Embed Size (px)
DESCRIPTION
Key Regulatory Issues & Challenges Confronting the MI Public Service Commission. Energy Regulatory Partnership Program Abuja, Nigeria July 14-18, 2008 Ikechukwu N. Nwabueze, Ph.D. Director, Regulated Energy Division Michigan Public Service Commission. - PowerPoint PPT Presentation
Citation preview

1 of 40
Key Regulatory Issues & Challenges Confronting the
MI Public Service Commission
Energy Regulatory Partnership ProgramAbuja, Nigeria
July 14-18, 2008
Ikechukwu N. Nwabueze, Ph.D.Director, Regulated Energy Division
Michigan Public Service Commission

2 of 40http://www.cis.state.mi.us/mpsc/electric/map.htm

3 of 40
COMPARISON OF AVERAGE RATES (IN CENTS PER kWh) FOR MPSC-REGULATED ELECTRIC UTILITIES IN MICHIGAN
RESIDENTIAL SMALL COMMERCIAL LARGE COMMERCIAL INDUSTRIAL
kW 5 25 100 100 100 1,000 10,000 50,000kWh 250 500 1,000 1,000 5,000 21,600 28,800 36,000 432,000 4,320,000 21,600,000
INVESTOR OWNEDALPENA POWER 12.30 11.45 11.02 11.57 11.03 10.71 9.58 8.80 6.93 5.59 5.59CONSUMERS ENERGY 12.02 10.82 11.71 13.02 11.70 12.51 10.86 9.87 9.04 8.71 8.49DETROIT EDISON 10.73 10.73 11.42 11.50 10.75 10.62 10.60 10.26 7.95 7.54 7.29EDISON SAULT ELECTRIC 9.99 9.31 8.97 10.67 10.08 9.97 9.92 9.43 8.87 8.85 8.85AEP (I&M) ST JOSEPH 7.97 6.86 6.56 10.24 8.45 8.15 7.84 7.65 5.42 5.31 5.04AEP (I&M) THREE RIVERS 8.03 7.11 6.66 8.16 8.05 7.70 7.22 6.75 5.01 4.75 4.56NORTHERN STATES POWER 10.24 9.39 8.96 9.50 8.90 9.06 8.17 7.63 7.28 7.25 7.25UPPER PENINSULA POWER 16.94 15.34 14.54 16.26 15.30 15.20 13.17 11.95 8.91 8.86 8.85UPPER PENINSULA POWER IRON RIVER 14.41 12.81 12.01 12.51 11.55 12.39 11.25 10.57 9.77 9.77 9.77WISCONSIN ELECTRIC 13.52 10.08 9.12 10.24 10.62 8.88 8.85 7.59 5.92 5.65 5.46WISCONSIN PUBLIC SERVICE 12.47 10.67 9.77 11.50 9.74 9.45 9.42 9.40 8.58 8.30 7.69
COOPERATIVESALGER DELTA 18.89 16.49 15.29 15.19 15.64 15.27 14.14 13.46 12.98CHERRYLAND 14.50 12.10 10.90 10.70 9.50 10.61 9.36 8.60 7.41CLOVERLAND 14.26 12.46 11.23 11.88 11.08 10.57 9.91 9.52 8.13GREAT LAKES 15.56 13.16 11.96 12.43 10.99 11.16 10.26 9.71 6.89MIDWEST ENERGY 14.43 12.03 10.83 11.02 9.90 10.21 9.21 8.61 9.44ONTONAGON 21.30 18.90 17.70 17.26 15.66 16.04 14.33 13.31 10.66PRESQUE ISLE 15.30 12.90 11.70 11.62 10.34 11.82 10.72 10.06 8.66THUMB 13.91 12.51 11.81 11.95 11.23 13.10 11.86 11.12 9.07TRI COUNTY 15.35 12.95 11.75 12.83 11.23 11.78 10.68 10.03 8.89
AVERAGE INVESTOR OWNED 11.69 10.42 10.07 11.38 10.56 10.42 9.71 9.08 7.61 7.33 7.17AVERAGE COOPERATIVE 15.94 13.72 12.57 12.76 11.73 12.28 11.16 10.49 9.12AVERAGE ALL COMPANIES 13.60 11.90 11.19 12.00 11.09 11.26 10.37 9.72 8.29 7.33 7.17
Compiled by the Regulated Energy Division
Revised July 1, 2008 by Mark Pung
July 1, 2008
Source: Michigan Public Service Commission Utility Rate Books

4 of 40
Price Regulations - MPSC Authority
• Public Act 3 grants MPSC authority over rates and tariffs of the regulated utilities (includes Investor Owned and Cooperatives – not Municipally owned utilities)
• Public Act 141establishes MPSC authority to implement Retail Customer Choice programs and applicable charges
• Public Act 304 implements MPSC authority over Power Supply Cost Recovery mechanisms (also Gas Cost Recovery mechanisms)

5 of 40
Recent Rate Reviews – Consumers
• Commission approved an electric rate increase of $27,468,600 related to Consumers Energy’s pending purchase of the Zeeland Generating Station– average residential electric customer’s bill
increased $2.10 per month (June 10, 2008 order in Case No. U-15245)
• Consumers Energy originally requested a $157 million rate increase in the main part of the case, filed on January 30, 2007.

6 of 40
Recent Rate Reviews – Detroit Edison
• Detroit Edison current rate proceeding in Case No. U-15244 which was filed on April 13,2007,originally requesting an increase of $123 million (2.86% overall). – Updated to a 2009 test year with additional increases
now totaling $284,200,000.
• Its rates increased on April 13, 2008 due to expiration of a rate reduction credit granted in Case No. U-14838, in 2006, which had reduced rates by $78,750,000.

7 of 40
Recent Rate Reviews – We Energies
• Commission approved a settlement agreement in authorizing an annual rate increase of $316,000 for We Energies. – Company’s original request totaled $2,137,804– average residential customer using 500 kilowatt-hours
per month saw an increase of 60 cents per month. (May 22, 2007 order in Case No. U-15039)
• On January 31, 2008, We Energies filed a new rate application requesting a rate increase totaling $22,000,000 inclusive of an Interim request of $8,422,000.

8 of 40
Recent Rate Reviews – Alpena Power
• Commission approved a settlement agreement authorizing Alpena Power to increase its electric rates by $1,261,000 annually; 28% below the company’s request (June 12, 2007 order in Case No. U-15250)
• This was Alpena Power’s first electric base rate increase in 15 years. – Increase was needed to provide recovery of rising operation
and maintenance expenses, employee pension and healthcare costs, and new plant additions.
• Monthly bill of an average residential electric customer increased $4.03 per month

9 of 40
Recent Rate Reviews – WI Public
• Commission approved a settlement agreement authorizing Wisconsin Public Service Corporation to increase its Michigan jurisdictional electric retail rates by $560,000 annually. – Company’s original request totaled $804,335
(December 4, 2007 order in Case No. U-15352)
• Average urban residential customer’s monthly bill increased by $4.40, and the average rural residential customer’s monthly bill increased by approximately $4.63.

10 of 40
Recent Rate Reviews – TIER Cases
• Commission approved five settlement agreements in 2007 authorizing revised rates for the sale of electricity and implementation of times interest earned ratio (TIER) ratemaking mechanism – Midwest Energy Cooperative, Thumb Electric Cooperative of
Michigan, Great Lakes Energy Cooperative, Tri-County Electric Cooperative, and Presque Isle Electric and Gas Cooperative.
• Three TIER ratemaking filings resulted in no rate changes – Alger Delta Co-operative Electric Association, Cloverland
Electric Cooperative, and Cherryland Electric Cooperative.

11 of 40
Residential Electric Rates
Utilities Rate Change/Increase
Typical Residential Monthly Bill Increase
Alpena Power $1,261,000 $4.03
Consumers Energy $27,468,600 $2.10
Great Lakes Energy $4,389,101 $1.92
HomeWorks $969,005 $1.85
Midwest Energy $1,797,306 $1.76
Thumb Electric $556,446 $2.36
Presque Isle Electric $673,472 $1.29
Wisconsin Public Service Corp. $316,000 $0.60

12 of 40
Electric Power Plants

13 of 40
Energy Prices
• Electricity rates are sharply rising due to a surge in coal prices over the past year. – National average retail price of electricity rose 2.3 percent last year
(Energy Department)
• There is an abundance of coal in the United States, but like many other commodities its price is increasingly dependent on events elsewhere in the world. – Snowstorms this winter cut coal production in China
– Heavy rain flooded mines in Australia - the world's largest coal exporter
– Demand for coal to generate electricity and make steel is rising almost everywhere, especially in fast-growing China and India.
• World’s appetite for American coal has increased, pushing up the price of the fuel utilities burn to generate half of the country's electricity.

14 of 40
Coal Prices
• Central Appalachian coal– Benchmark grade that's widely used by power plants
– Price has jumped from around $40 a ton in early 2007 to almost $90 a ton now
• Powder River Basin Coal in Wyoming and Montana– Has about three-quarters the heat content of Central Appalachian coal
– Price has jumped from less than $10 a ton to almost $15 a ton over the same time period.
• Utilities must burn more Powder River Basin coal to generate an equivalent amount of energy, and it must travel east by rail, which adds significantly to its final cost. – American Electric Power Co. burns mostly Appalachian coal in their eastern
plants, but relies on cheaper Powder River Basin coal in the west
– Some American Electric plants are designed to burn only the types of coal that are close to their plants

15 of 40
Coal Prices (Continued)
• Energy Dept. says the amount of the nation's electricity generated by burning coal will actually grow to 54 percent by 2030 from 49 percent now
• Coal is still cheap compared to other fuels– Coal cost $1.69 per British thermal unit (BTU) in 2006 while
Natural gas cost $6.87 per BTU (Energy Dept)
• Reasons coal prices are up– Weather related disruptions in China and Australia this winter,
will likely be resolved quickly– Ports in Australia aren't adequate to handle growing demand,
leaving ships lined up 30 to 50 deep waiting to load coal. – South Africa faces similar transportation bottlenecks
• Demand for coal is growing worldwide– China recently shifted from mostly exporting coal to mostly
importing it.
16 of 40
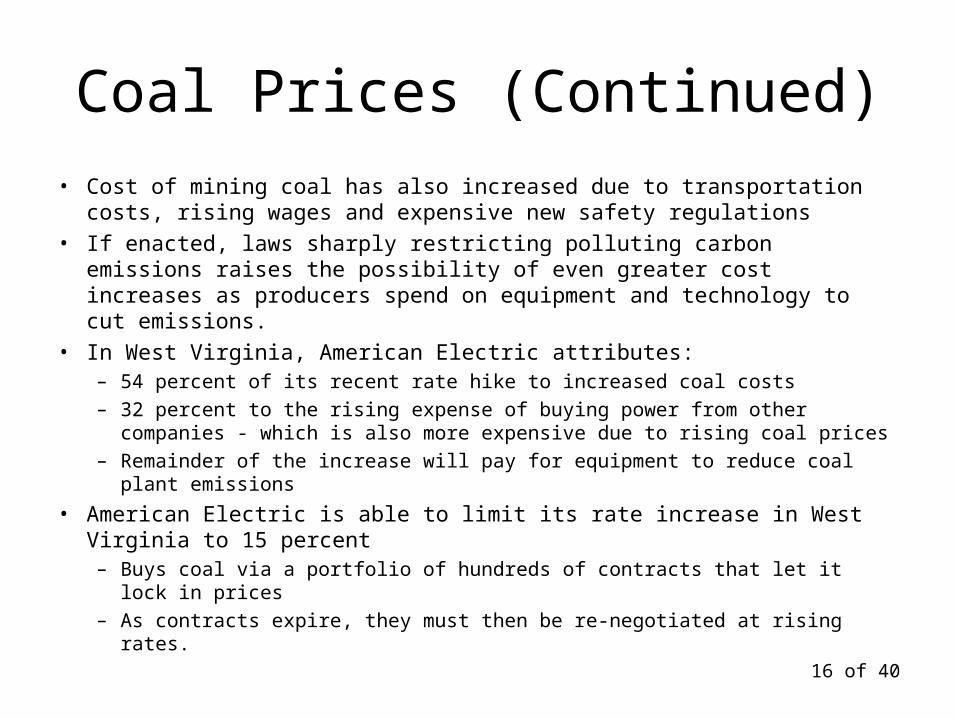
Coal Prices (Continued)
• Cost of mining coal has also increased due to transportation costs, rising wages and expensive new safety regulations
• If enacted, laws sharply restricting polluting carbon emissions raises the possibility of even greater cost increases as producers spend on equipment and technology to cut emissions.
• In West Virginia, American Electric attributes: – 54 percent of its recent rate hike to increased coal costs
– 32 percent to the rising expense of buying power from other companies - which is also more expensive due to rising coal prices
– Remainder of the increase will pay for equipment to reduce coal plant emissions
• American Electric is able to limit its rate increase in West Virginia to 15 percent – Buys coal via a portfolio of hundreds of contracts that let it lock in prices
– As contracts expire, they must then be re-negotiated at rising rates.

17 of 40
Demand Projections and Capacity Allocation
Detroit Edison Consumers Energy
2008 2009 2008 2009
Total Owned Capacity (MW) 11,020 11,016 6,562 6,562
Total Purchases (MW) 2,148 1,994 3,467 3,147
Subtotal (MW) 13,168 13,010 10,029 9,709
Demand (MW) 12,168 11,954 8,778 8,933
Interruptible Load (MW) (587) (641) (200) (200)
Subtotal (MW) 11,581 11,313 8,578 8,733
Reserve Margin (MW) 1,587 1,697 1,451 976
Margin Reserve % 13.7% 15% 16.92% 11.18%

18 of 40
Transmission Infrastructure Status and Expansion

19 of 40
Transmission Infrastructure Status and Expansion

20 of 40
Transmission Infrastructure Status & Expansion
21 of 40
Third-Party AccessElectric Customer Choice
• Michigan’s state legislature passed Public Acts 141 and 142 of 2000, the Customer Choice and Electricity Reliability Act on June 3, 2000.
• Generation and supply of power is open to competitive suppliers.

22 of 40
Demand Side Management
• All kinds of efforts to “shape” demand for energy services in order to produce system benefits.
• Could be demand reductions or increases…
• Typically includes: energy efficiency, load management, generically demand-side management (DSM).
• More recently: demand response (DR)

23 of 40
• Peak Clipping– Reduces peak demand, and may shift use to
shoulder or off-peak periods. May even increase kWh usage.
• Valley Filling– Strategic means of selling more during off-peak
periods.
• “Baseload” efficiency improvements – “on” all the time that end-use devices are in use
(e.g. more efficient lights, motors, etc.)
Demand Side Management OptionsMay be driven by Rates and/or Programs

24 of 40
Demand Side Management Detroit Edison
• Detroit Edison is an example of a Michigan regulated electric utility that has embraced demand response and load management programs for a number of years
• This has resulted in power supply savings for the company and its customers

25 of 40
Demand Response Programs at Detroit Edison
• Long history of active load management and passive Demand Response programs dating back to the 1960’s – Active load management refers to programs where the utility
initiates action to reduce customer load– Passive demand response programs require a customer choice
to reduce demand based on a pricing incentive offered by the utility.
• Incentive is usually either price based on the time electricity is used (time-of-day or season of year) or penalty for non-compliance to a load reduction requested by the utility based on customer contract provisions – Interruptible tariffs are commonly referred to as active load
management programs

26 of 40
Demand Response Programs at Detroit Edison
• Offers a variety of active and passive programs for all major rate classes – One of the nation’s largest, and most successful, D1.1
Interruptible Air Conditioning (IAC) program with over 280,000 active customers
– Residential customers: D5 Interruptible Water Heating and D1.2 Time-of-Use rates
• Promotes savings if the customer can shift electric use to off-peak hours in exchange for lower kilowatt-hour pricing)
– Commercial customers: Interruptible Air Conditioning, Interruptible Water Heating and Time-of-Use rates
• May take service under the optional Commercial Interruptible D3.3 or D-8 Interruptible Supply tariffs
– Industrial customers may also take service under the D8 tariff or R-10 Primary Interruptible Supply tariff

27 of 40
• Utility systems need to have adequate supply resources to meet customer demand
• To keep the system in balance, you can add supply resources, reduce customer demand, or a combination of the two
• In most cases, it is cheaper to reduce customer demand than to acquire new supply resources
• There needs to be a practical mechanism for utilities to acquire energy efficiency resources
Rational for Energy Efficiency

28 of 40
Energy Efficiency
• Reduces system peak demand
• Reduces total energy consumption
• Reduces consumption of natural resources & air emissions
• Can reduce energy imports
• Effects are long-lasting

29 of 40
Energy Efficiency (Continued)
• Energy efficiency is more than a ‘virtue’….it’s a RESOURCE
• Energy efficiency costs less than new supply, even less than fuel & variable O&M only
• Proven examples are readily available
• Energy efficiency still requires policy and regulatory action

30 of 40
• Renewable Portfolio Standard (RPS) requires that a certain percentage of a utility's [load-serving entity’s, or LSE’s] overall or new generating capacity or energy sales must be derived from renewable resources, i.e., 5% of electric sales must be from renewable energy in the year 2006
• Michigan Legislator introduced law to require RPS, which is still pending.
Renewable Energy

31 of 40
State Goal
☼ PA: 18%¹ by 2020
☼ NJ: 22.5% by 2021
CT: 10% by 2010
MA: 4% by 2009 + 1% annual increase
WI: requirement varies by utility; 10% by 2015 Goal
IA: 105 MW
MN: 10% by 2015 Goal +Xcel mandate of
1,125 MW wind by 2010
TX: 5,880 MW by 2015
*NM: 10% by 2011
☼ AZ: 1.1% by 2007
CA: 20% by 2010
☼ NV: 20% by 2015
ME: 30% by 2000
State RPS
*MD: 7.5% by 2019
☼ Minimum solar or customer-sited requirement* Increased credit for solar
¹PA: 8% Tier I, 10% Tier II (includes non-renewable sources)
HI: 20% by 2020
RI: 15% by 2020
☼ CO: 10% by 2015
☼ DC: 11% by 2022
☼ NY: 24% by 2013
MT: 15% by 2015
*DE: 10% by 2019
IL: 8% by 2013
VT: RE meets load growth by 2012
Renewable Portfolio Standards

32 of 40
• Interconnection Standards
• Funding, financing, incentives
• Required Green Pricing Options
• Solar & wind access laws
• Net metering
• Disclosure of fuel mix
Related Policies

33 of 40
Stakeholder Involvement in Ratemaking Process
• Stakeholder Inclusion through:– Formal Rate Case participation as a party to
the case– Customer Comments filed in a Rate Case
dockets– Formal Complaints to the MPSC– Informal Complaints and Inquiries to the
MPSC

34 of 40
Stakeholders Needs in Ratemaking Process
• Utilities: a reasonable return on investment (compensatory and non-confiscatory) to ensure financial viability, and protection from ruinous competition
• Customers: Nondiscriminatory service at fair, reasonable, and affordable rates, and protection from monopoly abuse
• Regulators: Utility services that promote the public interest, including price signals that encourage efficient use of resources and promote other social goals

35 of 40
Reliability and Security of Supply
• Generating units must be available to run barring an unforeseen outage or planned maintenance outage
• Utilities must have enough self-owned or purchased capacity to reliably serve their load with some Reserve Margin
• MISO (Midwest Independent transmission System Operator) has a planning reserve sharing group that helps set the reserve margin for utilities in the Midwest region – current margin is set at 13.7%
• Utilities also maintain redundant transmission system to help assure limited interruptions.
• Since September 11, 2001, U. S. generating plants (in particular nuclear plants) have increased security in and around their plants, limiting access to some units – Increased costs for security have been passed through rates
• MPSC requires regulated utilities to file summer reliability assessments to ensure that each utility will have a secure, reliable supply of energy during peak usage periods.

36 of 40
• MISO (Midwest Independent transmission System Operator) is the regional coordinator for transmission
• MISO operates a Day-2 energy market in which electricity is traded and scheduled – Market began in April 2005– Requires utilities to “offer” their generating units into the market and to
“bid” in prices for their load– Consists of a Real-time market giving price updates every 5 minutes
and a Day-ahead market where prices are set before next day’s operation
• MISO also launching an Ancillary Services Market in Sept. 2008– Allow utilities to sell essential services such as voltage regulation and
reactive supply that support Capacity and the transmission of electricity
• MISO has an independent market monitor (IMM) that oversees the market activities of all participants– IMM looks for possible market manipulation or gaming of prices by any
participant
Power Market Issues

37 of 40
Restructuring and InterconnectionsElectric Customer Choice
• PA 141 of 2000 provides that all retail customers have a choice of electric suppliers
• MPSC has issued many orders to implement the law
• Open access or Choice, became available to all customers of Michigan investor owned utilities, beginning January 1, 2002
• The rules are different for municipal electric utilities that are not regulated by the MPSC (see MCL 460.10y)

38 of 40
• Commission developed Electric Interconnection Standards rules (R460.481- R460.489)
• Utilities filed interconnection procedures in concert with the rules– Procedures provide Michigan regulated electric
distribution companies with a process for considering interconnection requests
– They include the required application process, basic technical criteria, filing fees and deadlines for completion of various steps in the process
Interconnection of Merchant Plants

39 of 40
Interconnection ProceduresTechnical Criteria
• Specify technical, engineering and operational requirements suitable for the system.
• Include distinct set of requirements for the following project capacity classifications:– Less than 30 kW– 30 to 149 kW – 150 kW but less than 2 megawatts– 2 megawatts or more

40 of 40
Questions?


