Embed Size (px)
Citation preview
A report prepared by:
The Centre for Research on Financial Markets and Policy®
KENYA BANKERS ECONOMIC BULLE TINQ U A R T E R T W O O F 2 0 1 5
VOLUME 12
© Kenya Bankers Association, 2015
About this Report
This Bulletin reviews the performance of the Kenyan economy for the second quarter of 2015, drawing on the performance of recent past months as well as current developments to provide perspectives on the outlook for the rest of the year. The Bulletin covers trends in the real economy, government fiscal operations, public debt, inflation and interest rates, balance of payments and exchange rate, as well as activity at the Nairobi Securities Exchange and banking sector performance
About the Centre for Research on Financial Markets and Policy
The Centre for Research on Financial Markets and Policy® was established by the Kenya Bankers Association in 2012 to offer an array of research, commentary, and dialogue regarding critical policy matters that impact on financial markets in Kenya. The Centre sponsors original research, provides thoughtful commentary, and hosts dialogues and conferences involving scholars and practitioners on key financial market issues. Through these activities, the Centre acts as a platform for intellectual engage-ment and dialogue between financial market experts, the banking sector and the policy makers in Kenya. It therefore contrib-utes to an informed discussion that influences critical financial market debates and policies.
CENTRE FOR RESEARCH ON
F I N A N C I A L M A R K E T S A N D P O L I C Y
Centre for Research on Financial Markets & Policy, KBA 1
Publisher KBA Centre for Research on Financial Markets and Policy®
KBA CEO Habil Olaka
Chief Editor Jared Osoro
Contributors David Muriithi Gabriel Thirikwa
Design & Layout Conrad Karume
Contacts KBA Headquarters, International Life House, 13th Floor Mama Ngina Street, Nairobi
Mailing Address P.O. Box 73100 00200 - Nairobi
Phone +254-20-2221704, +254-20-2217757, +254-20-2224014
E-mail [email protected]
Web www.kba.co.ke.
Distributed by Kenya Bankers Association
Disclaimer Views expressed in this publication do not necessarily express the views of the members of Kenya Bankers Association. The entire content of this publication is protected by copyright laws. Reproduction in part or whole requires express written consent from the publisher.
Pictures used herein have been sourced from the internet and other sources.
This bulletin can also be downloaded from: www.kba.co.ke
CENTRE FOR RESEARCH ON
F I N A N C I A L M A R K E T S A N D P O L I C Y
9
12
21
3
KENYA BANKERS ECONOMIC BULLE TIN
In this IssueFROM THE CEO’S DESK 2
COMMENTARy: THE POSSIBILITy OF GETTING 3 WORSE BEFORE GETTING BETTER?
STATE OF THE ECONOMy
• GrowthINGdp 7
• AGrIculture 8
• MANufActurING 11
• eNerGy 13
• BuIldINGANdcoNstructIoN 13
• trANsportANdcoMMuNIcAtIoNs 14
• tourIsM 16
• fINANcINGofGoverNMeNt 16
• puBlIcdeBt 17
• MoNeyANdcredIt 17
• INflAtIoN 18
• INterestrAtes 18
• BAlANceofpAyMeNts 19
• exchANGerAtes 20
• NAIroBIsecurItIesexchANGe 21
• BANKINGINdustryperforMANce 21
2 Centre for Research on Financial Markets & Policy, KBA
From the CEO’s Desk
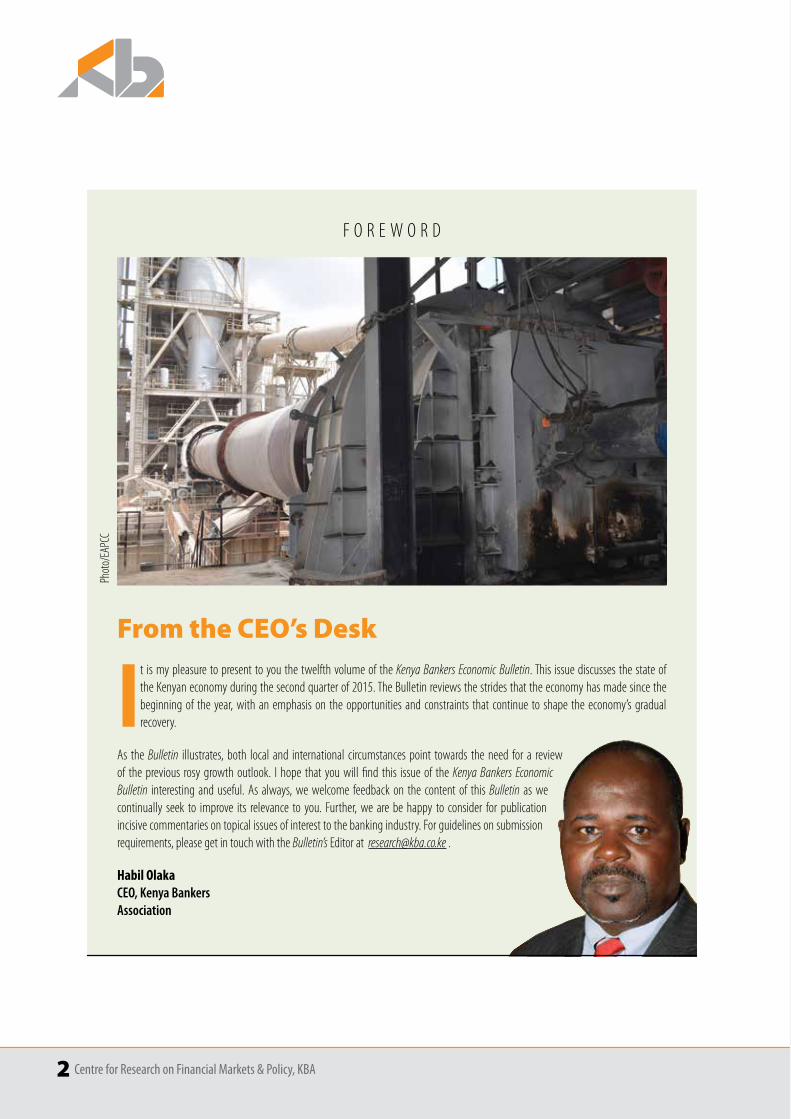
It is my pleasure to present to you the twelfth volume of the Kenya Bankers Economic Bulletin. This issue discusses the state of the Kenyan economy during the second quarter of 2015. The Bulletin reviews the strides that the economy has made since the beginning of the year, with an emphasis on the opportunities and constraints that continue to shape the economy’s gradual recovery.
As the Bulletin illustrates, both local and international circumstances point towards the need for a review of the previous rosy growth outlook. I hope that you will find this issue of the Kenya Bankers Economic Bulletin interesting and useful. As always, we welcome feedback on the content of this Bulletin as we continually seek to improve its relevance to you. Further, we are be happy to consider for publication incisive commentaries on topical issues of interest to the banking industry. For guidelines on submission requirements, please get in touch with the Bulletin’s Editor at [email protected] .
Habil Olaka CEO, Kenya Bankers Association
F O R E W O R D
Phot
o/EA
PCC
Centre for Research on Financial Markets & Policy, KBA 3
C O M M E N T A R y
rest of the so-called G7 were at best crawling while some of the emerging market economies – especially China – registered robust performance implies that they are now systemically very important.
Why should Kenyans care about the emerging economies now more that before? Simply because, as I have argued in the past1, Kenya is closely linked to Sub-Saharan Africa more that it is to the rest of the world. And as a recent study confirms2, Sub-Saharan Africa’s business cycle has not only moved in the same direction as that of the rest if the world, but has also gradually drifted away from the G7 in favour of the so called BRICs – Brazil, Russia, India and China. Trade with the BRICs turns out to be the strongest driver of this shift. Therefore the challenges currently facing the emerging markets should be seen as having potential adverse effects that are more than mild.
The emerging market sandwich So what are the challenges confronting the emerging markets? On top of the card is the challenge of these economies being sandwiched between the increasingly entrenched recovery of the US economy and the now evident near foundering of Chinese economy, respectively the largest and second largest economies in terms of output.
1 See Commentary – “A breather before the main sprint or a false start?” – in the Kenya Bankers Economic Bulletin Volume 11, Quarter 1, 2015.
2 Oumar Diallo ; Sampawende J.-A. Tapsoba (2014), “Rising BRICs and Changes in Sub-Saharan Africa’s Business Cycle Patterns”, IMF Working Paper No 14/35.
By Jared Osoro
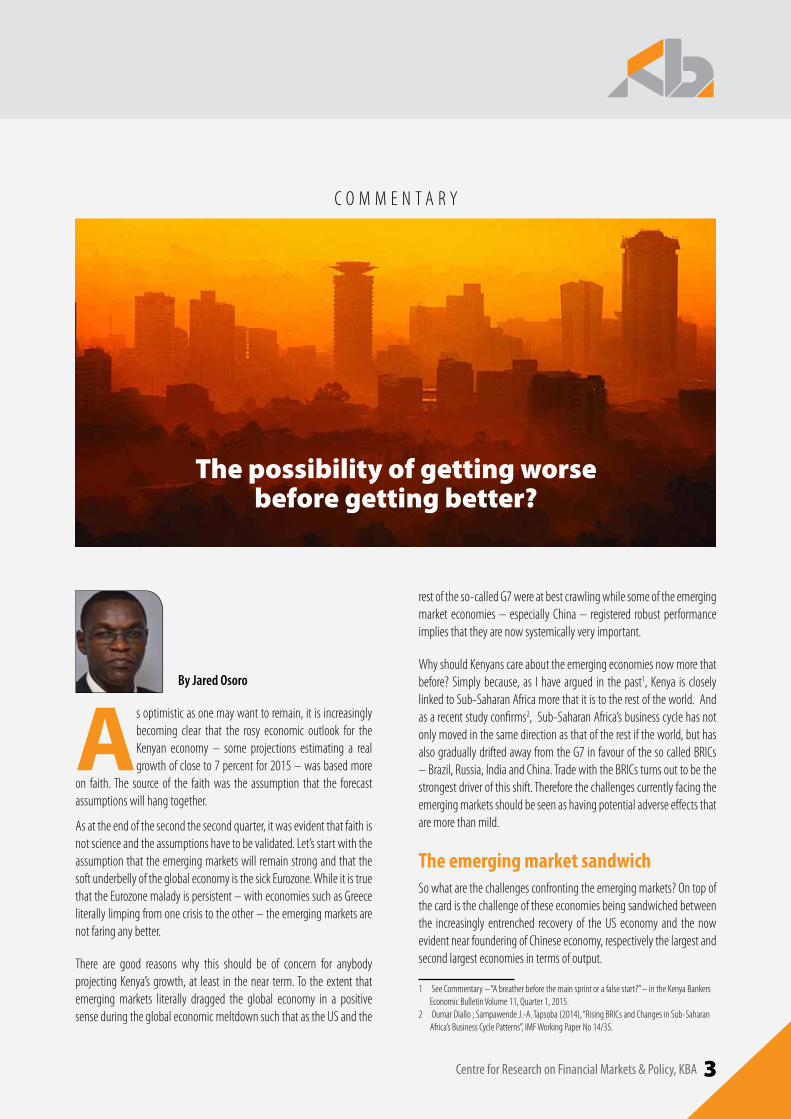
As optimistic as one may want to remain, it is increasingly becoming clear that the rosy economic outlook for the Kenyan economy – some projections estimating a real growth of close to 7 percent for 2015 – was based more
on faith. The source of the faith was the assumption that the forecast assumptions will hang together.
As at the end of the second the second quarter, it was evident that faith is not science and the assumptions have to be validated. Let’s start with the assumption that the emerging markets will remain strong and that the soft underbelly of the global economy is the sick Eurozone. While it is true that the Eurozone malady is persistent – with economies such as Greece literally limping from one crisis to the other – the emerging markets are not faring any better.
There are good reasons why this should be of concern for anybody projecting Kenya’s growth, at least in the near term. To the extent that emerging markets literally dragged the global economy in a positive sense during the global economic meltdown such that as the US and the
The possibility of getting worse before getting better?
4 Centre for Research on Financial Markets & Policy, KBA
There is no doubt that when the world largest economy is on a recovery path that then translates to good prospects for the global economy. you must therefore be wondering how the recovery of the US could be a bane to the emerging markets. The healthier the US economy becomes, the closer it comes to resuming normal monetary policy after close to eight years of unconventional monetary policy – the so-called quantitative easing (QE) regime – where interest rates were close to zero and the Federal Reserve (the US central bank) saw a substantial growth in its balance sheet.
In other words the equivalent of substantial printing of money that the growth in the Federal Reserve’s balance sheet represents, which came to a stop with the then famous “tapering remarks” by the its then Chairman, Ben Bernanke, in May 21st 2013 will give way to the commencement of some tightening of monetary policy.
By indicating that the Federal Reserve will be tapering on the QE, the message was that an indication of the easing of the QE and not necessarily a shift to tightening. With the US economy’s recovery comes the expectations that the Federal Reserve is likely to commence – as soon as September 2015 – an increase in its policy rate, the federal funds rate.
Although some have taken an optimistic posture with arguments such as the markets have already factored in such possibility or recent analyses3
3 See for instance Meier, Andre, (2015), “Watching the Tide”, Finance & Development, IMF, August pp.15–19.
to the effect that markets have now learnt on how to cope with such eventuality, all indications are that the mere prospects of a rate hike by the Federal Reserve will obviously adversely affect emerging markets and any anticipated resilience on account of markets are smatter now will be subject to some test.
Over the past two years, the US dollar has appreciated by more than 10 percent against its major trading partners. This appreciation is a manifestation of emerging markets being pinched from two fronts: One, capital has started retreating to the US in anticipation of higher yields; two, the extensive borrowing by emerging markets based on low costs during the QE regime is subject the severe currency risk.
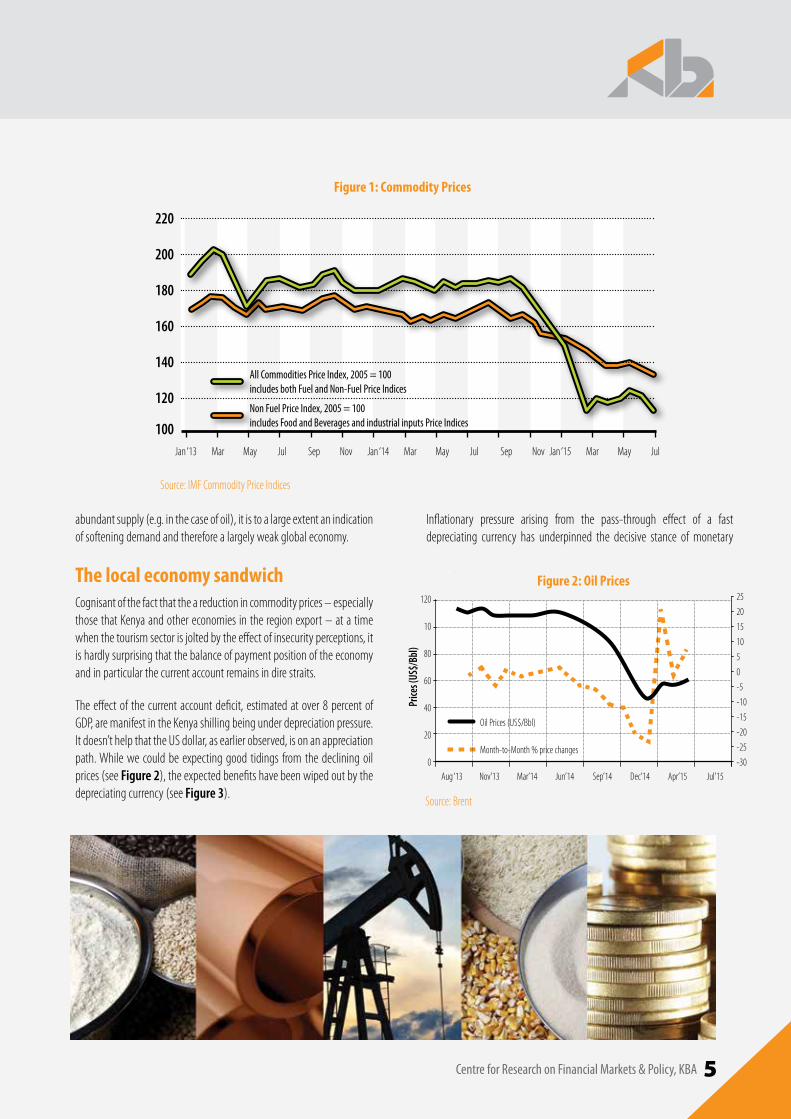
The Chinese bit of the bitter-sweet sandwich that has been made of the emerging markets arises from the clear slowdown of the economy. Although it can be argued that the slowdown is a positive development as it reflects the economy’s adjustment from one whose growth model is investment – no wonder the reduction in output prices over the past 3 years could be a reflection of over-capacity in China’s heavy industry – to one where growth is consumption led, this comes with some pain for the emerging markets; this is more so for commodity exporters such as South Africa and Brazil.
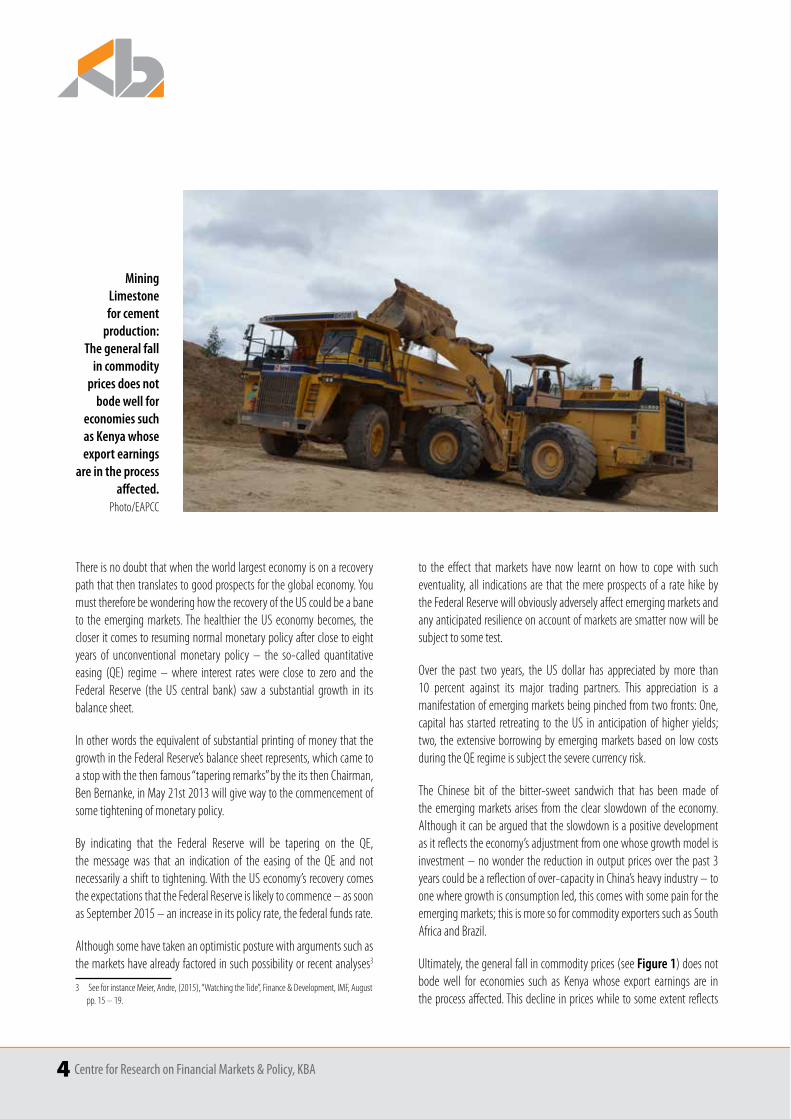
Ultimately, the general fall in commodity prices (see Figure 1) does not bode well for economies such as Kenya whose export earnings are in the process affected. This decline in prices while to some extent reflects
Mining Limestone for cement
production: The general fall
in commodity prices does not
bode well for economies such as Kenya whose export earnings
are in the process affected.
Photo/EAPCC
Centre for Research on Financial Markets & Policy, KBA 5
abundant supply (e.g. in the case of oil), it is to a large extent an indication of softening demand and therefore a largely weak global economy.
The local economy sandwichCognisant of the fact that the a reduction in commodity prices – especially those that Kenya and other economies in the region export – at a time when the tourism sector is jolted by the effect of insecurity perceptions, it is hardly surprising that the balance of payment position of the economy and in particular the current account remains in dire straits.
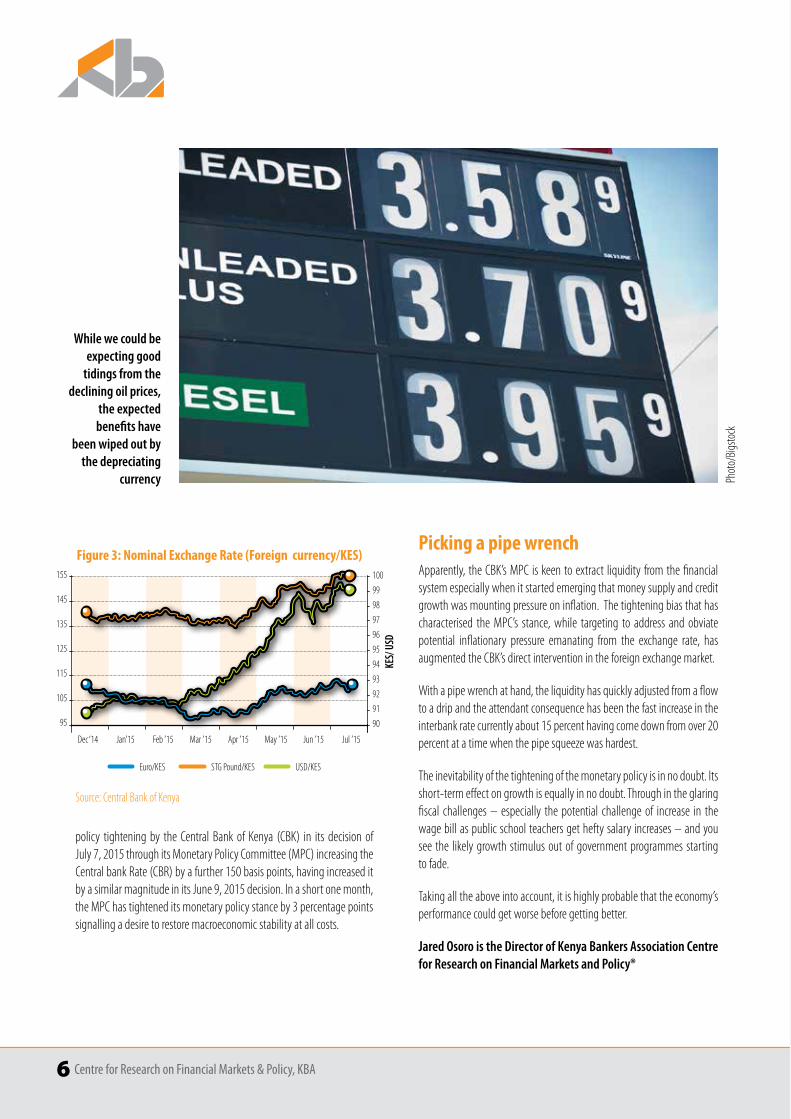
theeffectof thecurrentaccountdeficit,estimatedatover8percentofGDP, are manifest in the Kenya shilling being under depreciation pressure. It doesn’t help that the US dollar, as earlier observed, is on an appreciation path. While we could be expecting good tidings from the declining oil prices (see Figure 2), the expected benefits have been wiped out by the depreciating currency (see Figure 3).
Jan ‘13 Jan ‘14 Jan ‘15Mar Mar MarMay May May JulJul JulSep SepNov Nov
220
200
180
160
140
120
100
Figure 1: Commodity Prices
Source: IMF Commodity Price Indices
Non Fuel Price Index, 2005 = 100 includes Food and Beverages and industrial inputs Price Indices
All Commodities Price Index, 2005 = 100 includes both Fuel and Non-Fuel Price Indices
Source: Brent
0
20 -20
-10
15
25
20
-30
-25
-5
0
-15
5
10
40
60
80
10
120
Aug ‘13 Mar’14Nov’13 Jun’14 Sep’14 Dec’14 Apr’15 Jul’15
Figure 2: Oil Prices
Inflationary pressure arising from the pass-through effect of a fast depreciating currency has underpinned the decisive stance of monetary
Price
s (US
$/Bb
l)
Oil Prices (US$/Bbl)
Month-to-Month % price changes
6 Centre for Research on Financial Markets & Policy, KBA
policy tightening by the Central Bank of Kenya (CBK) in its decision of July 7, 2015 through its Monetary Policy Committee (MPC) increasing the Central bank Rate (CBR) by a further 150 basis points, having increased it byasimilarmagnitudeinitsJune9,2015decision.Inashortonemonth,the MPC has tightened its monetary policy stance by 3 percentage points signalling a desire to restore macroeconomic stability at all costs.
Picking a pipe wrench Apparently, the CBK’s MPC is keen to extract liquidity from the financial system especially when it started emerging that money supply and credit growth was mounting pressure on inflation. The tightening bias that has characterised the MPC’s stance, while targeting to address and obviate potential inflationary pressure emanating from the exchange rate, has augmented the CBK’s direct intervention in the foreign exchange market.
With a pipe wrench at hand, the liquidity has quickly adjusted from a flow to a drip and the attendant consequence has been the fast increase in the interbank rate currently about 15 percent having come down from over 20 percent at a time when the pipe squeeze was hardest.
The inevitability of the tightening of the monetary policy is in no doubt. Its short-term effect on growth is equally in no doubt. Through in the glaring fiscal challenges – especially the potential challenge of increase in the wage bill as public school teachers get hefty salary increases – and you see the likely growth stimulus out of government programmes starting to fade.
Taking all the above into account, it is highly probable that the economy’s performance could get worse before getting better.
Jared Osoro is the Director of Kenya Bankers Association Centre for Research on Financial Markets and Policy®
95
105 92
94
99
100
90
91
95
96
93
97
98
115
125
135
145
155
Euro/KES STG Pound/KES USD/KES
Dec ‘14 Feb ’15Jan’15 Mar ’15 Apr ’15 May ’15 Jun ’15 Jul ’15
Figure 3: Nominal Exchange Rate (Foreign currency/KES)
KES/
USD
Source: Central Bank of Kenya
While we could be expecting good
tidings from the declining oil prices,
the expected benefits have
been wiped out by the depreciating
currency Phot
o/Big
stock
Centre for Research on Financial Markets & Policy, KBA 7
Growth in Gross Domestic Product
thefirstquarterof2015recordedaneconomicgrowthrateof4.9percent:- a slight improvement compared to the same quarter of 2014 whose growth stood at 4.7 percent. This is underpinned on the sound and stable macroeconomic environment that was experienced in quarter one a spill over conditions from the last quarter on 2014. The low oil prices, in the global market which infiltrated in the domestic market boosted the growth in quarter one of 2015, through low energy costs and reduction in the inflationary pressures mainly arising from the food – fuel inflation component of the entire inflation rate.
However, the second quarter of 2015 posted a different encounter especially via the change in the macroeconomic environment. This adversely affected the economic performance of many sector of the economy and in overall the entire quarterly economic growth. To start with the experiences weakening bias on the Kenyan shilling against the major hard world currencies mainly the dollar shocked the economy negatively for the entire part of quarter two. This is in a number of aspects; - first is through the increased current account deficit given the rise in the import bills thus increasing the trade balance deficit which directly implies the increased current account deficit. The weakening shilling has also seen the domestic energy prices especially the oil prices surge up thus offsetting the benefits of the low oil prices realized in the first quarter of 2015. More importantly, the loss in the value of the shilling against the dollar has seen the change in the monetary policy stance in the economy
during the quarter. The depreciation of the shilling saw the raise in the bankrateforthefirsttimesinceApril2013fromthe8.50percentto10.00percent as at the end of quarter two. This has in turn inferred into the illiquidity in the credit market leading to the increase in the cost of credit in the market.
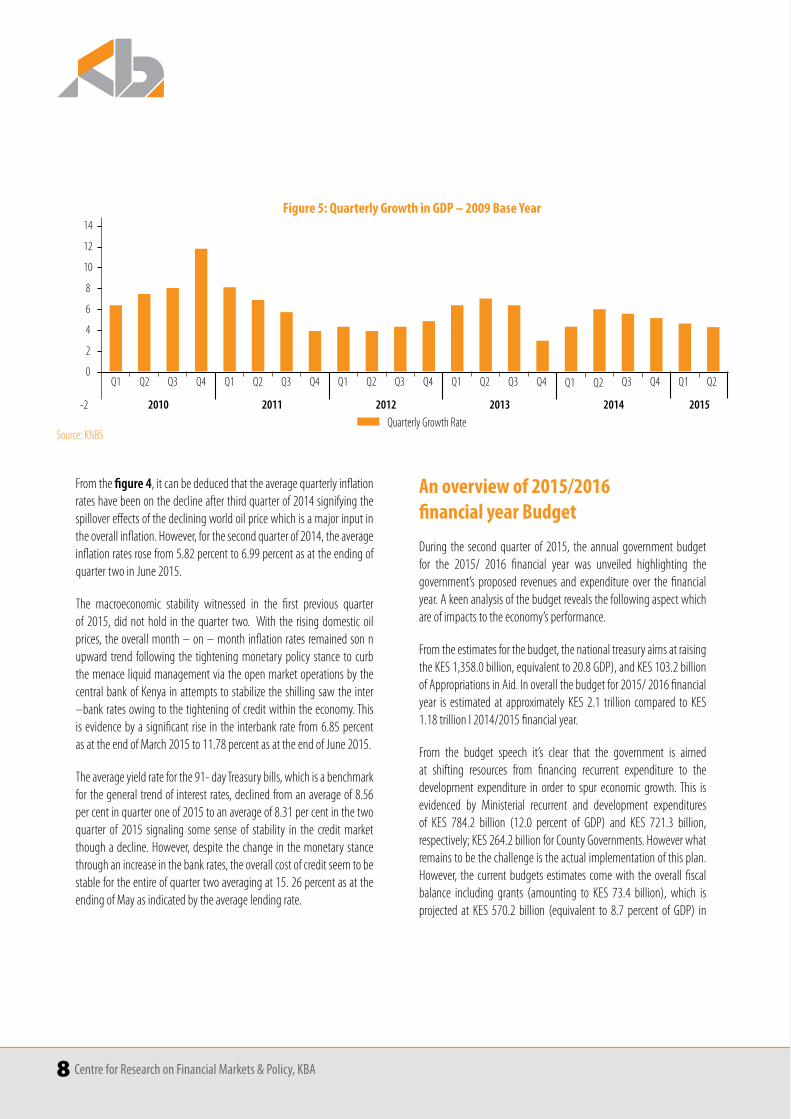
The overall month – on month inflation rates was on an upward rise, rising froma lowof the6.31percent inMarch2015 to ahighof7.03percent as at the end of June 2015; - a 0.47 percent below the from the Central Bank’s upper bound of 7.50 percent. This is mainly on the account of the change in the monetary policy stance amid the weakening bias on the shilling. In overall the average, quarterly inflation for quarter two was 6.99percentcomparedto5.82percentrecordedinquarteroneof2015(see figure 4).
Figure 4: Average Quarterly Inflation Rates
0
1
2
3
4
5
6
7
9
8
2013 2014 2015
Q1_13 Q1_14 Q1_15Q2_13 Q2_14 Q2_15Q3_13 Q3_14Q4_13 Q4_14
7.54%
6.18%
5.82%
6.99%
Source: Central Bank of Kenya
State of the Economy
Phot
o/Big
stock
8 Centre for Research on Financial Markets & Policy, KBA
An overview of 2015/2016 financial year Budget
During the second quarter of 2015, the annual government budget for the 2015/ 2016 financial year was unveiled highlighting thegovernment’s proposed revenues and expenditure over the financial year. A keen analysis of the budget reveals the following aspect which are of impacts to the economy’s performance.
From the estimates for the budget, the national treasury aims at raising theKes1,358.0billion,equivalentto20.8Gdp),andKes103.2billionofAppropriationsinAid.Inoverallthebudgetfor2015/2016financialyear is estimated at approximately KES 2.1 trillion compared to KES 1.18trillionI2014/2015financialyear.
From the budget speech it’s clear that the government is aimed at shifting resources from financing recurrent expenditure to the development expenditure in order to spur economic growth. This is evidenced by Ministerial recurrent and development expenditures of Kes 784.2 billion (12.0 percent of Gdp) and Kes 721.3 billion,respectively;Kes264.2billionforcountyGovernments.howeverwhatremains to be the challenge is the actual implementation of this plan. However, the current budgets estimates come with the overall fiscal balance including grants (amounting to KES 73.4 billion), which is projected at Kes 570.2 billion (equivalent to 8.7 percent of Gdp) in
From the figure 4, it can be deduced that the average quarterly inflation rates have been on the decline after third quarter of 2014 signifying the spillover effects of the declining world oil price which is a major input in the overall inflation. However, for the second quarter of 2014, the average inflationratesrosefrom5.82percentto6.99percentasattheendingofquarter two in June 2015.
The macroeconomic stability witnessed in the first previous quarter of 2015, did not hold in the quarter two. With the rising domestic oil prices, the overall month – on – month inflation rates remained son n upward trend following the tightening monetary policy stance to curb the menace liquid management via the open market operations by the central bank of Kenya in attempts to stabilize the shilling saw the inter –bank rates owing to the tightening of credit within the economy. This isevidencebyasignificant rise in the interbank rate from6.85percentasattheendofMarch2015to11.78percentasattheendofJune2015.
theaverageyieldrateforthe91-daytreasurybills,whichisabenchmarkforthegeneraltrendof interestrates,declinedfromanaverageof8.56percentinquarteroneof2015toanaverageof8.31percentinthetwoquarter of 2015 signaling some sense of stability in the credit market though a decline. However, despite the change in the monetary stance through an increase in the bank rates, the overall cost of credit seem to be stablefortheentireofquartertwoaveragingat15.26percentasattheending of May as indicated by the average lending rate.
Figure 5: Quarterly Growth in GDP – 2009 Base Year
Source: KNBS
Q1 Q1 Q1 Q10
-2
2
6
4
10
8
14
12
Q3 Q3 Q3 Q3Q4 Q4 Q4 Q4 Q4Q2 Q2 Q2 Q2
2010 2011 2012 2013 2014 2015
Quarterly Growth Rate
Q1 Q1Q3Q2 Q2
Centre for Research on Financial Markets & Policy, KBA 9
financial year 2015/16. excludingexpenditures related to thestandardGauge railway, the overall deficit would decline to Kes 426.3 billionwhichisequivalentto6.5percentofGdp.thisrepresentsa4.6percentincreaseinthebudgetdeficitcomparedtoKes190.8billion(equivalentsto 4.1 percent of GDP) for the 2014/2015 financial year. .
As per the budget speech the government seeks to finance the deficit by both the external and domestic borrowing with the net external financing amounting to KES 340.5 billion (5.2 percent of GDP) and domesticfinancingamountingtoKes229.7billion(3.5percentofGdp)thus implying that the overall fiscal deficit is fully financed. Looking at the external financing sought by the government, the proposal is to continue exploring on the use of Euro bonds including from export credit agencies and syndicated loans. From this proposal it’s clear that the types of financing the deficit will imply the increased burden to the economy especially if the borrowing is geared towards financing recurrent expenditure as opposed to the capital expenditure financing.
Moreover, given the current monetary policy stance in the economy in attempts to stabilize the shilling, any domestic borrowing will definitely lead to increase in the cost of credit in the economy which could potentially dampen the projected annual growth in the long run. In addition, the review of the budget leads to a conclusion of limited government innovativeness to broaden the tax base by relying on the same sources of revenue to finance the budget. Lastly some of the measures proposed are likely to be counterintuitive in that in attempt to pursue one goal, they may end up generating adverse effects. For instance, the increase in the
Road Maintenance Levy by KES 3 per litre to be collected and paid into the Road Annuity Fund directly feeds into the inflationary pressure through the food – fuel inflation component despite its proceeds being crucial in increasing the road network coverage.
The review of the budget seems to infer into an expansionary fiscal by thegovernmentfortheyear2015/2016asrevealedbythegovernment’sincreased expenditure. In addition the increased borrowing from both the domestic and external sources compared to the 2014/2015 financial year indicates the expansionary fiscal policy for the current financial year. Looking at the monetary policy angle its clear the Central bank has [pursed the contractionary monetary policy to anchor inflation as well as ensure stability in the forex market. Therefore given this scenario, it is unlikely that both internal and the external balance will be achieved given that the expansionary fiscal policy by the government continues to feed into the current account deficit thus external imbalance.
Agriculture
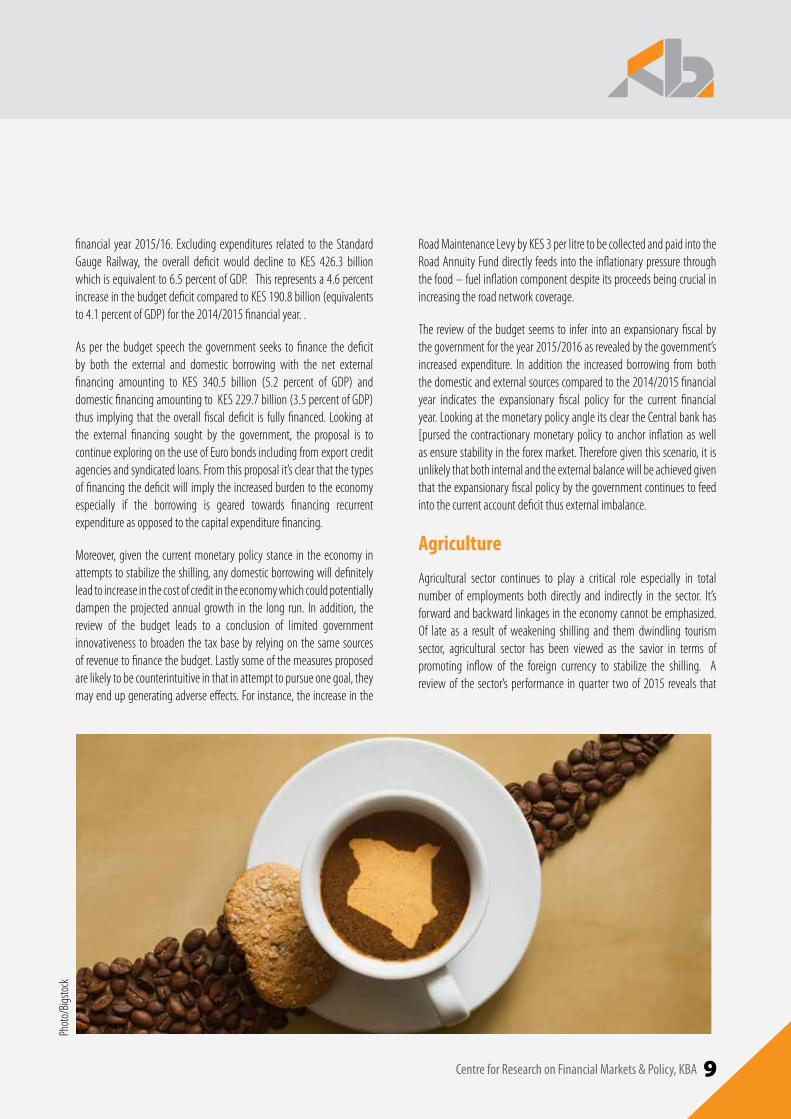
Agricultural sector continues to play a critical role especially in total number of employments both directly and indirectly in the sector. It’s forward and backward linkages in the economy cannot be emphasized. Of late as a result of weakening shilling and them dwindling tourism sector, agricultural sector has been viewed as the savior in terms of promoting inflow of the foreign currency to stabilize the shilling. A review of the sector’s performance in quarter two of 2015 reveals that
Phot
o/Big
stock
10 Centre for Research on Financial Markets & Policy, KBA
It is also worthy to note that development of real estate market continues to significantly affect the land under tea and coffee production. There is therefore the need for government intervention to formulate policies that will delineate agricultural land from settlement lands if the future of major exports is to be guaranteed in addition to food security.
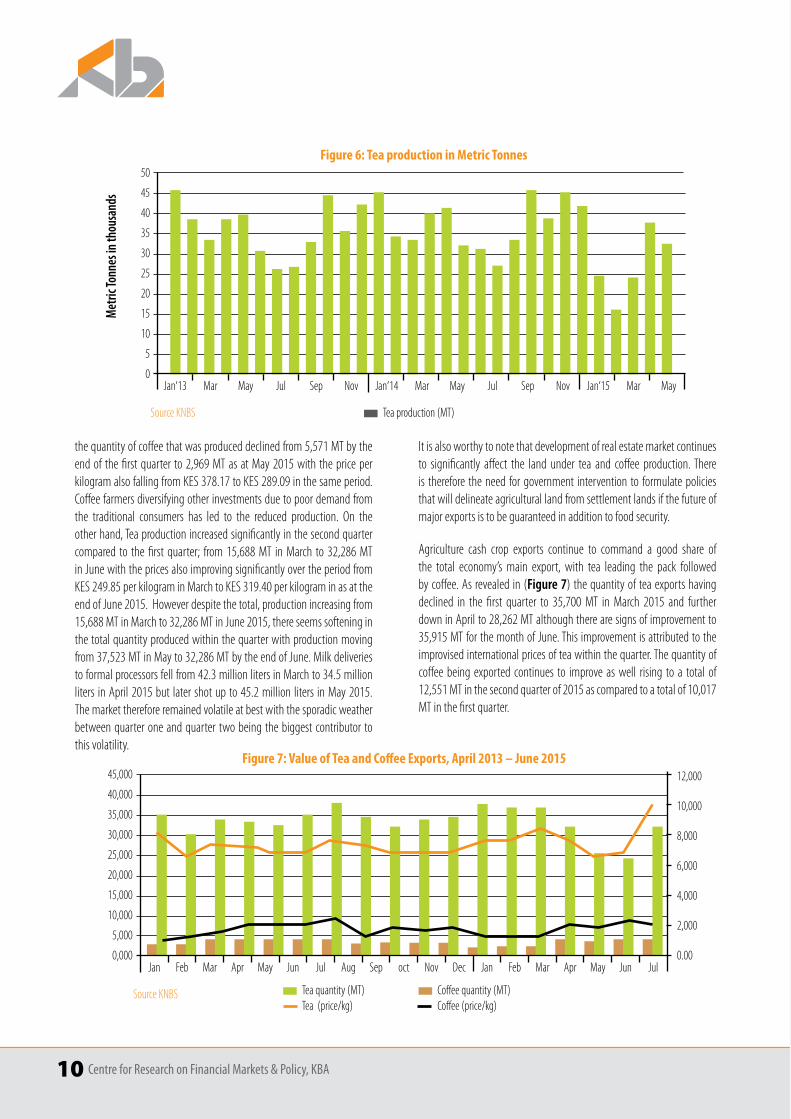
Agriculture cash crop exports continue to command a good share of the total economy’s main export, with tea leading the pack followed by coffee. As revealed in (Figure 7) the quantity of tea exports having declined in the first quarter to 35,700 MT in March 2015 and further downinAprilto28,262Mtalthoughtherearesignsofimprovementto35,915MtforthemonthofJune.thisimprovementisattributedtotheimprovised international prices of tea within the quarter. The quantity of coffee being exported continues to improve as well rising to a total of 12,551 MT in the second quarter of 2015 as compared to a total of 10,017 MT in the first quarter.
the quantity of coffee that was produced declined from 5,571 MT by the endof thefirstquarter to2,969MtasatMay2015with thepriceperkilogramalsofallingfromKes378.17toKes289.09inthesameperiod.Coffee farmers diversifying other investments due to poor demand from the traditional consumers has led to the reduced production. On the other hand, Tea production increased significantly in the second quarter compared to thefirstquarter; from15,688Mt inMarch to32,286Mtin June with the prices also improving significantly over the period from Kes249.85perkilograminMarchtoKes319.40perkilograminasattheend of June 2015. However despite the total, production increasing from 15,688MtinMarchto32,286MtinJune2015,thereseemssofteninginthe total quantity produced within the quarter with production moving from37,523MtinMayto32,286MtbytheendofJune.Milkdeliveriesto formal processors fell from 42.3 million liters in March to 34.5 million liters in April 2015 but later shot up to 45.2 million liters in May 2015. The market therefore remained volatile at best with the sporadic weather between quarter one and quarter two being the biggest contributor to this volatility.
Figure 6: Tea production in Metric Tonnes
Met
ric To
nnes
in th
ousa
nds
30
25
15
10
5
0
45
50
40
35
20
Jan‘13 Jan‘14 Jan‘15Mar Mar MarMay May MayJul JulSep SepNov Nov
Tea production (MT)Source KNBS
Figure 7: Value of Tea and Coffee Exports, April 2013 – June 2015
30,000
25,000
15,000
10,000
5,000
0,000 0.00
4,000
10,000
2,000
8,000
6,000
12,00045,000
40,000
35,000
20,000
Jan Jul JanFeb Aug FebMar Sep Mar Apr May Jun JulApr octMay NovJun Dec
Source KNBS Tea quantity (MT) Coffee quantity (MT)Tea (price/kg) Coffee (price/kg)
Centre for Research on Financial Markets & Policy, KBA 11
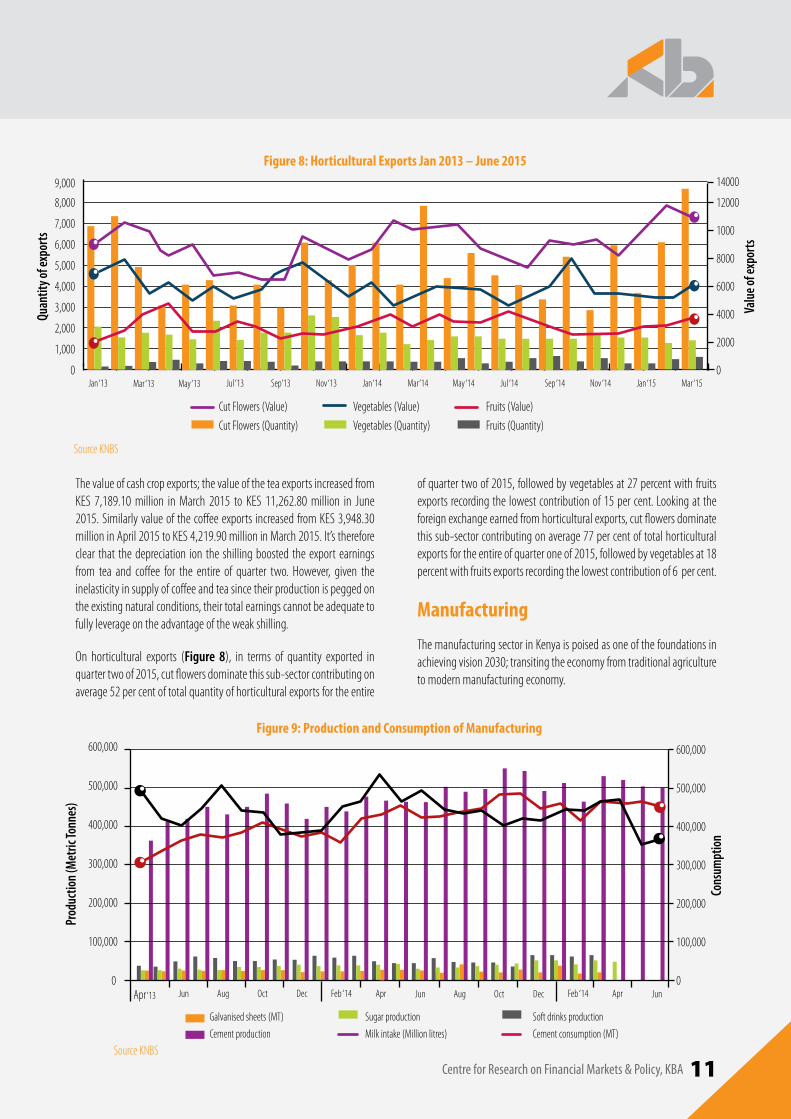
The value of cash crop exports; the value of the tea exports increased from Kes 7,189.10million inMarch 2015 to Kes 11,262.80million in June2015.similarlyvalueofthecoffeeexports increasedfromKes3,948.30millioninApril2015toKes4,219.90millioninMarch2015.It’sthereforeclear that the depreciation ion the shilling boosted the export earnings from tea and coffee for the entire of quarter two. However, given the inelasticity in supply of coffee and tea since their production is pegged on the existing natural conditions, their total earnings cannot be adequate to fully leverage on the advantage of the weak shilling.
On horticultural exports (Figure 8), in terms of quantity exported in quarter two of 2015, cut flowers dominate this sub-sector contributing on average 52 per cent of total quantity of horticultural exports for the entire
of quarter two of 2015, followed by vegetables at 27 percent with fruits exports recording the lowest contribution of 15 per cent. Looking at the foreign exchange earned from horticultural exports, cut flowers dominate this sub-sector contributing on average 77 per cent of total horticultural exportsfortheentireofquarteroneof2015,followedbyvegetablesat18percentwithfruitsexportsrecordingthelowestcontributionof6percent.
Manufacturing
The manufacturing sector in Kenya is poised as one of the foundations in achieving vision 2030; transiting the economy from traditional agriculture to modern manufacturing economy.
Figure 8: Horticultural Exports Jan 2013 – June 2015
Quan
tity o
f exp
orts
Valu
e of e
xpor
ts
0 0
6,000
6000
5,000
3,000
2,00020001,000
8,000
9,000
8000
1000
12000
14000
7,000
4,000
4000
May ‘13Mar ‘13 Jan ‘14Nov ‘13Sep‘13Jul ‘13Jan ‘13 May ‘14 Jul ‘14 Mar ‘15Nov ‘14Sep ‘14Mar‘14
Cut Flowers (Value)
Cut Flowers (Quantity)
Vegetables (Value)
Vegetables (Quantity)
Fruits (Value)
Fruits (Quantity)
Jan ‘15
Source KNBS
Figure 9: Production and Consumption of Manufacturing
Prod
uctio
n (M
etric
Tonn
es)
Cons
umpt
ion
0 0
600,000
500,000
300,000
200,000
100,000
Galvanised sheets (MT)
Milk intake (Million litres) Cement consumption (MT)Cement production
Sugar production Soft drinks production
200,000
300,000
400,000
500,000
600,000
400,000
100,000
Apr ‘13 Jun OctAug Dec Apr Apr Jun Jun Aug Oct DecFeb ‘14 Feb ‘14
Source KNBS
12 Centre for Research on Financial Markets & Policy, KBA
A key component of the manufacturing sector is its output that targets the construction industry. Cement production in the second quarter of 2015 increased slightly over quarter two production to an overall total of1,527,911Mtcomparedto1,510,063Mtinthefirstquarter.similarly,cement consumption in the second quarter of 2015 increased from an overallconsumptionof1,510,063Mtinquarteroneto1,527,911Mtinquarter two of 2015 giving a clear indication on the increased growth in the real estate sector. However there was a fall in the production of galvanized sheets in the first quarter 2015 from 33,543 MT in January to19,299MtbytheendofthequarterinMarch2015.thereductioninproduction may have been occassioned by the increase input prices due to the weakening of the Kenyan shilling over the period.
There was a slowdown in milk consumption starting from the beginning of the first quarter, reducing from 47,300 million liters in January to a low of 30,400 million liters as at the end of June 2015; this reduced demand is due to the rise in the milk prices over the period caused by reduced production occasioned by erratic weather conditions over the period. Despite the policy consideration to support the sector, the desired outcomes of the policy are likely to be realized with time lag. The number of assembled vehicles assembled has increased since the beginning of thefirstquarterintothesecondquarter,havinghad601unitsassembled
in January, 2015, 949 units in february and after which it fell to 887unitsMarchandfurtherto813unitsinApril.thisoverallincreaseshowthe renewed interest by local investors and also foreign investors to set up assembly shops in Kenya so as to provide the service for the Kenyan market and the larger East African community.
Energy
There has been continues concerted efforts to boosts energy production so as to meet the growing demand for energy by the growing economy. There is continues shift from the traditional sources of energy to concentrate on cheaper and more reliable, clean and renewable sources of energy. This shift is observable, seeing that geo-thermal production has continued to lead the way in adding to the total energy production and hydro production, though significant, continues to relatively drop. The commissioning of an additional geothermal power plant adding 140 megawatts to the national grid will cement the shift even further; this will make power costs go down by 30 percent.
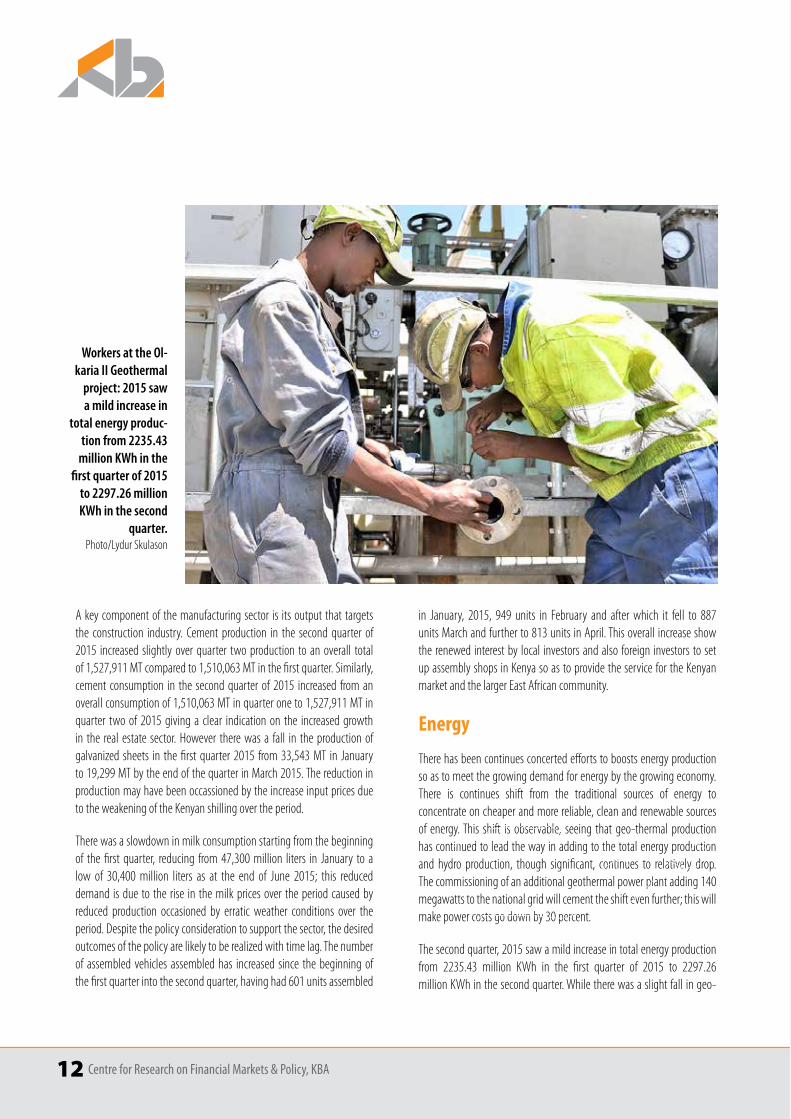
The second quarter, 2015 saw a mild increase in total energy production from 2235.43 million Kwh in the first quarter of 2015 to 2297.26million KWh in the second quarter. While there was a slight fall in geo-
Workers at the Ol-karia II Geothermal
project: 2015 saw a mild increase in
total energy produc-tion from 2235.43
million KWh in the first quarter of 2015
to 2297.26 million KWh in the second
quarter.
Photo/Lydur Skulason
Centre for Research on Financial Markets & Policy, KBA 13
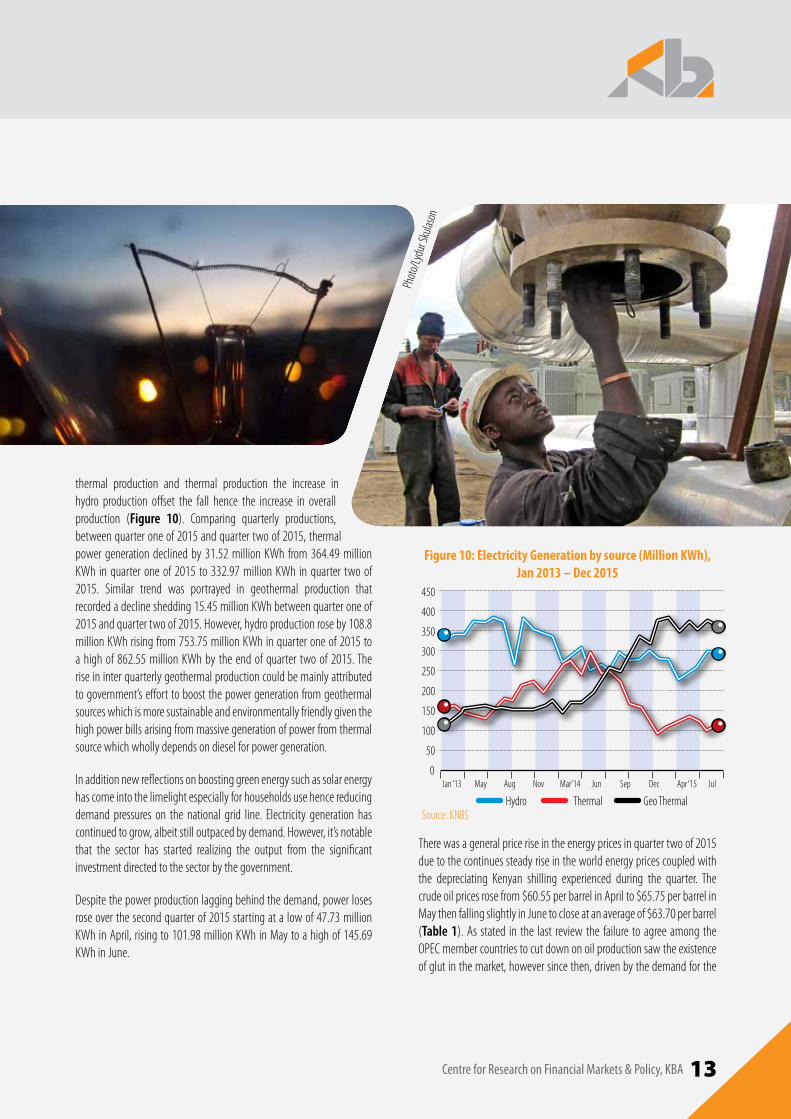
thermal production and thermal production the increase in hydro production offset the fall hence the increase in overall production (Figure 10). Comparing quarterly productions, between quarter one of 2015 and quarter two of 2015, thermal powergenerationdeclinedby31.52millionKwh from364.49millionKwh inquarter oneof 2015 to332.97millionKwh inquarter twoof2015. Similar trend was portrayed in geothermal production that recorded a decline shedding 15.45 million KWh between quarter one of 2015andquartertwoof2015.however,hydroproductionroseby108.8million KWh rising from 753.75 million KWh in quarter one of 2015 to ahighof862.55millionKwhby theendofquarter twoof2015.therise in inter quarterly geothermal production could be mainly attributed to government’s effort to boost the power generation from geothermal sources which is more sustainable and environmentally friendly given the high power bills arising from massive generation of power from thermal source which wholly depends on diesel for power generation.
In addition new reflections on boosting green energy such as solar energy has come into the limelight especially for households use hence reducing demand pressures on the national grid line. Electricity generation has continued to grow, albeit still outpaced by demand. However, it’s notable that the sector has started realizing the output from the significant investment directed to the sector by the government.
Despite the power production lagging behind the demand, power loses rose over the second quarter of 2015 starting at a low of 47.73 million KwhinApril, risingto101.98millionKwhinMaytoahighof145.69KWh in June.
Figure 10: Electricity Generation by source (Million KWh), Jan 2013 – Dec 2015
50
0
100
150
200
250
450
400
350
300
Jan ‘13 May Aug Nov Mar’14 Jun Sep Dec Apr ‘15 Jul
Source: KNBSHydro Thermal Geo Thermal
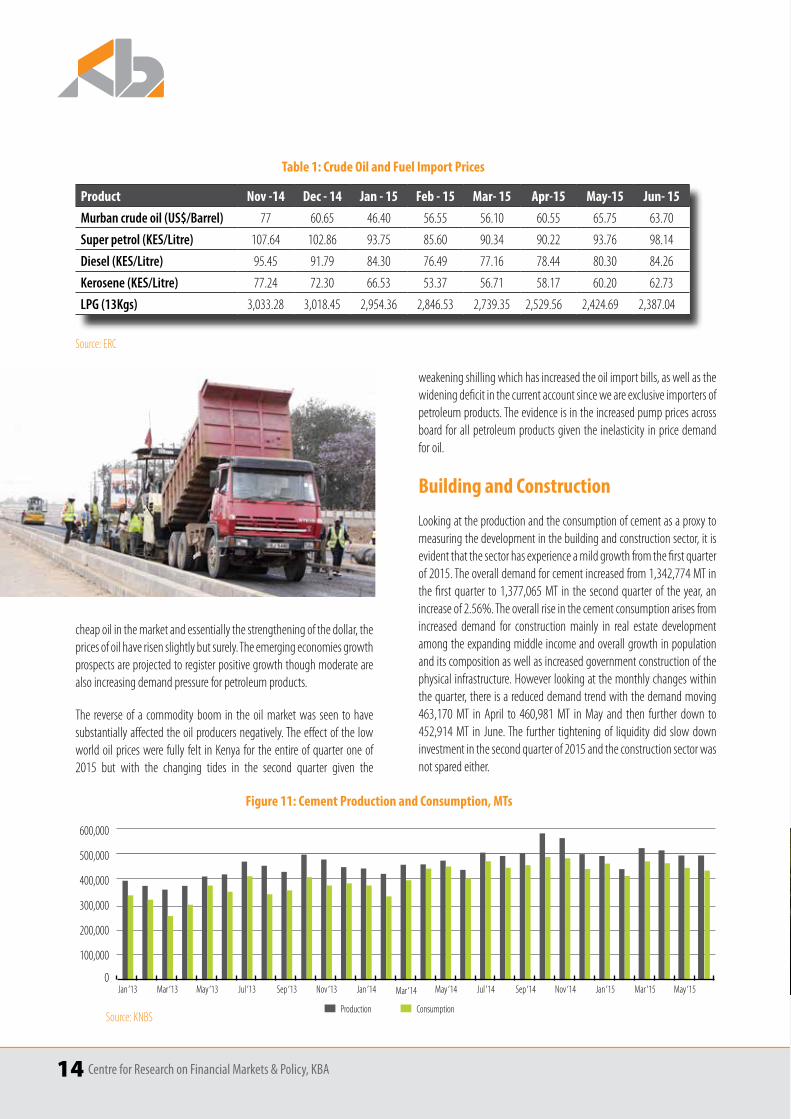
There was a general price rise in the energy prices in quarter two of 2015 due to the continues steady rise in the world energy prices coupled with the depreciating Kenyan shilling experienced during the quarter. The crudeoilpricesrosefrom$60.55perbarrelinAprilto$65.75perbarrelinMaythenfallingslightlyinJunetocloseatanaverageof$63.70perbarrel(Table 1). As stated in the last review the failure to agree among the OPEC member countries to cut down on oil production saw the existence of glut in the market, however since then, driven by the demand for the
Photo
/Lydu
r Sku
lason
14 Centre for Research on Financial Markets & Policy, KBA
cheap oil in the market and essentially the strengthening of the dollar, the prices of oil have risen slightly but surely. The emerging economies growth prospects are projected to register positive growth though moderate are also increasing demand pressure for petroleum products.
The reverse of a commodity boom in the oil market was seen to have substantially affected the oil producers negatively. The effect of the low world oil prices were fully felt in Kenya for the entire of quarter one of 2015 but with the changing tides in the second quarter given the
weakening shilling which has increased the oil import bills, as well as the widening deficit in the current account since we are exclusive importers of petroleum products. The evidence is in the increased pump prices across board for all petroleum products given the inelasticity in price demand for oil.
Building and Construction
Looking at the production and the consumption of cement as a proxy to measuring the development in the building and construction sector, it is evident that the sector has experience a mild growth from the first quarter of 2015. The overall demand for cement increased from 1,342,774 MT in thefirstquarter to1,377,065Mt in the secondquarterof theyear, anincreaseof2.56%.theoverallriseinthecementconsumptionarisesfromincreased demand for construction mainly in real estate development among the expanding middle income and overall growth in population and its composition as well as increased government construction of the physical infrastructure. However looking at the monthly changes within the quarter, there is a reduced demand trend with the demand moving 463,170Mt in April to 460,981Mt inMay and then further down to452,914Mt in June.the further tighteningof liquiditydid slowdowninvestment in the second quarter of 2015 and the construction sector was not spared either.
Table 1: Crude Oil and Fuel Import Prices
Product Nov -14 Dec - 14 Jan - 15 Feb - 15 Mar- 15 Apr-15 May-15 Jun- 15Murban crude oil (US$/Barrel) 77 60.65 46.40 56.55 56.10 60.55 65.75 63.70
Super petrol (KES/Litre) 107.64 102.86 93.75 85.60 90.34 90.22 93.76 98.14
Diesel (KES/Litre) 95.45 91.79 84.30 76.49 77.16 78.44 80.30 84.26
Kerosene (KES/Litre) 77.24 72.30 66.53 53.37 56.71 58.17 60.20 62.73
LPG (13Kgs) 3,033.28 3,018.45 2,954.36 2,846.53 2,739.35 2,529.56 2,424.69 2,387.04
Source: ERC
Production Consumption
100,000
0
300,000
200,000
400,000
500,000
600,000
Mar ‘13 Mar ‘14 May ‘15Mar ‘15May ‘13 May ‘14Jan ‘13 Jan ‘14 Jan ‘15Jul ‘13 Jul ‘14Sep ‘13 Sep ‘14Nov ‘13 Nov ‘14
Figure 11: Cement Production and Consumption, MTs
Source: KNBS
Centre for Research on Financial Markets & Policy, KBA 15
Transport and Communication
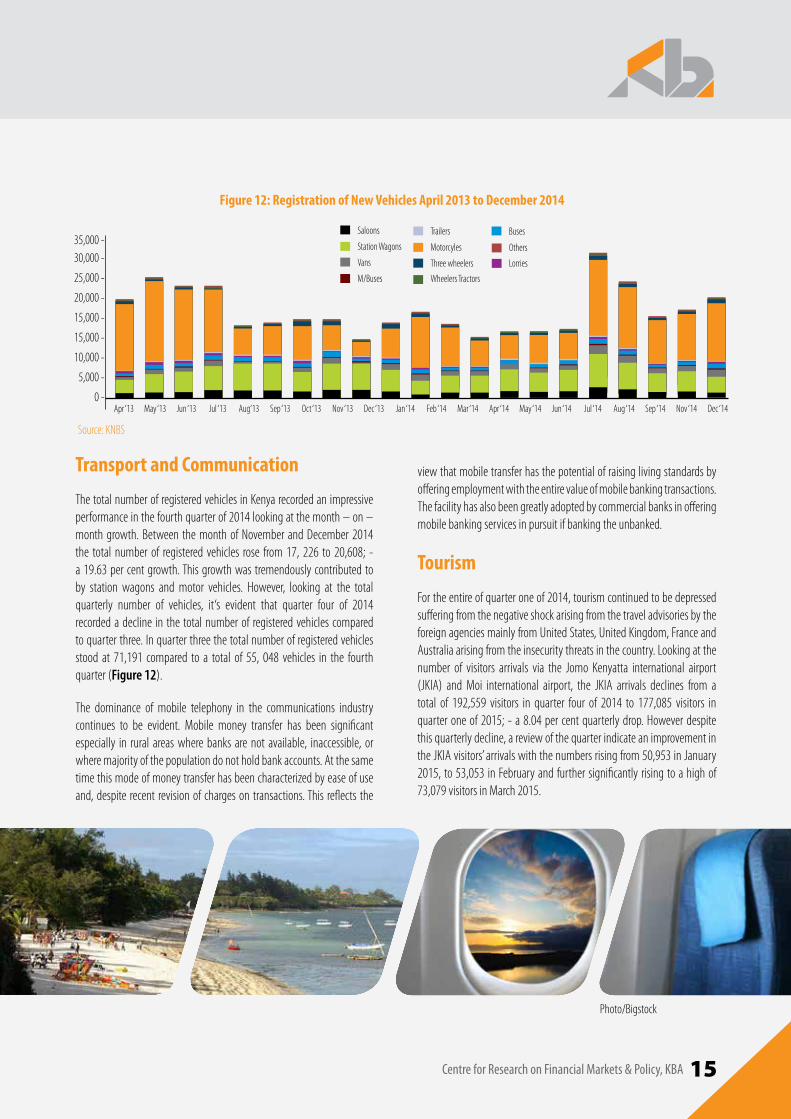
The total number of registered vehicles in Kenya recorded an impressive performance in the fourth quarter of 2014 looking at the month – on – month growth. Between the month of November and December 2014 the total number of registered vehicles rose from17, 226 to 20,608; -a19.63percentgrowth.thisgrowthwastremendouslycontributedtoby station wagons and motor vehicles. However, looking at the total quarterly number of vehicles, it‘s evident that quarter four of 2014 recorded a decline in the total number of registered vehicles compared to quarter three. In quarter three the total number of registered vehicles stood at 71,191 compared to a total of 55, 048 vehicles in the fourthquarter (Figure 12).
The dominance of mobile telephony in the communications industry continues to be evident. Mobile money transfer has been significant especially in rural areas where banks are not available, inaccessible, or where majority of the population do not hold bank accounts. At the same time this mode of money transfer has been characterized by ease of use and, despite recent revision of charges on transactions. This reflects the
view that mobile transfer has the potential of raising living standards by offering employment with the entire value of mobile banking transactions. The facility has also been greatly adopted by commercial banks in offering mobile banking services in pursuit if banking the unbanked.
Tourism
For the entire of quarter one of 2014, tourism continued to be depressed suffering from the negative shock arising from the travel advisories by the foreign agencies mainly from United States, United Kingdom, France and Australia arising from the insecurity threats in the country. Looking at the number of visitors arrivals via the Jomo Kenyatta international airport (JKIA) and Moi international airport, the JKIA arrivals declines from a total of 192,559 visitors in quarter four of 2014 to 177,085 visitors inquarteroneof2015;-a8.04percentquarterlydrop.howeverdespitethis quarterly decline, a review of the quarter indicate an improvement in theJKIAvisitors’arrivalswiththenumbersrisingfrom50,953inJanuary2015, to 53,053 in February and further significantly rising to a high of 73,079visitorsinMarch2015.
5,000 -
0 -
15,000 -
15,000 -
10,000 -
20,000 -
25,000 -
30,000 -35,000 -
Jun ‘13May ‘13 Oct ‘13Sep ‘13Aug‘13Jul ‘13Apr ‘13 Dec ‘13 Mar ‘14 Apr ‘14 May ‘14 Jun ‘14Jan ‘14 Feb ‘14Nov ‘13
Figure 12: Registration of New Vehicles April 2013 to December 2014
Source: KNBS
Saloons Buses
Vans
Trailers
Station Wagons
Lorries
M/Buses
Motorcyles
Three wheelers
Wheelers Tractors
Others
Jul ‘14 Aug ‘14 Sep ‘14 Nov ‘14 Dec ‘14
Photo/Bigstock
16 Centre for Research on Financial Markets & Policy, KBA
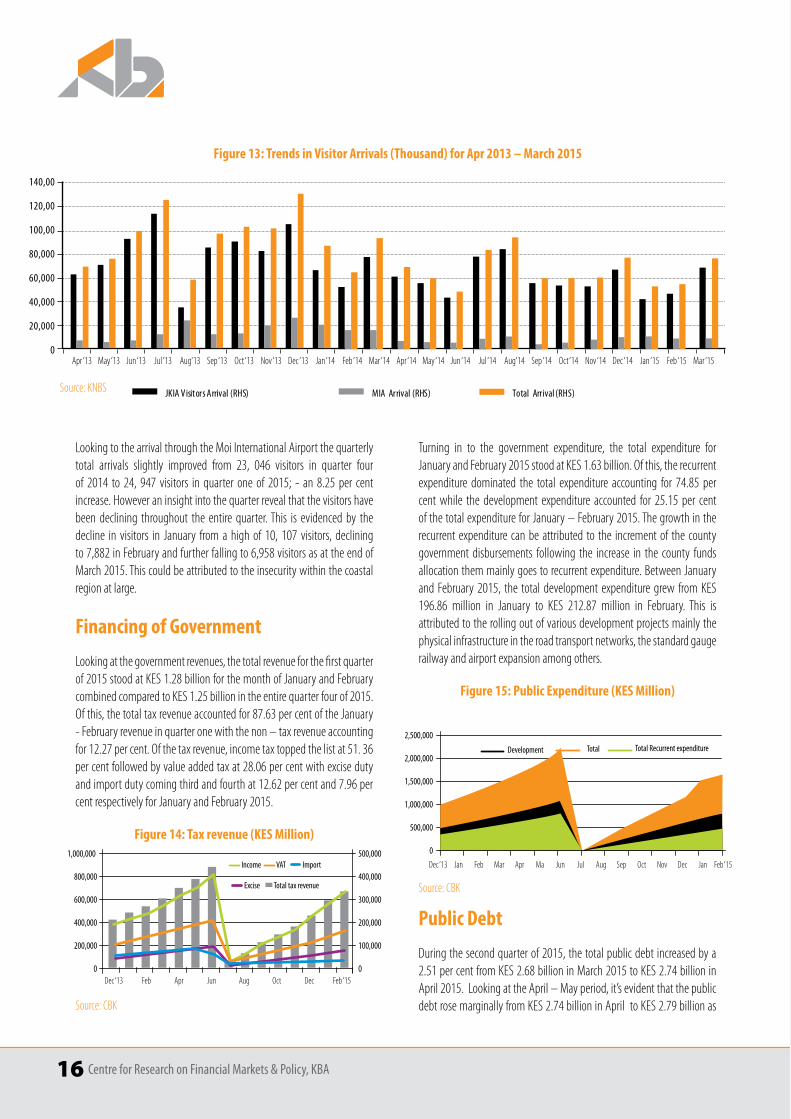
Turning in to the government expenditure, the total expenditure for Januaryandfebruary2015stoodatKes1.63billion.ofthis,therecurrentexpenditure dominated the total expenditure accounting for 74.85 percent while the development expenditure accounted for 25.15 per cent of the total expenditure for January – February 2015. The growth in the recurrent expenditure can be attributed to the increment of the county government disbursements following the increase in the county funds allocation them mainly goes to recurrent expenditure. Between January and February 2015, the total development expenditure grew from KES 196.86 million in January to Kes 212.87 million in february. this isattributed to the rolling out of various development projects mainly the physical infrastructure in the road transport networks, the standard gauge railway and airport expansion among others.
Figure 15: Public Expenditure (KES Million)
500,000
0
1,000,000
1,500,000
2,000,000
2,500,000
Jan Jan Dec ‘13 DecMa Apr MarFeb Feb ‘15Jul Oct NovAug SepJun
Development Total Total Recurrent expenditure
Source: CBK
Public Debt
During the second quarter of 2015, the total public debt increased by a 2.51percentfromKes2.68billioninMarch2015toKes2.74billioninApril 2015. Looking at the April – May period, it’s evident that the public debtrosemarginallyfromKes2.74billioninApriltoKes2.79billionas
Looking to the arrival through the Moi International Airport the quarterly total arrivals slightly improved from 23, 046 visitors in quarter fourof 2014 to 24, 947 visitors in quarter one of 2015; - an 8.25 per centincrease. However an insight into the quarter reveal that the visitors have been declining throughout the entire quarter. This is evidenced by the decline in visitors in January from a high of 10, 107 visitors, declining to7,882infebruaryandfurtherfallingto6,958visitorsasattheendofMarch 2015. This could be attributed to the insecurity within the coastal region at large.
Financing of Government
Looking at the government revenues, the total revenue for the first quarter of2015stoodatKes1.28billionforthemonthofJanuaryandfebruarycombined compared to KES 1.25 billion in the entire quarter four of 2015. ofthis,thetotaltaxrevenueaccountedfor87.63percentoftheJanuary- February revenue in quarter one with the non – tax revenue accounting for12.27percent.ofthetaxrevenue,incometaxtoppedthelistat51.36percentfollowedbyvalueaddedtaxat28.06percentwithexcisedutyandimportdutycomingthirdandfourthat12.62percentand7.96percent respectively for January and February 2015.
Figure 14: Tax revenue (KES Million)
200,000 100,000
0 0
400,000 200,000
600,000 300,000
800,000 400,000
1,000,000 500,000 Income VAT Import
Excise Total tax revenue
Dec ‘13 Dec Feb ‘15 Apr Feb Oct AugJun
Source: CBK
Figure 13: Trends in Visitor Arrivals (Thousand) for Apr 2013 – March 2015
Jun ‘13May ‘13 Oct ‘13 Oct ‘14Sep ‘13 Sep ‘14Aug‘13 Aug‘14Jul ‘13 Jul ‘14Apr ‘13 Dec ‘13 Dec ‘14Mar ‘14 Mar ‘15Apr ‘14 May ‘14 Jun ‘14Jan ‘14 Jan ‘15Feb ‘14 Feb ‘15Nov ‘13 Nov ‘14
Source: KNBS
Centre for Research on Financial Markets & Policy, KBA 17
at the end of May 2015. This was largely contributed by the external debt whichgrew fromKes1.28billion toKes1.33billion inMarch–Aprilperiod and from KES the same period compared to external debt which declinedfromKes1.16billiontoKes1.30billioninthesameperiodKes1.33billiontomKes1.38billioninApril–Mayperiod.thissignifiesthegovernment’s appetite for external debt as opposed to domestic debt. This could be as a results of the tightening monetary policy domestically which has seen the tightening in the credit market implying that any domestic borrowing by the government would further cause further tightening of the credit market leading to high domestic cost of credit. The appetite for external borrowing is likely to expand in the coming quarters with the government’s pronouncement of borrowing externally andutilizationoffacilitiessuchaseurobondstofinancethe2015/2016financial year deficit.
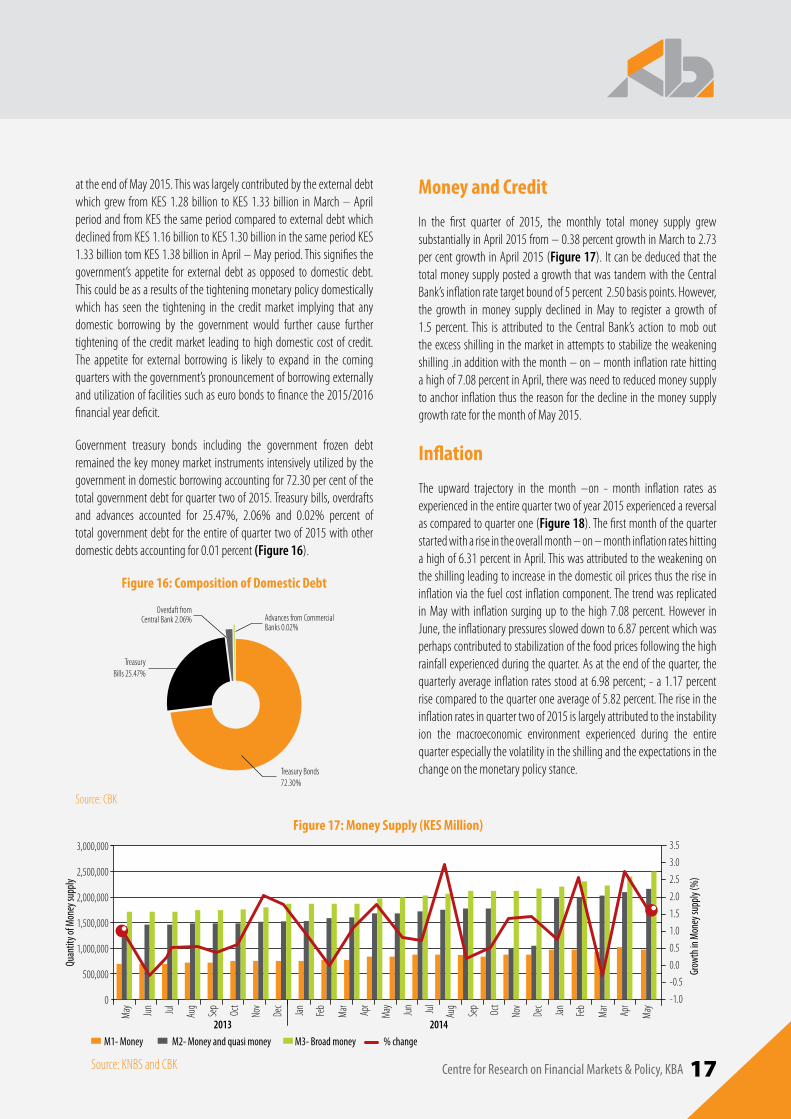
Government treasury bonds including the government frozen debt remained the key money market instruments intensively utilized by the government in domestic borrowing accounting for 72.30 per cent of the total government debt for quarter two of 2015. Treasury bills, overdrafts and advances accounted for 25.47%, 2.06% and 0.02% percent oftotal government debt for the entire of quarter two of 2015 with other domestic debts accounting for 0.01 percent (Figure 16).
Figure 16: Composition of Domestic Debt
Treasury Bonds 72.30%
Advances from Commercial Banks 0.02%
Overdaft from centralBank2.06%
Treasury Bills 25.47%
Source: CBK
Money and Credit
In the first quarter of 2015, the monthly total money supply grew substantiallyinApril2015from–0.38percentgrowthinMarchto2.73per cent growth in April 2015 (Figure 17). It can be deduced that the total money supply posted a growth that was tandem with the Central Bank’s inflation rate target bound of 5 percent 2.50 basis points. However, the growth in money supply declined in May to register a growth of 1.5 percent. This is attributed to the Central Bank’s action to mob out the excess shilling in the market in attempts to stabilize the weakening shilling .in addition with the month – on – month inflation rate hitting ahighof7.08percentinApril,therewasneedtoreducedmoneysupplyto anchor inflation thus the reason for the decline in the money supply growth rate for the month of May 2015.
Inflation
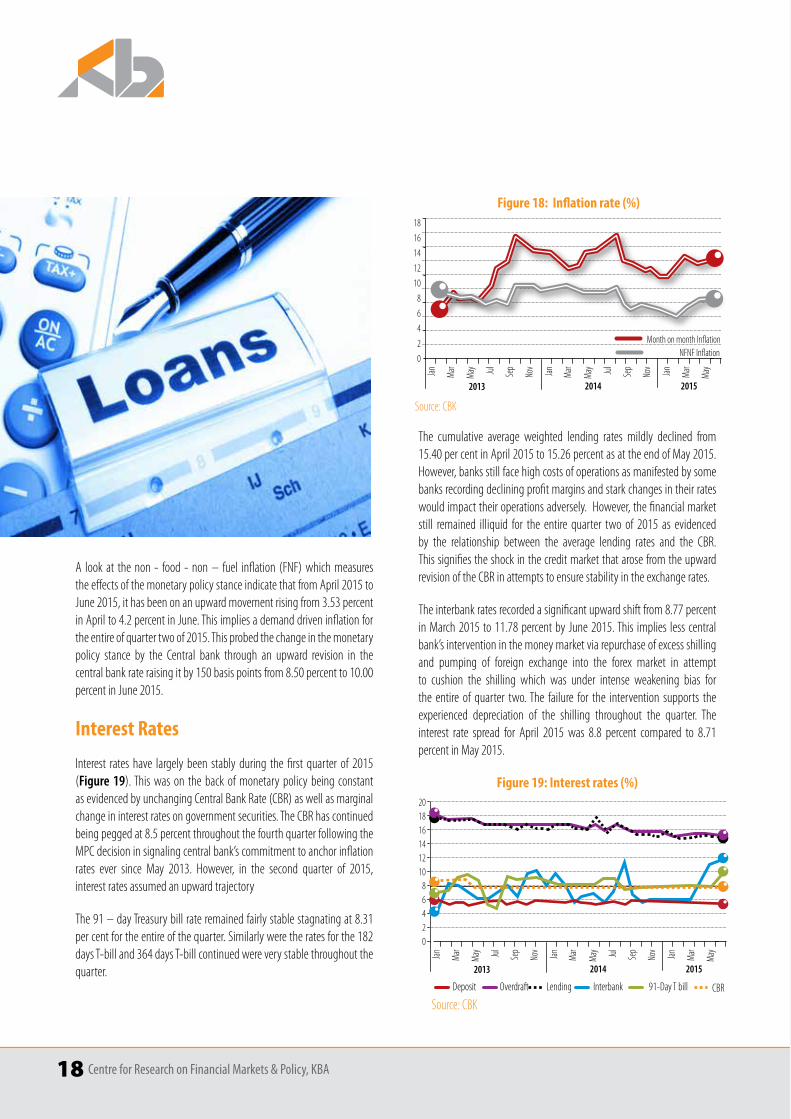
The upward trajectory in the month –on - month inflation rates as experienced in the entire quarter two of year 2015 experienced a reversal as compared to quarter one (Figure 18). The first month of the quarter started with a rise in the overall month – on – month inflation rates hitting ahighof6.31percentinApril.thiswasattributedtotheweakeningonthe shilling leading to increase in the domestic oil prices thus the rise in inflation via the fuel cost inflation component. The trend was replicated inMaywith inflation surgingup to thehigh7.08percent.however inJune,theinflationarypressuressloweddownto6.87percentwhichwasperhaps contributed to stabilization of the food prices following the high rainfall experienced during the quarter. As at the end of the quarter, the quarterlyaverage inflationratesstoodat6.98percent;-a1.17percentrisecomparedtothequarteroneaverageof5.82percent.theriseintheinflation rates in quarter two of 2015 is largely attributed to the instability ion the macroeconomic environment experienced during the entire quarter especially the volatility in the shilling and the expectations in the change on the monetary policy stance.
0
1,500,0001.5
1,000,000
1.0
0.5
2013 2014
500,000-0.5
0.0
-1.0
2,000,000
2.5
2.0
3,000,000
2,500,000
3.5
3.0
Mar
Mar
May
Sep
May
Jun Jul
Aug
Sep
Oct
Nov
Nov
Jan JanDec
Dec
Feb
Feb
Apr
Aug
M1- Money M2- Money and quasi money
Grow
th in
Mon
ey su
pply
(%)
Quan
tity o
f Mon
ey su
pply
M3- Broad money % change
Source: KNBS and CBK
Apr
Oct
May
Jun Jul
Figure 17: Money Supply (KES Million)
18 Centre for Research on Financial Markets & Policy, KBA
A look at the non - food - non – fuel inflation (FNF) which measures the effects of the monetary policy stance indicate that from April 2015 to June 2015, it has been on an upward movement rising from 3.53 percent in April to 4.2 percent in June. This implies a demand driven inflation for the entire of quarter two of 2015. This probed the change in the monetary policy stance by the Central bank through an upward revision in the centralbankrateraisingitby150basispointsfrom8.50percentto10.00percent in June 2015.
Interest Rates
Interest rates have largely been stably during the first quarter of 2015 (Figure 19). This was on the back of monetary policy being constant as evidenced by unchanging Central Bank Rate (CBR) as well as marginal change in interest rates on government securities. The CBR has continued beingpeggedat8.5percentthroughoutthefourthquarterfollowingtheMPC decision in signaling central bank’s commitment to anchor inflation rates ever since May 2013. However, in the second quarter of 2015, interest rates assumed an upward trajectory
the91–daytreasurybillrateremainedfairlystablestagnatingat8.31percentfortheentireofthequarter.similarlyweretheratesforthe182dayst-billand364dayst-billcontinuedwereverystablethroughoutthequarter.
The cumulative average weighted lending rates mildly declined from 15.40percentinApril2015to15.26percentasattheendofMay2015.However, banks still face high costs of operations as manifested by some banks recording declining profit margins and stark changes in their rates would impact their operations adversely. However, the financial market still remained illiquid for the entire quarter two of 2015 as evidenced by the relationship between the average lending rates and the CBR. This signifies the shock in the credit market that arose from the upward revision of the CBR in attempts to ensure stability in the exchange rates.
theinterbankratesrecordedasignificantupwardshiftfrom8.77percentinMarch2015to11.78percentbyJune2015.this implies lesscentralbank’s intervention in the money market via repurchase of excess shilling and pumping of foreign exchange into the forex market in attempt to cushion the shilling which was under intense weakening bias for the entire of quarter two. The failure for the intervention supports the experienced depreciation of the shilling throughout the quarter. The interest rate spread for April 2015 was 8.8 percent compared to 8.71percent in May 2015.
Figure 19: Interest rates (%)
CBR
Source: CBKDeposit Overdraft Lending Interbank 91-daytbill
Mar
02468
101214
201816
2013 2014 2015
Jul
Jan SepJul
Nov
Sep
Mar
Nov
May
May
May
JanJan Mar
Figure 18: Inflation rate (%)
Mar
Source: CBK
0
2
4
6
8
10
12
14
18
16
2013 2014 2015
Jul
Jan SepJul
Nov
Sep
Mar
Nov
May
May
May
JanJan Mar
Month on month Inflation NFNF Inflation
Centre for Research on Financial Markets & Policy, KBA 19
Balance of Payments
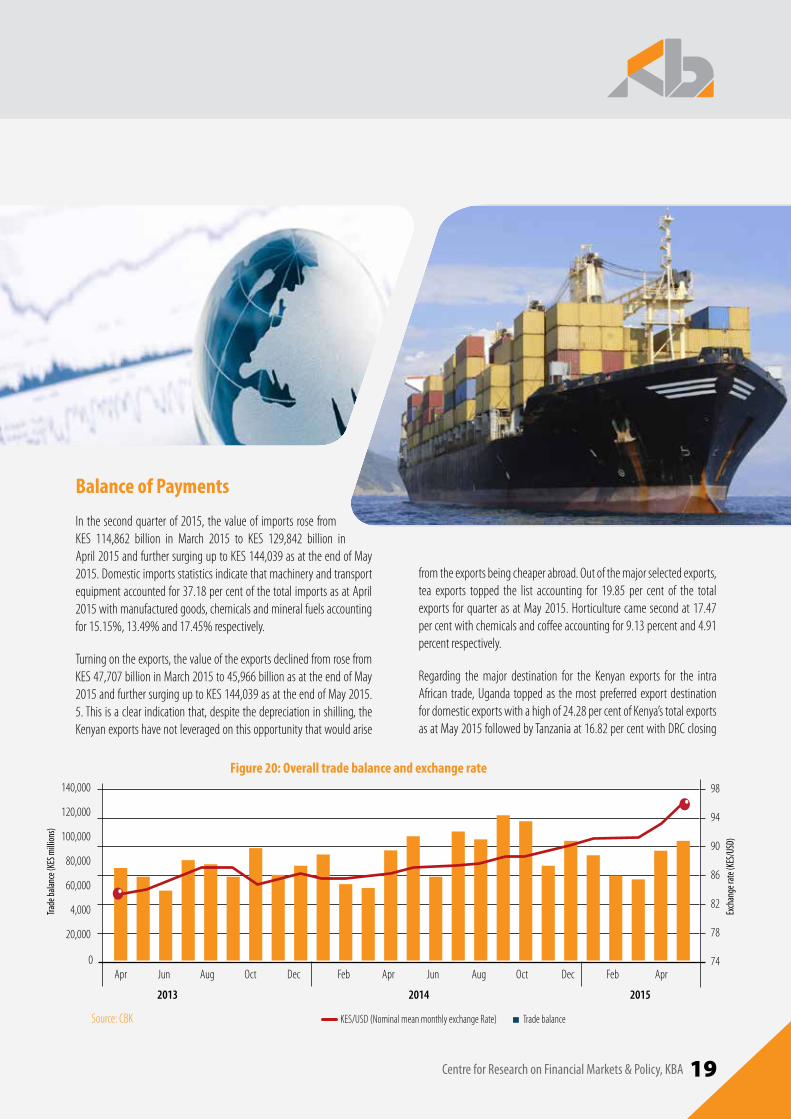
In the second quarter of 2015, the value of imports rose from Kes 114,862 billion in March 2015 to Kes 129,842 billion inApril2015andfurthersurginguptoKes144,039asattheendofMay2015. Domestic imports statistics indicate that machinery and transport equipmentaccountedfor37.18percentofthetotalimportsasatApril2015 with manufactured goods, chemicals and mineral fuels accounting for15.15%,13.49%and17.45%respectively.
Turning on the exports, the value of the exports declined from rose from Kes47,707billioninMarch2015to45,966billionasattheendofMay2015andfurthersurginguptoKes144,039asattheendofMay2015.5. This is a clear indication that, despite the depreciation in shilling, the Kenyan exports have not leveraged on this opportunity that would arise
from the exports being cheaper abroad. Out of the major selected exports, tea exports topped the list accounting for 19.85 per cent of the totalexports for quarter as at May 2015. Horticulture came second at 17.47 percentwithchemicalsandcoffeeaccountingfor9.13percentand4.91percent respectively.
Regarding the major destination for the Kenyan exports for the intra African trade, Uganda topped as the most preferred export destination fordomesticexportswithahighof24.28percentofKenya’stotalexportsasatMay2015followedbytanzaniaat16.82percentwithdrcclosing
Source: CBK
0
20,000
4,000
78
74
60,000
80,000
82
140,000
120,000 94
98
90
86
100,000
Apr AprAugDecAug DecAprJun OctFebOct FebJun
2013 2014 2015
Trade
balan
ce (K
ES m
illion
s)
Exch
ange
rate
(KES
/USD
)
KES/USD (Nominal mean monthly exchange Rate) Trade balance
Figure 20: Overall trade balance and exchange rate
20 Centre for Research on Financial Markets & Policy, KBA
Figure 21: Nominal Exchange Rate
31
32
33
34
90
95
30
85
29
75
80
70
28
65
94
98
96
100
125
120
90
110
92
115
88
86
105
100
84
95
Jan ‘13 Jun ‘15
Jan ‘13 Jun ‘15
Jan ‘13 Jun ‘15
Jan ‘13 Jun ‘15
Jan ‘13 Jun ‘15
Jan ‘13 Jun ‘15
26.0
155
24.0
150
20.0
140
22.0
145
18.0
130
135
16.0
125
120
(100)
thirdat8.25percent.for themajor importswithin theAfricanmarket,importsfromsouthAfricaaccountedfor43.80percentasattheendofMay 2015, followed by Tanzania at 17.20 percent with Egypt coming third at14.94percent.
Looking at the Kenya exports destinations globally for April and May 2015, Uganda topped at 11.01 per cent followed closely by Netherlands at7.93percentwithusAcomingthirdat6.63percent.tanzania,unitedKingdomandegyptfollowat6.61,6.27and3.52percentrespectively.
Turning into the overall monthly trade balance, it’s evident that while the monthlytradebalanceworsenedfromKes67,156millioninMarch2015toKes98,073millionasattheendofMay2015.thiscouldbemainlyattributed to the decline in the weakening shilling against the major currencies such as the dollar which increased the import bills significantly. In addition the massive importation of machinery and transport facilities in wake of continuing major physical infrastructural projects contributed to the worsening of the trade balance. In addition the failure of the exports to fetch enough export earnings despite the depreciating shilling mainly due to the nature of the Kenya exports led to the trade balance deficit in quarter two of 2015. From figure 21, it’s evident that the depreciation in
the shilling is directly related to the rise in the trade balance with a sharp rise being evidence in the month of April and May 2015.
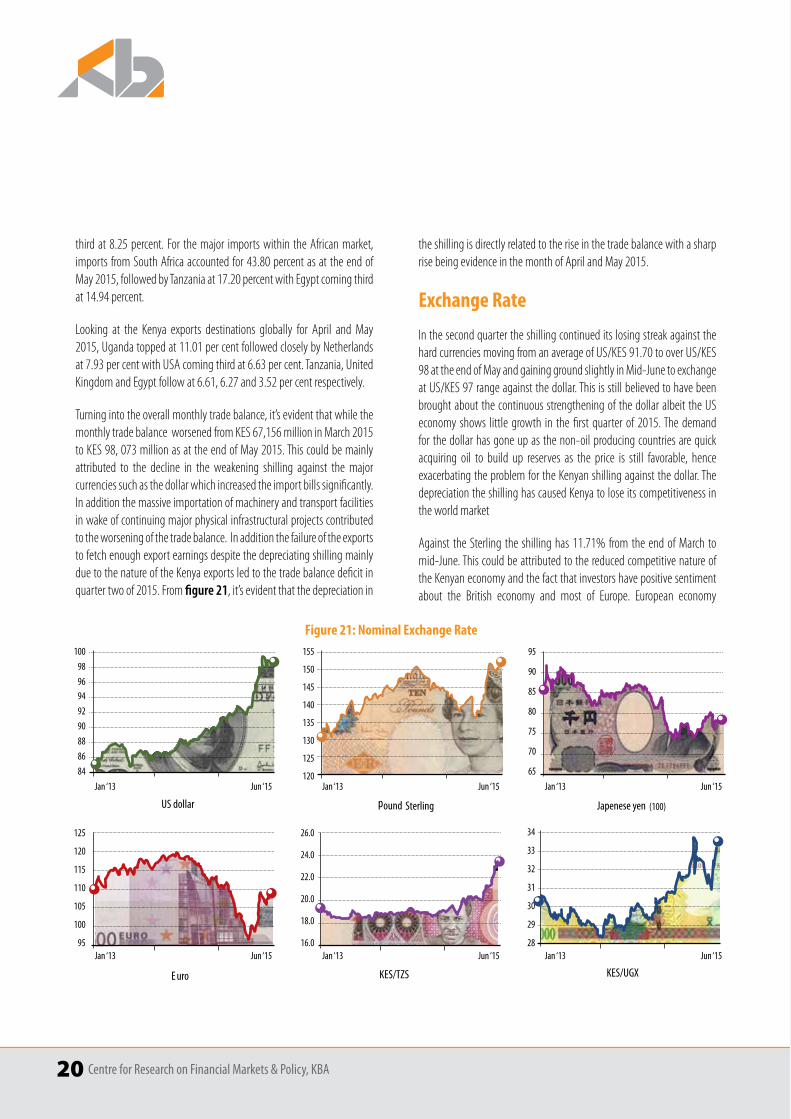
Exchange Rate
In the second quarter the shilling continued its losing streak against the hardcurrenciesmovingfromanaverageofus/Kes91.70tooverus/Kes98attheendofMayandgaininggroundslightlyinMid-Junetoexchangeatus/Kes97rangeagainstthedollar.thisisstillbelievedtohavebeenbrought about the continuous strengthening of the dollar albeit the US economy shows little growth in the first quarter of 2015. The demand for the dollar has gone up as the non-oil producing countries are quick acquiring oil to build up reserves as the price is still favorable, hence exacerbating the problem for the Kenyan shilling against the dollar. The depreciation the shilling has caused Kenya to lose its competitiveness in the world market
Against the Sterling the shilling has 11.71% from the end of March to mid-June. This could be attributed to the reduced competitive nature of the Kenyan economy and the fact that investors have positive sentiment about the British economy and most of Europe. European economy
Centre for Research on Financial Markets & Policy, KBA 21
Nairobi Securities Exchange
The first quarter of 2015 saw mild growth of 2.57 basis points in the NSE having posted a NSE 20-share index of 5,212 points in January and 5346 points at the end of the quarter. despite the growthwhichwasexperienced in the first quarter, the NSE started losing ground by the end of the quarter and the trend did continue into the second quarter of the yearwiththemonthofAprildippingtoalowof5,091points.theindexcontinued to fall below the 5,000 points mark reaching an average of 4788pointsforthemonthofMay.thoughtherehasbeenasurgeupwardsin the month of June the NSE is still trading below the 4000 points mark; atanaverageof4906forthemonthofJune.
Table 2: Nairobi Securities Exchange Market Indicators
DATE Jan 2015 Feb 2015 Mar 2015 Apr 2015May
2015Jun 2015
NSE 20 Share Index 100 =1966 5,212 5,491 5,346 5,091 4,788 4,906
NSE All Share Index (NASI) 100=2008 166 176 174 173 162 164
Market Capitalization (KES Bn) 2,350 2,461 2,452 2430 2341 2302
Total Shares Traded (Million) 414 593 614 488 684 681
No. of Equity Transactions 39,813 42,387 44,715 36,148 35,782 33,367
Bonds Turnover (KES Bn) 38 45 46 25 22 12
Percent of Foreign Participation to ET 47% 44% 53% 56 63 74
Source: NSE, Monthly Trading Report
may be getting out of the deflation it has been experiencing causing more depreciation pressure on the shilling. We also see that the Kenyan shilling has in overall lost ground against the Euro. The emerging markets, including the Asian market have also been experiencing lower growth numbers and The Japan economy has had a very slow recovery process that it has lost ground consistently against the Kenyan shilling over the past six quarters albeit showing signs of recovery in the second quarter of 2015.
The Kenyan shilling has behaved considerably well against it East African counterparts despite its weak turn against the majors. However, this can be attributed to the weak performance of the other economies in the region as well.
22 Centre for Research on Financial Markets & Policy, KBA
The low performance is a result of dividend pay outs to the foreign investors following the end of financial years for majority of the listed companies.theexchangehasexperiencedadeclineof3.63basispointssince the start of April to the end of the quarter, registering an average NSE 20-share indexof4906 for themonthof June.thedismalperformancehas mainly been caused by the bearish behaviour in the market, driven majorly by the foreign investors. We can see from the figures that the foreign investor activity increased considerably over the quarter from 56percent at thebeginningof thequarter to anaverageof74percentby the end of June. Foreign investor bearish sentiments, driven chiefly by the uncertainty of the Kenyan shilling performance, liquidity tightening in the Kenyan market and improved market outlook of the more developed stock exchanges like the Nigerian and the South African stock exchange has caused the NSE capitalization to also fall consistently throughout the quarter; from an average high of KES 2430 billion in April to a low of KES 2302 Billion in June. The local investors are also feeling a bit jittery about the market and perhaps one may see it as investors consolidating so as to see the direction that the market would take when the Kenyan shilling performance improves.
theNseAllshareindexfellaswellfrom173pointsinAprilto162pointsinMay having lost 6.36 basis points; then breaking the trend close atanaverageof164pointsinJune,againof1.24basispoints.theequityturnover coupled with the percentage of foreign traders in the market gives a picture of increased foreign participation in the market.
In the fixed income segment, the bond market performed dismally in the second quarter of 2015. The bond turnover having fallen drastically from Kes46billionattheendoftheMarchtoanaverageKes25billioninApriland further down in May, to KES 22 billion, to close at an average of KES 12 billion in June. This was widely driven by the contractual monetary policies that reduced liquidity in the market, redirecting demand to more short term instruments in the market.
Banking Industry Performance
A highlight of the banking industry for quarter two of 2015 posits that Demand for credit generally grew in a number of sectors namely: person-al/household, trade, building and construction, transport and agriculture. However, demand for credit in mining, energy, financial services, manu-facturing and real estate remained unchanged for the entire of quarter two of 2015. By the end of quarter two the recovery of the tourism and hotels sector had not picked though some prospects for recovery were evident. In overall, the banking sector remained stable for the entire of the quarter. However this stability for the rest of the year in pegged on the policies and measure undertaken by the central bank and the national treasury with regard to monetary and fiscal policies that will shape the macroeconomic environment which the commercial banks operate in.
Assets and Loans
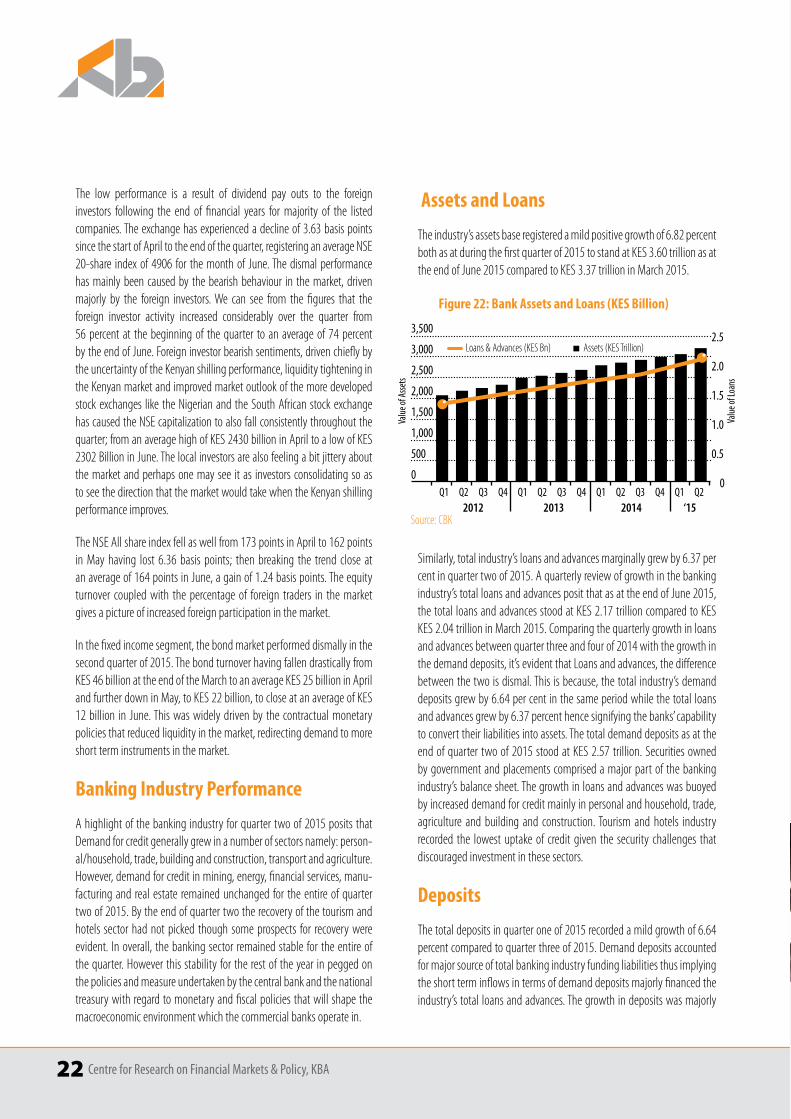
theindustry’sassetsbaseregisteredamildpositivegrowthof6.82percentbothasatduringthefirstquarterof2015tostandatKes3.60trillionasatthe end of June 2015 compared to KES 3.37 trillion in March 2015.
3,500
3,000
2,500
Q1 Q1 Q1 Q1Q4 Q4 Q4Q3 Q3Q2 Q2 Q3 Q2Q2
2,000
1,500
1,000
500
00
0.5
1.5
1.0
2.0
2.5
Figure 22: Bank Assets and Loans (KES Billion)
Source: CBK2012 2013 2014 ‘15
Loans & Advances (KES Bn) Assets (KES Trillion)
Value
of A
ssets
Value
of Lo
ans
similarly,totalindustry’sloansandadvancesmarginallygrewby6.37percent in quarter two of 2015. A quarterly review of growth in the banking industry’s total loans and advances posit that as at the end of June 2015, the total loans and advances stood at KES 2.17 trillion compared to KES KES 2.04 trillion in March 2015. Comparing the quarterly growth in loans and advances between quarter three and four of 2014 with the growth in the demand deposits, it’s evident that Loans and advances, the difference between the two is dismal. This is because, the total industry’s demand depositsgrewby6.64percentinthesameperiodwhilethetotalloansandadvancesgrewby6.37percenthencesignifyingthebanks’capabilityto convert their liabilities into assets. The total demand deposits as at the end of quarter two of 2015 stood at KES 2.57 trillion. Securities owned by government and placements comprised a major part of the banking industry’s balance sheet. The growth in loans and advances was buoyed by increased demand for credit mainly in personal and household, trade, agriculture and building and construction. Tourism and hotels industry recorded the lowest uptake of credit given the security challenges that discouraged investment in these sectors.
Deposits
thetotaldepositsinquarteroneof2015recordedamildgrowthof6.64percent compared to quarter three of 2015. Demand deposits accounted for major source of total banking industry funding liabilities thus implying the short term inflows in terms of demand deposits majorly financed the industry’s total loans and advances. The growth in deposits was majorly
Centre for Research on Financial Markets & Policy, KBA 23
attributed to increased branch expansions as banks initially involved in corporate banking continue embracing retail banking to leverage on competition from other players, remittances and receipts from exports. In addition, the tremendous growth in agency banking contributed to the growth in the demand deposits base given that the model has proved to be essential in banking the unbanked population especially in the rural areas. For the entire of quarter two of 2015 the total industry’s deposits stood at KES 2.57 trillion Compared to KES 2.41 trillion in quarter three of 2015.
Q1-12
0.5 1.5 2.0 2.5 3.01.0
Q2-12Q3-12Q4-12Q1-13Q2-13Q3-13
Q1-14Q4-13
Q3-14Q4-14Q1-15
Q2-14
Figure 23: Bank Deposits (KES Trillions)
Source: CBK
Q2-15
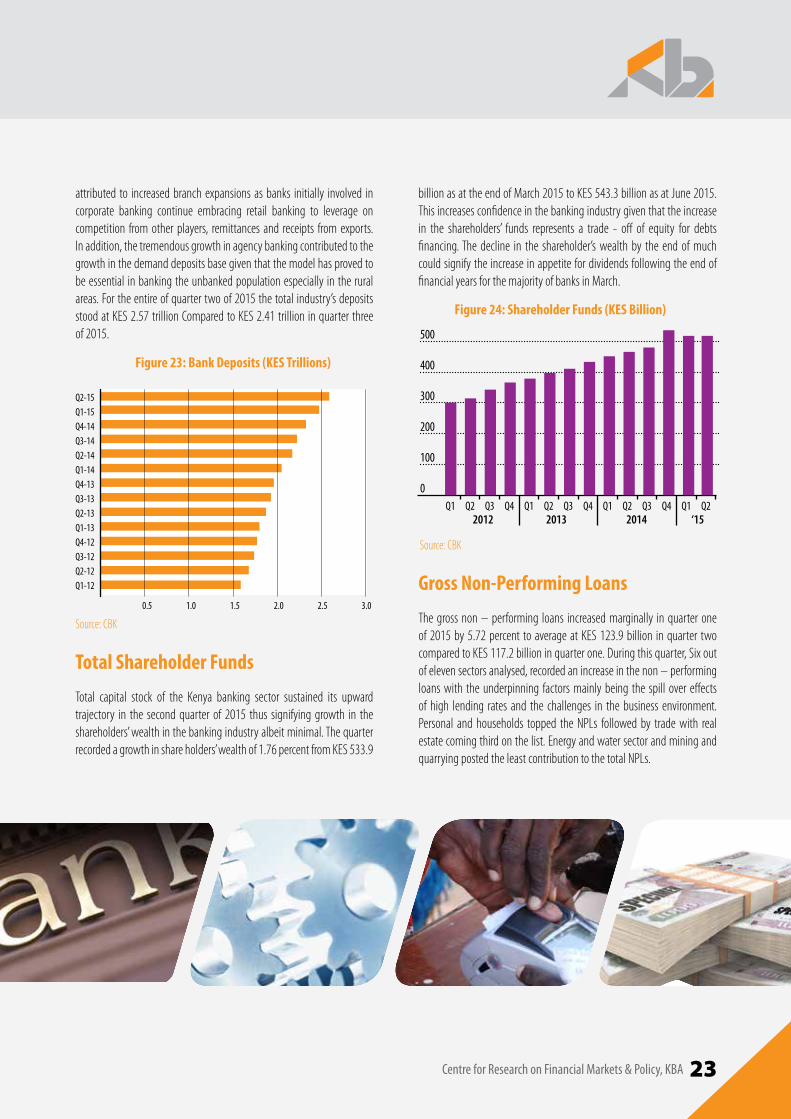
Total Shareholder Funds
Total capital stock of the Kenya banking sector sustained its upward trajectory in the second quarter of 2015 thus signifying growth in the shareholders’ wealth in the banking industry albeit minimal. The quarter recordedagrowthinshareholders’wealthof1.76percentfromKes533.9
billion as at the end of March 2015 to KES 543.3 billion as at June 2015. This increases confidence in the banking industry given that the increase in the shareholders’ funds represents a trade - off of equity for debts financing. The decline in the shareholder’s wealth by the end of much could signify the increase in appetite for dividends following the end of financial years for the majority of banks in March.
Q1 Q1 Q1Q1Q4 Q4 Q4Q3 Q3 Q3Q2 Q2 Q2 Q2
0
100
200
300
400
500
Source: CBK
2012 2013 2014 ‘15
Figure 24: Shareholder Funds (KES Billion)
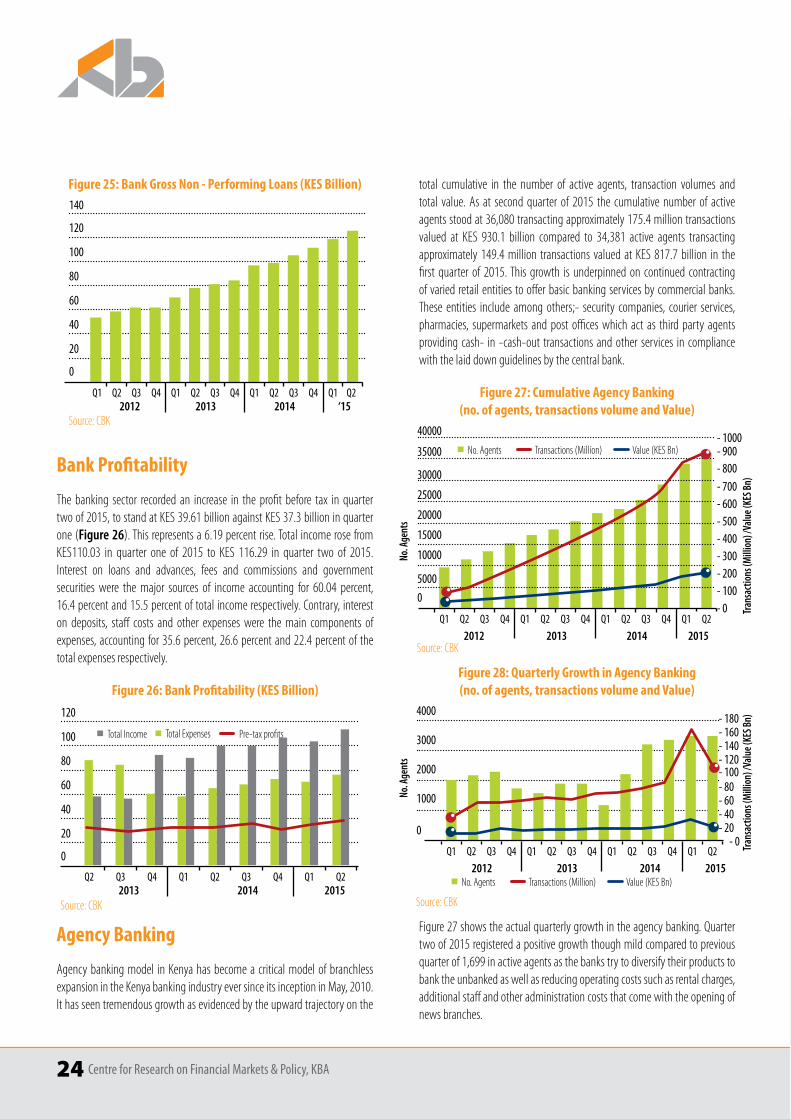
Gross Non-Performing Loans
The gross non – performing loans increased marginally in quarter one of2015by5.72percent toaverageatKes123.9billion inquarter twocompared to KES 117.2 billion in quarter one. During this quarter, Six out of eleven sectors analysed, recorded an increase in the non – performing loans with the underpinning factors mainly being the spill over effects of high lending rates and the challenges in the business environment. Personal and households topped the NPLs followed by trade with real estate coming third on the list. Energy and water sector and mining and quarrying posted the least contribution to the total NPLs.
24 Centre for Research on Financial Markets & Policy, KBA
Figure 25: Bank Gross Non - Performing Loans (KES Billion)
120
140
100
80
60
40
20
0
Source: CBK
Q1 Q1 Q1Q1Q4 Q4 Q4Q3 Q3 Q3Q2 Q2 Q2 Q22012 2013 2014 ‘15
Bank Profitability
The banking sector recorded an increase in the profit before tax in quarter twoof2015,tostandatKes39.61billionagainstKes37.3billioninquarterone (Figure 26).thisrepresentsa6.19percentrise.totalincomerosefromKes110.03 in quarter one of 2015 to Kes 116.29 in quarter two of 2015.Interest on loans and advances, fees and commissions and government securities were themajor sources of income accounting for 60.04 percent,16.4percentand15.5percentoftotalincomerespectively.contrary,intereston deposits, staff costs and other expenses were the main components of expenses,accountingfor35.6percent,26.6percentand22.4percentofthetotal expenses respectively.
Figure 26: Bank Profitability (KES Billion)
Pre-tax profitsTotal ExpensesTotal Income
120
100
80
60
40
20
0
Source: CBK
Q1Q1Q4 Q4Q3 Q3Q2 Q2 Q22013 2014 2015
Agency Banking
Agency banking model in Kenya has become a critical model of branchless expansion in the Kenya banking industry ever since its inception in May, 2010. It has seen tremendous growth as evidenced by the upward trajectory on the
total cumulative in the number of active agents, transaction volumes and total value. As at second quarter of 2015 the cumulative number of active agentsstoodat36,080transactingapproximately175.4milliontransactionsvalued at Kes 930.1 billion compared to 34,381 active agents transactingapproximately149.4million transactionsvaluedatKes817.7billion in thefirst quarter of 2015. This growth is underpinned on continued contracting of varied retail entities to offer basic banking services by commercial banks. These entities include among others;- security companies, courier services, pharmacies, supermarkets and post offices which act as third party agents providing cash- in -cash-out transactions and other services in compliance with the laid down guidelines by the central bank.
Figure 27: Cumulative Agency Banking (no. of agents, transactions volume and Value)
Source: CBK
25000
30000
35000
40000
Q1 Q2 Q3 Q1 Q1Q4 Q4Q2 Q2 Q2Q3 Q3Q4 Q1
20000
15000
10000
5000
0- 0
- 500
- 300
- 700- 800- 900- 1000
- 200- 100
- 600
- 400
2012 2013 2014 2015
Value (KES Bn)Transactions (Million)No. Agents
No. A
gent
s
Tran
sact
ions
(Mill
ion)
/Val
ue (K
ES B
n)
Figure 28: Quarterly Growth in Agency Banking (no. of agents, transactions volume and Value)
Q1 Q2 Q3 Q1 Q1Q4 Q4Q2 Q2 Q2Q3 Q3Q4 Q1
2012 2013 2014 2015
4000
3000
2000
1000
0- 0
- 120
- 80
- 160
- 60- 40- 20
- 140
- 100
- 180
Source: CBK
Value (KES Bn)Transactions (Million)No. Agents
No. A
gent
s
Tran
sact
ions
(Mill
ion)
/Val
ue (K
ES B
n)
Figure 27 shows the actual quarterly growth in the agency banking. Quarter two of 2015 registered a positive growth though mild compared to previous quarterof1,699inactiveagentsasthebankstrytodiversifytheirproductstobank the unbanked as well as reducing operating costs such as rental charges, additional staff and other administration costs that come with the opening of news branches.

THE INSIDE EDGEwww.oxfordbusinessgroup.com
“The most concise and authoritative
guide to business and economics available
on emerging markets.” – Newsweek
Oxford Business Group is a global economic research house and consultancy producing annual investment and economic reports in more than 35 markets.

Kenya Bankers Association13th Floor, International House, Mama Ngina StreetP.O. Box 73100– 00200 NAIROBITelephone: 254 20 2221704/2217757/2224014/5Cell: 0733 812770/0711 562910Fax: 254 20 2221792Email: [email protected]: www.kba.co.ke