Embed Size (px)
Citation preview
Equentis Wealth Advisory Services (P) Ltd
Registered Office: 712, Raheja Chambers, Nariman Point,
Mumbai – 400021 India
Tel: +91 22 61013800
Email: [email protected]
Main Research Report
KEC International Limited
Independent Equity Research
March - 2018
2
KEC INTERNATIONAL LIMITED (KEC)
Disclaimer: This note has been prepared in the month of March 2018 and is refreshed as and
when deemed necessary. Our recommended companies are tracked regularly (quarterly) and for
latest information on the company and latest 15-18 months and 5-year targets, please visit the
quarterly result report section on our website. Detailed quarterly results are uploaded every
quarter in this section. Additionally, clients are also updated on any major events as and when
they occur.
Background and Business
a) Business Overview –
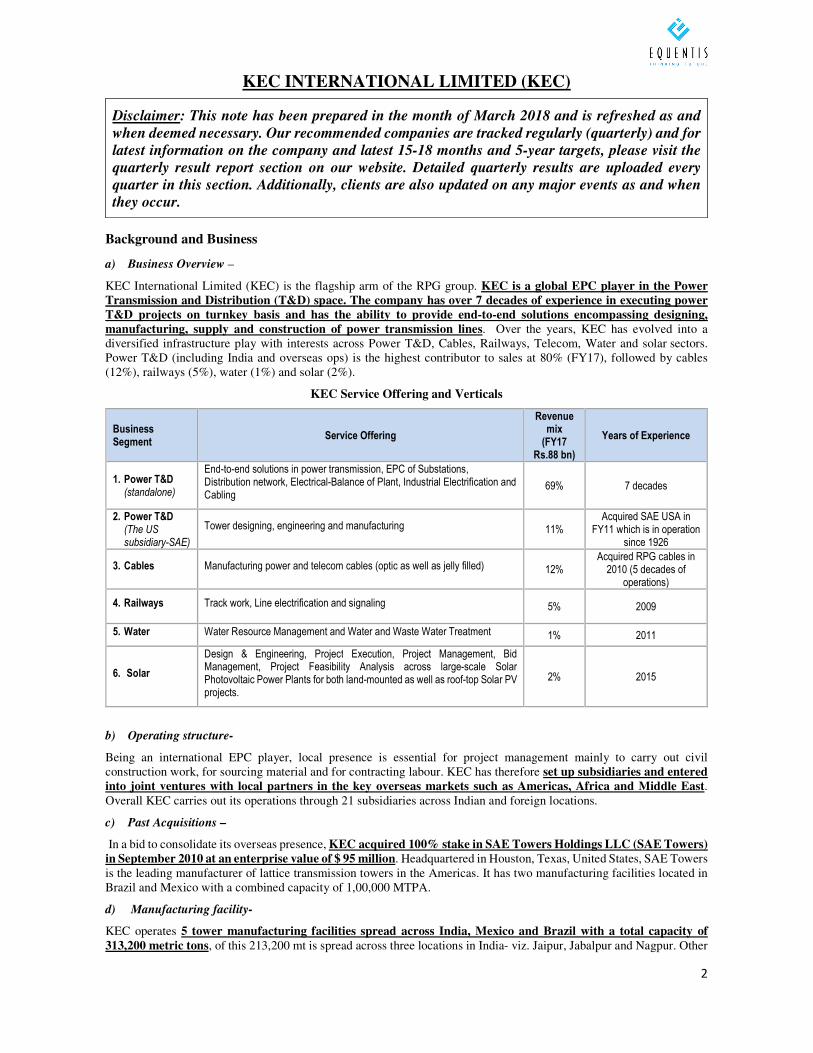
KEC International Limited (KEC) is the flagship arm of the RPG group. KEC is a global EPC player in the Power Transmission and Distribution (T&D) space. The company has over 7 decades of experience in executing power T&D projects on turnkey basis and has the ability to provide end-to-end solutions encompassing designing, manufacturing, supply and construction of power transmission lines. Over the years, KEC has evolved into a diversified infrastructure play with interests across Power T&D, Cables, Railways, Telecom, Water and solar sectors. Power T&D (including India and overseas ops) is the highest contributor to sales at 80% (FY17), followed by cables (12%), railways (5%), water (1%) and solar (2%).
KEC Service Offering and Verticals
Business Segment
Service Offering
Revenue mix
(FY17 Rs.88 bn)
Years of Experience
1. Power T&D (standalone)
End-to-end solutions in power transmission, EPC of Substations, Distribution network, Electrical-Balance of Plant, Industrial Electrification and Cabling
69% 7 decades
2. Power T&D (The US subsidiary-SAE)
Tower designing, engineering and manufacturing 11% Acquired SAE USA in
FY11 which is in operation since 1926
3. Cables Manufacturing power and telecom cables (optic as well as jelly filled) 12% Acquired RPG cables in
2010 (5 decades of operations)
4. Railways Track work, Line electrification and signaling 5% 2009
5. Water Water Resource Management and Water and Waste Water Treatment 1% 2011
6. Solar
Design & Engineering, Project Execution, Project Management, Bid Management, Project Feasibility Analysis across large-scale Solar Photovoltaic Power Plants for both land-mounted as well as roof-top Solar PV projects.
2% 2015
b) Operating structure-
Being an international EPC player, local presence is essential for project management mainly to carry out civil construction work, for sourcing material and for contracting labour. KEC has therefore set up subsidiaries and entered into joint ventures with local partners in the key overseas markets such as Americas, Africa and Middle East. Overall KEC carries out its operations through 21 subsidiaries across Indian and foreign locations.
c) Past Acquisitions –
In a bid to consolidate its overseas presence, KEC acquired 100% stake in SAE Towers Holdings LLC (SAE Towers) in September 2010 at an enterprise value of $ 95 million. Headquartered in Houston, Texas, United States, SAE Towers is the leading manufacturer of lattice transmission towers in the Americas. It has two manufacturing facilities located in Brazil and Mexico with a combined capacity of 1,00,000 MTPA.
d) Manufacturing facility-
KEC operates 5 tower manufacturing facilities spread across India, Mexico and Brazil with a total capacity of 313,200 metric tons, of this 213,200 mt is spread across three locations in India- viz. Jaipur, Jabalpur and Nagpur. Other
3
two manufacturing facilities are located overseas in Brazil (65,000 mt) and Mexico (35,000mt). It is the only company in the world to have four tower testing stations, of which three are located in India and one in Brazil. KEC also owns 3 cable manufacturing facilities set across Vadodara, Mysore and Silvassa in India, where it manufactures a range of power and telecom cables.
e) Management effectiveness –
KEC became a part of the Rama Prasad Goenka promoted RPG Group in 1982. The group has consolidated turnover of ~ Rs 200 billion and its operations span sectors like Power T&D, Tyre manufacturing, IT/software services, Life sciences/ pharma, capital goods and rubber plantation. KEC operations are headed by Mr. Vimal Kejriwal; Managing Director & CEO of the company and he brings over 32 years of experience in the engineering sector. With the support of RPG Group, KEC has established itself as a leading global T&D EPC player with operations spanning 60+ countries. The management has aggressively pursued topline growth through geographical expansion and diversification into other infra EPC sectors. Reflecting superior leadership, KEC has stayed ahead of its peers in terms of market share growth, capacity expansion and diversification outside India.
f) Promoter shareholding –
The Goenka family held 50.9% stake in the company (as on 31st December 2017), after combining the stake held by individual family members and promoter group entities. None of the promoter holding is pledged. Promoters have consistently increased their stake from 43.1% in FY12 to 50.9% currently. Total institutional holding was at 30.67% for quarter ended December 2017.
4
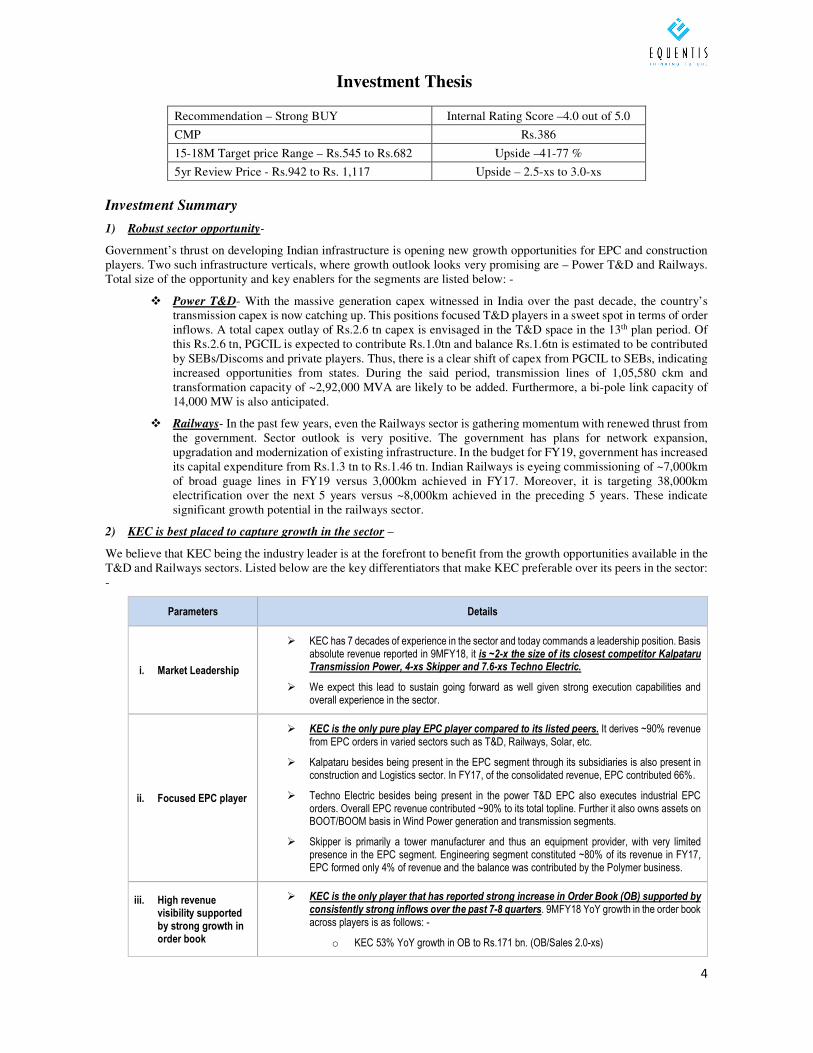
Investment Thesis
Recommendation – Strong BUY Internal Rating Score –4.0 out of 5.0
CMP Rs.386
15-18M Target price Range – Rs.545 to Rs.682 Upside –41-77 %
5yr Review Price - Rs.942 to Rs. 1,117 Upside – 2.5-xs to 3.0-xs
Investment Summary
1) Robust sector opportunity-
Government’s thrust on developing Indian infrastructure is opening new growth opportunities for EPC and construction players. Two such infrastructure verticals, where growth outlook looks very promising are – Power T&D and Railways. Total size of the opportunity and key enablers for the segments are listed below: -
� Power T&D- With the massive generation capex witnessed in India over the past decade, the country’s transmission capex is now catching up. This positions focused T&D players in a sweet spot in terms of order inflows. A total capex outlay of Rs.2.6 tn capex is envisaged in the T&D space in the 13th plan period. Of this Rs.2.6 tn, PGCIL is expected to contribute Rs.1.0tn and balance Rs.1.6tn is estimated to be contributed by SEBs/Discoms and private players. Thus, there is a clear shift of capex from PGCIL to SEBs, indicating increased opportunities from states. During the said period, transmission lines of 1,05,580 ckm and transformation capacity of ~2,92,000 MVA are likely to be added. Furthermore, a bi-pole link capacity of 14,000 MW is also anticipated.
� Railways- In the past few years, even the Railways sector is gathering momentum with renewed thrust from the government. Sector outlook is very positive. The government has plans for network expansion, upgradation and modernization of existing infrastructure. In the budget for FY19, government has increased its capital expenditure from Rs.1.3 tn to Rs.1.46 tn. Indian Railways is eyeing commissioning of ~7,000km of broad guage lines in FY19 versus 3,000km achieved in FY17. Moreover, it is targeting 38,000km electrification over the next 5 years versus ~8,000km achieved in the preceding 5 years. These indicate significant growth potential in the railways sector.
2) KEC is best placed to capture growth in the sector –
We believe that KEC being the industry leader is at the forefront to benefit from the growth opportunities available in the T&D and Railways sectors. Listed below are the key differentiators that make KEC preferable over its peers in the sector: -
Parameters Details
i. Market Leadership
� KEC has 7 decades of experience in the sector and today commands a leadership position. Basis absolute revenue reported in 9MFY18, it is ~2-x the size of its closest competitor Kalpataru Transmission Power, 4-xs Skipper and 7.6-xs Techno Electric.
� We expect this lead to sustain going forward as well given strong execution capabilities and overall experience in the sector.
ii. Focused EPC player
� KEC is the only pure play EPC player compared to its listed peers. It derives ~90% revenue from EPC orders in varied sectors such as T&D, Railways, Solar, etc.
� Kalpataru besides being present in the EPC segment through its subsidiaries is also present in construction and Logistics sector. In FY17, of the consolidated revenue, EPC contributed 66%.
� Techno Electric besides being present in the power T&D EPC also executes industrial EPC orders. Overall EPC revenue contributed ~90% to its total topline. Further it also owns assets on BOOT/BOOM basis in Wind Power generation and transmission segments.
� Skipper is primarily a tower manufacturer and thus an equipment provider, with very limited presence in the EPC segment. Engineering segment constituted ~80% of its revenue in FY17, EPC formed only 4% of revenue and the balance was contributed by the Polymer business.
iii. High revenue visibility supported by strong growth in order book
� KEC is the only player that has reported strong increase in Order Book (OB) supported by consistently strong inflows over the past 7-8 quarters. 9MFY18 YoY growth in the order book across players is as follows: -
o KEC 53% YoY growth in OB to Rs.171 bn. (OB/Sales 2.0-xs)
5
Parameters Details
o Kalpataru 27% YoY growth in OB to Rs.105bn. (OB/Sales 2.1-xs)
o Techno electric 4% growth in OB to Rs.25bn. (OB/Sales 2.1-xs)
o Skipper 25% YoY jump in engineering OB to Rs24 bn. (OB/Sales 1.3-xs)
iv. Diversified revenue and OB mix
� KEC, predominantly a power T&D EPC player, has diversified into multiple segments (e.g. solar, cables, railways and civil construction) to leverage its execution capabilities and intensify growth. EPC Order Book break up by segment and geography of peer set companies in 9MFY18 is as follows: -
o KEC - Domestic: International ~50:50; T&D and Non-T&D 80:20 with increasing bias towards growing Non-T&D segment.
o Kalpataru - Domestic: International ~50:50; T&D and Non-T&D 80:20
o Techno Electric- Domestic: International 100:0; T&D and Non-T&D 95:5
o Skipper- Domestic: International 85:15; T&D and Non-T&D - Not applicable as it is an Equipment manufacturer
v. Best-in-class Working Capital efficiency parameters
� Having tight control on working capital is a critical factor differentiating one EPC company from the other. KEC enjoys one of the best cash conversion days (measured as Creditor Days minus Debtor Days minus Inventory) amongst listed EPC players. In FY17, Techno Electric reported lowest cash conversion days at 44 days, followed by KEC at 60 days, Skipper at 90 days and Kalpataru at 121 days in FY17.
3) New growth levers available –
Over the years, KEC has been able to enhance its presence in power T&D by increasing geographical presence and scaling up new business verticals such as railways, solar and civil. This has helped it to: 1) expand market for its T&D business; and 2) develop new markets in related segments, where government spending is envisaged in the medium term. Overall, we expect KEC’s revenue to grow at a healthy pace of 14-15% CAGR over the next five years. After remaining almost flat for two consecutive years in FY16 and FY17, revenue is expected to grow at 14% YoY in FY18 and momentum is likely to pick up in the following two years at 20% and 15% YoY in FY19 and FY20, respectively. Growth in coming years would be supported by conversion of its existing order book of Rs.171 billion (9MFY18 53% YoY jump), to sales over the next 18-24 months period. We believe key growth drivers for revenue are as follows: -
� Railways a strong growth opportunity – Scaling up of its railway vertical has reaped benefits with order book contribution increasing to 21% at the end of 9MFY18 from 6% in FY16 and 12% in FY17. Consequently, contribution from this segment in overall revenue also stands increased at 7.5% in 9MFY18 compared to 2.5% in FY16 and 5.1% in FY17. Revenue from Railways is expected to grow further given the pipeline of orders in this segment.
� SEB to lead domestic T&D growth – Of the total power T&D outlay of Rs.2.6tn in the 13th plan period, SEBs are expected to contribute over 60% of the share. Thus, while PGCIL orders are expected to remain in Rs.20-25 bn p.a. range, momentum in order flows from SEBs is picking up. With SEB capex estimated to surpass PGCIL capex in coming years and given stringent pre-qualification criteria for winning large contracts in the EPC space, we expect KEC to be the key beneficiary of the emerging opportunity. As stated by the management, KEC would focus primarily on financially sound SEBs such as Tamil Nadu, Karnataka, West Bengal and Rajasthan, which have a strong pipeline of projects that are funded by multilateral agencies. Order backlog in Power T&D from states now contributes 65%, as against 20% earlier.
� Strong International T&D traction- KEC’s international order book at Rs. 65.6bn surpassed domestic orders in FY17 (Rs.60.6bn). At the end of 9MFY18, international orders contributed a healthy 47% of the total order backlog of Rs. 171bn. Strong order traction from international markets is on account of management’s stated strategy of entering newer geographies. In the past 24 months, KEC has ventured into 10 new geographies, largely in the African region, which has enhanced order inflow. We expect international markets to provide a good hedge for KEC operations going forward.
� SAE turnaround – Brazilian government has planned capex of $4bn to improve the transmission network in Brazil. KEC, through its subsidiary SAE Towers, would be one of the key beneficiaries of the upcoming capex. Besides supplying towers, SAE Towers also provides EPC work. KEC expects SAE Towers to register revenue CAGR of 15% over FY18-20, with an operating margin of ~10%.
6
4) Strong traction in order book to spur healthy growth in revenue –
KEC has strong order back log of Rs.171bn at the end of 9MFY18, a YoY growth of an impressive 53%. Order Book to Sales ratio currently stands at 2.0-xs, thus providing visibility for sales growth over the next 2 years. We expect the orders in hand to be executed over the next 12-24-month period, translating in 16-17% revenue CAGR over FY18 to FY21 compared to 2.7% CAGR seen in the past three years (FY14-17). Order inflows for 9MFY18 was up 30.9% YoY to Rs.113bn. KEC expects ordering to improve from SEBs like Karnataka, Tamil Nadu, West Bengal, Andhra Pradesh and Telangana. In the international market, KEC continues to see order and tender traction from SAARC, South East Asia and selected African regions.
5) Further expansion in margins underway-
KEC over the past five quarters has consistently improved its operating (EBDITA) margins from 8.6% reported in Q1FY17 to 10.2% in Q3FY18. This trajectory is very impressive when compared to its past performance. KEC’s operating performance had suffered greatly post FY11 as the company had to endure the double whammy of slowdown in domestic orders and global recession taking a hit on SAE operations. Further, in this period the company was investing heavily to diversify into new revenue streams of cables, waters, solar and Railway EPC. Resultantly, its margins dipped from 10-11% recorded in FY10-FY11 and lingered at sub 6-7% level for over 5 years. It is only in FY17 that operating margins started climbing back to plus 9% level to now touch 10.2% in Q3FY18. Over the past 4-5 years, KEC has sharpened focus on execution and cost reduction initiatives. The company has pruned execution delays, which has led to EBITDA margin improvement in FY17 and 9MFY18. Management has guided for a 50-bps improvement in EBDTIA margins in FY19 and is confident to hold it at plus 10% level going forward. In our forecast we have built in for the margins to move to 11% level by FY23. The factors we believe that will aid improvement in operating profitability are as follows: -
� Operating leverage to support margins- Order Book in 9MFY18, both from domestic and international geographies, has shown a strong jump. As these orders convert to sales, operating leverage would support margin expansion. Especially in the new segments such as Railways, where order book has touched the critical mass of Rs.3.6bn. We expect operating leverage benefits in new verticals to be the key contributor of profitability growth in coming years.
� Improvement in SAE operations– SAE’s profitability was impacted in FY16 on account of lower order intake in Mexico and lack of clearances in Brazil leading to higher inventories and lower production. This resulted in under absorption of fixed costs. KEC’s management has addressed this by rationalizing its cost structure and venturing into the EPC space, thereby improving profitability. After reporting sales drop of 56% to Rs. 8,274mn YoY and low single digit EBDTIA margin of 1.6% in FY16, SAE’s performance has started moving up in FY17. Subsidiary operations reported 23% YoY growth in FY17 and profitability got back on track with EBITDA margin of 10.5%. Recovery in SAE performance is marginally impacted in 9MFY18 due to long execution cycle in Brazil projects, hence its sales was flat YoY at Rs. 7,184 mn, margins came in at 7.8% compared to 9.8% in 9MFY17. However, what gives us confidence is the fact that SAE has reported a strong growth of 30% in its order book for 9MFY18 at Rs.171bn, which would be executed over the next 2 years.
� Increasing contribution from international orders with higher PBT margins- While EBITDA margins in domestic and international projects are similar, PBT margins are higher in international markets due to lower cost of debt. Also, international markets generally entail lower retention money period, enabling higher project cash flows. Hence, as contribution from international orders pick up due to KEC’s strategy to expand into newer geographies, EBDITA margins should trend up.
6) Healthy growth in profits aided by revenue growth, margin expansion and reduction in interest outgo –
Healthy growth in sales, improvement in profitability, low depreciation and interest costs as a proportion to sales should translate in PAT margins to grow from 3.6% in FY17 to 5.8% by FY23. Resultantly, we expect over 2.5-xs growth in PAT i.e. CAGR of 20% over FY18-23 to Rs 11bn. Basis our assumption of stable working capital and limited capex requirement going forward, we expect D:E to come down to sub-1.0xs level by FY19 as compared to 1.32x reported in FY17. RoCE of the company was 18.4% in FY17. Going ahead we expect the return matrices to improve aided by profitability growth and stable capital efficiency parameters. RoCE is expected to cross 24% by FY20 and hold at these levels until FY23.
7
Key assumptions for the base case forecast:
Particulars (Rs.mn) FY17 FY18E FY19E FY20E FY21E FY22E FY23E 5 yr
CAGR FY12-17
5 yr CAGR FY18-23E
Revenue 85,844 98,120 117,744 135,405 155,716 171,287 188,416 8% 14%
YoY% 0.8% 14.3% 20.0% 15.0% 15.0% 10.0% 10.0%
EBDITA 7,807 9,709 12,239 14,752 17,129 18,842 20,726 11% 16%
YoY% 20.4% 24.4% 26.1% 20.5% 16.1% 10.0% 10.0%
EBDITA Margin % 9.1% 9.9% 10.4% 10.9% 11.0% 11.0% 11.0% Avg. 7% Avg. 11%
Interest 2,433 2,510 2,745 2,844 3,047 2,945 2,753 9% 2%
% to sales 3% 3% 2% 2% 2% 2% 1%
PAT 3,048 4,369 5,917 7,373 8,663 9,749 11,012 8% 20%
YoY% 59.1% 43.3% 35.4% 24.6% 17.5% 12.5% 13.0%
PAT Margin % 3.6% 4.5% 5.0% 5.4% 5.6% 5.7% 5.8% Avg. 2% Avg. 6%
EPS- (Rs.) 11.9 17.0 23.0 28.7 33.7 37.9 42.8
Book Value (Rs.) 61.7 75.7 94.7 118.3 146.0 177.2 212.5
RATIOS FY17 FY18E FY19E FY20E FY21E FY22E FY23E 5 yr Avg FY13-17
5 yr Avg FY18-22E
Dividend payout % 16.2% 15.0% 15.0% 15.0% 15.0% 15.0% 15.0% 20% 15%
Debt/equity 1.32 1.11 0.98 0.81 0.71 0.56 0.44 1.58 0.83
Net working Capital/Sales % 21.2% 23.1% 23.1% 22.8% 22.8% 22.8% 22.8% 20% 23%
ROCE % 18.4% 21.4% 23.3% 24.5% 24.4% 24.1% 24.0% 13.7% 23.5%
ROE % 19.2% 22.4% 24.3% 24.2% 23.1% 21.4% 20.2% 11.1% 23.1%
We are positive on the growth prospects of KEC in the coming years. Our outlook on the company finds strength from its leadership position in the power T&D segment in India coupled with its strong presence in the international geographies. We believe that the company is best placed in the sector to benefit from the expected growth in order flows. Overall, we project revenue of the company to grow at a compounded rate of 14-15% to ~ Rs 200 billion by FY22. Healthy growth in sales, improvement in profitability and reduction in financing cost is likely to result in a much higher growth in net profit for the company. We project company’s PAT to grow at an impressive CAGR of ~25-27% over FY18 to FY21 and by 20% CAGR over the 5-year period of FY18 to FY23.
Revenue – Given the strong traction in order inflows specifically in the railways and international segments, we expect revenue to grow at a CAGR of 14% over FY18-23E.
EBDITA – KEC has been continuously improving margins and revenue growth is expected to further support margin expansion due to operating leverage. We expect margins to be around 11% going ahead.
Interest cost – KEC’s debt peaked out in FY16 and company has focused on reducing debt resulting in lower interest cost as a % to sales. We expect interest costs as % to sales to trend down to 2% by FY21 from 2.8% reported in FY17, before reducing further to 1.5% by FY23.
PAT – Strong revenue growth supported by operating efficiency and lower interest costs will help PAT to show a healthy growth of 20-25%.
Working capital – KEC has been managing its working capital efficiently, we expect it to remain stable going forward.
Capital structure – Management is focused towards reducing debt and we expect it to reduce to sub 1-xs from FY19 onwards.
Return matrices -We expect RoCE and RoE to improve to 24% and 20%, respectively by FY23, aided by profitability and capital efficiency improvement, compared to 18.4% and 19.2% reported in FY17.
8
Valuation and Recommendation
Increase in cash flows from operations, limited capex and rationalization of capital structure should translate in strong growth in net profit of the company. Overall, we project EPS of the Company to increase from Rs 11.9 per share in FY17, to Rs 17 in FY18 (YoY growth 43%) and further to Rs 42.8 by FY23, implying an EPS CAGR of 20.3% over FY18-23.
KEC currently trades at a PE of 24-xs on the consolidated TTM EPS of Rs 15.9. Over the next 4-5 years we expect the stock price to give 2.5-3.0-xs returns with target price ranging from Rs. 941 to Rs, 1,117. Target price range has been arrived at by valuing the FY23 EPS of Rs.42.8 at 20-25-xs PE multiple. Over the next 15 to 18 month period we expect a total upside of 41% to 77% in the stock price (Rs. 545 to Rs. 682).
Valuation reflects our confidence in the management capability in capturing high growth opportunities both in India and in the overseas market. Our outlook also finds strength from its leadership position in the power T&D segment and its superiority in managing working capital requirement as compared to its peers. We therefore believe that KEC is best placed in the sector to benefit from the expected growth in order flows.
� 15 to 18-month outlook
Particulars FY17 FY18 FY19 FY20
EPS 11.9 17.0 23.0 28.7
YoY Gr % 43% 35% 25%
Implied PE 33 23 17 13
CASE-I CASE-II
A) Multiple applied on FY20 EPS 20.00 25.00
Target price range (15-18 month) 574 717
% upside from CMP 49% 86%
CASE-I CASE-II
A) Multiple applied on Avg. FY19&FY20 EPS 20.00 25.00
Target price range (15-18 month) 517 646
% upside from CMP 34% 67%
Average A&B)
Avg. Target price range (15-18 month) 545 682
% upside from CMP 41% 77%
� Valuation -- 5-year
The table below details the sensitivity of FY23 target price to different levels of EPS estimates and PE multiples.
FY18 EPS (Rs.) EPS CaGR FY23 EPS (Rs.)
Attach PE Multiple (xs) Upside (xs)
10 15 20 25 30 35 10 15 20 25 30 35
16.99 10% 274 274 410 547 684 821 958 0.7 1.1 1.4 1.8 2.1 2.5
16.99 15% 342 342 513 684 854 1,025 1,196 0.9 1.3 1.8 2.2 2.7 3.1
16.99 20% 423 423 634 846 1,057 1,268 1,480 1.1 1.6 2.2 2.7 3.3 3.8
16.99 25% 519 519 778 1,037 1,296 1,556 1,815 1.3 2.0 2.7 3.4 4.0 4.7
16.99 30% 631 631 946 1,262 1,577 1,893 2,208 1.6 2.5 3.3 4.1 4.9 5.7
16.99 35% 762 762 1,143 1,524 1,905 2,286 2,667 2.0 3.0 3.9 4.9 5.9 6.9
Average Target price range 941 1,177
Average upside (xs) 2.4 3.0
Note – shaded cells indicate fair value of equity range
Recommendation- We are very positive on the overall growth story that is unfolding for KEC and therefore strongly
recommend buying into the stock for a medium-term upside of 41-77%. Basis the trajectory of the earnings growth over the next 5-year period ranging between 20-25% CAGR, long-term investors can invest in the stock for a potential 2.5-3.0xs returns.
9
Risks to the recommendation
� Slowdown in order flows – Entire growth in revenue hinges upon the expectation of order pick up in the domestic markets in the immediate term and sustained strength in the international markets. In case there are delays in domestic tendering process or international markets continue to languish beyond estimated time period, then our projections would face the risk of downward revision.
� Subsidiary and new vertical turn around- Our assumption on margin expansion assumes turnaround in SAE operations and improvement in the performance of new verticals and would need to be monitored closely for any deviations.
� Capital efficiency improvement– Interest outgo will increase for the company if it is unable to improve working capital efficiency as targeted or undertakes large capex over the next 2-3 years impacting the growth in PAT during the projection period
� Input cost fluctuation- KEC derives sizable revenue from international operations, which are fixed price in nature and therefore are vulnerable to adverse input cost movements. The company tries to mitigate this risk by hedging the exposure to the extent possible but there are always some uncovered positions in its order book.
10
PEER SET ANALYSIS
Equentis’ investment pecking order in the T&D EPC sector
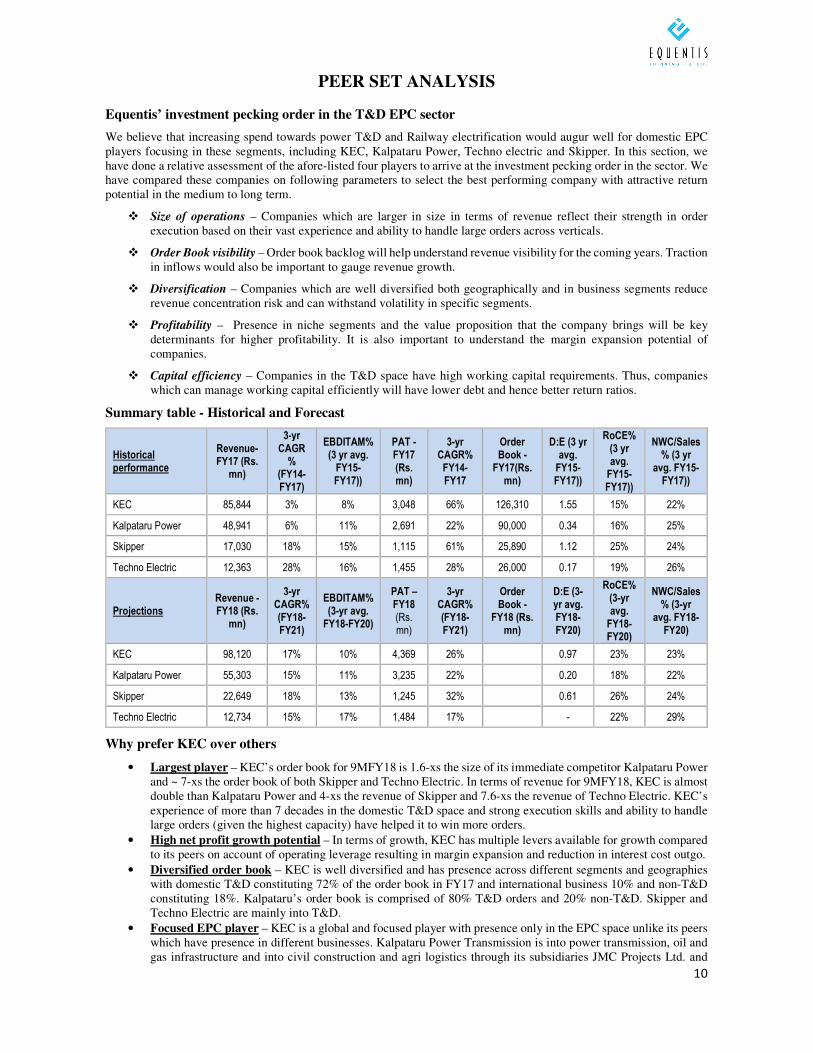
We believe that increasing spend towards power T&D and Railway electrification would augur well for domestic EPC players focusing in these segments, including KEC, Kalpataru Power, Techno electric and Skipper. In this section, we have done a relative assessment of the afore-listed four players to arrive at the investment pecking order in the sector. We have compared these companies on following parameters to select the best performing company with attractive return potential in the medium to long term.
� Size of operations – Companies which are larger in size in terms of revenue reflect their strength in order execution based on their vast experience and ability to handle large orders across verticals.
� Order Book visibility – Order book backlog will help understand revenue visibility for the coming years. Traction in inflows would also be important to gauge revenue growth.
� Diversification – Companies which are well diversified both geographically and in business segments reduce revenue concentration risk and can withstand volatility in specific segments.
� Profitability – Presence in niche segments and the value proposition that the company brings will be key determinants for higher profitability. It is also important to understand the margin expansion potential of companies.
� Capital efficiency – Companies in the T&D space have high working capital requirements. Thus, companies which can manage working capital efficiently will have lower debt and hence better return ratios.
Summary table - Historical and Forecast
Historical performance
Revenue- FY17 (Rs.
mn)
3-yr CAGR
% (FY14-FY17)
EBDITAM% (3 yr avg.
FY15-FY17))
PAT -FY17 (Rs. mn)
3-yr CAGR%
FY14-FY17
Order Book -
FY17(Rs. mn)
D:E (3 yr avg.
FY15-FY17))
RoCE% (3 yr avg.
FY15-FY17))
NWC/Sales % (3 yr
avg. FY15-FY17))
KEC 85,844 3% 8% 3,048 66% 126,310 1.55 15% 22%
Kalpataru Power 48,941 6% 11% 2,691 22% 90,000 0.34 16% 25%
Skipper 17,030 18% 15% 1,115 61% 25,890 1.12 25% 24%
Techno Electric 12,363 28% 16% 1,455 28% 26,000 0.17 19% 26%
Projections Revenue -FY18 (Rs.
mn)
3-yr CAGR% (FY18-FY21)
EBDITAM% (3-yr avg.
FY18-FY20)
PAT –FY18 (Rs. mn)
3-yr CAGR% (FY18-FY21)
Order Book -
FY18 (Rs. mn)
D:E (3-yr avg. FY18-FY20)
RoCE% (3-yr avg.
FY18-FY20)
NWC/Sales % (3-yr
avg. FY18-FY20)
KEC 98,120 17% 10% 4,369 26% 0.97 23% 23%
Kalpataru Power 55,303 15% 11% 3,235 22% 0.20 18% 22%
Skipper 22,649 18% 13% 1,245 32% 0.61 26% 24%
Techno Electric 12,734 15% 17% 1,484 17% - 22% 29%
Why prefer KEC over others
• Largest player – KEC’s order book for 9MFY18 is 1.6-xs the size of its immediate competitor Kalpataru Power and ~ 7-xs the order book of both Skipper and Techno Electric. In terms of revenue for 9MFY18, KEC is almost double than Kalpataru Power and 4-xs the revenue of Skipper and 7.6-xs the revenue of Techno Electric. KEC’s experience of more than 7 decades in the domestic T&D space and strong execution skills and ability to handle large orders (given the highest capacity) have helped it to win more orders.
• High net profit growth potential – In terms of growth, KEC has multiple levers available for growth compared to its peers on account of operating leverage resulting in margin expansion and reduction in interest cost outgo.
• Diversified order book – KEC is well diversified and has presence across different segments and geographies with domestic T&D constituting 72% of the order book in FY17 and international business 10% and non-T&D constituting 18%. Kalpataru’s order book is comprised of 80% T&D orders and 20% non-T&D. Skipper and Techno Electric are mainly into T&D.
• Focused EPC player – KEC is a global and focused player with presence only in the EPC space unlike its peers which have presence in different businesses. Kalpataru Power Transmission is into power transmission, oil and gas infrastructure and into civil construction and agri logistics through its subsidiaries JMC Projects Ltd. and
11
Shubham Logistics Ltd. Techno Electric is into Transmission & Distribution and Wind Power while Skipper is into manufacturing of towers and polymer pipes and fittings.
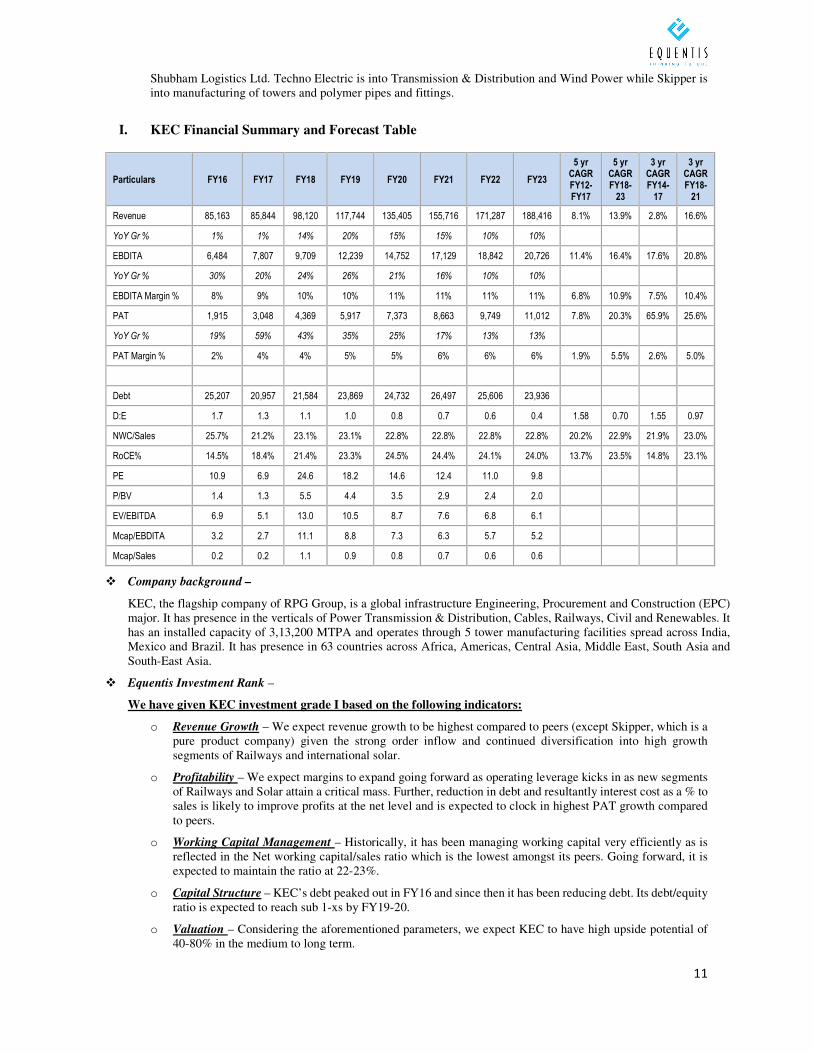
I. KEC Financial Summary and Forecast Table
Particulars FY16 FY17 FY18 FY19 FY20 FY21 FY22 FY23
5 yr CAGR FY12-FY17
5 yr CAGR FY18-
23
3 yr CAGR FY14-
17
3 yr CAGR FY18-
21
Revenue 85,163 85,844 98,120 117,744 135,405 155,716 171,287 188,416 8.1% 13.9% 2.8% 16.6%
YoY Gr % 1% 1% 14% 20% 15% 15% 10% 10%
EBDITA 6,484 7,807 9,709 12,239 14,752 17,129 18,842 20,726 11.4% 16.4% 17.6% 20.8%
YoY Gr % 30% 20% 24% 26% 21% 16% 10% 10%
EBDITA Margin % 8% 9% 10% 10% 11% 11% 11% 11% 6.8% 10.9% 7.5% 10.4%
PAT 1,915 3,048 4,369 5,917 7,373 8,663 9,749 11,012 7.8% 20.3% 65.9% 25.6%
YoY Gr % 19% 59% 43% 35% 25% 17% 13% 13%
PAT Margin % 2% 4% 4% 5% 5% 6% 6% 6% 1.9% 5.5% 2.6% 5.0%
Debt 25,207 20,957 21,584 23,869 24,732 26,497 25,606 23,936
D:E 1.7 1.3 1.1 1.0 0.8 0.7 0.6 0.4 1.58 0.70 1.55 0.97
NWC/Sales 25.7% 21.2% 23.1% 23.1% 22.8% 22.8% 22.8% 22.8% 20.2% 22.9% 21.9% 23.0%
RoCE% 14.5% 18.4% 21.4% 23.3% 24.5% 24.4% 24.1% 24.0% 13.7% 23.5% 14.8% 23.1%
PE 10.9 6.9 24.6 18.2 14.6 12.4 11.0 9.8
P/BV 1.4 1.3 5.5 4.4 3.5 2.9 2.4 2.0
EV/EBITDA 6.9 5.1 13.0 10.5 8.7 7.6 6.8 6.1
Mcap/EBDITA 3.2 2.7 11.1 8.8 7.3 6.3 5.7 5.2
Mcap/Sales 0.2 0.2 1.1 0.9 0.8 0.7 0.6 0.6
� Company background –
KEC, the flagship company of RPG Group, is a global infrastructure Engineering, Procurement and Construction (EPC) major. It has presence in the verticals of Power Transmission & Distribution, Cables, Railways, Civil and Renewables. It has an installed capacity of 3,13,200 MTPA and operates through 5 tower manufacturing facilities spread across India, Mexico and Brazil. It has presence in 63 countries across Africa, Americas, Central Asia, Middle East, South Asia and South-East Asia.
� Equentis Investment Rank –
We have given KEC investment grade I based on the following indicators:
o Revenue Growth – We expect revenue growth to be highest compared to peers (except Skipper, which is a pure product company) given the strong order inflow and continued diversification into high growth segments of Railways and international solar.
o Profitability – We expect margins to expand going forward as operating leverage kicks in as new segments of Railways and Solar attain a critical mass. Further, reduction in debt and resultantly interest cost as a % to sales is likely to improve profits at the net level and is expected to clock in highest PAT growth compared to peers.
o Working Capital Management – Historically, it has been managing working capital very efficiently as is reflected in the Net working capital/sales ratio which is the lowest amongst its peers. Going forward, it is expected to maintain the ratio at 22-23%.
o Capital Structure – KEC’s debt peaked out in FY16 and since then it has been reducing debt. Its debt/equity ratio is expected to reach sub 1-xs by FY19-20.
o Valuation – Considering the aforementioned parameters, we expect KEC to have high upside potential of 40-80% in the medium to long term.

12
II. Skipper Financial Summary and Forecast Table
Particulars FY16 FY17 FY18 FY19 FY20 FY21 FY22 FY23
5 yr CAGR FY12-FY17
5 yr CAGR FY18-
23
3 yr CAGR FY14-
17
3 yr CAGR FY18-
21
Revenue 15,062 17,030 22,649 27,179 32,615 37,507 43,134 49,604 18.1% 17.0% 17.8% 18.3%
YoY Gr% 15% 13% 33% 20% 20% 15% 15% 15%
EBDITA 2,271 2,413 2,990 3,669 4,403 5,251 6,039 6,945 27.1% 18.4% 26.9% 20.7%
YoY Gr% 1% 6% 24% 23% 20% 19% 15% 15%
EBDITA Margin % 15% 14% 13% 14% 14% 14% 14% 14% 13.6% 13.8% 15.5% 13.4%
PAT 951 1,115 1,245 1,728 2,248 2,856 3,495 4,265 62.3% 27.9% 60.6% 31.9%
YoY Gr% 7% 17% 12% 39% 30% 27% 22% 22%
PAT Margin % 6% 7% 5% 6% 7% 8% 8% 9% 4.9% 7.5% 6.6% 6.2%
Debt 4,682 4,378 4,677 4,605 4,193 3,449 2,102 270
D:E 1.2 0.9 0.8 0.6 0.4 0.3 0.1 0.0 1.47 0.30 1.12 0.61
NWC/Sales 25.2% 24.8% 23.9% 23.9% 23.9% 23.9% 23.9% 23.9% 25.7% 23.9% 23.7% 23.9%
RoCE% 23.6% 23.1% 23.8% 26.3% 28.7% 30.7% 32.2% 33.8% 20.6% 30.3% 25.2% 26.3%
PE 7.2 19.0 19.4 14.0 10.8 8.5 6.9 5.7
P/BV 3.6 4.3 4.0 3.2 2.6 2.0 1.6 1.3
EV/EBITDA 7.9 10.5 9.5 7.7 6.3 5.1 4.2 3.4
Mcap/EBDITA 6.0 8.8 8.1 6.6 5.5 4.6 4.0 3.5
Mcap/Sales 0.9 1.2 1.1 0.9 0.7 0.6 0.6 0.5
� Company background –
Skipper is an integrated Transmission Tower manufacturing company with Angle Rolling, Tower, Accessories & Fastener manufacturing and EPC line construction. It has installed capacity of 2,30,000 MTPA. The company also manufactures huge range of premium quality pipes and fittings, which are used in different areas such as Plumbing, Sewage, Agriculture and Borewell sectors.
� Equentis Investment Rank –
We have given Skipper investment grade II based on the following indicators:
o Revenue Growth – We expect revenue growth to be in the range of 15-20% given the high exposure towards PGCIL orders. However, any slow-down in order flows from PGCIL can impact revenue growth significantly.
o Profitability – Skipper has high profitability compared to peers and has maintained margins at around 14-15% as it is purely into tower manufacturing. PAT margins are expected to improve on the back of reduction in interest as free cash flows improve.
o Working Capital Management – Working capital efficiency is higher than its peers reflecting high dependence on PGCIL for orders. Working capital/sales ratio is expected to remain in the range of 23-24% going forward as well.
o Capital Structure – Historically, debt has remained at higher levels. However, as revenue growth kicks in and cash flows improve, debt is expected to come down and reach at sub 0.5-xs levels by FY20.
o Valuation – Based on the strong growth expected in revenue and better margins than industry, we expect strong upside potential of around 35-85% on SOTP basis. However, its PVC business remains a key monitorable and poses a risk, making it relatively riskier investment option compared to KEC.
13
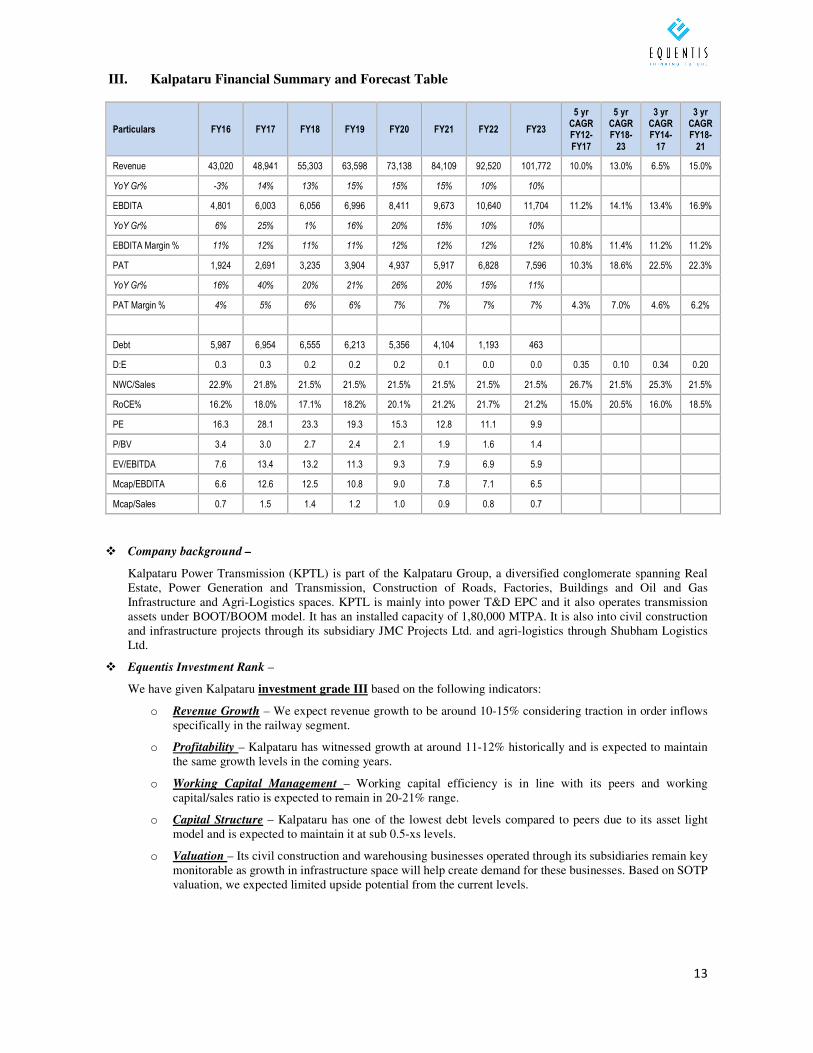
III. Kalpataru Financial Summary and Forecast Table
Particulars FY16 FY17 FY18 FY19 FY20 FY21 FY22 FY23
5 yr CAGR FY12-FY17
5 yr CAGR FY18-
23
3 yr CAGR FY14-
17
3 yr CAGR FY18-
21
Revenue 43,020 48,941 55,303 63,598 73,138 84,109 92,520 101,772 10.0% 13.0% 6.5% 15.0%
YoY Gr% -3% 14% 13% 15% 15% 15% 10% 10%
EBDITA 4,801 6,003 6,056 6,996 8,411 9,673 10,640 11,704 11.2% 14.1% 13.4% 16.9%
YoY Gr% 6% 25% 1% 16% 20% 15% 10% 10%
EBDITA Margin % 11% 12% 11% 11% 12% 12% 12% 12% 10.8% 11.4% 11.2% 11.2%
PAT 1,924 2,691 3,235 3,904 4,937 5,917 6,828 7,596 10.3% 18.6% 22.5% 22.3%
YoY Gr% 16% 40% 20% 21% 26% 20% 15% 11%
PAT Margin % 4% 5% 6% 6% 7% 7% 7% 7% 4.3% 7.0% 4.6% 6.2%
Debt 5,987 6,954 6,555 6,213 5,356 4,104 1,193 463
D:E 0.3 0.3 0.2 0.2 0.2 0.1 0.0 0.0 0.35 0.10 0.34 0.20
NWC/Sales 22.9% 21.8% 21.5% 21.5% 21.5% 21.5% 21.5% 21.5% 26.7% 21.5% 25.3% 21.5%
RoCE% 16.2% 18.0% 17.1% 18.2% 20.1% 21.2% 21.7% 21.2% 15.0% 20.5% 16.0% 18.5%
PE 16.3 28.1 23.3 19.3 15.3 12.8 11.1 9.9
P/BV 3.4 3.0 2.7 2.4 2.1 1.9 1.6 1.4
EV/EBITDA 7.6 13.4 13.2 11.3 9.3 7.9 6.9 5.9
Mcap/EBDITA 6.6 12.6 12.5 10.8 9.0 7.8 7.1 6.5
Mcap/Sales 0.7 1.5 1.4 1.2 1.0 0.9 0.8 0.7
� Company background –
Kalpataru Power Transmission (KPTL) is part of the Kalpataru Group, a diversified conglomerate spanning Real Estate, Power Generation and Transmission, Construction of Roads, Factories, Buildings and Oil and Gas Infrastructure and Agri-Logistics spaces. KPTL is mainly into power T&D EPC and it also operates transmission assets under BOOT/BOOM model. It has an installed capacity of 1,80,000 MTPA. It is also into civil construction and infrastructure projects through its subsidiary JMC Projects Ltd. and agri-logistics through Shubham Logistics Ltd.
� Equentis Investment Rank –
We have given Kalpataru investment grade III based on the following indicators:
o Revenue Growth – We expect revenue growth to be around 10-15% considering traction in order inflows specifically in the railway segment.
o Profitability – Kalpataru has witnessed growth at around 11-12% historically and is expected to maintain the same growth levels in the coming years.
o Working Capital Management – Working capital efficiency is in line with its peers and working capital/sales ratio is expected to remain in 20-21% range.
o Capital Structure – Kalpataru has one of the lowest debt levels compared to peers due to its asset light model and is expected to maintain it at sub 0.5-xs levels.
o Valuation – Its civil construction and warehousing businesses operated through its subsidiaries remain key monitorable as growth in infrastructure space will help create demand for these businesses. Based on SOTP valuation, we expected limited upside potential from the current levels.
14
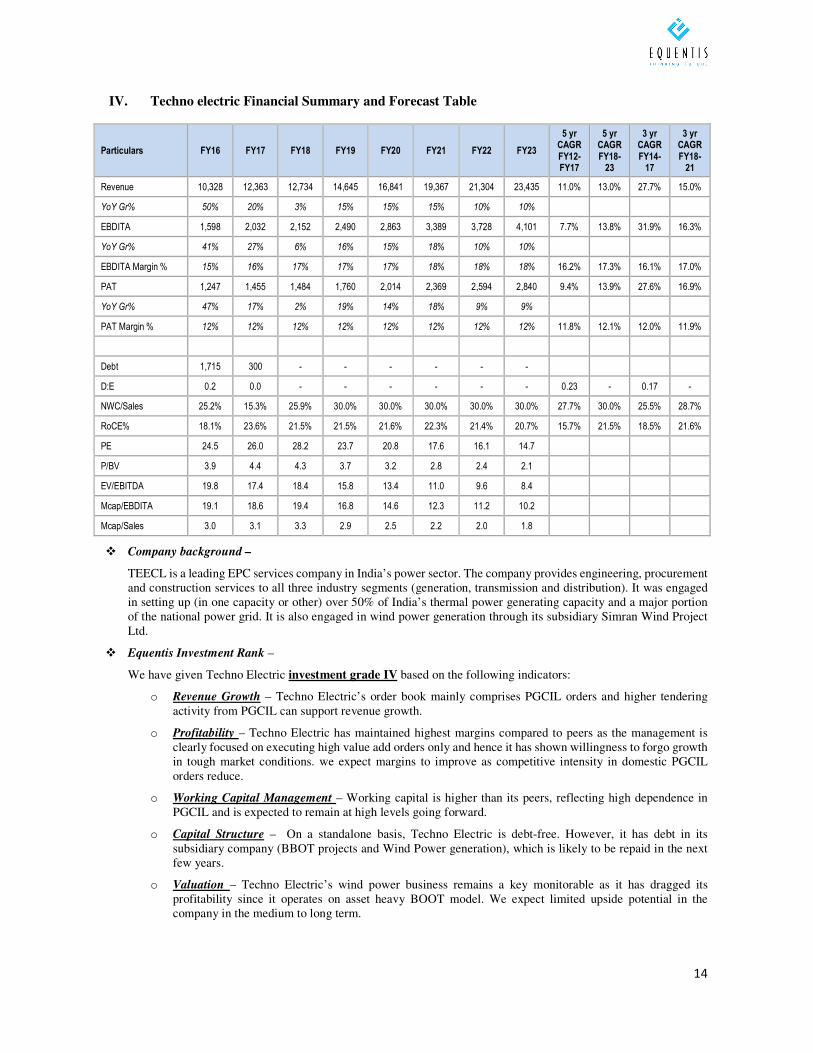
IV. Techno electric Financial Summary and Forecast Table
Particulars FY16 FY17 FY18 FY19 FY20 FY21 FY22 FY23
5 yr CAGR FY12-FY17
5 yr CAGR FY18-
23
3 yr CAGR FY14-
17
3 yr CAGR FY18-
21
Revenue 10,328 12,363 12,734 14,645 16,841 19,367 21,304 23,435 11.0% 13.0% 27.7% 15.0%
YoY Gr% 50% 20% 3% 15% 15% 15% 10% 10%
EBDITA 1,598 2,032 2,152 2,490 2,863 3,389 3,728 4,101 7.7% 13.8% 31.9% 16.3%
YoY Gr% 41% 27% 6% 16% 15% 18% 10% 10%
EBDITA Margin % 15% 16% 17% 17% 17% 18% 18% 18% 16.2% 17.3% 16.1% 17.0%
PAT 1,247 1,455 1,484 1,760 2,014 2,369 2,594 2,840 9.4% 13.9% 27.6% 16.9%
YoY Gr% 47% 17% 2% 19% 14% 18% 9% 9%
PAT Margin % 12% 12% 12% 12% 12% 12% 12% 12% 11.8% 12.1% 12.0% 11.9%
Debt 1,715 300 - - - - - -
D:E 0.2 0.0 - - - - - - 0.23 - 0.17 -
NWC/Sales 25.2% 15.3% 25.9% 30.0% 30.0% 30.0% 30.0% 30.0% 27.7% 30.0% 25.5% 28.7%
RoCE% 18.1% 23.6% 21.5% 21.5% 21.6% 22.3% 21.4% 20.7% 15.7% 21.5% 18.5% 21.6%
PE 24.5 26.0 28.2 23.7 20.8 17.6 16.1 14.7
P/BV 3.9 4.4 4.3 3.7 3.2 2.8 2.4 2.1
EV/EBITDA 19.8 17.4 18.4 15.8 13.4 11.0 9.6 8.4
Mcap/EBDITA 19.1 18.6 19.4 16.8 14.6 12.3 11.2 10.2
Mcap/Sales 3.0 3.1 3.3 2.9 2.5 2.2 2.0 1.8
� Company background –
TEECL is a leading EPC services company in India’s power sector. The company provides engineering, procurement and construction services to all three industry segments (generation, transmission and distribution). It was engaged in setting up (in one capacity or other) over 50% of India’s thermal power generating capacity and a major portion of the national power grid. It is also engaged in wind power generation through its subsidiary Simran Wind Project Ltd.
� Equentis Investment Rank –
We have given Techno Electric investment grade IV based on the following indicators:
o Revenue Growth – Techno Electric’s order book mainly comprises PGCIL orders and higher tendering activity from PGCIL can support revenue growth.
o Profitability – Techno Electric has maintained highest margins compared to peers as the management is clearly focused on executing high value add orders only and hence it has shown willingness to forgo growth in tough market conditions. we expect margins to improve as competitive intensity in domestic PGCIL orders reduce.
o Working Capital Management – Working capital is higher than its peers, reflecting high dependence in PGCIL and is expected to remain at high levels going forward.
o Capital Structure – On a standalone basis, Techno Electric is debt-free. However, it has debt in its subsidiary company (BBOT projects and Wind Power generation), which is likely to be repaid in the next few years.
o Valuation – Techno Electric’s wind power business remains a key monitorable as it has dragged its profitability since it operates on asset heavy BOOT model. We expect limited upside potential in the company in the medium to long term.
15
ANNEXURE - I
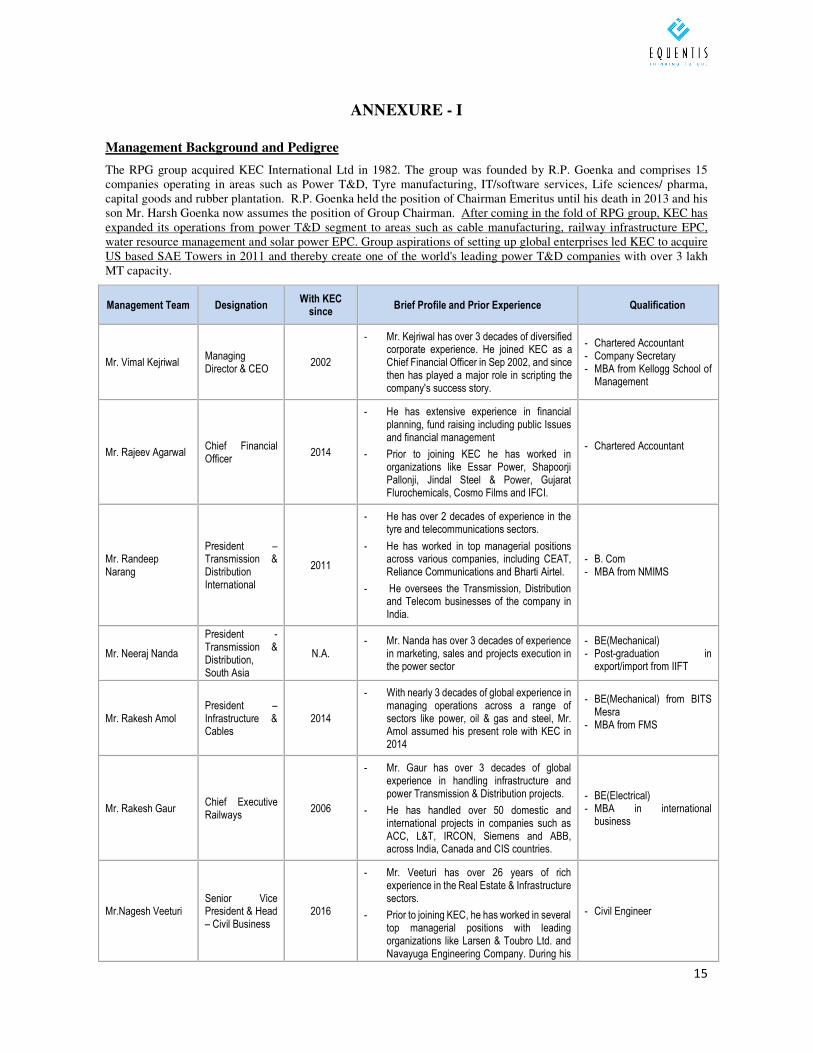
Management Background and Pedigree
The RPG group acquired KEC International Ltd in 1982. The group was founded by R.P. Goenka and comprises 15 companies operating in areas such as Power T&D, Tyre manufacturing, IT/software services, Life sciences/ pharma, capital goods and rubber plantation. R.P. Goenka held the position of Chairman Emeritus until his death in 2013 and his son Mr. Harsh Goenka now assumes the position of Group Chairman. After coming in the fold of RPG group, KEC has expanded its operations from power T&D segment to areas such as cable manufacturing, railway infrastructure EPC, water resource management and solar power EPC. Group aspirations of setting up global enterprises led KEC to acquire US based SAE Towers in 2011 and thereby create one of the world's leading power T&D companies with over 3 lakh MT capacity.
Management Team Designation With KEC
since Brief Profile and Prior Experience Qualification
Mr. Vimal Kejriwal Managing Director & CEO
2002
- Mr. Kejriwal has over 3 decades of diversified corporate experience. He joined KEC as a Chief Financial Officer in Sep 2002, and since then has played a major role in scripting the company's success story.
- Chartered Accountant - Company Secretary - MBA from Kellogg School of
Management
Mr. Rajeev Agarwal Chief Financial Officer
2014
- He has extensive experience in financial planning, fund raising including public Issues and financial management
- Prior to joining KEC he has worked in organizations like Essar Power, Shapoorji Pallonji, Jindal Steel & Power, Gujarat Flurochemicals, Cosmo Films and IFCI.
- Chartered Accountant
Mr. Randeep Narang
President –Transmission & Distribution International
2011
- He has over 2 decades of experience in the tyre and telecommunications sectors.
- He has worked in top managerial positions across various companies, including CEAT, Reliance Communications and Bharti Airtel.
- He oversees the Transmission, Distribution and Telecom businesses of the company in India.
- B. Com - MBA from NMIMS
Mr. Neeraj Nanda
President - Transmission & Distribution, South Asia
N.A. - Mr. Nanda has over 3 decades of experience
in marketing, sales and projects execution in the power sector
- BE(Mechanical) - Post-graduation in
export/import from IIFT
Mr. Rakesh Amol President –Infrastructure & Cables
2014
- With nearly 3 decades of global experience in managing operations across a range of sectors like power, oil & gas and steel, Mr. Amol assumed his present role with KEC in 2014
- BE(Mechanical) from BITS Mesra
- MBA from FMS
Mr. Rakesh Gaur Chief Executive Railways
2006
- Mr. Gaur has over 3 decades of global experience in handling infrastructure and power Transmission & Distribution projects.
- He has handled over 50 domestic and international projects in companies such as ACC, L&T, IRCON, Siemens and ABB, across India, Canada and CIS countries.
- BE(Electrical) - MBA in international
business
Mr.Nagesh Veeturi Senior Vice President & Head – Civil Business
2016
- Mr. Veeturi has over 26 years of rich experience in the Real Estate & Infrastructure sectors.
- Prior to joining KEC, he has worked in several top managerial positions with leading organizations like Larsen & Toubro Ltd. and Navayuga Engineering Company. During his
- Civil Engineer
16
Management Team Designation With KEC
since Brief Profile and Prior Experience Qualification
long association with L&T, he managed significant large value and Prestigious Projects.
Mr. Gustavo Cedeno Executive Officer-SAE Towers
2015
- Mr. Cedeno has spent his career in various leadership positions within the Energy, Power Generation and Oil & Gas industries.
- He has also published several papers for the power industry on the topics of Industrial automation and Turbomachinery controls.
- BE (Electrical Engineering) - Executive MBA in
International Business from the University of Houston
Shareholding Pattern
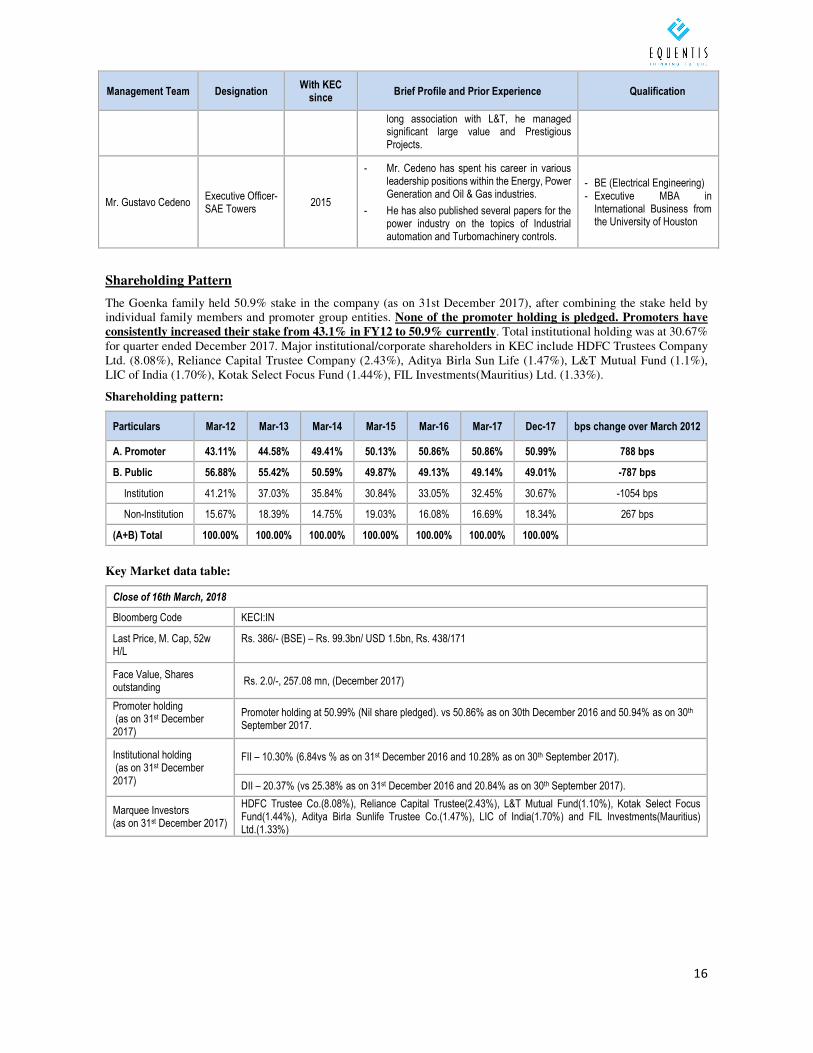
The Goenka family held 50.9% stake in the company (as on 31st December 2017), after combining the stake held by individual family members and promoter group entities. None of the promoter holding is pledged. Promoters have consistently increased their stake from 43.1% in FY12 to 50.9% currently. Total institutional holding was at 30.67% for quarter ended December 2017. Major institutional/corporate shareholders in KEC include HDFC Trustees Company Ltd. (8.08%), Reliance Capital Trustee Company (2.43%), Aditya Birla Sun Life (1.47%), L&T Mutual Fund (1.1%), LIC of India (1.70%), Kotak Select Focus Fund (1.44%), FIL Investments(Mauritius) Ltd. (1.33%).
Shareholding pattern:
Particulars Mar-12 Mar-13 Mar-14 Mar-15 Mar-16 Mar-17 Dec-17 bps change over March 2012
A. Promoter 43.11% 44.58% 49.41% 50.13% 50.86% 50.86% 50.99% 788 bps
B. Public 56.88% 55.42% 50.59% 49.87% 49.13% 49.14% 49.01% -787 bps
Institution 41.21% 37.03% 35.84% 30.84% 33.05% 32.45% 30.67% -1054 bps
Non-Institution 15.67% 18.39% 14.75% 19.03% 16.08% 16.69% 18.34% 267 bps
(A+B) Total 100.00% 100.00% 100.00% 100.00% 100.00% 100.00% 100.00%
Key Market data table:
Close of 16th March, 2018
Bloomberg Code KECI:IN
Last Price, M. Cap, 52w H/L
Rs. 386/- (BSE) – Rs. 99.3bn/ USD 1.5bn, Rs. 438/171
Face Value, Shares outstanding
Rs. 2.0/-, 257.08 mn, (December 2017)
Promoter holding (as on 31st December 2017)
Promoter holding at 50.99% (Nil share pledged). vs 50.86% as on 30th December 2016 and 50.94% as on 30th September 2017.
Institutional holding (as on 31st December 2017)
FII – 10.30% (6.84vs % as on 31st December 2016 and 10.28% as on 30th September 2017).
DII – 20.37% (vs 25.38% as on 31st December 2016 and 20.84% as on 30th September 2017).
Marquee Investors (as on 31st December 2017)
HDFC Trustee Co.(8.08%), Reliance Capital Trustee(2.43%), L&T Mutual Fund(1.10%), Kotak Select Focus Fund(1.44%), Aditya Birla Sunlife Trustee Co.(1.47%), LIC of India(1.70%) and FIL Investments(Mauritius) Ltd.(1.33%)
17
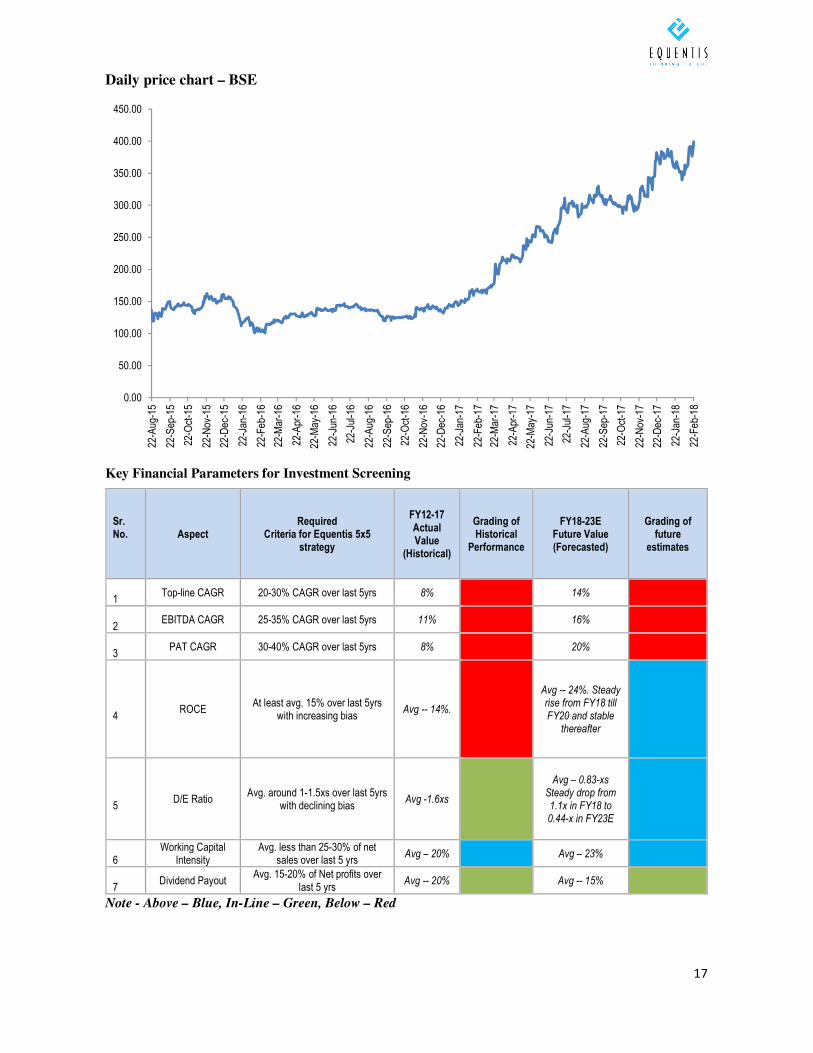
Daily price chart – BSE
Key Financial Parameters for Investment Screening
Sr. No.
Aspect Required
Criteria for Equentis 5x5 strategy
FY12-17 Actual Value
(Historical)
Grading of Historical
Performance
FY18-23E Future Value (Forecasted)
Grading of future
estimates
1
Top-line CAGR 20-30% CAGR over last 5yrs 8% 14%
2
EBITDA CAGR 25-35% CAGR over last 5yrs 11% 16%
3
PAT CAGR 30-40% CAGR over last 5yrs 8% 20%
4
ROCE At least avg. 15% over last 5yrs
with increasing bias Avg -- 14%.
Avg -- 24%. Steady rise from FY18 till FY20 and stable
thereafter
5
D/E Ratio Avg. around 1-1.5xs over last 5yrs
with declining bias Avg -1.6xs
Avg – 0.83-xs Steady drop from 1.1x in FY18 to 0.44-x in FY23E
6
Working Capital Intensity
Avg. less than 25-30% of net sales over last 5 yrs
Avg – 20% Avg – 23%
7
Dividend Payout Avg. 15-20% of Net profits over
last 5 yrs Avg -- 20% Avg -- 15%
Note - Above – Blue, In-Line – Green, Below – Red
0.00
50.00
100.00
150.00
200.00
250.00
300.00
350.00
400.00
450.00
22-A
ug-1
5
22-S
ep-1
5
22-O
ct-1
5
22-N
ov-1
5
22-D
ec-1
5
22-J
an-1
6
22-F
eb-1
6
22-M
ar-1
6
22-A
pr-1
6
22-M
ay-1
6
22-J
un-1
6
22-J
ul-1
6
22-A
ug-1
6
22-S
ep-1
6
22-O
ct-1
6
22-N
ov-1
6
22-D
ec-1
6
22-J
an-1
7
22-F
eb-1
7
22-M
ar-1
7
22-A
pr-1
7
22-M
ay-1
7
22-J
un-1
7
22-J
ul-1
7
22-A
ug-1
7
22-S
ep-1
7
22-O
ct-1
7
22-N
ov-1
7
22-D
ec-1
7
22-J
an-1
8
22-F
eb-1
8
18
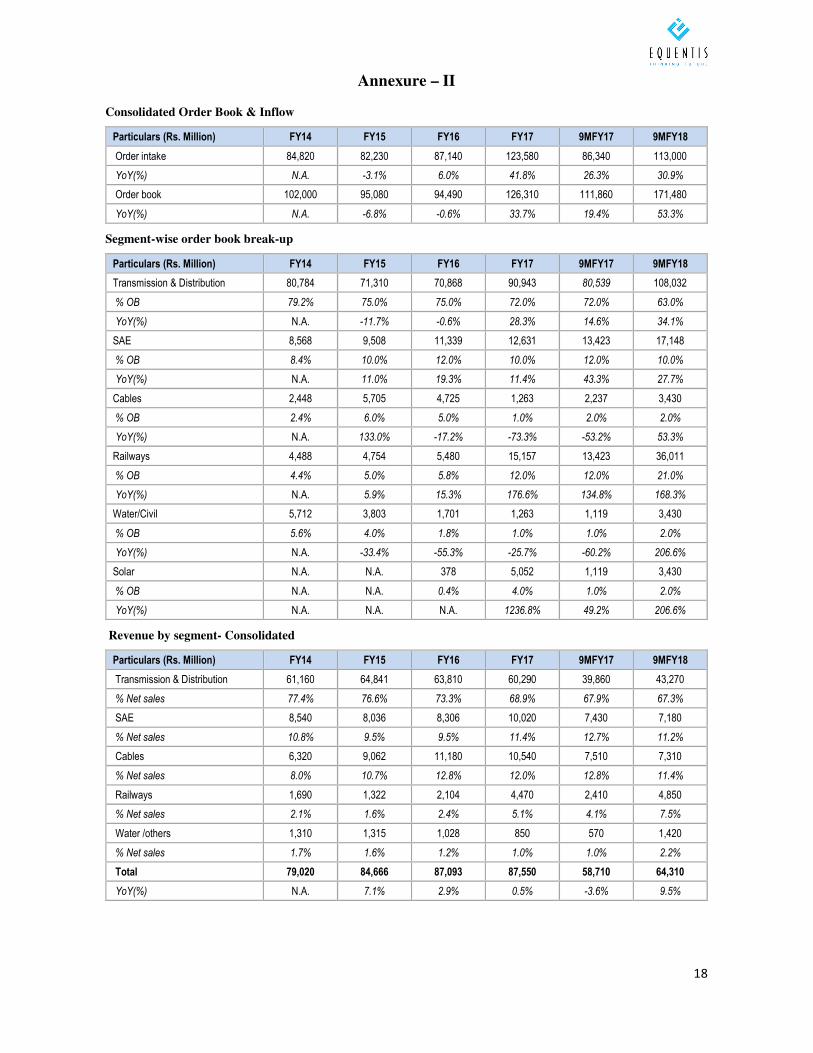
Annexure – II
Consolidated Order Book & Inflow
Particulars (Rs. Million) FY14 FY15 FY16 FY17 9MFY17 9MFY18
Order intake 84,820 82,230 87,140 123,580 86,340 113,000
YoY(%) N.A. -3.1% 6.0% 41.8% 26.3% 30.9%
Order book 102,000 95,080 94,490 126,310 111,860 171,480
YoY(%) N.A. -6.8% -0.6% 33.7% 19.4% 53.3%
Segment-wise order book break-up
Particulars (Rs. Million) FY14 FY15 FY16 FY17 9MFY17 9MFY18
Transmission & Distribution 80,784 71,310 70,868 90,943 80,539 108,032
% OB 79.2% 75.0% 75.0% 72.0% 72.0% 63.0%
YoY(%) N.A. -11.7% -0.6% 28.3% 14.6% 34.1%
SAE 8,568 9,508 11,339 12,631 13,423 17,148
% OB 8.4% 10.0% 12.0% 10.0% 12.0% 10.0%
YoY(%) N.A. 11.0% 19.3% 11.4% 43.3% 27.7%
Cables 2,448 5,705 4,725 1,263 2,237 3,430
% OB 2.4% 6.0% 5.0% 1.0% 2.0% 2.0%
YoY(%) N.A. 133.0% -17.2% -73.3% -53.2% 53.3%
Railways 4,488 4,754 5,480 15,157 13,423 36,011
% OB 4.4% 5.0% 5.8% 12.0% 12.0% 21.0%
YoY(%) N.A. 5.9% 15.3% 176.6% 134.8% 168.3%
Water/Civil 5,712 3,803 1,701 1,263 1,119 3,430
% OB 5.6% 4.0% 1.8% 1.0% 1.0% 2.0%
YoY(%) N.A. -33.4% -55.3% -25.7% -60.2% 206.6%
Solar N.A. N.A. 378 5,052 1,119 3,430
% OB N.A. N.A. 0.4% 4.0% 1.0% 2.0%
YoY(%) N.A. N.A. N.A. 1236.8% 49.2% 206.6%
Revenue by segment- Consolidated
Particulars (Rs. Million) FY14 FY15 FY16 FY17 9MFY17 9MFY18
Transmission & Distribution 61,160 64,841 63,810 60,290 39,860 43,270
% Net sales 77.4% 76.6% 73.3% 68.9% 67.9% 67.3%
SAE 8,540 8,036 8,306 10,020 7,430 7,180
% Net sales 10.8% 9.5% 9.5% 11.4% 12.7% 11.2%
Cables 6,320 9,062 11,180 10,540 7,510 7,310
% Net sales 8.0% 10.7% 12.8% 12.0% 12.8% 11.4%
Railways 1,690 1,322 2,104 4,470 2,410 4,850
% Net sales 2.1% 1.6% 2.4% 5.1% 4.1% 7.5%
Water /others 1,310 1,315 1,028 850 570 1,420
% Net sales 1.7% 1.6% 1.2% 1.0% 1.0% 2.2%
Total 79,020 84,666 87,093 87,550 58,710 64,310
YoY(%) N.A. 7.1% 2.9% 0.5% -3.6% 9.5%
19
Annexure – III
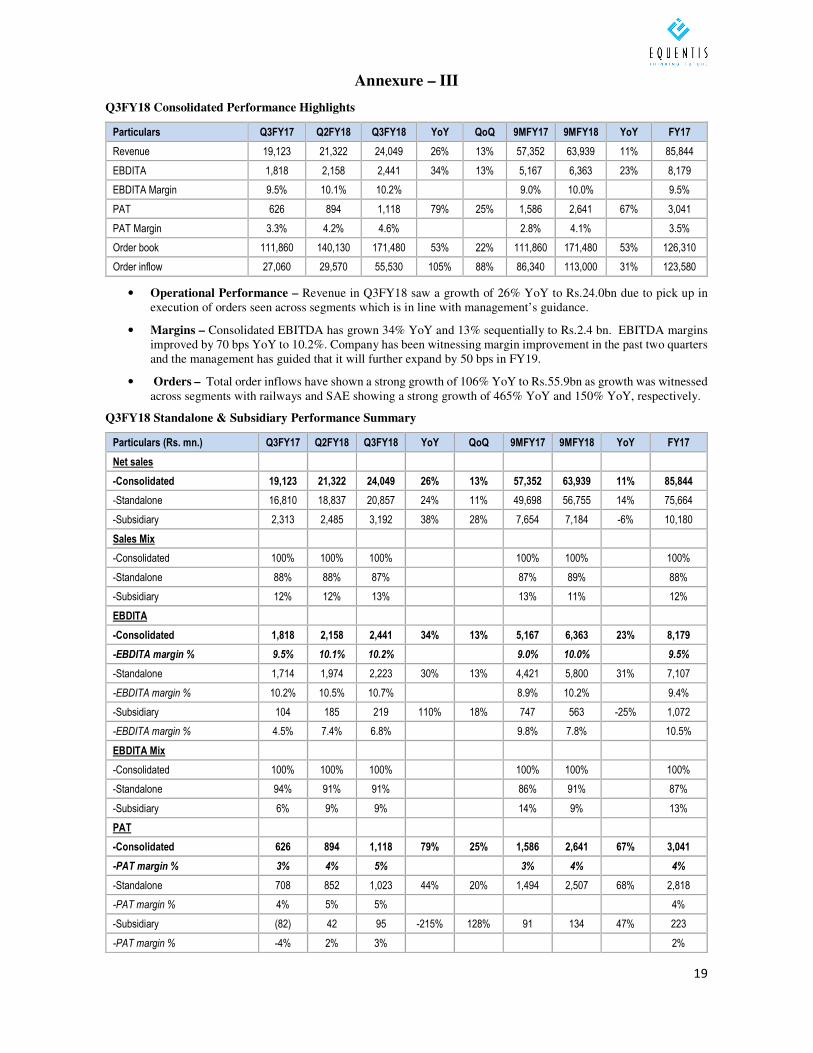
Q3FY18 Consolidated Performance Highlights
Particulars Q3FY17 Q2FY18 Q3FY18 YoY QoQ 9MFY17 9MFY18 YoY FY17
Revenue 19,123 21,322 24,049 26% 13% 57,352 63,939 11% 85,844
EBDITA 1,818 2,158 2,441 34% 13% 5,167 6,363 23% 8,179
EBDITA Margin 9.5% 10.1% 10.2% 9.0% 10.0% 9.5%
PAT 626 894 1,118 79% 25% 1,586 2,641 67% 3,041
PAT Margin 3.3% 4.2% 4.6% 2.8% 4.1% 3.5%
Order book 111,860 140,130 171,480 53% 22% 111,860 171,480 53% 126,310
Order inflow 27,060 29,570 55,530 105% 88% 86,340 113,000 31% 123,580
• Operational Performance – Revenue in Q3FY18 saw a growth of 26% YoY to Rs.24.0bn due to pick up in execution of orders seen across segments which is in line with management’s guidance.
• Margins – Consolidated EBITDA has grown 34% YoY and 13% sequentially to Rs.2.4 bn. EBITDA margins improved by 70 bps YoY to 10.2%. Company has been witnessing margin improvement in the past two quarters and the management has guided that it will further expand by 50 bps in FY19.
• Orders – Total order inflows have shown a strong growth of 106% YoY to Rs.55.9bn as growth was witnessed across segments with railways and SAE showing a strong growth of 465% YoY and 150% YoY, respectively.
Q3FY18 Standalone & Subsidiary Performance Summary
Particulars (Rs. mn.) Q3FY17 Q2FY18 Q3FY18 YoY QoQ 9MFY17 9MFY18 YoY FY17
Net sales
-Consolidated 19,123 21,322 24,049 26% 13% 57,352 63,939 11% 85,844
-Standalone 16,810 18,837 20,857 24% 11% 49,698 56,755 14% 75,664
-Subsidiary 2,313 2,485 3,192 38% 28% 7,654 7,184 -6% 10,180
Sales Mix
-Consolidated 100% 100% 100% 100% 100% 100%
-Standalone 88% 88% 87% 87% 89% 88%
-Subsidiary 12% 12% 13% 13% 11% 12%
EBDITA
-Consolidated 1,818 2,158 2,441 34% 13% 5,167 6,363 23% 8,179
-EBDITA margin % 9.5% 10.1% 10.2% 9.0% 10.0% 9.5%
-Standalone 1,714 1,974 2,223 30% 13% 4,421 5,800 31% 7,107
-EBDITA margin % 10.2% 10.5% 10.7% 8.9% 10.2% 9.4%
-Subsidiary 104 185 219 110% 18% 747 563 -25% 1,072
-EBDITA margin % 4.5% 7.4% 6.8% 9.8% 7.8% 10.5%
EBDITA Mix
-Consolidated 100% 100% 100% 100% 100% 100%
-Standalone 94% 91% 91% 86% 91% 87%
-Subsidiary 6% 9% 9% 14% 9% 13%
PAT
-Consolidated 626 894 1,118 79% 25% 1,586 2,641 67% 3,041
-PAT margin % 3% 4% 5% 3% 4% 4%
-Standalone 708 852 1,023 44% 20% 1,494 2,507 68% 2,818
-PAT margin % 4% 5% 5% 4%
-Subsidiary (82) 42 95 -215% 128% 91 134 47% 223
-PAT margin % -4% 2% 3% 2%
20
Annexure - IV
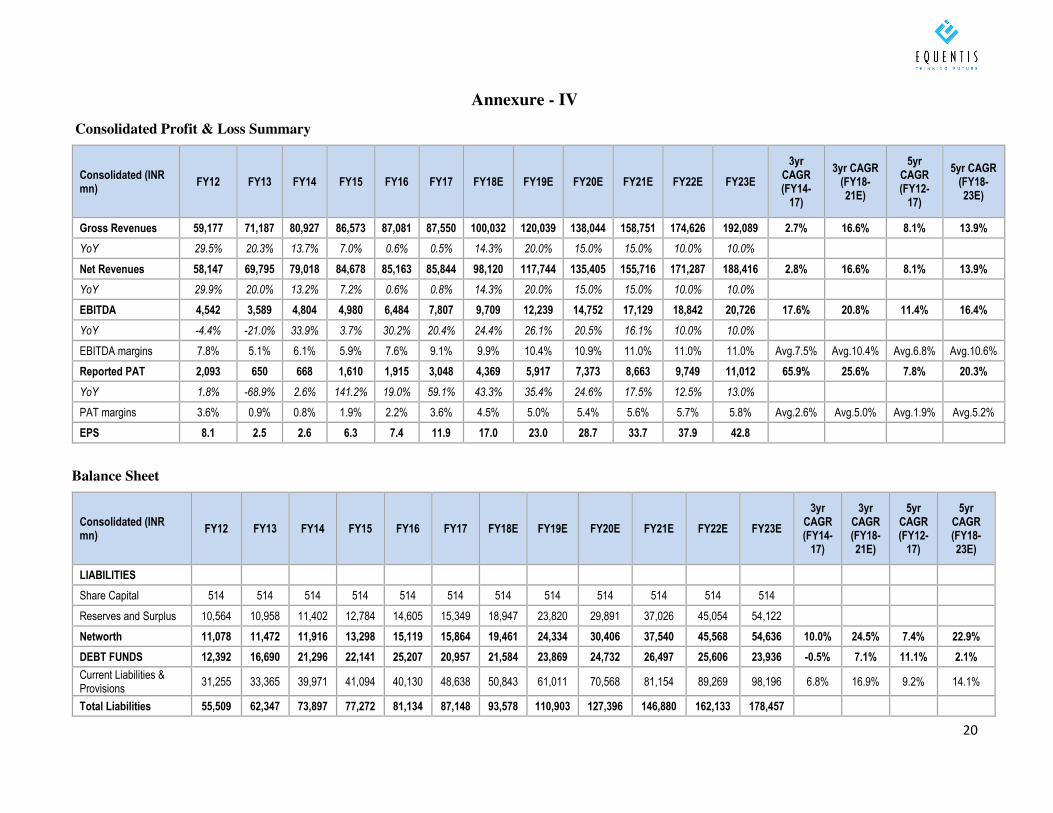
Consolidated Profit & Loss Summary
Consolidated (INR mn)
FY12 FY13 FY14 FY15 FY16 FY17 FY18E FY19E FY20E FY21E FY22E FY23E
3yr CAGR (FY14-
17)
3yr CAGR (FY18-21E)
5yr CAGR (FY12-
17)
5yr CAGR (FY18-23E)
Gross Revenues 59,177 71,187 80,927 86,573 87,081 87,550 100,032 120,039 138,044 158,751 174,626 192,089 2.7% 16.6% 8.1% 13.9%
YoY 29.5% 20.3% 13.7% 7.0% 0.6% 0.5% 14.3% 20.0% 15.0% 15.0% 10.0% 10.0%
Net Revenues 58,147 69,795 79,018 84,678 85,163 85,844 98,120 117,744 135,405 155,716 171,287 188,416 2.8% 16.6% 8.1% 13.9%
YoY 29.9% 20.0% 13.2% 7.2% 0.6% 0.8% 14.3% 20.0% 15.0% 15.0% 10.0% 10.0%
EBITDA 4,542 3,589 4,804 4,980 6,484 7,807 9,709 12,239 14,752 17,129 18,842 20,726 17.6% 20.8% 11.4% 16.4%
YoY -4.4% -21.0% 33.9% 3.7% 30.2% 20.4% 24.4% 26.1% 20.5% 16.1% 10.0% 10.0%
EBITDA margins 7.8% 5.1% 6.1% 5.9% 7.6% 9.1% 9.9% 10.4% 10.9% 11.0% 11.0% 11.0% Avg.7.5% Avg.10.4% Avg.6.8% Avg.10.6%
Reported PAT 2,093 650 668 1,610 1,915 3,048 4,369 5,917 7,373 8,663 9,749 11,012 65.9% 25.6% 7.8% 20.3%
YoY 1.8% -68.9% 2.6% 141.2% 19.0% 59.1% 43.3% 35.4% 24.6% 17.5% 12.5% 13.0%
PAT margins 3.6% 0.9% 0.8% 1.9% 2.2% 3.6% 4.5% 5.0% 5.4% 5.6% 5.7% 5.8% Avg.2.6% Avg.5.0% Avg.1.9% Avg.5.2%
EPS 8.1 2.5 2.6 6.3 7.4 11.9 17.0 23.0 28.7 33.7 37.9 42.8
Balance Sheet
Consolidated (INR mn)
FY12 FY13 FY14 FY15 FY16 FY17 FY18E FY19E FY20E FY21E FY22E FY23E
3yr CAGR (FY14-
17)
3yr CAGR (FY18-21E)
5yr CAGR (FY12-
17)
5yr CAGR (FY18-23E)
LIABILITIES
Share Capital 514 514 514 514 514 514 514 514 514 514 514 514
Reserves and Surplus 10,564 10,958 11,402 12,784 14,605 15,349 18,947 23,820 29,891 37,026 45,054 54,122
Networth 11,078 11,472 11,916 13,298 15,119 15,864 19,461 24,334 30,406 37,540 45,568 54,636 10.0% 24.5% 7.4% 22.9%
DEBT FUNDS 12,392 16,690 21,296 22,141 25,207 20,957 21,584 23,869 24,732 26,497 25,606 23,936 -0.5% 7.1% 11.1% 2.1%
Current Liabilities & Provisions
31,255 33,365 39,971 41,094 40,130 48,638 50,843 61,011 70,568 81,154 89,269 98,196 6.8% 16.9% 9.2% 14.1%
Total Liabilities 55,509 62,347 73,897 77,272 81,134 87,148 93,578 110,903 127,396 146,880 162,133 178,457
21
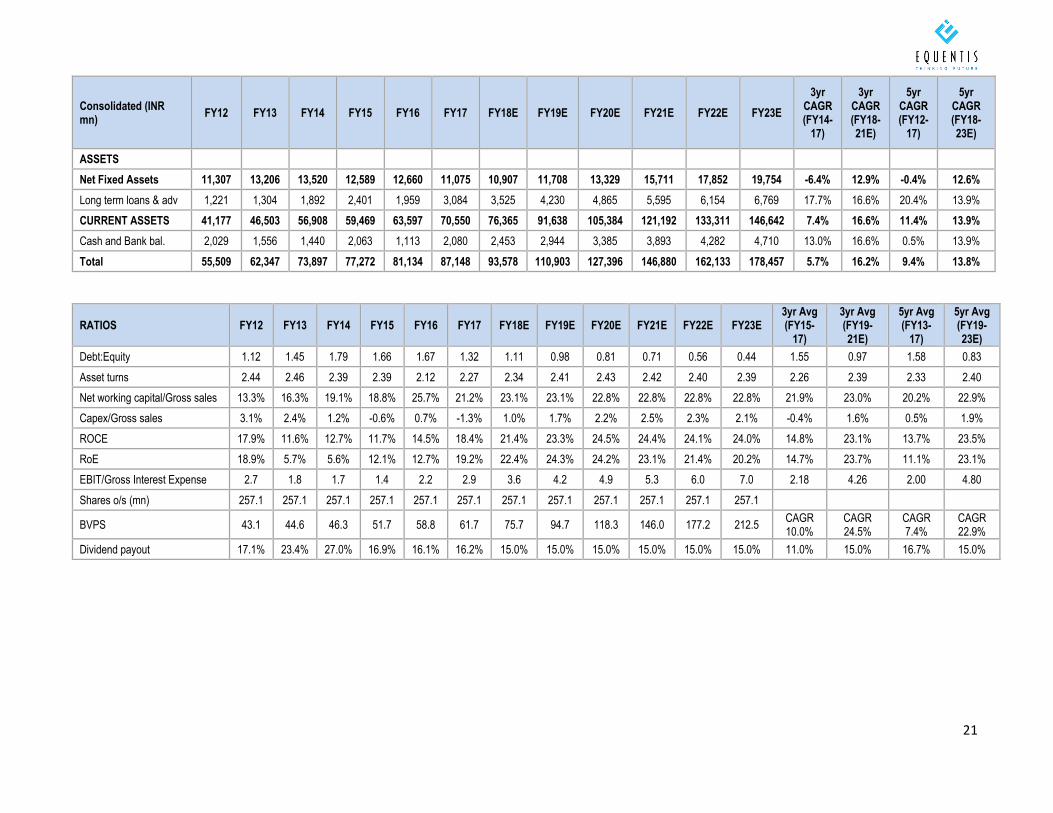
Consolidated (INR mn)
FY12 FY13 FY14 FY15 FY16 FY17 FY18E FY19E FY20E FY21E FY22E FY23E
3yr CAGR (FY14-
17)
3yr CAGR (FY18-21E)
5yr CAGR (FY12-
17)
5yr CAGR (FY18-23E)
ASSETS
Net Fixed Assets 11,307 13,206 13,520 12,589 12,660 11,075 10,907 11,708 13,329 15,711 17,852 19,754 -6.4% 12.9% -0.4% 12.6%
Long term loans & adv 1,221 1,304 1,892 2,401 1,959 3,084 3,525 4,230 4,865 5,595 6,154 6,769 17.7% 16.6% 20.4% 13.9%
CURRENT ASSETS 41,177 46,503 56,908 59,469 63,597 70,550 76,365 91,638 105,384 121,192 133,311 146,642 7.4% 16.6% 11.4% 13.9%
Cash and Bank bal. 2,029 1,556 1,440 2,063 1,113 2,080 2,453 2,944 3,385 3,893 4,282 4,710 13.0% 16.6% 0.5% 13.9%
Total 55,509 62,347 73,897 77,272 81,134 87,148 93,578 110,903 127,396 146,880 162,133 178,457 5.7% 16.2% 9.4% 13.8%
RATIOS FY12 FY13 FY14 FY15 FY16 FY17 FY18E FY19E FY20E FY21E FY22E FY23E 3yr Avg (FY15-
17)
3yr Avg (FY19-21E)
5yr Avg (FY13-
17)
5yr Avg (FY19-23E)
Debt:Equity 1.12 1.45 1.79 1.66 1.67 1.32 1.11 0.98 0.81 0.71 0.56 0.44 1.55 0.97 1.58 0.83
Asset turns 2.44 2.46 2.39 2.39 2.12 2.27 2.34 2.41 2.43 2.42 2.40 2.39 2.26 2.39 2.33 2.40
Net working capital/Gross sales 13.3% 16.3% 19.1% 18.8% 25.7% 21.2% 23.1% 23.1% 22.8% 22.8% 22.8% 22.8% 21.9% 23.0% 20.2% 22.9%
Capex/Gross sales 3.1% 2.4% 1.2% -0.6% 0.7% -1.3% 1.0% 1.7% 2.2% 2.5% 2.3% 2.1% -0.4% 1.6% 0.5% 1.9%
ROCE 17.9% 11.6% 12.7% 11.7% 14.5% 18.4% 21.4% 23.3% 24.5% 24.4% 24.1% 24.0% 14.8% 23.1% 13.7% 23.5%
RoE 18.9% 5.7% 5.6% 12.1% 12.7% 19.2% 22.4% 24.3% 24.2% 23.1% 21.4% 20.2% 14.7% 23.7% 11.1% 23.1%
EBIT/Gross Interest Expense 2.7 1.8 1.7 1.4 2.2 2.9 3.6 4.2 4.9 5.3 6.0 7.0 2.18 4.26 2.00 4.80
Shares o/s (mn) 257.1 257.1 257.1 257.1 257.1 257.1 257.1 257.1 257.1 257.1 257.1 257.1
BVPS 43.1 44.6 46.3 51.7 58.8 61.7 75.7 94.7 118.3 146.0 177.2 212.5 CAGR 10.0%
CAGR 24.5%
CAGR 7.4%
CAGR 22.9%
Dividend payout 17.1% 23.4% 27.0% 16.9% 16.1% 16.2% 15.0% 15.0% 15.0% 15.0% 15.0% 15.0% 11.0% 15.0% 16.7% 15.0%
22
DISCLAIMER
Equentis Wealth Advisory Services Private Limited (EWASPL) is registered under the SEBI (Investment Advisers) Regulations,
2013. “Research & Ranking” is the brand under which the Research Division of EWASPL render’s its Research Services. General Disclaimers: This Research Report (hereinafter called ‘Report’) is prepared and distributed by EWASPL for information purposes only. The recommendations, if any, made herein are expression of views and/or opinions and should not be deemed or construed to be neither advice for the purpose of purchase or sale of any security, derivatives or any other security through EWASPL nor any solicitation or offering of any investment /trading opportunity on behalf of the issuer(s) of the respective
security(ies) referred to herein. These information / opinions / views are not meant to serve as a professional investment guide for the readers. No action is solicited based upon the information provided herein. Recipients of this Report should rely on information/data arising out of their own investigations. Readers are advised to seek independent professional advice and arrive at an informed trading/investment decision before executing any trades or making any investments. This Report has been prepared on the basis of publicly available information, internally developed data and other sources believed by EWASPL to be reliable. EWASPL or its directors, employees, affiliates or representatives do not assume any responsibility for, or warrant the accuracy, completeness, adequacy and reliability of such information / opinions / views. While due care has been taken to
ensure that the disclosures and opinions given are fair and reasonable, none of the directors, employees, affiliates or
representatives of EWASPL shall be liable for any direct, indirect, special, incidental, consequential, punitive or exemplary damages, including lost profits arising in any way whatsoever from the information / opinions / views contained in this Report.
Risks: Trading and investment in securities are subject to market risks. There are no assurances or guarantees that the
objectives of any of trading / investment in securities will be achieved. The trades/ investments referred to herein may not be
suitable to all categories of traders/investors. The names of securities mentioned herein do not in any manner indicate their
prospects or returns. The value of securities referred to herein may be adversely affected by the performance or otherwise of
the respective issuer companies, changes in the market conditions, micro and macro factors and forces affecting capital markets
like interest rate risk, credit risk, liquidity risk and reinvestment risk. Derivative products may also be affected by various risks
including but not limited to counter party risk, market risk, valuation risk, liquidity risk and other risks. Besides the price of the
underlying asset, volatility, tenor and interest rates may affect the pricing of derivatives.
Disclaimers in respect of jurisdiction: The possession, circulation and/or distribution of this Report may be restricted or
regulated in certain jurisdictions by appropriate laws. No action has been or will be taken by EWASPL in any jurisdiction (other
than India), where any action for such purpose(s) is required. Accordingly, this Report shall not be possessed, circulated and/or
distributed in any such country or jurisdiction unless such action is in compliance with all applicable laws and regulations of
such country or jurisdiction. EWASPL requires such recipient to inform himself about and to observe any restrictions at his own
expense, without any liability to EWASPL. Any dispute arising out of this Report shall be subject to the exclusive jurisdiction of
the Courts in Mumbai (India).
Disclosure of Interest: The Research Analyst(s) who have prepared this Report hereby certify that the views /opinions
expressed in this Report are their personal independent views/opinions in respect of the securities and their respective issuers.
None of EWASPL, Research Analyst(s), or their relatives had any known direct /indirect material conflict of interest including
any long/short position(s) in any specific security on which views/opinions have been made in this Report, during its preparation.
EWASPL, the Research Analyst(s), or their relativesdo not have financial interest in the issuer company(ies) of the said securities
nor have ownership of 1% or more individually or jointly till the date of this Report. EWASPL, the Research Analyst(s), or their
relatives have not received any compensation or other benefits from the said issuer company(ies) in last 12 months in any
respect whatsoever.
Copyright: The copyright in this Report belongs exclusively to EWASPL. This Report shall only be read by those persons to
whom it has been delivered. No reprinting, reproduction, copying, distribution of this Report in any manner whatsoever, in
whole or in part, is permitted without the prior express written consent of EWASPL.
EWASPL’s activities were never suspended by SEBI or any other authority. Further, there does not exist any material adverse
order/judgments/strictures assessed by any regulatory, government or public authority or agency or any law enforcing agency
in last three years. Further, there does not exist any material enquiry of whatsoever nature instituted or pending against
EWASPL as on the date of this Report.
Important These disclaimers, risks and other disclosures must be read in conjunction with the information / opinions / views
of which they form part of.
CIN: U74999MH2015PTC262812; SEBI Registration No.:INA000003874


![[XLS] Report... · Web viewKARNATAKA BANK LTD. KAYA LIMITED KEC INTERNATIONAL LTD. (FORMERLY KNOWN AS KEC INFRASTRUCTURES LTD.) KESAR PETROPRODUCTS LTD KESORAM INDUSTRIES LTD KEWAL](https://img.dokumen.tips/doc/110x75/5ac79c417f8b9a42358b9ef2/xls-reportweb-viewkarnataka-bank-ltd-kaya-limited-kec-international-ltd-formerly.jpg)