Embed Size (px)
Citation preview
KBC Group
Summer presentationJune 2005Web site: www.kbc.com
Ticker codes: KBC BB (Bloomberg) KBKBT BR (Reuters)
ISIN code: BE0003565737

2
Contact information
Investor Relations Office
Luc CoolNele KindtMarina Kanamori
Tel.: +32 2 429 49 16 investor.relations @ kbc.com
Surf to www.kbc.com for the latest update.
3
KBC Group’s financial accounts are presented according to IFRS reporting standards as of 1Q2005
As IFRS have a material impact on the way earnings are presented, this presentation is drafted to increase their visibility and to help the investment community to understand the underlying profit trends
KBC believes that this presentation is reliable, although some information may be condensed or incomplete
By receiving this presentation, each investor is deemed to represent that it possesses sufficient expertise to understand the risks involved
This presentation is provided for informational purposes only and does not constitute an offer to sell or the solicitation of an offer to buy any security
This presentation contains forward-looking statements with respect to our earnings development. By their nature, these forward-looking statements involve assumptions, uncertainties and opportunities. The risk exists that these statements may not be fulfilled and that future results differ materially.
Important information
Foto gebouw
Financial highlights - 1Q 2005
- Group performance
- Headlines per segment
FY 2005 profit outlook
Additional information on 1Q 2005 results
2004 pro forma IFRS quarterly accounts

5
Strong earnings momentum
393476
332
557
376434
365440
717
1Q04 2Q04 3Q04 4Q04 1Q04 2Q04 3Q04 4Q04 1Q05 2Q05
As published (Bel. GAAP), KBC Old Pro forma (IFRS 2004), MergCo IFRS 2005
Net profit+91% yoy
6
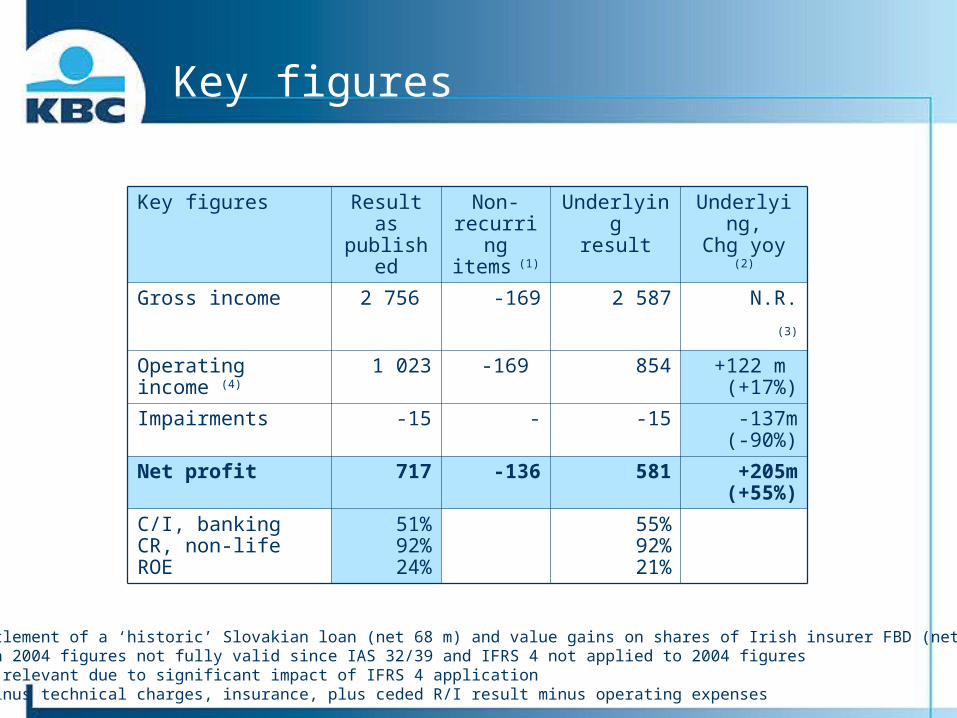
Key figures
Key figures Result as published
Non-recurring items (1)
Underlyingresult
Underlying,Chg yoy (2)
Gross income 2 756 -169 2 587 N.R.
(3)
Operating income (4) 1 023 -169 854 +122 m (+17%)
Impairments -15 - -15 -137m(-90%)
Net profit 717 -136 581 +205m(+55%)
C/I, bankingCR, non-lifeROE
51%92%24%
55%92%21%
Notes:(1) Related to settlement of a ‘historic’ Slovakian loan (net 68 m) and value gains on shares of Irish insurer FBD (net 68 m)(2) Comparison with 2004 figures not fully valid since IAS 32/39 and IFRS 4 not applied to 2004 figures(3) Comparison not relevant due to significant impact of IFRS 4 application (4) Gross income minus technical charges, insurance, plus ceded R/I result minus operating expenses
7
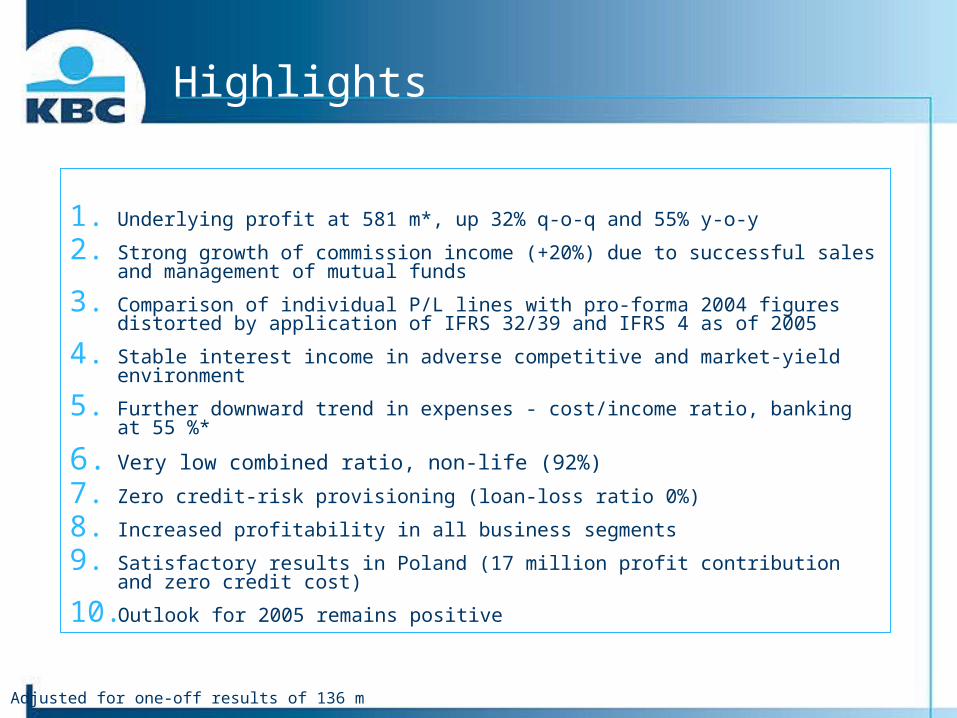
1. Underlying profit at 581 m*, up 32% q-o-q and 55% y-o-y
2. Strong growth of commission income (+20%) due to successful sales and management of mutual funds
3. Comparison of individual P/L lines with pro-forma 2004 figures distorted by application of IFRS 32/39 and IFRS 4 as of 2005
4. Stable interest income in adverse competitive and market-yield environment
5. Further downward trend in expenses - cost/income ratio, banking at 55 %*
6. Very low combined ratio, non-life (92%)
7. Zero credit-risk provisioning (loan-loss ratio 0%)
8. Increased profitability in all business segments
9. Satisfactory results in Poland (17 million profit contribution and zero credit cost)
10. Outlook for 2005 remains positive
Highlights
* Adjusted for one-off results of 136 m
8
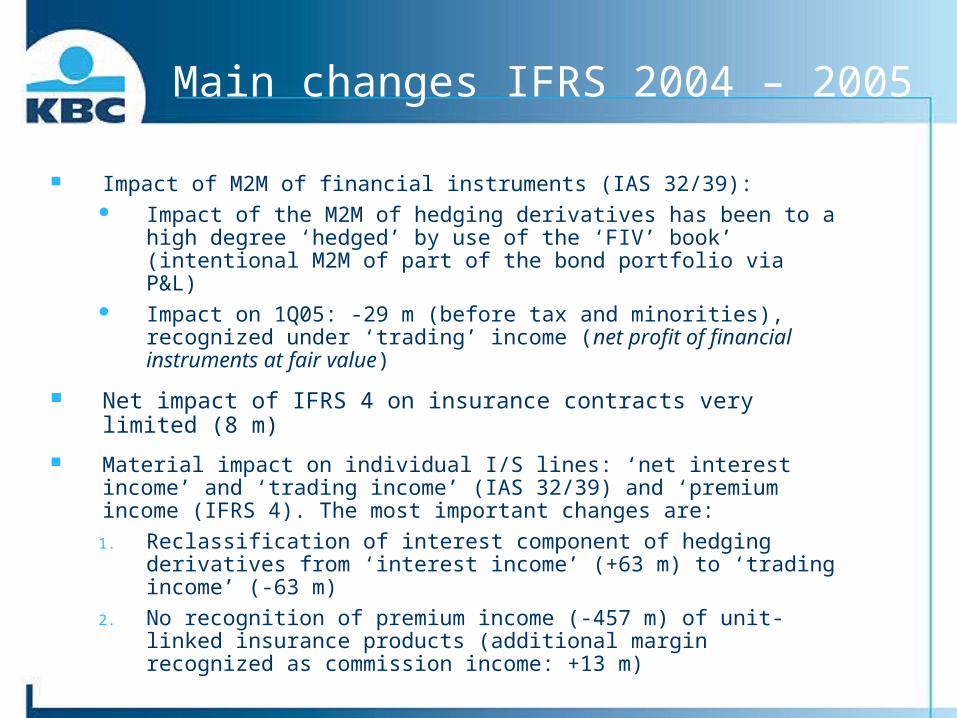
Main changes IFRS 2004 – 2005
Impact of M2M of financial instruments (IAS 32/39): Impact of the M2M of hedging derivatives has been to a high degree
‘hedged’ by use of the ‘FIV’ book’ (intentional M2M of part of the bond portfolio via P&L)
Impact on 1Q05: -29 m (before tax and minorities), recognized under ‘trading’ income (net profit of financial instruments at fair value)
Net impact of IFRS 4 on insurance contracts very limited (8 m)
Material impact on individual I/S lines: ‘net interest income’ and ‘trading income’ (IAS 32/39) and ‘premium income (IFRS 4). The most important changes are:
1. Reclassification of interest component of hedging derivatives from ‘interest income’ (+63 m) to ‘trading income’ (-63 m)
2. No recognition of premium income (-457 m) of unit-linked insurance products (additional margin recognized as commission income: +13 m)

9
Satisfactory quality of revenue
1Q04 2Q04 3Q04 4Q04 1Q05 2Q05
Pro forma IFRS 2004 IFRS 2005
3 462
2 517
3 1783 175
2 756
Excl. one-offs (169 m) and IFRS reclassifications, solid quality of banking income: stable interest income (in adverse interest rate environment), strong commission line (+17% y-o-y) and lower trading revenue
Nominal amount dropped, mainly due to a) non-recognition under IFRS 2005 of 464 m new unit-linked premium volume, b) M2M of financial instruments (IAS 32/39) and c) lower guaranteed life insurance (-667 m q-o-q and –95 m y-o-y)
Gross income (m)

10
Operating expenses at low level
1Q04 2Q04 3Q04 4Q04 1Q05 2Q05
4Q04 lifted by staff profit-sharing bonuses, marketing costs, litigation provision (KBC Bank) and restructuring provision (KBL epb)
Pro forma IFRS 2004 IFRS 2005
1 424
1 1471 105
1 269
1 104
* C/I of 55% excl. non-recurring income
1Q05 down 13% y-o-y due to cost cutting, no provisioning for future operating expenses & timing differences (y-o-y trend not to be extrapolated to Q2)
Cost/income of banking and asset management at 51%*
Operating expenses (m)
11
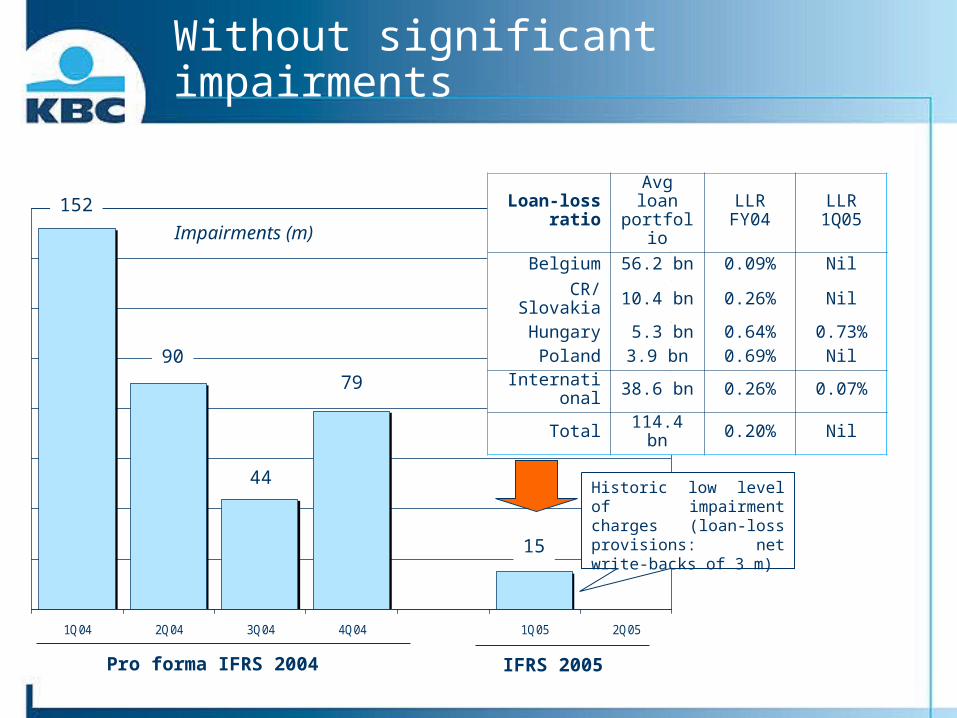
Without significant impairments
1Q04 2Q04 3Q04 4Q04 1Q05 2Q05
Pro forma IFRS 2004 IFRS 2005
15
152
90
44
79
Loan-loss ratio
Avg loan portfolio
LLRFY04
LLR1Q05
Belgium 56.2 bn 0.09% Nil
CR/Slovakia 10.4 bn 0.26% NilHungary 5.3 bn 0.64% 0.73%
Poland 3.9 bn 0.69% Nil
International 38.6 bn 0.26% 0.07%
Total 114.4 bn 0.20% Nil
Historic low level of impairment charges (loan-loss provisions: net write-backs of 3 m)
Impairments (m)
12
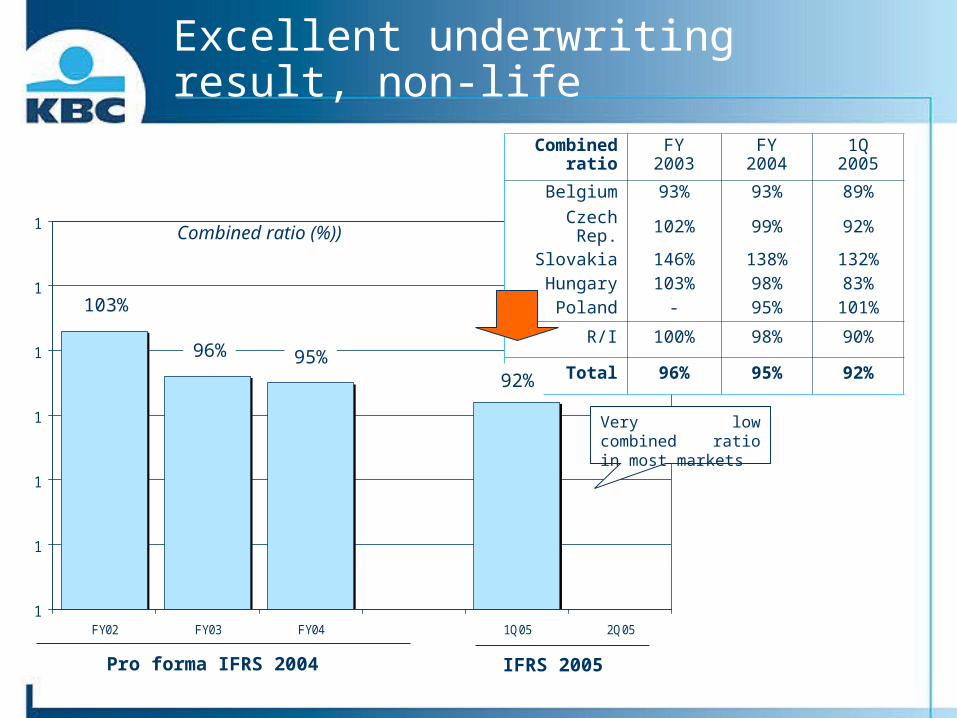
Excellent underwriting result, non-life
1
1
1
1
1
1
1
FY02 FY03 FY04 1Q05 2Q05
Pro forma IFRS 2004 IFRS 2005
103%
96% 95%
Combined ratio
FY2003
FY2004
1Q2005
Belgium 93% 93% 89%
Czech Rep. 102% 99% 92%Slovakia 146% 138% 132%Hungary 103% 98% 83%
Poland - 95% 101%
R/I 100% 98% 90%
Total 96% 95% 92%
Very low combined ratio in most markets
Combined ratio (%))
92%

13
Asset growth
Customer loans (1)
o/w mortgages
Customer deposits (1)
‘Life deposits’
AUM(off-balance)
108.4 bn 29.0 bn 166.4 bn 13.9 bn 150.7 bn
Total %, Ytd (1) +2% +4% +4% +3% +7%
Belgium +2% +4% +5% +3% +9%
CEE- CR/Slovakia- Hungary- Poland
0%+1%+1%-4%
+6%+6%+8%+2%
+10%+14%+ 4%+ 2%
+7%+8%
+15%-7%
+7%+12%+35%-14%
Rest of the world +4% +6% +2% -5% +5%
Note:(1) Growth excl. (reverse) repo’s
Foto gebouw
Financial highlights - 1Q 2005
- Group performance
- Headlines per segment
FY 2005 profit outlook
Additional information on 1Q 2005 results
2004 pro forma IFRS accounts
15
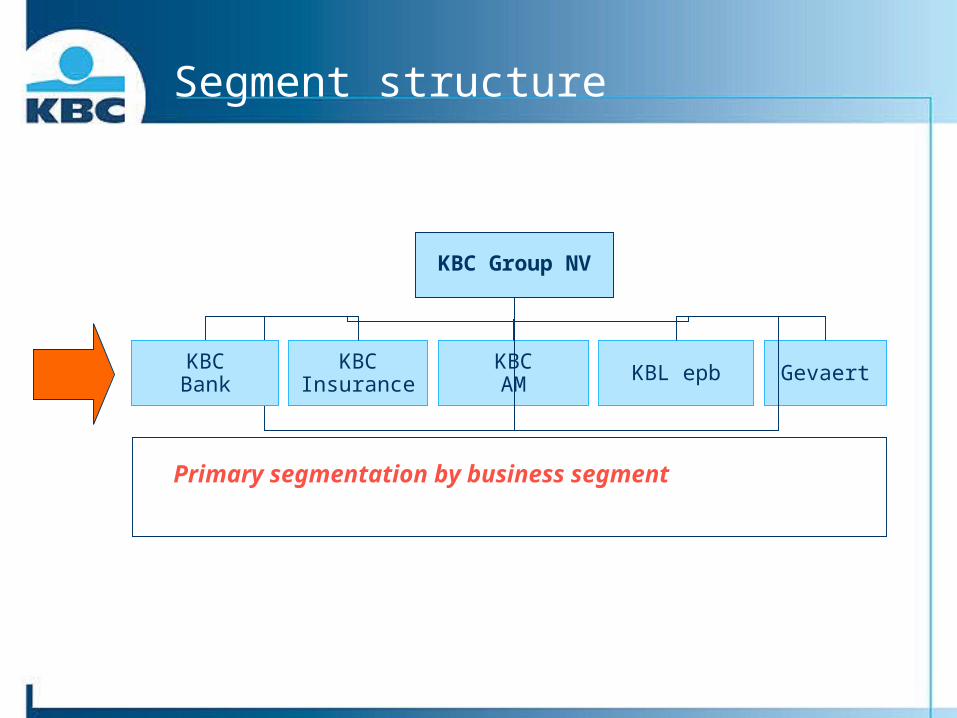
Segment structure
KBC Group NV
KBCInsurance
KBCAM KBL epb GevaertKBC
Bank
Primary segmentation by business segment
16
Key points, business segments
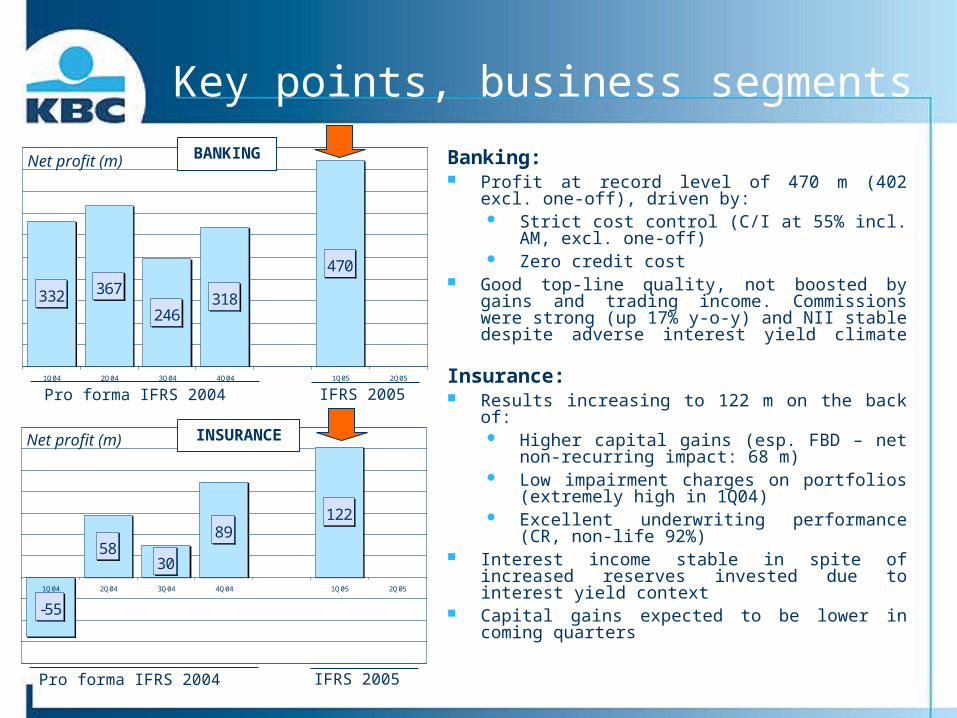
-55
5830
89122
1Q04 2Q04 3Q04 4Q04 1Q05 2Q05
Pro forma IFRS 2004 IFRS 2005
Net profit (m)
332 367
246318
470
1Q04 2Q04 3Q04 4Q04 1Q05 2Q05
Pro forma IFRS 2004 IFRS 2005
Net profit (m)
INSURANCE
BANKING Banking: Profit at record level of 470 m (402 excl. one-off),
driven by: Strict cost control (C/I at 55% incl. AM, excl.
one-off) Zero credit cost
Good top-line quality, not boosted by gains and trading income. Commissions were strong (up 17% y-o-y) and NII stable despite adverse interest yield climate
Insurance: Results increasing to 122 m on the back of:
Higher capital gains (esp. FBD – net non-recurring impact: 68 m)
Low impairment charges on portfolios (extremely high in 1Q04)
Excellent underwriting performance (CR, non-life 92%)
Interest income stable in spite of increased reserves invested due to interest yield context
Capital gains expected to be lower in coming quarters

17
Key points, business segments
43
2338
-30
53
1Q04 2Q04 3Q04 4Q04 1Q05 2Q05
Pro forma IFRS 2004 IFRS 2005
Net profit (m)
5158 53
6658
1Q04 2Q04 3Q04 4Q04 1Q05 2Q05
Pro forma IFRS 2004 IFRS 2005
Net profit (m)
EUROPEAN PRIVATE BANKING
ASSET MANAGEMENT Asset management: AUM in 1Q05 up 8% to 85.2 bn on the back of new
money entries Profit contribution at 58 m, +7 m y-o-y (driven by
increased AUM), down 8 m q-o-q (exceptionally high dividend income in Q4)
Note: total 3rd assets of the group: 150.7 bn Asset management segment: 72.3 bn (3rd party)
+ 12.9 bn (group assets) Banking segment: 28.7 bn (mostly private and
HNWI assets in Belgium and CEE) European private banking segment: 49.7 bn (o/w
46.0 bn of private customers via epb network)
European private banking: Profit contribution at 53 m, up 10 m y-o-y and up 83
m q-o-q (Q4 heavily depressed by one-off restructuring provisions)
Top-line at high level (partly due to M2M of financial instruments) with sustained growth trend of commission income
Private banking AUM in 1Q05 up 6% to 49.7 bn Cost/income at 63% No relevant impairment charges
18
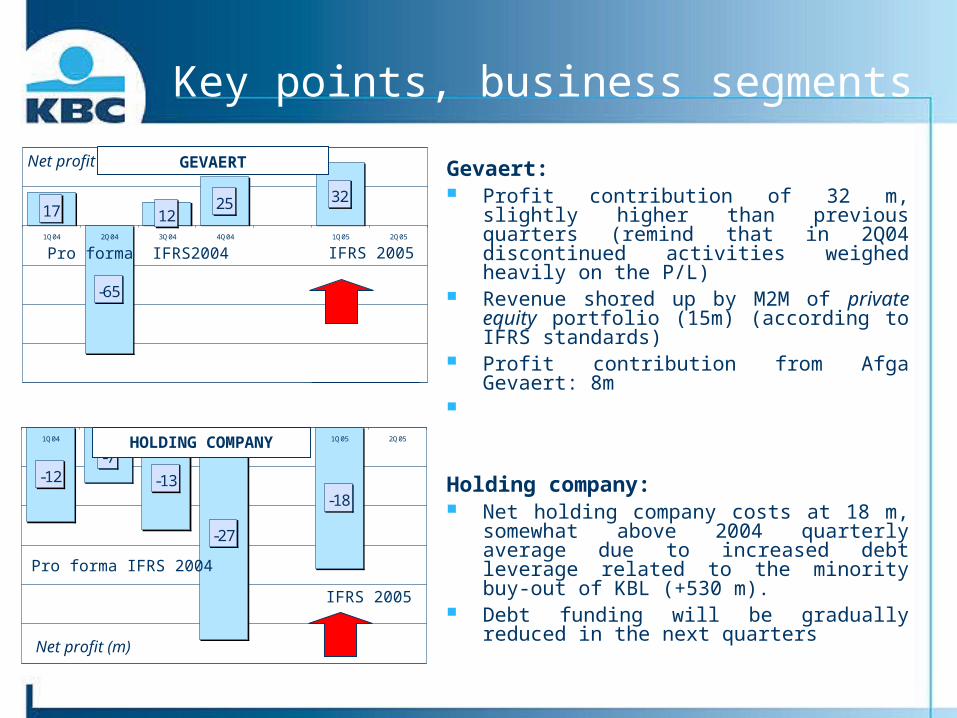
17
-65
1225 32
1Q04 2Q04 3Q04 4Q04 1Q05 2Q05
Pro forma IFRS2004
Key points, business segments
-12-7
-13
-27
-18
1Q04 2Q04 3Q04 4Q04 1Q05 2Q05
Pro forma IFRS 2004
IFRS 2005
Net profit (m)
IFRS 2005
Net profit (m)
HOLDING COMPANY
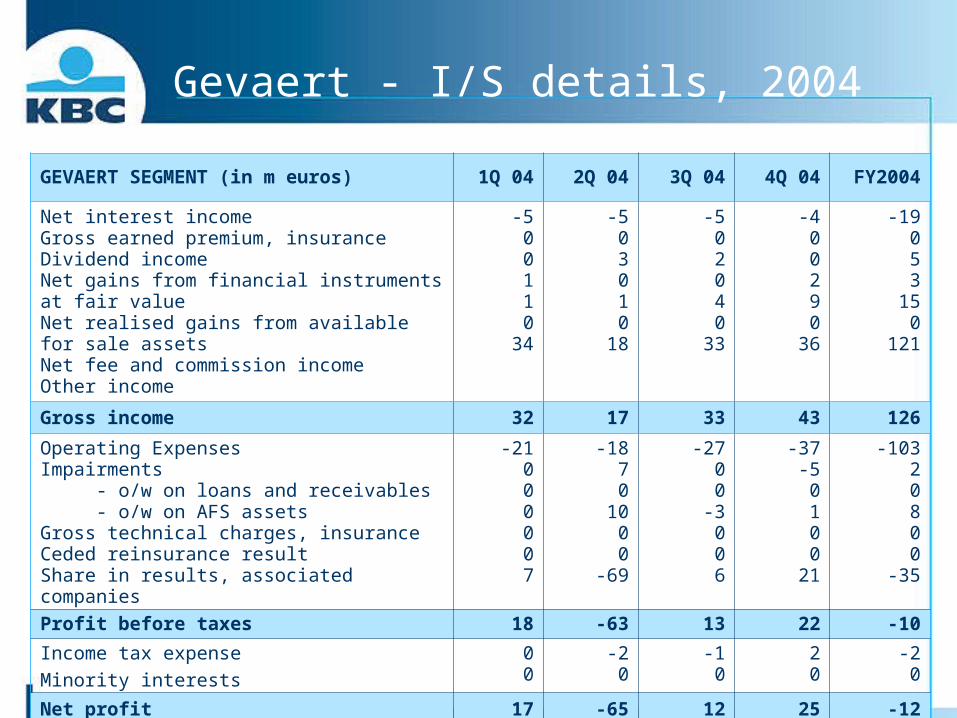
GEVAERT Gevaert: Profit contribution of 32 m, slightly higher than
previous quarters (remind that in 2Q04 discontinued activities weighed heavily on the P/L)
Revenue shored up by M2M of private equity portfolio (15m) (according to IFRS standards)
Profit contribution from Afga Gevaert: 8m
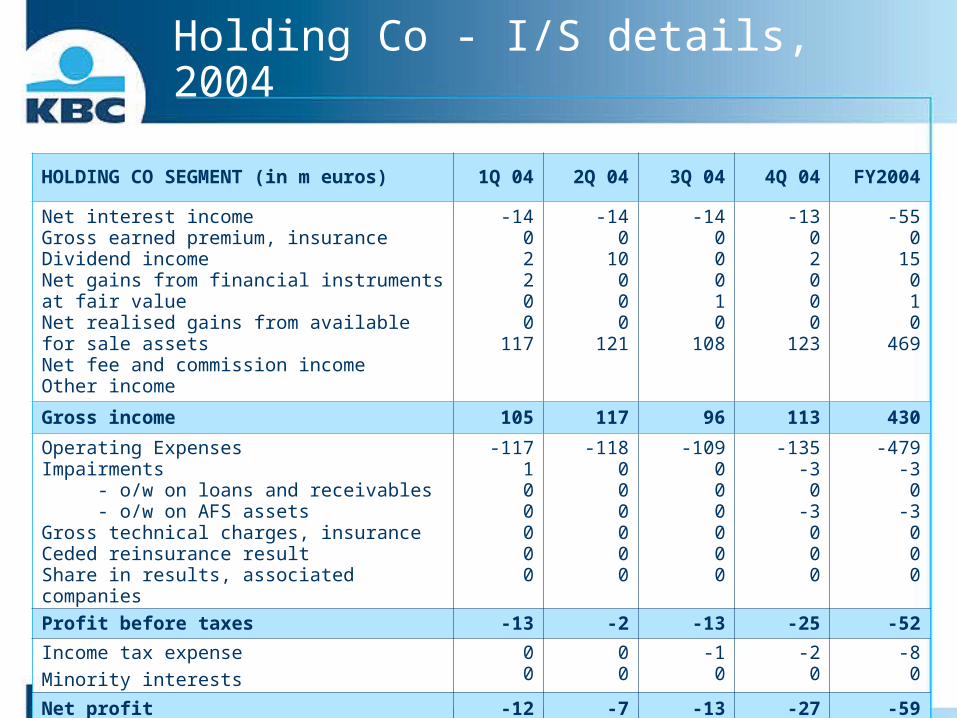
Holding company: Net holding company costs at 18 m, somewhat
above 2004 quarterly average due to increased debt leverage related to the minority buy-out of KBL (+530 m).
Debt funding will be gradually reduced in the next quarters
19
Segment structure – cont’d
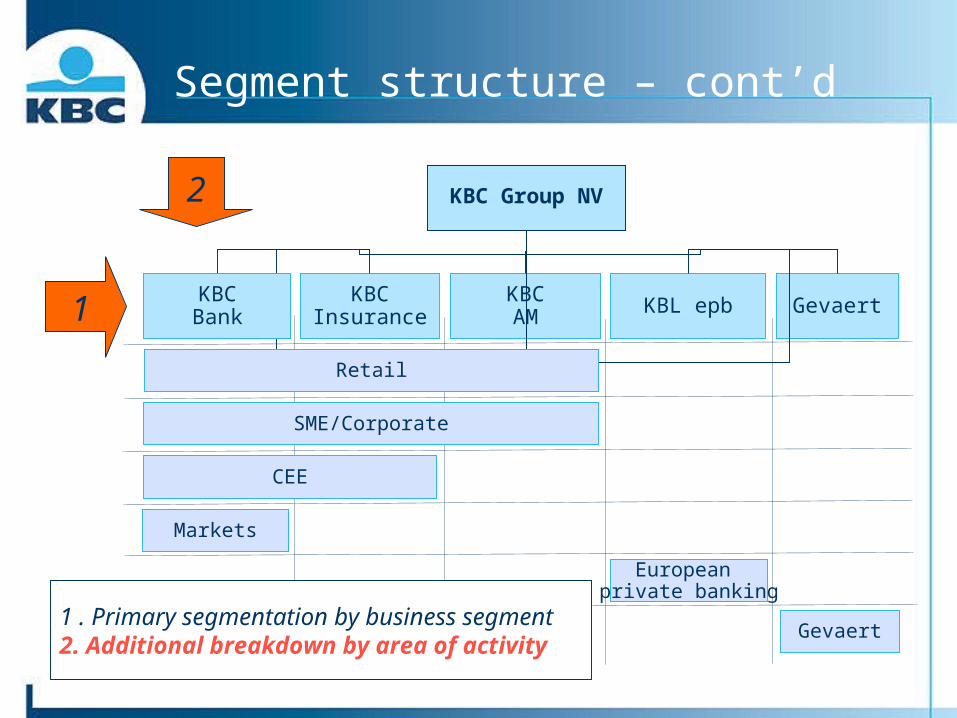
KBC Group NV
KBCInsurance
KBCAM KBL epb GevaertKBC
Bank
CEE
Markets
European private banking
Gevaert
Retail
SME/Corporate
1
2
1 . Primary segmentation by business segment2. Additional breakdown by area of activity
20
Reminder
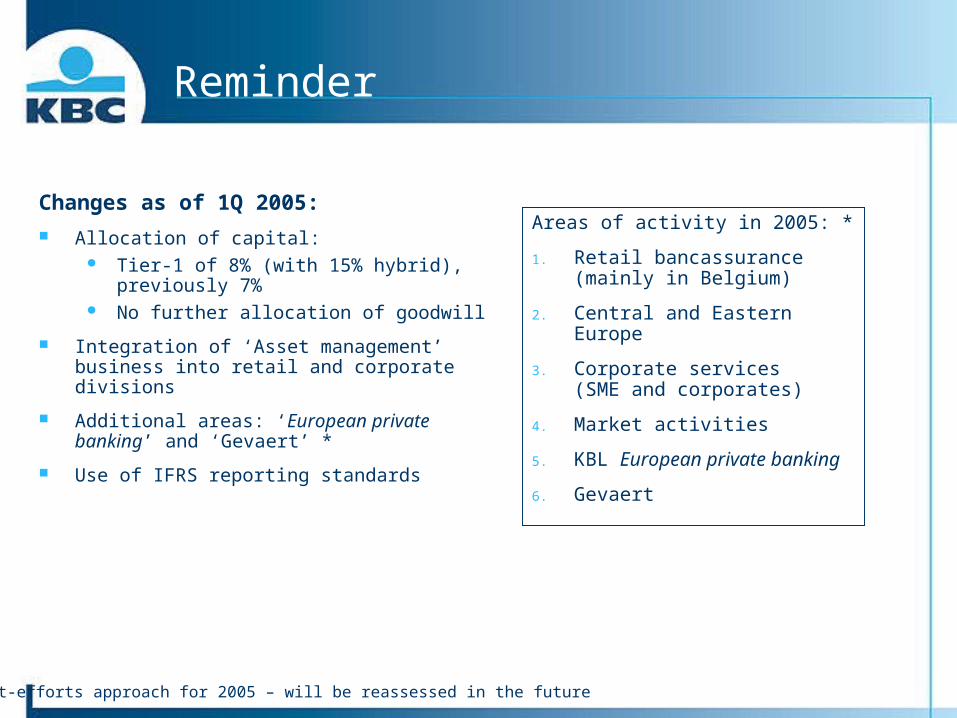
Changes as of 1Q 2005:
Allocation of capital: Tier-1 of 8% (with 15% hybrid), previously 7% No further allocation of goodwill
Integration of ‘Asset management’ business into retail and corporate divisions
Additional areas: ‘European private banking’ and ‘Gevaert’ *
Use of IFRS reporting standards
Areas of activity in 2005: *
1. Retail bancassurance (mainly in Belgium)
2. Central and Eastern Europe
3. Corporate services (SME and corporates)
4. Market activities
5. KBL European private banking
6. Gevaert
* Best-efforts approach for 2005 – will be reassessed in the future
21
Retail Belgium and CEE
6689 75
51
191
1Q04 2Q04 3Q04 4Q04 1Q05 2Q05
Pro forma
Net profit (m)
87146 132
303 295
1Q04 2Q04 3Q04 4Q04 1Q05 2Q05
Pro forma
Net profit (m)
CEE
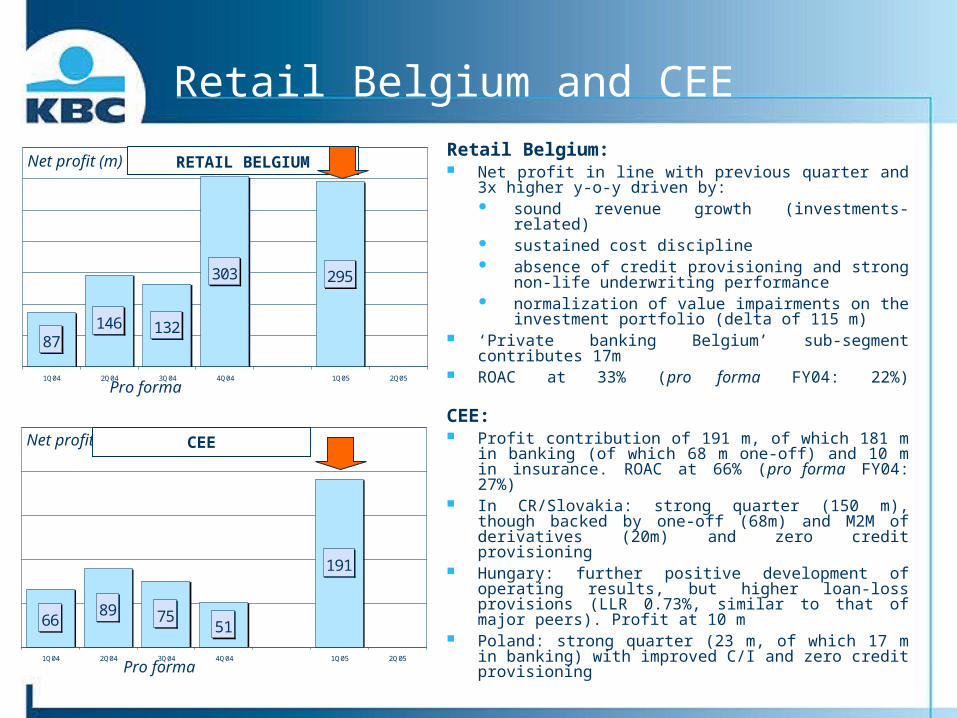
RETAIL BELGIUMRetail Belgium: Net profit in line with previous quarter and 3x
higher y-o-y driven by: sound revenue growth (investments-related) sustained cost discipline absence of credit provisioning and strong non-
life underwriting performance normalization of value impairments on the
investment portfolio (delta of 115 m) ‘Private banking Belgium’ sub-segment contributes
17m ROAC at 33% (pro forma FY04: 22%)
CEE: Profit contribution of 191 m, of which 181 m in
banking (of which 68 m one-off) and 10 m in insurance. ROAC at 66% (pro forma FY04: 27%)
In CR/Slovakia: strong quarter (150 m), though backed by one-off (68m) and M2M of derivatives (20m) and zero credit provisioning
Hungary: further positive development of operating results, but higher loan-loss provisions (LLR 0.73%, similar to that of major peers). Profit at 10 m
Poland: strong quarter (23 m, of which 17 m in banking) with improved C/I and zero credit provisioning
22
Earnings momentum in CEE, banking
* Pro forma
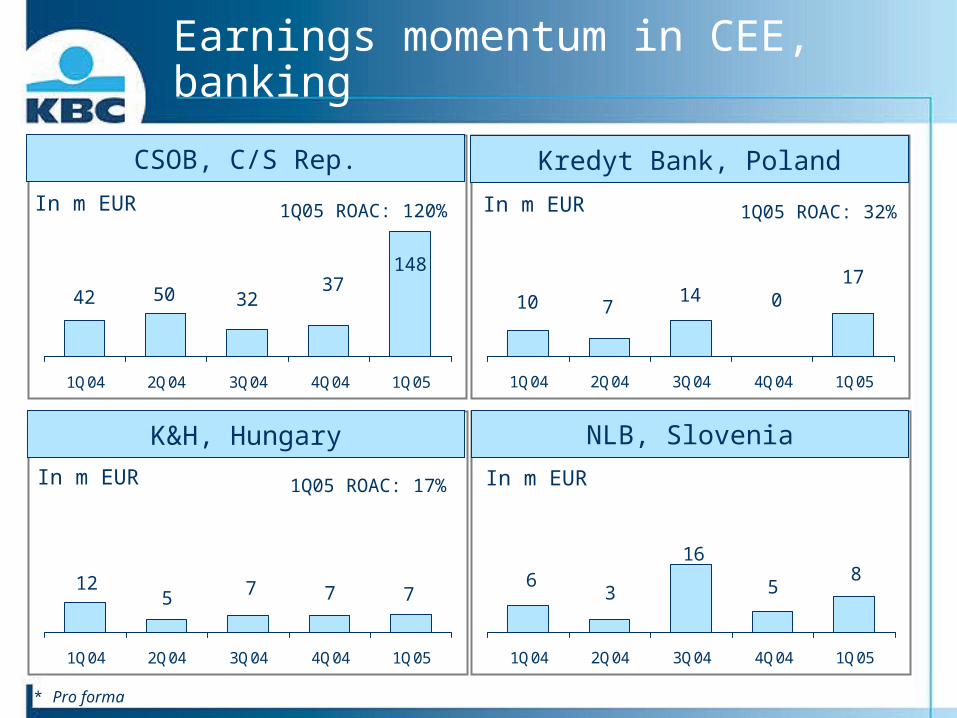
3250 3742
148
1Q04 2Q04 3Q04 4Q04 1Q05
CSOB, C/S Rep.
In m EUR 1Q05 ROAC: 120%
712 75 7
1Q04 2Q04 3Q04 4Q04 1Q05
K&H, Hungary
In m EUR 1Q05 ROAC: 17%
1710 07
14
1Q04 2Q04 3Q04 4Q04 1Q05
Kredyt Bank, Poland
In m EUR 1Q05 ROAC: 32%
86 53
16
1Q04 2Q04 3Q04 4Q04 1Q05
NLB, Slovenia
In m EUR
23
SME and wholesale activities
8871
19
76 75
1Q04 2Q04 3Q04 4Q04 1Q05 2Q05
Pro forma
Net profit (m)
108 106 99 105134
1Q04 2Q04 3Q04 4Q04 1Q05 2Q05
Pro forma
Net profit (m)
CAPITAL MARKETS
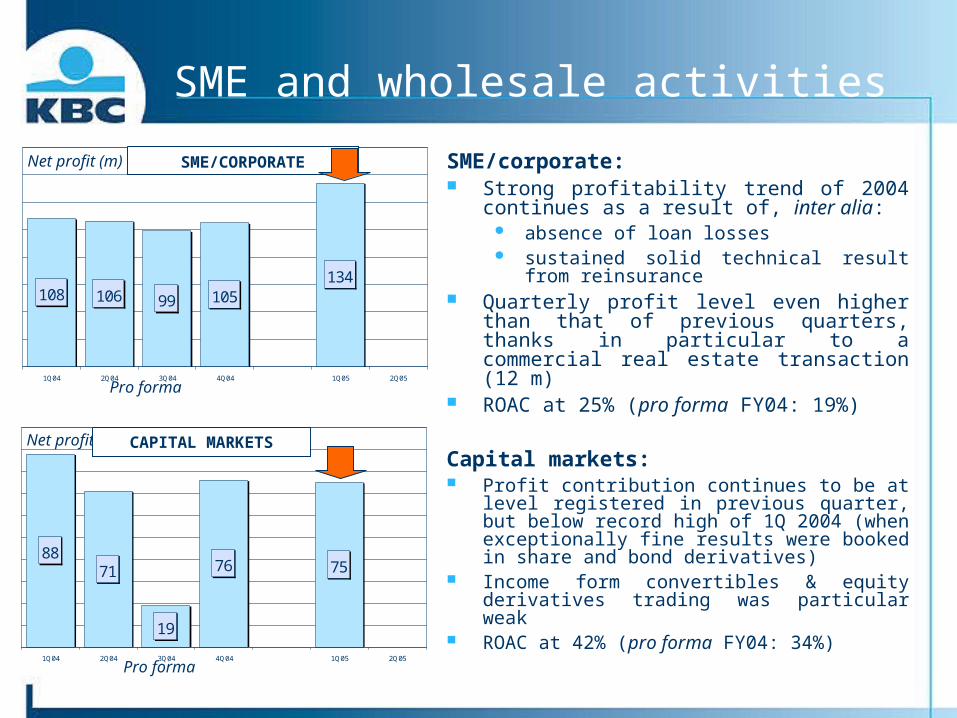
SME/CORPORATE SME/corporate: Strong profitability trend of 2004 continues as a
result of, inter alia: absence of loan losses sustained solid technical result from
reinsurance Quarterly profit level even higher than that of
previous quarters, thanks in particular to a commercial real estate transaction (12 m)
ROAC at 25% (pro forma FY04: 19%)
Capital markets: Profit contribution continues to be at level
registered in previous quarter, but below record high of 1Q 2004 (when exceptionally fine results were booked in share and bond derivatives)
Income form convertibles & equity derivatives trading was particular weak
ROAC at 42% (pro forma FY04: 34%)
24
2005 profit outlook
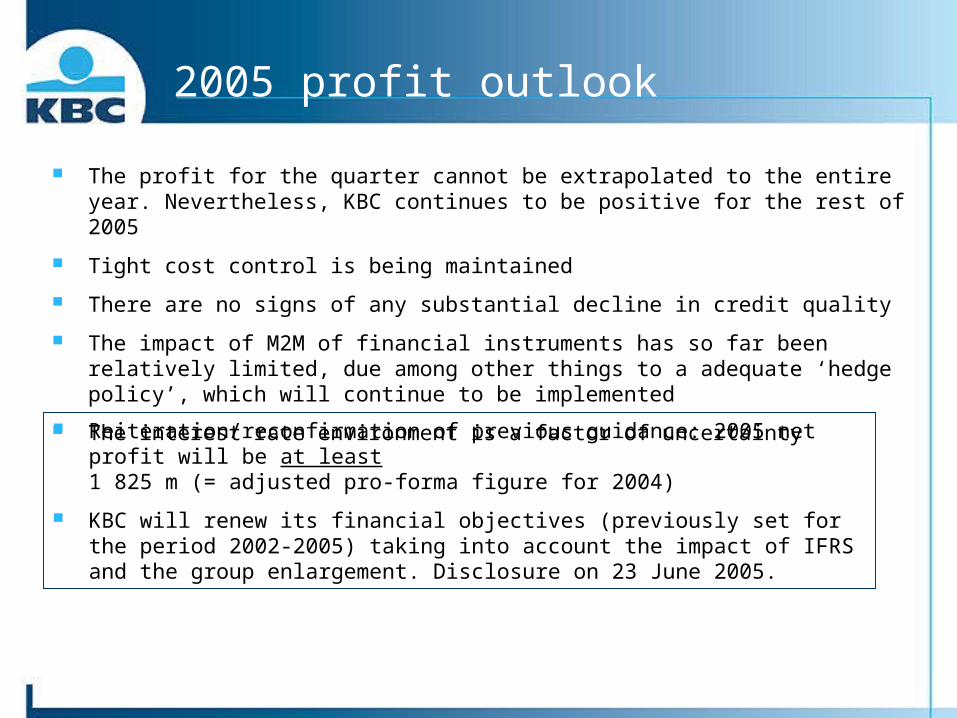
The profit for the quarter cannot be extrapolated to the entire year. Nevertheless, KBC continues to be positive for the rest of 2005
Tight cost control is being maintained
There are no signs of any substantial decline in credit quality
The impact of M2M of financial instruments has so far been relatively limited, due among other things to a adequate ‘hedge policy’, which will continue to be implemented
The interest rate environment is a factor of uncertainty
Reiteration/reconfirmation of previous guidance: 2005 net profit will be at least 1 825 m (= adjusted pro-forma figure for 2004)
KBC will renew its financial objectives (previously set for the period 2002-2005) taking into account the impact of IFRS and the group enlargement. Disclosure on 23 June 2005.

Foto gebouw
Financial highlights - 1Q 2005
- Group performance
- Headlines per segment
FY 2005 profit outlook
Additional information on 1Q 2005 results
2004 pro forma IFRS quarterly accounts
26
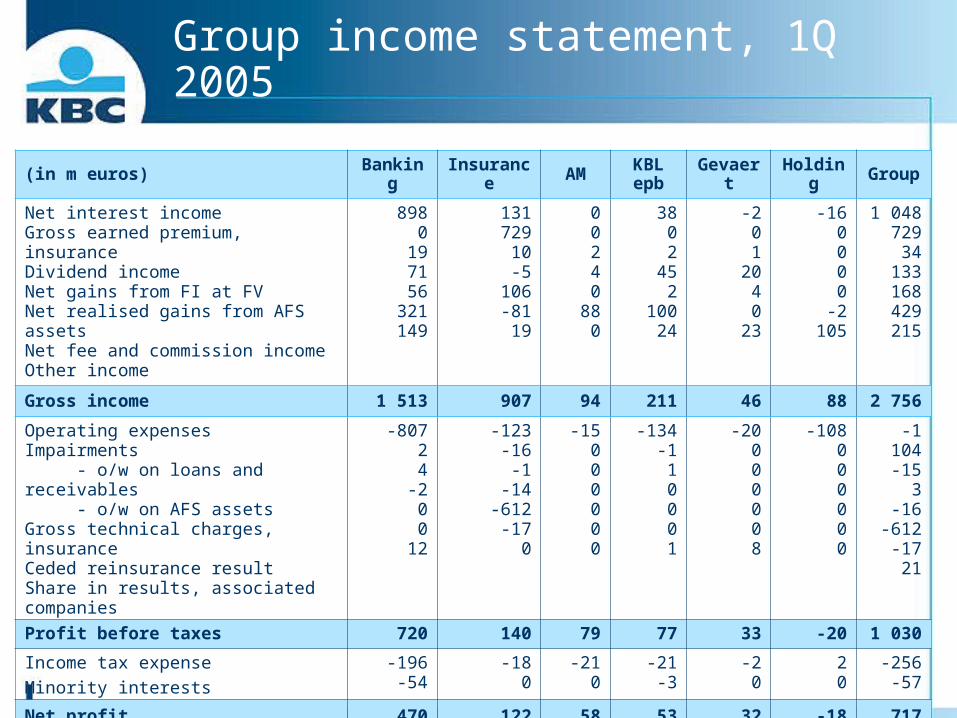
Group income statement, 1Q 2005
(in m euros) Banking Insurance AM KBLepb Gevaert Holding Group
Net interest incomeGross earned premium, insuranceDividend incomeNet gains from FI at FV Net realised gains from AFS assetsNet fee and commission incomeOther income
8980
197156
321149
13172910-5
106-8119
00240
880
3802
452
10024
-201
2040
23
-160000
-2105
1 04872934
133168429215
Gross income 1 513 907 94 211 46 88 2 756
Operating expensesImpairments - o/w on loans and receivables - o/w on AFS assetsGross technical charges, insuranceCeded reinsurance resultShare in results, associated companies
-80724
-200
12
-123-16-1
-14-612-17
0
-15000000
-134-110001
-20000008
-108000000
-1 104-15
3-16
-612-1721
Profit before taxes 720 140 79 77 33 -20 1 030
Income tax expense
Minority interests
-196-54
-180
-210
-21-3
-20
20
-256-57
Net profit 470 122 58 53 32 -18 717
27
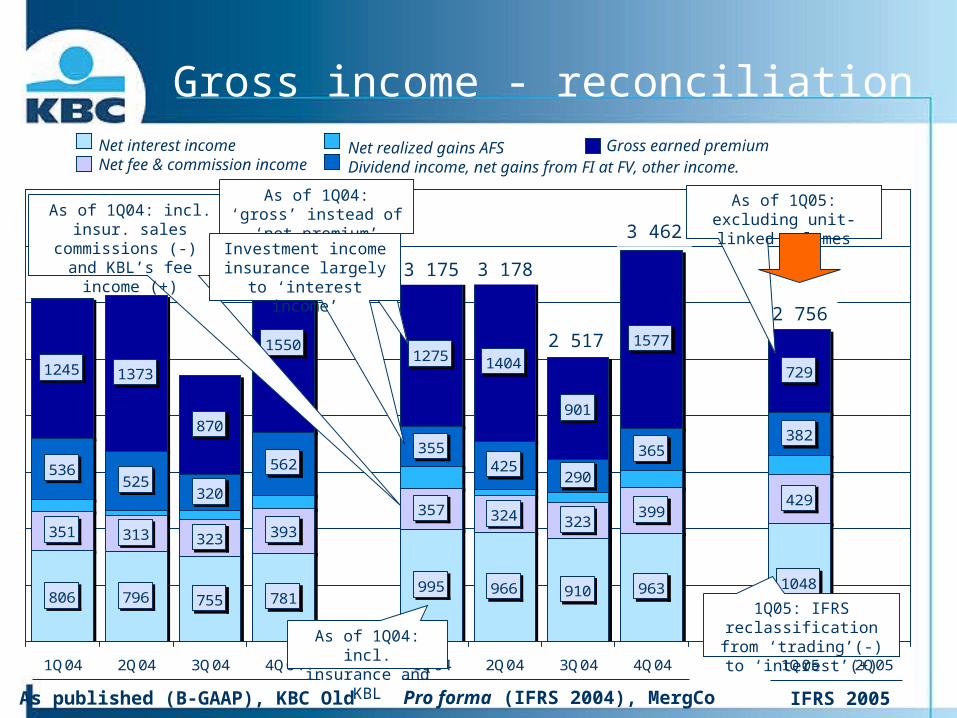
Gross income - reconciliation
806 796 755 781995 966 910 963 1048
351 313 323 393
357 324 323399
429
536525
320
562355
425290
365382
1245 1373
870
15501275 1404
901
1577
729
1Q04 2Q04 3Q04 4Q04 1Q04 2Q04 3Q04 4Q04 1Q05 2Q05
As of 1Q04: incl. insurance and KBL
1Q05: IFRS reclassification from
‘trading’(-) to ‘interest’(+)
As published (B-GAAP), KBC Old Pro forma (IFRS 2004), MergCo IFRS 2005
3 462
2 517
3 1783 175
2 756
As of 1Q04: incl. insur. sales commissions (-)
and KBL’s fee income (+)
As of 1Q05: excluding unit-linked volumes
As of 1Q04: ‘gross’ instead of ‘net premium’
Investment income insurance largely to
‘interest income’
Net interest incomeNet fee & commission income
Net realized gains AFSDividend income, net gains from FI at FV, other income.
Gross earned premium
28
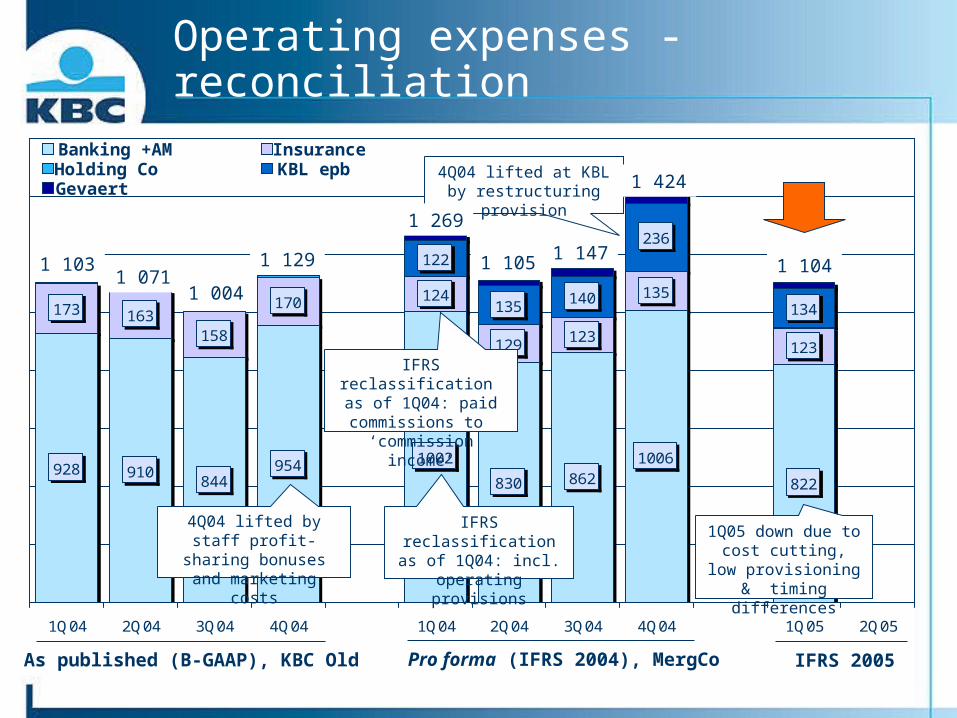
Operating expenses - reconciliation
928 910844
954 1002
830 8621006
822
173 163158
170 124
129123
135
123
122
135140
236
134
1Q04 2Q04 3Q04 4Q04 1Q04 2Q04 3Q04 4Q04 1Q05 2Q05
IFRS reclassification as of 1Q04: incl. operating
provisions
4Q04 lifted by staff profit-sharing bonuses and marketing costs
1Q05 down due to cost cutting, low
provisioning & timing differences
4Q04 lifted at KBL by restructuring provision
As published (B-GAAP), KBC Old Pro forma (IFRS 2004), MergCo IFRS 2005
1 1031 071
1 004
1 424
1 1471 105
1 269
1 1041 129
IFRS reclassification as of 1Q04: paid commissions to
‘commission income’
Banking +AM InsuranceHolding Co KBL epbGevaert

29
Impairments - reconciliation
43
77
14
65
33
74
15
7627
119
12
18
16
11
11
123
31
1Q04 2Q04 3Q04 4Q04 1Q04 2Q04 3Q04 4Q04 1Q05 2Q05
1Q04: high equity impairments (under
IFRS, impact not compensated by write-
back of dedicated provisioning, as was the
case under B-GAAP)
As published (B-GAAP), KBC Old Pro forma (IFRS 2004), MergCo IFRS 2005
15
152
90
44
79
Under IFRS, no further amortization of
goodwill (avg. 10m/Q)
KBL’s 10 m write-back explains delta with B-GAAP
Zero credit-loss provisioning
11 m real-estate impairments
KBL’s 10 m provisioning explains delta with B-GAAP
KBL/Gevaert’s 18 m write-back explains delta with B-GAAP

30
Areas of activity overview, 1Q 2005 (1)
(in m euros and % y-o-y)
Retail CEE SME/Corp.
Markets KBLepb Gevaert Total
Banking and AM
Gross incomeOperating expensesAssociatesIncome tax expenseMinority interestsNet profit – group share
659 (+13%)- 371 (-2%)
0 (-) - 87 (58%)
0 (-)213 (47%)
522 (+47%)-253 (6%)
1 (-)- 59 (79%)-25(-233%)181 (157%)
258(+13%)-94 (15%)
0 (-)- 44 (15%)
0 (-)123 (19%)
207 (-28%)-93 (-38%)
0 (-)- 40 (15%)
0 (-)75 (19%)
211 (13%)-134 (10%)
-1 (-)- 21 (-)
-3 (-)53 (22%)
1 608 (+1%)-822 (-18%)
12 +20%)- 218 (+59%)
-54 (+23%)528 (+38%)
Insurance
Gross incomeOperating expensesAssociatesIncome tax expenseMinority interestsNet profit – group share
618 (-45%)- 74 (-4%)
0 (-)- 11 (-91%)
0 (-)82 (-241%)
203 (13%)- 41 (0%)
0 (-)- 6 (-326%)- 2 (-259%)10 (-241%)
79 (-)- 8 (-)
0 (-)- 1 (-)
0 (-)12 (-102%)
907 (+34%) - 123 (-1%)
0 (-)- 18 (64%)
0 (-)122 (-)
Holding Co
Net profit – group share 32 - 18
Group total
Net profit – Group shareShare in group resultROAC
295 (238%)41%33%
191(191%)27%66%
134 (24%)19%25%
75 (-15%)10%41%
53 (+22%) 7%
18%
32 (84%)4%13%
717 (91%)
24%
(1) excl. Non-allocated
31
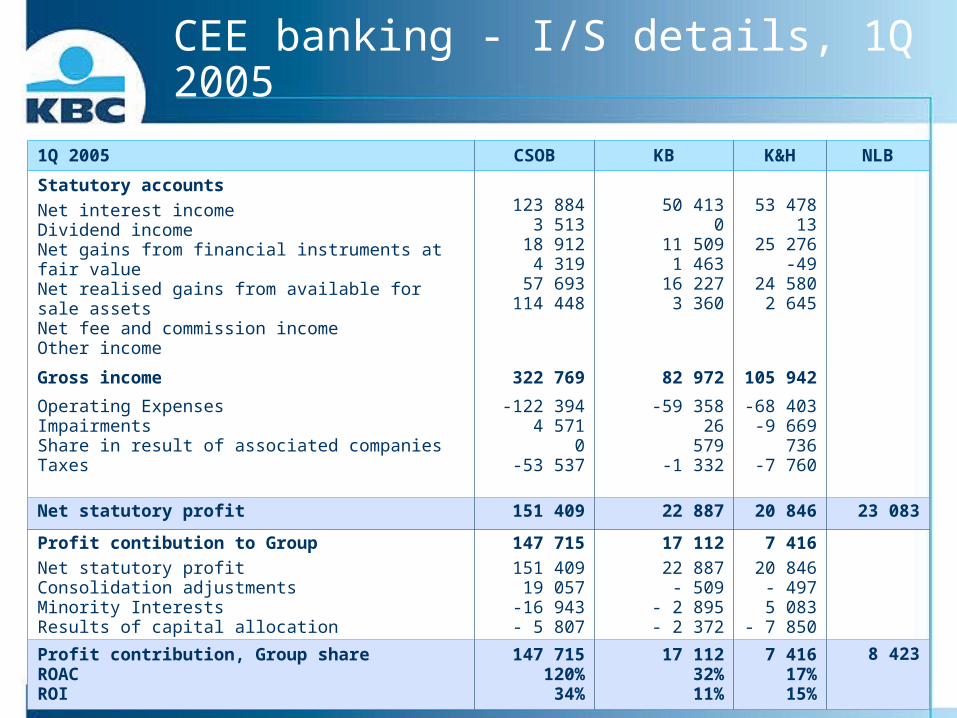
CEE banking - I/S details, 1Q 2005
1Q 2005 CSOB KB K&H NLB
Statutory accounts
Net interest incomeDividend incomeNet gains from financial instruments at fair valueNet realised gains from available for sale assetsNet fee and commission incomeOther income
123 8843 513
18 9124 319
57 693114 448
50 4130
11 5091 463
16 2273 360
53 47813
25 276-49
24 5802 645
Gross income 322 769 82 972 105 942
Operating ExpensesImpairmentsShare in result of associated companiesTaxes
-122 3944 571
0-53 537
-59 35826
579-1 332
-68 403-9 669
736-7 760
Net statutory profit 151 409 22 887 20 846 23 083
Profit contibution to Group
Net statutory profitConsolidation adjustmentsMinority InterestsResults of capital allocation
147 715
151 40919 057
-16 943- 5 807
17 112
22 887- 509
- 2 895- 2 372
7 416
20 846- 497
5 083- 7 850
Profit contribution, Group shareROACROI
147 715120%34%
17 11232%11%
7 41617%15%
8 423
32
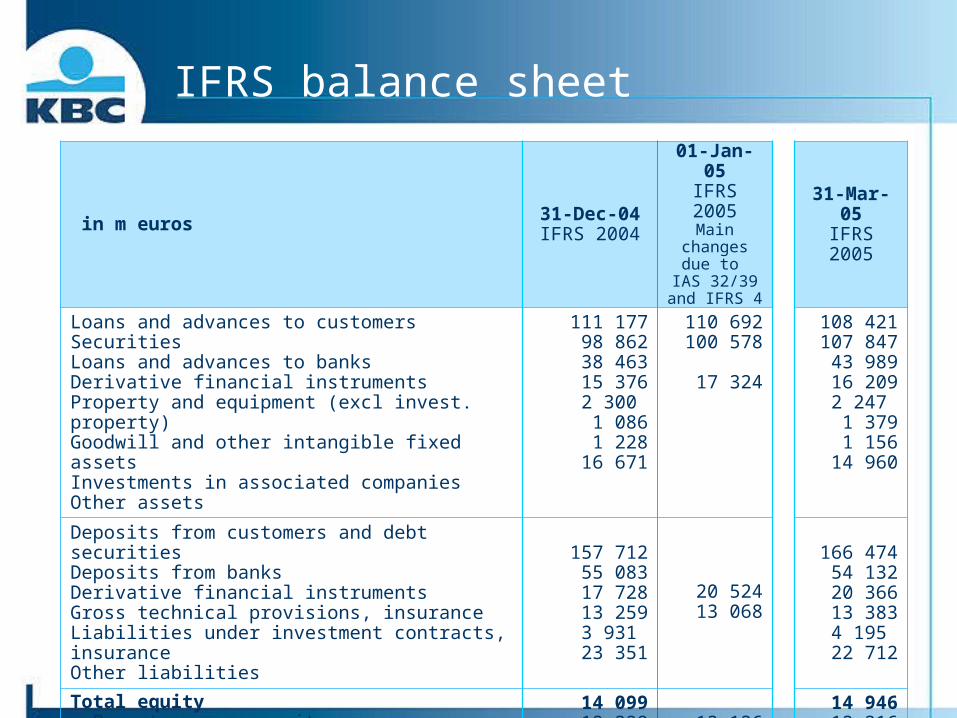
IFRS balance sheet
in m euros 31-Dec-04IFRS 2004
01-Jan-05IFRS 2005
Main changes due
to IAS 32/39
and IFRS 4
31-Mar-05IFRS 2005
Loans and advances to customersSecuritiesLoans and advances to banksDerivative financial instrumentsProperty and equipment (excl invest. property) Goodwill and other intangible fixed assetsInvestments in associated companiesOther assets
111 17798 86238 46315 3762 300 1 0861 228
16 671
110 692100 578
17 324
108 421107 847
43 98916 2092 247 1 3791 156
14 960
Deposits from customers and debt securitiesDeposits from banksDerivative financial instrumentsGross technical provisions, insuranceLiabilities under investment contracts, insuranceOther liabilities
157 71255 08317 72813 2593 931 23 351
20 52413 068
166 47454 13220 36613 3834 195 22 712
Total equity- Parent company equity- Minorities
14 09912 328
1 77113 136
14 94613 316
1 630
Balance sheet total 285 163 296 208
33
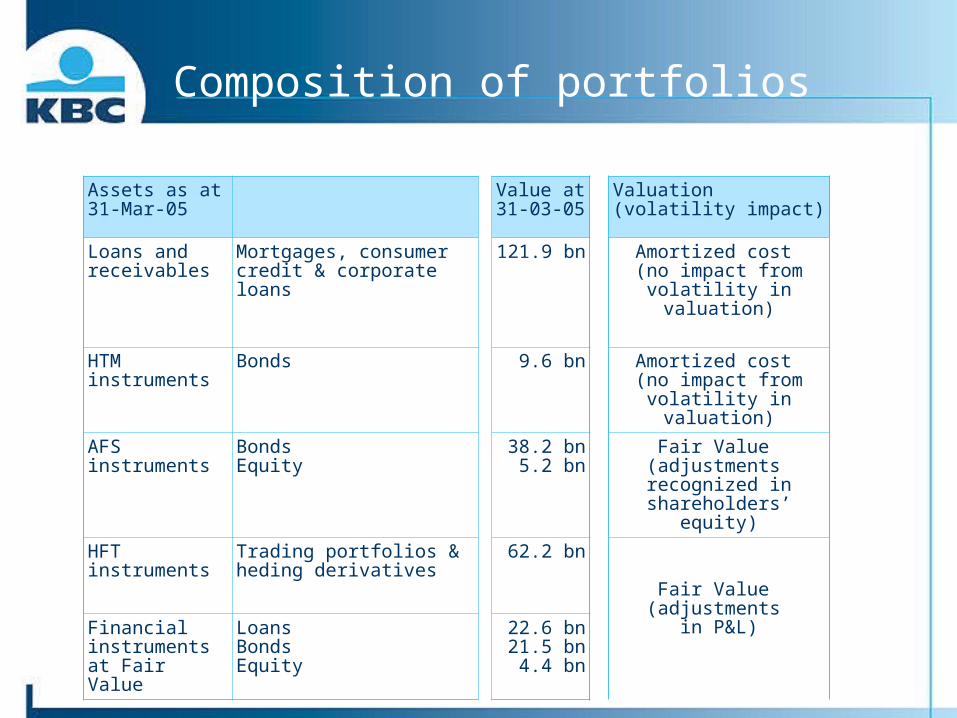
Composition of portfolios
Assets as at31-Mar-05
Value at 31-03-05
Valuation (volatility impact)
Loans and receivables
Mortgages, consumer credit & corporate loans
121.9 bn Amortized cost (no impact from volatility
in valuation)
HTMinstruments
Bonds 9.6 bn Amortized cost (no impact from volatility
in valuation)
AFS instruments
BondsEquity
38.2 bn5.2 bn
Fair Value (adjustments recognized in
shareholders’ equity)
HFT instruments Trading portfolios & heding derivatives
62.2 bn
Fair Value (adjustments
in P&L)Financial instruments at Fair Value
LoansBondsEquity
22.6 bn21.5 bn
4.4 bn

34
Number of shares
BASIC NUMBER OF SHARES (in millions)
Ordinary shares
Mandatory convertibles
Treasury shares
Basic No.of shares
Avg. quarter
Average Ytd
31/12/03 367.7 2. 6 -11.0 359. 4 - -
31/03/04 367.0 2. 6 -10.1 359.6 359.5 359.5
30/06/04 366.3 2. 6 -9.7 359.2 359.4 359.5
30/09/04 366.3 2. 6 -9.5 359.4 359.3 359.4
31/12/04 366.4 2. 6 -9. 6 359.5 359.5 359.4
31/03/05 366. 4 2. 6 -12.6 356.5 358. 0 358.0
DILUTIVE NUMBER OF SHARES (in millions)
Basic No. of shares
Stock options
Convertible bonds
Dilutive No. of shares
Avg. quarter
Average Ytd
31/12/03 359.4 6.1 5.2 370.7 - -
31/03/04 359.6 6.1 5.2 370.9 370.8 370.8
30/06/04 359.2 6.0 5.2 370.5 370.7 370.8
30/09/04 359.5 5.8 5.2 370.5 370.5 370.7
31/12/04 359.5 5.0 5.2 369.7 370.1 370.5
31/03/05 356.5 5.0 5.2 366.7 368.2 368.2
Net profit (in m EUR)
717
Basic number of shares
357 990 384
Diluted number of shares
368 187 859
Basic EPS (euros)
2.00
Diluted EPS (euros)
1.96
Foto gebouw
Financial highlights - 1Q 2005
- Group performance
- Headlines per segment
FY 2005 profit outlook
Additional information on 1Q 2005 results
2004 pro forma IFRS quarterly accounts
36
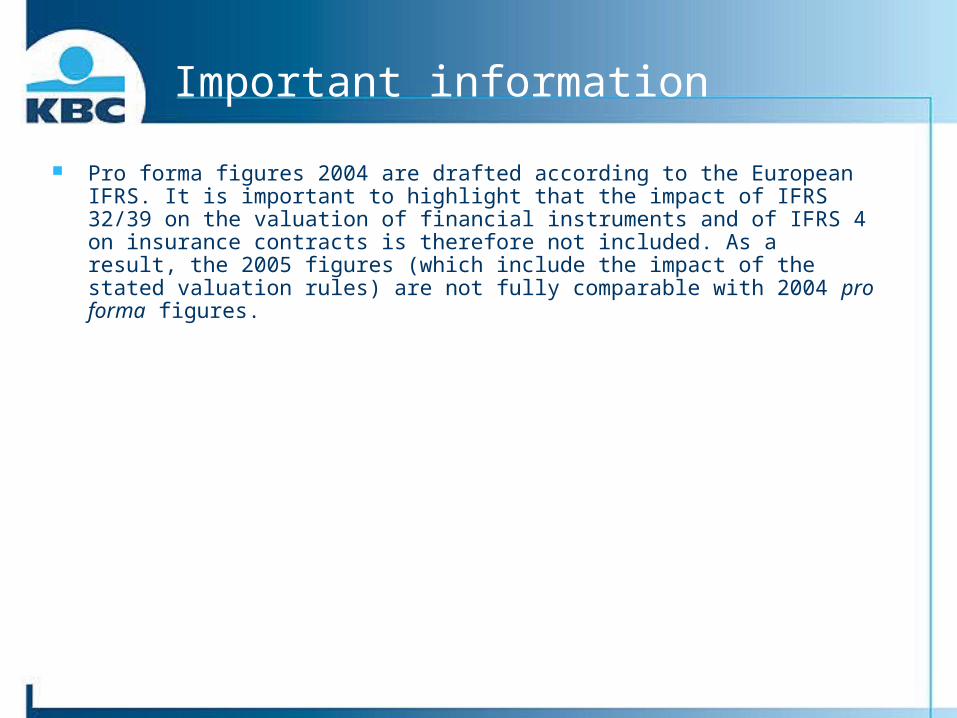
Important information
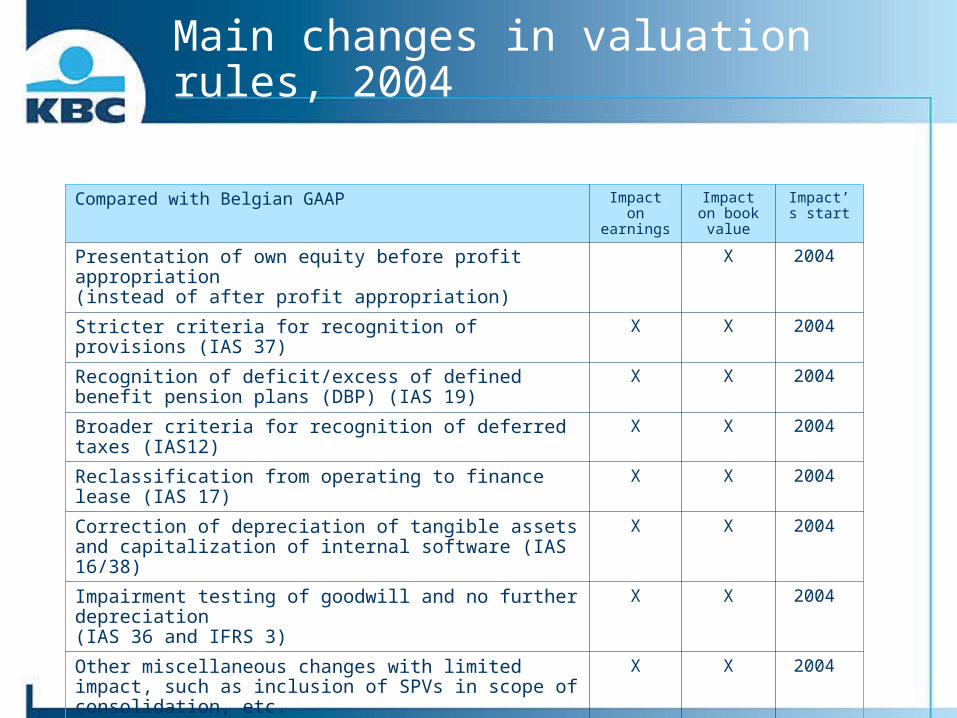
Pro forma figures 2004 are drafted according to the European IFRS. It is important to highlight that the impact of IFRS 32/39 on the valuation of financial instruments and of IFRS 4 on insurance contracts is therefore not included. As a result, the 2005 figures (which include the impact of the stated valuation rules) are not fully comparable with 2004 pro forma figures.
37
Main changes in valuation rules, 2004
Compared with Belgian GAAP Impact on earnings
Impact on book value
Impact’s start
Presentation of own equity before profit appropriation (instead of after profit appropriation)
X 2004
Stricter criteria for recognition of provisions (IAS 37) X X 2004
Recognition of deficit/excess of defined benefit pension plans (DBP) (IAS 19)
X X 2004
Broader criteria for recognition of deferred taxes (IAS12) X X 2004
Reclassification from operating to finance lease (IAS 17) X X 2004
Correction of depreciation of tangible assets and capitalization of internal software (IAS 16/38)
X X 2004
Impairment testing of goodwill and no further depreciation (IAS 36 and IFRS 3)
X X 2004
Other miscellaneous changes with limited impact, such as inclusion of SPVs in scope of consolidation, etc.
X X 2004
38
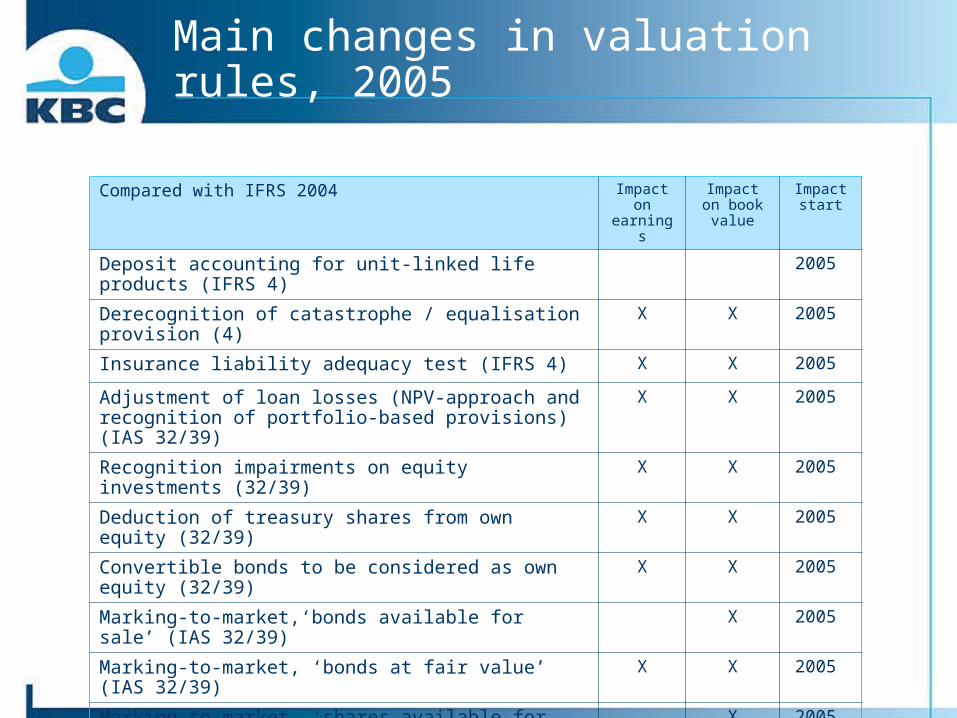
Main changes in valuation rules, 2005
Compared with IFRS 2004 Impact on earnings
Impact on book value
Impact start
Deposit accounting for unit-linked life products (IFRS 4) 2005
Derecognition of catastrophe / equalisation provision (4) X X 2005
Insurance liability adequacy test (IFRS 4) X X 2005
Adjustment of loan losses (NPV-approach and recognition of portfolio-based provisions) (IAS 32/39)
X X 2005
Recognition impairments on equity investments (32/39) X X 2005
Deduction of treasury shares from own equity (32/39) X X 2005
Convertible bonds to be considered as own equity (32/39) X X 2005
Marking-to-market,‘bonds available for sale’ (IAS 32/39) X 2005
Marking-to-market, ‘bonds at fair value’ (IAS 32/39) X X 2005
Marking-to-market, ‘shares available for sale’ (IAS 32/39) X 2005
Marking-to-market, ‘shares at fair value’ (IAS 32/39) X X 2005
Marking-to-market, derivatives not held for trading (32/39) X X 2005
39
11
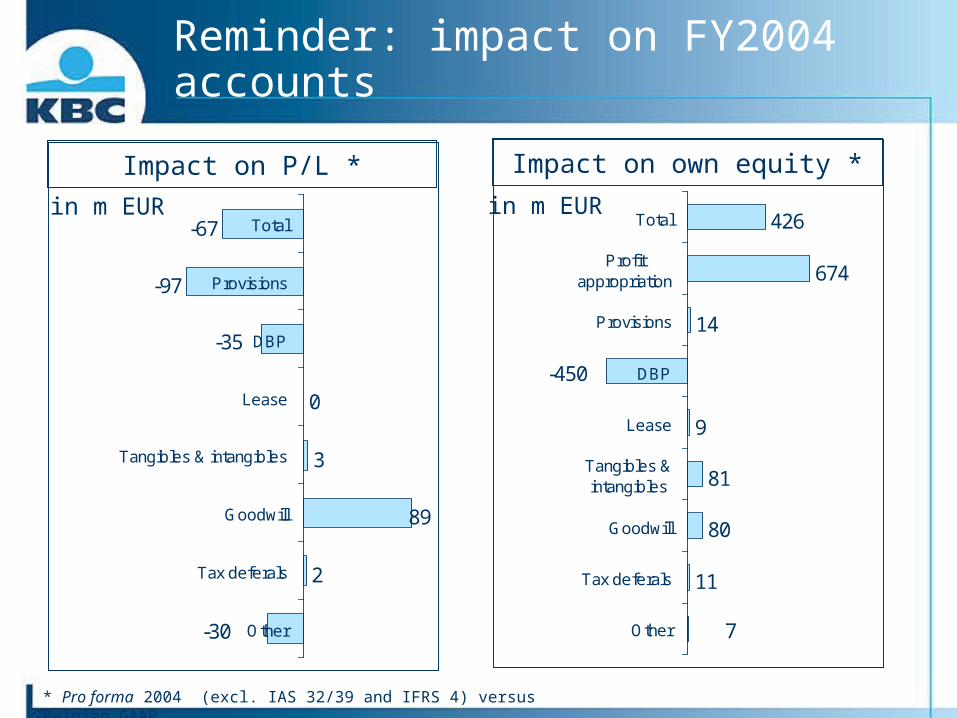
80
81
9
14
674
426
-450
7Other
Tax deferals
Goodwill
Tangibles &intangibles
Lease
DBP
Provisions
Profitappropriation
Total
2
89
3
0
-97
-67
-35
-30 Other
Tax deferals
Goodwill
Tangibles & intangibles
Lease
DBP
Provisions
Total
Reminder: impact on FY2004 accounts
Impact on own equity *Impact on P/L *
in m EUR in m EUR
* Pro forma 2004 (excl. IAS 32/39 and IFRS 4) versus Belgian GAAP
40
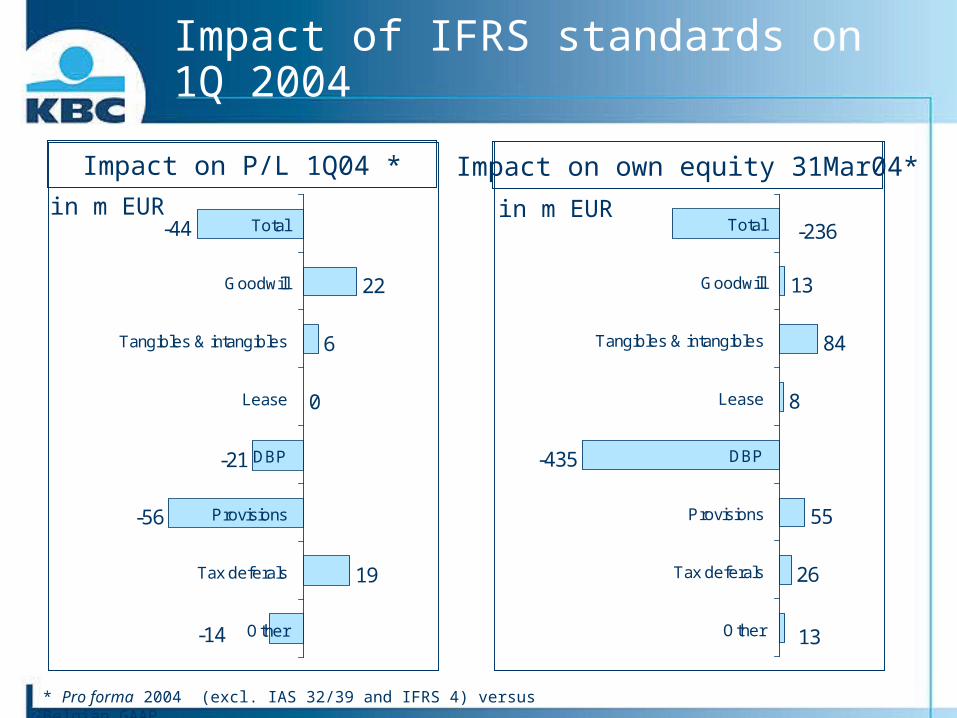
26
55
-435
8
84
13
-236
13Other
Tax deferals
Provisions
DBP
Lease
Tangibles & intangibles
Goodwill
Total
19
-56
-21
0
6
22
-44
-14 Other
Tax deferals
Provisions
DBP
Lease
Tangibles & intangibles
Goodwill
Total
Impact of IFRS standards on 1Q 2004
Impact on own equity 31Mar04*Impact on P/L 1Q04 *
in m EUR in m EUR
* Pro forma 2004 (excl. IAS 32/39 and IFRS 4) versus Belgian GAAP
41
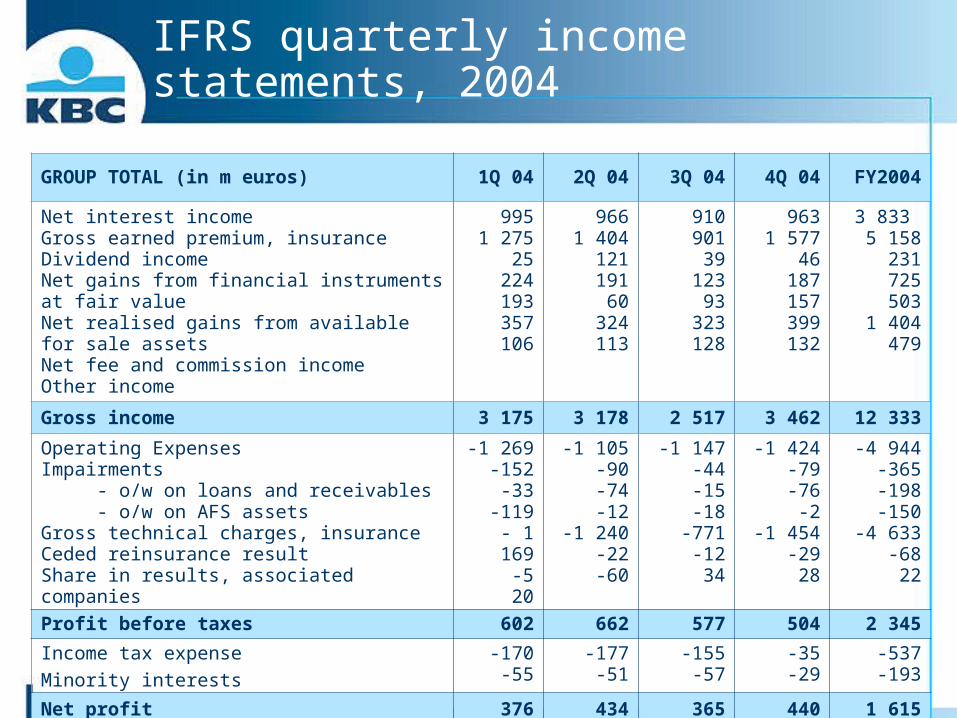
IFRS quarterly income statements, 2004
GROUP TOTAL (in m euros) 1Q 04 2Q 04 3Q 04 4Q 04 FY2004
Net interest incomeGross earned premium, insuranceDividend incomeNet gains from financial instruments at fair valueNet realised gains from available for sale assetsNet fee and commission incomeOther income
9951 275
25224193357106
9661 404
121191
60324113
910901
39123
93323128
9631 577
46187157399132
3 833 5 158
231725503
1 404479
Gross income 3 175 3 178 2 517 3 462 12 333
Operating ExpensesImpairments - o/w on loans and receivables - o/w on AFS assetsGross technical charges, insuranceCeded reinsurance resultShare in results, associated companies
-1 269-152
-33-119
- 1 169-520
-1 105-90-74-12
-1 240-22-60
-1 147-44-15-18
-771-1234
-1 424-79-76
-2-1 454
-2928
-4 944-365-198-150
-4 633-6822
Profit before taxes 602 662 577 504 2 345
Income tax expense
Minority interests
-170-55
-177-51
-155-57
-35-29
-537-193
Net profit 376 434 365 440 1 615

42
Banking - I/S details, 2004
BANKING SEGMENT (in m euros) 1Q 04 2Q 04 3Q 04 4Q 04 FY2004
Net interest incomeGross earned premium, insuranceDividend incomeNet gains from financial instruments at fair valueNet realised gains from available for sale assetsNet fee and commission incomeOther income
8360
13220116274
52
8250
41177
60226
71
7870
258556
23752
8050
23150
76305
68
3 253 0
103632307
1 042243
Gross income 1 511 1 400 1 241 1 428 5 581
Operating ExpensesImpairments - o/w on loans and receivables - o/w on AFS assetsGross technical charges, insuranceCeded reinsurance resultShare in results, associated companies
-989-39-42
300
10
-816-72-77
5003
-848-28-14
000
19
-993-80-65-15
003
-3 646-220-199
-700
35
Profit before taxes 493 516 383 358 1 750
Income tax expense
Minority interests
-117-44
-108-41
-93-45
-3-38
-320-167
Net profit 332 367 246 318 1 263
43
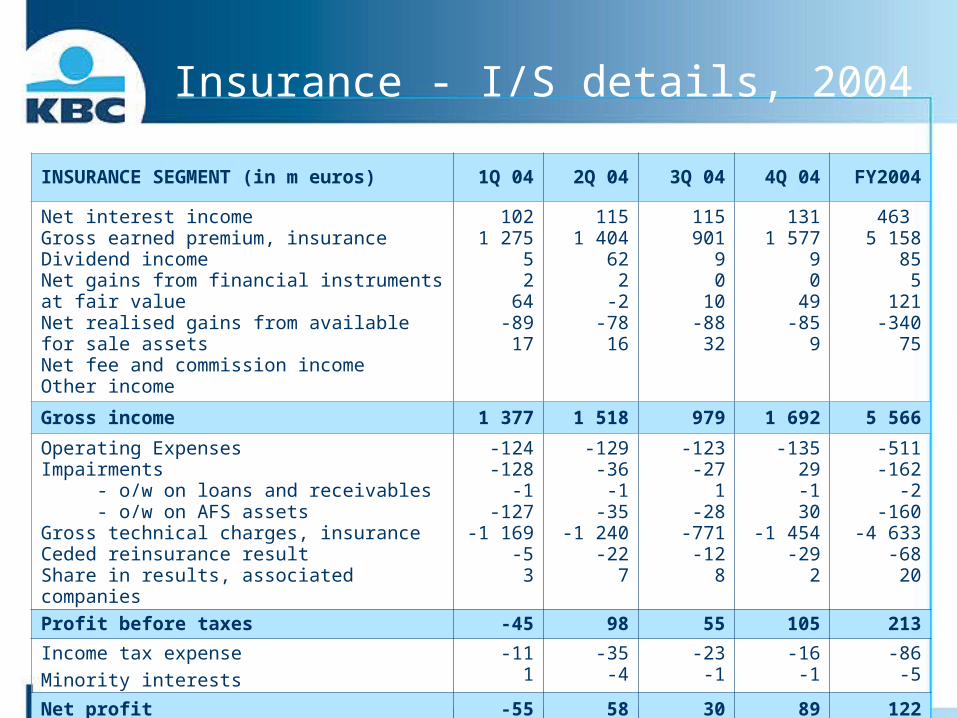
Insurance - I/S details, 2004
INSURANCE SEGMENT (in m euros) 1Q 04 2Q 04 3Q 04 4Q 04 FY2004
Net interest incomeGross earned premium, insuranceDividend incomeNet gains from financial instruments at fair valueNet realised gains from available for sale assetsNet fee and commission incomeOther income
1021 275
52
64-8917
1151 404
622
-2-7816
115901
90
10-8832
1311 577
90
49-85
9
463 5 158
855
121-340
75
Gross income 1 377 1 518 979 1 692 5 566
Operating ExpensesImpairments - o/w on loans and receivables - o/w on AFS assetsGross technical charges, insuranceCeded reinsurance resultShare in results, associated companies
-124-128
-1-127
-1 169-53
-129-36
-1-35
-1 240-22
7
-123-27
1-28
-771-12
8
-13529-130
-1 454-29
2
-511-162
-2-160
-4 633-6820
Profit before taxes -45 98 55 105 213
Income tax expense
Minority interests
-111
-35-4
-23-1
-16-1
-86-5
Net profit -55 58 30 89 122
44
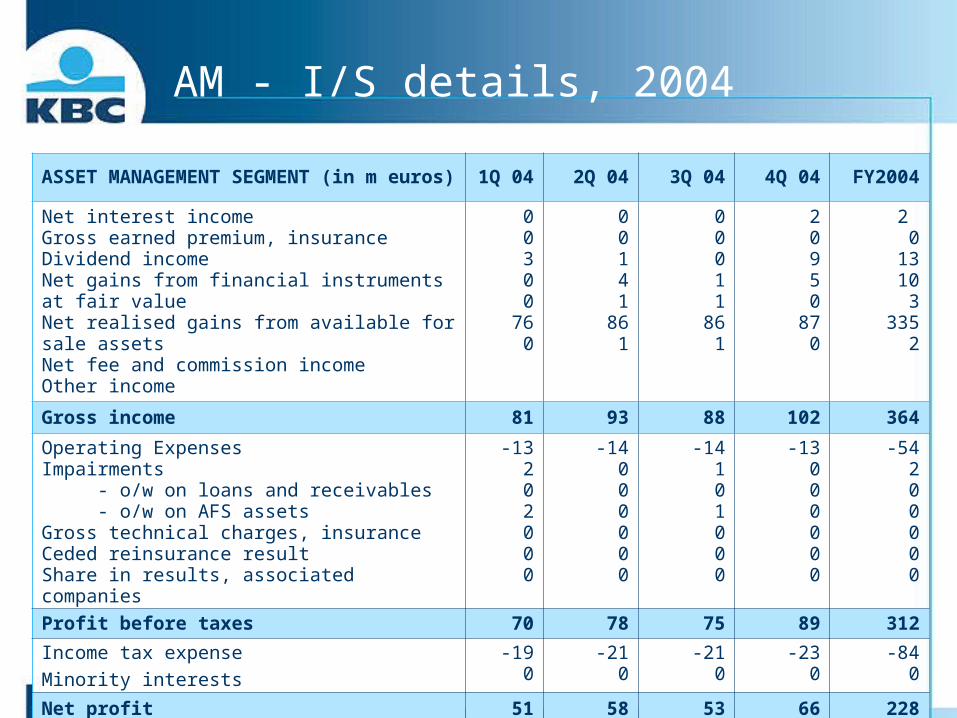
AM - I/S details, 2004
ASSET MANAGEMENT SEGMENT (in m euros) 1Q 04 2Q 04 3Q 04 4Q 04 FY2004
Net interest incomeGross earned premium, insuranceDividend incomeNet gains from financial instruments at fair valueNet realised gains from available for sale assetsNet fee and commission incomeOther income
00300
760
00141
861
00011
861
20950
870
2 0
1310
3335
2
Gross income 81 93 88 102 364
Operating ExpensesImpairments - o/w on loans and receivables - o/w on AFS assetsGross technical charges, insuranceCeded reinsurance resultShare in results, associated companies
-13202000
-14000000
-14101000
-13000000
-54200000
Profit before taxes 70 78 75 89 312
Income tax expense
Minority interests
-190
-210
-210
-230
-840
Net profit 51 58 53 66 228
45
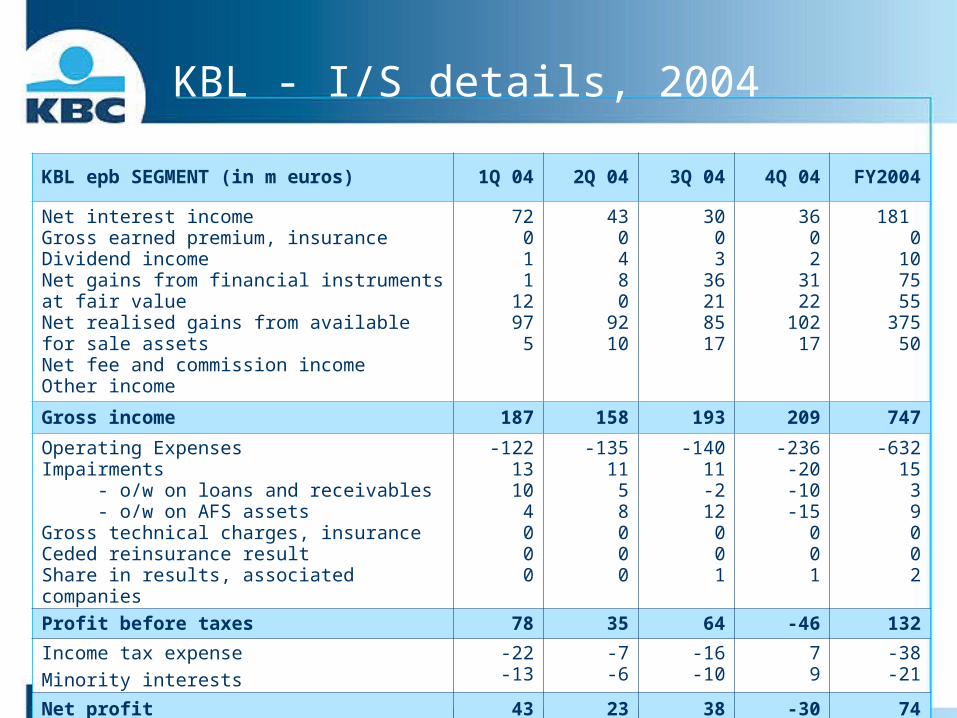
KBL - I/S details, 2004
KBL epb SEGMENT (in m euros) 1Q 04 2Q 04 3Q 04 4Q 04 FY2004
Net interest incomeGross earned premium, insuranceDividend incomeNet gains from financial instruments at fair valueNet realised gains from available for sale assetsNet fee and commission incomeOther income
72011
1297
5
430480
9210
3003
36218517
3602
3122
10217
181 0
107555
37550
Gross income 187 158 193 209 747
Operating ExpensesImpairments - o/w on loans and receivables - o/w on AFS assetsGross technical charges, insuranceCeded reinsurance resultShare in results, associated companies
-1221310
4000
-13511
58000
-14011-212
001
-236-20-10-15
001
-63215
39002
Profit before taxes 78 35 64 -46 132
Income tax expense
Minority interests
-22-13
-7-6
-16-10
79
-38-21
Net profit 43 23 38 -30 74
46
Gevaert - I/S details, 2004
GEVAERT SEGMENT (in m euros) 1Q 04 2Q 04 3Q 04 4Q 04 FY2004
Net interest incomeGross earned premium, insuranceDividend incomeNet gains from financial instruments at fair valueNet realised gains from available for sale assetsNet fee and commission incomeOther income
-500110
34
-503010
18
-502040
33
-400290
36
-19053
150
121
Gross income 32 17 33 43 126
Operating ExpensesImpairments - o/w on loans and receivables - o/w on AFS assetsGross technical charges, insuranceCeded reinsurance resultShare in results, associated companies
-21000007
-1870
1000
-69
-2700
-3006
-37-50100
21
-10320800
-35
Profit before taxes 18 -63 13 22 -10
Income tax expense
Minority interests
00
-20
-10
20
-20
Net profit 17 -65 12 25 -12
47
Holding Co - I/S details, 2004
HOLDING CO SEGMENT (in m euros) 1Q 04 2Q 04 3Q 04 4Q 04 FY2004
Net interest incomeGross earned premium, insuranceDividend incomeNet gains from financial instruments at fair valueNet realised gains from available for sale assetsNet fee and commission incomeOther income
-1402200
117
-140
10000
121
-1400010
108
-1302000
123
-550
15010
469
Gross income 105 117 96 113 430
Operating ExpensesImpairments - o/w on loans and receivables - o/w on AFS assetsGross technical charges, insuranceCeded reinsurance resultShare in results, associated companies
-117100000
-118000000
-109000000
-135-30
-3000
-479-30
-3000
Profit before taxes -13 -2 -13 -25 -52
Income tax expense
Minority interests
00
00
-10
-20
-80
Net profit -12 -7 -13 -27 -59
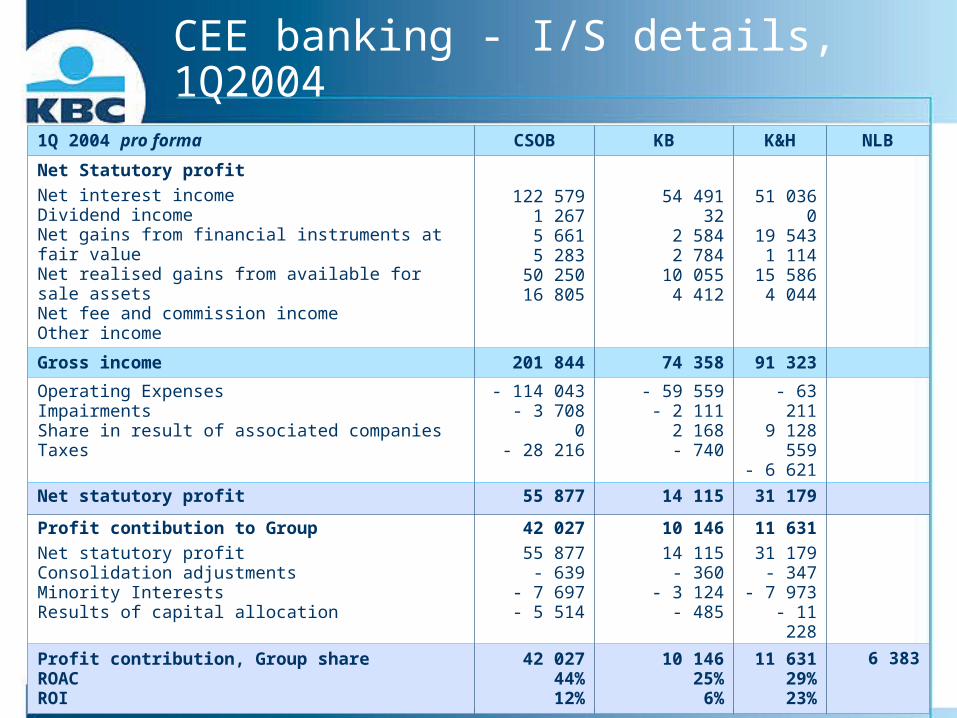
48
CEE banking - I/S details, 1Q20041Q 2004 pro forma CSOB KB K&H NLB
Net Statutory profit
Net interest incomeDividend incomeNet gains from financial instruments at fair valueNet realised gains from available for sale assetsNet fee and commission incomeOther income
122 5791 2675 6615 283
50 25016 805
54 49132
2 5842 784
10 0554 412
51 0360
19 5431 114
15 5864 044
Gross income 201 844 74 358 91 323
Operating ExpensesImpairmentsShare in result of associated companiesTaxes
- 114 043- 3 708
0- 28 216
- 59 559- 2 111
2 168- 740
- 63 2119 128
559- 6 621
Net statutory profit 55 877 14 115 31 179
Profit contibution to Group
Net statutory profitConsolidation adjustmentsMinority InterestsResults of capital allocation
42 027
55 877- 639
- 7 697- 5 514
10 146
14 115- 360
- 3 124- 485
11 631
31 179- 347
- 7 973- 11 228
Profit contribution, Group shareROACROI
42 02744%12%
10 14625%6%
11 63129%23%
6 383