Embed Size (px)
Citation preview

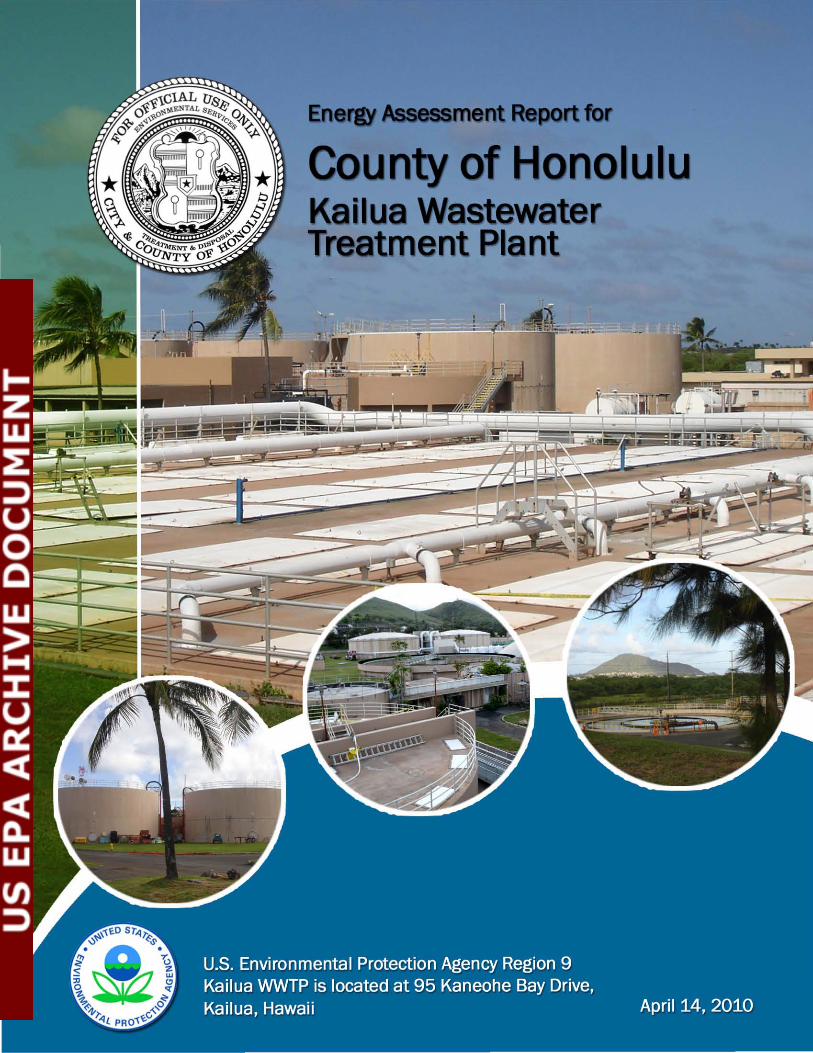
for
County of Honolulu Kailua Wastewater Treatment Plant
1
Section 1. Executive Summary
County of Honolulu and Kailua WWTP
SECTION 1 Executive Summary
Under contract to USEPA, Tetra Tech, Inc., (Tetra Tech) performed a site energy assessment of the Kailua Wastewater Treatment Plant (WWTP) facility. The facility is located on the island of Oahu at 95 Kaneohe Bay Drive, Kailua, Hawaii. Representatives from the Kailua WWTP provided access to the facility and they also provided valuable information and data on the Wastewater Plant operations including site energy use, equipment, systems, and operations.
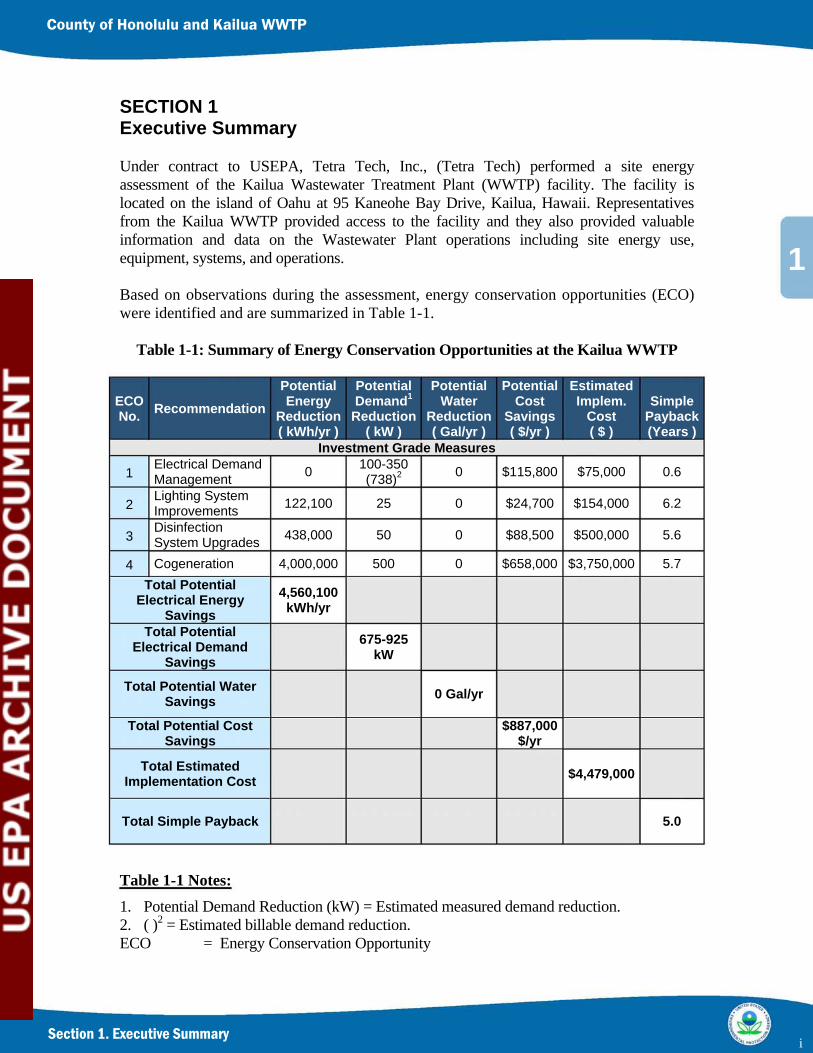
Based on observations during the assessment, energy conservation opportunities (ECO) were identified and are summarized in Table 1-1.
Table 1-1: Summary of Energy Conservation Opportunities at the Kailua WWTP
Potential Potential Potential Potential Estimated ECO Energy Demand1 Water Cost Implem. SimpleRecommendation No. Reduction Reduction Reduction Savings Cost Payback
( kWh/yr ) ( kW ) ( Gal/yr ) ( $/yr ) ( $ ) (Years ) Investment Grade Measures
Electrical Demand 100-3501 0 0 $115,800 $75,000 0.6Management (738)2
Lighting System 2 122,100 25 0 $24,700 $154,000 6.2Improvements Disinfection 3 438,000 50 0 $88,500 $500,000 5.6System Upgrades
4 Cogeneration 4,000,000 500 0 $658,000 $3,750,000 5.7 Total Potential 4,560,100 Electrical Energy kWh/yr Savings Total Potential 675-925Electrical Demand kWSavings
Total Potential Water 0 Gal/yr Savings
Total Potential Cost $887,000 Savings $/yr
Total Estimated $4,479,000 Implementation Cost
Total Simple Payback 5.0
Table 1-1 Notes: 1. Potential Demand Reduction (kW) = Estimated measured demand reduction. 2. ( )2 = Estimated billable demand reduction. ECO = Energy Conservation Opportunity
i

1
Section 1. Executive Summary
County of Honolulu and Kailua WWTP
kWh/yr = Kilowatt-hours per year kW = Kilowatts Gal/yr = Gallons per year $/yr = Dollars per year
ECO No. 1. Install on site electrical metering to continuously monitor the site’s electrical demand loads and energy use. This will provide operators with the information necessary to proactively manage the site’s energy use and reduce 15-minute interval demand peaks.
ECO No. 2. Replace current lighting technologies with higher efficiency lighting technologies.
ECO No. 3. Install a new, more efficient Ultra Violet (UV) disinfection system in addition to providing hydraulic overflow protection and automatic process controls.
ECO No. 4. Conduct a cogeneration feasibility study and implement the recommendations.
ii
Table of Contents
County of Honolulu and Kailua WWTP
TABLE OF CONTENTS
SECTION 1 - Executive Summary ............................................................................................ i
Table of Contents ..................................................................................................................... iii SECTION 2 - Introduction .........................................................................................................1
SECTION 3 – Wastewater Treatment Plant Description .........................................................2
SECTION 4 - Utility Analysis ...................................................................................................9
SECTION 5 - Energy Conservation Opportunities (ECO) ................................................... 19
ECO-1: Electrical Demand Management.......................................................................... 19
ECO-2: Lighting System Improvements ........................................................................... 26
ECO-3: Disinfection System Upgrades............................................................................. 30
ECO-4: Cogeneration ......................................................................................................... 33
SECTION 6 - Sustainable Energy Opportunities ................................................................... 36
SECTION 7 - Additional ECO Considerations...................................................................... 38
iii

2
Section 2. Introduction
County of Honolulu and Kailua WWTP
SECTION 2 Introduction
In 2009, Congress passed the American Recovery and Reinvestment Act (ARRA) which contains funding for Environmental Protection Agency (EPA) Region 9 States (AZ, CA, HI, NV), federally recognized Tribes, and Island Territories (America Samoa, Commonwealth of the Northern Marianas Islands, Guam) (States) to construct water infrastructure. ARRA promotes sustainable water infrastructure practices by requiring 20% of the funding to be directed to energy efficiency, water efficiency, green infrastructure, and/or other innovative environmental projects through the Green Project Reserve (GPR). GPR projects are identified on each State’s Intended Use Plan, workplan, or Interagency Agreement developed specifically for the funding received under ARRA.
This report was prepared by Tetra Tech in support of EPA Region 9 Water Division in implementing the GPR requirements of ARRA. Mr. Donald King and Ms. Kim Williams conducted the field audits, analyzed site data and drafted the following report under project manager, Victor D’Amato. The EPA Region 9 provided for the Energy Assessments at four Wastewater Treatment Plants (WWTP) on the islands of Hawaii. Those sites selected for evaluation included: • Hilo WWTP – located on the island of Hawaii. • Kailua WWTP – located on the island of Oahu. • Kihei WWTP – located on the island of Maui. • Kailua WWTP – located on the island of Kauai.
1
3
Section 3. Wastewater Treatment Plant Description
County of Honolulu and Kailua WWTP
KAUAI
OAHU
~~AUI ,;:>
SECTION 3 Wastewater Treatment Plant Description
Location
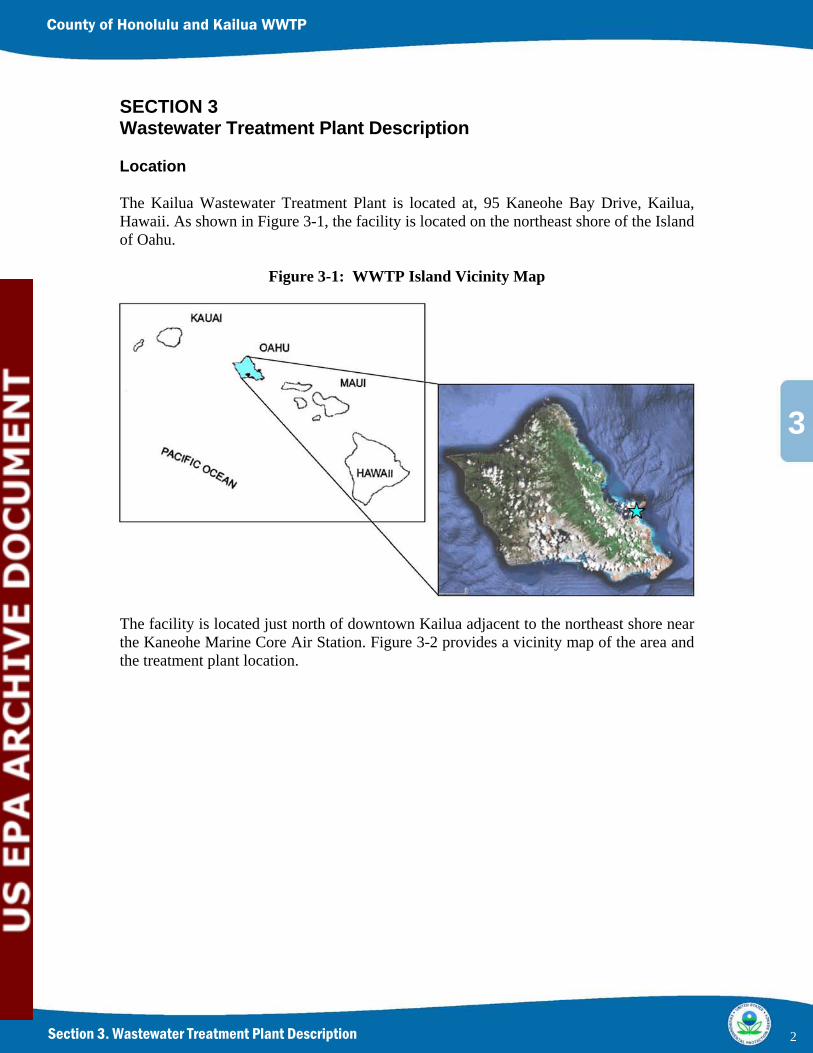
The Kailua Wastewater Treatment Plant is located at, 95 Kaneohe Bay Drive, Kailua, Hawaii. As shown in Figure 3-1, the facility is located on the northeast shore of the Island of Oahu.
Figure 3-1: WWTP Island Vicinity Map
The facility is located just north of downtown Kailua adjacent to the northeast shore near the Kaneohe Marine Core Air Station. Figure 3-2 provides a vicinity map of the area and the treatment plant location.
2
3
Section 3. Wastewater Treatment Plant Description
County of Honolulu and Kailua WWTP
~b #
<-" Kaneohe
KIM'Oho OIslr"'F'rk
f!ID ® StateH"'Y 65
v ... oJ.J...,~ b
11 mi II 2 1m
./ Kaneohe Station
~ ~
'h)~.
rw
l" I KlIWlIinul
Marine Corps Base Hawaii · t<aneohO Bay
I ,/
.$
'\\ ~
Ka a
1/P«' 02009 Google • Mep dele CI2OO9 Google
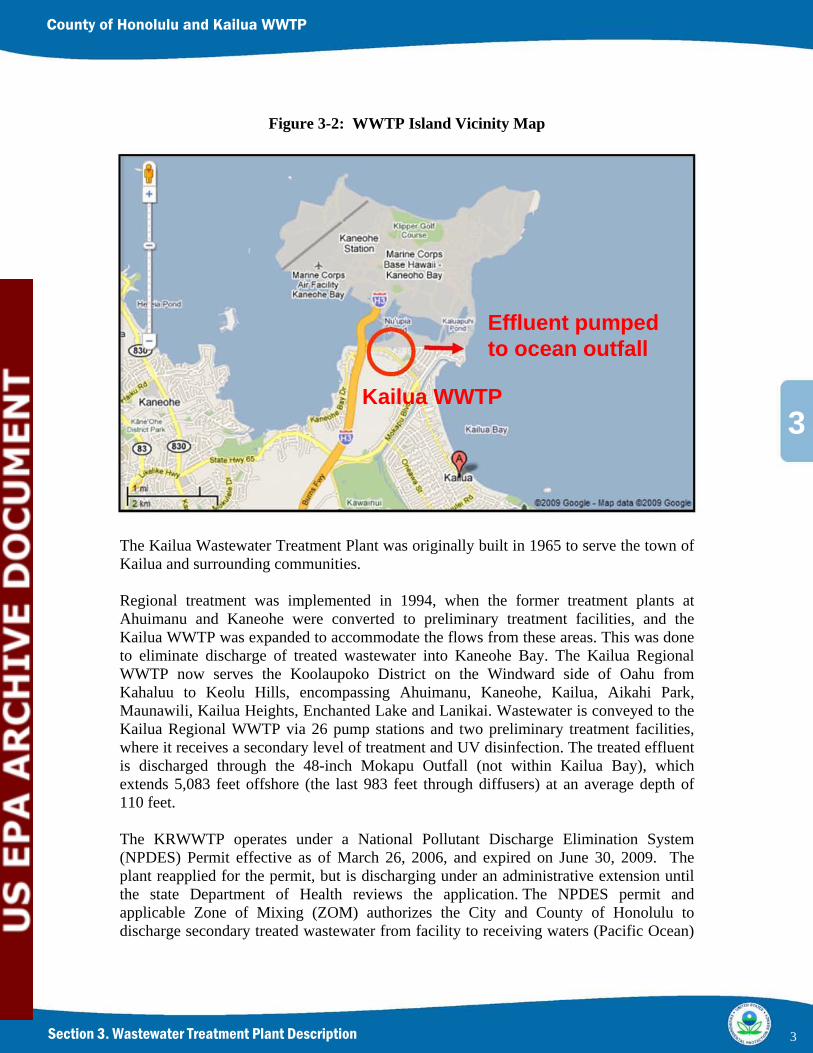
Figure 3-2: WWTP Island Vicinity Map
Effluent pumped to ocean outfall
Kailua WWTP
The Kailua Wastewater Treatment Plant was originally built in 1965 to serve the town of Kailua and surrounding communities.
Regional treatment was implemented in 1994, when the former treatment plants at Ahuimanu and Kaneohe were converted to preliminary treatment facilities, and the Kailua WWTP was expanded to accommodate the flows from these areas. This was done to eliminate discharge of treated wastewater into Kaneohe Bay. The Kailua Regional WWTP now serves the Koolaupoko District on the Windward side of Oahu from Kahaluu to Keolu Hills, encompassing Ahuimanu, Kaneohe, Kailua, Aikahi Park, Maunawili, Kailua Heights, Enchanted Lake and Lanikai. Wastewater is conveyed to the Kailua Regional WWTP via 26 pump stations and two preliminary treatment facilities, where it receives a secondary level of treatment and UV disinfection. The treated effluent is discharged through the 48-inch Mokapu Outfall (not within Kailua Bay), which extends 5,083 feet offshore (the last 983 feet through diffusers) at an average depth of 110 feet.
The KRWWTP operates under a National Pollutant Discharge Elimination System (NPDES) Permit effective as of March 26, 2006, and expired on June 30, 2009. The plant reapplied for the permit, but is discharging under an administrative extension until the state Department of Health reviews the application. The NPDES permit and applicable Zone of Mixing (ZOM) authorizes the City and County of Honolulu to discharge secondary treated wastewater from facility to receiving waters (Pacific Ocean)
3
3
Section 3. Wastewater Treatment Plant Description
County of Honolulu and Kailua WWTP
east of the Mokapu Peninsula through its deep ocean outfall in accordance with the effluent limitations, monitoring requirements and other permit conditions. The discharge permit requirements are to maintain less than 30 mg/l biochemical oxygen demand, (BOD) and less than 30 mg/L total suspended solids (TSS). The plant is operating on a waiver to allow non-disinfection. In early 2009, the UV disinfection system was flooded resulting in electrical short circuiting and major equipment failure. The C&CH is currently evaluating the upgrade and retrofit of the UV system with structural modifications to prevent flooding.
The service area sewage is collected and conveyed to the WWTP via a series of gravity systems and pump stations.
WWTP Operating Schedule
The plant maintains a staff of approximately 20 full-time operators and maintenance staff during the week. Daily operations typically run between the hours of 7:00 a.m. and 3:30 p.m. and afternoon and night shifts are covered by reduced staff. Dewatering operations (centrifuge) occur 3 to 4 times a week for a 5 hour period during day shift only.
WWTP Process- Overview
The treatment plant has a design capacity of 15.0 million gallons per day (MGD) monthly average with a peak hourly maximum of 30.0 MGD. Currently, the facility is operating at 12.0 MGD.
Kailua Regional WWTP uses primary and secondary treatment processes to produce a clarified effluent with low concentrations of suspended solids (SS) and BOD. The discharge permit requirements are to maintain less than 30 mg/l BOD and less than 30 mg/L total suspended solids (TSS).
Wastewater is conveyed to the KRWWTP through a series of pump stations and gravity mains. Raw sewage enters the plant at the IPS headworks. The headworks consists of two mechanically-cleaned bar screens that remove large particles such as rags and rocks that may damage downstream equipment. The screenings are collected in a hopper and trucked to a landfill for disposal. After screening the flow is conveyed to the influent Pump Station (IPS). The IPS contains four pumps and two wet wells. All four pumps are equipped with VFD’s and the pumping rates are controlled by wet well level. The pumps lift the incoming wastewater to the primary treatment facility headworks. The wastewater then flows by gravity through the PTF to the bio-tower pump station. The influent pump station is critical in moving the in coming wastewater through the plant and equipped with diesel fueled internal combustion engine driven emergency generators.
Primary treatment facility (PTF) consists of physical processes and removed most of the influent SS and some of the incoming BOD. The PTF consists of influent screening, influent pumping, coarse screening, girt removal and clarification
4

3
Section 3. Wastewater Treatment Plant Description
County of Honolulu and Kailua WWTP
Secondary treatment consists of physical and biological systems. The main purpose of the secondary treatment is to remove most of the BOD exiting the primary treatment, although secondary treatment also removes a portion of the SS in the primary effluent. The secondary process used at KRWWTP is the trickling filter-solids contactor (TF/SC) process. The units that compromise the secondary treatment are the Biotower Pump Station (BPS), two bio-towers, two solids contactors, two solids re-aerators and three secondary clarifiers.
The BPS is equipped with a VDF drive pumps which circulate the wastewater through the bio-towers. Each bio-tower is equipped with fresh air fans to provide oxygen to the bio-mass. A portion of the bio-mass will slough off and is carried downstream to the solids contactor for further treatment. The secondary clarifiers allow a final settling process to occur and the settled solids are conveyed to the sludge processing area.
After the secondary clarification, the effluent flows via gravity through the Ultra Violet (UV) disinfection process. The UV process was flooded and subsequently has been out of service awaiting re-design and upgrade.
Effluent from the WWTP and the Kaneohe Marine Corp Base WWTP enters the Effluent Pump Station (EPS). The two flow streams mix within the EPS and seven variable-speed vertical turbine pumps pump the effluent to the Mokapu Ocean Outfall for disposal. The seven pumps are equipped with a combination of 4 electrical drives and three internal combustion engines. The mix of drives provides an enhanced level of reliability in the event electrical service is interrupted. The final effluent must be pumped due to the depth and distance of the outfall in relation to the treatment plant.
Sludge is generated by primary and secondary treatment, and this sludge must be treated before disposal. Sludge treatment involves reducing the volume of sludge and deactivating pathogens, microorganisms that cause disease, present in the sludge.
The facility is equipped with sludge thickening using a dissolved air floatation (DAF) process to reduce the percent of water prior to digestion. Four anaerobic digesters reduce and stabilize the sludge while maintaining 100ºF. The volatilization process generates digester gas with a heat content of between 500 and 600 BTUs. The digester gas is used to heat the incoming solids and maintain the digester temperature of 100º F. Waste heat boilers use the digester gas and the excess digester gas flared. Supplemental fuel oil is provided to the boilers in the event of insufficient digester gas production.
Digested sludge is pumped to the centrifuge building for dewatering. The centrifuges dewater the sludge, producing sludge cake and centrate. The sludge cake is transferred to trucks and hauled to a sanitary landfill. The centrate (i.e. liquid from the dewatering process) is recycled back to the IPS for reprocessing.
Foul odors enter the treatment plant through the wastewater collection system and are also generated at the various unit operations throughout the plant. Comprehensive odor control systems have been installed at the WWTP and a 25-million dollar odor control
5
3
Section 3. Wastewater Treatment Plant Description
County of Honolulu and Kailua WWTP
111111111111111
~-- -' - -'" ,-----1
improvement project is planned for the near future. The new odor control will provide a biological treatment system(s).
The WWTP is equipped with five electrical feeds into the plant and extensive influent and effluent pumping requirements.
Recently, several energy and electrical service assessment studies have been completed for the KRWTPP including a cogeneration feasibility study and an electrical service and reliability study.
WWTP Process
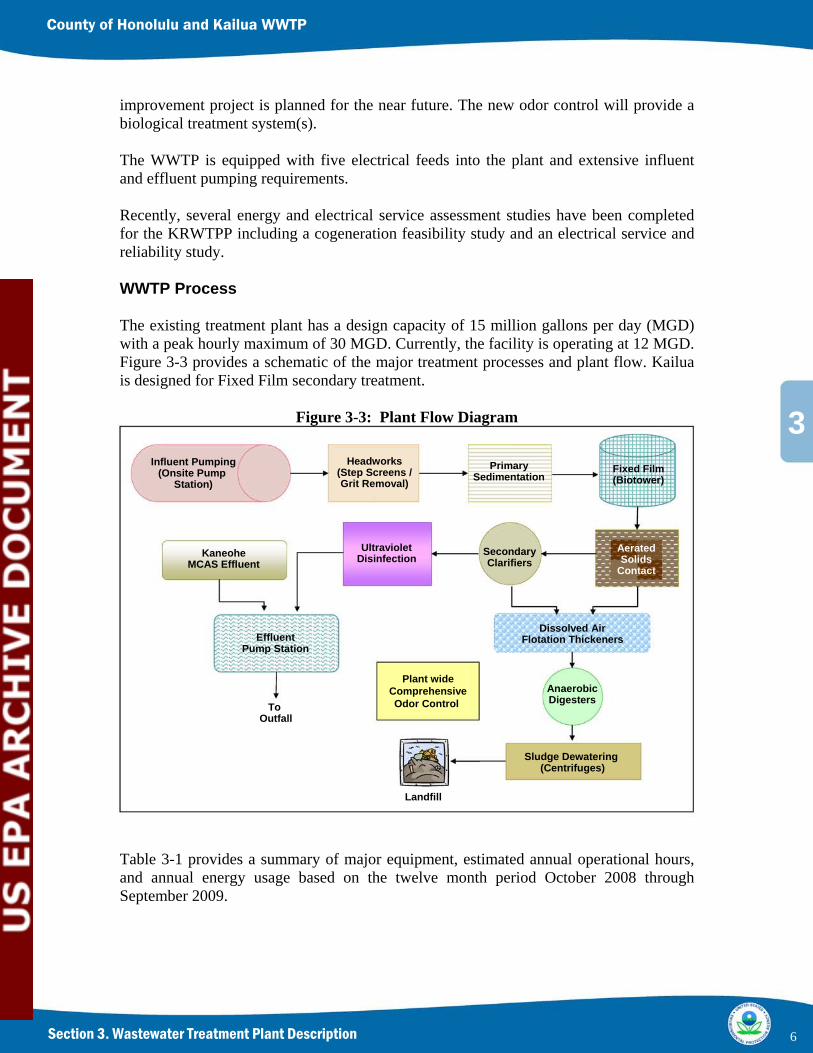
The existing treatment plant has a design capacity of 15 million gallons per day (MGD) with a peak hourly maximum of 30 MGD. Currently, the facility is operating at 12 MGD. Figure 3-3 provides a schematic of the major treatment processes and plant flow. Kailua is designed for Fixed Film secondary treatment.
Figure 3-3: Plant Flow Diagram
Influent Pumping Headworks Primary Fixed Film (Onsite Pump (Step Screens / Sedimentation (Biotower) Station) Grit Removal)
Ultraviolet Aerated Kaneohe SecondaryDisinfection Solids MCAS Effluent Clarifiers Contact
Dissolved Air Effluent Flotation Thickeners
Pump Station
Plant wide
To Comprehensive Odor Control
Anaerobic Digesters
Outfall
Sludge Dewatering (Centrifuges)
Landfill
Table 3-1 provides a summary of major equipment, estimated annual operational hours, and annual energy usage based on the twelve month period October 2008 through September 2009.
6
3
Section 3. Wastewater Treatment Plant Description
County of Honolulu and Kailua WWTP
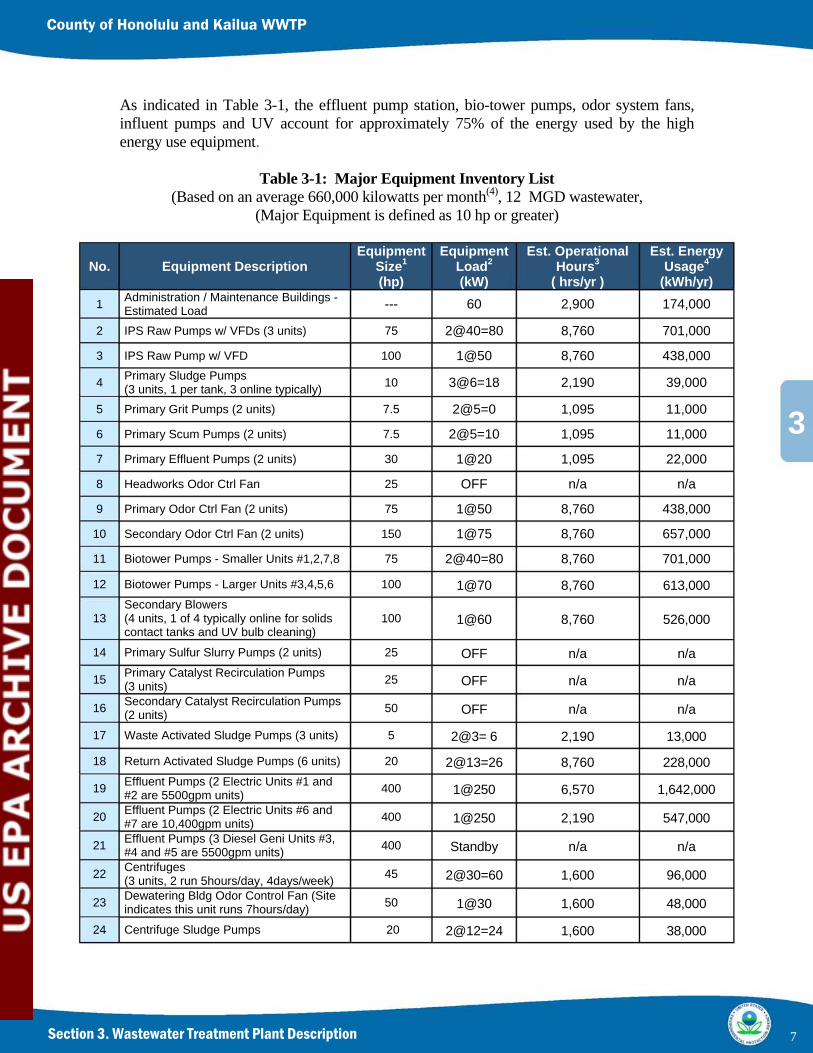
As indicated in Table 3-1, the effluent pump station, bio-tower pumps, odor system fans, influent pumps and UV account for approximately 75% of the energy used by the high energy use equipment.
Table 3-1: Major Equipment Inventory List (Based on an average 660,000 kilowatts per month(4), 12 MGD wastewater,
(Major Equipment is defined as 10 hp or greater)
Equipment Equipment Est. Operational Est. Energy No. Equipment Description Size1 Load2 Hours3 Usage4
(hp) (kW) ( hrs/yr ) (kWh/yr) Administration / Maintenance Buildings - 1 --- 60 2,900 174,000 Estimated Load
2 IPS Raw Pumps w/ VFDs (3 units) 75 2@40=80 8,760 701,000
3 IPS Raw Pump w/ VFD 100 1@50 8,760 438,000 Primary Sludge Pumps 4 10 3@6=18 2,190 39,000(3 units, 1 per tank, 3 online typically)
5 Primary Grit Pumps (2 units) 7.5 2@5=0 1,095 11,000
6 Primary Scum Pumps (2 units) 7.5 2@5=10 1,095 11,000
7 Primary Effluent Pumps (2 units) 30 1@20 1,095 22,000
8 Headworks Odor Ctrl Fan 25 OFF n/a n/a
9 Primary Odor Ctrl Fan (2 units) 75 1@50 8,760 438,000
10 Secondary Odor Ctrl Fan (2 units) 150 1@75 8,760 657,000
11 Biotower Pumps - Smaller Units #1,2,7,8 75 2@40=80 8,760 701,000
12 Biotower Pumps - Larger Units #3,4,5,6 100 1@70 8,760 613,000 Secondary Blowers
13 (4 units, 1 of 4 typically online for solids 100 1@60 8,760 526,000 contact tanks and UV bulb cleaning)
14 Primary Sulfur Slurry Pumps (2 units) 25 OFF n/a n/a Primary Catalyst Recirculation Pumps 15 25 OFF n/a n/a(3 units) Secondary Catalyst Recirculation Pumps 16 50 OFF n/a n/a(2 units)
17 Waste Activated Sludge Pumps (3 units) 5 2@3= 6 2,190 13,000
18 Return Activated Sludge Pumps (6 units) 20 2@13=26 8,760 228,000 Effluent Pumps (2 Electric Units #1 and 19 400 1@250 6,570 1,642,000#2 are 5500gpm units) Effluent Pumps (2 Electric Units #6 and 20 400 1@250 2,190 547,000#7 are 10,400gpm units) Effluent Pumps (3 Diesel Geni Units #3, 21 400 Standby n/a n/a #4 and #5 are 5500gpm units) Centrifuges 22 45 2@30=60 1,600 96,000(3 units, 2 run 5hours/day, 4days/week) Dewatering Bldg Odor Control Fan (Site 23 50 1@30 1,600 48,000indicates this unit runs 7hours/day)
24 Centrifuge Sludge Pumps 20 2@12=24 1,600 38,000
7
3
Section 3. Wastewater Treatment Plant Description
County of Honolulu and Kailua WWTP
Equipment Equipment Est. Operational Est. Energy No. Equipment Description Size1 Load2 Hours3 Usage4
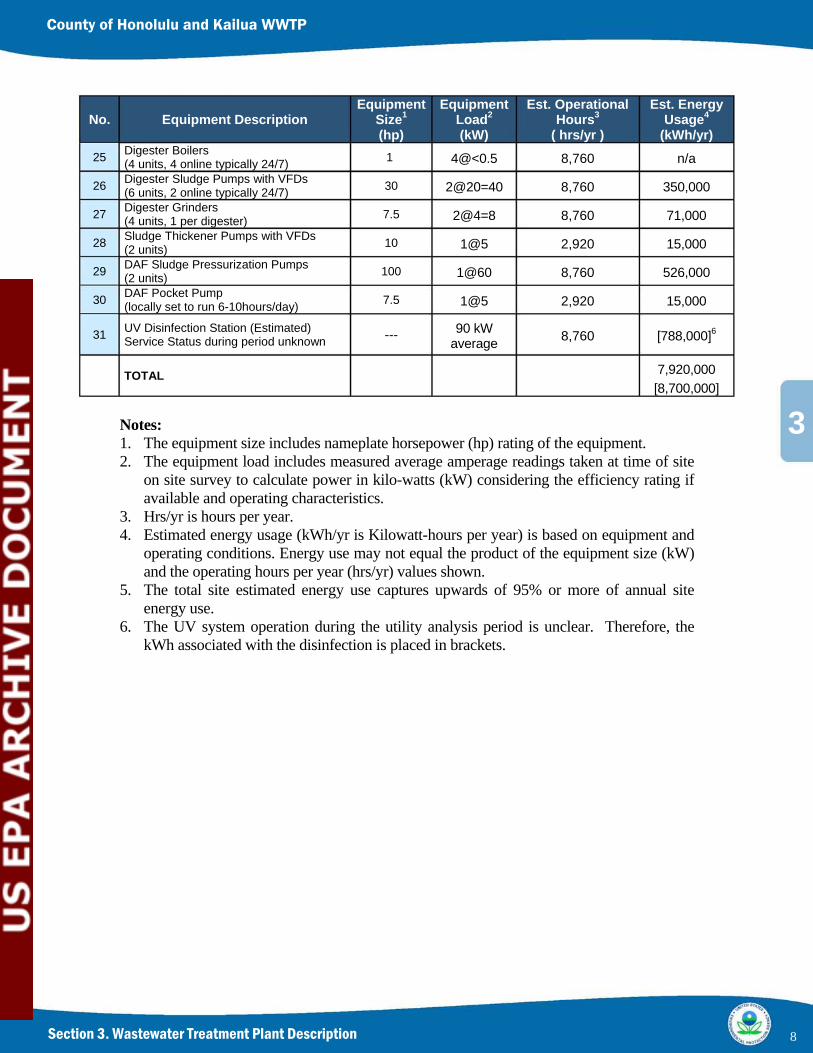
(hp) (kW) ( hrs/yr ) (kWh/yr) Digester Boilers 25 1 4@<0.5 8,760 n/a(4 units, 4 online typically 24/7) Digester Sludge Pumps with VFDs 26 30 2@20=40 8,760 350,000(6 units, 2 online typically 24/7) Digester Grinders 27 7.5 2@4=8 8,760 71,000(4 units, 1 per digester) Sludge Thickener Pumps with VFDs 28 10 1@5 2,920 15,000(2 units) DAF Sludge Pressurization Pumps 29 100 1@60 8,760 526,000(2 units) DAF Pocket Pump30 7.5 1@5 2,920 15,000(locally set to run 6-10hours/day)
UV Disinfection Station (Estimated) 90 kW31 --- 8,760 [788,000]6 Service Status during period unknown average
7,920,000TOTAL [8,700,000]
Notes: 1. The equipment size includes nameplate horsepower (hp) rating of the equipment. 2. The equipment load includes measured average amperage readings taken at time of site
on site survey to calculate power in kilo-watts (kW) considering the efficiency rating if available and operating characteristics.
3. Hrs/yr is hours per year. 4. Estimated energy usage (kWh/yr is Kilowatt-hours per year) is based on equipment and
operating conditions. Energy use may not equal the product of the equipment size (kW) and the operating hours per year (hrs/yr) values shown.
5. The total site estimated energy use captures upwards of 95% or more of annual site energy use.
6. The UV system operation during the utility analysis period is unclear. Therefore, the kWh associated with the disinfection is placed in brackets.
8
4
Section 4. Utility Analysis
County of Honolulu and Kailua WWTP
SECTION 4 Utility Analysis
Current Utility Use
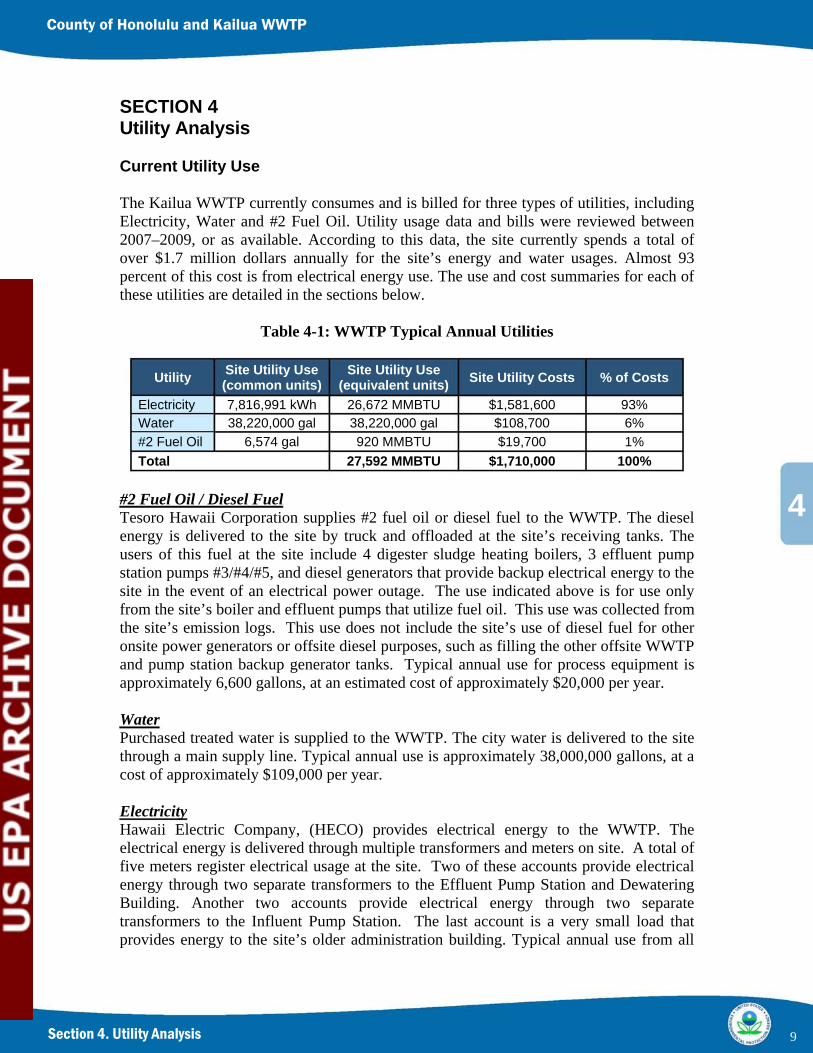
The Kailua WWTP currently consumes and is billed for three types of utilities, including Electricity, Water and #2 Fuel Oil. Utility usage data and bills were reviewed between 2007–2009, or as available. According to this data, the site currently spends a total of over $1.7 million dollars annually for the site’s energy and water usages. Almost 93 percent of this cost is from electrical energy use. The use and cost summaries for each of these utilities are detailed in the sections below.
Table 4-1: WWTP Typical Annual Utilities
Utility Site Utility Use (common units)
Site Utility Use (equivalent units) Site Utility Costs % of Costs
Electricity 7,816,991 kWh 26,672 MMBTU $1,581,600 93% Water 38,220,000 gal 38,220,000 gal $108,700 6% #2 Fuel Oil 6,574 gal 920 MMBTU $19,700 1% Total 27,592 MMBTU $1,710,000 100%
#2 Fuel Oil / Diesel Fuel Tesoro Hawaii Corporation supplies #2 fuel oil or diesel fuel to the WWTP. The diesel energy is delivered to the site by truck and offloaded at the site’s receiving tanks. The users of this fuel at the site include 4 digester sludge heating boilers, 3 effluent pump station pumps #3/#4/#5, and diesel generators that provide backup electrical energy to the site in the event of an electrical power outage. The use indicated above is for use only from the site’s boiler and effluent pumps that utilize fuel oil. This use was collected from the site’s emission logs. This use does not include the site’s use of diesel fuel for other onsite power generators or offsite diesel purposes, such as filling the other offsite WWTP and pump station backup generator tanks. Typical annual use for process equipment is approximately 6,600 gallons, at an estimated cost of approximately $20,000 per year.
Water Purchased treated water is supplied to the WWTP. The city water is delivered to the site through a main supply line. Typical annual use is approximately 38,000,000 gallons, at a cost of approximately $109,000 per year.
Electricity Hawaii Electric Company, (HECO) provides electrical energy to the WWTP. The electrical energy is delivered through multiple transformers and meters on site. A total of five meters register electrical usage at the site. Two of these accounts provide electrical energy through two separate transformers to the Effluent Pump Station and Dewatering Building. Another two accounts provide electrical energy through two separate transformers to the Influent Pump Station. The last account is a very small load that provides energy to the site’s older administration building. Typical annual use from all
9
4
Section 4. Utility Analysis
County of Honolulu and Kailua WWTP
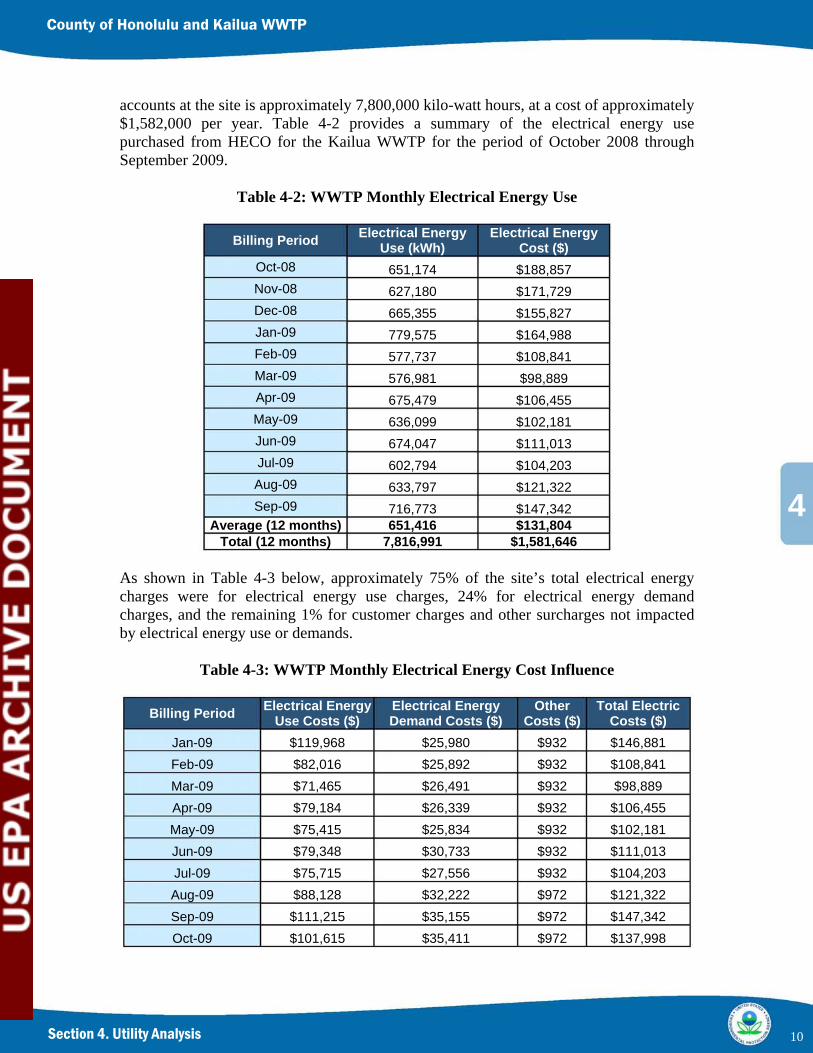
accounts at the site is approximately 7,800,000 kilo-watt hours, at a cost of approximately $1,582,000 per year. Table 4-2 provides a summary of the electrical energy use purchased from HECO for the Kailua WWTP for the period of October 2008 through September 2009.
Table 4-2: WWTP Monthly Electrical Energy Use
Billing Period Electrical Energy Use (kWh)
Electrical Energy Cost ($)
Oct-08 651,174 $188,857 Nov-08 627,180 $171,729 Dec-08 665,355 $155,827 Jan-09 779,575 $164,988 Feb-09 577,737 $108,841 Mar-09 576,981 $98,889 Apr-09 675,479 $106,455 May-09 636,099 $102,181 Jun-09 674,047 $111,013 Jul-09 602,794 $104,203 Aug-09 633,797 $121,322 Sep-09 716,773 $147,342
Average (12 months) 651,416 $131,804 Total (12 months) 7,816,991 $1,581,646
As shown in Table 4-3 below, approximately 75% of the site’s total electrical energy charges were for electrical energy use charges, 24% for electrical energy demand charges, and the remaining 1% for customer charges and other surcharges not impacted by electrical energy use or demands.
Table 4-3: WWTP Monthly Electrical Energy Cost Influence
Electrical Energy Electrical Energy Other Total Electric Billing Period Use Costs ($) Demand Costs ($) Costs ($) Costs ($) Jan-09 $119,968 $25,980 $932 $146,881
Feb-09 $82,016 $25,892 $932 $108,841
Mar-09 $71,465 $26,491 $932 $98,889
Apr-09 $79,184 $26,339 $932 $106,455
May-09 $75,415 $25,834 $932 $102,181
Jun-09 $79,348 $30,733 $932 $111,013
Jul-09 $75,715 $27,556 $932 $104,203
Aug-09 $88,128 $32,222 $972 $121,322
Sep-09 $111,215 $35,155 $972 $147,342
Oct-09 $101,615 $35,411 $972 $137,998
10
4
Section 4. Utility Analysis
County of Honolulu and Kailua WWTP
Electrical Energy Electrical Energy Other Total Electric Billing Period Use Costs ($) Demand Costs ($) Costs ($) Costs ($) Nov-09 $108,801 $35,237 $972 $145,010 Dec-09 $118,580 $28,901 $972 $148,453
Average (12 months) $92,621 $29,646 $949 $123,216 Total (12 months) $1,111,452 $355,750 $11,386 $1,478,589 Percent of Total 75% 24% 1% 100%
Note: Electric costs in Table 4-3 represent site electrical energy costs for the period beginning January 2009 through December 2009 as unit rate information was not available for 2008. These breakdowns are estimated values as utility bills were not provided for full verification purposes.
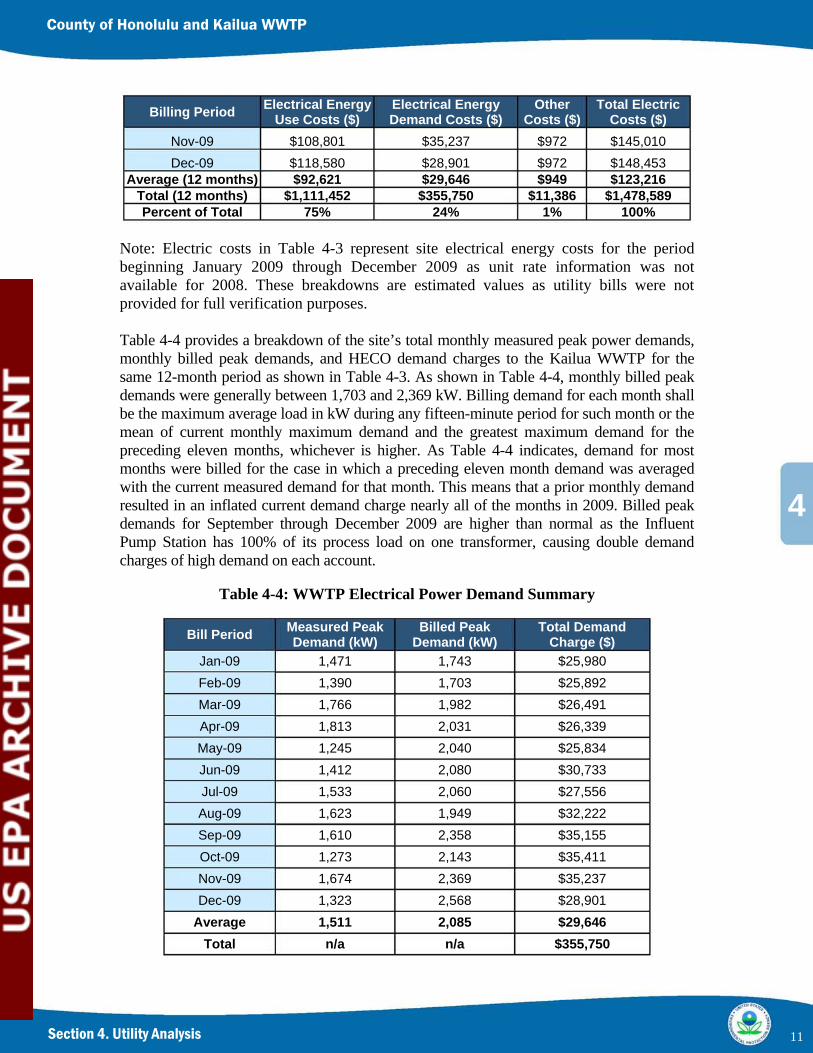
Table 4-4 provides a breakdown of the site’s total monthly measured peak power demands, monthly billed peak demands, and HECO demand charges to the Kailua WWTP for the same 12-month period as shown in Table 4-3. As shown in Table 4-4, monthly billed peak demands were generally between 1,703 and 2,369 kW. Billing demand for each month shall be the maximum average load in kW during any fifteen-minute period for such month or the mean of current monthly maximum demand and the greatest maximum demand for the preceding eleven months, whichever is higher. As Table 4-4 indicates, demand for most months were billed for the case in which a preceding eleven month demand was averaged with the current measured demand for that month. This means that a prior monthly demand resulted in an inflated current demand charge nearly all of the months in 2009. Billed peak demands for September through December 2009 are higher than normal as the Influent Pump Station has 100% of its process load on one transformer, causing double demand charges of high demand on each account.
Table 4-4: WWTP Electrical Power Demand Summary
Measured Peak Billed Peak Total Demand Bill Period Demand (kW) Demand (kW) Charge ($) Jan-09 1,471 1,743 $25,980 Feb-09 1,390 1,703 $25,892 Mar-09 1,766 1,982 $26,491 Apr-09 1,813 2,031 $26,339 May-09 1,245 2,040 $25,834 Jun-09 1,412 2,080 $30,733 Jul-09 1,533 2,060 $27,556 Aug-09 1,623 1,949 $32,222 Sep-09 1,610 2,358 $35,155 Oct-09 1,273 2,143 $35,411 Nov-09 1,674 2,369 $35,237 Dec-09 1,323 2,568 $28,901
Average 1,511 2,085 $29,646 Total n/a n/a $355,750
11
4
Section 4. Utility Analysis
County of Honolulu and Kailua WWTP
Note: The measured and billed demand values above represent the combined total demand from the site’s four largest electric accounts. Total demand charges above represent the “demand charge” as defined in the utility schedule in addition to all charges that are influenced by the monthly billed peak demand. These cost breakdowns are estimated values as utility bills were not provided for full verification purposes.
The site’s load profile is the variation of the plant’s electrical energy demand over time. A plant’s electrical demand typically follows the influent flow volumes; as influent flows increase so does the amount of equipment online and hence an increase in electrical energy use. Since the plant is typically staffed during the day only, the demand energy for the site is elevated by a small percentage during the day versus at night, too. The electric meters at the site are not connected to a managed database and therefore trends of the plant’s electrical energy are not tracked.
The site demand information is valuable as it can provide instantaneous information about the amount of equipment operating at your site. Since approximately 24% of the site’s electrical costs are determined from the monthly peak 15-minute interval demands, the site has direct influence over this portion of the bill. The influence of electric billing demand and opportunities identified for the site to improve this billing demand are provided in the Energy Conservation Opportunities Section 5.
Electricity Rate Schedule
The Kailua WWTP purchases electricity from HECO and has five separately metered accounts which register electrical usage at the site. One of the five meters is a very small account which is under HECO’s schedule rate “G” for “General Service Non-Demand” and is not billed with demand energy. The other four accounts log the site’s electrical energy use over time and electrical demand information. These four accounts are under two different rate schedules. Two of these accounts provide electrical energy through two separate transformers to the Influent Pump Station (IPS) and are under HECO’s schedule “PS” for “Large Power Secondary Voltage Service.” The other two accounts provide electrical energy through two separate transformers (in addition to the IPS transformers) to the Effluent Pump Station (EPS) and Dewatering Building and are under HECO’s schedule “J” for “General Service Demand.” The two rate schedules bill separately and uniquely for electric demand and are each described in further detail below.
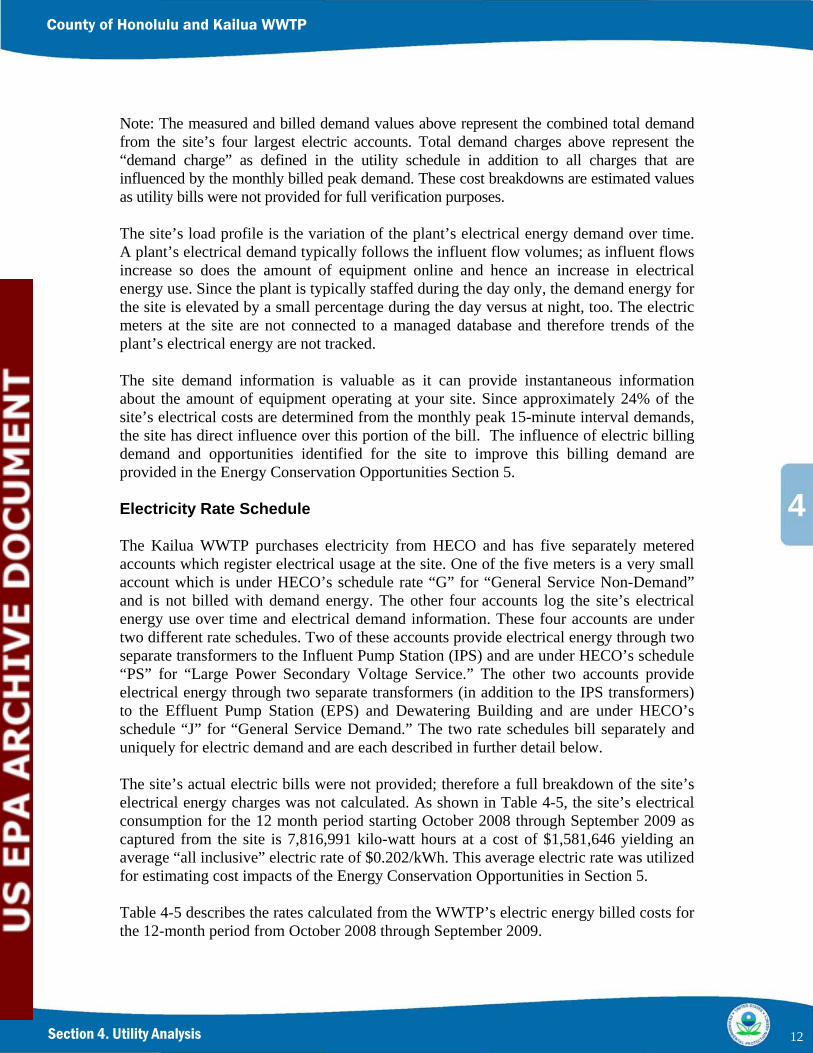
The site’s actual electric bills were not provided; therefore a full breakdown of the site’s electrical energy charges was not calculated. As shown in Table 4-5, the site’s electrical consumption for the 12 month period starting October 2008 through September 2009 as captured from the site is 7,816,991 kilo-watt hours at a cost of $1,581,646 yielding an average “all inclusive” electric rate of $0.202/kWh. This average electric rate was utilized for estimating cost impacts of the Energy Conservation Opportunities in Section 5.
Table 4-5 describes the rates calculated from the WWTP’s electric energy billed costs for the 12-month period from October 2008 through September 2009.
12
4
Section 4. Utility Analysis
County of Honolulu and Kailua WWTP
Table 4-5: WWTP Monthly Electrical Energy Use and Demand Rates Utilized for ECO Cost Impact for the Site
Billing Billing Electrical Energy Electrical Energy Other Total Electric Period Days Use & Costs Demand Use & Costs Costs ($) Use & Costs Total (12 months) $1,581,646 /yr n/a n/a $1,581,646 /yr Total (12 months) 7,816,991 kWh/yr 1,939 kW/mo average n/a n/a
Rate Used for ECO $0.202 /kWh n/a n/a n/aCalculations
The site’s three electric service rate schedules are broken down into the following charges as of the date of this report:
• Customer Charge – this is a fixed fee per month and does not vary with use. Each rate schedule has a unique base rate. These rates range between $30-$350 per month.
• Energy Charge – this is a fixed fee with a base rate of $0.164205 per kilowatt-hour under Schedule G and a declining block charge for the J and PS rate schedules. Both declining block charges bill for energy per kWh/month/kW of billing demand per kWh with different rates for the first 200 kWh/month/kW versus the next 200 kWh/month/kW and over 400 kWh/month/kW. The block rates decrease as for the next increment(s) of energy as use increases. The base block rates for Schedule J and PS are graphically described below.
Schedule “J” Schedule “PS” Base Energy Charge Rates Base Energy Charge Rates
$0.135915/kWh $0.122456/kWh $ $for first 200 for first 200
kWhr/month/kW $0.124436/kWh kWhr/month/kW $0.114473/kWh for next 200 $0.114145/kWh for next 200 $0.111379/kWh
kWhr/month/kW for over 400 kWhr/month/kW for over 400 kWhr/month/kW kWhr/month/kW
0 200 400 or greater 0 200 400 or greater
kWh’s kWh’s
• Demand Charge – the measured demand is the maximum average load in kW during any fifteen-minute period. The billing demand for each month is the maximum average load in kW during any fifteen-minute period for such month, or the mean of current monthly maximum demand and the greatest maximum demand for the preceding eleven months, whichever is higher, but not less than the minimum billing demand of 25 kW for accounts under Schedule J and not less than 300 kW for accounts under Schedule PS. Like the customer charge, this is a fixed fee under Schedule J with a base rate of $8.50 per month per kW of billing demand. For Schedule PS this is similar to the energy charge and is a declining block charge with three block rates of 0-500kW at $14.35 per kW of billing demand, next 1,000 kW at $13.85 per kW of billing demand, and over 1,500 kW at $12.85
13

4
Section 4. Utility Analysis
County of Honolulu and Kailua WWTP
per kW of billing demand. Since the site’s accounts are all metered separately, they are each charged for monthly peak demands even if that load is shared by the other account for portions of the month. Demand is not charged under the rate Schedule G.
• Power Factor – the rate Schedules J and PS, the above energy and demand charges are based upon an average monthly power factor of 85%. For each 1% the average power factor is above or below 85%, the demand and energy charges, as computed under the above rates, shall be decreased or increased, respectively, by 0.10%.
• Energy Cost Adjustment – this factor is evaluated each month and is charged to the energy used in kWhs for all three of the site’s rate schedules. If the PUC approves HECO’s submitted rate change, then the new rate takes effect from that day forward until a new rate is approved. In 2009, this rate has typically changed monthly. The days in the billing period are charged at the respective rates for such charges. In 2009, this was between ($0.01510)-$0.03149 per kWh.
• Interim Rate Increase – effective November 11, 2008, an interim rate increase in the amount of 7.01%, 5.93% and 7.44% has been in effect for Schedules G, J and PS respectively. Effective August 8, 2009, the interim rate increase changed to 3.59%, 6.33% and 4.20% respectively for Schedules G, J and PS. This rate increase percent is applied to all base charges which include the customer charge, energy charge, demand charge, and power factor adjustment, voltage discount and minimum charge.
• Public Benefits Fund (PBF) Surcharge – effective January 1, 2009, this charge is a set percentage of the total energy used in kWh and is applicable for all three of the site’s rate schedules. Currently the Commercial and Industrial surcharge rate is at $0.001015 per kWh. According to PUC documents, the PBF rate is set to increase over the next few years and then level off. This funding is to support investment in more sustainable alternatives to fossil fuel derived power needs.
• Resource Cost Adjustment (DSM) Surcharge – a surcharge that is to be added to the accounts energy use per kilowatt-hour and is applicable for all three of the site’s rate schedules. The Commercial and Industrial surcharge rate from January-March 2009 was $0.003076/kWh, from April-June 2009 this rate was $0.004009/kWh and from July-December 2009 this rate was $0.001561/kWh.
14
4
Section 4. Utility Analysis
County of Honolulu and Kailua WWTP
~
~~ .~
------------------~~~}__,~~r •• .--------------
!~ :~~: - ~~~
---
---
r-- r-- --- --- r-- r-- --- --- r-
Oct‐08 Nov‐08
Dec‐08
Jan‐09
Feb‐09
Mar‐09
Apr‐09
May‐09 Jun‐09Jul‐09
Aug‐09
Sep‐09
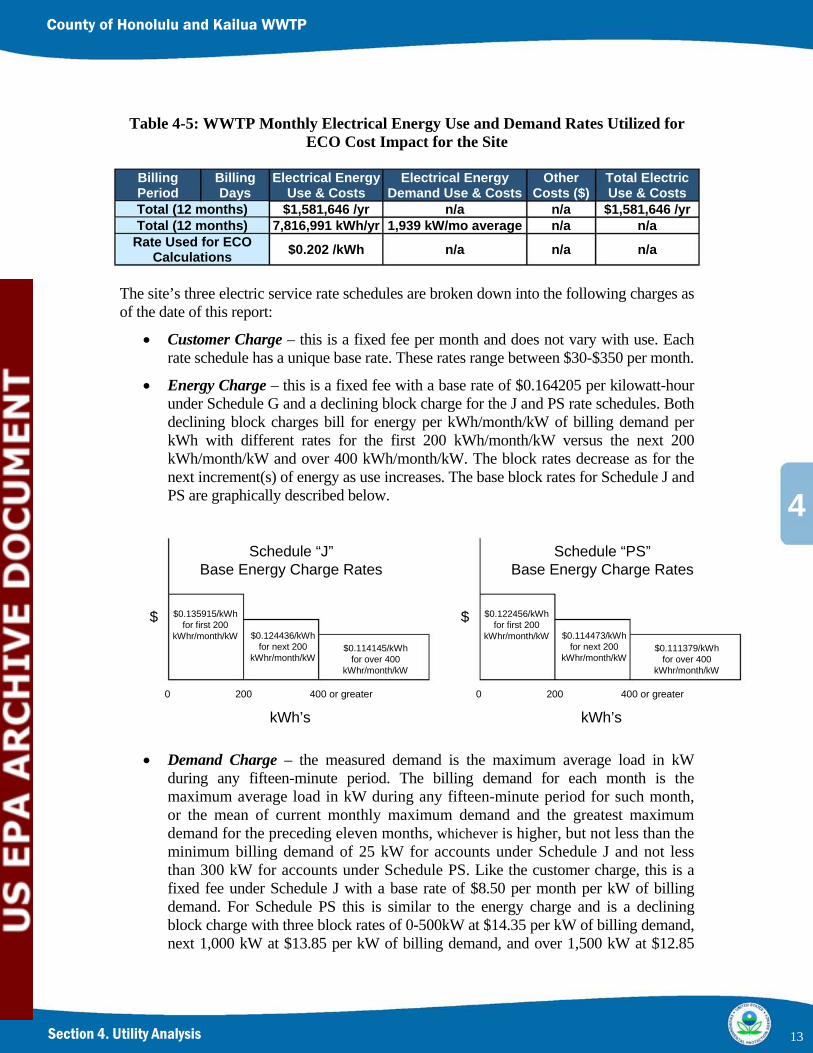
Energy Baseline
The following Figure 4-1 describes the site’s energy use over the 12-month period from October 2008 through September 2009.
Figure 4-1: WWTP Total Energy Use Breakdown
2,800
2,600
2,400
2,200
2,000
1,800
Energy
Use
(MMBT
U)
Months
Electricity #2 Fuel Oil
15
4
Section 4. Utility Analysis
County of Honolulu and Kailua WWTP
r.;.;1 t.!l.I
Oct‐08
Nov‐08
Dec‐08
Jan‐09
Feb‐09
Mar‐09
Apr‐09
May‐09
Jun‐09
Jul‐09
Aug‐09 Sep‐09
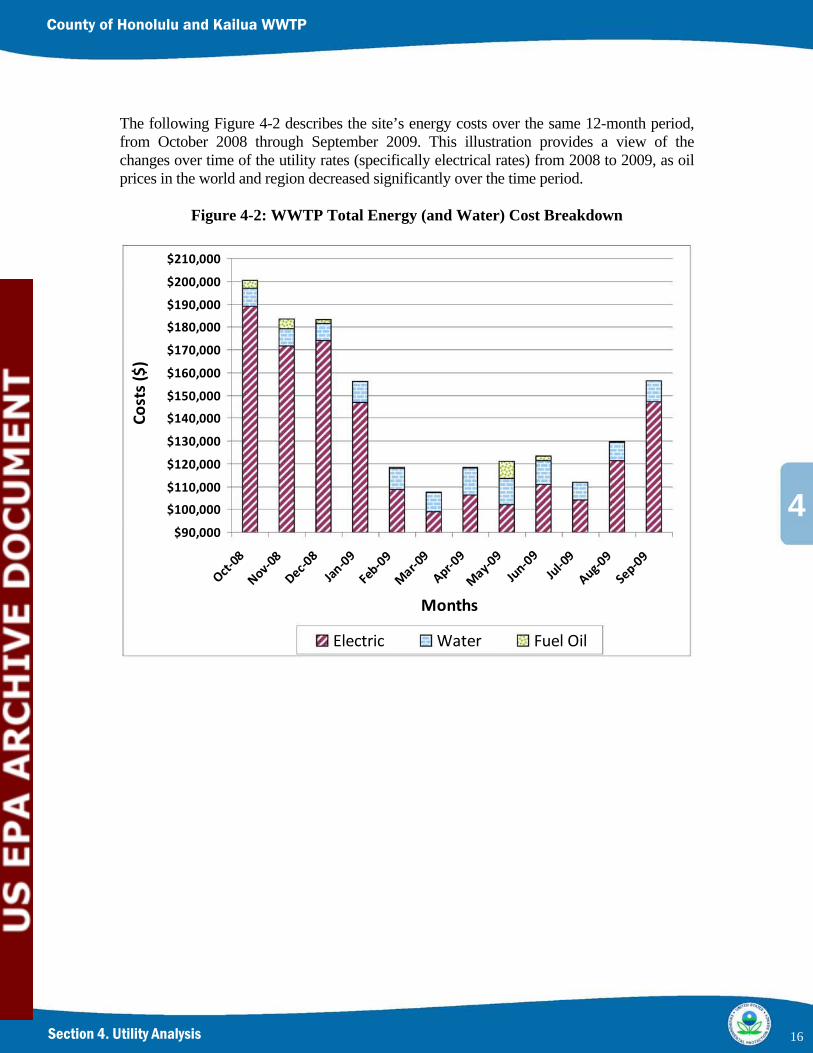
The following Figure 4-2 describes the site’s energy costs over the same 12-month period, from October 2008 through September 2009. This illustration provides a view of the changes over time of the utility rates (specifically electrical rates) from 2008 to 2009, as oil prices in the world and region decreased significantly over the time period.
Figure 4-2: WWTP Total Energy (and Water) Cost Breakdown
$210,000
$200,000
$190,000
$180,000
$170,000
$160,000
$150,000
$140,000
$130,000
$120,000
$110,000
$100,000
$90,000
Costs ($)
Months
Electric Water Fuel Oil
16
4
Section 4. Utility Analysis
County of Honolulu and Kailua WWTP
Oct‐08
Nov‐08
Dec‐08
Jan‐09
Feb‐09
Mar‐09
Apr‐09
May‐09
Jun‐09
Jul‐09
Aug‐09
Sep‐09
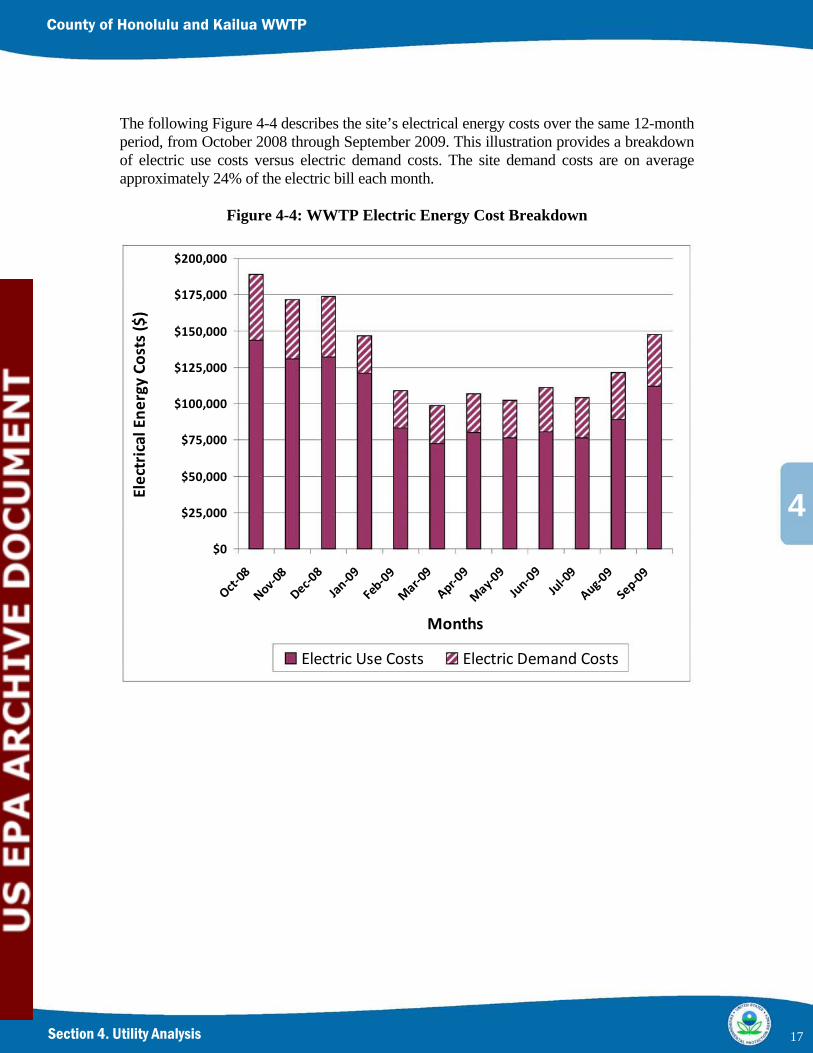
The following Figure 4-4 describes the site’s electrical energy costs over the same 12-month period, from October 2008 through September 2009. This illustration provides a breakdown of electric use costs versus electric demand costs. The site demand costs are on average approximately 24% of the electric bill each month.
Figure 4-4: WWTP Electric Energy Cost Breakdown
$200,000
$175,000
$150,000
$125,000
$100,000
$75,000
$50,000
$25,000
$0
Electrical
Ene
rgy Co
sts ($)
Months
Electric Use Costs Electric Demand Costs
17
4
Section 4. Utility Analysis
County of Honolulu and Kailua WWTP
I -
Oct‐08
Nov‐08
Dec‐08
Jan‐09
Feb‐09
Mar‐09
Apr‐09
May‐09
Jun‐09
Jul‐09
Aug‐09
Sep‐09
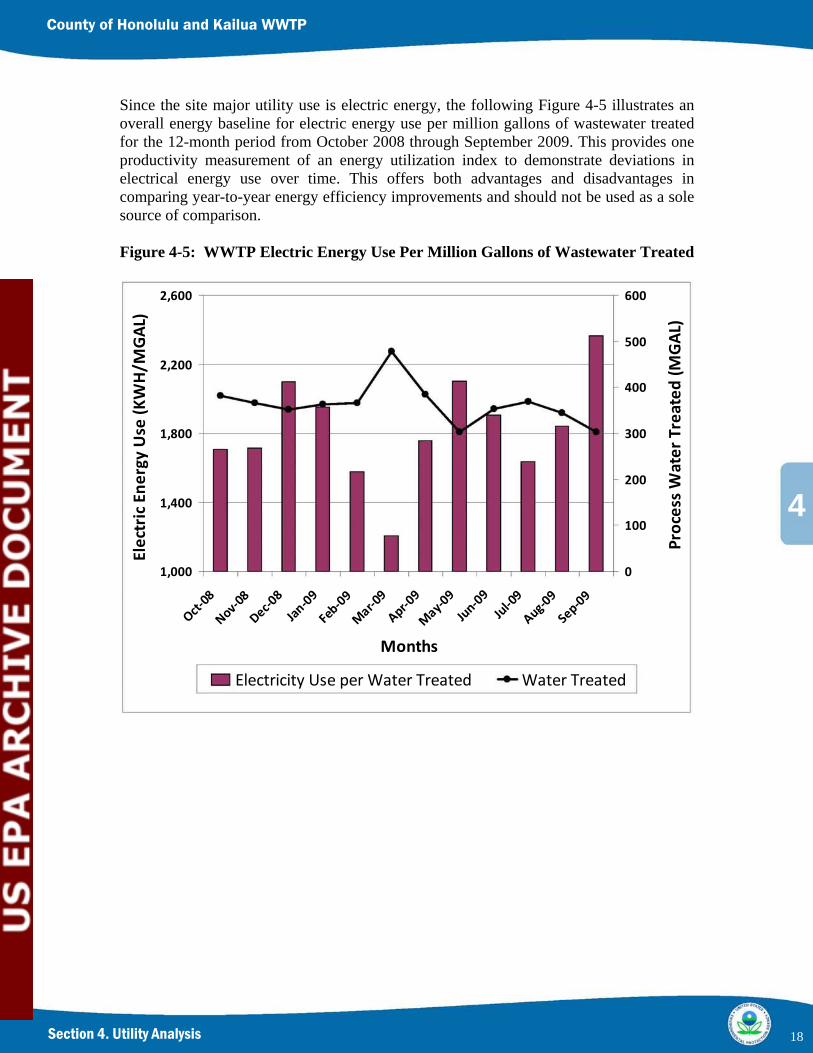
Since the site major utility use is electric energy, the following Figure 4-5 illustrates an overall energy baseline for electric energy use per million gallons of wastewater treated for the 12-month period from October 2008 through September 2009. This provides one productivity measurement of an energy utilization index to demonstrate deviations in electrical energy use over time. This offers both advantages and disadvantages in comparing year-to-year energy efficiency improvements and should not be used as a sole source of comparison.
Figure 4-5: WWTP Electric Energy Use Per Million Gallons of Wastewater Treated
2,600 600
Electric
Ene
rgy Use
(KWH/M
GAL)
Process Water
Treated
(MGAL)
500
2,200
400
1,800 300
200
1,400
100
1,000 0
Months
Electricity Use per Water Treated Water Treated
18
5
Section 5. Energy Conservation Opportunities (ECO)
County of Honolulu and Kailua WWTP
SECTION 5 Energy Conservation Opportunities
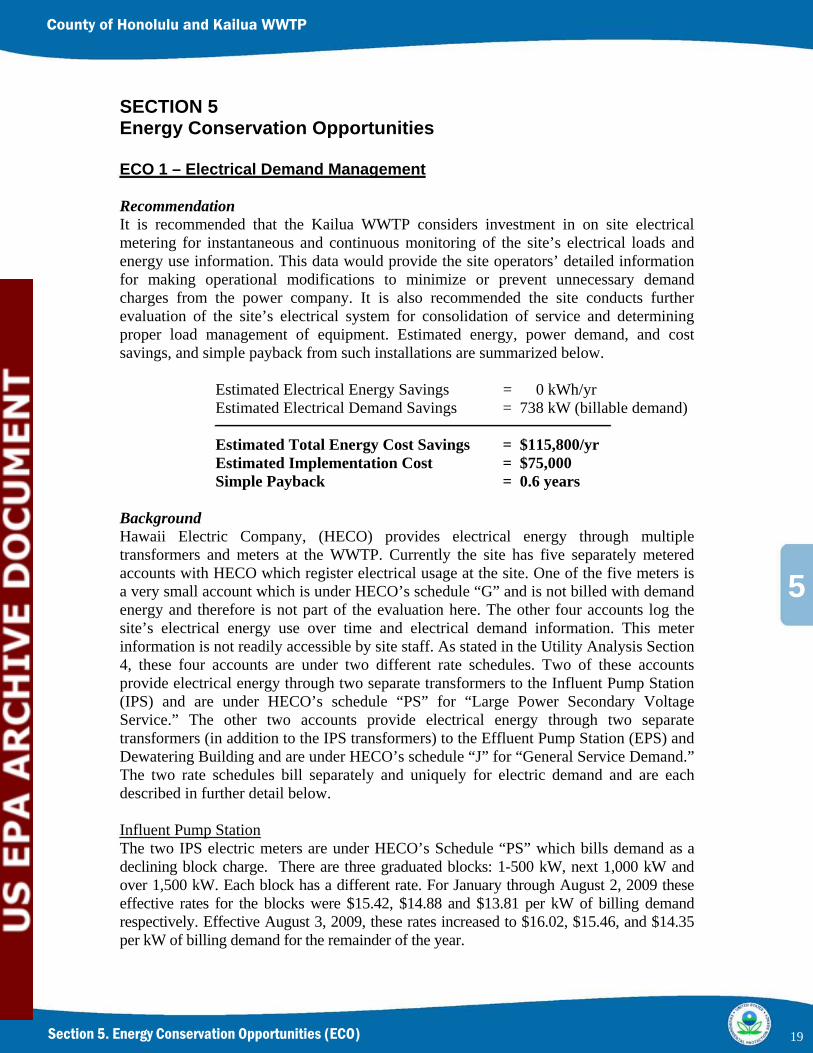
ECO 1 – Electrical Demand Management
Recommendation It is recommended that the Kailua WWTP considers investment in on site electrical metering for instantaneous and continuous monitoring of the site’s electrical loads and energy use information. This data would provide the site operators’ detailed information for making operational modifications to minimize or prevent unnecessary demand charges from the power company. It is also recommended the site conducts further evaluation of the site’s electrical system for consolidation of service and determining proper load management of equipment. Estimated energy, power demand, and cost savings, and simple payback from such installations are summarized below.
Estimated Electrical Energy Savings = 0 kWh/yr Estimated Electrical Demand Savings = 738 kW (billable demand)
Estimated Total Energy Cost Savings = $115,800/yr Estimated Implementation Cost = $75,000
Simple Payback = 0.6 years
Background Hawaii Electric Company, (HECO) provides electrical energy through multiple transformers and meters at the WWTP. Currently the site has five separately metered accounts with HECO which register electrical usage at the site. One of the five meters is a very small account which is under HECO’s schedule “G” and is not billed with demand energy and therefore is not part of the evaluation here. The other four accounts log the site’s electrical energy use over time and electrical demand information. This meter information is not readily accessible by site staff. As stated in the Utility Analysis Section 4, these four accounts are under two different rate schedules. Two of these accounts provide electrical energy through two separate transformers to the Influent Pump Station (IPS) and are under HECO’s schedule “PS” for “Large Power Secondary Voltage Service.” The other two accounts provide electrical energy through two separate transformers (in addition to the IPS transformers) to the Effluent Pump Station (EPS) and Dewatering Building and are under HECO’s schedule “J” for “General Service Demand.” The two rate schedules bill separately and uniquely for electric demand and are each described in further detail below.
Influent Pump Station The two IPS electric meters are under HECO’s Schedule “PS” which bills demand as a declining block charge. There are three graduated blocks: 1-500 kW, next 1,000 kW and over 1,500 kW. Each block has a different rate. For January through August 2, 2009 these effective rates for the blocks were $15.42, $14.88 and $13.81 per kW of billing demand respectively. Effective August 3, 2009, these rates increased to $16.02, $15.46, and $14.35 per kW of billing demand for the remainder of the year.
19
5
Section 5. Energy Conservation Opportunities (ECO)
County of Honolulu and Kailua WWTP
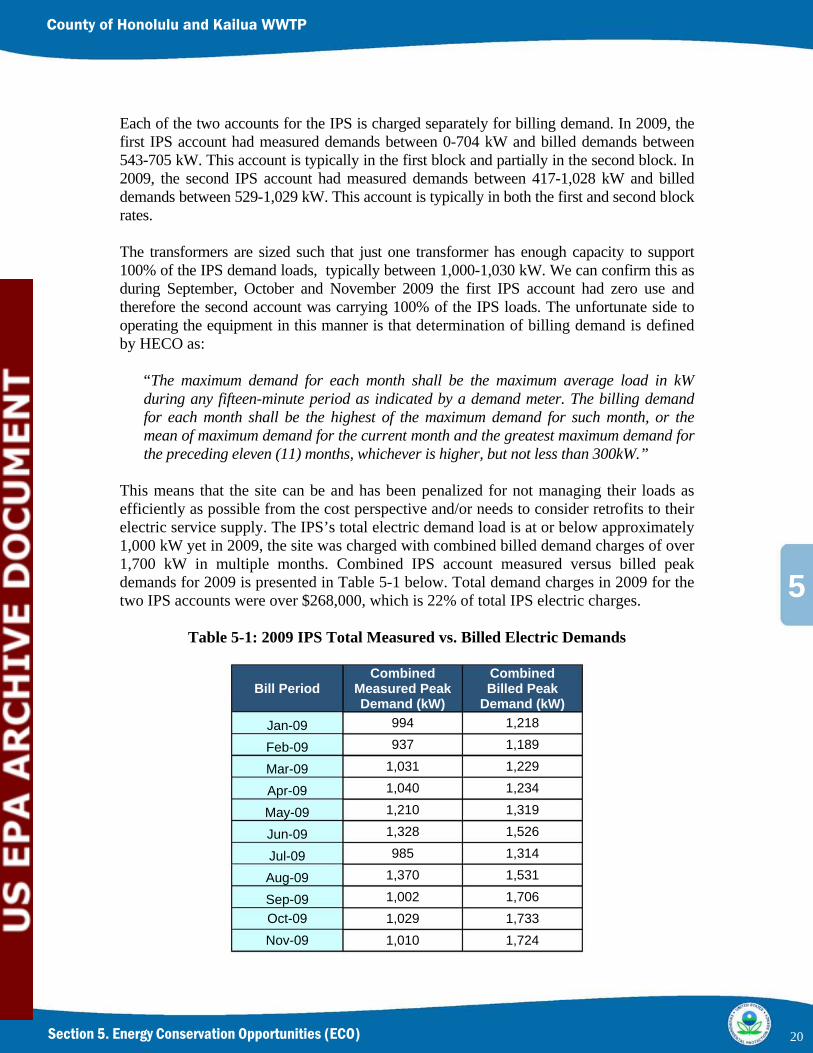
Each of the two accounts for the IPS is charged separately for billing demand. In 2009, the first IPS account had measured demands between 0-704 kW and billed demands between 543-705 kW. This account is typically in the first block and partially in the second block. In 2009, the second IPS account had measured demands between 417-1,028 kW and billed demands between 529-1,029 kW. This account is typically in both the first and second block rates.
The transformers are sized such that just one transformer has enough capacity to support 100% of the IPS demand loads, typically between 1,000-1,030 kW. We can confirm this as during September, October and November 2009 the first IPS account had zero use and therefore the second account was carrying 100% of the IPS loads. The unfortunate side to operating the equipment in this manner is that determination of billing demand is defined by HECO as:
“The maximum demand for each month shall be the maximum average load in kW during any fifteen-minute period as indicated by a demand meter. The billing demand for each month shall be the highest of the maximum demand for such month, or the mean of maximum demand for the current month and the greatest maximum demand for the preceding eleven (11) months, whichever is higher, but not less than 300kW.”
This means that the site can be and has been penalized for not managing their loads as efficiently as possible from the cost perspective and/or needs to consider retrofits to their electric service supply. The IPS’s total electric demand load is at or below approximately 1,000 kW yet in 2009, the site was charged with combined billed demand charges of over 1,700 kW in multiple months. Combined IPS account measured versus billed peak demands for 2009 is presented in Table 5-1 below. Total demand charges in 2009 for the two IPS accounts were over $268,000, which is 22% of total IPS electric charges.
Table 5-1: 2009 IPS Total Measured vs. Billed Electric Demands
Combined Combined Bill Period Measured Peak Billed Peak
Demand (kW) Demand (kW) Jan-09 994 1,218
Feb-09 937 1,189
Mar-09 1,031 1,229
Apr-09 1,040 1,234
May-09 1,210 1,319
Jun-09 1,328 1,526
Jul-09 985 1,314
Aug-09 1,370 1,531
Sep-09 1,002 1,706
Oct-09 1,029 1,733
Nov-09 1,010 1,724
20

5
Section 5. Energy Conservation Opportunities (ECO)
County of Honolulu and Kailua WWTP
Dec-09 1,405 1,569
Bill Period
Average HighLow
Combined Measured Peak Demand (kW)
1,112 1,405 937
Combined Billed Peak
Demand (kW) 1,441 1,733 1,189
Effluent Pump Station The two EPS electric meters are under HECO’s Schedule “J” which bills demand as a fixed fee. For January through August 2, 2009 this fixed fee rate was $9.00 per kW of billing demand. Effective August 3, 2009 this rate increased to $9.54 per kW of billing demand for the remainder of the year.
Each of the two accounts for the EPS is charged separately for billing demand. In 2009, the first EPS account had measured demands between 238-298 kW and billed demands between 250-298 kW. In 2009, the second EPS account had measured demands between 15-564 kW and billed demands between 133-564 kW.
Like the IPS, the transformers at the EPS are sized such that just one transformer has enough capacity to support 100% of the EPS demand loads. When the centrifuges are online along with two electric effluent pumps at 75% capacity each, the EPS demand is expected to be in the range of 550 kW. However for 2009, this demand was only seen in one of the months and that was in January of 2009 with a measured demand of 564 kW. The other months were typically in a combined peak of 300-400 kW. If the site is using a diesel powered effluent pump or the site has low flows and is only operating one electric effluent pump, then typical total demands for the EPS is below 350 kW.
The unfortunate side to operating most or all of the EPS load off one transformer (as what occurred in January with individual metered account peaks of 250 kW and 564 kW for a combined EPS metered peak of 814 kW) is that one months demand will be averaged with the next 11 months measured demands to calculate the monthly billed demand even if the current months measured demand is lower. This causes an unnecessary elevated demand value that if managed appropriately can be reduced. The demand for Schedule “J” is defined slightly different than for Schedule “PS” as the minimum demand value for these accounts is different. Billing demand as defined by HECO under Schedule “J” is:
“The maximum demand for each month shall be the maximum average load in kW during any fifteen-minute period as indicated by a demand meter. The billing demand for each month shall be the highest of the maximum demand for such month, or the mean of maximum demand for the current month and the greatest maximum demand for the preceding eleven (11) months, whichever is higher, but not less than 25kW.”
The EPS’s total electric maximum demand load is at or below approximately 565 kW, yet the in 2009, site was charged with combined billed demand charges of over 850 kW
21
5
Section 5. Energy Conservation Opportunities (ECO)
County of Honolulu and Kailua WWTP
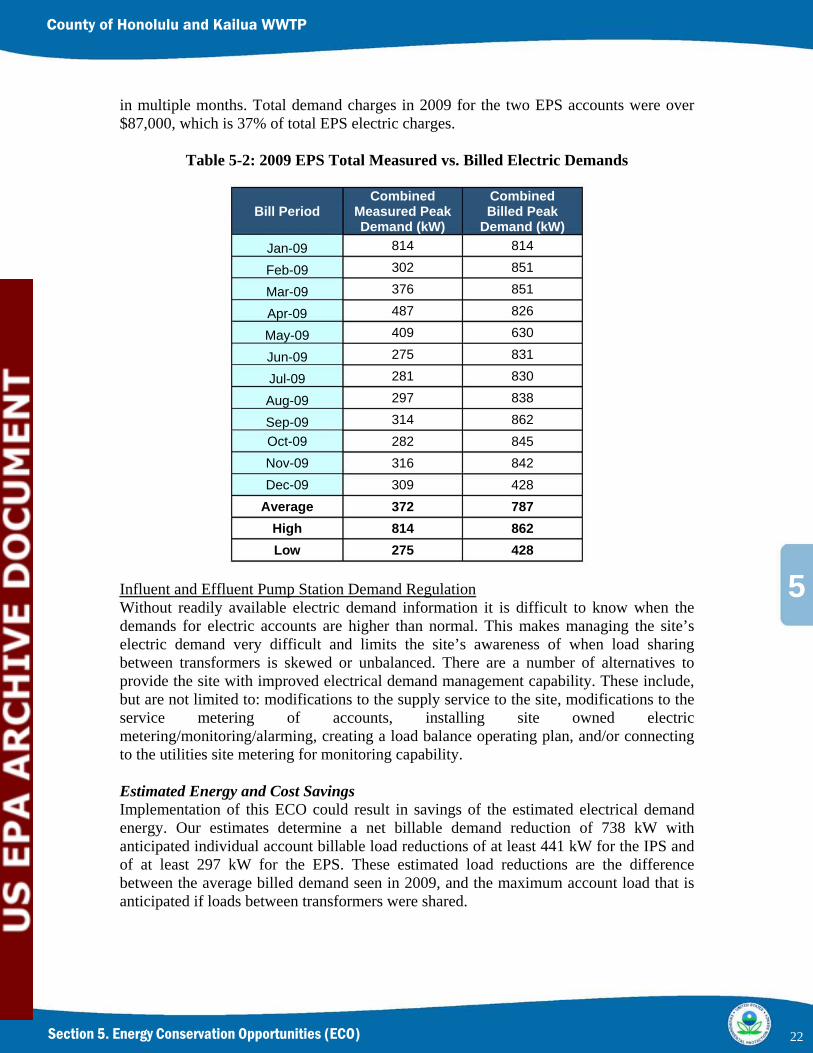
in multiple months. Total demand charges in 2009 for the two EPS accounts were over $87,000, which is 37% of total EPS electric charges.
Table 5-2: 2009 EPS Total Measured vs. Billed Electric Demands
Combined Combined Bill Period Measured Peak Billed Peak
Demand (kW) Demand (kW) 814 814Jan-09 302 851Feb-09 376 851Mar-09
Apr-09 487 826
May-09 409 630 275 831Jun-09 281 830Jul-09
Aug-09 297 838
Sep-09 314 862 Oct-09 282 845 Nov-09 316 842 Dec-09 309 428
Average 372 787 High 814 862 Low 275 428
Influent and Effluent Pump Station Demand Regulation Without readily available electric demand information it is difficult to know when the demands for electric accounts are higher than normal. This makes managing the site’s electric demand very difficult and limits the site’s awareness of when load sharing between transformers is skewed or unbalanced. There are a number of alternatives to provide the site with improved electrical demand management capability. These include, but are not limited to: modifications to the supply service to the site, modifications to the service metering of accounts, installing site owned electric metering/monitoring/alarming, creating a load balance operating plan, and/or connecting to the utilities site metering for monitoring capability.
Estimated Energy and Cost Savings Implementation of this ECO could result in savings of the estimated electrical demand energy. Our estimates determine a net billable demand reduction of 738 kW with anticipated individual account billable load reductions of at least 441 kW for the IPS and of at least 297 kW for the EPS. These estimated load reductions are the difference between the average billed demand seen in 2009, and the maximum account load that is anticipated if loads between transformers were shared.
22

5
Section 5. Energy Conservation Opportunities (ECO)
County of Honolulu and Kailua WWTP
The total estimated annual Cost Savings (CS) is the sum of the Electrical Energy Cost Savings (ECS) and Demand Cost Savings (DCS). The electrical energy and demand charges are based on the HELCO 2008-09 data as presented in Section 4.
CS = (ECS)(Usage Charge) + (DCS)(Demand Charge) CS = [0 (kWh/yr) X 0.202 ($/kWh)] + [441 (kW) X 15.46 ($/kW−month) X 12
(months/yr)] + [297 (kW) X 9.54 ($/kW−month) X 12 (months/yr)] + CS = $0/yr + $81,800/yr + $34,000/yr CS = $115,800/yr
Estimated Implementation Cost and Payback The total preliminary estimated cost to implement this ECO is $75,000. This estimate includes the cost for new metering interface hardware to connect to new current transformers. This will incorporate the four main electrical accounts’ power usage into the site’s supervisory, control, and data acquisition (SCADA) system. A basic power monitoring system would convert the current and voltage readings at the switchgear to 420mA signals, which would be inputted to the SCADA system. Programming of the Programmable Logic Controllers (PLC) and operator interface would provide the necessary calculations and display the electrical power signals through the SCADA interface as well as indicate any alarms and warnings. This would provide the site with the minimum tools necessary for electrical demand management. These costs do not include services for a load management survey, consolidation of electric service or electrical service modifications. These services should be considered once more detailed monitoring and measurements have been taken and evaluated.
Based on this preliminary assessment, the simple payback period would be 0.6 years.
The following assumptions were made about this ECO: 1) The site will monitor and regulate equipment operation to maintain site electric
demand loads under a combined 1,565 kW demand threshold. This assumed individual account thresholds of 1,000 kW for the IPS and 565 kW for the EPS.
2) The site may not see the expected demand savings for upwards of 11 months due to the influence of a higher kW demand measured from the prior 11 month period that will still contribute to a higher than measured billing demand. This is due to the site’s electric schedule contract with the utility.
3) Cost savings estimated were based on current electric demand rates and cost adjustment factors. Future rates for the site may go up or down and would impact the cost savings estimates in this ECO accordingly.
The following steps are required to implement this ECO: 1) Contact the local utility to request utilization of existing utility owned meters
pulse signals for replication within the site’s SCADA system to reduce the cost of installing new meters and current transformers.
2) Confirm that the site’s SCADA system will have the capability and space to store and database the meters pulse signal data.
23

5
Section 5. Energy Conservation Opportunities (ECO)
County of Honolulu and Kailua WWTP
3) Train the site staff on the demand reduction strategy and update such staff on a regular basis as to the demand limiting set point(s).
Plant Staffing Impact Implementation of this ECO is not anticipated to impact plant staffing requirements. This ECO has a small impact on the need for operators and site management to review the site’s monthly electric demand and future metering data, but should not require more than a few minutes for such reviews. This information is a tool to enhance the operator’s knowledge of the system and the ability to make better decisions for daily operations.
Photo Gallery
1 of 2 HECO Owned EPS Electric Meters 1 of 2 HECO Owned EPS Electric Meters Located in EPS Building Located in EPS Building
1 of 2 HECO Owned IPS Electric Meters 1 of 2 HECO Owned EPS Electric Meters Located at IPS Building Located in IPS Building
24
5
Section 5. Energy Conservation Opportunities (ECO)
County of Honolulu and Kailua WWTP
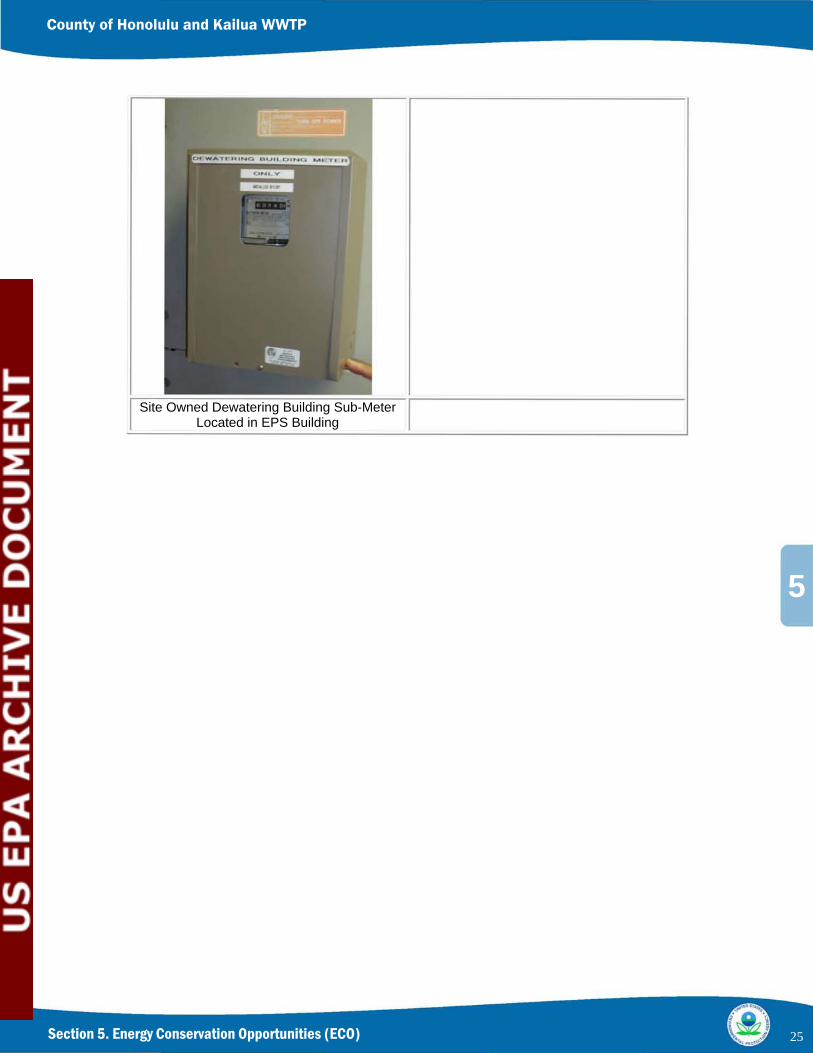
Site Owned Dewatering Building Sub-Meter Located in EPS Building
25
5
Section 5. Energy Conservation Opportunities (ECO)
County of Honolulu and Kailua WWTP
ECO 2 – Lighting System Improvements
Recommendation It is recommended that the Kailua WWTP consider further investment in new higher efficiency lighting technologies to reduce the site’s electric demand and use. Replacing lower efficiency lighting systems with higher efficiency lighting systems will standardize lamp and ballast types and reduce the number of lamps, ballasts and other lighting equipment to be stocked and managed. Fixture upgrades would include replacing all T12 fluorescent lamps with T8 fluorescent lamps and elimination of incandescent lamps. Also, we recommend replacing magnetic ballasts with electronic ballasts for further energy load improvement of the fixtures. Other upgrades include considering replacement of HID fixtures with LEDs for improved control and to significantly reduce maintenance costs. Lighting controls are also recommended to optimize on lamp energy use and extend lamp life. Estimated energy, power demand, and cost savings and simple payback from such installations are summarized below.
Estimated Electrical Energy Savings = 122,100 kWh/yr Estimated Electrical Demand Savings = 25 kW
Estimated Total Energy Cost Savings = $24,700/yr Estimated Implementation Cost = $154,000
Simple Payback = 6.2 years
Background The Tetra Tech team observed that portions of the interior lighting in office locations of the plant, have already been upgraded to new lighting technologies. These upgrades include replacing fluorescent fixtures containing T12 lamps and magnetic ballasts with new fluorescent fixtures containing T8 lamps and electronic ballasts. The site is already working towards improving the remainder of the lighting systems at the WWTP and this ECO is only identifying those further needs and quantifying the expected impact to the site’s utility use and costs. Therefore, the lighting improvements identified in this ECO are for future improvements only.
There are approximately 426 interior and exterior fixtures at the site that use older generation lighting technologies. Most of theses fixtures were installed when the building or area was erected. This older lighting technology includes T12 fluorescent, incandescent, and High Pressure Sodium lamps and fixtures which also use magnetic ballasts.
The plant runs continuously throughout the year. The site is occupied with operations personnel on three shifts, seven days a week. Therefore building lighting systems are typically on for the majority of the day. Fixtures in some areas of the plant not frequently occupied were assumed turned off for a portion of the day as they were observed off during the audit. The current controls for building lighting fixtures are manual wall switches. The exterior lighting systems are on either photocells or time clock controls and were observed off during the day. These units automatically turn on during very low-no
26
5
Section 5. Energy Conservation Opportunities (ECO)
County of Honolulu and Kailua WWTP
light evening periods. Not including the cost of maintenance and replacement lamps and ballasts, it is estimated that the Kailua WWTP is spending over $50,000 per year for the energy to light the areas of the plant. This estimate is based on light counts and information collected during the site walk.
Many of these lighting systems can be replaced with more efficient i.e. lower wattage lamps and ballasts. While replacing the lamps is a short term solution, Light Emitting Diodes (LED) is an example of a longer term solution. For instance LED lamps are rated for approximately 100,000 hours while high pressure sodium (HPS) lamps currently used by the site are rated for just a fraction of this lamp life at approximately 24,000 hours. The initial cost of LED maybe higher than HPS lamps, yet they consume minimal energy and require less equipment and maintenance costs which can aide in justifying the use of LED. It is recommended that the site consider such alternative technologies when ultimately deciding on fixture replacement purchases.
Recommended control improvements include motion sensors or timer based switches for the building interior lighting systems. Several outdoor fixtures use controls such as photocells as recommended for such applications. The site should considered reducing site outdoor lighting during unoccupied periods for further reductions in site energy use. Implementing such controls to both interior and exterior lighting would need further assessment and may positively impact the energy reduction of this ECO.
Estimated Energy and Cost Savings The estimated electrical demand energy savings, if all fixtures and lamps were replaced with the higher efficiency ballasts and lamps and operating at the same current conditions, is 25 kW. Based on the current operating hours for lighting, the energy savings would be 122,100 kWh per year.
The total estimated annual Cost Savings (CS) is the sum of the Electrical Energy Cost Savings (ECS) and Demand Cost Savings (DCS). The electrical energy and demand charges are based on the HECO 2008-09 data as presented in Section 4.
CS = (ECS)(Usage Charge) + (DCS)(Demand Charge) CS = 122,100 (kWh/yr) X 0.202 ($/kWh)] + [25 (kW) X 0 ($/kW−month) X 12
(months/yr)] CS = $24,700/yr + $0/yr CS = $24,700/yr
Estimated Implementation Cost and Payback The total preliminary estimated cost to implement this ECO is $154,000. This estimate includes the cost for new lighting fixtures, ballasts, lamps and installation.
Based on this preliminary assessment, the simple payback period would be 6.2 years.
The following assumptions were made about this ECO: 1) Lamps and fixture prices remain the same.
27
5
Section 5. Energy Conservation Opportunities (ECO)
County of Honolulu and Kailua WWTP
2) Light counts are estimates. 3) Most interior office lighting has already been upgraded and is not included for the
ECO improvements. 4) Building interior lighting was estimated to operate on average 16 hours per day, 7
days per week with the exception of the maintenance building which was assumed to operate only 10 hours per day, 5 days per week.
5) Exterior lighting was estimated to operate on average 12 hours per day, 365 days per year.
6) Reduced lamp replacement costs (equipment and labor) due to extended lamp life expectancies for new lighting technologies were not included in the savings estimates.
7) Energy savings from improved control and/or reduced operating hours was not included here.
8) Cost savings estimated were based on current electric demand rates and cost adjustment factors. Future rates for the site may go up or down and would impact the cost savings estimates in this ECO accordingly.
The following steps are required to implement this ECO: 1) Confirm lighting fixture, efficiency, and operating hours. 2) Confirm lighting levels and acceptability of new fixture types and controls.
Plant Staffing Impact Implementation of this ECO is not anticipated to impact plant staffing requirements.
Photo Gallery
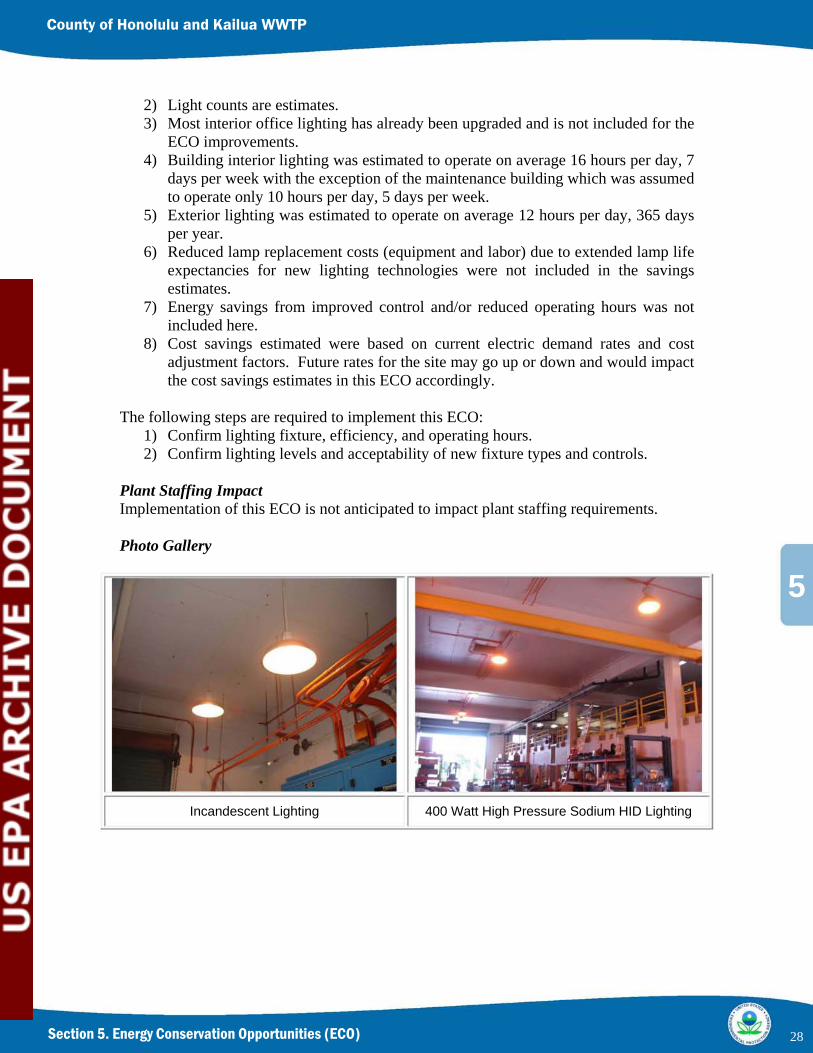
Incandescent Lighting 400 Watt High Pressure Sodium HID Lighting
28

5
Section 5. Energy Conservation Opportunities (ECO)
County of Honolulu and Kailua WWTP
T12 Fluorescent Lighting T12 & T8 Mixed Fluorescent Lighting
29
5
Section 5. Energy Conservation Opportunities (ECO)
County of Honolulu and Kailua WWTP
ECO 3 – Disinfection System Upgrades
Recommendation It is recommended that the Kailua WWTP consider further investment in the evaluation and upgrades to the existing disinfection system. Upgrades and improvements recommended include installation of a new ultra violet (UV) system, hydraulic overflow protection and automatic controls. The new UV system would provide for new higher efficiency lamps and operational controls with capability of up to 70% automatic turndown. Significant electrical savings over the current system will be realized when in operation. An auto cleaning feature of a new system may reduce the existing operations and maintenance (O&M) efforts; however such savings have not been accounted for here. Estimated energy, power demand, and cost savings and simple payback from such installations are summarized below.
Estimated Electrical Energy Savings = 438,000 kWh/yr Estimated Electrical Demand Savings = 50 kW
Estimated Total Energy Cost Savings = $88,500/yr Estimated Implementation Cost = $500,000
Simple Payback = 5.6 years
Background Currently, the plant’s UV system is out-of-service. Future operation is anticipated; however a date for return to service was not given. The existing system consists of an UltraTech UV System with six modules over two channels each containing 40 low-pressure lamps for a total system capacity of 240 lamps. Typically both channels and all modules are in operation to adequately meet disinfection needs at the plant. Operator interviews indicated that when the existing UV system is in operation the modules were on continuous power and maintenance of the system including cleaning was a constant struggle. Flooding of the channels was problematic and caused the ultimate failure and current offline situation today. At the time of the site survey, plant staffs were uncertain as to the status of the new UV system and hydraulic modifications.
The electrical needs of the current system are estimated at a maximum demand of 100 kW resulting in an annual energy use approximation of 750,000 kWh/yr when the system was in operation. The existing system is challenging and inefficient on many levels including energy, operations, hydraulic capacity and maintenance. This observation was based on operator interviews and observing the failed equipment.
Several deficiencies were noted from observations and interviews with operators. These include the need to operate both channels continuously due to hydraulic control and regulation limitations during flow variations, and the need for frequent module removal and cleaning of the lamps, which is currently a manual operation. In addition, both trains have very limited turn-down capabilities. In essence, the UV system was at times either over disinfecting the effluent prior to discharge or the effectiveness of the UV was degraded by the accumulation of dirt and grease on the lamps over time.
30

5
Section 5. Energy Conservation Opportunities (ECO)
County of Honolulu and Kailua WWTP
Estimated Energy and Cost Savings The estimated electrical demand energy savings by installing a higher efficiency lamp system with automatic modulation and self cleaning is 50 kW. Based on a 99% on-line reliability factor, medium pressure high efficiency lamps, self cleaning and auto turndown the energy savings are estimated to be 438,000 kWh per year.
The total estimated annual Cost Savings (CS) is the sum of the Electrical Energy Cost Savings (ECS) and Demand Cost Savings (DCS). The electrical energy and demand charges are based on the HECO 2008-09 data as presented in Section 4.
CS = (ECS)(Usage Charge) + (DCS)(Demand Charge) CS = 438,000 (kWh/yr) X 0.202 ($/kWh)] + [500 (kW) X 0 ($/kW−month) X
12 (months/yr)] CS = $88,500/yr + $0/yr CS = $88,500/yr
Estimated Implementation Cost and Payback The total preliminary estimated cost to implement this ECO is $400,000. This estimate includes the cost for design and installation of new high efficiency lamp, auto electrical turn-down UV system, an emergency overflow protection tank upgrade and electrical upgrades. An allocation of $100,000 has been designated for the hydraulic overflow protection improvement and electrical upgrades and will be added to the ECO for a total anticipated project cost of approximately $500,000.
Based on this preliminary assessment, the simple payback period would be 5.6 years.
The following assumptions were made about this ECO: 1. UV disinfection is required for all effluent being discharged to the ocean outfall. 2. Plant secondary effluent quality and disinfection requirements do not change. 3. Hydraulic overflow improvements will be completed prior to or during the new
UV system installation. 4. Self-cleaning lamps and automatic turn-down controls capable of regulation down
to 30% of lamp intensity provided. 5. Cost savings estimated were based on current electric demand rates and cost
adjustment factors. Future rates for the site may go up or down and would impact the cost savings estimates in this ECO accordingly.
The following steps are required to implement this ECO: 1) Complete hydraulic structure emergency overflow protection study. 2) Confirm if UV disinfection is a permanent requirement. 3) Implement recommendations. 4) Verify energy savings.
31
5
Section 5. Energy Conservation Opportunities (ECO)
County of Honolulu and Kailua WWTP
Plant Staffing Impact Implementation of this ECO is not anticipated to require additional staff support and environmental oversight.
Photo Gallery
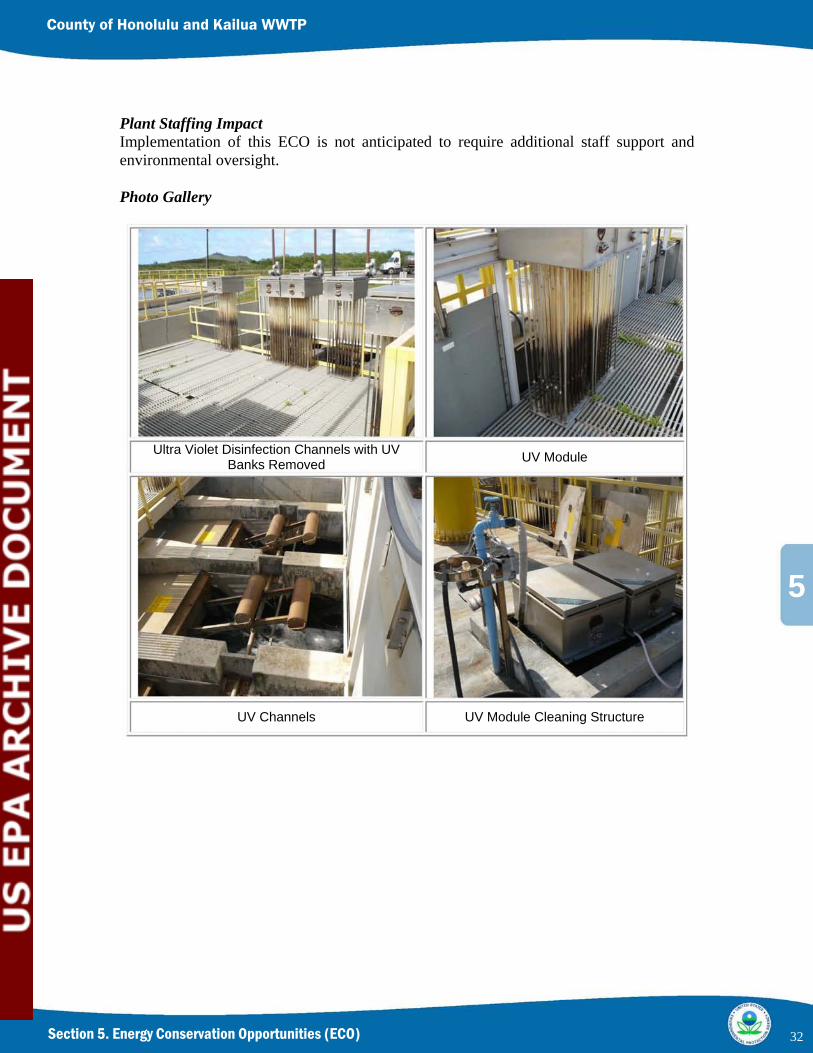
Ultra Violet Disinfection Channels with UV UV Module Banks Removed
UV Channels UV Module Cleaning Structure
32

5
Section 5. Energy Conservation Opportunities (ECO)
County of Honolulu and Kailua WWTP
ECO 4 – Conduct Cogeneration Feasibility Study and Implement Recommendations
Recommendation It is recommended that the Kailua WWTP consider further investment in the evaluation of the opportunity to implement cogeneration at the treatment plant. The facility generates digester gas with a heating value of 550 – 600 BTU per cubic foot. In 2002, a Wastewater Cogeneration Feasibility Study, C.H. Guernsey & Company was completed to evaluate the merits of installing a cogeneration facility to offset the electrical purchase. Since 2002, technology advancement in the digester gas cleaning systems as well as digester utilization systems has shown great improvement. Installation of a system sized between 500 kW to 600 kW would produce between 4,000 MWh/yr to 4,800 MWh/yr. With site annual electrical usage around 7,800 MWh/yr, the cogeneration system would provide upwards of 50% to 60% of the plant electrical use requirements. Estimated energy, power demand, and cost savings and simple payback from such installations are summarized below.
Estimated Electrical Energy Savings = 4,000,000 kWh/yr Estimated Electrical Demand Savings = 500 kW
Estimated Total Energy Cost Savings = $808,000/yr Estimated Annual O&M Costs = ($150,000/yr) Estimated Net Savings per Year = $658,000/yr Estimated Implementation Cost = $3,750,000 Simple Payback = 5.7 years
Background The Tetra Tech team observed the digester operations and had a discussion with Mr. Shelton Hunt a representative from C.H. Guernsey, Inc. currently updating the cogeneration study, as part of the on site audit process. Past cogeneration studies, indicated adequate site derived digester gas production to design, install and operate a 500 to 600 kW cogeneration facility. The cogeneration configuration may include electrical generation, waste heat for the digesters and supplemental cooling to the administration and electrical motor control centers (MCC). Electrical rate increases, lack of electrical service reliability, technological advancement in the gas cleaning and cogeneration equipment and the drive to be sustainable all point to a careful review and consideration of implementation of cogeneration.
Estimated Energy and Cost Savings The estimated electrical demand energy savings by installing a 500 kW cogeneration system is 500 kW. Based on a 90% on-line reliability factor, 8,000 hours per year, the energy savings would be 4,000,000 kWh per year.
The total estimated annual Cost Savings (CS) is the sum of the Electrical Energy Cost Savings (ECS) and Demand Cost Savings (DCS). The electrical energy and demand charges are based on the HECO 2008-09 data as presented in Section 4.
33
5
Section 5. Energy Conservation Opportunities (ECO)
County of Honolulu and Kailua WWTP
CS = (ECS)(Usage Charge) + (DCS)(Demand Charge) CS = 4,000,000 (kWh/yr) X 0.202 ($/kWh)] + [500 (kW) X 0 ($/kW−month) X
12 (months/yr)] CS = $808,000/yr + $0/yr CS = $808,000/yr
Estimated Implementation Cost and Payback The total preliminary estimated cost to implement this ECO is $ 3,250,000. This estimate includes the cost for cogeneration equipment, as well as electrical and central plant infrastructure upgrades. The electrical upgrades to “clean-up the harmonics and other poor load factor areas” within the plant is estimated at $ 500,000. In addition, supplemental propane and consumables will be required on an ongoing basis to support the cogeneration operation. An annual cost allowance of $150,000 for consumables, maintenance and staffing is estimated.
Based on this preliminary assessment, the simple payback period would be 5.7 years.
The following assumptions were made about this ECO: 1. Adequate digester gas will be available with no more than 30% propane
required. 2. Existing boilers will serve as supplemental heat back-up capabilities. 3. Air quality and environmental issues will be addressed as part of ECO. 4. A 90% cogeneration reliability factor is adequate for facility staffing. 5. Operation and maintenance costs will not exceed $150,000 per year for
maintenance ($50,000/yr), operation ($50,000/yr) and consumables ($ 50,000/yr).
6. A digester gas cleaning process will be provided to remove hydrogen sulfide and Siloxane.
7. Electrical upgrades will be completed prior to or with the cogeneration project.
8. Cost savings estimated were based on current electric demand rates and cost adjustment factors. Future rates for the site may go up or down and would impact the cost savings estimates in this ECO accordingly.
The following steps are required to implement this ECO: 1) Update Cogeneration Feasibility Study. 2) Implement recommendations. 3) Verify energy savings
Plant Staffing Impact Implementation of this ECO is anticipated to require some additional staff support and environmental oversight.
Environmental Impact: Implementation of this ECO will require additional permitting (air quality) as well as noise attenuation and abatement.
34

5
Section 5. Energy Conservation Opportunities (ECO)
County of Honolulu and Kailua WWTP
Photo Gallery
Existing Digester Gas Boiler Digester Gas Waste Gas Flare
Internal Combustion Engines IC Engine
35
6
Section 6. Sustainable Energy Opportunities
County of Honolulu and Kailua WWTP
SECTION 6 Sustainable Energy Opportunities
An evaluation, of sustainable design concepts, was performed to identify opportunities for incorporating innovative initiatives such as renewable energy alternatives at the Kailua Wastewater Treatment Plant. The following table lists the sustainable design options evaluated at this facility for energy use impact and/or the opportunity to improve the site’s environmental impact. Recommendations are provided for those options the site should consider for further feasibility.
36
37
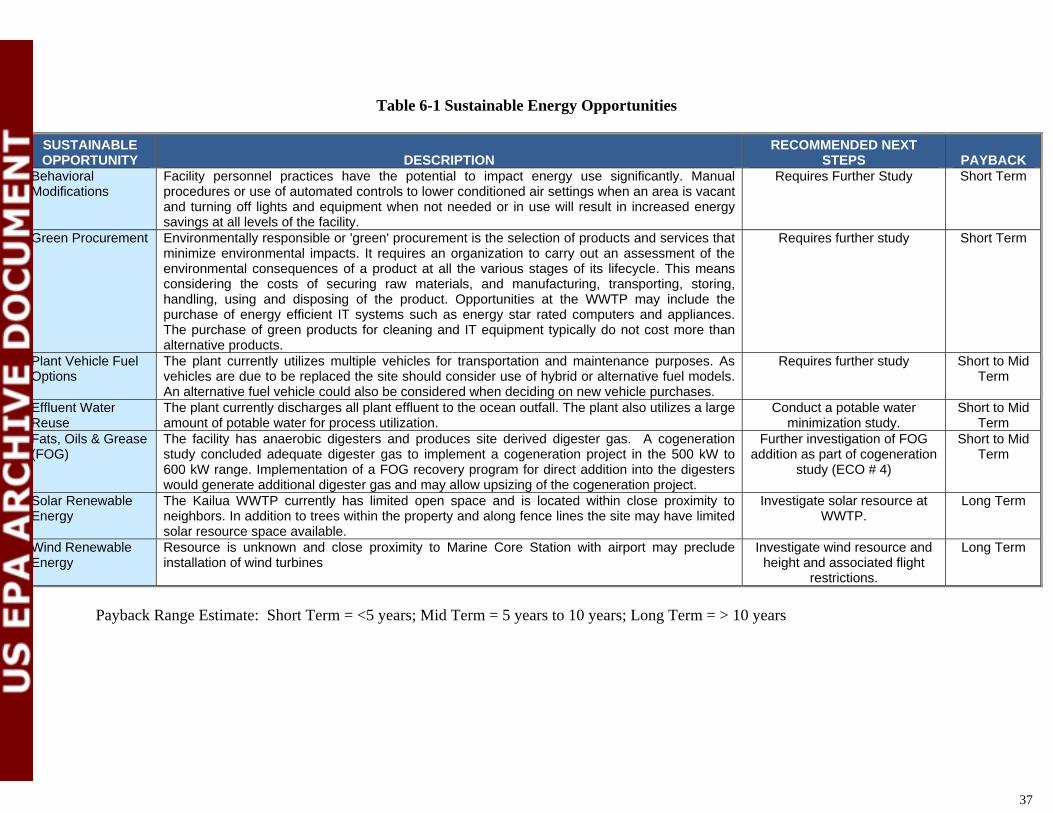
Table 6-1 Sustainable Energy Opportunities
SUSTAINABLE OPPORTUNITY DESCRIPTION
RECOMMENDED NEXT STEPS PAYBACK
Behavioral Modifications
Facility personnel practices have the potential to impact energy use significantly. Manual procedures or use of automated controls to lower conditioned air settings when an area is vacant and turning off lights and equipment when not needed or in use will result in increased energy savings at all levels of the facility.
Requires Further Study Short Term
Green Procurement Environmentally responsible or 'green' procurement is the selection of products and services that minimize environmental impacts. It requires an organization to carry out an assessment of the environmental consequences of a product at all the various stages of its lifecycle. This means considering the costs of securing raw materials, and manufacturing, transporting, storing, handling, using and disposing of the product. Opportunities at the WWTP may include the purchase of energy efficient IT systems such as energy star rated computers and appliances. The purchase of green products for cleaning and IT equipment typically do not cost more than alternative products.
Requires further study Short Term
Plant Vehicle Fuel Options
The plant currently utilizes multiple vehicles for transportation and maintenance purposes. As vehicles are due to be replaced the site should consider use of hybrid or alternative fuel models. An alternative fuel vehicle could also be considered when deciding on new vehicle purchases.
Requires further study Short to Mid Term
Effluent Water Reuse
The plant currently discharges all plant effluent to the ocean outfall. The plant also utilizes a large amount of potable water for process utilization.
Conduct a potable water minimization study.
Short to Mid Term
Fats, Oils & Grease (FOG)
The facility has anaerobic digesters and produces site derived digester gas. A cogeneration study concluded adequate digester gas to implement a cogeneration project in the 500 kW to 600 kW range. Implementation of a FOG recovery program for direct addition into the digesters would generate additional digester gas and may allow upsizing of the cogeneration project.
Further investigation of FOG addition as part of cogeneration
study (ECO # 4)
Short to Mid Term
Solar Renewable Energy
The Kailua WWTP currently has limited open space and is located within close proximity to neighbors. In addition to trees within the property and along fence lines the site may have limited solar resource space available.
Investigate solar resource at WWTP.
Long Term
Wind Renewable Energy
Resource is unknown and close proximity to Marine Core Station with airport may preclude installation of wind turbines
Investigate wind resource and height and associated flight
restrictions.
Long Term
Payback Range Estimate: Short Term = <5 years; Mid Term = 5 years to 10 years; Long Term = > 10 years
37
7
Section 7. Additional ECO Considerations
County of Honolulu and Kailua WWTP
SECTION 7 Additional Energy Conservation Considerations
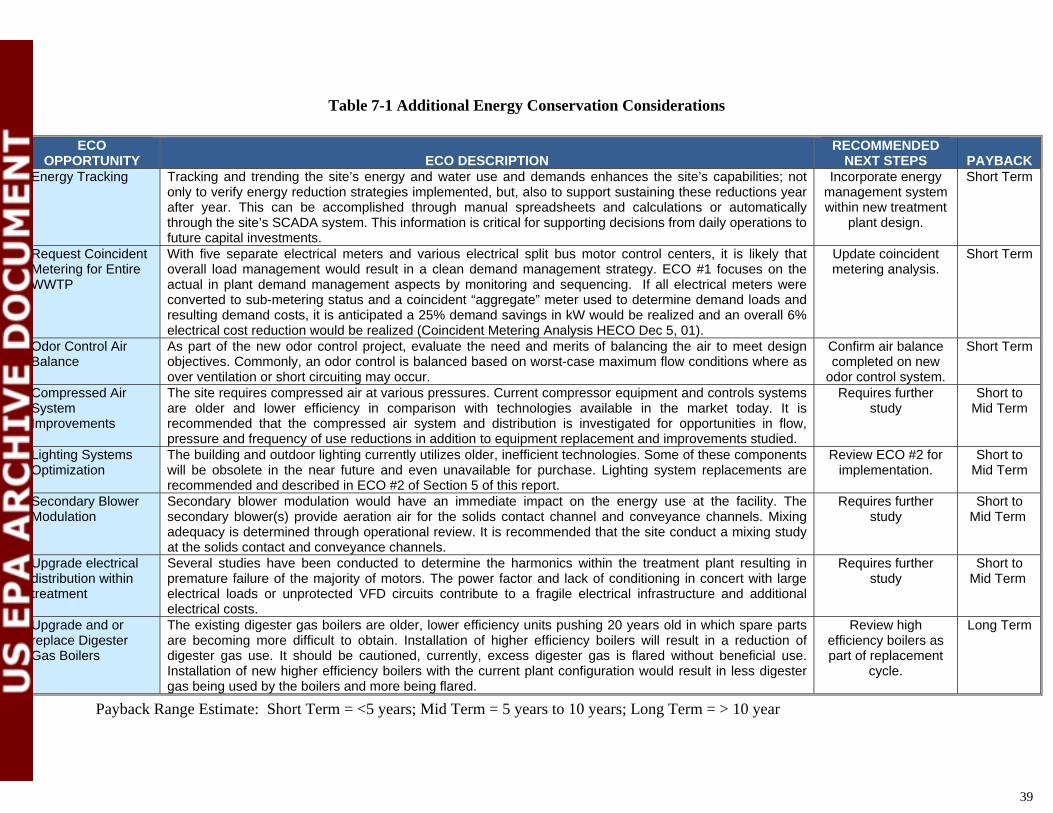
During the course of the site visit and in review of the planned wastewater treatment plant expansion, a review of the proposed upgrades was conducted which identified additional missed energy and cost savings related to resource conservation. While Tetra Tech was unable to detail these opportunities within the limits of this initial study, these items warrant further attention, whether requiring additional study or simply operations and maintenance actions. Table 7-1 lists the opportunities noted and explains the nature of actions required to capitalize on the items listed.
38
39
Table 7-1 Additional Energy Conservation Considerations
ECO OPPORTUNITY ECO DESCRIPTION
RECOMMENDED NEXT STEPS PAYBACK
Energy Tracking Tracking and trending the site’s energy and water use and demands enhances the site’s capabilities; not only to verify energy reduction strategies implemented, but, also to support sustaining these reductions year after year. This can be accomplished through manual spreadsheets and calculations or automatically through the site’s SCADA system. This information is critical for supporting decisions from daily operations to future capital investments.
Incorporate energy management system within new treatment
plant design.
Short Term
Request Coincident Metering for Entire WWTP
With five separate electrical meters and various electrical split bus motor control centers, it is likely that overall load management would result in a clean demand management strategy. ECO #1 focuses on the actual in plant demand management aspects by monitoring and sequencing. If all electrical meters were converted to sub-metering status and a coincident “aggregate” meter used to determine demand loads and resulting demand costs, it is anticipated a 25% demand savings in kW would be realized and an overall 6% electrical cost reduction would be realized (Coincident Metering Analysis HECO Dec 5, 01).
Update coincident metering analysis.
Short Term
Odor Control Air Balance
As part of the new odor control project, evaluate the need and merits of balancing the air to meet design objectives. Commonly, an odor control is balanced based on worst-case maximum flow conditions where as over ventilation or short circuiting may occur.
Confirm air balance completed on new
odor control system.
Short Term
Compressed Air System Improvements
The site requires compressed air at various pressures. Current compressor equipment and controls systems are older and lower efficiency in comparison with technologies available in the market today. It is recommended that the compressed air system and distribution is investigated for opportunities in flow, pressure and frequency of use reductions in addition to equipment replacement and improvements studied.
Requires further study
Short to Mid Term
Lighting Systems Optimization
The building and outdoor lighting currently utilizes older, inefficient technologies. Some of these components will be obsolete in the near future and even unavailable for purchase. Lighting system replacements are recommended and described in ECO #2 of Section 5 of this report.
Review ECO #2 for implementation.
Short to Mid Term
Secondary Blower Modulation
Secondary blower modulation would have an immediate impact on the energy use at the facility. The secondary blower(s) provide aeration air for the solids contact channel and conveyance channels. Mixing adequacy is determined through operational review. It is recommended that the site conduct a mixing study at the solids contact and conveyance channels.
Requires further study
Short to Mid Term
Upgrade electrical distribution within treatment
Several studies have been conducted to determine the harmonics within the treatment plant resulting in premature failure of the majority of motors. The power factor and lack of conditioning in concert with large electrical loads or unprotected VFD circuits contribute to a fragile electrical infrastructure and additional electrical costs.
Requires further study
Short to Mid Term
Upgrade and or replace Digester Gas Boilers
The existing digester gas boilers are older, lower efficiency units pushing 20 years old in which spare parts are becoming more difficult to obtain. Installation of higher efficiency boilers will result in a reduction of digester gas use. It should be cautioned, currently, excess digester gas is flared without beneficial use. Installation of new higher efficiency boilers with the current plant configuration would result in less digester gas being used by the boilers and more being flared.
Review high efficiency boilers as part of replacement
cycle.
Long Term
Payback Range Estimate: Short Term = <5 years; Mid Term = 5 years to 10 years; Long Term = > 10 year
39