Embed Size (px)
DESCRIPTION
All friends must see it.
Citation preview
138. Amanpreet Kaur, Assistant Professor ( Soil Science), Department of Soil Science, PunjabAgricultural University, Ludhiana ( Punjab).
139. Balbir Kaur, Subject Matter Specialist ( Horticulture), KVK, Jalandhar ( Punjab).
140. Divakar Singh Tomar, Subject Matter Specialist (Agronomy), KVK, Ujjain ( Madhya Pradesh)
141. Gulzar Singh Sanghera, Senior Scientist (Plant Breeding), PAU’s Regional Research Station,Kapurthala (Punjab).
142. Gurmail Singh, Subject Matter Specialist (Plant Protection), KVK, Mukatsar (Punjab).
143. Jasvir Singh, District Extension Specialist (Agronomy), FASS, Kapurthala ( Punjab).
144. Ketankumar Dhirajlal Butani, Subject Matter Specialist ( Agricultural Extension) , KVK,Lokbharti at Sanosara, Bhavnagar (Gujarat)
145. Loveleesh Garg, Assistant Professor ( Extension Education), Department of Extenson Education,Punjab Agricultural University, Ludhiana ( Punjab).
146. Madhusmita Kataky, Subject Matter Specialist (Plant Protection), KVK, Diphu, Karbi Anglong(Assam)
147. Manisha Bhatia, Subject Matter Specialist (Home Science), KVK, Shaheed Bhagat Singh Nagar( Punjab).
148. Monika Gupta, Assistant Professor of Horticulture, Department of Fruit Science, PunjabAgricultural University, Ludhiana (Punjab).
149. Nigamkumar Prabhakar Shukla, Programme Coordinator, KVK, Lokbharti at Sanosara,Bhavnagar (Gujarat)
150. Onkar Singh, Agronomist, PAU’s Regional Research Station, Kapurthala (Punjab).
151. P K Ghumman, Programme Coordinator, KVK, Gurdaspur ( Punjab).
152. Paramjit Kaur, Assistant Agronomist , Department of Agronomy, Punjab Agricultural University,Ludhiana ( Punjab).
153. Prahlad Singh, Programme Coordinator, KVK, Tarantaran ( Punjab).
154. Pravin Pati Tripathi, Subject Matter Specialist (Plant Protection), KVK, Pampoli, Seepa, EastKameng ( Arunachal Pradesh)
155. Satish Kumar Verma, Programme Coordinator, KVK, Janjgir- Champa (Chhattisgarh).
156. Smita Bhatnagar, Subject Matter Specialist (Home Science), KVK , Jaipur (Rajasthan).
SCIENTISTS JOINED AS LIFE MEMBER OF SOCIETY OF KRISHI VIGYAN

Editor’s MessageDear Readers,
I feel really pleased and honoured to introduce
myself as editor of a new journal called Journal
of Krishi Vigyan , a half yearly journal being
published by the Society of Krishi Vigyan for the
benefit of scientific community particularly young
scientists. I hope that this journal would be the
first in its kind which publishes research papers
pertaining to all fields of agriculture and allied
sectors. Hence, within a short span of just two
years, we are receiving tremendous response from
all agricultural scientists working across the
country in research, extension and teaching
streams. Similarly, the efforts being made by the
Dr. Manoj Sharma, Secretary of the society are
worth appreciating who is in constant touch with
the faculty working in the Krishi Vigyan Kendras
and is motivating the young faculty particularly
those who are serving in the extension stream to
document, write, edit and submit the different
unique experiences attained by them while
working with the farming community in different
parts of the country. As a result of which, this
journal is having its central executive committee
from 21 states. Likewise in every issue, efforts
are made to include papers written on some
different or newer aspect. Our goal is to create a
new forum for exchange of information on all
aspects of agriculture and allied fields. Future
scope of this journal is open to your suggestions.
Therefore, I would like to encourage you to submit
original research notes as well as opinions,
technical reports, and short communications in the
general area of agriculture, horticulture, forestry,
fisheries, animal husbandry, poultry and activities
related to farm women.
Too often we forget that a journal, even a
scientific journal, can survive only if it meets the
expectations of its readers and is fruitful to them.
Too often scientific journals
are managed having only
authors in mind. However,
authors, before being authors,
were readers; and every new
work is – and shall be –
inspired by a thorough
literature search. Moreover,
today’s readers will probably be tomorrow’s
authors. If we offer them a qualified, broad insight
on the most innovative works from the farmers’
field, we not only serve them, but we also
contribute to educate new generations of authors,
thus ensuring a bright future for this journal. All
this can be achieved through constant feedback
from our readers. So, please, do not hesitate to
contact me with your comments, complaints and
suggestions. They will surely help me in making
my job more and more useful and desirable. The
success of this publication depends on your
response. I would appreciate your feedback. I may
be reached via E-mail at [email protected]
or visit society’s website www.iskv.in for any
clarification.
(Dr Gagandeep Kaur)
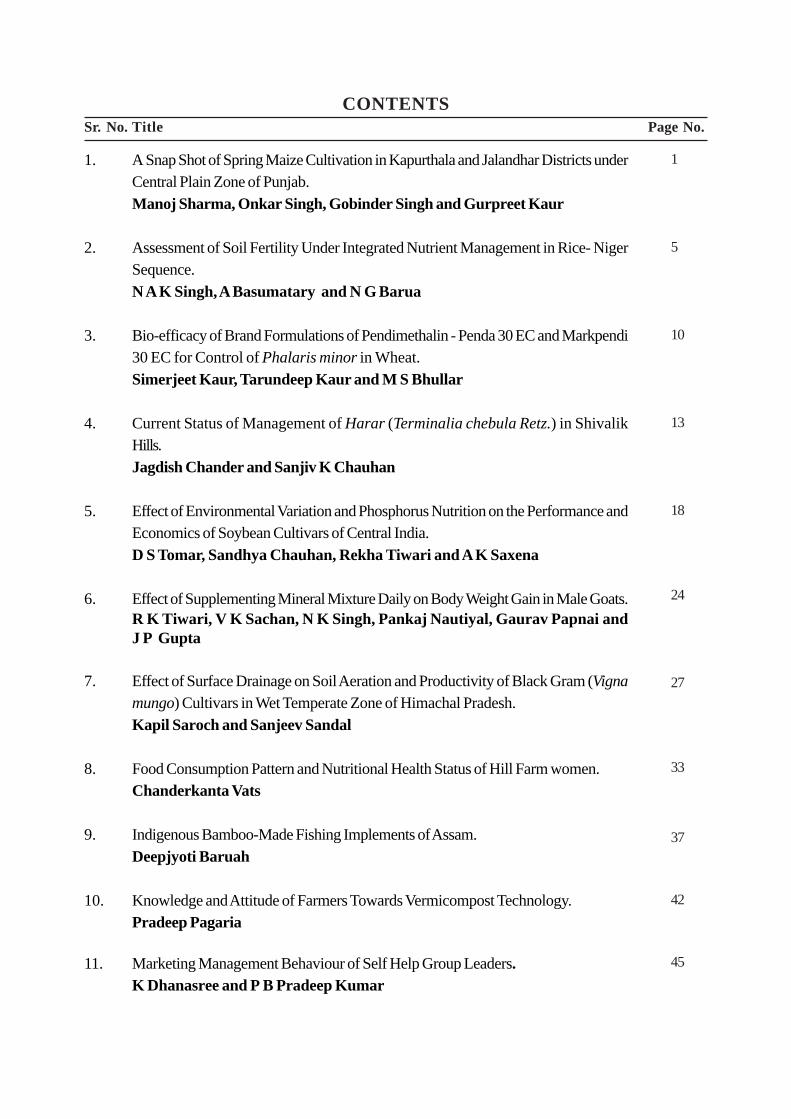
CONTENTSSr. No. Title Page No.
1. A Snap Shot of Spring Maize Cultivation in Kapurthala and Jalandhar Districts underCentral Plain Zone of Punjab.Manoj Sharma, Onkar Singh, Gobinder Singh and Gurpreet Kaur
2. Assessment of Soil Fertility Under Integrated Nutrient Management in Rice- NigerSequence.N A K Singh, A Basumatary and N G Barua
3. Bio-efficacy of Brand Formulations of Pendimethalin - Penda 30 EC and Markpendi30 EC for Control of Phalaris minor in Wheat.Simerjeet Kaur, Tarundeep Kaur and M S Bhullar
4. Current Status of Management of Harar (Terminalia chebula Retz.) in ShivalikHills.Jagdish Chander and Sanjiv K Chauhan
5. Effect of Environmental Variation and Phosphorus Nutrition on the Performance andEconomics of Soybean Cultivars of Central India.D S Tomar, Sandhya Chauhan, Rekha Tiwari and A K Saxena
6. Effect of Supplementing Mineral Mixture Daily on Body Weight Gain in Male Goats.R K Tiwari, V K Sachan, N K Singh, Pankaj Nautiyal, Gaurav Papnai andJ P Gupta
7. Effect of Surface Drainage on Soil Aeration and Productivity of Black Gram (Vignamungo) Cultivars in Wet Temperate Zone of Himachal Pradesh.Kapil Saroch and Sanjeev Sandal
8. Food Consumption Pattern and Nutritional Health Status of Hill Farm women.Chanderkanta Vats
9. Indigenous Bamboo-Made Fishing Implements of Assam.Deepjyoti Baruah
10. Knowledge and Attitude of Farmers Towards Vermicompost Technology.Pradeep Pagaria
11. Marketing Management Behaviour of Self Help Group Leaders.K Dhanasree and P B Pradeep Kumar
1
5
10
13
18
24
27
33
37
42
45
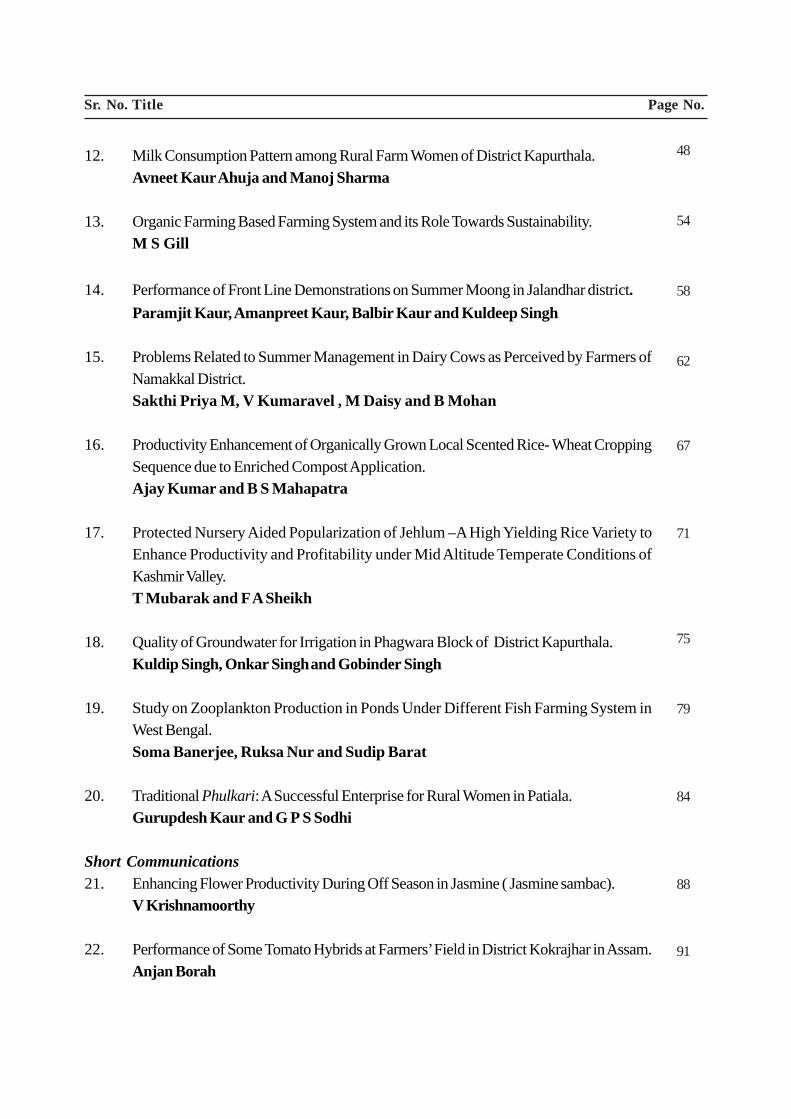
Sr. No. Title Page No.
12. Milk Consumption Pattern among Rural Farm Women of District Kapurthala.Avneet Kaur Ahuja and Manoj Sharma
13. Organic Farming Based Farming System and its Role Towards Sustainability.M S Gill
14. Performance of Front Line Demonstrations on Summer Moong in Jalandhar district.Paramjit Kaur, Amanpreet Kaur, Balbir Kaur and Kuldeep Singh
15. Problems Related to Summer Management in Dairy Cows as Perceived by Farmers ofNamakkal District.Sakthi Priya M, V Kumaravel , M Daisy and B Mohan
16. Productivity Enhancement of Organically Grown Local Scented Rice- Wheat CroppingSequence due to Enriched Compost Application.Ajay Kumar and B S Mahapatra
17. Protected Nursery Aided Popularization of Jehlum –A High Yielding Rice Variety toEnhance Productivity and Profitability under Mid Altitude Temperate Conditions ofKashmir Valley.T Mubarak and F A Sheikh
18. Quality of Groundwater for Irrigation in Phagwara Block of District Kapurthala.Kuldip Singh, Onkar Singh and Gobinder Singh
19. Study on Zooplankton Production in Ponds Under Different Fish Farming System inWest Bengal.Soma Banerjee, Ruksa Nur and Sudip Barat
20. Traditional Phulkari: A Successful Enterprise for Rural Women in Patiala.Gurupdesh Kaur and G P S Sodhi
Short Communications21. Enhancing Flower Productivity During Off Season in Jasmine ( Jasmine sambac).
V Krishnamoorthy
22. Performance of Some Tomato Hybrids at Farmers’ Field in District Kokrajhar in Assam.Anjan Borah
48
54
58
62
67
71
75
79
84
88
91
1
A Snap Shot of Spring Maize Cultivation inKapurthala and Jalandhar Districts under Central
Plain Zone of PunjabManoj Sharma, Onkar Singh1, Gobinder Singh and Gurpreet Kaur
Krishi Vigyan Kendra, Kapurthala-144 620 (Punjab)
ABSTRACTMaize (Zea mays L.) can play an important role in the crop diversification in Punjab. It is usedin poultry and animal feed and for the manufacturing of starch, glucose and corn flakes. It isalso used as a human food during winter season. Traditionally maize was grown as kharif cropand now sowing during rabi season has also been started in some districts with the developmentof new varieties and hybrids. Maize can be grown successfully during spring season. Thepresent study was undertaken to assess the area under different maize hybrids grown in springseason, its productivity and gross returns of the farmers in the Jalandhar and Kapurthala districtsof Punjab. The results revealed that majority of farmers prefer to sow seeds of two hybridsnamely 31Y45 and DKC 9108 with an average yield around 96q/ha. These hybrids on anaverage resulted in a gross return around Rs 81,600/ha. Among the blocks studied, the maximumarea was in the Kapurthala block. The highest grain yield obtained was in Kartarpur block butthe selling rate and gross returns were maximum in Lohian block. Among the different categoriesof the farmers according to their land holdings, the maximum area was planted by farmers ofcategory having land more than 20 ha. and they also got the maximum gross returns.
Key Words: Spring Maize, Hybrids, Cultivation, Jalandhar, Kapurthala.
INTRODUCTIONThe state of Punjab remains a classic example
of a fast developing economy with agriculture asits base. The state is pioneer in ushering in thegreen revolution in the country. Besides this, thestate has also made remarkable progress in alliedsectors like dairy, poultry, fishery and also in theproduction of fruits and vegetables.
Punjab is an agrarian state having paddy andwheat as its main crops. The continuous adoptionof rice-wheat cropping system in the Indo-Gangetic plains of the Indian sub-continent hasled to a number of adverse effects (Chhiba, 2008)including deterioration of soil health, severeground water depletion and emergence of newinsect-pests, diseases and weeds which warrantsthe need for crop diversification. Due to plenty ofthese food grains, the central and stategovernments are pursuing the farmers to diversify
J Krishi Vigyan 2014, 3(1) : 1-4 DOI: 10.5958/2349-4433.2014.01238.0
their cropping pattern and adopt maize as one ofthe major alternative crop. Maize can playimportant role in crop diversification policy of thestate. It is used in poultry and animal feed and forthe manufacture of starch, glucose, corn flakes. Itis also used as a human food (Makki di roti) inwinter season as a special delicious recipe incombination with Sarson ka-sag.
Maize crop is mainly grown in the districts ofHoshiarpur, Roopnagar, Shaheed Bhagat SinghNagar, Amritsar, Gurdaspur, Jalandhar,Kapurthala, Patiala, Ludhiana, SAS Nagar andFatehgarh Sahib in the state. Traditionally maizewas grown as kharif crop and now sowing duringrabi season has also been started in some districts.With the development of new hybrids, it is nowpossible to raise spring crop in Hoshiarpur,Shaheed Bhagat Singh Nagar, Jalandhar andKapurthala. Out of these districts Jalandhar and
*Corresponding Author’s Email: [email protected]’s Regional Research Station, Kapurthala-144 620 (Punjab)
J Krishi Vigyan 2014, 3(1) : 1-4
2
Kapurthala comes under central plain zone andin this area, the major cropping system followedis paddy- potato-muskmelon, paddy- potato-maize, paddy-potato-sunflower, paddy- potato-late sown wheat, paddy-potato-peas, etc. Hence,after harvesting of potato in the month fromDecember to February, farmers decide about tothe next crop to be sown i.e. maize muskmelon,sunflower, peas or late sown wheat dependingupon the prevailing weather conditions. Springmaize may also be more profitable as it helps inmeeting the green cob demand during earlysummer (Verma and Mishra, 1998). In order tosee the change in cropping pattern year after year,it is essential to note down the status of springmaize cultivation every year so that later on somepolicy can be chalked out for the area. Therefore,the present study was undertaken to assess thearea under different maize hybrids, its productivityand gross returns of the farmers in both thedistricts.
MATERIALS AND METHODSIn both the districts, a total 125 farmers were
interviewed in order to know the size of landholding, hybrids of maize grown along with other
information regarding spring maize cultivationduring the year 2014. There are 5 blocks inKapurthala but maize is cultivated in Sultanpurand Kapurthala blocks where as the adjoiningblocks of Jalandhar district namely Jalanadhar,Nakodar, Lohian and Kartarpur were alsoselected. A random sampling technique wasfollowed for interview purpose. A questionnairewas developed and the information was collectedon various parameters. The various parametersnoted were area sown, grain yield obtained, rateof selling the produce in the market, days takenfor harvesting and returns obtained. Data wereclassified by using frequency and averages etc.
RESULTS AND DISCUSSIONIt has been observed that during the sowing
season in the months of January and February,there are number of private companies dealingwith the seed roaming in the farmers field in orderto convince the farmers regarding the performanceof hybrid seeds available with the said firm. Onthe basis of experience of last year, neighbouringfarmer, dealers, availability of seed in the marketand price of hybrid seed, farmers take decisionregarding the selection of cultivar for sowing thecrop.
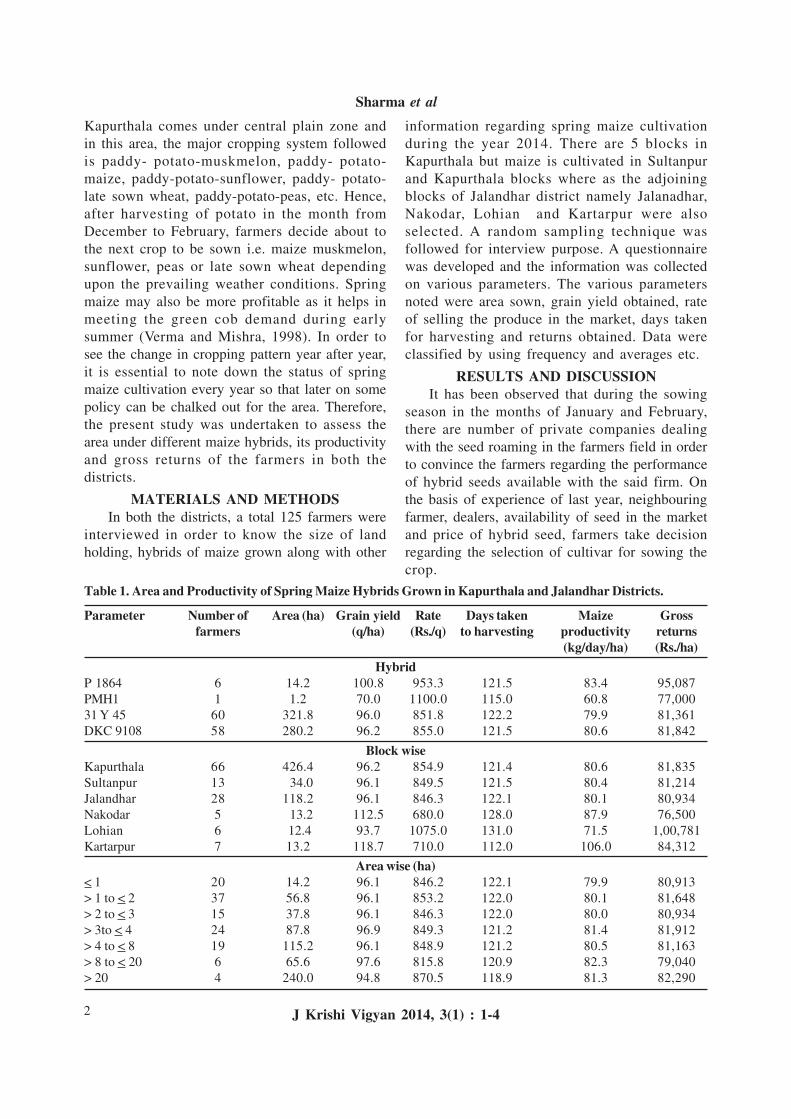
Table 1. Area and Productivity of Spring Maize Hybrids Grown in Kapurthala and Jalandhar Districts.
Parameter Number of Area (ha) Grain yield Rate Days taken Maize Grossfarmers (q/ha) (Rs./q) to harvesting productivity returns
(kg/day/ha) (Rs./ha)Hybrid
P 1864 6 14.2 100.8 953.3 121.5 83.4 95,087PMH1 1 1.2 70.0 1100.0 115.0 60.8 77,00031 Y 45 60 321.8 96.0 851.8 122.2 79.9 81,361DKC 9108 58 280.2 96.2 855.0 121.5 80.6 81,842
Block wiseKapurthala 66 426.4 96.2 854.9 121.4 80.6 81,835Sultanpur 13 34.0 96.1 849.5 121.5 80.4 81,214Jalandhar 28 118.2 96.1 846.3 122.1 80.1 80,934Nakodar 5 13.2 112.5 680.0 128.0 87.9 76,500Lohian 6 12.4 93.7 1075.0 131.0 71.5 1,00,781Kartarpur 7 13.2 118.7 710.0 112.0 106.0 84,312
Area wise (ha)< 1 20 14.2 96.1 846.2 122.1 79.9 80,913> 1 to < 2 37 56.8 96.1 853.2 122.0 80.1 81,648> 2 to < 3 15 37.8 96.1 846.3 122.0 80.0 80,934> 3to < 4 24 87.8 96.9 849.3 121.2 81.4 81,912> 4 to < 8 19 115.2 96.1 848.9 121.2 80.5 81,163> 8 to < 20 6 65.6 97.6 815.8 120.9 82.3 79,040> 20 4 240.0 94.8 870.5 118.9 81.3 82,290
J Krishi Vigyan 2014, 3(1) : 1-4
Sharma et al
3
Performance and choice of hybridsThere were 4 different hybrids from public
and private concern (Table 1). It was found thathybrid 31Y 45 of M/S DuPont Pioneer,formerly Pioneer Hi-Bred was sown on an areaof about 322 ha by 60 farmers (48%) but theselling rate was found to be the lowest (Rs. 852/q). Another hybrid DKC 9108 of M/S MonsantoCompany, was also grown on an area of 280haby 58 farmers. Therefore, both these hybrids ofprivate firms were most popular among the farmersof both the districts. Moreover, the averageproductivity is almost same i.e. about 96 q/ha.Similarly, the number of days taken to maturitywas 121 to 122 whereas per day productivity wasfound to be about 80 kg/day/ha. The selling priceof PMH 1 was maximum (Rs.1100/q) followedby P 1864 and the most popular hybrids hadcomparable selling price (Rs 850/q). The grossreturns were almost comparable among thesehybrids (31Y45 and DKC 9108) but it wasmaximum in P1864 and the difference was aboutRs 13,800/ha as compared to the two popularhybrids, which was mainly due to higher sellingprice of produce of this hybrid. But the farmersare growing more of 31Y45 and DKC 9108hybrids which might be due to easy availabilityof seed or intensive marketing strategy of thecompanies producing them. Hence, it can be saidthat in maize cultivation, both these privatehybrids have their monopoly among the farmersof the area.
Site SpecificityThe results of the present study showed that
maximum 426 ha area was observed in Kapurthalablock followed by Jalandhar. The highest grainyield was noticed in the Kartarpur block (118.7q/ha), which was followed by Nakodar (112.5q/ha)in rest of the blocks the grain yield was almostequal and was around 96.2q/ha, the lowest grainyield was noticed in Lohian (93.7q/ha). The maizeproduced in Lohian block fetched the highest price(Rs 1075/q), followed by Kartarpur, Sultanpur andJalandhar where price remained around Rs 850/q. The price in Nakodar block was the lowestamong all the blocks surveyed. The days takenfor harvesting was maximum in Lohian followedby Nakodar and was lowest in Kartarpur (112)and rest of the block had almost similar number
of days for harvest (around 122). Maizeproductivity (kg/day/h) was maximum in Kartarpur(106kg/day/ha) followed by Nakodar (87.9kg/day/ha) and was lowest in Lohian (71.5 kg/day/ha). Inrest of the blocks it was around 80 kg/day/ha. Themaximum gross return was obtained in Lohianblock and least was in Nakodar block.
Land holdingThe data (Table 1) revealed that maximum area
under maize was planted by farmers who werehaving the land above 20 ha followed by between4 to 8 ha and 3 to 4ha. It was interesting to notethat there were only 4 farmers having area morethan 20 ha and total area sown by these 4 farmerswas 240 ha. This was due to the fact that theypossess the machinery required for maizecultivation e.g. maize seed planter, bund maker,maize combine harvester, rotavator, tractor withmore horse power, trolleys, etc. Farmers havingland between 1 to 2 ha cultivated maize only on56.8 ha indicating that the small farmers try tosell this crop as green cob and if left will be usedfor grain purpose. Hence, it can be said that thefinancial condition of the farmers plays animportant role in selecting the crops to be sown atthe farms likewise, the large farmers also takesome land on lease for the production of cereal,oilseeds and for the vegetable mainly potato. Thegrain yield obtained per hectare by all groups ofland holdings was almost comparable (around96.25q/ha) except in case of the farmers havingland holding above 20 ha which had the lowestgrain yield of 94.8q/ha. The selling price waslowest for farmers having land holding between8 to 20 ha of land, while for the farmers of rest ofthe land holding categories the selling priceremained around Rs 850/q. while, the farmers ofthe highest land holding group fetched themaximum price (Rs 870/q) for the produce. Thedays taken for harvesting and maize productivityper day remained almost similar for all the landholding types. This might be due to the fact thatmajority of the farmers planted the two hybridsrequiring same number of days from sowing toharvest and had almost similar yield potential.Maximum gross return was noticed in case offarmers having land holding more than 20 ha,while the minimum was in case of farmersbelonging to 8 to 20 ha category.
J Krishi Vigyan 2014, 3(1) : 1-4
Spring Maize Cultivation in Kapurthala and Jalandhar
4
ConstraintsIn both these districts farmers take the land
on lease @ Rs75,000 to 1,00,000/ha/year. Mainlythey grow paddy as the main crop in order tocover up the land rent due to the assured marketand minimum selling price. In order to get theprofit, farmers prefer to grow, muskmelon,sunflower or maize keeping in view the grossreturns obtained during the previous years. Thisis the main reason that, area under all these threecrops go on varying every year. The mainconstraints perceived by the participating farmerswere:
1. Scarcity of labour required: For sowing of thecrop, earthling up, frequent irrigations, watchand word from parrots, crows and strayanimals.
2. Dwindling selling rate every year: Every yearthe farmers sell the produce at different ratesand this depends upon the quality of produce.
3. Occurrence of rain at harvesting time: Cropsown in the month of February –Marchbecame ready for harvesting in the month ofmid June - July and if rains occur during thistime cultivation of maize results in a loss.
4. High temperature: Due to very hightemperature in the month of May-Junesometimes pollination does not occur andresults in low yields.
5. Frequent irrigation: Farmers revealed that cropsown in spring season require frequentirrigation at an interval of 5-7 d and if there isno electricity available its cost of productionincreases manifolds.
6. The maize crop in Punjab is presently facingserious marketing problem due to highpercentage of moisture in grains. The moisturepercentage in the grains at the time ofharvesting may be up to 28 per cent but actualrequirement of moisture for proper storageand processing is approximately 14 per cent.This results in low price of crop. The sundrying during this period is not practicallypossible because it coincides with the
monsoons; moreover the sun drying is notuniform. Therefore, provision for artificiallydrying of maize needs to be made in the grainmarkets so that farmers can fetch a goodharvest and returns from the maize cultivation.
CONCLUSIONThis study revealed that farmers of the area
have good confidence in cultivating the springmaize and harvesting an average grain yield of96q/ha. However, the water requirement is veryhigh and therefore low water productivity butfarmers are reluctant to see the long term effect ofmaize cultivation during spring season. Similarly,the hybrid seeds evolved by the private seedcompanies market the seeds at very high rates.Due to small land holdings in both the districts,farmers go for three crops in a year in order to getmaximum profit from crop cultivation. In fact, itis not appropriate to increase area under springmaize due to the fact that the underground watertable in both these district is going down at a veryhigh rate and in Jalandhar district some of theblocks have been declared under dark zone. Itcan be concluded from the present study thatmajority of farmers prefer to sow seeds of twohybrids namely 31Y45 and DKC 9108 with anaverage yield around 96 q/ha. These hybridsresulted in a gross return around Rs 81,250/ha.Among the blocks studied, the maximum areaunder spring maize was in the Kapurthala block.The highest grain yield was in Kartarpur block,but the selling rate and gross returns weremaximum in Lohia block. Among the differentcategories of the farmers according to their landholdings the maximum area was planted byfarmers of category having land more than 20 haand they also got the maximum gross returns.
REFERENCESChhiba I M (2008). Soil fertility related problems in Punjab. Chhiba
I M and Kukal S S (eds) Irrigation Water and Soil FertilityManagement in Punjab. Tech Bull II, Niche Area of Excellence,Department of Soils, Punjab Agricultural University, Ludhiana.
Verma S S and Mishra S N (1998). Successful cultivation ofmaize in summer. Indian Farmers’ Digest 31: 17-18.
Received on 20/8/2014 Accepted on 30/9/2014
J Krishi Vigyan 2014, 3(1) : 1-4
Sharma et al
5
Assessment of Soil Fertility Under IntegratedNutrient Management in Rice- Niger Sequence
N A K Singh, 1 A Basumatary 2 and N G Barua 3
Department of Soil ScienceAssam Agricultural University, Jorhat-785013 ( Assam)
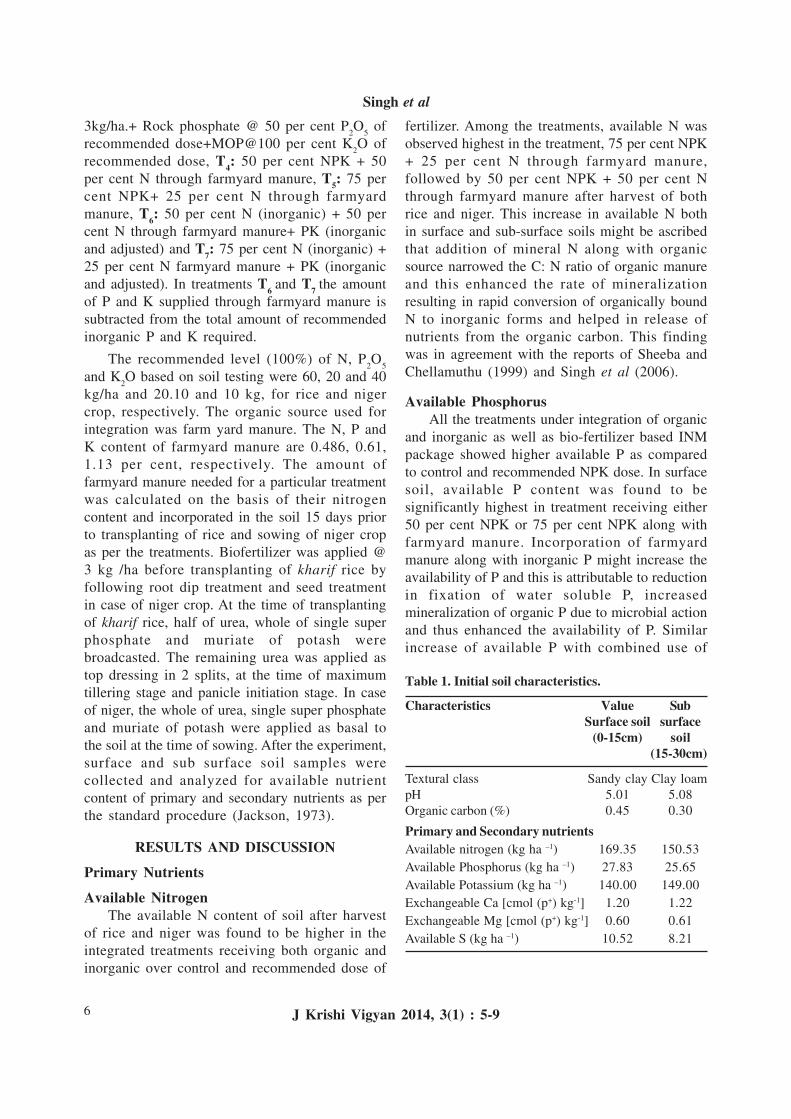
ABSTRACTA field experiment was conducted at the Instructional-cum-Research (ICR) Farm of AssamAgricultural University, Jorhat to assess the effect of integrated nutrient management on availablenutrient status of soil under rice-niger sequence. It showed that application of 50 per cent ofrecommended NPK+50 per cent N FYM and 75 per cent of recommended NPK+25 per cent NFYM were superior treatments and recorded higher available nitrogen and phosphorus for boththe layers of soil after harvest of rice and niger. However, the bio-fertilizer based INM packageresulted the highest increase in available potassium followed by 75 per cent NPK plus 25 percent N FYM and 50 per cent NPK with 50 per cent N FYM. A marked build up of availablesulphur content of soil was recorded by applying 50 per cent NPK with 50 per cent N FYM,while the integrated nutrient management had a little positive influence on exchangeable Caand Mg contents of the soil.
Key Words: Integrated Nutrient Management, Primary and Secondary Nutrients, Rice- NigerSequence.
J Krishi Vigyan 2014, 3(1) : 5-9 DOI: 10.5958/2349-4433.2014.01239.2
INTRODUCTIONThe high cost of fertilizers and unstable crop
production call for substituting part of theinorganic fertilizers by locally available low costorganic sources viz., manures, green manures,bio-fertilizers etc. in an integrated manner forsustainable production and to maintain soil health(Acharya, 2002). The overall strategy forincreasing crop yields and sustaining them at ahigh level must include an integrated approach tothe management of soil nutrients along with othercomplementary measures (Gruhn et al 2000).Integrated nutrient management (INM) is animportant component of sustainable agriculturalintensification. Crop intensification inmonocropped rice areas of Assam which accounts62 per cent of total rice area needs special attentionfor increasing productivity per unit area per unittime. INM has greater scope in rice based croppingsystem than any other cropping system. In Assam,however; information on availability of nutrientsin soil with integrated nutrient management under
different crop sequence is very limited except rice-rice or rice-legume-rice sequence. Thus, thepresent investigation was conducted to assess thesoil fertility status under integrated nutrientmanagement in rice-niger cropping sequence.
MATERIALS AND METHODSA field experiment was conducted at
Instructional cum Research Farm of AssamAgricultural University, Jorhat during Kharif andRabi , 2005-2006 which is located at a latitude of26°48’N and longitude of 95°50’E. Theexperimental soil was sandy clay in texture andacidic in reaction having pH value of 5.01. Thedetails of initial soil characteristics are shown inTable 1. The experiment was laid out inrandomized block design (RBD) with 7 treatmentsand 3 replications. The treatments were: T1:Control, T2: 100% NPK ,T3: Biofertilizer basedINM package i.e. (@ 3t farmyard manure/ha +Azospirillum for rice/Azotobacter for niger andphosphate solubilizing bacteria dual culture @
*Corresponding Author’s Email: [email protected] Matter Specialist (Soil Science), Kolasib, Mizoram2 Professor (Soil Sc.) AAU, Jorhat, Assam E-mail: [email protected] Senior Scientist (AICRPDA), AAU, Jorhat, Assam E-mail: [email protected]
J Krishi Vigyan 2014, 3(1) : 5-9
6
3kg/ha.+ Rock phosphate @ 50 per cent P2O
5 of
recommended dose+MOP@100 per cent K2O of
recommended dose, T4: 50 per cent NPK + 50per cent N through farmyard manure, T5: 75 percent NPK+ 25 per cent N through farmyardmanure, T6: 50 per cent N (inorganic) + 50 percent N through farmyard manure+ PK (inorganicand adjusted) and T7: 75 per cent N (inorganic) +25 per cent N farmyard manure + PK (inorganicand adjusted). In treatments T6 and T7 the amountof P and K supplied through farmyard manure issubtracted from the total amount of recommendedinorganic P and K required.
The recommended level (100%) of N, P2O
5
and K2O based on soil testing were 60, 20 and 40
kg/ha and 20.10 and 10 kg, for rice and nigercrop, respectively. The organic source used forintegration was farm yard manure. The N, P andK content of farmyard manure are 0.486, 0.61,1.13 per cent, respectively. The amount offarmyard manure needed for a particular treatmentwas calculated on the basis of their nitrogencontent and incorporated in the soil 15 days priorto transplanting of rice and sowing of niger cropas per the treatments. Biofertilizer was applied @3 kg /ha before transplanting of kharif rice byfollowing root dip treatment and seed treatmentin case of niger crop. At the time of transplantingof kharif rice, half of urea, whole of single superphosphate and muriate of potash werebroadcasted. The remaining urea was applied astop dressing in 2 splits, at the time of maximumtillering stage and panicle initiation stage. In caseof niger, the whole of urea, single super phosphateand muriate of potash were applied as basal tothe soil at the time of sowing. After the experiment,surface and sub surface soil samples werecollected and analyzed for available nutrientcontent of primary and secondary nutrients as perthe standard procedure (Jackson, 1973).
RESULTS AND DISCUSSION
Primary Nutrients
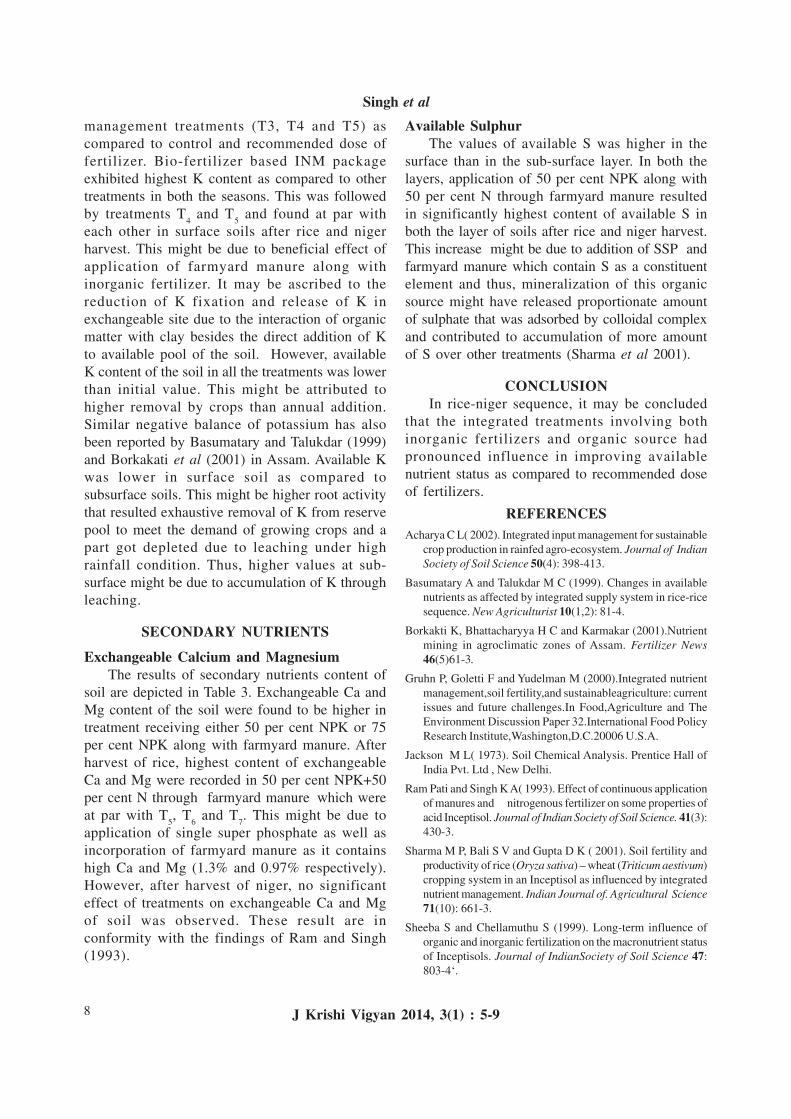
Available NitrogenThe available N content of soil after harvest
of rice and niger was found to be higher in theintegrated treatments receiving both organic andinorganic over control and recommended dose of
fertilizer. Among the treatments, available N wasobserved highest in the treatment, 75 per cent NPK+ 25 per cent N through farmyard manure,followed by 50 per cent NPK + 50 per cent Nthrough farmyard manure after harvest of bothrice and niger. This increase in available N bothin surface and sub-surface soils might be ascribedthat addition of mineral N along with organicsource narrowed the C: N ratio of organic manureand this enhanced the rate of mineralizationresulting in rapid conversion of organically boundN to inorganic forms and helped in release ofnutrients from the organic carbon. This findingwas in agreement with the reports of Sheeba andChellamuthu (1999) and Singh et al (2006).
Available PhosphorusAll the treatments under integration of organic
and inorganic as well as bio-fertilizer based INMpackage showed higher available P as comparedto control and recommended NPK dose. In surfacesoil, available P content was found to besignificantly highest in treatment receiving either50 per cent NPK or 75 per cent NPK along withfarmyard manure. Incorporation of farmyardmanure along with inorganic P might increase theavailability of P and this is attributable to reductionin fixation of water soluble P, increasedmineralization of organic P due to microbial actionand thus enhanced the availability of P. Similarincrease of available P with combined use of
Table 1. Initial soil characteristics.
Characteristics Value SubSurface soil surface
(0-15cm) soil(15-30cm)
Textural class Sandy clay Clay loampH 5.01 5.08Organic carbon (%) 0.45 0.30
Primary and Secondary nutrientsAvailable nitrogen (kg ha –1) 169.35 150.53Available Phosphorus (kg ha –1) 27.83 25.65Available Potassium (kg ha –1) 140.00 149.00Exchangeable Ca [cmol (p+) kg-1] 1.20 1.22Exchangeable Mg [cmol (p+) kg-1] 0.60 0.61Available S (kg ha –1) 10.52 8.21
J Krishi Vigyan 2014, 3(1) : 5-9
Singh et al
7
organic and inorganic source of fertilizer havealso been reported by Sharma et al (2001) andVaralakshmi et al (2005).
Tab
le 2
. Eff
ect o
f int
egra
ted
nutr
ient
man
agem
ent o
n pr
imar
y nu
trie
nts o
f soi
l in
rice
-nig
er se
quen
ce.
Tre
atm
ent
Ric
e (K
hari
f)N
iger
(Rab
i)A
vaila
ble
NA
vaila
ble
Ava
ilabl
eA
vaila
ble
NA
vaila
ble
Ava
ilabl
e K
2O(K
g/ha
)P
2O5 (
kg /h
a)K
2O (k
g/ h
a)(k
g/ h
a)P
2O5 (k
g/ h
a)(k
g/ h
a)0-
1515
-30
0-15
15-3
00-
1515
-30
0-15
15-3
00-
1515
-30
0-15
15-3
0cm
cmcm
cmcm
cmcm
cmcm
cmcm
cm
T1
: C
ontr
ol15
1.9
118.
321
.518
.050
.055
.013
1.7
117.
118
.316
.842
.750
.5T
2 : 1
00%
NPK
163.
813
0.3
23.6
20.9
52.0
60.3
140.
812
1.3
20.8
17.8
51.1
62.8
T3 :
Bio
fert
ilize
r ba
sed
INM
pac
kage
170.
214
2.3
24.8
22.8
55.9
68.5
150.
913
5.0
21.5
19.5
54.7
64.3
T4 :
50%
NPK
+ 5
0% N
FY
M18
1.9
150.
029
.525
.053
.562
. 516
9.4
148.
827
.822
.551
.362
.5T
5: 7
5% N
PK +
25%
N F
YM
190.
915
8.5
28.5
24.8
55.0
67.0
171.
815
4.7
27.9
23.0
52.8
63.8
T6 :
50%
N (i
norg
anic
) + 5
0% N
FY
M16
6.5
148.
226
.224
.652
.562
.116
5.2
138.
8
24.0
21.4
51.0
62.5
+ P
K (
inor
gani
c an
d ad
just
ed)
T7:
75%
N (i
norg
anic
) + 2
5% N
FY
M16
3.8
145.
524
.821
.752
.361
.814
5.8
136.
822
.220
.046
.457
.5
+
PK
(ino
rgan
ic a
nd a
djus
ted)
CD
(p=0
.05)
14.4
14.5
3.1
3.2
2.4
6.0
13.8
17.8
2.6
3.2
3.6
3.2
Tab
le 3
Eff
ect o
f int
egra
ted
nutr
ient
man
agem
ent o
n se
cond
ary
nutr
ient
s of s
oil i
n ri
ce-n
iger
sequ
ence
.
Tre
atm
ent
Ric
e (K
hari
f)N
iger
(Rab
i)E
xcha
ngea
ble
Exc
hang
eabl
eA
vaila
ble
SE
xcha
ngea
bleE
xcha
ngea
ble
Ava
ilabl
e S
Ca
Mg
cmol
(p+)
/kg
(kg/
ha)
Ca
Mg
(kg/
ha)
cmol
(p+)
/kg
cmol
(p+)
/kg
cmol
(p+)
/kg
0-15
15-3
00-
1515
-30
0-15
15-3
00-
1515
-30
0-15
15-3
00-
1515
-30
cmcm
cmcm
cmcm
cmcm
cmcm
cmcm
T1
: C
ontr
ol1.
101.
100.
540.
555.
895.
501.
001.
050.
520.
545.
905.
50T
2 : 1
00%
NPK
1.14
1.15
0.56
0.56
8.87
7.47
1.07
1.10
0.54
0.58
11.2
09.
83T
3 : B
iofe
rtili
zer
base
d IN
M p
acka
ge1.
151.
160.
580.
5910
.32
9.00
1.11
1.12
0.57
0.58
12.2
010
.90
T4 :
50%
NPK
+ 5
0% N
FY
M1.
211.
190.
600.
6115
.62
13.1
51.
151.
150.
580.
6016
.70
15.7
0T
5: 7
5% N
PK +
25%
N F
YM
1.20
1.20
0.60
0.62
13.2
012
.00
1.16
1.17
0.60
0.61
14.2
012
.40
T6 :
50%
N (i
norg
anic
) + 5
0% N
FY
M1.
181.
190.
590.
6011
.80
10.2
51.
131.
140.
570.
5912
.70
10.6
0
+
PK
(in
orga
nic
and
adju
sted
)T
7: 7
5% N
(ino
rgan
ic) +
25%
N F
YM
1.16
1.15
0.57
0.58
7.78
6.46
1.10
1.10
0.56
0.57
8.50
7.40
+
PK
(in
orga
nic
and
adju
sted
)C
D (p
=0.
05)
0.05
NS
0.03
0.05
0.51
0.58
NS
NS
NS
NS
0.75
0.67
Available PotassiumAvailable potassium content of the soil
exhibited improvement under integrated nutrient
J Krishi Vigyan 2014, 3(1) : 5-9
Assessment of Soil Fertility
8
management treatments (T3, T4 and T5) ascompared to control and recommended dose offertilizer. Bio-fertilizer based INM packageexhibited highest K content as compared to othertreatments in both the seasons. This was followedby treatments T
4 and T
5 and found at par with
each other in surface soils after rice and nigerharvest. This might be due to beneficial effect ofapplication of farmyard manure along withinorganic fertilizer. It may be ascribed to thereduction of K fixation and release of K inexchangeable site due to the interaction of organicmatter with clay besides the direct addition of Kto available pool of the soil. However, availableK content of the soil in all the treatments was lowerthan initial value. This might be attributed tohigher removal by crops than annual addition.Similar negative balance of potassium has alsobeen reported by Basumatary and Talukdar (1999)and Borkakati et al (2001) in Assam. Available Kwas lower in surface soil as compared tosubsurface soils. This might be higher root activitythat resulted exhaustive removal of K from reservepool to meet the demand of growing crops and apart got depleted due to leaching under highrainfall condition. Thus, higher values at sub-surface might be due to accumulation of K throughleaching.
SECONDARY NUTRIENTS
Exchangeable Calcium and MagnesiumThe results of secondary nutrients content of
soil are depicted in Table 3. Exchangeable Ca andMg content of the soil were found to be higher intreatment receiving either 50 per cent NPK or 75per cent NPK along with farmyard manure. Afterharvest of rice, highest content of exchangeableCa and Mg were recorded in 50 per cent NPK+50per cent N through farmyard manure
which were
at par with T5, T
6 and T
7. This might be due to
application of single super phosphate as well asincorporation of farmyard manure as it containshigh Ca and Mg (1.3% and 0.97% respectively).However, after harvest of niger, no significanteffect of treatments on exchangeable Ca and Mgof soil was observed. These result are inconformity with the findings of Ram and Singh(1993).
Available SulphurThe values of available S was higher in the
surface than in the sub-surface layer. In both thelayers, application of 50 per cent NPK along with50 per cent N through farmyard manure resultedin significantly highest content of available S inboth the layer of soils after rice and niger harvest.This increase might be due to addition of SSP andfarmyard manure which contain S as a constituentelement and thus, mineralization of this organicsource might have released proportionate amountof sulphate that was adsorbed by colloidal complexand contributed to accumulation of more amountof S over other treatments (Sharma et al 2001).
CONCLUSIONIn rice-niger sequence, it may be concluded
that the integrated treatments involving bothinorganic fertilizers and organic source hadpronounced influence in improving availablenutrient status as compared to recommended doseof fertilizers.
REFERENCESAcharya C L( 2002). Integrated input management for sustainable
crop production in rainfed agro-ecosystem. Journal of IndianSociety of Soil Science 50(4): 398-413.
Basumatary A and Talukdar M C (1999). Changes in availablenutrients as affected by integrated supply system in rice-ricesequence. New Agriculturist 10(1,2): 81-4.
Borkakti K, Bhattacharyya H C and Karmakar (2001).Nutrientmining in agroclimatic zones of Assam. Fertilizer News46(5)61-3.
Gruhn P, Goletti F and Yudelman M (2000).Integrated nutrientmanagement,soil fertility,and sustainableagriculture: currentissues and future challenges.In Food,Agriculture and TheEnvironment Discussion Paper 32.International Food PolicyResearch Institute,Washington,D.C.20006 U.S.A.
Jackson M L( 1973). Soil Chemical Analysis. Prentice Hall ofIndia Pvt. Ltd , New Delhi.
Ram Pati and Singh K A( 1993). Effect of continuous applicationof manures and nitrogenous fertilizer on some properties ofacid Inceptisol. Journal of Indian Society of Soil Science. 41(3):430-3.
Sharma M P, Bali S V and Gupta D K ( 2001). Soil fertility andproductivity of rice (Oryza sativa) – wheat (Triticum aestivum)cropping system in an Inceptisol as influenced by integratednutrient management. Indian Journal of. Agricultural Science71(10): 661-3.
Sheeba S and Chellamuthu S (1999). Long-term influence oforganic and inorganic fertilization on the macronutrient statusof Inceptisols. Journal of IndianSociety of Soil Science 47:803-4‘.
J Krishi Vigyan 2014, 3(1) : 5-9
Singh et al
9
Singh S, Singh R N, Prasad J and Singh B P (2006). Effect ofintegrated nutrient management on yield and uptake of nutrientsby rice and soil fertility in rainfed uplands. Journal of IndianSociety of Soil Science 54 (3): 327-30.
Varalakshmi L R, Srinivasamurthy C A and Bhaskar S (2005).Effect of integrated use of organic manures and inorganicfertilizers on organic carbon,available N,P and K in sustainingproductivity of groundnut-finger millet cropping system. .Journal of Indian Soc. Soil Sci. 53(3): 315-18.
Received on 29/4/2014 Accepted on 15/9/2014
Assessment of Soil Fertility
J Krishi Vigyan 2014, 3(1) : 5-9
10
Bio-Efficacy of Brand Formulations ofPendimethalin - Penda 30 EC and Markpendi 30 EC
for Control of Phalaris minor in WheatSimerjeet Kaur, Tarundeep Kaur and M S Bhullar
Department of AgronomyPunjab Agricultural University, Ludhiana-141 004 (Punjab)
ABSTRACTThe field experiment was conducted at Students’ Research Farm, Department of Agronomy,Punjab Agricultural University, Ludhiana during rabi 2013-14 to study the bio-efficacy of twonew brand formulations-Penda 30 EC and Markpendi 30 EC for control of Phalaris minor inwheat. New brand formulations of pendimethalin (Penda 30 EC and Markpendi 30 EC) @ 2.5l/ha were tested against recommended brand formulation (Stomp 30 EC) @ 2.5 l/ha andunsprayed check in randomized block design in three replications. The tested new brandformulations of pendimethalin (Markpendi 30 EC and Penda 30 EC) were at par to earlierrecommended brand (Stomp 30 EC) with respect to weed population, dry matter accumulationand wheat grain yield.
Key Words: Wheat, Phalaris minor, Pendimethalin, Weed control.
INTRODUCTIONWheat is one of the premiere cereal crops of
Punjab and is badly infested with both grasses andbroadleaf weeds. Phalaris minor Retz (little seedcanary grass) is a major weed of wheat crop innorthern parts of India. The crop suffers a yieldloss of 25-30 per cent due to infestation of thisweed (Yadav and Malik, 2005) and is verydifficult to distinguish it from wheat plant in itsearly growth stages. The weed evolvedinsensitivity to isoproturon–a urea herbicide afterits continuous use for over 15 yrs. Alternativeherbicides belonging to group I [(acetyl co-Acarboxylase (ACCase) inhibitors] and group II[acetolactate synthase (ALS) inhibitors] wererecommended for its management during 1997-98 (Yadav et al 1997; Brar et al 1999). ACCaseand ALS inhibiting herbicides introduced for thecontrol of isoproturon resistant Phalaris minor arenow rapidly losing their effectiveness at manyfarms. The multiple herbicide-resistant populationshad a low level of sulfosulfuron resistance but ahigh level of resistance to clodinafop andfenoxaprop (Chhokar and Shar, 2008). Some
farmers have started using higher than therecommend doses or tank-mix of these herbicidesto achieve control of P. minor in wheat. Evaluationof new herbicides with different modes of actionoffers an opportunity to manage herbicide resistantweeds. With limited herbicides options availablependimethalin appears to be the best option formanagement of P. minor (Dhawan et al 2012).
Pendimethalin [N-(1-ethylpropyl)-2, 6-dinitro-3,4-xylidine] is a herbicide of the dinitro-aniline group used as pre-emergence applicationto control annual grasses and certain small seededbroadleaf weeds. It inhibits cell division and cellelongation. Dinitroaniline herbicides killsusceptible plants by inhibiting cell division in rootcells which arrests normal root growth.Pendimethalin is listed in the K1-group accordingto the HRAC classification and is approved inEurope, North America, South America, Africa,Asia and Oceania for different crops includingcereals (wheat, barley, rice, maize, etc.), soybean,potato, legumes, fruits, vegetables, nuts as wellas lawns and ornamental plants. Pre-emergenceherbicide, pendimethalin has been recommended
J Krishi Vigyan 2014, 3(1) : 10-12 DOI: 10.5958/2349-4433.2014.01240.9
*Corresponding Author’s Email: [email protected]
J Krishi Vigyan 2014, 3(1) : 10-12
11
at 2.5 l/ha for spray immediately after sowing ofthe crop. For obtaining desirable effects, fieldshould have good moisture content and dissolvependimethalin in 500 – 750 l of water/ha forspraying on fully prepared seed bed. High sprayvolume adds to the efficacy of these herbicides.The present study was undertaken to evaluatenew brand formulations of pendimethalin:Markpendi 30 EC and Penda 30 EC for controllingPhalaris minor in wheat.
MATERIALS AND METHODSA field experiment was conducted to study
the bio-efficacy of new brand formulations ofpendimethalin Penda 30 EC and Markpendi 30EC for control of Phalaris minor in wheat atResearch farm of Depatment of Agronomy duringrabi 2013-14. The soil of the experimental sitewas loamy sand with normal soil reaction andelectrical conductivity, low in organic carbon andavailable nitrogen and medium in availablephosphorus and potassium. The field wasploughed with disc harrow and a fine seed-bedwas prepared with two ploughing with tractordrawn cultivator and two plankings after rauniirrigation. The drill sowing of wheat cv. HD 2967was done at 22.5 cm row spacing after seedtreatment at the seed rate of 100 kg/ha on20.11.2013. Two new brand formulations ofpendimethalin (Penda 30 EC of ShivalikAgrochemicals, Chandigarh and Markpendi 30EC of Markfed) @ 2.5 l/ha were tested againstrecommended brand formulation (Stomp 30 EC)@ 2.5 l/ha and unsprayed check in randomizedblock design in 3 replications. The pre-emergenceherbicide was sprayed using knap sack sprayerby dissolving in 500 l/ha of water with flat fannozzle after sowing. The crop was raised withrecommended package of practices, except weed
control treatments. Weed dry matter of Phalarisminor was recorded at 60 days after sowing (DAS).The data on plant height, effective tillers, totalweed dry matter, panicle length, grain yield andbiological yield was recorded at the time of cropharvest on 04.04.2014. Weed control efficiencywas calculated. The data collected on variousparameters under study were statistically analyzedas prescribed by Cochran and Cox (1967). Thecomparisons were made at 5 per cent level ofsignificance.
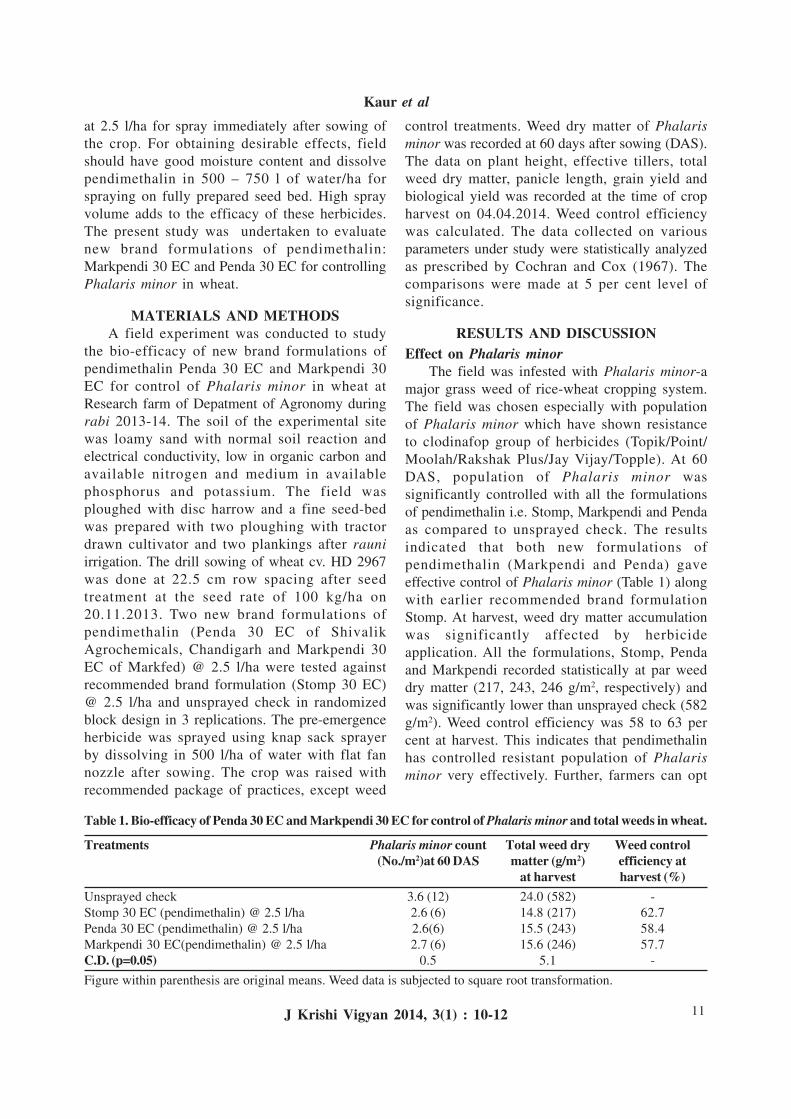
RESULTS AND DISCUSSIONEffect on Phalaris minor
The field was infested with Phalaris minor-amajor grass weed of rice-wheat cropping system.The field was chosen especially with populationof Phalaris minor which have shown resistanceto clodinafop group of herbicides (Topik/Point/Moolah/Rakshak Plus/Jay Vijay/Topple). At 60DAS, population of Phalaris minor wassignificantly controlled with all the formulationsof pendimethalin i.e. Stomp, Markpendi and Pendaas compared to unsprayed check. The resultsindicated that both new formulations ofpendimethalin (Markpendi and Penda) gaveeffective control of Phalaris minor (Table 1) alongwith earlier recommended brand formulationStomp. At harvest, weed dry matter accumulationwas significantly affected by herbicideapplication. All the formulations, Stomp, Pendaand Markpendi recorded statistically at par weeddry matter (217, 243, 246 g/m2, respectively) andwas significantly lower than unsprayed check (582g/m2). Weed control efficiency was 58 to 63 percent at harvest. This indicates that pendimethalinhas controlled resistant population of Phalarisminor very effectively. Further, farmers can opt
Table 1. Bio-efficacy of Penda 30 EC and Markpendi 30 EC for control of Phalaris minor and total weeds in wheat.
Treatments Phalaris minor count Total weed dry Weed control(No./m2)at 60 DAS matter (g/m2) efficiency at
at harvest harvest (%)Unsprayed check 3.6 (12) 24.0 (582) -Stomp 30 EC (pendimethalin) @ 2.5 l/ha 2.6 (6) 14.8 (217) 62.7Penda 30 EC (pendimethalin) @ 2.5 l/ha 2.6(6) 15.5 (243) 58.4Markpendi 30 EC(pendimethalin) @ 2.5 l/ha 2.7 (6) 15.6 (246) 57.7C.D. (p=0.05) 0.5 5.1 -
Figure within parenthesis are original means. Weed data is subjected to square root transformation.
J Krishi Vigyan 2014, 3(1) : 10-12
Kaur et al
12
for one hand pulling/post emergence spray ofherbicide to control late flushes of Phalaris minorbecause it has been cited by researchers (Dhawanet al 2012) that pendimethalin residual activityremains for 1.0 to 1.5 months after spray.
Effect on Wheat cropWeed control treatments have direct effect on
growth, yield attributes and grain yield of any crop.Penda and Markpendi 30 EC, new brandformulations of pendimethalin recordedsignificantly taller plants (82.7 and 83 cm), moreeffective tillers (361.7 and 367.5 per m2,) andbiological yield (122.9 and 127.7 q/ha) which ledto higher grain yield (52.1 and 52.7 q/ha) ascompared to unweeded control (42.4 q/ha).
Due to better weed control in pendimethalintreated plots, the crop grows luxuriantly. So weedsdo not compete with crop for light, moisture, spaceetc. and ultimately this was reflected in cropgrowth, yield attributes and grain yield. Thepanicle length of wheat spike did not vary withrespect to different weed control treatments. Thenew brands- Penda and Markpendi 30 ECrecorded grain yield statistically at par with earlierrecommended herbicide Stomp (54.1 q/ha) butrecorded significantly higher wheat grain yieldthan unsprayed check (Table 2). These resultswere in agreement with those reported by Pisal etal (2013).
CONCLUSIONThe study revealed that new brand
formulations of pendimethalin (Markpendi andPenda 30 EC) were at par to earlier recommendedbrand (Stomp) with respect to weed control andwheat grain yield. Pre emergence application ofMarkpendi 30 EC and Penda 30 EC(pendimethalin) at 2.5 l/ha within two days ofsowing provided effective control of Phalaris
minor in wheat. Another brand of pendimethalinwill create healthy competition in the market andwill help in breaking the monopoly of thecompany. Pendimethalin– a pre emergenceherbicide can be used to effectively controlresistant population of Phalaris minor. Furtherrotational use of different herbicide groups(Substituted ureas/ Clodinafop/ Sulfonylureas/Dinitroanilines) or ready mix herbicidecombination (Fenoxaprop+Metribuzin) canfurther delay the occurrence of resistance inPhalaris minor. Utmost care should be taken beforeselecting a particular herbicide for weed controldepending upon cultivar being grown, croppingsystem to be followed, soil type and type of weedflora present.
REFERENCESBrar L S, Walia U S and Dhaliwal B K (1999). Bio-effficacy of
new herbicides for the control of resistant Phalaris minor inwheat. Pesticide Research Journal 11: 177-180.
Chhokar R S and Shar R K (2008). Multiple herbicide resistancein littleseed canary grass (Phalaris minor): A threat to wheatproduction in India. Weed Biology and Management 8 (2):112-123.
Cochran W G and Cox G M (1967). Experimental Designs. JohnWiley Publisher’s. New York.
Dhawan R S, Singh N and Singh S (2012). Little seed canarygrass resistance to sulfonyl-urea herbicides and its possiblemanagement with pendimethalin. Indian Journal of WeedScience 44 (4): 218-224.
Pisal R R, Surve V H, Jathar S C and Sagarka B K (2013). Impactof weed control treatments on weed flora, nutrient uptake byweeds and wheat crop. Agricultural Science Digest 33 (1):47-51.
Yadav A, Malik R K and Balyan R S (1997). Studies on alternateherbicides to control isoproturon–resistant littleseed canarygrass. Pestology 21: 26-28.
Yadav A and Malik R K (2005). Herbicide Resistant Phalarisminor in Wheat – A Sustainability Issue. Department ofAgronomy and Directorate of Extension Education, CCSHaryana Agricultural University, Hisar, India.152 p.
Received on 28/8/2014 Accepted on 20/9/2014
Table 2. Effect of Penda 30 EC and Markpendi 30 EC on wheat growth, yield attributes and yield.
Treatments Plant height Effective Panicle Grain yield Biologicalat harvest(cm) tillers/m2 length (cm) (q/ha) yield (q/ha)
Unsprayed check 67.0 240.0 11.4 42.4 110.8Stomp 30 EC (pendimethalin) @ 2.5 l/ha 80.5 364.2 12.5 54.1 127.3Penda 30 EC (pendimethalin) @ 2.5 l/ha 82.7 361.7 12.9 52.1 122.9Markpendi 30 EC(pendimethalin) @ 2.5 l/ha 83.0 367.5 13.1 52.7 127.7
C.D. (p=0.05) 6.5 40.7 NS 7.7 11.9
J Krishi Vigyan 2014, 3(1) : 10-12
Bio-efficacy of Weedicides for control of Phalaris minor
13
Current Status of Management of Harar (Terminaliachebula Retz.) in Shivalik Hills
Jagdish Chander and Sanjeev K Chauhan1
Research wing of Haryana Forest Department, Panchkula-134102 ( Haryana)
ABSTRACTHarar (Terminalia chebula Retz.) has been given the status of mother and king of medicines inAyurveda. Its fruit has astringent, purgative, antibacterial, antifungal and laxative activity.Shiwalik hills of Panchkula and Yamunanagar districts in Haryana upto an altitude of about1200m above mean sea level boast of best Harar in the country in terms of quality. The country’srichest germplasm exists here. It has become endangered in Haryana and adjoining Himachalas its regeneration is not taking place. Out of an estimated number of about 2000 Harar treesexisting in Haryana, about 3/4th are on farmers’ fields and only about 1/4th trees exist in forests.About 90 per cent of these trees exist in and around Raj Tikri, Hathiya and Thandog village ofPanchkula district and adjoining Sirmour district in Himachal. Trees existing on farmers’ landare commercially utilized by the farmers. However, the trees existing in forest are inaccessibledue to thick undergrowth of Lantana camera growth which makes human movement difficult.This fruit is neither collected by the Forest Department nor is it auctioned. While in forest, it isthick growth of Lantana camera which does not allow young seedlings to come up, outsideforest. Premature fruit drop as a result of attack of a beetle borer insect and leaf rust takes its tollby reducing the size of fruits and causing economic losses to the farmers.
Key Words: Harar, Terminalia chebula, Distribution, Harvesting, Processing, Value Addition.
INTRODUCTIONHarar or Haritaki (Terminalia chebula Retz.)
is an unique gift of nature to mankind. The fruitof Harar has the magical healing powers. It hasastringent, purgative, rejuvenating, antibacterial,antifungal and laxative activity. This activity isdue to the presence of substances - tannic acid,chebulinic acid, gallic acid, anthraquinone andsennoside. It is used in India to treat many diseasessuch as urinary, digestive diseases, diabetes, skindiseases, parasitic infections, heart ailments, fever,flatulence, constipation, ulcers, vomiting, colicpain and hemorrhoids (Bag et al 2013).
It is a deciduous tree and grows up to 1600 mabove mean sea level and is mainly found inHimachal Pradesh, Jammu and Kashmir, Haryana,Uttrakhand, Madhya Pradesh Maharashtra, NorthEastern States, Assam, Kerala and Karnataka.According to Ayurveda, there are seven varietiesof Harar (Vijaya, Putana, Rohini, Amrita, Abhaya,
Jivanti and Chetaki) and each has differentproperties. Chetaki is in two colours i.e., whiteand black. Harar grows in the northern Shiwalikbelt and found scattered everywhere but largelyis found in Morni area. Morni area of Haryana islocated at an altitude of about 1200 m above meansea level. Morni and some part of adjoiningHimachal boast of a very rich germplasm ofHarar. The villages in Morni (Raji Tikri, Hathiya,Thandog and Mandhana) have largerconcentration of Harar. Adjoining Jaman ki Serarea of Sirmaur district of Himachal Pradesh alsohas same germplasm and patch of Harar trees.
The Harar produced in Morni and theadjoining part of Haryana is in great demand inPakistan, Afghanistan, Iran, Iraq and other Gulfcountries. The govt. in Haryana has not imposedrules for the transport of this produce from thestate, therefore the farmers are benefited a lot, butthe information regarding the actual quantity of
*Corresponding Author’s Email: [email protected]: [email protected]; [email protected] of Forestry and Natural Resources, Punjab Agricultural University, Ludhiana-141 004
J Krishi Vigyan 2014, 3(1) : 13-17 DOI: 10.5958/2349-4433.2014.01241.0
J Krishi Vigyan 2014, 3(1) : 13-17
14
Harar being sent from Morni and adjoining areasin Himachal is lacking. At present, there is norestriction on the movement of Harar from thestate of Haryana and Himachal. As country’s bestgermplasm of Harar exists here because offavourable conditions, this needs to be conserved.A lot of problems are being faced by the farmersin terms of pests, premature fruit fall, marketing,transport of the produce value addition, etc. Inthe absence of any scientific method of harvesting,the farmers continue to harvest Harar fruits bycrude method using stick, which damages thefruits. The damaged fruits are sold in the marketat throw away prices. There does not exist anycooperative or local mandies for the sale/purchaseof Harar either in Haryana or in the Himachal/Punjab. There is lot of scope to improve theexisting Harar stock and maximize the returnsbesides conserving the existing germplasm andstrengthening it by introducing genetic materialfrom other parts of the country. Hence, the studywas planned to know the present status of Harartree distribution in Morni hills, their fruitharvesting, transportation, marketing,regeneration, improvement in stock, insect/pestattack, value addition, etc.
MATERIALS AND METHODSThe survey was conducted in entire Shiwalik
belt of Haryana with large emphasis on Morniarea in the year 2011 to 2013 and adjoining JamanKi Ser area of Himachal Pradesh. To begin with,the first hand information was collected from theForest Guards and Foresters/Deputy ForestRangers of both Haryana and Himachal Pradeshstates stationed in the area of the study. A seriesof meetings were conducted with the Harargrowers and local contractors regarding themanagement of Harar trees growing on theirfields, contribution of Harar in their income,harvesting and collection method followed, sale,processing and value addition at local level, andproblems faced by them in terms of marketing,insect pests and diseases.
The information regarding the number ofHarar trees growing on their fields was collectedfrom the villagers. The similar information wascollected from Haryana Forest Department fieldofficials at compartment level. After obtaining the
preliminary information about the number of trees,the ground truthing was done by conducting actualsurvey in the forest as well as on the fields of Harargrowers’. The number of trees growing in theforest was estimated by physically counting thetrees in the forest. The amount of Harar collectedannually was obtained from the contractorsoperating in the area. Fruit samples were collectedat the time of tree counting to assess the insect/pest damage and serve as germ plasm for futureevaluation. Fruit physical parameters were alsorecordedThe mechanism of marketing of Hararfruits from individual farmer to the localcontractor and thereafter of these fruits in bigmarket was studied. The Harar fruits are sold attwo places (Khari Bawali in New Delhi andMajitha in Amritsar district). However, for thepurpose of present study, only Khari Bawali wasselected. The problems faced by Harar growers,the local contractors and the problem of the tradersat Khari Bawali in New Delhi were also studiedby interacting with the Harar traders and the leaderof herb traders. Regeneration studies in Shiwaliks(both Haryana and Himachal) were also initiatedfor future saving of valuable resources.
RESULTS AND DISCUSSION
Plant populationThe villages in Morni area of Haryana and
Himachal Pradesh have Harar trees on thefarmers’ land and forest area around them. Themoderate climate prevailing in this area (averagemaximum and minimum temperature around 37and 5°C, respectively) favours the growth of Harartrees and development of active principles in thefruits. However, both in the forest and in thefields, Harar never exists in pure stands. It isfound mixed with other tree species like Jhingan/Wodier Wood of India (Lannea coromendelica),Beul (Grewia optiva), Behra (Terminalia bellerica)and Ainy/Sain (Terminala elliptica). On thefarmer’s fields, the Harar grows on the bunds offields on the hilly terrain and the fruits areharvested by the farmers. However, in the forests,the thick mat of Lantana camera makes humanmovement difficult and therefore, the fruits arenot collected from there.
Owing to the hilly terrain and absence ofmeans of transport, no efforts were made in the
J Krishi Vigyan 2014, 3(1) : 13-17
Chander and Chauhan
15
past to explore the richness of Harar in Haryana,however, some initiatives have been taken inHimachal and Jammu & Kashmir (Sharma et al1995; Saleem et al 2010). Forest Departmentnever conducted survey on the regeneration statusand number of Harar trees existing in the state.Forest Department never collected Harar fruitsfrom the wild nor were ever auctioned. The localsare not ready to reveal the fact that they collectHarar fruit from the wild. As a result of this, noinformation was available on the status of Hararin Haryana. On the basis of the extensive surveyconducted in the Shiwalik belt of Haryana state,the number of Harar trees existing in Haryanawas ascertained (Table 1).
Table 1. Number of trees of Harar existing in Shiwalikbelt of Haryana.
Sr. No. Name of village District Estimatednumber oftrees
1. Mandhana Panchkula 5002. Raji Tikri Panchkula 5503. Thandog Panchkula 504. Hathiya Panchkula 4505. Forest Panchkula and 400
Yamunanagar
Total 1500
Production and fruit qualityThe figures regarding the total Harar being
sold from Morni area taken from the localcontractors and the record of this produce beingmaintained at Berwala Forest barrier revealed thatabout four thousand quintals of Harar is sold fromMorni area. However, the whole produce does notbelong to Haryana. Out of this, about onethousand quintals come from Himachal Pradesh(district Sirmour).
No study is available in the country as to whichpart of the country produces best Harar fruit interms of desirable characters like anthraquinones,tannins, chebulic acid, chebulinic acid and gallicacid. However, the shape and the size of Hararfruit produced in Morni area, is the best in thecountry. This is the reason that most of the Hararproduced in Haryana is exported via Pakistan toAfghanistan, Iran, Iraq and other Gulf countrieswhere meat consumption is very high. A typicalvariety has attractive long fruits, which touches a
maximum length of 8.5 cms. This variety iscomparable with Raj Harar variety found inJammu (Saleem et al 2010). Raj Harar is the bestvariety of Harar in the country.
Harar starts bearing fruits somewhere in thetenth year of its age and it continues bearing fruitsupto the age of about 70 years. During the firstyear, the tree bears about ten kg fruit, but, a fullygrown tree can bear fruit upto one quintal. At site,one kg Harar fruit fetches price varying fromRs.12 rupees to Rs.35 depending upon the qualityof the fruit, which normally is adjudged on thebasis of fruit size.
Harvesting of fruitsThe harvesting of Harar fruits starts by the
end of August when the rains start receding. It isat peak between 15th of September to 15th ofOctober. Thereafter, the harvesting, transportationand sale of Harar in Haryana continues right upto the end of January but the fruit collection atthat time is very less. Normally, Harar fruit ripensin the month of January but as mentioned above,the harvesting of the fruit starts in the last week ofAugust. The study revealed that it is not that theHarar growers are in a hurry to harvest theirproduce. The fact however, is that the Harargrowers are forced to harvest their produce dueto attack of beetle borer during rainy season. Thefeeding by the insect pest on the fruit renders thefruit very weak. This leads to premature fruit fall.Such damaged fruits are of no use.
Attack by BeetleBoth larva and the adult of the beetle pest first
bore the soft epicarp and mesocarp of the fruitand, thereafter, the pest bores the hard endocarpwith the help of its sharp mandibles. The pest hasthen access to the nutritious kernel inside. Afterfinishing the contents of the kernel, the pest returnsto the soft mesocarp to further feed on the softpulp. The mature larva feeds on the ground forpupation. Adults after emergence reach the fruitby flying, though it is a poor flyer. The eggs arelaid just below the epicarp. The hatching takesplace inside the fruit and the grub start feedingthereafter. The borer beetle alone is not a problemrather, during the rainy season, the Harar foliageis badly affected by a foliar rust disease. In this
J Krishi Vigyan 2014, 3(1) : 13-17
Status of Management of Harar
16
case, yellow spots appear initially on the leavesin the month of July. These spots later on turnblack. Many such spots join together to form bigpatch, leaving very small green portion on theleaves. Photosynthetic activity is lost in suchleaves and they fall prematurely. By the end ofOctober, the tree is almost leafless, whichconsiderably reduces the fruit size and such fruitfetches very low price in the market.
Harvesting techniqueThe harvesting technique adopted by the
farmers is also not appropriate. Instead ofhandpicking of the fruit, they use the stick toharvest the fruits. The branches are beaten withthe stick and no cloth or tarpaulin is used forcollecting the fruits on the ground. During theprocess of harvesting, some fruits get damagedwhile bearing the impact of stick, others getdamaged while falling on the ground. Such fruitsare attacked by fungus in less than a week andhave to be sold immediately at throwaway prices.The fruits after harvesting are packed in gunnybags of 50 kg each.The local contractor then buysthe fruit depending upon the quality.
Marketing of fruitsKhari Bawali ( New Delhi) is known for the
sale and purchase of Harar fruit all over thecountry. Along with Majitha in Punjab, it isregarded as the hub of trade of medicinal plantsactivity in India.The commission agents at KhariBawali knows it very well that there is no otherplace to sell medicinal plants including Harar andthe local contractor from Morni will not be in aposition to carry back Harar fruits because it ishighly perishable. Also it is knows that if notprocessed in less than a week, the fruits will beattacked by the fungi reducing them to blackpowdery mass. So, the commission agent at KhariBawali purchases Harar fruits at his conditionsand price. The contractor is forced to sell theproduce at the prices, which are usually betweenRs.25/- to Rs. 50/- kg.
Processing of fruitsThere is no trader as such in Khari Bawali who
solely deals with Harar. This is one of his activityand there are fixed days for the sale of Harar fruitin Khari Bawali. Finally bulk fruits are sold to the
big company representatives, where the prices arefixed on quality. Company carries out grading anddamaged/diseased fruits are separated and goodquality fruits are further processed. Low gradefruits are processed separately including damagedfruits. The green fruit is roasted in big sand panson slow flames to reduce the moisture content.The green fruit as such has about 80 per centmoisture content. It has to be reduced to about 10per cent. It takes about three hours for roasting offruits on low heat in sand. During the processingof the roasting or cooking, the pan has to be stirredconstantly to prevent any black burning spot onthe fruits.
Ripening of fruitsThe fruit is considered ripened when the color
changes from golden green to golden yellow. Suchfruits are kept for further drying in shade for afortnight. Drying in sun reduces theanthraquinone and tannin contents. Hence, the sundrying has to be avoided. The grading of the fruitis done after drying. There are few trees in Morniarea of Haryana whose fruit falls in grade-1. Thebulk falls in grade -2 and grade-3. Grade-4 islowest grade and it fetches the least price.
Value addition and its exportHarar market at Majitha (Amritsar,Punjab)
consumes most of Harar fruit produced in Morniarea of Haryana and adjoining Jaman Ki Sher areaof H.P. While there is no consumption of Hararfruit for preparation of murabba at Khari Bawali,there is full fledged market for murabba makingin Majitha in Amritsar district of Punjab. It is verywell organized industry for this purpose. However,it is not the best quality Harar fruit that goes formurabba making. The inferior and damaged fruitsare used for this purpose. The traders at Majithahave links with their Pakistani counterparts andthe fruit is immediately exported to Pakistan. Thelocal contractor revealed that traders at Majithamake handsome money from this trade as Morniarea Harar is liked in Pakistan, Afghanistan, Iran,Iraq and other gulf countries.
The study also revealed that Harar fromMajitha is processed in Pakistan after grading only,it is exported to other countries. Possessing highgrade of processed Harar is considered a matter
J Krishi Vigyan 2014, 3(1) : 13-17
Chander and Chauhan
17
of pride in Pakistan and adjoining countries. Infactconsumption of Harar after meals is customary inthis part of the world. Therefore, the grade ofHarar placed for consumption speaks about thefinancial status of the family. It is for this reason,the grade-1 Harar is placed during marriageceremonies.
Conservation of HararHarar is an endangered species of Shiwaliks
of Haryana, Punjab and Himachal Pradesh andprobably of Uttrakhand as well. So, there is anurgent need for putting all varieties of Hararexisting in Haryana and H.P. at one place to serveas reservoir for the future breeding programme.For this purpose, the fruits of different varietiesof Harar were collected from Haryana Shiwaliksin January 2010 and grown in nursery of HaryanaForest Department, Panchkula. These plants wereplanted at a spacing of 6m x 6m at a place calledDakhrog in Panchkula district of Haryana. Fivehundred plants of improved varieties of Hararwere also purchased from Horticulture ResearchStation Nurpur, Kangra (HP). These plants werealso raised at Dakhrog. This plant material includedall best germplasm available with the institute.Although Morni area of Haryana has superiorgermplasm of Harar, yet the bulk of fruit that ismarketed is not of very good quality.
Future scopeNot many efforts have been made in the past
to rehabilitate and restock dwindling Hararpopulation. Haryana Forest Department at presentraises only a few hundred plants in its nursery. Toprovide superior quality plants to the Harargrowers, chip budding method has been used.Forest Department Haryana is also planning toprovide training to the Harar growers on thevegetative propagation method to produce goodquality panting stock. Efforts will be made toprovide genetically and phenotypically superiorHarar plants to the farmers and improvedmethods of harvesting causing minimum damageto fruits will be introduced. Farmers would bemade aware of conservation of availableresources. Probably govt. interventions arerequired for regulating sale and utilization ofHarar fruit including value addition. The farmersare also required to be trained for handling pests
and diseases, managing trees scientifically andcollecting the fruits with minimum injuries.
CONCLUSIONMuch needs to be done in the case of Harar
as regards the scientific investigations. No studieshave been conducted anywhere in the countryregarding the chemical contents in each varietyof Harar as mentioned in Ayurveda. In this era ofscientific advancements, tannic acid, chebulinicacid, gallic acid, anthraquinone and sennosidecontents of each variety and their variation indifferent parts of the country need to bedetermined so that the tree improvement programis followed accordingly and farmers get goodquality planting stock for future planting. Allvarieties need to be put at one place and theirgermplasm needs to be conserved for posterity.The farmers need to be trained for vegetativepropagation of improved varieties, control of pestsand growing best quality fruit. In the forest, somegaps have to be created by removing Lantana inpatches to pave way for natural regeneration ofHarar. The Government support in terms of valueaddition and market facilities for the farmers ofHarar are of utmost importance.
ACKNOWLEDGEMENTSThe authors are thankful to the people of
Morni and Raji Tikri for sharing their knowledgeof Harar and helping in all possible way inconducting this study in their area. The authorsincerely thanks Sh. S. K. Dhar, Dr. Jakati and Dr.Ramesh Singh (All IFS officers (Retired) andformer PCCFs of Haryana for guiding inconducting this study. Haryana Forest Departmenthas provided platform for conducting this study,and therefore, deserves full credit for this study.
REFERENCESBag Anwesa, Bhattacharaya S K and Chattopadhayay R R (2013).
The development of Terminalia chebula Retz. (Combretaceae)in clinical research Asian Pacific J. Trop. Biomed 3(3): 244–52.
Sharma K, Thakur S, Badiyala S D and Sharma N K ( 1995). Firstreport on the propagation of Terminalia chebula Retz. throughpatch budding. Indian Forester 121(8): 760-61.
Saleem M, Sood K K and Singh P ( 2010). Producing qualityplanting stock of Terminalia chebula for integration inagroforestry farms. APA News 36:5-6.
Received on 26/8/2014 Accepted on 20/9/2014
J Krishi Vigyan 2014, 3(1) : 13-17
Status of Management of Harar
18
Effect of Environmental Variation and PhosphorusNutrition on the Performance and Economics of
Soybean Cultivars of Central IndiaD S Tomar, Sandhya Chauhan1, Rekha Tiwari and A K Saxena2
Krishi Vigyan Kendra, Ujjain-456010Rajmata Vijayaraje Scindia Krishi Vishwavidyalaya, Gwalior ( Madhya Pradesh.)
ABSTRACTPaucity of information on management practices to enhance seed germination, seedingemergence and development for an economically important crop of central India led to theconductance of field experiment in split - plot design, on deep Vertisols. Experiment aimed atdetermining the influence of planting date (main plot), cultivators (sub - plot) and phosphoruslevels (sub-sub plot) on growth and development of soybean. Results indicated that early plantingof soybean resulted in higher germination in all the cultivars, whereas under late plantingcondition though the period required for emergence was less but the germination was reducedby 61.6 per cent. Significantly higher seed yield and B:C ratio was recorded in early plantingunder all the varieties and levels of phosphorus. The interaction effect of planting date xvariety x phosphorus level was highly significant, as indicated by rooting pattern and yieldattributing characters.
Key Words: Environmental Variation, Phosphorus, Soybean.
*Corresponding Author’s Email: [email protected], Krishi Vigyan Kendra, RVSKVV Ujjain1PhD Scholar Vikram University, Ujjain2Associate Professor, COA, Ganjbasoda JNKVV
INTRODUCTIONPeninsular India bestowed with medium
deep black soils has almost 75 per cent of totalarea under soybean cultivation in kharif season.In spite of increase in area year after year, theproduction per unit area has remainedsubstantially low, owing to lack of informationon such management practices that could enhanceseed germination, seedling emergence and cropdevelopment taking into consideration thesuitability of planting date, appropriate levels ofphosphorus and the iteration of both on specificvariety of soybean.
In the vertisols of central India, performanceof soybean in greatly affected due to variation intemperature before and after the onset of monsoon.The soil and air temperatures drops to certaindegrees after the onset of monsoon but this periodis accompanied by very high relative humidityand hence affects the germination and emergenceof soybean seeds which being thinly coated is
prone to the attack of fungi and higher respirationof geminated and imbibed seeds. Research workrelated to the response of soybean to variousmanagement practices in the Versisols of centralIndia has been restricted to varietal trials, plantingdates and/or manurial experiments. Informationrelating to the interactions of various parameterssuch as planting dates, phosphorus level andvarieties was lacking.
It is a known fact that in legumes, applicationof phosphorus stimulates rhizobial activity, noduleformation and thus helps in nitrogen fixation. Itincreases the water use efficiency, improves taste,storage quality and skin hardness of the bean. Asphosphorus plays a role in photosynthesis,respiration, energy storage and transfer, celldivision and enlargement, it has been shown to beimportant for growth, development and yield ofsoybean (Kakar et al 2002). Fageria et al (1995)suggested that large quantities of P fertilizer maybe required for successful soybean production.
J Krishi Vigyan 2014, 3(1) : 18-23 DOI: 10.5958/2349-4433.2014.01242.2
J Krishi Vigyan 2014, 3(1) : 18-23
19
A detailed study relating the environmentalfactors with the management practices had notfound place in earlier studies. Since soybean isthe major crop in the cropping system of this agroclimatic zone which is followed by wheat/gramor pea and wheat followed by sunflower/greengram and black gram. The present investigationbecame inevitable because this crop has changedthe socio-economic scenario in the region, sinceits introduction as monsoon crop, whereas earlierdue to the typical characters of Vertisols , majorpart of cultivable land was under mono or doublecropping, due to drainage problems. However,after the inception of soybean the croppingintensity has risen up to 300 per cent. The objectiveof the study was to determing planting date andphosphorus requirement of different varieites ofsoyabean.
MATERIALS AND METHODSA field experiment was conducted on Vertisol
(deep fine-textrues montmorillonitic family oftypic chromusterts) of experimental station underRajmata Vijayaraje Scindia KrishiVishwavidyalaya, Madhya Pradesh in rainy seasonfor two consecutive years i.e 2008 and 2009. Thesoil (56% clay 25% silt and 18% sand) has pH 7.3and organic carbon 0.48%. A split plot designconsisting of two planting dates (PD
1 – 28 to 30
June and PD2 12 to 15 July) during both the years,
each main plot was subdivided into three sub plots,respectively three varieties (V
1:JS-93-05, V
2:JS-
95-60, and V3: JS-335 selection and four sub-sub
plots representing phosphorus level (P0 : Control,
P1 : 30 Kg P
2O
5, P
2 : 60 Kg P
2O
5 ha-1 and P
3 : 90
Kg P2O
5 ha-1 ). Planting dates were selected on
the basis of onset of rainy season and workabilityin Vertisols, taking into account the temperaturesassociated therein. The plot size was 5m x 4.5 mwith 1.25 m inter plot distance and 1.5m. betweenreplications.
All the soybean cultivars were plantedmanually on respective dates at a row spacing of30 cm. Counted seeds were planted in randomlyselected four rows in each plot to study the effectof temperature on germination . Germinationcounts were recorded daily after start ofemergence up to complete emergence. Five plantswere selected randomly and tagged for recording
biometrical observation. Soil temperature wasrecorded at 5 cm and 10 cm depth and it wasmeasured using mercury in glass thermometersat 0700 and 1400 hr. Root samples were takenwith the help of locally fabricated cylindricalsampler of 20x20 cm. dimension. Block of soilwith intact roots was excavated and soaked inwater containing sodium hexameta phosphate forfew hours to enable easy dispersion of clay. Rootsbiomass was recorded after drying the samples inair oven at 650 for 24 hr. till the constant weightwas obtained.
RESULTS AND DISCUSSION
Germination and seedling emergenceData in Table1 revealed that the average soil
and air temperature were lower under normalplanting as compared to late planting.Temperatures were higher at 5 cm depth ascompared to 10 cm depth. Lower soil and airtemperature increased the total period foremergence in early planting, whereas higher soiland air temperatures hastened the emergence inlate planting (earlier by 2-days in comparison toearly planting). Early planting had favorableeffect on total germination (83.5%) as comparedto late plantings (33.9%). This was due to thereason that soybean is highly sensitive totemperature fluctuations, particularly in the earlyperiod of its growth.
The mean soil temperature, at 5 and 10 cmdepth under late planting was 29.2 and 28.1oC asagainst 26.6o and 25.7oC under normal planting.Since, under late planting, the temperature duringthe initial 3-days ranged between 34.5o-36oC inthe morning and 31.5 to 37oC in the forenoonalong with high atmospheric temperature (35-38oC). This might have led to poor germinationunder late planting. More over, lower soil and airtemperatures, which prevailed during normalplanting, increased the total period for emergence(10 days), whereas owing to high soil and airtemperatures, germination was hastened under lateplanting and was completed in only 8days.
Seed yieldThe interaction of planting date, variety and
phosphorus levels indicated that seed yield wassignificantly influenced by the various treatment
J Krishi Vigyan 2014, 3(1) : 18-23
Tomar et al
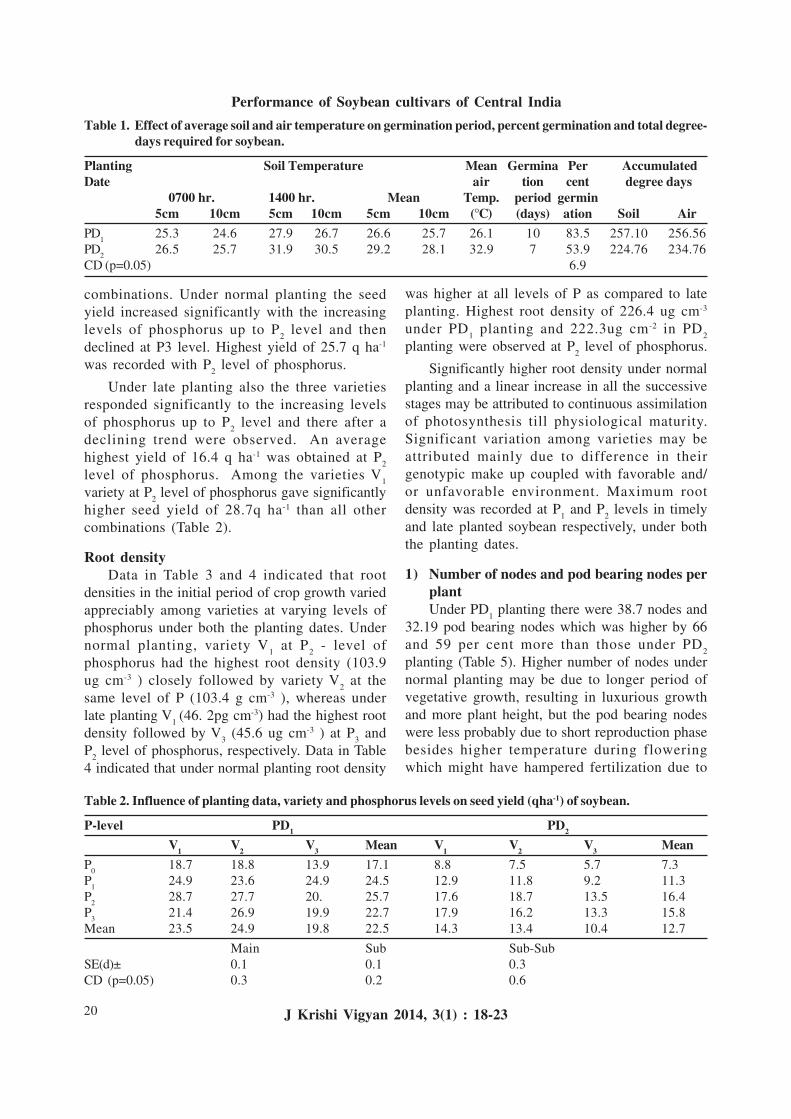
20
combinations. Under normal planting the seedyield increased significantly with the increasinglevels of phosphorus up to P
2 level and then
declined at P3 level. Highest yield of 25.7 q ha-1
was recorded with P2 level of phosphorus.
Under late planting also the three varietiesresponded significantly to the increasing levelsof phosphorus up to P
2 level and there after a
declining trend were observed. An averagehighest yield of 16.4 q ha-1 was obtained at P
2
level of phosphorus. Among the varieties V1
variety at P2 level of phosphorus gave significantly
higher seed yield of 28.7q ha-1 than all othercombinations (Table 2).
Root densityData in Table 3 and 4 indicated that root
densities in the initial period of crop growth variedappreciably among varieties at varying levels ofphosphorus under both the planting dates. Undernormal planting, variety V
1 at P
2 - level of
phosphorus had the highest root density (103.9ug cm-3 ) closely followed by variety V
2 at the
same level of P (103.4 g cm-3 ), whereas underlate planting V
1 (46. 2pg cm-3) had the highest root
density followed by V3 (45.6 ug cm-3 ) at P
3 and
P2 level of phosphorus, respectively. Data in Table
4 indicated that under normal planting root density
Table 1. Effect of average soil and air temperature on germination period, percent germination and total degree-days required for soybean.
Planting Soil Temperature Mean Germina Per AccumulatedDate air tion cent degree days
0700 hr. 1400 hr. Mean Temp. period germin5cm 10cm 5cm 10cm 5cm 10cm (°C) (days) ation Soil Air
PD1
25.3 24.6 27.9 26.7 26.6 25.7 26.1 10 83.5 257.10 256.56PD
226.5 25.7 31.9 30.5 29.2 28.1 32.9 7 53.9 224.76 234.76
CD (p=0.05) 6.9
was higher at all levels of P as compared to lateplanting. Highest root density of 226.4 ug cm-3
under PD1 planting and 222.3ug cm-2 in PD
2
planting were observed at P2 level of phosphorus.
Significantly higher root density under normalplanting and a linear increase in all the successivestages may be attributed to continuous assimilationof photosynthesis till physiological maturity.Significant variation among varieties may beattributed mainly due to difference in theirgenotypic make up coupled with favorable and/or unfavorable environment. Maximum rootdensity was recorded at P
1 and P
2 levels in timely
and late planted soybean respectively, under boththe planting dates.
1) Number of nodes and pod bearing nodes perplantUnder PD
1 planting there were 38.7 nodes and
32.19 pod bearing nodes which was higher by 66and 59 per cent more than those under PD
2
planting (Table 5). Higher number of nodes undernormal planting may be due to longer period ofvegetative growth, resulting in luxurious growthand more plant height, but the pod bearing nodeswere less probably due to short reproduction phasebesides higher temperature during floweringwhich might have hampered fertilization due to
Table 2. Influence of planting data, variety and phosphorus levels on seed yield (qha-1) of soybean.
P-level PD1 PD2
V1 V2 V3 Mean V1 V2 V3 MeanP
018.7 18.8 13.9 17.1 8.8 7.5 5.7 7.3
P1
24.9 23.6 24.9 24.5 12.9 11.8 9.2 11.3P
228.7 27.7 20. 25.7 17.6 18.7 13.5 16.4
P3
21.4 26.9 19.9 22.7 17.9 16.2 13.3 15.8Mean 23.5 24.9 19.8 22.5 14.3 13.4 10.4 12.7
Main Sub Sub-SubSE(d)± 0.1 0.1 0.3CD (p=0.05) 0.3 0.2 0.6
J Krishi Vigyan 2014, 3(1) : 18-23
Performance of Soybean cultivars of Central India
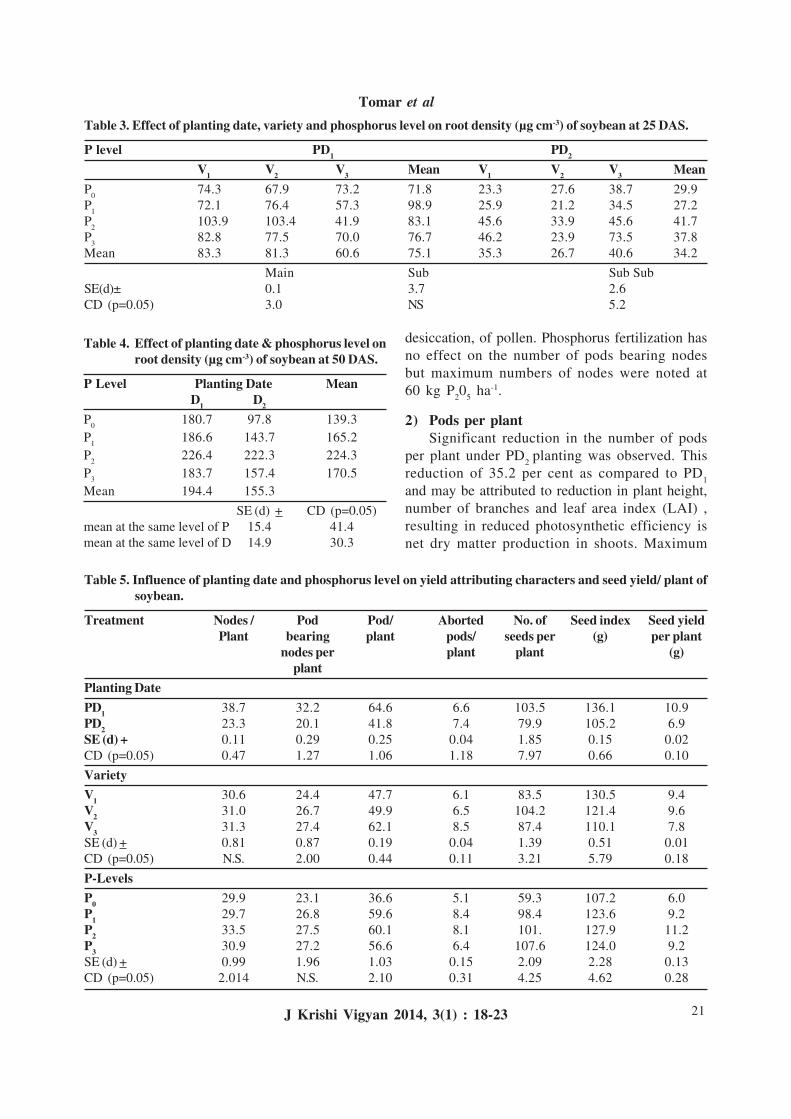
21
Table 3. Effect of planting date, variety and phosphorus level on root density (µg cm-3) of soybean at 25 DAS.
P level PD1 PD2
V1 V2 V3 Mean V1 V2 V3 MeanP
074.3 67.9 73.2 71.8 23.3 27.6 38.7 29.9
P1
72.1 76.4 57.3 98.9 25.9 21.2 34.5 27.2P
2103.9 103.4 41.9 83.1 45.6 33.9 45.6 41.7
P3
82.8 77.5 70.0 76.7 46.2 23.9 73.5 37.8Mean 83.3 81.3 60.6 75.1 35.3 26.7 40.6 34.2
Main Sub Sub SubSE(d)± 0.1 3.7 2.6CD (p=0.05) 3.0 NS 5.2
desiccation, of pollen. Phosphorus fertilization hasno effect on the number of pods bearing nodesbut maximum numbers of nodes were noted at60 kg P
20
5 ha-1.
2) Pods per plantSignificant reduction in the number of pods
per plant under PD2
planting was observed. Thisreduction of 35.2 per cent as compared to PD
1
and may be attributed to reduction in plant height,number of branches and leaf area index (LAI) ,resulting in reduced photosynthetic efficiency isnet dry matter production in shoots. Maximum
Table 5. Influence of planting date and phosphorus level on yield attributing characters and seed yield/ plant ofsoybean.
Treatment Nodes / Pod Pod/ Aborted No. of Seed index Seed yieldPlant bearing plant pods/ seeds per (g) per plant
nodes per plant plant (g)plant
Planting DatePD1 38.7 32.2 64.6 6.6 103.5 136.1 10.9PD2 23.3 20.1 41.8 7.4 79.9 105.2 6.9SE (d) + 0.11 0.29 0.25 0.04 1.85 0.15 0.02CD (p=0.05) 0.47 1.27 1.06 1.18 7.97 0.66 0.10
VarietyV1 30.6 24.4 47.7 6.1 83.5 130.5 9.4V2 31.0 26.7 49.9 6.5 104.2 121.4 9.6V3 31.3 27.4 62.1 8.5 87.4 110.1 7.8SE (d) + 0.81 0.87 0.19 0.04 1.39 0.51 0.01CD (p=0.05) N.S. 2.00 0.44 0.11 3.21 5.79 0.18
P-LevelsP0 29.9 23.1 36.6 5.1 59.3 107.2 6.0P1 29.7 26.8 59.6 8.4 98.4 123.6 9.2P2 33.5 27.5 60.1 8.1 101. 127.9 11.2P3 30.9 27.2 56.6 6.4 107.6 124.0 9.2SE (d) + 0.99 1.96 1.03 0.15 2.09 2.28 0.13CD (p=0.05) 2.014 N.S. 2.10 0.31 4.25 4.62 0.28
Table 4. Effect of planting date & phosphorus level onroot density (µg cm-3) of soybean at 50 DAS.
P Level Planting Date MeanD1 D2
P0
180.7 97.8 139.3P
1186.6 143.7 165.2
P2
226.4 222.3 224.3P
3183.7 157.4 170.5
Mean 194.4 155.3
SE (d) + CD (p=0.05)mean at the same level of P 15.4 41.4mean at the same level of D 14.9 30.3
J Krishi Vigyan 2014, 3(1) : 18-23
Tomar et al
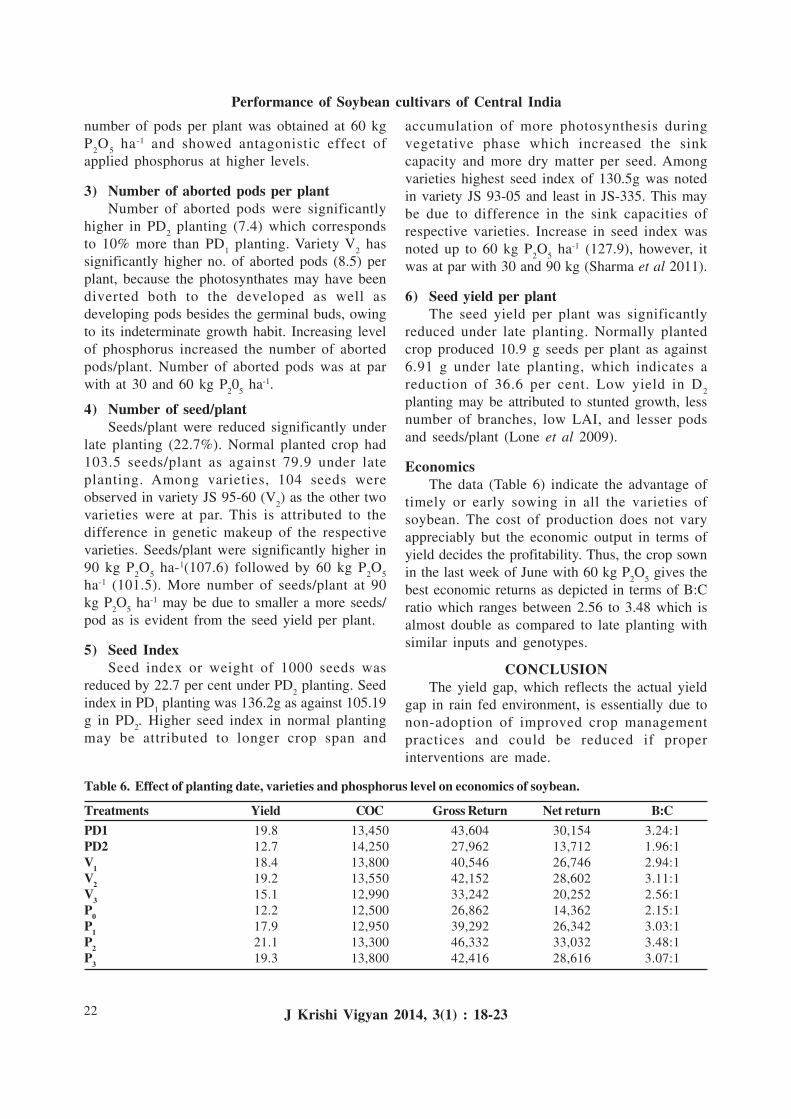
22
number of pods per plant was obtained at 60 kgP
2O
5 ha-1 and showed antagonistic effect of
applied phosphorus at higher levels.
3) Number of aborted pods per plantNumber of aborted pods were significantly
higher in PD2 planting (7.4) which corresponds
to 10% more than PD1 planting. Variety V
2 has
significantly higher no. of aborted pods (8.5) perplant, because the photosynthates may have beendiverted both to the developed as well asdeveloping pods besides the germinal buds, owingto its indeterminate growth habit. Increasing levelof phosphorus increased the number of abortedpods/plant. Number of aborted pods was at parwith at 30 and 60 kg P
20
5 ha-1.
4) Number of seed/plantSeeds/plant were reduced significantly under
late planting (22.7%). Normal planted crop had103.5 seeds/plant as against 79.9 under lateplanting. Among varieties, 104 seeds wereobserved in variety JS 95-60 (V
2) as the other two
varieties were at par. This is attributed to thedifference in genetic makeup of the respectivevarieties. Seeds/plant were significantly higher in90 kg P
2O
5 ha-1(107.6) followed by 60 kg P
2O
5
ha-1 (101.5). More number of seeds/plant at 90kg P
2O
5 ha-1 may be due to smaller a more seeds/
pod as is evident from the seed yield per plant.
5) Seed IndexSeed index or weight of 1000 seeds was
reduced by 22.7 per cent under PD2 planting. Seed
index in PD1 planting was 136.2g as against 105.19
g in PD2. Higher seed index in normal planting
may be attributed to longer crop span and
accumulation of more photosynthesis duringvegetative phase which increased the sinkcapacity and more dry matter per seed. Amongvarieties highest seed index of 130.5g was notedin variety JS 93-05 and least in JS-335. This maybe due to difference in the sink capacities ofrespective varieties. Increase in seed index wasnoted up to 60 kg P
2O
5 ha-1 (127.9), however, it
was at par with 30 and 90 kg (Sharma et al 2011).
6) Seed yield per plantThe seed yield per plant was significantly
reduced under late planting. Normally plantedcrop produced 10.9 g seeds per plant as against6.91 g under late planting, which indicates areduction of 36.6 per cent. Low yield in D
2
planting may be attributed to stunted growth, lessnumber of branches, low LAI, and lesser podsand seeds/plant (Lone et al 2009).
EconomicsThe data (Table 6) indicate the advantage of
timely or early sowing in all the varieties ofsoybean. The cost of production does not varyappreciably but the economic output in terms ofyield decides the profitability. Thus, the crop sownin the last week of June with 60 kg P
2O
5 gives the
best economic returns as depicted in terms of B:Cratio which ranges between 2.56 to 3.48 which isalmost double as compared to late planting withsimilar inputs and genotypes.
CONCLUSIONThe yield gap, which reflects the actual yield
gap in rain fed environment, is essentially due tonon-adoption of improved crop managementpractices and could be reduced if properinterventions are made.
Table 6. Effect of planting date, varieties and phosphorus level on economics of soybean.
Treatments Yield COC Gross Return Net return B:CPD1 19.8 13,450 43,604 30,154 3.24:1PD2 12.7 14,250 27,962 13,712 1.96:1V1 18.4 13,800 40,546 26,746 2.94:1V2 19.2 13,550 42,152 28,602 3.11:1V3 15.1 12,990 33,242 20,252 2.56:1P0 12.2 12,500 26,862 14,362 2.15:1P1 17.9 12,950 39,292 26,342 3.03:1P2 21.1 13,300 46,332 33,032 3.48:1P3 19.3 13,800 42,416 28,616 3.07:1
J Krishi Vigyan 2014, 3(1) : 18-23
Performance of Soybean cultivars of Central India
23
REFERENCESSrinivas K (2012). Simulation of Soybean Growth under Sowing
Date Management by CROPGRO Model. Am. J. Agriculturaland Biological Sciences 7 (2): 143-149
Lone, Bilal Ahmad, Hasan, Badrul, Ansar S and KhandayBA (2009). Effect of seed rate, row spacing and fertility levelson growth and nutrient uptake of soybean (Glycine max. L.)under temperate conditions. ARPN Journal of Agriculturaland Biological Science 4 (3): 7-10.
Fageria N K, Zimmenman F J P and Batgar V C( 1995). Lime andpriterathon on growth and nutrient uptake by upland rice,
wheat, common bean and corn in an Oxisol. Journal of PlantNutrition 18: 2519-32.
Kakar K M, Tariq M, Taj F H and Nawab K (2002). Phosphoroususe efficiency of Soybean as affected by phosphorousapplication and inoculation. Pakistan Journal of Agronomy1(1): 49-50.
Sharma U C, Datta M and Sharma Vikas (2011). Effect of appliedphosphorus on the yield and nutrient uptake by soybeancultivars on acidic hill soil. Open Journal of Soil Science 1:45-48.
Received on 23/8/2014 Accepted on 10/9/2014
J Krishi Vigyan 2014, 3(1) : 18-23
Tomar et al
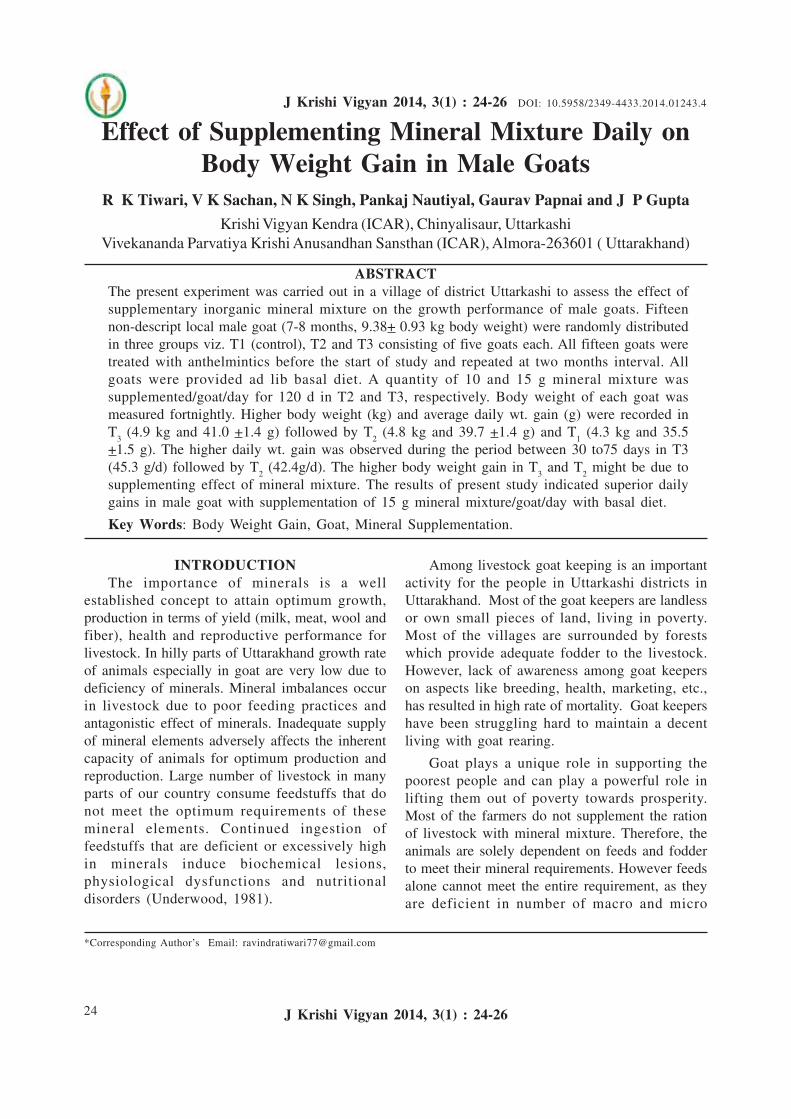
24
Effect of Supplementing Mineral Mixture Daily onBody Weight Gain in Male Goats
R K Tiwari, V K Sachan, N K Singh, Pankaj Nautiyal, Gaurav Papnai and J P GuptaKrishi Vigyan Kendra (ICAR), Chinyalisaur, Uttarkashi
Vivekananda Parvatiya Krishi Anusandhan Sansthan (ICAR), Almora-263601 ( Uttarakhand)
ABSTRACTThe present experiment was carried out in a village of district Uttarkashi to assess the effect ofsupplementary inorganic mineral mixture on the growth performance of male goats. Fifteennon-descript local male goat (7-8 months, 9.38+ 0.93 kg body weight) were randomly distributedin three groups viz. T1 (control), T2 and T3 consisting of five goats each. All fifteen goats weretreated with anthelmintics before the start of study and repeated at two months interval. Allgoats were provided ad lib basal diet. A quantity of 10 and 15 g mineral mixture wassupplemented/goat/day for 120 d in T2 and T3, respectively. Body weight of each goat wasmeasured fortnightly. Higher body weight (kg) and average daily wt. gain (g) were recorded inT
3 (4.9 kg and 41.0 +1.4 g) followed by T
2 (4.8 kg and 39.7 +1.4 g) and T
1 (4.3 kg and 35.5
+1.5 g). The higher daily wt. gain was observed during the period between 30 to75 days in T3(45.3 g/d) followed by T
2 (42.4g/d). The higher body weight gain in T
3 and T
2 might be due to
supplementing effect of mineral mixture. The results of present study indicated superior dailygains in male goat with supplementation of 15 g mineral mixture/goat/day with basal diet.
Key Words: Body Weight Gain, Goat, Mineral Supplementation.
INTRODUCTIONThe importance of minerals is a well
established concept to attain optimum growth,production in terms of yield (milk, meat, wool andfiber), health and reproductive performance forlivestock. In hilly parts of Uttarakhand growth rateof animals especially in goat are very low due todeficiency of minerals. Mineral imbalances occurin livestock due to poor feeding practices andantagonistic effect of minerals. Inadequate supplyof mineral elements adversely affects the inherentcapacity of animals for optimum production andreproduction. Large number of livestock in manyparts of our country consume feedstuffs that donot meet the optimum requirements of thesemineral elements. Continued ingestion offeedstuffs that are deficient or excessively highin minerals induce biochemical lesions,physiological dysfunctions and nutritionaldisorders (Underwood, 1981).
Among livestock goat keeping is an importantactivity for the people in Uttarkashi districts inUttarakhand. Most of the goat keepers are landlessor own small pieces of land, living in poverty.Most of the villages are surrounded by forestswhich provide adequate fodder to the livestock.However, lack of awareness among goat keeperson aspects like breeding, health, marketing, etc.,has resulted in high rate of mortality. Goat keepershave been struggling hard to maintain a decentliving with goat rearing.
Goat plays a unique role in supporting thepoorest people and can play a powerful role inlifting them out of poverty towards prosperity.Most of the farmers do not supplement the rationof livestock with mineral mixture. Therefore, theanimals are solely dependent on feeds and fodderto meet their mineral requirements. However feedsalone cannot meet the entire requirement, as theyare deficient in number of macro and micro
*Corresponding Author’s Email: [email protected]
J Krishi Vigyan 2014, 3(1) : 24-26 DOI: 10.5958/2349-4433.2014.01243.4
J Krishi Vigyan 2014, 3(1) : 24-26
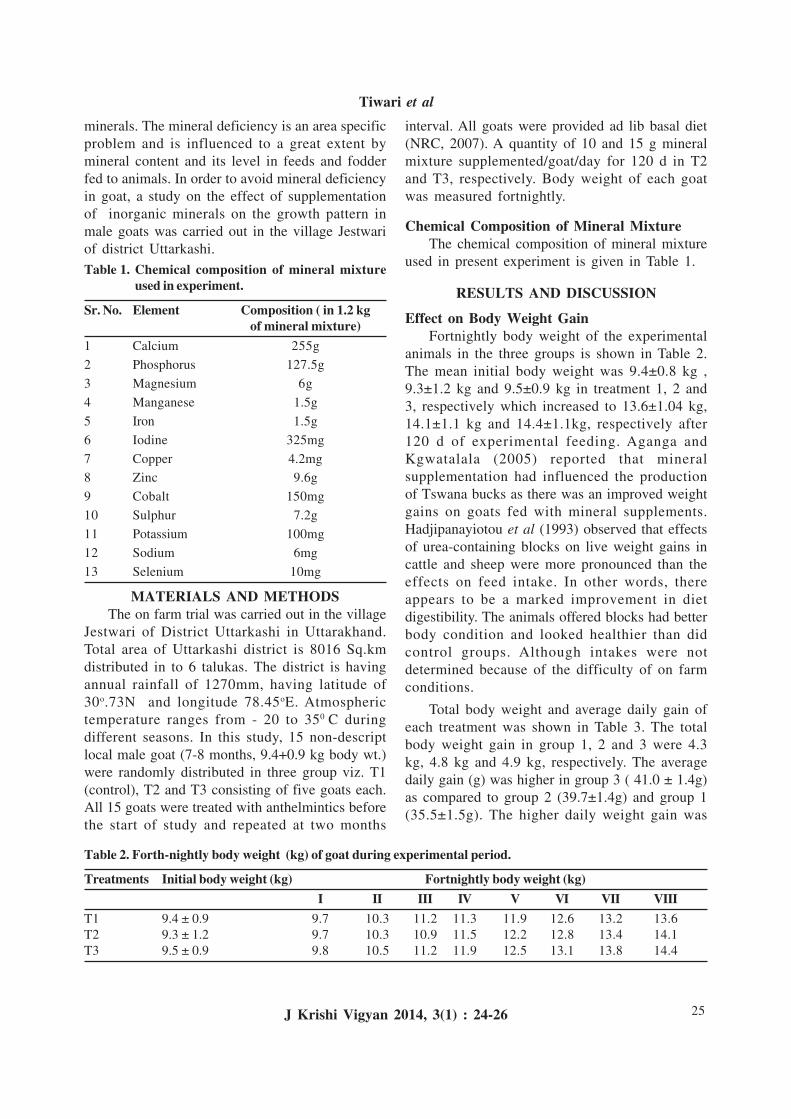
25
minerals. The mineral deficiency is an area specificproblem and is influenced to a great extent bymineral content and its level in feeds and fodderfed to animals. In order to avoid mineral deficiencyin goat, a study on the effect of supplementationof inorganic minerals on the growth pattern inmale goats was carried out in the village Jestwariof district Uttarkashi.
interval. All goats were provided ad lib basal diet(NRC, 2007). A quantity of 10 and 15 g mineralmixture supplemented/goat/day for 120 d in T2and T3, respectively. Body weight of each goatwas measured fortnightly.
Chemical Composition of Mineral MixtureThe chemical composition of mineral mixture
used in present experiment is given in Table 1.
RESULTS AND DISCUSSION
Effect on Body Weight GainFortnightly body weight of the experimental
animals in the three groups is shown in Table 2.The mean initial body weight was 9.4±0.8 kg ,9.3±1.2 kg and 9.5±0.9 kg in treatment 1, 2 and3, respectively which increased to 13.6±1.04 kg,14.1±1.1 kg and 14.4±1.1kg, respectively after120 d of experimental feeding. Aganga andKgwatalala (2005) reported that mineralsupplementation had influenced the productionof Tswana bucks as there was an improved weightgains on goats fed with mineral supplements.Hadjipanayiotou et al (1993) observed that effectsof urea-containing blocks on live weight gains incattle and sheep were more pronounced than theeffects on feed intake. In other words, thereappears to be a marked improvement in dietdigestibility. The animals offered blocks had betterbody condition and looked healthier than didcontrol groups. Although intakes were notdetermined because of the difficulty of on farmconditions.
Total body weight and average daily gain ofeach treatment was shown in Table 3. The totalbody weight gain in group 1, 2 and 3 were 4.3kg, 4.8 kg and 4.9 kg, respectively. The averagedaily gain (g) was higher in group 3 ( 41.0 ± 1.4g)as compared to group 2 (39.7±1.4g) and group 1(35.5±1.5g). The higher daily weight gain was
Table 2. Forth-nightly body weight (kg) of goat during experimental period.
Treatments Initial body weight (kg) Fortnightly body weight (kg)I II III IV V VI VII VIII
T1 9.4 ± 0.9 9.7 10.3 11.2 11.3 11.9 12.6 13.2 13.6T2 9.3 ± 1.2 9.7 10.3 10.9 11.5 12.2 12.8 13.4 14.1T3 9.5 ± 0.9 9.8 10.5 11.2 11.9 12.5 13.1 13.8 14.4
Table 1. Chemical composition of mineral mixtureused in experiment.
Sr. No. Element Composition ( in 1.2 kgof mineral mixture)
1 Calcium 255g
2 Phosphorus 127.5g
3 Magnesium 6g
4 Manganese 1.5g
5 Iron 1.5g
6 Iodine 325mg
7 Copper 4.2mg
8 Zinc 9.6g
9 Cobalt 150mg
10 Sulphur 7.2g
11 Potassium 100mg
12 Sodium 6mg
13 Selenium 10mg
MATERIALS AND METHODSThe on farm trial was carried out in the village
Jestwari of District Uttarkashi in Uttarakhand.Total area of Uttarkashi district is 8016 Sq.kmdistributed in to 6 talukas. The district is havingannual rainfall of 1270mm, having latitude of30o.73N and longitude 78.45oE. Atmospherictemperature ranges from - 20 to 350 C duringdifferent seasons. In this study, 15 non-descriptlocal male goat (7-8 months, 9.4+0.9 kg body wt.)were randomly distributed in three group viz. T1(control), T2 and T3 consisting of five goats each.All 15 goats were treated with anthelmintics beforethe start of study and repeated at two months
J Krishi Vigyan 2014, 3(1) : 24-26
Tiwari et al
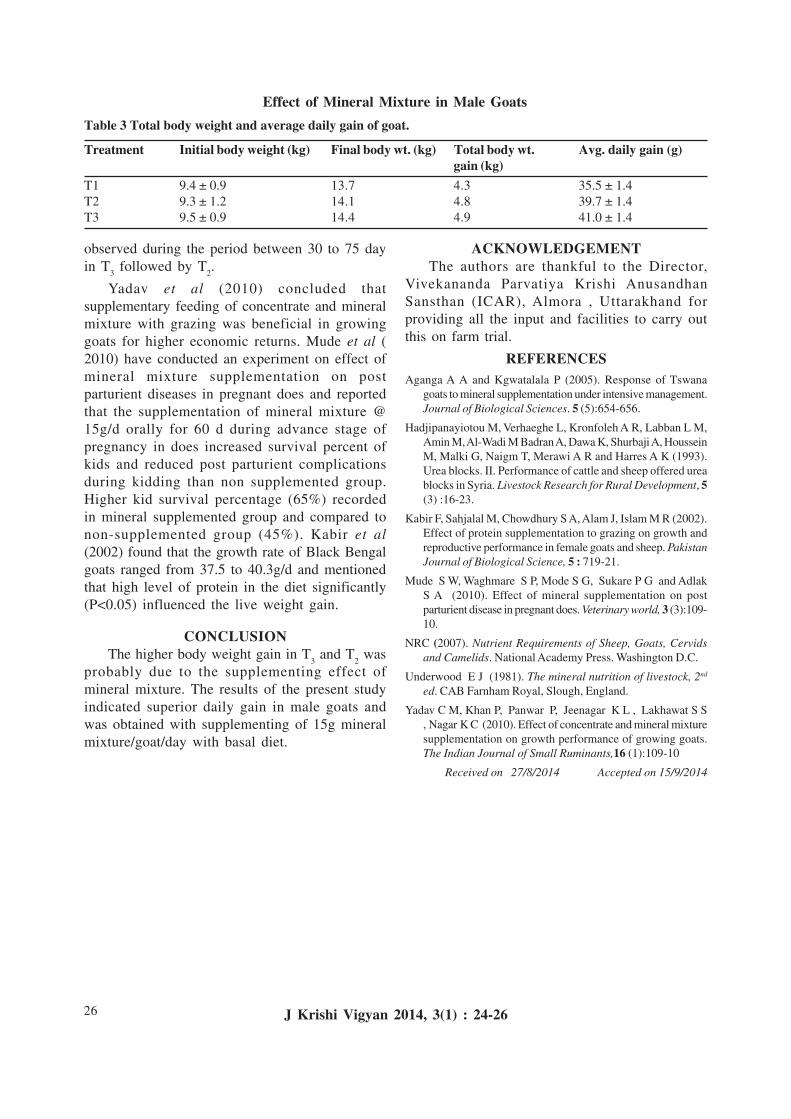
26
observed during the period between 30 to 75 dayin T
3 followed by T
2.
Yadav et al (2010) concluded thatsupplementary feeding of concentrate and mineralmixture with grazing was beneficial in growinggoats for higher economic returns. Mude et al (2010) have conducted an experiment on effect ofmineral mixture supplementation on postparturient diseases in pregnant does and reportedthat the supplementation of mineral mixture @15g/d orally for 60 d during advance stage ofpregnancy in does increased survival percent ofkids and reduced post parturient complicationsduring kidding than non supplemented group.Higher kid survival percentage (65%) recordedin mineral supplemented group and compared tonon-supplemented group (45%). Kabir et al(2002) found that the growth rate of Black Bengalgoats ranged from 37.5 to 40.3g/d and mentionedthat high level of protein in the diet significantly(P<0.05) influenced the live weight gain.
CONCLUSIONThe higher body weight gain in T
3 and T
2 was
probably due to the supplementing effect ofmineral mixture. The results of the present studyindicated superior daily gain in male goats andwas obtained with supplementing of 15g mineralmixture/goat/day with basal diet.
Table 3 Total body weight and average daily gain of goat.
Treatment Initial body weight (kg) Final body wt. (kg) Total body wt. Avg. daily gain (g)gain (kg)
T1 9.4 ± 0.9 13.7 4.3 35.5 ± 1.4T2 9.3 ± 1.2 14.1 4.8 39.7 ± 1.4T3 9.5 ± 0.9 14.4 4.9 41.0 ± 1.4
ACKNOWLEDGEMENTThe authors are thankful to the Director,
Vivekananda Parvatiya Krishi AnusandhanSansthan (ICAR), Almora , Uttarakhand forproviding all the input and facilities to carry outthis on farm trial.
REFERENCESAganga A A and Kgwatalala P (2005). Response of Tswana
goats to mineral supplementation under intensive management.Journal of Biological Sciences. 5 (5):654-656.
Hadjipanayiotou M, Verhaeghe L, Kronfoleh A R, Labban L M,Amin M, Al-Wadi M Badran A, Dawa K, Shurbaji A, HousseinM, Malki G, Naigm T, Merawi A R and Harres A K (1993).Urea blocks. II. Performance of cattle and sheep offered ureablocks in Syria. Livestock Research for Rural Development, 5(3) :16-23.
Kabir F, Sahjalal M, Chowdhury S A, Alam J, Islam M R (2002).Effect of protein supplementation to grazing on growth andreproductive performance in female goats and sheep. PakistanJournal of Biological Science, 5 : 719-21.
Mude S W, Waghmare S P, Mode S G, Sukare P G and AdlakS A (2010). Effect of mineral supplementation on postparturient disease in pregnant does. Veterinary world, 3 (3):109-10.
NRC (2007). Nutrient Requirements of Sheep, Goats, Cervidsand Camelids. National Academy Press. Washington D.C.
Underwood E J (1981). The mineral nutrition of livestock, 2nd
ed. CAB Farnham Royal, Slough, England.
Yadav C M, Khan P, Panwar P, Jeenagar K L , Lakhawat S S, Nagar K C (2010). Effect of concentrate and mineral mixturesupplementation on growth performance of growing goats.The Indian Journal of Small Ruminants,16 (1):109-10
Received on 27/8/2014 Accepted on 15/9/2014
J Krishi Vigyan 2014, 3(1) : 24-26
Effect of Mineral Mixture in Male Goats
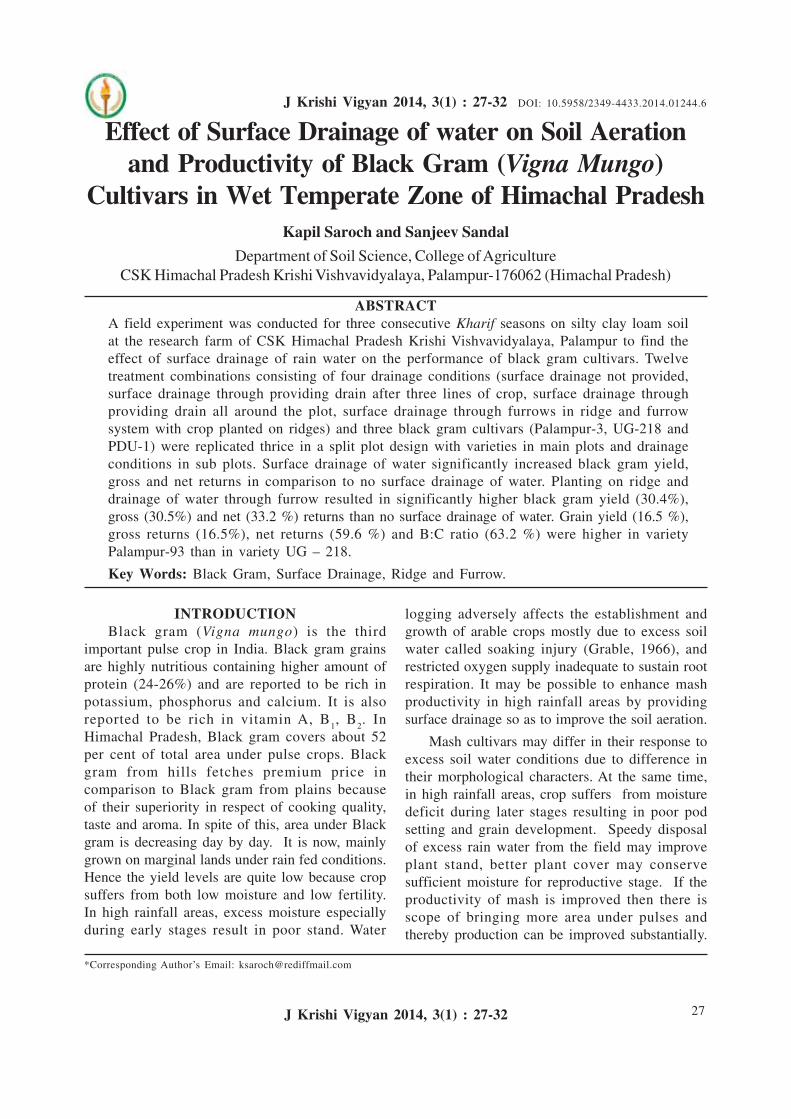
27
Effect of Surface Drainage of water on Soil Aerationand Productivity of Black Gram (Vigna Mungo)
Cultivars in Wet Temperate Zone of Himachal PradeshKapil Saroch and Sanjeev Sandal
Department of Soil Science, College of AgricultureCSK Himachal Pradesh Krishi Vishvavidyalaya, Palampur-176062 (Himachal Pradesh)
ABSTRACTA field experiment was conducted for three consecutive Kharif seasons on silty clay loam soilat the research farm of CSK Himachal Pradesh Krishi Vishvavidyalaya, Palampur to find theeffect of surface drainage of rain water on the performance of black gram cultivars. Twelvetreatment combinations consisting of four drainage conditions (surface drainage not provided,surface drainage through providing drain after three lines of crop, surface drainage throughproviding drain all around the plot, surface drainage through furrows in ridge and furrowsystem with crop planted on ridges) and three black gram cultivars (Palampur-3, UG-218 andPDU-1) were replicated thrice in a split plot design with varieties in main plots and drainageconditions in sub plots. Surface drainage of water significantly increased black gram yield,gross and net returns in comparison to no surface drainage of water. Planting on ridge anddrainage of water through furrow resulted in significantly higher black gram yield (30.4%),gross (30.5%) and net (33.2 %) returns than no surface drainage of water. Grain yield (16.5 %),gross returns (16.5%), net returns (59.6 %) and B:C ratio (63.2 %) were higher in varietyPalampur-93 than in variety UG – 218.
Key Words: Black Gram, Surface Drainage, Ridge and Furrow.
INTRODUCTIONBlack gram (Vigna mungo) is the third
important pulse crop in India. Black gram grainsare highly nutritious containing higher amount ofprotein (24-26%) and are reported to be rich inpotassium, phosphorus and calcium. It is alsoreported to be rich in vitamin A, B
1, B
2. In
Himachal Pradesh, Black gram covers about 52per cent of total area under pulse crops. Blackgram from hills fetches premium price incomparison to Black gram from plains becauseof their superiority in respect of cooking quality,taste and aroma. In spite of this, area under Blackgram is decreasing day by day. It is now, mainlygrown on marginal lands under rain fed conditions.Hence the yield levels are quite low because cropsuffers from both low moisture and low fertility.In high rainfall areas, excess moisture especiallyduring early stages result in poor stand. Water
logging adversely affects the establishment andgrowth of arable crops mostly due to excess soilwater called soaking injury (Grable, 1966), andrestricted oxygen supply inadequate to sustain rootrespiration. It may be possible to enhance mashproductivity in high rainfall areas by providingsurface drainage so as to improve the soil aeration.
Mash cultivars may differ in their response toexcess soil water conditions due to difference intheir morphological characters. At the same time,in high rainfall areas, crop suffers from moisturedeficit during later stages resulting in poor podsetting and grain development. Speedy disposalof excess rain water from the field may improveplant stand, better plant cover may conservesufficient moisture for reproductive stage. If theproductivity of mash is improved then there isscope of bringing more area under pulses andthereby production can be improved substantially.
*Corresponding Author’s Email: [email protected]
J Krishi Vigyan 2014, 3(1) : 27-32 DOI: 10.5958/2349-4433.2014.01244.6
J Krishi Vigyan 2014, 3(1) : 27-32
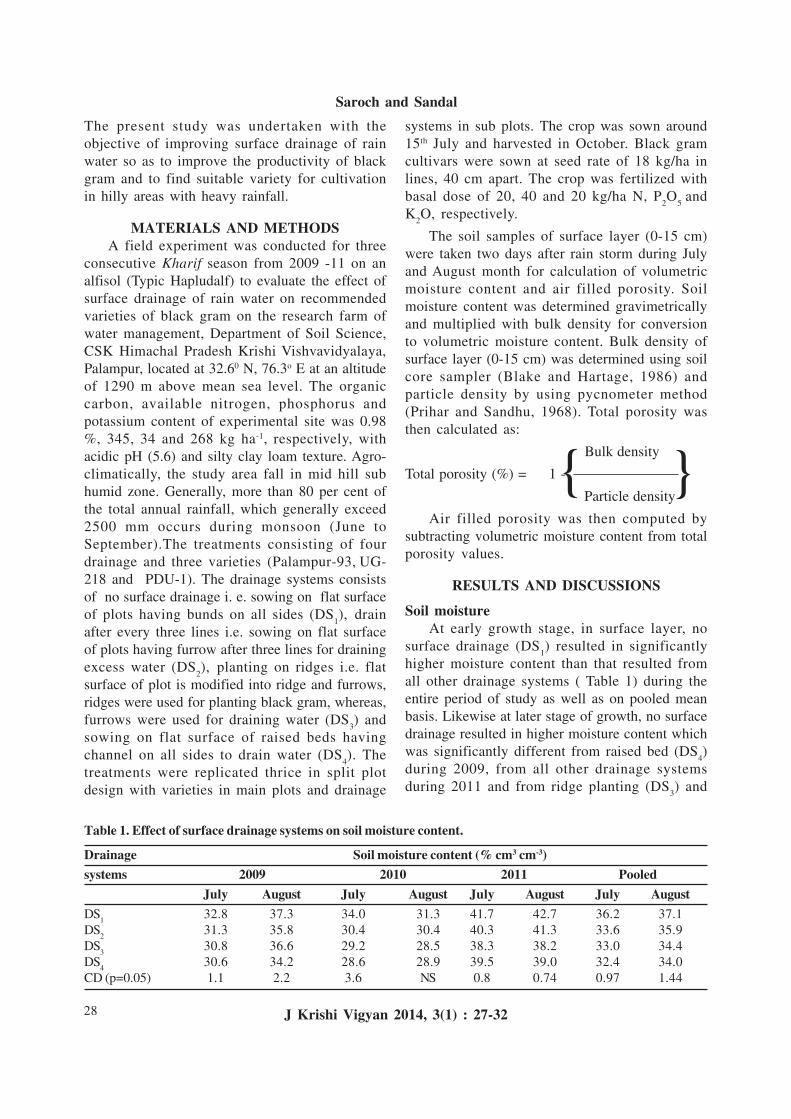
28
The present study was undertaken with theobjective of improving surface drainage of rainwater so as to improve the productivity of blackgram and to find suitable variety for cultivationin hilly areas with heavy rainfall.
MATERIALS AND METHODSA field experiment was conducted for three
consecutive Kharif season from 2009 -11 on analfisol (Typic Hapludalf) to evaluate the effect ofsurface drainage of rain water on recommendedvarieties of black gram on the research farm ofwater management, Department of Soil Science,CSK Himachal Pradesh Krishi Vishvavidyalaya,Palampur, located at 32.60 N, 76.3o E at an altitudeof 1290 m above mean sea level. The organiccarbon, available nitrogen, phosphorus andpotassium content of experimental site was 0.98%, 345, 34 and 268 kg ha-1, respectively, withacidic pH (5.6) and silty clay loam texture. Agro-climatically, the study area fall in mid hill subhumid zone. Generally, more than 80 per cent ofthe total annual rainfall, which generally exceed2500 mm occurs during monsoon (June toSeptember).The treatments consisting of fourdrainage and three varieties (Palampur-93,
UG-
218 and PDU-1). The drainage systems consists
of no surface drainage i. e. sowing on flat surfaceof plots having bunds on all sides (DS
1),
drain
after every three lines i.e. sowing on flat surfaceof plots having furrow after three lines for drainingexcess water (DS
2),
planting on ridges i.e. flat
surface of plot is modified into ridge and furrows,ridges were used for planting black gram, whereas,furrows were used for draining water (DS
3) and
sowing on flat surface of raised beds havingchannel on all sides to drain water (DS
4). The
treatments were replicated thrice in split plotdesign with varieties in main plots and drainage
systems in sub plots. The crop was sown around15th July and harvested in October. Black gramcultivars were sown at seed rate of 18 kg/ha inlines, 40 cm apart. The crop was fertilized withbasal dose of 20, 40 and 20 kg/ha N, P
2O
5 and
K2O, respectively.
The soil samples of surface layer (0-15 cm)were taken two days after rain storm during Julyand August month for calculation of volumetricmoisture content and air filled porosity. Soilmoisture content was determined gravimetricallyand multiplied with bulk density for conversionto volumetric moisture content. Bulk density ofsurface layer (0-15 cm) was determined using soilcore sampler (Blake and Hartage, 1986) andparticle density by using pycnometer method(Prihar and Sandhu, 1968). Total porosity wasthen calculated as:
Bulk density
Total porosity (%) = 1 -
Particle density
Air filled porosity was then computed bysubtracting volumetric moisture content from totalporosity values.
RESULTS AND DISCUSSIONS
Soil moistureAt early growth stage, in surface layer, no
surface drainage (DS1) resulted in significantly
higher moisture content than that resulted fromall other drainage systems ( Table 1) during theentire period of study as well as on pooled meanbasis. Likewise at later stage of growth, no surfacedrainage resulted in higher moisture content whichwas significantly different from raised bed (DS
4)
during 2009, from all other drainage systemsduring 2011 and from ridge planting (DS
3) and
Table 1. Effect of surface drainage systems on soil moisture content.
Drainage Soil moisture content (% cm3 cm-3)systems 2009 2010 2011 Pooled
July August July August July August July AugustDS
132.8 37.3 34.0 31.3 41.7 42.7 36.2 37.1
DS2
31.3 35.8 30.4 30.4 40.3 41.3 33.6 35.9DS
330.8 36.6 29.2 28.5 38.3 38.2 33.0 34.4
DS4
30.6 34.2 28.6 28.9 39.5 39.0 32.4 34.0CD (p=0.05) 1.1 2.2 3.6 NS 0.8 0.74 0.97 1.44
{ }
J Krishi Vigyan 2014, 3(1) : 27-32
Saroch and Sandal
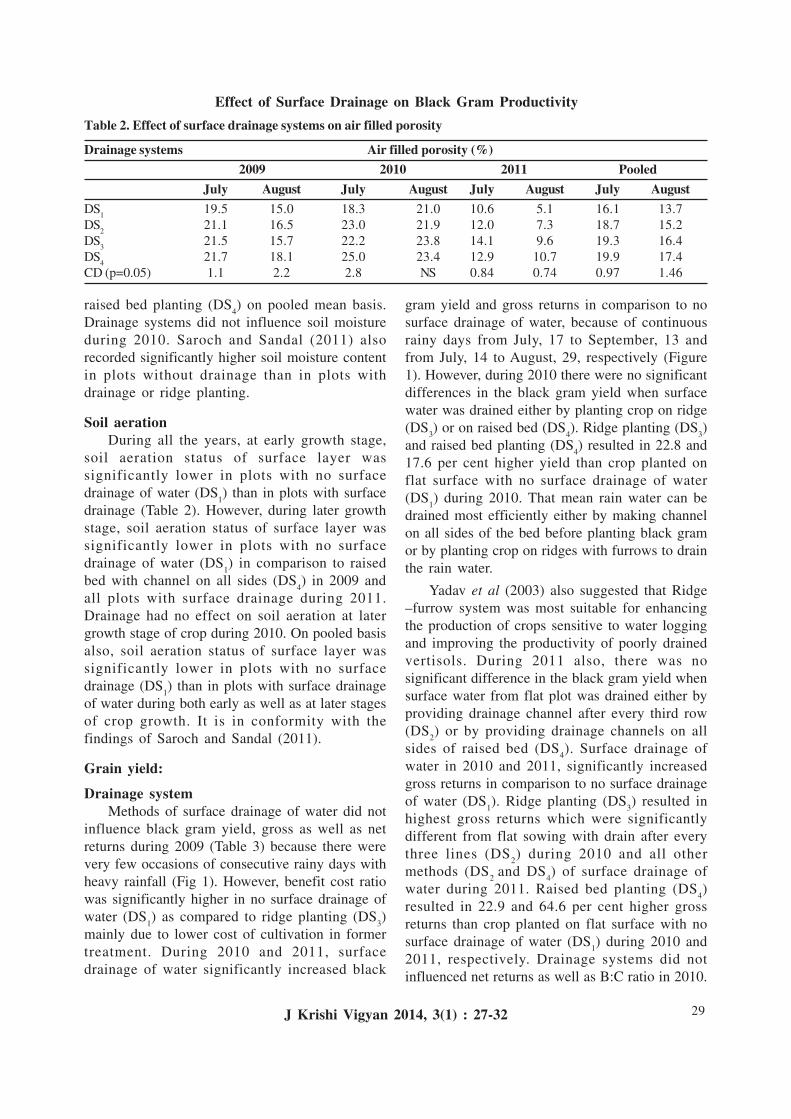
29
raised bed planting (DS4) on pooled mean basis.
Drainage systems did not influence soil moistureduring 2010. Saroch and Sandal (2011) alsorecorded significantly higher soil moisture contentin plots without drainage than in plots withdrainage or ridge planting.
Soil aerationDuring all the years, at early growth stage,
soil aeration status of surface layer wassignificantly lower in plots with no surfacedrainage of water (DS
1) than in plots with surface
drainage (Table 2). However, during later growthstage, soil aeration status of surface layer wassignificantly lower in plots with no surfacedrainage of water (DS
1) in comparison to raised
bed with channel on all sides (DS4) in 2009 and
all plots with surface drainage during 2011.Drainage had no effect on soil aeration at latergrowth stage of crop during 2010. On pooled basisalso, soil aeration status of surface layer wassignificantly lower in plots with no surfacedrainage (DS
1) than in plots with surface drainage
of water during both early as well as at later stagesof crop growth. It is in conformity with thefindings of Saroch and Sandal (2011).
Grain yield:
Drainage systemMethods of surface drainage of water did not
influence black gram yield, gross as well as netreturns during 2009 (Table 3) because there werevery few occasions of consecutive rainy days withheavy rainfall (Fig 1). However, benefit cost ratiowas significantly higher in no surface drainage ofwater (DS
1) as compared to ridge planting (DS
3)
mainly due to lower cost of cultivation in formertreatment. During 2010 and 2011, surfacedrainage of water significantly increased black
gram yield and gross returns in comparison to nosurface drainage of water, because of continuousrainy days from July, 17 to September, 13 andfrom July, 14 to August, 29, respectively (Figure1). However, during 2010 there were no significantdifferences in the black gram yield when surfacewater was drained either by planting crop on ridge(DS
3) or on raised bed (DS
4). Ridge planting (DS
3)
and raised bed planting (DS4) resulted in 22.8 and
17.6 per cent higher yield than crop planted onflat surface with no surface drainage of water(DS
1) during 2010. That mean rain water can be
drained most efficiently either by making channelon all sides of the bed before planting black gramor by planting crop on ridges with furrows to drainthe rain water.
Yadav et al (2003) also suggested that Ridge–furrow system was most suitable for enhancingthe production of crops sensitive to water loggingand improving the productivity of poorly drainedvertisols. During 2011 also, there was nosignificant difference in the black gram yield whensurface water from flat plot was drained either byproviding drainage channel after every third row(DS
2) or by providing drainage channels on all
sides of raised bed (DS4). Surface drainage of
water in 2010 and 2011, significantly increasedgross returns in comparison to no surface drainageof water (DS
1). Ridge planting (DS
3) resulted in
highest gross returns which were significantlydifferent from flat sowing with drain after everythree lines (DS
2) during 2010 and all other
methods (DS2
and DS4) of surface drainage of
water during 2011. Raised bed planting (DS4)
resulted in 22.9 and 64.6 per cent higher grossreturns than crop planted on flat surface with nosurface drainage of water (DS
1) during 2010 and
2011, respectively. Drainage systems did notinfluenced net returns as well as B:C ratio in 2010.
Table 2. Effect of surface drainage systems on air filled porosity
Drainage systems Air filled porosity (%) 2009 2010 2011 Pooled
July August July August July August July AugustDS
119.5 15.0 18.3 21.0 10.6 5.1 16.1 13.7
DS2
21.1 16.5 23.0 21.9 12.0 7.3 18.7 15.2DS
321.5 15.7 22.2 23.8 14.1 9.6 19.3 16.4
DS4
21.7 18.1 25.0 23.4 12.9 10.7 19.9 17.4CD (p=0.05) 1.1 2.2 2.8 NS 0.84 0.74 0.97 1.46
J Krishi Vigyan 2014, 3(1) : 27-32
Effect of Surface Drainage on Black Gram Productivity
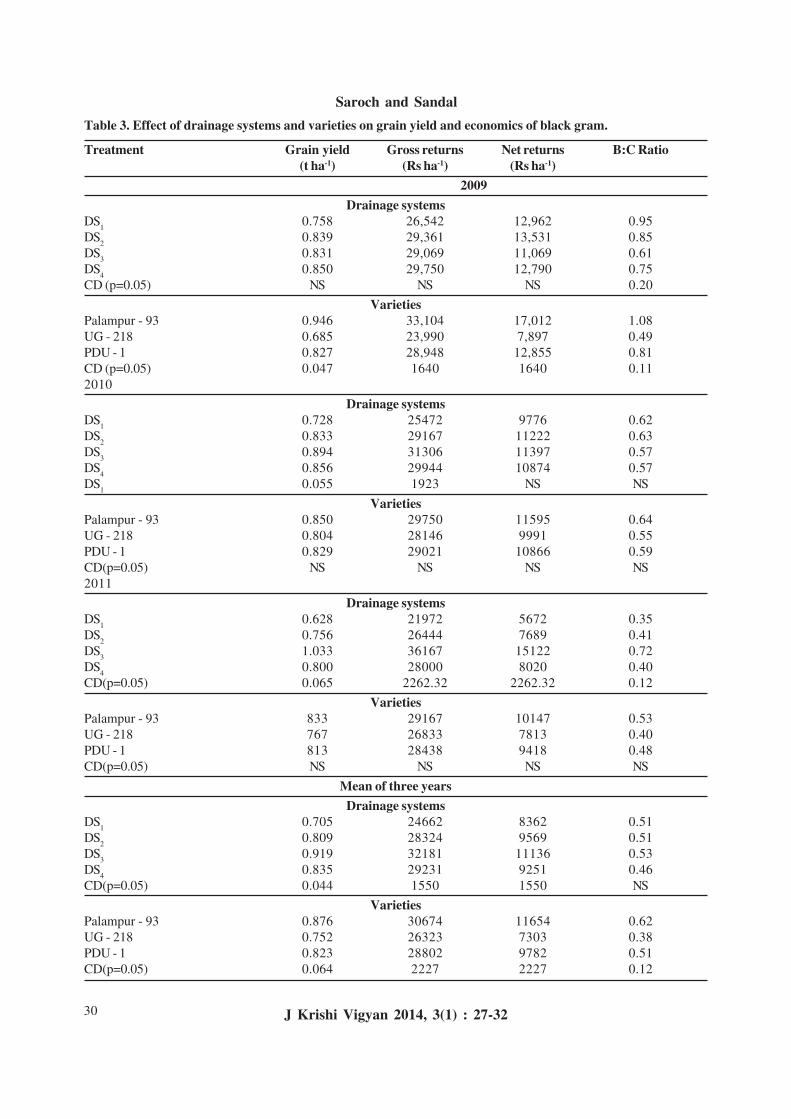
30
Table 3. Effect of drainage systems and varieties on grain yield and economics of black gram.
Treatment Grain yield Gross returns Net returns B:C Ratio(t ha-1) (Rs ha-1) (Rs ha-1)
2009Drainage systems
DS1
0.758 26,542 12,962 0.95DS
20.839 29,361 13,531 0.85
DS3
0.831 29,069 11,069 0.61DS
40.850 29,750 12,790 0.75
CD (p=0.05) NS NS NS 0.20
VarietiesPalampur - 93 0.946 33,104 17,012 1.08UG - 218 0.685 23,990 7,897 0.49PDU - 1 0.827 28,948 12,855 0.81CD (p=0.05) 0.047 1640 1640 0.112010
Drainage systemsDS
10.728 25472 9776 0.62
DS2
0.833 29167 11222 0.63DS
30.894 31306 11397 0.57
DS4
0.856 29944 10874 0.57DS
10.055 1923 NS NS
VarietiesPalampur - 93 0.850 29750 11595 0.64UG - 218 0.804 28146 9991 0.55PDU - 1 0.829 29021 10866 0.59CD(p=0.05) NS NS NS NS2011
Drainage systemsDS
10.628 21972 5672 0.35
DS2
0.756 26444 7689 0.41DS
31.033 36167 15122 0.72
DS4
0.800 28000 8020 0.40CD(p=0.05) 0.065 2262.32 2262.32 0.12
VarietiesPalampur - 93 833 29167 10147 0.53UG - 218 767 26833 7813 0.40PDU - 1 813 28438 9418 0.48CD(p=0.05) NS NS NS NS
Mean of three yearsDrainage systems
DS1
0.705 24662 8362 0.51DS
20.809 28324 9569 0.51
DS3
0.919 32181 11136 0.53DS
40.835 29231 9251 0.46
CD(p=0.05) 0.044 1550 1550 NS
VarietiesPalampur - 93 0.876 30674 11654 0.62UG - 218 0.752 26323 7303 0.38PDU - 1 0.823 28802 9782 0.51CD(p=0.05) 0.064 2227 2227 0.12
J Krishi Vigyan 2014, 3(1) : 27-32
Saroch and Sandal
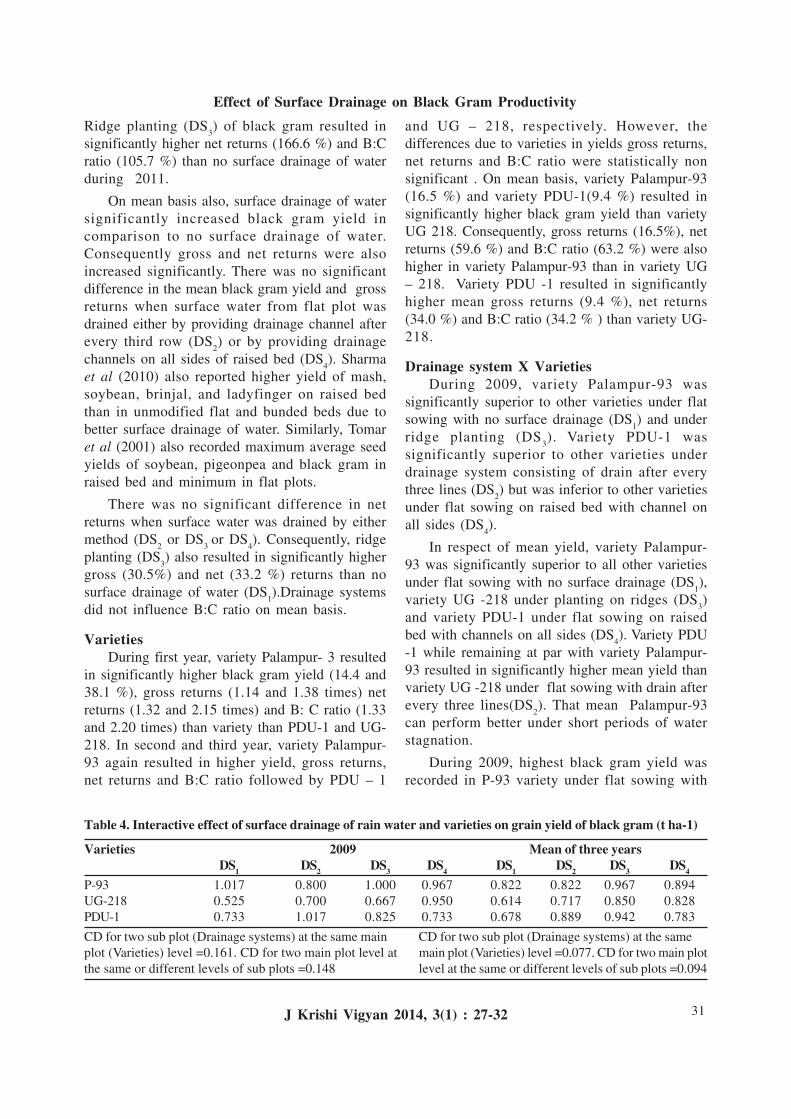
31
Ridge planting (DS3) of black gram resulted in
significantly higher net returns (166.6 %) and B:Cratio (105.7 %) than no surface drainage of waterduring 2011.
On mean basis also, surface drainage of watersignificantly increased black gram yield incomparison to no surface drainage of water.Consequently gross and net returns were alsoincreased significantly. There was no significantdifference in the mean black gram yield and grossreturns when surface water from flat plot wasdrained either by providing drainage channel afterevery third row (DS
2) or by providing drainage
channels on all sides of raised bed (DS4). Sharma
et al (2010) also reported higher yield of mash,soybean, brinjal, and ladyfinger on raised bedthan in unmodified flat and bunded beds due tobetter surface drainage of water. Similarly, Tomaret al (2001) also recorded maximum average seedyields of soybean, pigeonpea and black gram inraised bed and minimum in flat plots.
There was no significant difference in netreturns when surface water was drained by eithermethod (DS
2 or DS
3 or DS
4). Consequently, ridge
planting (DS3) also resulted in significantly higher
gross (30.5%) and net (33.2 %) returns than nosurface drainage of water (DS
1).Drainage systems
did not influence B:C ratio on mean basis.
VarietiesDuring first year, variety Palampur- 3 resulted
in significantly higher black gram yield (14.4 and38.1 %), gross returns (1.14 and 1.38 times) netreturns (1.32 and 2.15 times) and B: C ratio (1.33and 2.20 times) than variety than PDU-1 and UG-218. In second and third year, variety Palampur-93 again resulted in higher yield, gross returns,net returns and B:C ratio followed by PDU – 1
and UG – 218, respectively. However, thedifferences due to varieties in yields gross returns,net returns and B:C ratio were statistically nonsignificant . On mean basis, variety Palampur-93(16.5 %) and variety PDU-1(9.4 %) resulted insignificantly higher black gram yield than varietyUG 218. Consequently, gross returns (16.5%), netreturns (59.6 %) and B:C ratio (63.2 %) were alsohigher in variety Palampur-93 than in variety UG– 218. Variety PDU -1 resulted in significantlyhigher mean gross returns (9.4 %), net returns(34.0 %) and B:C ratio (34.2 % ) than variety UG-218.
Drainage system X VarietiesDuring 2009, variety Palampur-93 was
significantly superior to other varieties under flatsowing with no surface drainage (DS
1) and under
ridge planting (DS3). Variety PDU-1 was
significantly superior to other varieties underdrainage system consisting of drain after everythree lines (DS
2) but was inferior to other varieties
under flat sowing on raised bed with channel onall sides (DS
4).
In respect of mean yield, variety Palampur-93 was significantly superior to all other varietiesunder flat sowing with no surface drainage (DS
1),
variety UG -218 under planting on ridges (DS3)
and variety PDU-1 under flat sowing on raisedbed with channels on all sides (DS
4). Variety PDU
-1 while remaining at par with variety Palampur-93 resulted in significantly higher mean yield thanvariety UG -218 under flat sowing with drain afterevery three lines(DS
2). That mean Palampur-93
can perform better under short periods of waterstagnation.
During 2009, highest black gram yield wasrecorded in P-93 variety under flat sowing with
Table 4. Interactive effect of surface drainage of rain water and varieties on grain yield of black gram (t ha-1)
Varieties 2009 Mean of three yearsDS1 DS2 DS3 DS4 DS1 DS2 DS3 DS4
P-93 1.017 0.800 1.000 0.967 0.822 0.822 0.967 0.894UG-218 0.525 0.700 0.667 0.950 0.614 0.717 0.850 0.828PDU-1 0.733 1.017 0.825 0.733 0.678 0.889 0.942 0.783
CD for two sub plot (Drainage systems) at the same main CD for two sub plot (Drainage systems) at the sameplot (Varieties) level =0.161. CD for two main plot level at main plot (Varieties) level =0.077. CD for two main plotthe same or different levels of sub plots =0.148 level at the same or different levels of sub plots =0.094
J Krishi Vigyan 2014, 3(1) : 27-32
Effect of Surface Drainage on Black Gram Productivity

32
no surface drainage (DS1) which was at par with
black gram yields of the same variety under ridgeplanting (DS
3) and under raised bed with channel
on all sides (DS4). PDU-1 with drain after every
three lines (DS2) also produced similar yield.
Highest mean black gram yield was recorded inP-93 variety under ridge planting (DS
3) which was
at par with black gram yields of the same varietyunder flat sowing on raised bed with channels onall sides (DS
4) and under raised bed with channel
on all sides (DS4) and mash yield of variety PDU-
1 under ridge planting (DS3) and flat sowing with
drain after every three lines (DS2).
Fig 1 Rainfall distribution during growing season ofblack gram
CONCLUSIONFrom the present study it can be concluded
that in high rainfall areas surface drainage of rainwater decreased soil water content and increasedsoil aeration status thereby improve productionpotential of black gram. The higher productivityand returns in black gram can be obtained byplanting Palampur-3 variety on ridges so thatsurface water from heavy rains can be drained.
REFERENCESBlake G R and Hartage K H (1986). Bulk density. In: Klute A
(ed.), Methods of soil analysis, Part 1, Physical andMineralogical Methods. Agron. Monograph 9:363-76.
Grable A R(1966). Soil aeration and plant growth. Adv. Agron18:57-106.
Prihar S S and Sandhu B S (1968). A rapid method for soilmoisture determination. Soil Sci 105: 142-44.
Saroch K and Sandal S (2011). Effect of surface drainage andridge planting on soil aeration and productivity of soybean(Glycine max L) cultivar in wet temperate zone of H.P.Himachal Journal of Agricultural Research 37(2):241-45.
Sharma P K, Kapur O C, Masand S S, Saroch K and Sandal S(2010). Rain-water harvesting. In: Water for hill agriculture-unlocking Potential, Westville Publishing House, New Delhi:pp 32.
Tomar S S, Tembe G P and Sharma S K (2001). Effect of surfacedrainage on the production potential of Pigeon pea in highrainfall vertisol. Journal of Agricultural Physics 1(1):151-55
Yadav A L, Goswami B, Aggarwal P and Arya M (2003). Fewimportant soil management technologies for sustainable cropproduction – A review. Agricultural Reviews 24(3):216-20.
Received on 1/9/2014 Accepted on 15/9/2014
J Krishi Vigyan 2014, 3(1) : 27-32
Saroch and Sandal
33
Food Consumption Pattern and Nutritional HealthStatus of Hill Farm Women
Chanderkanta VatsKrishi Vigyan Kendra, Kullu at Bajaura 175 125 (Himachal Pradesh)
ABSTARCTDiet composition plays an important role in nutritional status of an individual. An ample
and diverse supply of calories, protein, vitamin and minerals is necessary for good nutrition.Balanced diet must include food items from the various food groups in sufficient quantities tomeet the needs of an individual and for maintenance of good health throughout the life. Thepresent study focuses on the health and well-being of farm women from four villages of districtKullu in Himachal Pradesh. The mean daily intake of nutrients was calculated by using theFood Composition Tables and was compared with the Recommended Dietary Allowances foradult women as recommended by Indian Council of Medical Research. The present studyrevealed that diet consumed by the farmwomen of the area was sufficient only in meeting theenergy requirements whereas all other nutrients were deficient in their diet. A majority of thefarm women suffer from iron-deficiency anemia.
Key Words: Food Consumption Pattern, Farm Women, Nutritional Status
INTRODUCTIONWomen play a decisive role in household
and food security. They grow the crop and areprimarily responsible for food preparing, storingand processing etc. They are almost exclusivelyresponsible for the nutrition of their children, fromgeneration through weaning and throughout thecritical periods of growth. In addition they are alsothe principal food producers and prepare for therest of family, yet are often vulnerable than mento malnutrition. Although a woman requires lessdietary energy, however, the requirements ofnutrients are more than her male counterpart dueto her specific body needs and nature of work.Nutrient rich diet is an important among the otherfactors for reducing the risk of sickness andincreasing the life expectancy of the individuals.Quality and quantity of the food taken is the singlemost important determinant of nutritional status.Despite an increase in food production, nutritionalproblems of women continue to be formidable.This issue has been raised in various studies andit is now well accepted that in order to understandthe women’s nutritional status, food consumptionhabits, working capacity, environment andnutritional limitations must be viewed seriously
(Rani, 2001). Neglect of women’s health is clearlylinked with her lower nutrient intake. Malnutritionand other deficiency problems further aggravatemany diseases and reduce her body resistance,which is a cause of high mortality among womenand thus affect women’s access to healthinformation. It is unfortunate that her nutritionalstatus and care issues usually have not emergedseriously in planning the nutritional programs andpolicies. Keeping these points in view, the presentstudy was undertaken with the objective to studythe food consumption pattern, food habits,nutritional and health status of hill farm women.
MATERIALS AND METHODSThe data were collected through interview
method from the two development blocks of Kulludistrict of Himachal Pradesh. Two villages fromeach block and 25 women from each village wererandomly selected. The food consumed by thesubject was determined by using 24 hr recallmethod. Availability of the nutrients from theactual intake of food was calculated by usingstandard nutritive values and RDA of ICMR(Begum, 1997). The results were presented intabular form using average and percentage.
*Corresponding Author’s Email: [email protected]
J Krishi Vigyan 2014, 3(1) : 33-36 DOI: 10.5958/2349-4433.2014.01245.8
J Krishi Vigyan 2014, 3(1) : 33-36
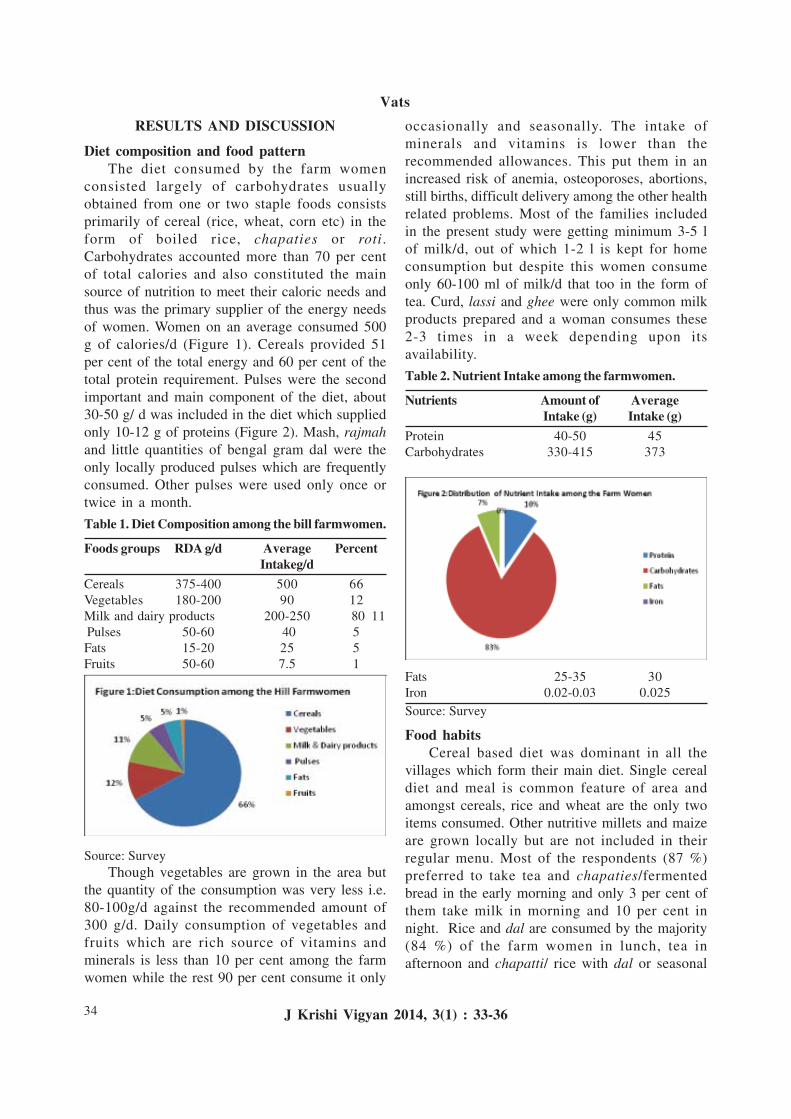
34
RESULTS AND DISCUSSION
Diet composition and food patternThe diet consumed by the farm women
consisted largely of carbohydrates usuallyobtained from one or two staple foods consistsprimarily of cereal (rice, wheat, corn etc) in theform of boiled rice, chapaties or roti.Carbohydrates accounted more than 70 per centof total calories and also constituted the mainsource of nutrition to meet their caloric needs andthus was the primary supplier of the energy needsof women. Women on an average consumed 500g of calories/d (Figure 1). Cereals provided 51per cent of the total energy and 60 per cent of thetotal protein requirement. Pulses were the secondimportant and main component of the diet, about30-50 g/ d was included in the diet which suppliedonly 10-12 g of proteins (Figure 2). Mash, rajmahand little quantities of bengal gram dal were theonly locally produced pulses which are frequentlyconsumed. Other pulses were used only once ortwice in a month.
Table 1. Diet Composition among the bill farmwomen.
Foods groups RDA g/d Average PercentIntakeg/d
Cereals 375-400 500 66Vegetables 180-200 90 12Milk and dairy products 200-250 80 11 Pulses 50-60 40 5Fats 15-20 25 5Fruits 50-60 7.5 1
occasionally and seasonally. The intake ofminerals and vitamins is lower than therecommended allowances. This put them in anincreased risk of anemia, osteoporoses, abortions,still births, difficult delivery among the other healthrelated problems. Most of the families includedin the present study were getting minimum 3-5 lof milk/d, out of which 1-2 l is kept for homeconsumption but despite this women consumeonly 60-100 ml of milk/d that too in the form oftea. Curd, lassi and ghee were only common milkproducts prepared and a woman consumes these2-3 times in a week depending upon itsavailability.
Table 2. Nutrient Intake among the farmwomen.
Nutrients Amount of AverageIntake (g) Intake (g)
Protein 40-50 45Carbohydrates 330-415 373
Source: SurveyThough vegetables are grown in the area but
the quantity of the consumption was very less i.e.80-100g/d against the recommended amount of300 g/d. Daily consumption of vegetables andfruits which are rich source of vitamins andminerals is less than 10 per cent among the farmwomen while the rest 90 per cent consume it only
Fats 25-35 30Iron 0.02-0.03 0.025Source: Survey
Food habitsCereal based diet was dominant in all the
villages which form their main diet. Single cerealdiet and meal is common feature of area andamongst cereals, rice and wheat are the only twoitems consumed. Other nutritive millets and maizeare grown locally but are not included in theirregular menu. Most of the respondents (87 %)preferred to take tea and chapaties/fermentedbread in the early morning and only 3 per cent ofthem take milk in morning and 10 per cent innight. Rice and dal are consumed by the majority(84 %) of the farm women in lunch, tea inafternoon and chapatti/ rice with dal or seasonal
J Krishi Vigyan 2014, 3(1) : 33-36
Vats
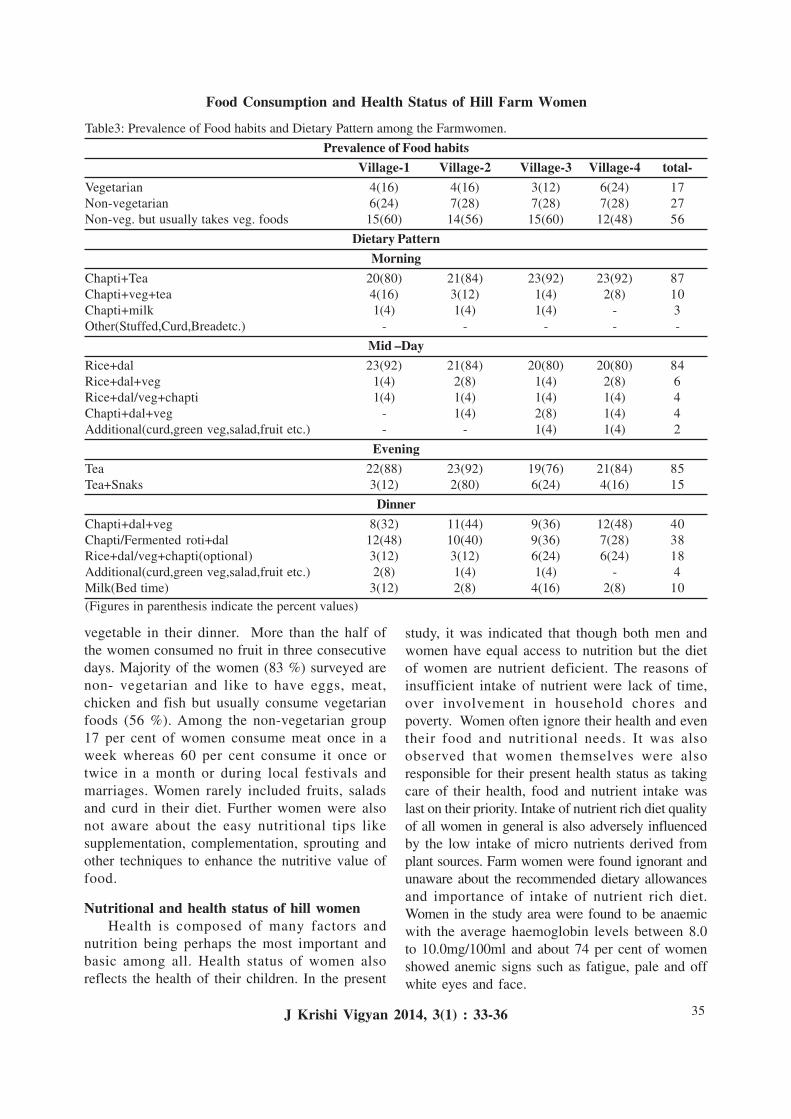
35
vegetable in their dinner. More than the half ofthe women consumed no fruit in three consecutivedays. Majority of the women (83 %) surveyed arenon- vegetarian and like to have eggs, meat,chicken and fish but usually consume vegetarianfoods (56 %). Among the non-vegetarian group17 per cent of women consume meat once in aweek whereas 60 per cent consume it once ortwice in a month or during local festivals andmarriages. Women rarely included fruits, saladsand curd in their diet. Further women were alsonot aware about the easy nutritional tips likesupplementation, complementation, sprouting andother techniques to enhance the nutritive value offood.
Nutritional and health status of hill womenHealth is composed of many factors and
nutrition being perhaps the most important andbasic among all. Health status of women alsoreflects the health of their children. In the present
study, it was indicated that though both men andwomen have equal access to nutrition but the dietof women are nutrient deficient. The reasons ofinsufficient intake of nutrient were lack of time,over involvement in household chores andpoverty. Women often ignore their health and eventheir food and nutritional needs. It was alsoobserved that women themselves were alsoresponsible for their present health status as takingcare of their health, food and nutrient intake waslast on their priority. Intake of nutrient rich diet qualityof all women in general is also adversely influencedby the low intake of micro nutrients derived fromplant sources. Farm women were found ignorant andunaware about the recommended dietary allowancesand importance of intake of nutrient rich diet.Women in the study area were found to be anaemicwith the average haemoglobin levels between 8.0to 10.0mg/100ml and about 74 per cent of womenshowed anemic signs such as fatigue, pale and offwhite eyes and face.
Table3: Prevalence of Food habits and Dietary Pattern among the Farmwomen.
Prevalence of Food habitsVillage-1 Village-2 Village-3 Village-4 total-
Vegetarian 4(16) 4(16) 3(12) 6(24) 17Non-vegetarian 6(24) 7(28) 7(28) 7(28) 27Non-veg. but usually takes veg. foods 15(60) 14(56) 15(60) 12(48) 56
Dietary PatternMorning
Chapti+Tea 20(80) 21(84) 23(92) 23(92) 87Chapti+veg+tea 4(16) 3(12) 1(4) 2(8) 10Chapti+milk 1(4) 1(4) 1(4) - 3Other(Stuffed,Curd,Breadetc.) - - - - -
Mid –DayRice+dal 23(92) 21(84) 20(80) 20(80) 84Rice+dal+veg 1(4) 2(8) 1(4) 2(8) 6Rice+dal/veg+chapti 1(4) 1(4) 1(4) 1(4) 4Chapti+dal+veg - 1(4) 2(8) 1(4) 4Additional(curd,green veg,salad,fruit etc.) - - 1(4) 1(4) 2
EveningTea 22(88) 23(92) 19(76) 21(84) 85Tea+Snaks 3(12) 2(80) 6(24) 4(16) 15
DinnerChapti+dal+veg 8(32) 11(44) 9(36) 12(48) 40Chapti/Fermented roti+dal 12(48) 10(40) 9(36) 7(28) 38Rice+dal/veg+chapti(optional) 3(12) 3(12) 6(24) 6(24) 18Additional(curd,green veg,salad,fruit etc.) 2(8) 1(4) 1(4) - 4Milk(Bed time) 3(12) 2(8) 4(16) 2(8) 10(Figures in parenthesis indicate the percent values)
J Krishi Vigyan 2014, 3(1) : 33-36
Food Consumption and Health Status of Hill Farm Women
36
The study reveals that the diet consumed bythe farmwomen of the area was sufficient only inmeeting the energy requirements whereas all othernutrients were deficient in the diet. Thus, it canbe concluded that the routine diet of farmwomenis imbalance both in quality and quantity. Intakeof protein is marginal while intake of vitamins,minerals and other micronutrients falls far shortthan the recommended levels. This type of dietaryimbalance and deficiency were mainly responsiblefor malnutrition and other deficiency diseasesspecially anemia and reproductive disorders.
CONCLUSIONIt can be inferred from the study that nutritional
knowledge must be imparted to the women folkof the area and it can only be achieved byequipping women through nutrition education,knowledge, skill and awareness by the differentdevelopmental agencies and by tailoring thepolicies and programmes targeted towards womenthat increase their access to nutritional information.
In these training programmes the main emphasisshould be given upon planning, development andpopularization of low cost nutritious balanced dietby including locally available resources, crops,foods and fruits.
The nutritive value of the generally consumedfoods can be enhanced by educating the womenabout the importance of germination,fermentation, fortification and supplementationprocesses which can overall improve the qualityand quantity of the food and diet. Further sincereefforts are required to standardize the post harvesttechnologies and develop the nutritionally richvalue added products.
REFERENCESRani B R ( 2001). Health and nutritional status of rural women- A
comparative study of ICDS and non-ICDS areas of Chittoordisttrict (A.P). Manage Extension Research Review Vol II (1): 157-164.
Begum M R (1997). A Text Book of Foods, Nutrition and Dietetics(Revised & Enlarged Edition), pp 356.
Received on 5/9/2014 Accepted on 15/9/2014
J Krishi Vigyan 2014, 3(1) : 33-36
Vats
37
Indigenous Bamboo-Made Fishing Implements ofAssam
Deepjyoti BaruahLivestock Research Station
Assam Agricultural University, Hekra-791 127( Assam)
ABSTRACTThe rivers Brahmaputra and Barak along with their numerous tributaries and rivulets has beentraditional source of fishing for the people of the state Assam from the time immemorial. Diverserange of traditional and indigenous fishing gears are used to harvest the fishery resources fromthese water bodies. Many of the traditional fishing gears are exclusively made of bambooswhich are still in use today in one form or another contributing to the total fish production andthe economy of the local community. Variation of fish harvesting systems in the region can beattributed due to the topography, diverse terrain, fish habitat, fish behaviour, fish diversity,fisher community and availability of construction materials, cost and skill. Bamboo-made fishinggears were found to be effective for specific kind of fishes and are widely used throughout theseason due to its ease of operation, low cost and availability of raw material and easyconstruction.
Key Words: Indigenous, Fishing Devices, Bamboo, Brahmaputra, Assam.
INTRODUCTIONAquatic resources of inland origin are
harvested from rivers, its tributaries, distributaries,natural lakes, beels, jheels, multipurposereservoirs, community tanks, household ponds,irrigation canals, water logged paddy fields,burrow pits and innumerable ditches by the sidesof rivers, canals, roads and railway tracks(Varghese, 2002). The river Brahmaputra andBarak form the principal drainage of North-EastIndia with its numerous tributaries flowing throughthe different states along with myriads of rivuletsand lentic water bodies. These resources of theinland water areas are still exploited by traditionalor artisanal fishing methods and gears (Joseph andNarayanan, 1965). Since the fishing opportunitiesvary at different areas, both as regards species andthe nature of the fishing ground, and also becauseof variations in weather, currents, otherenvironmental factors and local availability ofmaterials and skills, a variety of different types oftraditional fishing gear have been developed overthe centuries (Baruah et al 2012). The methodsof fishing in the river Brahmaputra are diverse
and the crafts and gears used are mostlyindigenous (Jhingran, 1991). An attempt has beenmade in this paper to identify and classify someof the indigenous gears exclusively made ofbamboos which are readily available, cheaper andeasy to prepare.
MATERIALS AND METHODSA study was carried out to investigate on the
bamboo-made fishing gears and methods in therivers and tributaries of river Brahmaputra andriver Barak and major wetlands (beels) at differentlocations of the districts of Assam. Informationon types of gears in use, method of operation,time and season of operation, areas of operation,and their probable fish catch were collected at thefishing sites, fish landing centers, fish markets,fishing villages through personal interview of thefishers, lessees, mohaldars, middleman etc.
RESULTS AND DISCUSSIONDiverse kinds of fishing devices were found
to be made other than textiles by the local andmigrant fishermen in the entire length of the river
*Corresponding Author’s Email: [email protected]
J Krishi Vigyan 2014, 3(1) : 37-41 DOI: 10.5958/2349-4433.2014.01246.X
J Krishi Vigyan 2014, 3(1) : 37-41
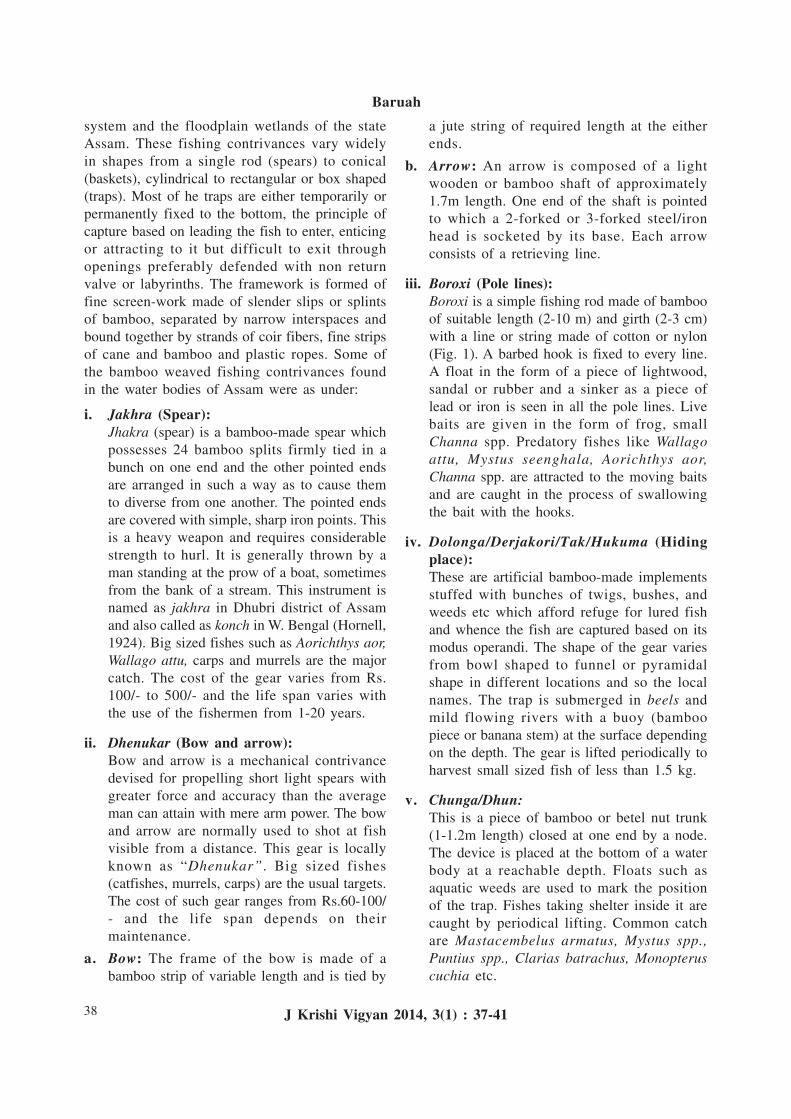
38
system and the floodplain wetlands of the stateAssam. These fishing contrivances vary widelyin shapes from a single rod (spears) to conical(baskets), cylindrical to rectangular or box shaped(traps). Most of he traps are either temporarily orpermanently fixed to the bottom, the principle ofcapture based on leading the fish to enter, enticingor attracting to it but difficult to exit throughopenings preferably defended with non returnvalve or labyrinths. The framework is formed offine screen-work made of slender slips or splintsof bamboo, separated by narrow interspaces andbound together by strands of coir fibers, fine stripsof cane and bamboo and plastic ropes. Some ofthe bamboo weaved fishing contrivances foundin the water bodies of Assam were as under:
i. Jakhra (Spear):Jhakra (spear) is a bamboo-made spear whichpossesses 24 bamboo splits firmly tied in abunch on one end and the other pointed endsare arranged in such a way as to cause themto diverse from one another. The pointed endsare covered with simple, sharp iron points. Thisis a heavy weapon and requires considerablestrength to hurl. It is generally thrown by aman standing at the prow of a boat, sometimesfrom the bank of a stream. This instrument isnamed as jakhra in Dhubri district of Assamand also called as konch in W. Bengal (Hornell,1924). Big sized fishes such as Aorichthys aor,Wallago attu, carps and murrels are the majorcatch. The cost of the gear varies from Rs.100/- to 500/- and the life span varies withthe use of the fishermen from 1-20 years.
ii. Dhenukar (Bow and arrow):Bow and arrow is a mechanical contrivancedevised for propelling short light spears withgreater force and accuracy than the averageman can attain with mere arm power. The bowand arrow are normally used to shot at fishvisible from a distance. This gear is locallyknown as “Dhenukar”. Big sized fishes(catfishes, murrels, carps) are the usual targets.The cost of such gear ranges from Rs.60-100/- and the life span depends on theirmaintenance.
a. Bow: The frame of the bow is made of abamboo strip of variable length and is tied by
a jute string of required length at the eitherends.
b. Arrow: An arrow is composed of a lightwooden or bamboo shaft of approximately1.7m length. One end of the shaft is pointedto which a 2-forked or 3-forked steel/ironhead is socketed by its base. Each arrowconsists of a retrieving line.
iii. Boroxi (Pole lines):Boroxi is a simple fishing rod made of bambooof suitable length (2-10 m) and girth (2-3 cm)with a line or string made of cotton or nylon(Fig. 1). A barbed hook is fixed to every line.A float in the form of a piece of lightwood,sandal or rubber and a sinker as a piece oflead or iron is seen in all the pole lines. Livebaits are given in the form of frog, smallChanna spp. Predatory fishes like Wallagoattu, Mystus seenghala, Aorichthys aor,Channa spp. are attracted to the moving baitsand are caught in the process of swallowingthe bait with the hooks.
iv. Dolonga/Derjakori/Tak/Hukuma (Hidingplace):These are artificial bamboo-made implementsstuffed with bunches of twigs, bushes, andweeds etc which afford refuge for lured fishand whence the fish are captured based on itsmodus operandi. The shape of the gear variesfrom bowl shaped to funnel or pyramidalshape in different locations and so the localnames. The trap is submerged in beels andmild flowing rivers with a buoy (bamboopiece or banana stem) at the surface dependingon the depth. The gear is lifted periodically toharvest small sized fish of less than 1.5 kg.
v. Chunga/Dhun:This is a piece of bamboo or betel nut trunk(1-1.2m length) closed at one end by a node.The device is placed at the bottom of a waterbody at a reachable depth. Floats such asaquatic weeds are used to mark the positionof the trap. Fishes taking shelter inside it arecaught by periodical lifting. Common catchare Mastacembelus armatus, Mystus spp.,Puntius spp., Clarias batrachus, Monopteruscuchia etc.
J Krishi Vigyan 2014, 3(1) : 37-41
Baruah
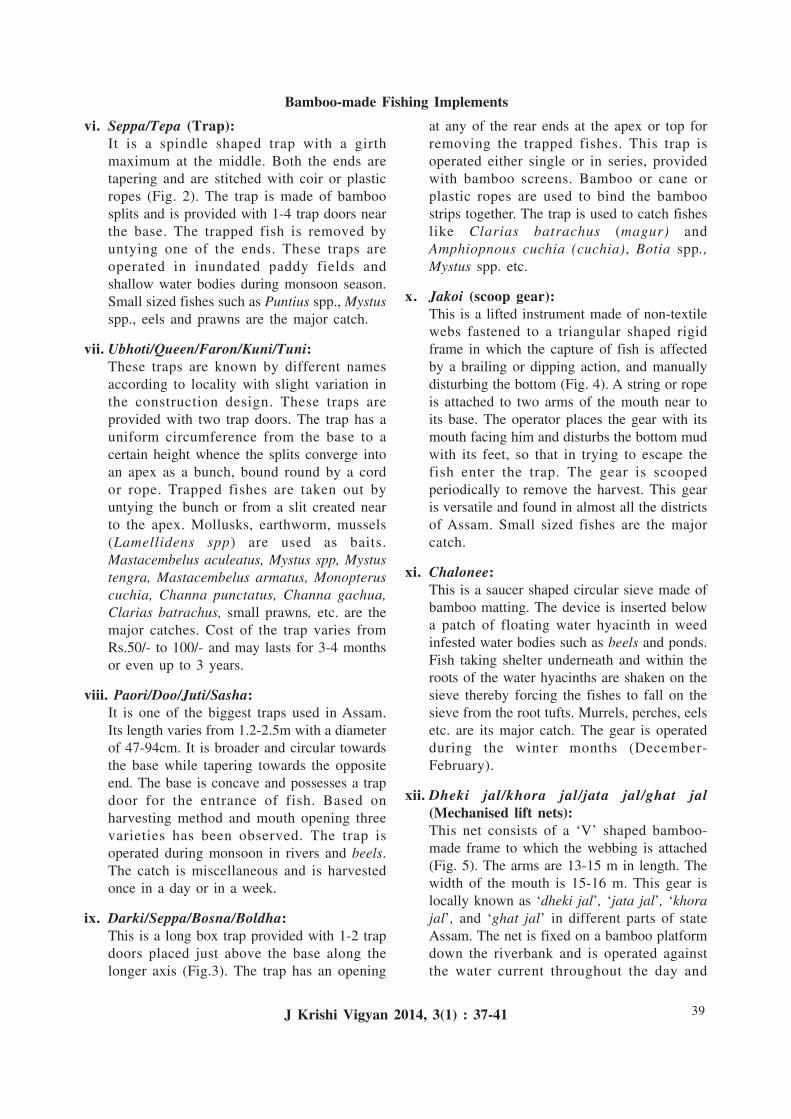
39
vi. Seppa/Tepa (Trap):It is a spindle shaped trap with a girthmaximum at the middle. Both the ends aretapering and are stitched with coir or plasticropes (Fig. 2). The trap is made of bamboosplits and is provided with 1-4 trap doors nearthe base. The trapped fish is removed byuntying one of the ends. These traps areoperated in inundated paddy fields andshallow water bodies during monsoon season.Small sized fishes such as Puntius spp., Mystusspp., eels and prawns are the major catch.
vii. Ubhoti/Queen/Faron/Kuni/Tuni:These traps are known by different namesaccording to locality with slight variation inthe construction design. These traps areprovided with two trap doors. The trap has auniform circumference from the base to acertain height whence the splits converge intoan apex as a bunch, bound round by a cordor rope. Trapped fishes are taken out byuntying the bunch or from a slit created nearto the apex. Mollusks, earthworm, mussels(Lamellidens spp) are used as baits.Mastacembelus aculeatus, Mystus spp, Mystustengra, Mastacembelus armatus, Monopteruscuchia, Channa punctatus, Channa gachua,Clarias batrachus, small prawns, etc. are themajor catches. Cost of the trap varies fromRs.50/- to 100/- and may lasts for 3-4 monthsor even up to 3 years.
viii. Paori/Doo/Juti/Sasha:It is one of the biggest traps used in Assam.Its length varies from 1.2-2.5m with a diameterof 47-94cm. It is broader and circular towardsthe base while tapering towards the oppositeend. The base is concave and possesses a trapdoor for the entrance of fish. Based onharvesting method and mouth opening threevarieties has been observed. The trap isoperated during monsoon in rivers and beels.The catch is miscellaneous and is harvestedonce in a day or in a week.
ix. Darki/Seppa/Bosna/Boldha:This is a long box trap provided with 1-2 trapdoors placed just above the base along thelonger axis (Fig.3). The trap has an opening
at any of the rear ends at the apex or top forremoving the trapped fishes. This trap isoperated either single or in series, providedwith bamboo screens. Bamboo or cane orplastic ropes are used to bind the bamboostrips together. The trap is used to catch fisheslike Clarias batrachus (magur) andAmphiopnous cuchia (cuchia), Botia spp.,Mystus spp. etc.
x. Jakoi (scoop gear):This is a lifted instrument made of non-textilewebs fastened to a triangular shaped rigidframe in which the capture of fish is affectedby a brailing or dipping action, and manuallydisturbing the bottom (Fig. 4). A string or ropeis attached to two arms of the mouth near toits base. The operator places the gear with itsmouth facing him and disturbs the bottom mudwith its feet, so that in trying to escape thefish enter the trap. The gear is scoopedperiodically to remove the harvest. This gearis versatile and found in almost all the districtsof Assam. Small sized fishes are the majorcatch.
xi. Chalonee:This is a saucer shaped circular sieve made ofbamboo matting. The device is inserted belowa patch of floating water hyacinth in weedinfested water bodies such as beels and ponds.Fish taking shelter underneath and within theroots of the water hyacinths are shaken on thesieve thereby forcing the fishes to fall on thesieve from the root tufts. Murrels, perches, eelsetc. are its major catch. The gear is operatedduring the winter months (December-February).
xii. Dheki jal/khora jal/jata jal/ghat jal(Mechanised lift nets):This net consists of a ‘V’ shaped bamboo-made frame to which the webbing is attached(Fig. 5). The arms are 13-15 m in length. Thewidth of the mouth is 15-16 m. This gear islocally known as ‘dheki jal’, ‘jata jal’, ‘khorajal’, and ‘ghat jal’ in different parts of stateAssam. The net is fixed on a bamboo platformdown the riverbank and is operated againstthe water current throughout the day and
Bamboo-made Fishing Implements
J Krishi Vigyan 2014, 3(1) : 37-41
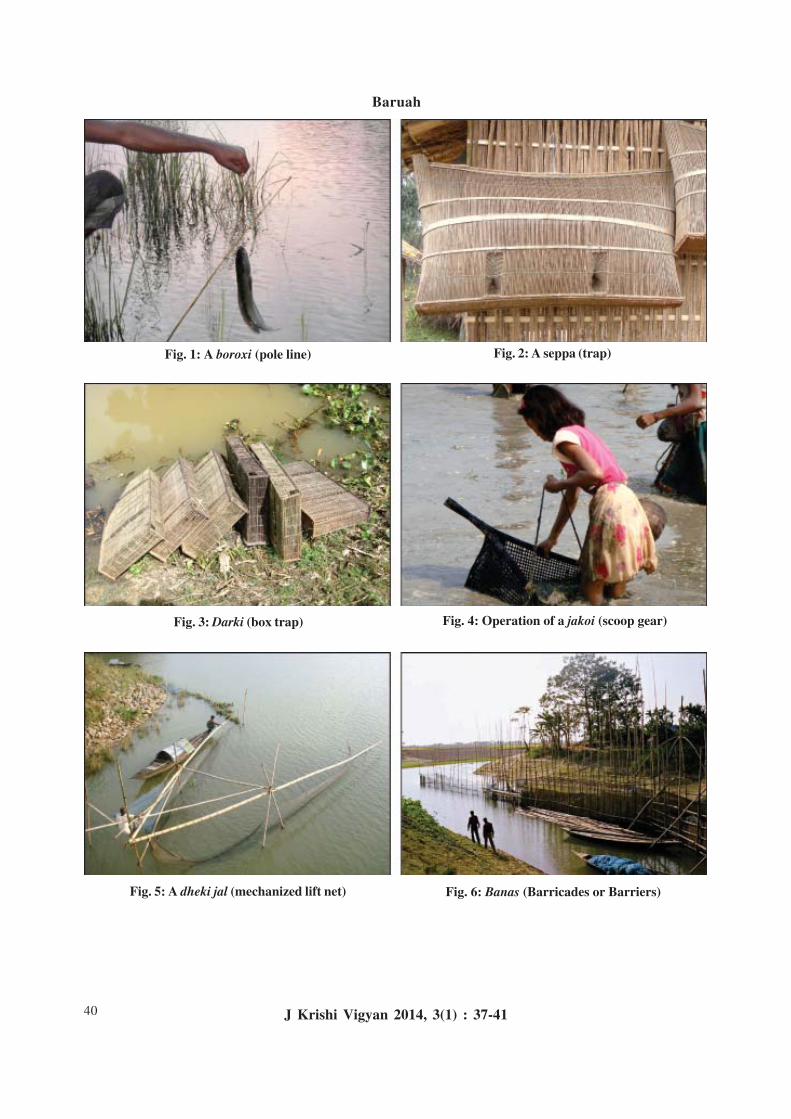
40
Fig. 1: A boroxi (pole line) Fig. 2: A seppa (trap)
Fig. 3: Darki (box trap) Fig. 4: Operation of a jakoi (scoop gear)
Fig. 5: A dheki jal (mechanized lift net) Fig. 6: Banas (Barricades or Barriers)
Baruah
J Krishi Vigyan 2014, 3(1) : 37-41
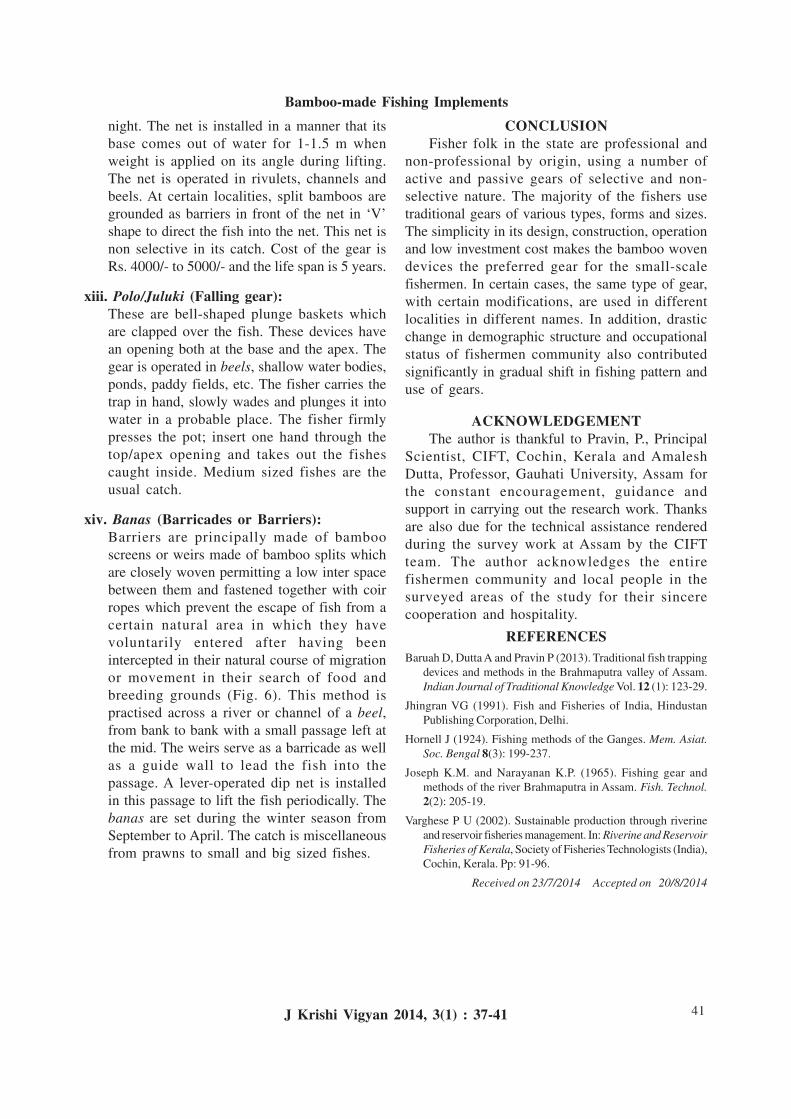
41
night. The net is installed in a manner that itsbase comes out of water for 1-1.5 m whenweight is applied on its angle during lifting.The net is operated in rivulets, channels andbeels. At certain localities, split bamboos aregrounded as barriers in front of the net in ‘V’shape to direct the fish into the net. This net isnon selective in its catch. Cost of the gear isRs. 4000/- to 5000/- and the life span is 5 years.
xiii. Polo/Juluki (Falling gear):These are bell-shaped plunge baskets whichare clapped over the fish. These devices havean opening both at the base and the apex. Thegear is operated in beels, shallow water bodies,ponds, paddy fields, etc. The fisher carries thetrap in hand, slowly wades and plunges it intowater in a probable place. The fisher firmlypresses the pot; insert one hand through thetop/apex opening and takes out the fishescaught inside. Medium sized fishes are theusual catch.
xiv. Banas (Barricades or Barriers):Barriers are principally made of bambooscreens or weirs made of bamboo splits whichare closely woven permitting a low inter spacebetween them and fastened together with coirropes which prevent the escape of fish from acertain natural area in which they havevoluntarily entered after having beenintercepted in their natural course of migrationor movement in their search of food andbreeding grounds (Fig. 6). This method ispractised across a river or channel of a beel,from bank to bank with a small passage left atthe mid. The weirs serve as a barricade as wellas a guide wall to lead the fish into thepassage. A lever-operated dip net is installedin this passage to lift the fish periodically. Thebanas are set during the winter season fromSeptember to April. The catch is miscellaneousfrom prawns to small and big sized fishes.
CONCLUSIONFisher folk in the state are professional and
non-professional by origin, using a number ofactive and passive gears of selective and non-selective nature. The majority of the fishers usetraditional gears of various types, forms and sizes.The simplicity in its design, construction, operationand low investment cost makes the bamboo wovendevices the preferred gear for the small-scalefishermen. In certain cases, the same type of gear,with certain modifications, are used in differentlocalities in different names. In addition, drasticchange in demographic structure and occupationalstatus of fishermen community also contributedsignificantly in gradual shift in fishing pattern anduse of gears.
ACKNOWLEDGEMENTThe author is thankful to Pravin, P., Principal
Scientist, CIFT, Cochin, Kerala and AmaleshDutta, Professor, Gauhati University, Assam forthe constant encouragement, guidance andsupport in carrying out the research work. Thanksare also due for the technical assistance renderedduring the survey work at Assam by the CIFTteam. The author acknowledges the entirefishermen community and local people in thesurveyed areas of the study for their sincerecooperation and hospitality.
REFERENCESBaruah D, Dutta A and Pravin P (2013). Traditional fish trapping
devices and methods in the Brahmaputra valley of Assam.Indian Journal of Traditional Knowledge Vol. 12 (1): 123-29.
Jhingran VG (1991). Fish and Fisheries of India, HindustanPublishing Corporation, Delhi.
Hornell J (1924). Fishing methods of the Ganges. Mem. Asiat.Soc. Bengal 8(3): 199-237.
Joseph K.M. and Narayanan K.P. (1965). Fishing gear andmethods of the river Brahmaputra in Assam. Fish. Technol.2(2): 205-19.
Varghese P U (2002). Sustainable production through riverineand reservoir fisheries management. In: Riverine and ReservoirFisheries of Kerala, Society of Fisheries Technologists (India),Cochin, Kerala. Pp: 91-96.
Received on 23/7/2014 Accepted on 20/8/2014
Bamboo-made Fishing Implements
J Krishi Vigyan 2014, 3(1) : 37-41
42
Knowledge and Attitude of Farmers towardsVermicompost Technology
Pradeep PagariaKrishi Vigyan Kendra, Danta - Barmer 344001 (Rajasthan)
ABSTRACTA study was conducted with 150 randomly selected farmers in Barmer Panchayat Samiti areaof Barmer district. The study revealed that the majority of the farmers (84 %) were havingmoderate level of knowledge and favourable attitude about advantages of vermicomposttechnology. The major constraints noticed were the non availability of worms in nearby market,lack of knowledge about preparation of vermicompost and high temperature during summerseason. Removing these constraints need organized efforts from all the stakeholder’s namelyfarmers, government (local administration and research institution) and non governmentorganizations.
Key Words: Adoption, Attitude, Constraints , Vermicompost .
INTRODUCTIONThe agricultural production depends on the
availability and use of quality and quantity of farminputs. The chemical fertilizer is supposed to bean essential input for boosting up agricultureproduction. It had played significant role inincreasing food production in the country.However, the continuous use of chemicalfertilizers had deteriorated the soil fertility, soilmicrobial activity and disturbed environmentalbalance.
Vermicompost is the potential alternative tochemical fertilizer because of significant changein crop production system, reasonable cost andenvironmental soundness. It is helpful forproliferation and survival of beneficial micro-organisms in the soil. Vermicompost technologyis affordable for farmers because of its low costand marketing of its available plant nutrient likenitrogen and phosphours (Pandey and Pandey,1995). For accelerating the use of vermicompost,it is essential to train the farmers, encourage themto use vermi compost in their field for cropproduction. In order to know the existing level ofknowledge about vermicompost and attitude offarmers towards vermicompost technology , itsactual use, constraints faced by the farmers whileusing vermicompost technology in the fields, thepresent study was undertaken.
MATERIALS AND METHODSThe investigation was carried out in Barmer
Panchayat Samiti in Barmer district of westernRajasthan. Krishi Vigyan Kendra, Danta, Barmeris disseminating knowledge about vermicomposttechnology through lectures, demonstrations,exhibitions and its adoption in crop productionsystem at farmers’ level. For this study, a total of150 respondents were selected from five randomlyselected villages of Barmer district. All thesefarmers constituted the sample of respondents forthe study. The survey was undertaken to collectthe data from the selected farmers through face toface interview with the help of an interviewschedule. The data obtained were analyzed formean, percentage and standard error as perstandard procedure (Snedecor and Cochran,1980).
Knowledge level - Total number of knowledgeitems was 12, each of them was scored zero andone for ‘no’ knowledge and ‘complete’knowledge, respectively on the part of therespondents. The knowledge for an individualrespondent was arrived at by using the followingformula;
Knowledge = Score obtained x 100 / 12
Attitude - To measure the level of attitude ofrespondents towards vermicompost technology,
*Corresponding Author’s Email: [email protected]
J Krishi Vigyan 2014, 3(1) : 42-44 DOI: 10.5958/2349-4433.2014.01247.1
J Krishi Vigyan 2014, 3(1) : 42-44
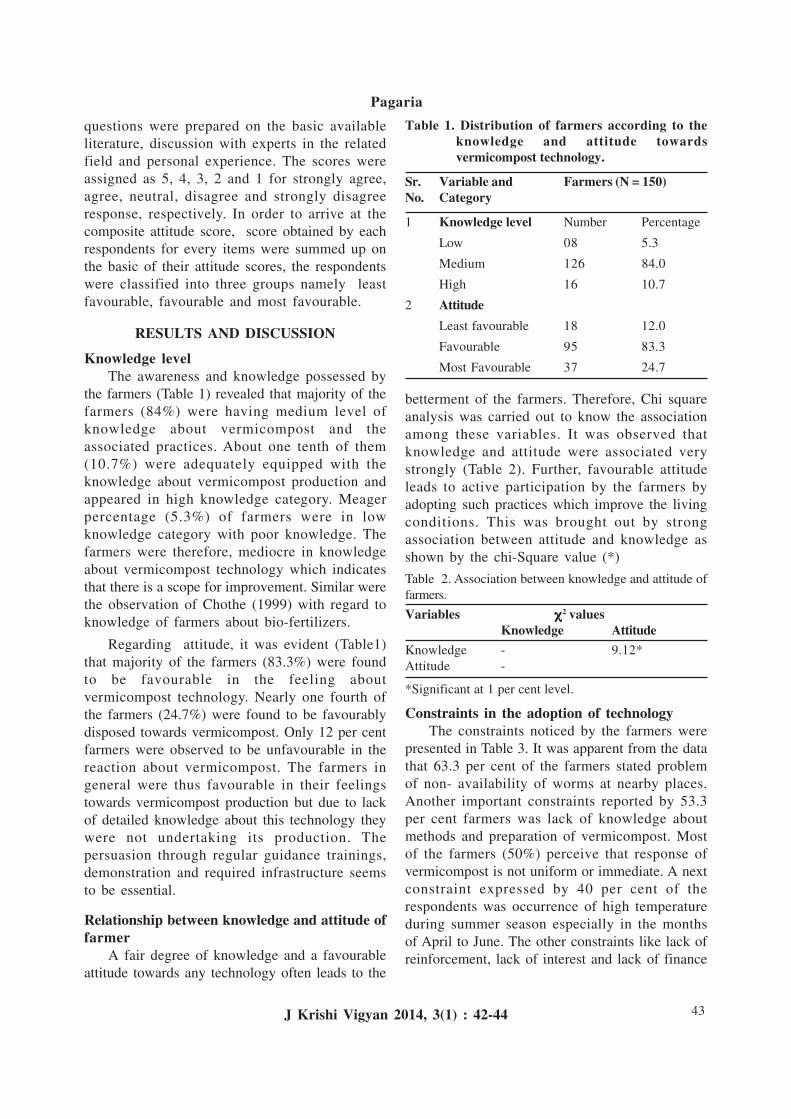
43
questions were prepared on the basic availableliterature, discussion with experts in the relatedfield and personal experience. The scores wereassigned as 5, 4, 3, 2 and 1 for strongly agree,agree, neutral, disagree and strongly disagreeresponse, respectively. In order to arrive at thecomposite attitude score, score obtained by eachrespondents for every items were summed up onthe basic of their attitude scores, the respondentswere classified into three groups namely leastfavourable, favourable and most favourable.
RESULTS AND DISCUSSION
Knowledge levelThe awareness and knowledge possessed by
the farmers (Table 1) revealed that majority of thefarmers (84%) were having medium level ofknowledge about vermicompost and theassociated practices. About one tenth of them(10.7%) were adequately equipped with theknowledge about vermicompost production andappeared in high knowledge category. Meagerpercentage (5.3%) of farmers were in lowknowledge category with poor knowledge. Thefarmers were therefore, mediocre in knowledgeabout vermicompost technology which indicatesthat there is a scope for improvement. Similar werethe observation of Chothe (1999) with regard toknowledge of farmers about bio-fertilizers.
Regarding attitude, it was evident (Table1)that majority of the farmers (83.3%) were foundto be favourable in the feeling aboutvermicompost technology. Nearly one fourth ofthe farmers (24.7%) were found to be favourablydisposed towards vermicompost. Only 12 per centfarmers were observed to be unfavourable in thereaction about vermicompost. The farmers ingeneral were thus favourable in their feelingstowards vermicompost production but due to lackof detailed knowledge about this technology theywere not undertaking its production. Thepersuasion through regular guidance trainings,demonstration and required infrastructure seemsto be essential.
Relationship between knowledge and attitude offarmer
A fair degree of knowledge and a favourableattitude towards any technology often leads to the
betterment of the farmers. Therefore, Chi squareanalysis was carried out to know the associationamong these variables. It was observed thatknowledge and attitude were associated verystrongly (Table 2). Further, favourable attitudeleads to active participation by the farmers byadopting such practices which improve the livingconditions. This was brought out by strongassociation between attitude and knowledge asshown by the chi-Square value (*)
Table 2. Association between knowledge and attitude offarmers.
Variables χχχχχ2 valuesKnowledge Attitude
Knowledge - 9.12*Attitude -
*Significant at 1 per cent level.
Constraints in the adoption of technologyThe constraints noticed by the farmers were
presented in Table 3. It was apparent from the datathat 63.3 per cent of the farmers stated problemof non- availability of worms at nearby places.Another important constraints reported by 53.3per cent farmers was lack of knowledge aboutmethods and preparation of vermicompost. Mostof the farmers (50%) perceive that response ofvermicompost is not uniform or immediate. A nextconstraint expressed by 40 per cent of therespondents was occurrence of high temperatureduring summer season especially in the monthsof April to June. The other constraints like lack ofreinforcement, lack of interest and lack of finance
Table 1. Distribution of farmers according to theknowledge and attitude towardsvermicompost technology.
Sr. Variable and Farmers (N = 150)No. Category
1 Knowledge level Number Percentage
Low 08 5.3
Medium 126 84.0
High 16 10.7
2 Attitude
Least favourable 18 12.0
Favourable 95 83.3
Most Favourable 37 24.7
Pagaria
J Krishi Vigyan 2014, 3(1) : 42-44
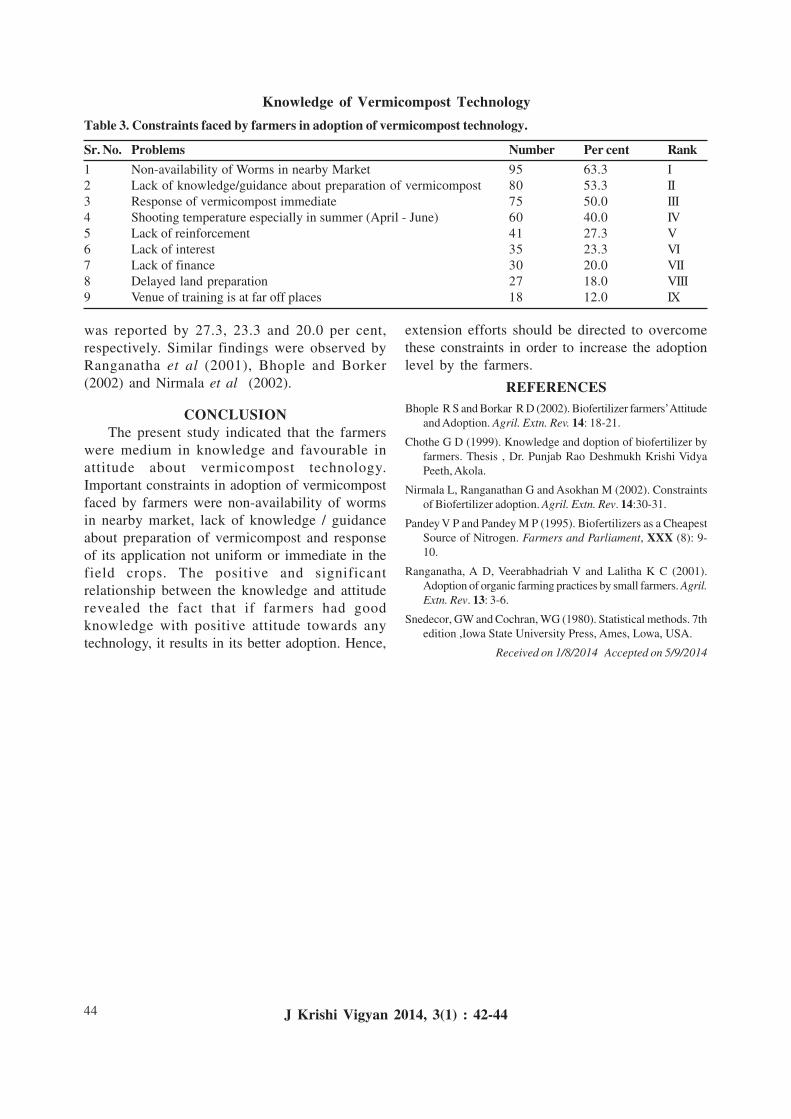
44
was reported by 27.3, 23.3 and 20.0 per cent,respectively. Similar findings were observed byRanganatha et al (2001), Bhople and Borker(2002) and Nirmala et al (2002).
CONCLUSIONThe present study indicated that the farmers
were medium in knowledge and favourable inattitude about vermicompost technology.Important constraints in adoption of vermicompostfaced by farmers were non-availability of wormsin nearby market, lack of knowledge / guidanceabout preparation of vermicompost and responseof its application not uniform or immediate in thefield crops. The positive and significantrelationship between the knowledge and attituderevealed the fact that if farmers had goodknowledge with positive attitude towards anytechnology, it results in its better adoption. Hence,
Table 3. Constraints faced by farmers in adoption of vermicompost technology.
Sr. No. Problems Number Per cent Rank1 Non-availability of Worms in nearby Market 95 63.3 I2 Lack of knowledge/guidance about preparation of vermicompost 80 53.3 II3 Response of vermicompost immediate 75 50.0 III4 Shooting temperature especially in summer (April - June) 60 40.0 IV5 Lack of reinforcement 41 27.3 V6 Lack of interest 35 23.3 VI7 Lack of finance 30 20.0 VII8 Delayed land preparation 27 18.0 VIII9 Venue of training is at far off places 18 12.0 IX
extension efforts should be directed to overcomethese constraints in order to increase the adoptionlevel by the farmers.
REFERENCESBhople R S and Borkar R D (2002). Biofertilizer farmers’ Attitude
and Adoption. Agril. Extn. Rev. 14: 18-21.
Chothe G D (1999). Knowledge and doption of biofertilizer byfarmers. Thesis , Dr. Punjab Rao Deshmukh Krishi VidyaPeeth, Akola.
Nirmala L, Ranganathan G and Asokhan M (2002). Constraintsof Biofertilizer adoption. Agril. Extn. Rev. 14:30-31.
Pandey V P and Pandey M P (1995). Biofertilizers as a CheapestSource of Nitrogen. Farmers and Parliament, XXX (8): 9-10.
Ranganatha, A D, Veerabhadriah V and Lalitha K C (2001).Adoption of organic farming practices by small farmers. Agril.Extn. Rev. 13: 3-6.
Snedecor, GW and Cochran, WG (1980). Statistical methods. 7thedition ,Iowa State University Press, Ames, Lowa, USA.
Received on 1/8/2014 Accepted on 5/9/2014
Knowledge of Vermicompost Technology
J Krishi Vigyan 2014, 3(1) : 42-44
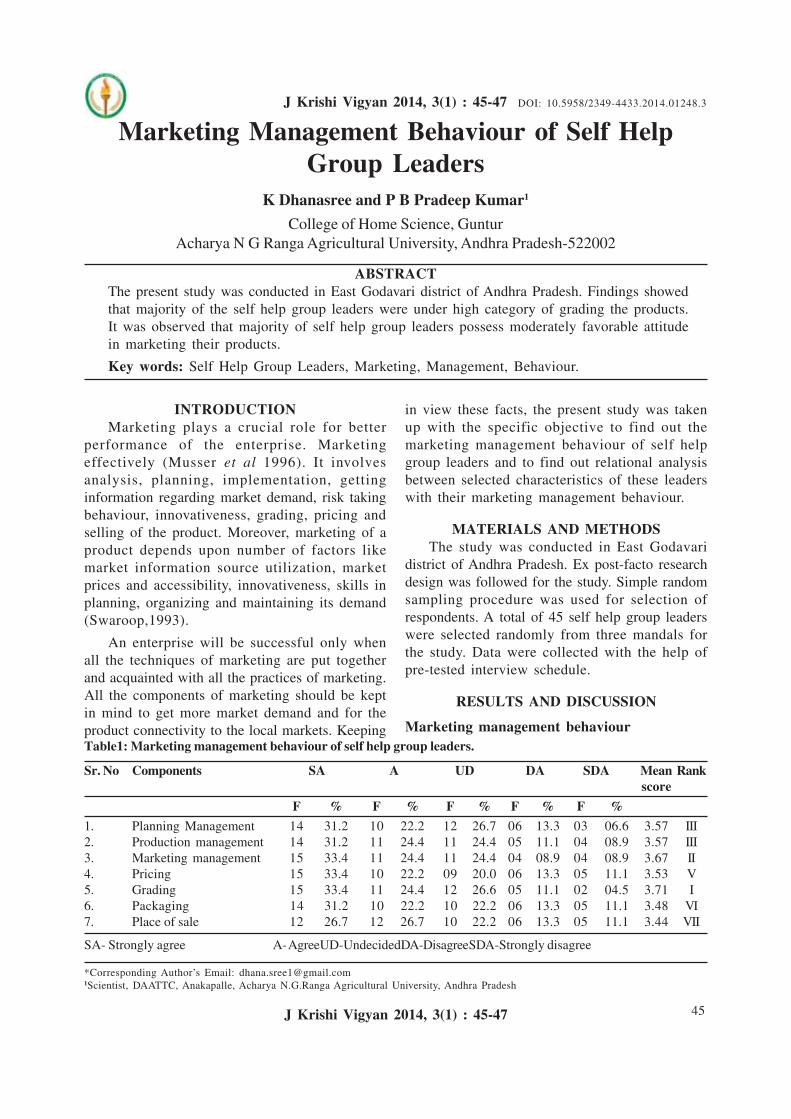
45
Marketing Management Behaviour of Self HelpGroup Leaders
K Dhanasree and P B Pradeep Kumar1
College of Home Science, GunturAcharya N G Ranga Agricultural University, Andhra Pradesh-522002
ABSTRACTThe present study was conducted in East Godavari district of Andhra Pradesh. Findings showedthat majority of the self help group leaders were under high category of grading the products.It was observed that majority of self help group leaders possess moderately favorable attitudein marketing their products.
Key words: Self Help Group Leaders, Marketing, Management, Behaviour.
INTRODUCTIONMarketing plays a crucial role for better
performance of the enterprise. Marketingeffectively (Musser et al 1996). It involvesanalysis, planning, implementation, gettinginformation regarding market demand, risk takingbehaviour, innovativeness, grading, pricing andselling of the product. Moreover, marketing of aproduct depends upon number of factors likemarket information source utilization, marketprices and accessibility, innovativeness, skills inplanning, organizing and maintaining its demand(Swaroop,1993).
An enterprise will be successful only whenall the techniques of marketing are put togetherand acquainted with all the practices of marketing.All the components of marketing should be keptin mind to get more market demand and for theproduct connectivity to the local markets. Keeping
in view these facts, the present study was takenup with the specific objective to find out themarketing management behaviour of self helpgroup leaders and to find out relational analysisbetween selected characteristics of these leaderswith their marketing management behaviour.
MATERIALS AND METHODSThe study was conducted in East Godavari
district of Andhra Pradesh. Ex post-facto researchdesign was followed for the study. Simple randomsampling procedure was used for selection ofrespondents. A total of 45 self help group leaderswere selected randomly from three mandals forthe study. Data were collected with the help ofpre-tested interview schedule.
RESULTS AND DISCUSSION
Marketing management behaviourTable1: Marketing management behaviour of self help group leaders.
Sr. No Components SA A UD DA SDA Mean Rankscore
F % F % F % F % F %1. Planning Management 14 31.2 10 22.2 12 26.7 06 13.3 03 06.6 3.57 III2. Production management 14 31.2 11 24.4 11 24.4 05 11.1 04 08.9 3.57 III3. Marketing management 15 33.4 11 24.4 11 24.4 04 08.9 04 08.9 3.67 II4. Pricing 15 33.4 10 22.2 09 20.0 06 13.3 05 11.1 3.53 V5. Grading 15 33.4 11 24.4 12 26.6 05 11.1 02 04.5 3.71 I6. Packaging 14 31.2 10 22.2 10 22.2 06 13.3 05 11.1 3.48 VI7. Place of sale 12 26.7 12 26.7 10 22.2 06 13.3 05 11.1 3.44 VII
SA- Strongly agree A- AgreeUD-UndecidedDA-DisagreeSDA-Strongly disagree
*Corresponding Author’s Email: [email protected], DAATTC, Anakapalle, Acharya N.G.Ranga Agricultural University, Andhra Pradesh
J Krishi Vigyan 2014, 3(1) : 45-47 DOI: 10.5958/2349-4433.2014.01248.3
J Krishi Vigyan 2014, 3(1) : 45-47
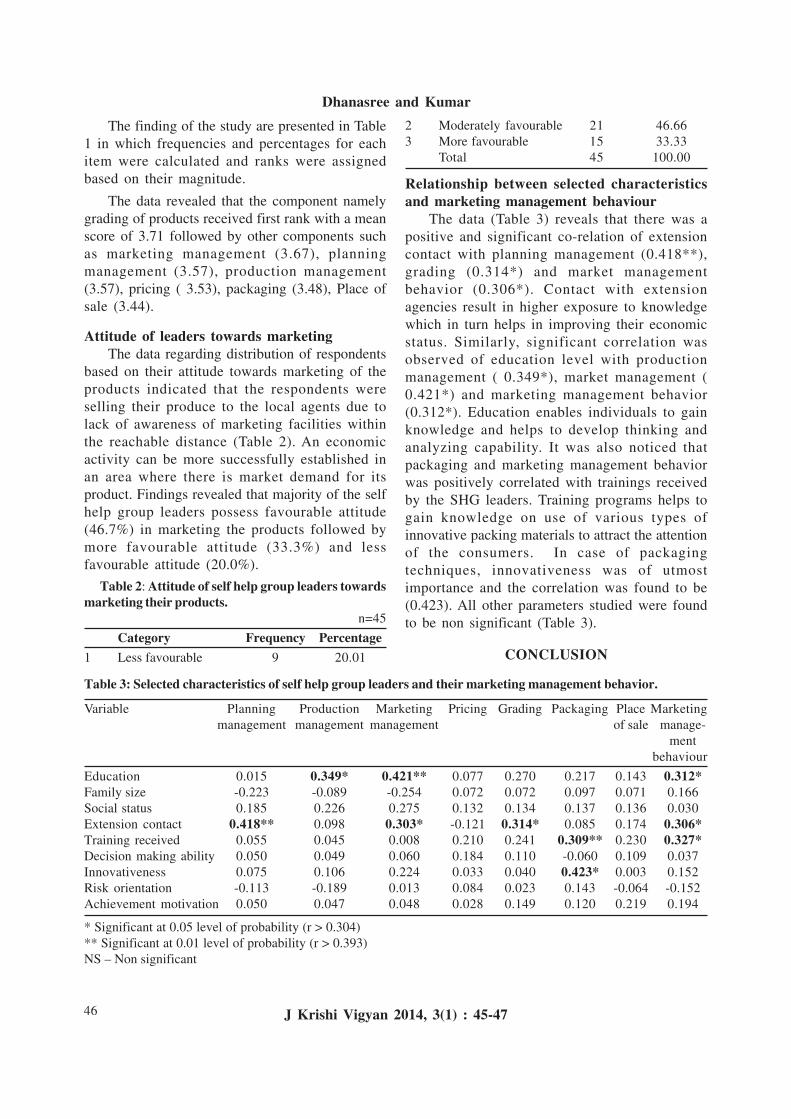
46
The finding of the study are presented in Table1 in which frequencies and percentages for eachitem were calculated and ranks were assignedbased on their magnitude.
The data revealed that the component namelygrading of products received first rank with a meanscore of 3.71 followed by other components suchas marketing management (3.67), planningmanagement (3.57), production management(3.57), pricing ( 3.53), packaging (3.48), Place ofsale (3.44).
Attitude of leaders towards marketingThe data regarding distribution of respondents
based on their attitude towards marketing of theproducts indicated that the respondents wereselling their produce to the local agents due tolack of awareness of marketing facilities withinthe reachable distance (Table 2). An economicactivity can be more successfully established inan area where there is market demand for itsproduct. Findings revealed that majority of the selfhelp group leaders possess favourable attitude(46.7%) in marketing the products followed bymore favourable attitude (33.3%) and lessfavourable attitude (20.0%).
Table 2: Attitude of self help group leaders towardsmarketing their products.
n=45
Category Frequency Percentage1 Less favourable 9 20.01
2 Moderately favourable 21 46.663 More favourable 15 33.33
Total 45 100.00
Relationship between selected characteristicsand marketing management behaviour
The data (Table 3) reveals that there was apositive and significant co-relation of extensioncontact with planning management (0.418**),grading (0.314*) and market managementbehavior (0.306*). Contact with extensionagencies result in higher exposure to knowledgewhich in turn helps in improving their economicstatus. Similarly, significant correlation wasobserved of education level with productionmanagement ( 0.349*), market management (0.421*) and marketing management behavior(0.312*). Education enables individuals to gainknowledge and helps to develop thinking andanalyzing capability. It was also noticed thatpackaging and marketing management behaviorwas positively correlated with trainings receivedby the SHG leaders. Training programs helps togain knowledge on use of various types ofinnovative packing materials to attract the attentionof the consumers. In case of packagingtechniques, innovativeness was of utmostimportance and the correlation was found to be(0.423). All other parameters studied were foundto be non significant (Table 3).
CONCLUSION
Table 3: Selected characteristics of self help group leaders and their marketing management behavior.
Variable Planning Production Marketing Pricing Grading Packaging Place Marketingmanagement management management of sale manage-
mentbehaviour
Education 0.015 0.349* 0.421** 0.077 0.270 0.217 0.143 0.312*Family size -0.223 -0.089 -0.254 0.072 0.072 0.097 0.071 0.166Social status 0.185 0.226 0.275 0.132 0.134 0.137 0.136 0.030Extension contact 0.418** 0.098 0.303* -0.121 0.314* 0.085 0.174 0.306*Training received 0.055 0.045 0.008 0.210 0.241 0.309** 0.230 0.327*Decision making ability 0.050 0.049 0.060 0.184 0.110 -0.060 0.109 0.037Innovativeness 0.075 0.106 0.224 0.033 0.040 0.423* 0.003 0.152Risk orientation -0.113 -0.189 0.013 0.084 0.023 0.143 -0.064 -0.152Achievement motivation 0.050 0.047 0.048 0.028 0.149 0.120 0.219 0.194
* Significant at 0.05 level of probability (r > 0.304)** Significant at 0.01 level of probability (r > 0.393)NS – Non significant
Dhanasree and Kumar
J Krishi Vigyan 2014, 3(1) : 45-47

47
Marketing plays a crucial role both inestablishment as well as better performance of theenterprise. Self help group leaders should betrained in areas like costing, grading, labeling,packaging and quality control of products. Theyshould also be encouraged to participate in thetrade fairs from time to time. An awareness on
connectivity to local market has to be created forbetter marketing of the finished products.
REFERENCESSwaroop B (1993). A study on knowledge and adoption of
sunflower production technology among the farmers ofMahaboobnagar district of Andhra Pradesh. M.Sc(Ag.) Thesis,Andhra Pradesh Agricultural University, Hyderabad.
Received on 19/8/2014 Accepted on 26/8/2014
Management Behaviour of Self Help Group Leaders
J Krishi Vigyan 2014, 3(1) : 45-47
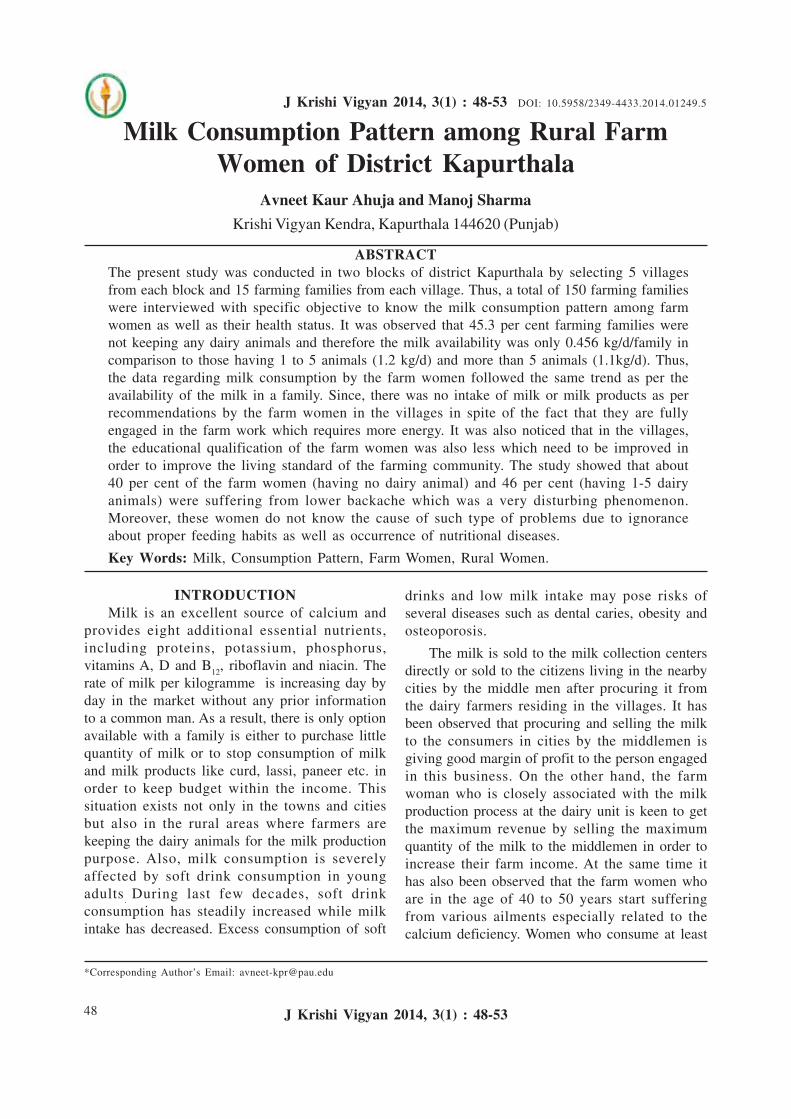
48
Milk Consumption Pattern among Rural FarmWomen of District Kapurthala
Avneet Kaur Ahuja and Manoj SharmaKrishi Vigyan Kendra, Kapurthala 144620 (Punjab)
ABSTRACTThe present study was conducted in two blocks of district Kapurthala by selecting 5 villagesfrom each block and 15 farming families from each village. Thus, a total of 150 farming familieswere interviewed with specific objective to know the milk consumption pattern among farmwomen as well as their health status. It was observed that 45.3 per cent farming families werenot keeping any dairy animals and therefore the milk availability was only 0.456 kg/d/family incomparison to those having 1 to 5 animals (1.2 kg/d) and more than 5 animals (1.1kg/d). Thus,the data regarding milk consumption by the farm women followed the same trend as per theavailability of the milk in a family. Since, there was no intake of milk or milk products as perrecommendations by the farm women in the villages in spite of the fact that they are fullyengaged in the farm work which requires more energy. It was also noticed that in the villages,the educational qualification of the farm women was also less which need to be improved inorder to improve the living standard of the farming community. The study showed that about40 per cent of the farm women (having no dairy animal) and 46 per cent (having 1-5 dairyanimals) were suffering from lower backache which was a very disturbing phenomenon.Moreover, these women do not know the cause of such type of problems due to ignoranceabout proper feeding habits as well as occurrence of nutritional diseases.
Key Words: Milk, Consumption Pattern, Farm Women, Rural Women.
INTRODUCTIONMilk is an excellent source of calcium and
provides eight additional essential nutrients,including proteins, potassium, phosphorus,vitamins A, D and B
12, riboflavin and niacin. The
rate of milk per kilogramme is increasing day byday in the market without any prior informationto a common man. As a result, there is only optionavailable with a family is either to purchase littlequantity of milk or to stop consumption of milkand milk products like curd, lassi, paneer etc. inorder to keep budget within the income. Thissituation exists not only in the towns and citiesbut also in the rural areas where farmers arekeeping the dairy animals for the milk productionpurpose. Also, milk consumption is severelyaffected by soft drink consumption in youngadults
. During last few decades, soft drink
consumption has steadily increased while milkintake has decreased. Excess consumption of soft
drinks and low milk intake may pose risks ofseveral diseases such as dental caries, obesity andosteoporosis.
The milk is sold to the milk collection centersdirectly or sold to the citizens living in the nearbycities by the middle men after procuring it fromthe dairy farmers residing in the villages. It hasbeen observed that procuring and selling the milkto the consumers in cities by the middlemen isgiving good margin of profit to the person engagedin this business. On the other hand, the farmwoman who is closely associated with the milkproduction process at the dairy unit is keen to getthe maximum revenue by selling the maximumquantity of the milk to the middlemen in order toincrease their farm income. At the same time ithas also been observed that the farm women whoare in the age of 40 to 50 years start sufferingfrom various ailments especially related to thecalcium deficiency. Women who consume at least
*Corresponding Author’s Email: [email protected]
J Krishi Vigyan 2014, 3(1) : 48-53 DOI: 10.5958/2349-4433.2014.01249.5
J Krishi Vigyan 2014, 3(1) : 48-53
49
three servings of milk every day may increase theavailability of folic acid in other foods. Folic acidmay help to prevent heart disease and stroke andis especially important for women of childbearingage to reduce the risk of birth defects.
A recent study depicted that 68 per centfemales were consuming milk in some form orother whereas 32 per cent female were notconsuming milk at all. Out of 68 per cent , 51 percent females were consuming milk regularlywhile 17 per cent were consuming milkoccasionally (NIN, 2010). It has also beenreported that women with low milk intake duringchildhood and adolescence have less bone massin adulthood and greater risk of fractures(Heidi et al 2003). Hence, it was thought that thereis need to study the milk consumption pattern anddaily calcium intake from dairy products in therural areas among the farm women and itscorrelation with the prevalence of variousnutritional diseases so that necessary remedialmeasures can be taken up in due course of time.
MATERIALS AND METHODSThis study was conducted in the district
Kapurthala by selecting two blocks namelyKapurthala and Sultanpur. From both the blocks,5 villages namely Sheikhupur, Saidowal,Blairkhanpur, Bhagwanpur, Madhojhanda fromKapurthala block and Sawal, Sukhi Nangal, ThattaNawan, Dariawal, Dolla from Sultanpur wereselected. Fifteen farming families from eachvillage were purposeful selected and farm womenin the age group 30-60 years were interviewedpersonally to get the information through interviewschedule prepared for this purpose. Thus, a totalof 150 farm women were interviewed for thisstudy. The interview schedule was divided intothree parts. The first part contained informationrelated to socio-economic indicators while secondone had milk and milk consumption patternswhereas the third one focused on the questionsregarding health problems, if any. All therespondents were divided into three groupsnamely: families having no dairy animals (Group1), families having 1-5 dairy animals (Group 2),families having >5 dairy animals (Group 3).Collected data was analyzed with the help ofstatistical techniques viz, percentage, arithmetic
mean and standard error. Co-efficient ofcorrelation was calculated between independentvariables and milk intake, calcium intake and perhead availability of milk.
RESULTS AND DISCUSSION
Age and family members of the respondentsThe data (Table 1) showed that majority of
the respondents (49.3%) were in the age group of30 to 40 yr, 40.0 and 4.0 per cent were in between41 to 50 and 51 to 60 yr of age, respectively. Thisindicates that for carrying out dairy farmingpractices, farm women should be physicallyhealthy because various routine practices likefeeding, watering, milking and cleaning of animalsas well as sheds require lot of energy. It wasnoticed that 64.7 per cent families were having 2to 5 members whereas in 35.3 per cent families,number of members varied from 6 to 10. Thisindicates that mostly nuclear family culture systemis prevalent in the district because in these daysevery family member wants liberty andindependence.
Education and Occupation
It was noticed that still 12 per cent farmwomen were illiterate and only 4 per cent weregraduate or above. Majority of the respondents(42.7%) were matric or senior secondary whereas41.3 per cent studied up to primary or middle level.Therefore, it was inferred that there is need toeducate the parents that they must give educationto the girl child too. Likewise, 5.4 per cent farmwomen were in service and about half (53.3 %)were engaged in agricultural operations. Contraryto this, 41.3 per cent were serving as labourer inthe agricultural fields of other farmers. Therefore,it was revealed that the condition of farm womenin the villages was not very good as expected.
Size of dairy herd and milk availabilityIn Kapurthala district, 48.0 per cent farming
families were keeping 1 to 5 dairy animals formilk production purpose (group 2) and only 6.7per cent were possessing more than 5 dairy animalsin comparison (group 3) to 45.3 per cent who werenot keeping animals (group 1). This indicates thatabout 50 per cent population does not see dairy
Ahuja and Sharma
J Krishi Vigyan 2014, 3(1) : 48-53
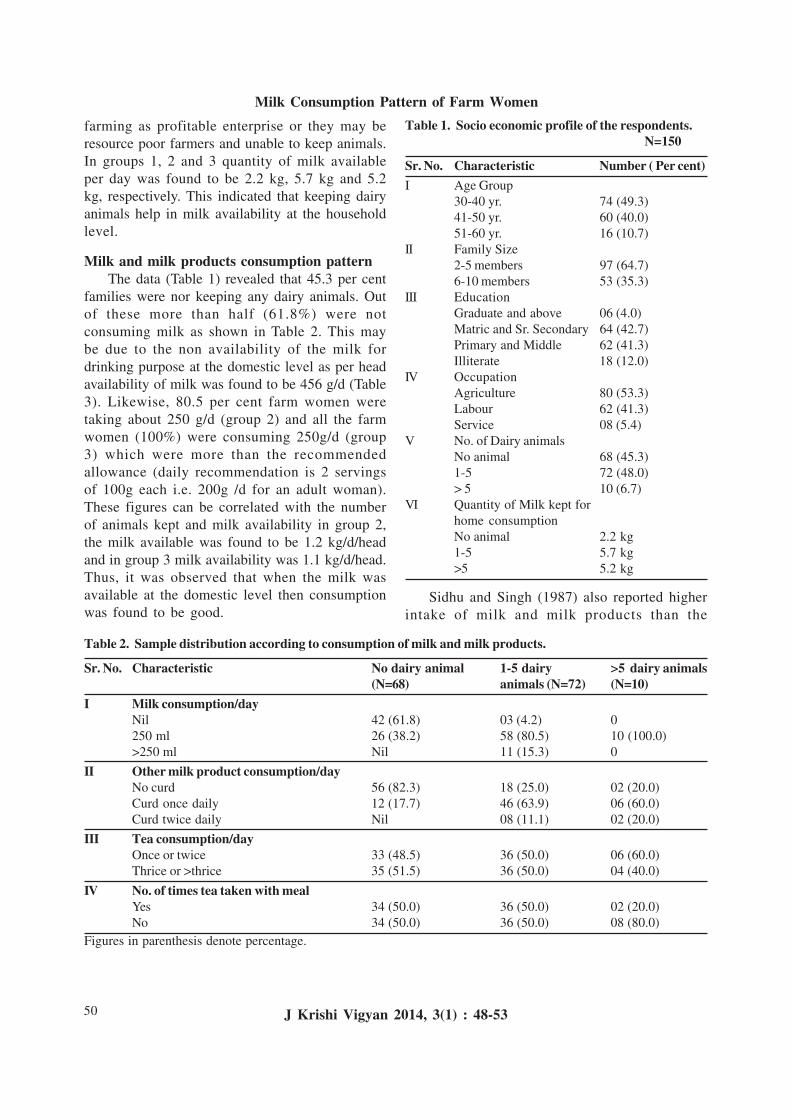
50
farming as profitable enterprise or they may beresource poor farmers and unable to keep animals.In groups 1, 2 and 3 quantity of milk availableper day was found to be 2.2 kg, 5.7 kg and 5.2kg, respectively. This indicated that keeping dairyanimals help in milk availability at the householdlevel.
Milk and milk products consumption patternThe data (Table 1) revealed that 45.3 per cent
families were nor keeping any dairy animals. Outof these more than half (61.8%) were notconsuming milk as shown in Table 2. This maybe due to the non availability of the milk fordrinking purpose at the domestic level as per headavailability of milk was found to be 456 g/d (Table3). Likewise, 80.5 per cent farm women weretaking about 250 g/d (group 2) and all the farmwomen (100%) were consuming 250g/d (group3) which were more than the recommendedallowance (daily recommendation is 2 servingsof 100g each i.e. 200g /d for an adult woman).These figures can be correlated with the numberof animals kept and milk availability in group 2,the milk available was found to be 1.2 kg/d/headand in group 3 milk availability was 1.1 kg/d/head.Thus, it was observed that when the milk wasavailable at the domestic level then consumptionwas found to be good.
Table 1. Socio economic profile of the respondents.N=150
Sr. No. Characteristic Number ( Per cent)I Age Group
30-40 yr. 74 (49.3)41-50 yr. 60 (40.0)51-60 yr. 16 (10.7)
II Family Size2-5 members 97 (64.7)6-10 members 53 (35.3)
III EducationGraduate and above 06 (4.0)Matric and Sr. Secondary 64 (42.7)Primary and Middle 62 (41.3)Illiterate 18 (12.0)
IV OccupationAgriculture 80 (53.3)Labour 62 (41.3)Service 08 (5.4)
V No. of Dairy animalsNo animal 68 (45.3)1-5 72 (48.0)> 5 10 (6.7)
VI Quantity of Milk kept forhome consumptionNo animal 2.2 kg1-5 5.7 kg>5 5.2 kg
Sidhu and Singh (1987) also reported higherintake of milk and milk products than the
Table 2. Sample distribution according to consumption of milk and milk products.
Sr. No. Characteristic No dairy animal 1-5 dairy >5 dairy animals(N=68) animals (N=72) (N=10)
I Milk consumption/dayNil 42 (61.8) 03 (4.2) 0250 ml 26 (38.2) 58 (80.5) 10 (100.0)>250 ml Nil 11 (15.3) 0
II Other milk product consumption/dayNo curd 56 (82.3) 18 (25.0) 02 (20.0)Curd once daily 12 (17.7) 46 (63.9) 06 (60.0)Curd twice daily Nil 08 (11.1) 02 (20.0)
III Tea consumption/dayOnce or twice 33 (48.5) 36 (50.0) 06 (60.0)Thrice or >thrice 35 (51.5) 36 (50.0) 04 (40.0)
IV No. of times tea taken with mealYes 34 (50.0) 36 (50.0) 02 (20.0)No 34 (50.0) 36 (50.0) 08 (80.0)
Figures in parenthesis denote percentage.
Milk Consumption Pattern of Farm Women
J Krishi Vigyan 2014, 3(1) : 48-53

51
recommended allowances. The per capita foodintake of rural Punjabi families showed thatconsumption of milk and milk products in wintersof low income group was 525g, while middleincome group consumed 527g. Similarly, theaverage daily milk and milk productsconsumption was 245ml by rural women ofLudhiana city and was more than ICMR’srecommended intake (Ahuja et al 2000). Theconsumption of milk and milk products and fatsand oils by rural pregnant women of Haryana wassignificantly higher than that of RDI(recommended dietary intake) as reported by Joodet al (2001)
Similarly, the values for milk products viz.curd consumption revealed that 82.3 per cent farmwomen from group 1 were not taking it while one-fourth and one-fifth of farm women from groups2 and 3, respectively were not consuming curd.Similarly, respondents consuming curd once dailywere 17.7, 63.9 and 60.0 per cent from group 1,group 2 and group 3, respectively. This trend wasfound similar to the liquid milk consumption bythe farm women. From the data about teaconsumption per day, it was inferred that the farmwomen were habitual to use milk in the form oftea as consumption was found to be once or twicea day (48.5%) and thrice or more than thrice(51.5%) in case of group 1. Similar trend was
found in farm women of group 2 while in thirdgroup it was 60 and 40 per cent, respectively.
Table 3 showed the mean values for milkconsumption, per head availability of milk andcalcium intake from dairy products. Mean milkconsumption in groups 2 and 3 was almost same(257 and 250 g/d) and more than recommendedby ICMR. Ahuja (1997) has also reported highermean consumption of milk (250-575g). Per headavailability of milk was also same in groups 2 and3 (1.2 and 1.1kg/d, respectively). Calcium intakefrom dairy products was lower thanRecommended Dietary Allowances (600 mg/d foradult woman) in case of group 1 (240.1 mg/d)because their milk intake was very less (96 g/d).The reason might be due to the fact that subjectsin this group did not own milch animals.Respondents from group 2 and 3 consumed 735.2and 748.5 mg of calcium per day which was morethan recommended. Various authors (Mann et al1997 and Ahuja, 1997) have reported higherintake (605-1685 mg) by Punjabi men andwomen.
Health StatusData in (Table 4) showed that only 5.9 per
cent farm women go for walking from group 1whereas 91.2 per cent did not do any exercise.Similarly, 83.4 and 100 per cent farm women from
Table3 milk consumption, per head availability and average calcium intake from dairy products.
(Mean ± S.E.)Parameter No dairy animal 1-5 dairy animals >5 dairy animals
(N=68) (N=72) (N=10)Milk consumption (g/d) 96 ± 14.8 257 ± 19.1 250 ± 0Per head availability of milk (kg/d) 0.456 ± 0.023 1.2 ± 0.09 1.0 ± 0.05Ca intake (mg/d) 240.1± 33.9 735.2± 46.8 748.5 ± 47.1
Table 4. Health Status of the respondents.
Sr.No. Parameter No dairy animal 1-5 dairy animals >5 dairy animals (N=68) (N=72) (N=10)
I Do exerciseYes 04 (5.9) 10 (13.9) 0No 62 (91.2) 60 (83.4) 10 (100.0)Occasionally 02 (2.9) 02 (2.7) 0
II Lower back acheYes 40 (58.8) 46 (63.8) 02 (20.0)No 28 (41.2) 26 (36.2) 08 (80.0)
Figures in parenthesis denote percentage.
Ahuja and Sharma
J Krishi Vigyan 2014, 3(1) : 48-53
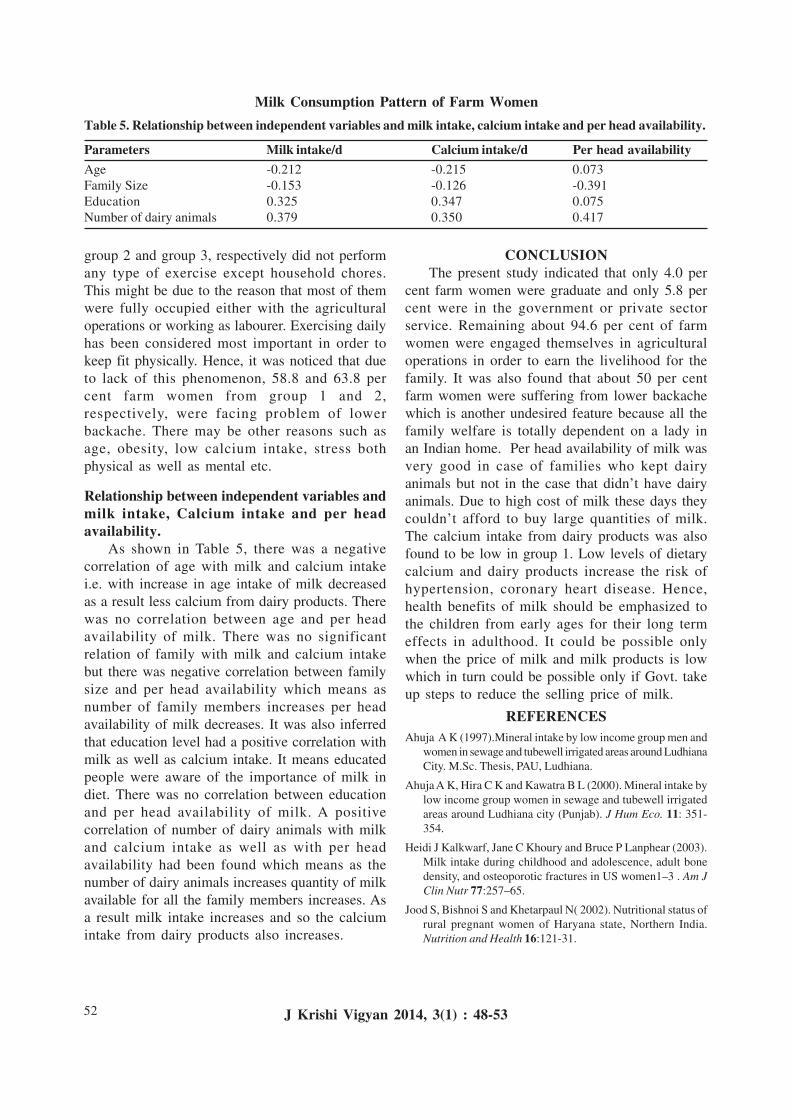
52
group 2 and group 3, respectively did not performany type of exercise except household chores.This might be due to the reason that most of themwere fully occupied either with the agriculturaloperations or working as labourer. Exercising dailyhas been considered most important in order tokeep fit physically. Hence, it was noticed that dueto lack of this phenomenon, 58.8 and 63.8 percent farm women from group 1 and 2,respectively, were facing problem of lowerbackache. There may be other reasons such asage, obesity, low calcium intake, stress bothphysical as well as mental etc.
Relationship between independent variables andmilk intake, Calcium intake and per headavailability.
As shown in Table 5, there was a negativecorrelation of age with milk and calcium intakei.e. with increase in age intake of milk decreasedas a result less calcium from dairy products. Therewas no correlation between age and per headavailability of milk. There was no significantrelation of family with milk and calcium intakebut there was negative correlation between familysize and per head availability which means asnumber of family members increases per headavailability of milk decreases. It was also inferredthat education level had a positive correlation withmilk as well as calcium intake. It means educatedpeople were aware of the importance of milk indiet. There was no correlation between educationand per head availability of milk. A positivecorrelation of number of dairy animals with milkand calcium intake as well as with per headavailability had been found which means as thenumber of dairy animals increases quantity of milkavailable for all the family members increases. Asa result milk intake increases and so the calciumintake from dairy products also increases.
CONCLUSIONThe present study indicated that only 4.0 per
cent farm women were graduate and only 5.8 percent were in the government or private sectorservice. Remaining about 94.6 per cent of farmwomen were engaged themselves in agriculturaloperations in order to earn the livelihood for thefamily. It was also found that about 50 per centfarm women were suffering from lower backachewhich is another undesired feature because all thefamily welfare is totally dependent on a lady inan Indian home. Per head availability of milk wasvery good in case of families who kept dairyanimals but not in the case that didn’t have dairyanimals. Due to high cost of milk these days theycouldn’t afford to buy large quantities of milk.The calcium intake from dairy products was alsofound to be low in group 1. Low levels of dietarycalcium and dairy products increase the risk ofhypertension, coronary heart disease. Hence,health benefits of milk should be emphasized tothe children from early ages for their long termeffects in adulthood. It could be possible onlywhen the price of milk and milk products is lowwhich in turn could be possible only if Govt. takeup steps to reduce the selling price of milk.
REFERENCESAhuja A K (1997).Mineral intake by low income group men and
women in sewage and tubewell irrigated areas around LudhianaCity. M.Sc. Thesis, PAU, Ludhiana.
Ahuja A K, Hira C K and Kawatra B L (2000). Mineral intake bylow income group women in sewage and tubewell irrigatedareas around Ludhiana city (Punjab). J Hum Eco. 11: 351-354.
Heidi J Kalkwarf, Jane C Khoury and Bruce P Lanphear (2003).Milk intake during childhood and adolescence, adult bonedensity, and osteoporotic fractures in US women1–3 . Am JClin Nutr 77:257–65.
Jood S, Bishnoi S and Khetarpaul N( 2002). Nutritional status ofrural pregnant women of Haryana state, Northern India.Nutrition and Health 16:121-31.
Table 5. Relationship between independent variables and milk intake, calcium intake and per head availability.
Parameters Milk intake/d Calcium intake/d Per head availabilityAge -0.212 -0.215 0.073Family Size -0.153 -0.126 -0.391Education 0.325 0.347 0.075Number of dairy animals 0.379 0.350 0.417
Milk Consumption Pattern of Farm Women
J Krishi Vigyan 2014, 3(1) : 48-53
53
Mann S K, Bakhetia P, Kawatra B L, Hira C K and Kaur A(1997). Energy-iron adequacy and work efficiency of ruralPunjabi women. Third Agricultural Science Congress, PAU,Ludhiana, March 12-15.
NIN (2010). Dietary Guidelines for Indians. A Manual. IndianCouncil of Medical Research, Hyderabad, India, pp. 20-21.
Shubhadarshini G Pawar, Pranita Ashok and Joshi A R (2013).Assessment of milk consumption in young females. Indian J.Applied Research 3(8): 536-537
Sidhu H and Singh Z (1987). A study of nutritional status offarmers of Ludhiana district. J Res PAU, Ludhiana 24:180-87.
Received on 18/7/2014 Accepted on 28/8/2014
Ahuja and Sharma
J Krishi Vigyan 2014, 3(1) : 48-53

54
Organic Farming based Farming System and its roletowards Sustainability
M S GillDepartment of Agronomy
Punjab Agricultural University, Ludhiana-141004 (Punjab)
ABSTRACTIn India, 85 per cent total cropping systems are cereal-cereal e.g. rice-wheat (10.5 M ha.), rice- rice (6.0 M ha.), pearl millet - wheat (2.3 M ha), sorghum - wheat (2.3 M ha.), maize - wheat(1.9 M ha.) etc. These systems are very exhaustive in nature and removal of nutrients is muchmore than the replenishment and as result the productivity of different cropping systems is atplateau. In the Indo- Gangetic Plains which is considered as a food bowl of the country is alsobeing affected on account of over exploitation of the natural resources. Since rice-wheat is thepredominant cropping system and excessive wet tillage in rice cultivation has caused soildegradation problem and the physical, chemical and biological conditions of the soil are beingaffected which need to be rejuvenated. Therefore, it has become of utmost importance toconserve the natural resources by following organic farming based farming system approach.The water conservation is an integral component of this approach and a function of soil propertylargely determine the infiltration rate and soil depth partially control the amount of water storedin the soil. For higher water intake, soil surface has to be covered by mulching material or intercropping so that surface sealing and crusting do not occur. Shallow tillage increases the soilsurface roughness that helps in cutting runoff. Soil cover and addition of organic matter increasesthe soil moisture storage and ultimately soil health. There is an urgent need to do follow the naturalfarming or zero budget farming by making use of the resources available at the farm itself. Theuse of bio-fertilizers, bio-dynamics formulations, recycling of crop residue, crop rotation,application of green manuring, farm yard manure, extracts of herbs, following bhumi sanskar,beej sanskar, use of bio agents not only would reduce the cost of production but simultaneouslymake the ecosystem more vibrant by making a choice of the various plantation crops basedfarming system. Likewise vegetable, poultry, mushroom/ rabitary/piggrey/fishery based farmingsystems to make the production system productive, profitable and sustainable over a longerperiod of time.
Key Words: Organic Farming, Farming System , Sustainability.
INTRODUCTIONOrganic agriculture has grown out of the
conscious efforts by inspired people to create thebest possible relationship between the earth andthe men. It is holistic production managementsystem which promotes and enhances agro-ecosystem health, including bio-diversity,biological cycles and soil biological activities. Itemphasizes, the use of management practices inpreference to the use of off-farm inputs, takinginto account that regional conditions require
locally adopted systems. This is accomplished byusing, where possible, agronomic, biological andmechanical methods as opposed by usingsynthetic materials, to fulfill any specific functionswithin the system.
It is worth to mention that for the last fourdecades, the cultivated area of the country is142-143 M ha. and simultaneously population pressureis building up. There is general notion among thepeople that to ensure the food security of the
*Corresponding Author’s Email: [email protected]
J Krishi Vigyan 2014, 3(1) : 54-57 DOI: 10.5958/2349-4433.2014.01250.1
J Krishi Vigyan 2014, 3(1) : 54-57
55
country, intensive efforts are required to increaseper unit productivity, which is not possible withoutthe use of chemical fertilizers. However, organicfarming has a scope as a component of farmingsystem, which is an appropriate combination offarm enterprises such as crops, livestock, fishery,forestry, poultry, sericulture, mushroom etc. andthe means available to the farmers to raise themfor profitability. It interacts adequately with theenvironment without dislocating the ecologicaland socio-economic balance on one hand andattempt to meet the national goals on the other(Gill, 2009). Both the concepts are inter related.In farming system too, efforts are made to use theby-product of one enterprise as an in-put for theother enterprise and least dependence on theexternal inputs.
Scope and Need of Organic Farming· Globally one million pesticide poisoning cases
and 20,000 deaths every year are beingnoticed only due to high pesticide residues infood chain-WHO.
· Degradation of bio-diversity due to heavy useof chemical in agriculture.
· To increase the export potential of agriculturalproduce.
· 25 per cent of Indian food products containpesticides residues above tolerance levelscompared to only 1-2 per cent globally.
· Almost 97 per cent of Indian food productscontain detectable pesticide residuescompared to 20 per cent at global level.
· Rejection of Indian agricultural exports ismore than Rs 4,000 Crore annually becauseof very high pesticides residue content.
· Growers of rainfed hill agriculture and smalland marginal holdings in irrigated eco- systemregions are producing crops organically andgetting premium prices from the localconsumers.
Why Farming Systems?· The sustaining household food security has
been an issue of prime importance for majorityof the farmers belonging to the category ofsmall and marginal holdings.
· New improved technologies, even when
considered technically sound find limitedacceptance by majority of resource poorfarmers because such technologies are mainlytargeted to the resource endowed productionsystem.
· Each individual farm has its own specificcharacteristics arising from variation inresource availability and familycircumstances. Likewise, the bio-physical,socio-economic and human characteristics ofa farm are independent in time and space.
· To solve the problem of farmers, who operatein a complex, diverse, risk prone environment;a need is being felt to develop holistic clientoriented and inter-disciplinary farming systemapproach.
· To fulfill the basic needs of farm householdsto ensure the rational use of resources andevade malnutrition and poverty.
· Multi- functionality of agriculture wasobserved in terms of social, cultural and foodsecurity whereby the public is benefittedthrough employment opportunities andaccessibility to better food.
Benefits of Organic FarmingOrganic agriculture sustains the health of soils,
ecosystems and people. It relies on ecologicalprocesses, bio-diversity and cycles adapted to localconditions, rather than the use of inputs withadverse effects. Organic agriculture combinestradition, innovation and science to benefit theshared environment and promote fair relationshipsand a good quality for all involved. According toGill and Prasad (2009), organic farming aims atthe following
- Minimizing cost of production
- Healthy food
- Augmentation of profit
- Improving soil health
- Counteract the climate change
- Minimize energy consumption
- Encourage natural habitats
Benefits of Farming SystemWhile farming system aims at increased
productivity, profitability, sustainability, balanced
Gill
J Krishi Vigyan 2014, 3(1) : 54-57
56
food, clean environment, recycling of resources,income around the year, adoption of newtechnology, solving energy fuel and fodder crisis,avoiding deforestation, increased employmentgeneration, input-output efficiency, enhancedopportunity for agriculture oriented industries andstandard of living of the farmers (Gill et al 2009).thereby organic farming based farming systemcan well address the challenges such as declinein water table, appearance of multi-nutrientdeficiency, less response to applied nutrients,excessive use of pesticides, soil degradation andclimate change.
Principles of Organic Farming:It has four principles as under
The Principle of Health: Organic agricultureshould sustain and enhance the health of soil,plant, animal, human and planet as one andindivisible.
The Principle of Ecology: Organic agricultureshould be based on living ecological systems andcycles, work with them, emulate them and helpsustain them.
The Principle of Fairness: Organic agricultureshould build on relationships that ensure fairnesswith regard to the common environment and lifeopportunities.
The Principle of Care: Organic agriculture shouldbe managed in a precautionary and responsiblemanner to protect the health and well being ofcurrent and future generations and theenvironment.
Misconceptions about Organic Farming- Can we sustain the food security to ever-
increasing population through organicfarming?
- Is it possible to meet the nutrient requirementsof the crops entirely through organic sources?
- Are there any significant benefits of organicfarming in terms of food quality?
- Is organic farming economically viable?
- Is it possible to manage weeds, insect-pestsand diseases in organic farming to sustainyield levels?
- Complex and costly procedure ofidentification.
- The risk involved in marketing of organicproduce at premium rates are not available indomestic markets.
Lack of Active Interest among FarmingCommunity
There is considerable latent interest amongfarmers in conversion to organic farming becauseof the following reasons:
- Perceived high costs of doing so, which ismainly due to incomplete knowledge aboutprinciples and practices of organic agricultureamong farmers. Farmers often seek for off-farm inputs, leading to escalation inproduction costs, which is against the basicphilosophy of organic agriculture. Moreover,very high government subsidies on chemicalfertilizers in conventional agriculture are nottaken into account while comparing theeconomic costs.
- Non availability of adequate quantities oforganic manures and other organic inputs inthe local market from reliable sources. Farmersare, more often than not, forced to recyclemajor quantities of crop residues as animalfodder and animal dung as source ofhousehold energy. Sizable quantities of cropresidues are also sold off to paper andcardboard industry to earn cash for householdneeds.
- Complete knowledge about organic farmingprinciples, practices and advantages accruedto grower as well as mankind, is not filtereddown to the small farmers, which should beactual target and potential beneficiary oforganic farming. Further, whatsoeverinformation reaches to target groups, is veryoften not backed by scientifically provenresults in tropical/ sub-tropical climaticconditions and different farming situationsprevailing in Indian sub-continent (Gill andPrasad, 2009).
ExampleThe results of a case study at the farm of Sh.
Krishan kumar Jakhar in Village-Dhaba, TehsilSangaria, Distt.-Hanumangarh (Rajasthan) whoused to grow crops (cereals, pulses, oilseeds),vegetables, fruits with organic source of nutrition,jeeva amrit, crop residue management, livestock,
Organic Farming
J Krishi Vigyan 2014, 3(1) : 54-57
57
beej sanskar, bhumi sanskar , panchgaviya,decoction of herbs as pesticides, decant of biogasslurry and other ITK at his farm clearly revealedthe following facts (Gill, 2009).
- The quality of the produce is considered usefulto keep good human health.
- Agriculture is economically and spirituallybeneficial to the consumers.
- Agriculture is highly sustainable at his farm.- The agriculture practiced at his farm is
conforming to nature.- Levels of productivity were highly
satisfactory.It has led to diversified farming where the
farmer is engaged in a multitude of farmenterprises. If a large number of crop enterprises,with or without a number of non-crop enterpriseis run by a single farmer. It leads to better resourceutilization and production utilization with ultimateaim to fulfill the farm household need, createemployment opportunity, ensure regular flow ofincome and improve the standard of living byensuring livelihood security.
Strategies Needed to Promote Organic FarmingBased Farming System in India
In Indian context, to promote and makeorganic farming based farming systemeconomically viable following issues are neededto be addressed.
* Adequate research and extension supportneeds to be provided in order to improveregion specific farming techniques anddisseminate findings for conversion andmanagement of organic farms in farmingsystem mode.
* Researchers should study and quantify the roleof organic agriculture in mitigating the climatechange and ill effects of modern agricultureand improve resource sustainability.
* Central and State government shouldacknowledge organic farming as an emissionmechanism to reduce green house gases andsequester carbon. They should help farmersby promoting organic agriculture throughresearch and extension services.
* Government should recognize organicagriculture in Kyoto Protocol carbon creditmechanism.
* Organic market development sector needsmajor thrust on developing supply chains andrelated infrastructure to ensure competitiveprice of organic produce to the grower indomestic and international markets.
* Mission – Mode programs for on-farmdemonstrations, training for capacity buildingof institutions, organic farmers, serviceproviders, NGOs and processing / packingindustry, with full research backup are needed.Model organic farms are need to be establishedin Public-Private-Partnership mode.
* Government support is required for cheaperaccess to organic certification of farms.
* There is a need to create the data base onfarming system in relation to type of farmingsystem, infrastructure, economics,sustainability etc. under different farmingsituation.
* Need to develop research modules of farmingsystem under different holding size withvarying economically viable and sociallyacceptable systems.
* The assessment and refinement of thetechnologies developed at research station atcultivators’ field.
* Need to prepare a policy a contingentplanning to counteract the weather vagaries/climate threats under different farmingsituations.
* Need to prepare a policy draft for theconsideration of planners for its promotion atlarge scale with nominal financial assistanceeither through short/medium /long term loansand other promotional advantage.
REFERENCESGill M S (2009). Cooperative organic farming in Rajasthan – A
case study. Compendium on Advances in Organic Farming,project Directorate for Farming System Research, ICAR,Modipuram : pp 8-9.
Gill M S (2009). Integrated farming system – A noble approachfor enhancing farm income. Indian Farming. 59 (6) : 12-17.
Gill M S and Prashad Kamta (2009). Organic Agriculture –Concept, Status and strategies in Indian Perspective.Compendium on Advances in Organic farming, projectDirectorate for Farming System Research, ICAR, Modipuram: pp 1-7.
Gill M S, Singh J P and Gangwar K S (2009). Integrated farmingsystem and agriculture sustainability. Indian Journal ofAgronomy, 54 (2) : 128-139.
Received on 26/8/2014 Accepted on 15/9/2014
Gill
J Krishi Vigyan 2014, 3(1) : 54-57
58
Performance of Front Line Demonstrations onSummer Moong in Jalandhar district
Paramjit Kaur, Amanpreet Kaur, Balbir Kaur and Kuldeep SinghKrishi Vigyan Kendra, Jalandhar-144039 (Punjab)
ABSTRACTKrishi Vigyan Kendra conducted front line demonstrations on summer moong variety SML668 at farmers’ fields in district Jalandhar during years 2008 to 2013. The productivity andeconomic returns of summer moong in demonstrated plots were calculated and compared withthe corresponding farmers’ practices (local check). The data obtained was pooled for six years.It was observed that on an average 15.9 per cent higher grain yield was recorded in demonstrationplots than the farmers’ practices. The extension gap, technology gap and technology indexwere 1.3q/ha, 0.76q/ha and 6.7 per cent, respectively. An additional investments of Rs. 1,379/ha coupled with scientific monitoring of demonstrations and non-monetary factors resulted inadditional return of Rs. 5,362/ ha over the farmer’s practice. Fluctuating minimum selling priceof summer moong during different years influenced the economic returns per unit area.
Key Words: Summer Moong , Front Line Demonstrations, Technology and Extension Gaps,Technology Index.
INTRODUCTIONKrishi Vigyan Kendra an innovative science–
based institution plays an important role inbringing the research scientists face to face withfarmers. The main aim of Krishi Vigyan Kendrais to reduce the time lag between generation oftechnology at the research institution and itstransfer to the farmers for increasing productivityand income from the agriculture and allied sectorson sustained basis. KVKs are grass root levelorganizations meant for application of technologythrough assessment, refinement anddemonstration of proven technologies underdifferent ‘micro farming’ situations in a district(Das, 2007). Front line demonstration (FLD) is along term educational activity conducted in asystematic manner at farmers’ fields to prove theworth of a new practice/technology. Farmers inIndia are still producing crops based on theknowledge transmitted to them by their forefathersleading to a grossly unscientific agronomic,nutrient management and pest managementpractices. As a result of these, they often fail toachieve the desired potential yield of various cropsand new varieties.
Jalandhar district is in central zone thetraditional cropping system of this district is rice-wheat. The soil is low in organic carbon, mediumin P and K. Till date the productivity level ofsummer moong is not sufficient on account ofseveral causes like unavailability of quality seedsof improved varieties in time and poor cropmanagement practices due to unawareness andnon-adoption of recommended production &plant protection technologies. Therefore, it is veryessential to demonstrate the high yielding varieties,resistant to biotic and abiotic stresses and otherproduction technologies which the farmersgenerally do not adopt. Keeping above points inview Front line demonstrations were conductedon summer moong (var. SML 668) by KrishiVigyan Kendra. The main objectives of the studywere to exhibit the performance of recommendedhigh yielding summer moong variety with fullrecommended package of practices for harvestinghigher crop yields. To compare the yield levels oflocal check (farmers’ practices) and FLD plots.To collect feedback for further improvement inthe performance of summer moong cultivationpractices.
*Corresponding Author’s Email: [email protected]
J Krishi Vigyan 2014, 3(1) : 58-61 DOI: 10.5958/2349-4433.2014.01251.3
J Krishi Vigyan 2014, 3(1) : 58-61
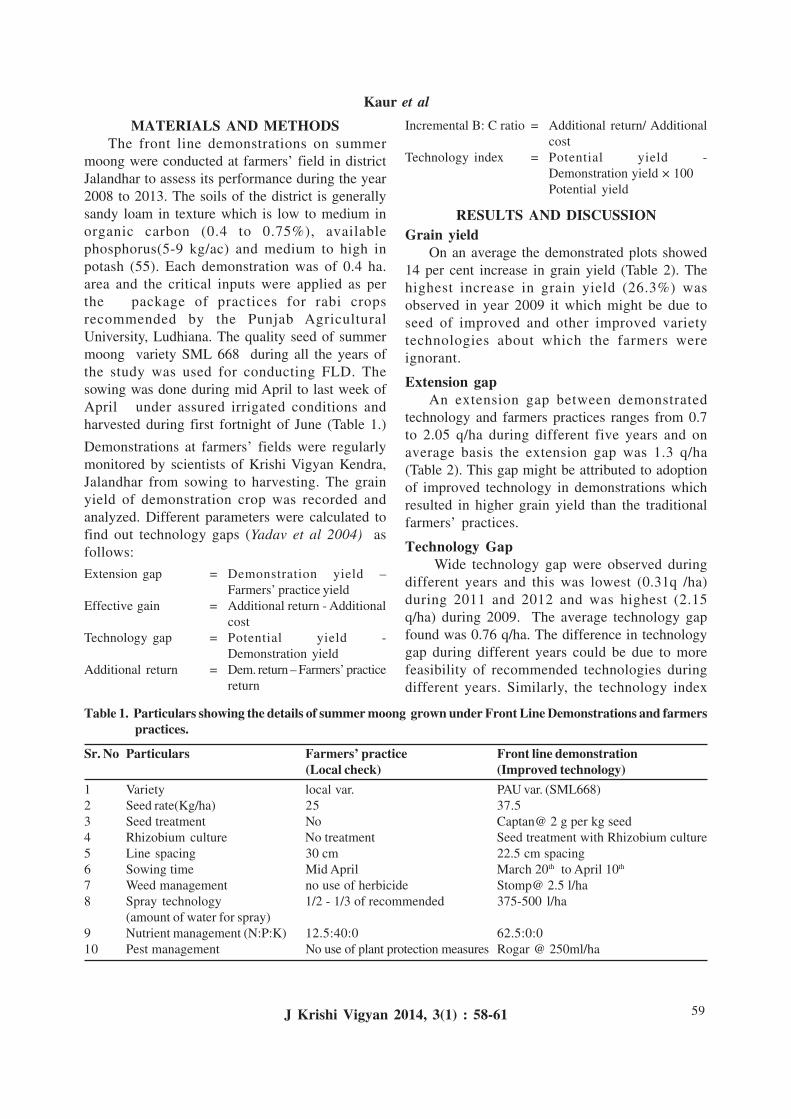
59
MATERIALS AND METHODSThe front line demonstrations on summer
moong were conducted at farmers’ field in districtJalandhar to assess its performance during the year2008 to 2013. The soils of the district is generallysandy loam in texture which is low to medium inorganic carbon (0.4 to 0.75%), availablephosphorus(5-9 kg/ac) and medium to high inpotash (55). Each demonstration was of 0.4 ha.area and the critical inputs were applied as perthe package of practices for rabi cropsrecommended by the Punjab AgriculturalUniversity, Ludhiana. The quality seed of summermoong variety SML 668 during all the years ofthe study was used for conducting FLD. Thesowing was done during mid April to last week ofApril under assured irrigated conditions andharvested during first fortnight of June (Table 1.)
Demonstrations at farmers’ fields were regularlymonitored by scientists of Krishi Vigyan Kendra,Jalandhar from sowing to harvesting. The grainyield of demonstration crop was recorded andanalyzed. Different parameters were calculated tofind out technology gaps (Yadav et al 2004) asfollows:
Extension gap = Demonstration yield –Farmers’ practice yield
Effective gain = Additional return - Additionalcost
Technology gap = Potential yield -Demonstration yield
Additional return = Dem. return – Farmers’ practicereturn
Incremental B: C ratio = Additional return/ Additionalcost
Technology index = Potential yield -Demonstration yield × 100Potential yield
RESULTS AND DISCUSSIONGrain yield
On an average the demonstrated plots showed14 per cent increase in grain yield (Table 2). Thehighest increase in grain yield (26.3%) wasobserved in year 2009 it which might be due toseed of improved and other improved varietytechnologies about which the farmers wereignorant.
Extension gapAn extension gap between demonstrated
technology and farmers practices ranges from 0.7to 2.05 q/ha during different five years and onaverage basis the extension gap was 1.3 q/ha(Table 2). This gap might be attributed to adoptionof improved technology in demonstrations whichresulted in higher grain yield than the traditionalfarmers’ practices.
Technology Gap Wide technology gap were observed during
different years and this was lowest (0.31q /ha)during 2011 and 2012 and was highest (2.15q/ha) during 2009. The average technology gapfound was 0.76 q/ha. The difference in technologygap during different years could be due to morefeasibility of recommended technologies duringdifferent years. Similarly, the technology index
Table 1. Particulars showing the details of summer moong grown under Front Line Demonstrations and farmerspractices.
Sr. No Particulars Farmers’ practice Front line demonstration(Local check) (Improved technology)
1 Variety local var. PAU var. (SML668)2 Seed rate(Kg/ha) 25 37.53 Seed treatment No Captan@ 2 g per kg seed4 Rhizobium culture No treatment Seed treatment with Rhizobium culture5 Line spacing 30 cm 22.5 cm spacing6 Sowing time Mid April March 20th to April 10th
7 Weed management no use of herbicide Stomp@ 2.5 l/ha8 Spray technology 1/2 - 1/3 of recommended 375-500 l/ha
(amount of water for spray)9 Nutrient management (N:P:K) 12.5:40:0 62.5:0:010 Pest management No use of plant protection measures Rogar @ 250ml/ha
Kaur et al
J Krishi Vigyan 2014, 3(1) : 58-61

60
for all the demonstrations during different yearswere in accordance with technology gap. Highertechnology index reflected the inadequate proventechnology for transferring to farmers andinsufficient extension services for transfer oftechnology.
Economic analysisDifferent variables like seed, fertilizers, bio
fertilizers and pesticides were considered ascritical inputs for the demonstrations as well asfarmers practice and on an average an additionalinvestment of Rs.1,379/ha was made underdemonstrations. Economic returns as a functionof grain yield and MSP sale price varied duringdifferent years. Maximum returns (Rs. 47,565/-ha) during the year 2013 was obtained due tohigher MSP sale rates as declared by Governmentof India. The higher additional returns andeffective gain obtained under demonstrationscould be due to improved technology, non-monetary factors, timely operations of cropcultivation and scientific monitoring. The highest
incremental benefit: cost ratio (IBCR) was 5.71during the year 2011. It depends on grain yieldand MSP. Overall average IBCR was found to be3.6:1. The results confirm the findings of frontlinedemonstrations on oilseed and pulse crops byYadav et al (2004) and Lathwal (2010).
CONCLUSIONFront line demonstration program was
effective in changing attitude of farmers towardspulse cultivation. Cultivation of demonstratedplots of summer moong with improvedtechnologies has increased the skill andknowledge of the farmers. FLD also helped inreplacement of local un-recommended varietieswith improved recommended varieties. This alsoimproved the relationship between farmers andscientists and built confidence between them. Thefarmers where improved technology wasdemonstrated also acted as primary source ofinformation for other farmers on the improvedpractices of summer moong cultivation and alsoacted as source of good quality pure seeds in their
Table 3. Economic Analysis of demonstrated plots and farmers’ practice.
Year Cost of input Additional MSP Yield Total Returns Additi Effect INC (Rs/ha) cost in (Rs/q) (q/ha) (Rs/ha) onal ive B:C
demon. return gain ratioDemon. Farmers’ (Rs/ha) Demon. Local Demon. Local in demo
Practice Check Check (Rs/ha)2008 11,695 10,392 1,303 2,600 9.2 7.5 24,050 19,500 4,550 3,247 3.492009 11,739 10,450 1,289 2,760 9.1 7.2 25,116 19,872 5,244 3,955 4.062010 13,982 12,276 1,706 3,170 10.9 10.2 34,553 32,334 2,219 5,130 0.302011 13,580 12,325 1,255 3,500 11.4 9.4 39,900 32,725 7,175 5,920 5.712012 13,880 12,525 1,355 3,872 10.9 10.1 42,360 34,735 7,625 6,270 4.622013 14,242 12,952 1,290 4,500 10.5 9.6 47,565 43,020 4,545 3,255 3.52Av. 10,873 11,820 1,379 3,400 10.3 8.9 35,590 30,364 5,362 4,629 3.60
Table 2. Grain yield and gap analysis of front line demonstrations on summer moong (SML 668) at farmers’field.
Year No. of demon. Area(ha) Yield (q/ha) Increase Extension Technology TechnologyDemon. Farmers’ (%) gap (q/ha) gap (q/ha) index (%)
Practice2008 2 1.0 9.2 7.5 23.3 1.8 2.0 17.72009 16 1.0 9.1 7.2 26.3 1.9 2.2 19.12010 3 0.8 10.9 10.2 6.8 0.7 0.4 3.12011 14 6.0 11.4 9.4 21.9 2.1 0.3 2.82012 12 6.0 10.9 10.1 8.3 0.8 0.3 2.82013 18 4.8 10.6 9.6 10.5 1.0 0.7 6.0Av. 10.8 3.3 10.6 9.3 14.0 1.3 0.76 6.7
Front Line Demonstrations on Summer Moong
J Krishi Vigyan 2014, 3(1) : 58-61
61
locality for the next crop. The concept of Frontline demonstration may be applied to all farmercategories including progressive farmers forspeedy and wider dissemination of therecommended practices to other members of thefarming community.
REFERENCESDas P (2007). Proceedings of the meeting of DDG (AE), ICAR,
with officials of state Departments, ICAR institutes andAgricultural Universities, NRC Mithun, Jharmapani, ZonalCoordinating Unit, Zone-III, Barapani, Meghalaya, India.pp 6.
Lathwal O P (2010). Evaluation of front line demonstrations onblackgram in irrigated agro ecosystem. Annals of AgriculturalResearch 31 (1&2) : 24-27.
Yadav D B, Kamboj B K and Garg R B (2004). Increasing theproductivity and profitability of sunflower through front linedemonstrations in irrigated agroecosystem of eastern Haryana.Haryana J. of Agronomy 20 (1&2): 33-35.
Balai C M , Bairwa R K , Verma L N , Roat B L, and JalwaniaR (2013). Economic impact of front line demonstrations oncereal crops in Tribal Belt of Rajasthan International Journalof Agricultural Sciences 3 (7) : 566-570,
Received on 14/7/2014 Accepted on 24/8/2014
Kaur et al
J Krishi Vigyan 2014, 3(1) : 58-61
62
Problems Related to Summer Management in DairyCows as Perceived by Farmers of Namakkal District
Sakthi Priya M, V Kumaravel, M Daisy and B MohanKrishi Vigyan Kendra,
Veterinary College and Research Institute Campus,Namakkal-637001 ( Tamilnadu)
ABSTRACTA study was conducted in Sendamangalam and Rasipuram blocks of Namakkal district tounderstand the problems perceived by the small and marginal farmers in rearing dairy cowsduring summer months. Heat stress is of greatest concern in high producing dairy cows in a drybelt like Namakkal in Tamil Nadu. A random sample of 140 farmers was selected from twoselected blocks of Namakkal district. Depressed milk production, reduced feed intake, increasedwater intake, bacterial and viral diseases outbreak and lack of knowledge on housing facilitieswere the problems perceived as most serious by the farmers. Around 30 per cent reduction inenergy utilization in dairy animals due to heat stress was noticed. Thus these problems pertainingto dairy farm operations intend the farmers to follow certain implications or strategies to reducethe economic loss occurring during summer.
Key Words: Dairy cows, Milk production, Heat stress, Temperature, Diseases, Farmers.
INTRODUCTIONThe farmers of Namakkal district maintain two
to four dairy cows at their farm and depend onmilk production economically. Namakkal districtin Tamil Nadu comes under semi arid region andrecorded a normal rainfall of 907 mm. In the lastthree years of 2011 to 2013 there was 50 per centreduction in the normal rainfall. This extremedrought condition takes its toll on milk yield andover-all performance of dairy animals. Heat stressoccurs in animals when there is problem inthermoregulation i.e., imbalance between heatproduction within the body and its dissipationfrom the body Increased ambient temperature maylead to enhanced heat gain as compared to heatloss from the body and causes heat stress inanimals. In high milk producing cows, higher feedintake results in an increased metabolic heatproduction during summer months, as a resulthigh milk producing cows may come under heatstress much earlier than the low milk producingcounter parts.
MATERIALS AND METHODSThe study was conducted in Sendamangalam
and Rasipuram blocks of Namakkal district ofTamil Nadu state. From these two blocks 140 dairyfarmers were randomly selected and the data werecollected by personal interviews using a pre-testedstructured schedule. Ranking of problems wasdone based on mean score which was calculatedas sum of scores for each problem divided by totalnumber of respondents.
CLIMATE AND WEATHERThe mean data on temperature, relative
humidity and rainfall for a period of six years wereobtained from the Automatic Weather Station(AWS), Namakkal which are as follows. A meanannual rainfall of Namakkal was 719.8 mm anddistributed over 55 rainy days. The annual meantemperature was 33.6°C and mean relativehumidity was 73.7 per cent.
The weather conditions prevailed during thesurvey period (March 2012 to March 2014) arepresented in Table 1.
*Corresponding Author’s E-mail: [email protected]
J Krishi Vigyan 2014, 3(1) : 62-66 DOI: 10.5958/2349-4433.2014.01252.5
J Krishi Vigyan 2014, 3(1) : 62-66
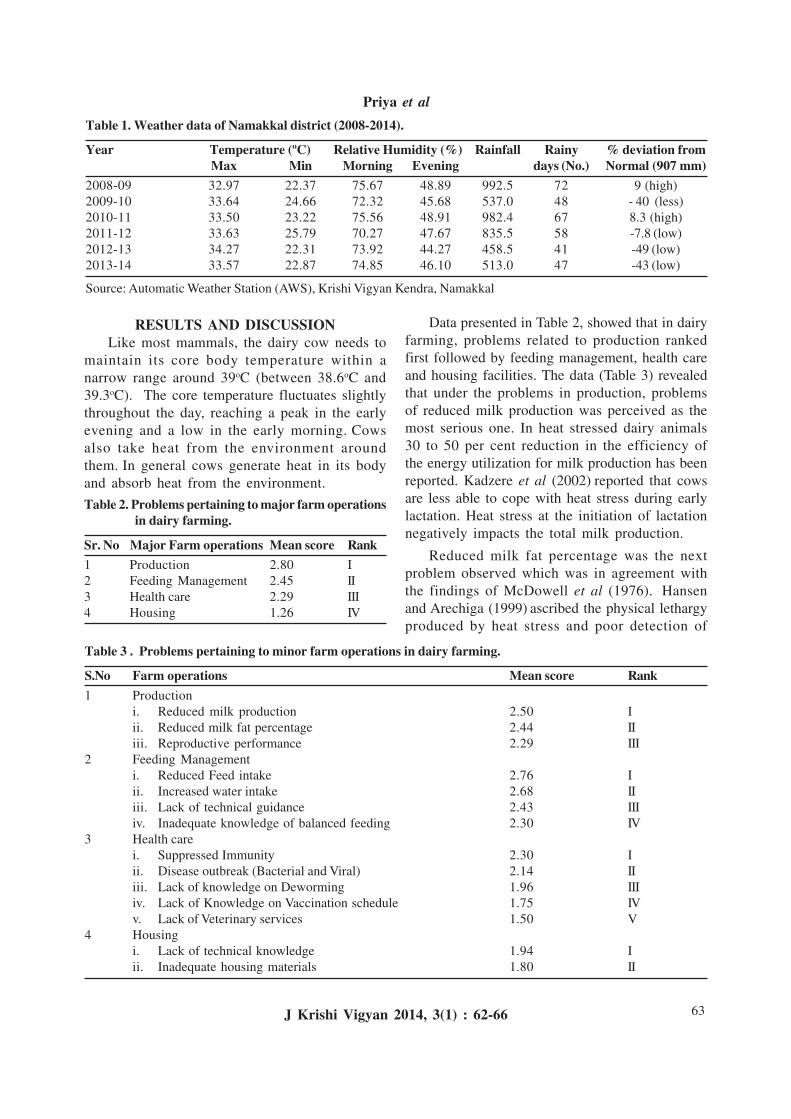
63
RESULTS AND DISCUSSIONLike most mammals, the dairy cow needs to
maintain its core body temperature within anarrow range around 39oC (between 38.6oC and39.3oC). The core temperature fluctuates slightlythroughout the day, reaching a peak in the earlyevening and a low in the early morning. Cowsalso take heat from the environment aroundthem. In general cows generate heat in its bodyand absorb heat from the environment.
Table 2. Problems pertaining to major farm operationsin dairy farming.
Sr. No Major Farm operations Mean score Rank1 Production 2.80 I2 Feeding Management 2.45 II3 Health care 2.29 III4 Housing 1.26 IV
Table 1. Weather data of Namakkal district (2008-2014).
Year Temperature (ºC) Relative Humidity (%) Rainfall Rainy % deviation fromMax Min Morning Evening days (No.) Normal (907 mm)
2008-09 32.97 22.37 75.67 48.89 992.5 72 9 (high)2009-10 33.64 24.66 72.32 45.68 537.0 48 - 40 (less)2010-11 33.50 23.22 75.56 48.91 982.4 67 8.3 (high)2011-12 33.63 25.79 70.27 47.67 835.5 58 -7.8 (low)2012-13 34.27 22.31 73.92 44.27 458.5 41 -49 (low)2013-14 33.57 22.87 74.85 46.10 513.0 47 -43 (low)
Source: Automatic Weather Station (AWS), Krishi Vigyan Kendra, Namakkal
Data presented in Table 2, showed that in dairyfarming, problems related to production rankedfirst followed by feeding management, health careand housing facilities. The data (Table 3) revealedthat under the problems in production, problemsof reduced milk production was perceived as themost serious one. In heat stressed dairy animals30 to 50 per cent reduction in the efficiency ofthe energy utilization for milk production has beenreported. Kadzere et al (2002) reported that cowsare less able to cope with heat stress during earlylactation. Heat stress at the initiation of lactationnegatively impacts the total milk production.
Reduced milk fat percentage was the nextproblem observed which was in agreement withthe findings of McDowell et al (1976). Hansenand Arechiga (1999) ascribed the physical lethargyproduced by heat stress and poor detection of
Table 3 . Problems pertaining to minor farm operations in dairy farming.
S.No Farm operations Mean score Rank1 Production
i. Reduced milk production 2.50 Iii. Reduced milk fat percentage 2.44 IIiii. Reproductive performance 2.29 III
2 Feeding Managementi. Reduced Feed intake 2.76 Iii. Increased water intake 2.68 IIiii. Lack of technical guidance 2.43 IIIiv. Inadequate knowledge of balanced feeding 2.30 IV
3 Health carei. Suppressed Immunity 2.30 Iii. Disease outbreak (Bacterial and Viral) 2.14 IIiii. Lack of knowledge on Deworming 1.96 IIIiv. Lack of Knowledge on Vaccination schedule 1.75 IVv. Lack of Veterinary services 1.50 V
4 Housingi. Lack of technical knowledge 1.94 Iii. Inadequate housing materials 1.80 II
Priya et al
J Krishi Vigyan 2014, 3(1) : 62-66
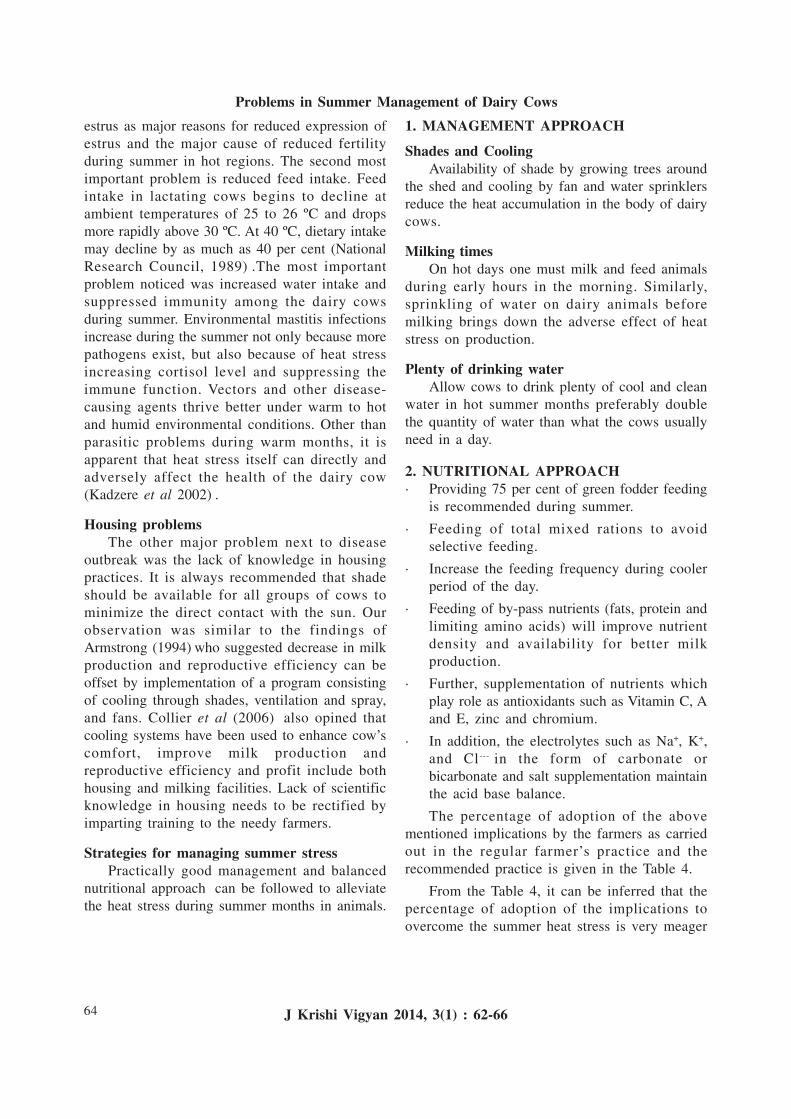
64
estrus as major reasons for reduced expression ofestrus and the major cause of reduced fertilityduring summer in hot regions. The second mostimportant problem is reduced feed intake. Feedintake in lactating cows begins to decline atambient temperatures of 25 to 26 ºC and dropsmore rapidly above 30 ºC. At 40 ºC, dietary intakemay decline by as much as 40 per cent (NationalResearch Council, 1989) .The most importantproblem noticed was increased water intake andsuppressed immunity among the dairy cowsduring summer. Environmental mastitis infectionsincrease during the summer not only because morepathogens exist, but also because of heat stressincreasing cortisol level and suppressing theimmune function. Vectors and other disease-causing agents thrive better under warm to hotand humid environmental conditions. Other thanparasitic problems during warm months, it isapparent that heat stress itself can directly andadversely affect the health of the dairy cow(Kadzere et al 2002) .
Housing problemsThe other major problem next to disease
outbreak was the lack of knowledge in housingpractices. It is always recommended that shadeshould be available for all groups of cows tominimize the direct contact with the sun. Ourobservation was similar to the findings ofArmstrong (1994) who suggested decrease in milkproduction and reproductive efficiency can beoffset by implementation of a program consistingof cooling through shades, ventilation and spray,and fans. Collier et al (2006) also opined thatcooling systems have been used to enhance cow’scomfort, improve milk production andreproductive efficiency and profit include bothhousing and milking facilities. Lack of scientificknowledge in housing needs to be rectified byimparting training to the needy farmers.
Strategies for managing summer stressPractically good management and balanced
nutritional approach can be followed to alleviatethe heat stress during summer months in animals.
1. MANAGEMENT APPROACH
Shades and CoolingAvailability of shade by growing trees around
the shed and cooling by fan and water sprinklersreduce the heat accumulation in the body of dairycows.
Milking timesOn hot days one must milk and feed animals
during early hours in the morning. Similarly,sprinkling of water on dairy animals beforemilking brings down the adverse effect of heatstress on production.
Plenty of drinking waterAllow cows to drink plenty of cool and clean
water in hot summer months preferably doublethe quantity of water than what the cows usuallyneed in a day.
2. NUTRITIONAL APPROACH· Providing 75 per cent of green fodder feeding
is recommended during summer.
· Feeding of total mixed rations to avoidselective feeding.
· Increase the feeding frequency during coolerperiod of the day.
· Feeding of by-pass nutrients (fats, protein andlimiting amino acids) will improve nutrientdensity and availability for better milkproduction.
· Further, supplementation of nutrients whichplay role as antioxidants such as Vitamin C, Aand E, zinc and chromium.
· In addition, the electrolytes such as Na+, K+,and Cl--- in the form of carbonate orbicarbonate and salt supplementation maintainthe acid base balance.
The percentage of adoption of the abovementioned implications by the farmers as carriedout in the regular farmer’s practice and therecommended practice is given in the Table 4.
From the Table 4, it can be inferred that thepercentage of adoption of the implications toovercome the summer heat stress is very meager
Problems in Summer Management of Dairy Cows
J Krishi Vigyan 2014, 3(1) : 62-66
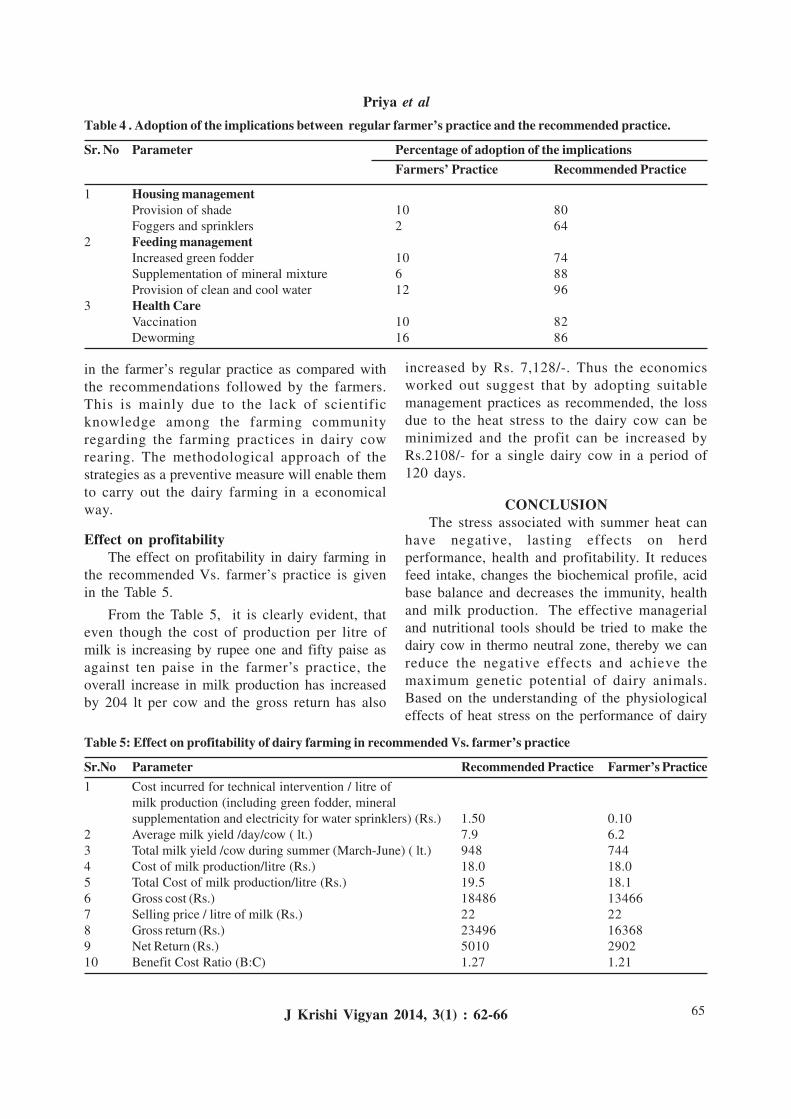
65
Table 4 . Adoption of the implications between regular farmer’s practice and the recommended practice.
Sr. No Parameter Percentage of adoption of the implicationsFarmers’ Practice Recommended Practice
1 Housing managementProvision of shade 10 80Foggers and sprinklers 2 64
2 Feeding managementIncreased green fodder 10 74Supplementation of mineral mixture 6 88Provision of clean and cool water 12 96
3 Health CareVaccination 10 82Deworming 16 86
in the farmer’s regular practice as compared withthe recommendations followed by the farmers.This is mainly due to the lack of scientificknowledge among the farming communityregarding the farming practices in dairy cowrearing. The methodological approach of thestrategies as a preventive measure will enable themto carry out the dairy farming in a economicalway.
Effect on profitabilityThe effect on profitability in dairy farming in
the recommended Vs. farmer’s practice is givenin the Table 5.
From the Table 5, it is clearly evident, thateven though the cost of production per litre ofmilk is increasing by rupee one and fifty paise asagainst ten paise in the farmer’s practice, theoverall increase in milk production has increasedby 204 lt per cow and the gross return has also
increased by Rs. 7,128/-. Thus the economicsworked out suggest that by adopting suitablemanagement practices as recommended, the lossdue to the heat stress to the dairy cow can beminimized and the profit can be increased byRs.2108/- for a single dairy cow in a period of120 days.
CONCLUSIONThe stress associated with summer heat can
have negative, lasting effects on herdperformance, health and profitability. It reducesfeed intake, changes the biochemical profile, acidbase balance and decreases the immunity, healthand milk production. The effective managerialand nutritional tools should be tried to make thedairy cow in thermo neutral zone, thereby we canreduce the negative effects and achieve themaximum genetic potential of dairy animals.Based on the understanding of the physiologicaleffects of heat stress on the performance of dairy
Table 5: Effect on profitability of dairy farming in recommended Vs. farmer’s practice
Sr.No Parameter Recommended Practice Farmer’s Practice1 Cost incurred for technical intervention / litre of
milk production (including green fodder, mineralsupplementation and electricity for water sprinklers) (Rs.) 1.50 0.10
2 Average milk yield /day/cow ( lt.) 7.9 6.23 Total milk yield /cow during summer (March-June) ( lt.) 948 7444 Cost of milk production/litre (Rs.) 18.0 18.05 Total Cost of milk production/litre (Rs.) 19.5 18.16 Gross cost (Rs.) 18486 134667 Selling price / litre of milk (Rs.) 22 228 Gross return (Rs.) 23496 163689 Net Return (Rs.) 5010 290210 Benefit Cost Ratio (B:C) 1.27 1.21
Priya et al
J Krishi Vigyan 2014, 3(1) : 62-66
66
cows, it is highly desirable to alleviate the heatloads in the cows by adopting good housing,nutrition and disease management. Also furtherstrategies needs to be worked out and developedto keep the dairy cows in the comfortable zoneduring the production period.
ACKNOWLEDGEMENTThe authors are highly thankful to farmers of
the concerned blocks, for having providednecessary information and facilities to carry outthe research project.
REFERENCESArmstrong D V (1994). Heat stress interaction with shade and
cooling. J. Dairy Science 77(7): 2044-2050.
Beede D K and Collier R J (1986). Potential nutritional strategiesfor intensively managed cattle during thermal stress. J. Anim.Sci 62 : 543–554.
Collier R J, Dahl G E and VanBaale M J (2006). Major advancesassociated with environmental effects on dairy cattle. J. DairySci 89:1244–1253.
Hansen P J and Arechiga C F (1999). Strategies for managingreproduction in heat-stressed dairy cows. J. Dairy. Sci 82(Suppl.): 36–50.
Kadzere C T, Murphy M R, Silanikove N and Maltz E (2002).Heat stress in lactating dairy cows: a review. LivestockProduction Science 77 : 59-91.
National Research Council (1989). In: 6th Revised Edition Update.Nutrient Requirements of Dairy Cattle. National AcademyPress, Washington, DC
Received on 28/5/2014 Accepted on 16/8/2014
Problems in Summer Management of Dairy Cows
J Krishi Vigyan 2014, 3(1) : 62-66
67
Productivity Enhancement of Organically GrownLocal Scented Rice- Wheat Cropping Sequence due
to Enriched Compost ApplicationAjay Kumar and B S Mahapatra1
Krishi Vigyan Kendra, PithoragarhG B Pant University of Agriculture and Technology, Pantnagar-262 530 (Uttrakhand)
ABSTRACTThe organic farming in hilly areas of Uttarakhand is default by nature as chemical fertilizer anduse of fungicide, insecticide and herbicide is negligible. In hilly regions of district Pithoragarhrice wheat is an important cropping sequence. The entire scented rice in the district is grownorganically and the yield of local scented rice varieties is very low. The present study wasconducted by Krishi Vigyan Kendra Pithoragarh to compare the farmers’ practice (T-1) withtwo treatments viz; T-2: 20 t FYM to Rice and Wheat along with phosphorus solublising bacteria(PSB) and T-3: 20 t FYM to Rice and Wheat along with PSB, Azatobacter and Azospirillum.The experiment was conducted at farmers’ field in two villages viz; Bagrihat and Egyardevi. Invillage Bagrihat during 2007 treatment T-3 resulted in 13.7 and 11.7 per cent increase in yieldof rice and wheat over farmers’ practice respectively. While in village Egyardevi treatment T-3resulted in higher yield of rice and wheat during both the years of study.Net return for treatmentT-3 was higher as compared to treatment T-1 and T-2. Thus application of well decomposedF.Y.M enriched with Azotobacter, Azospirillum and PSB resulted in higher yield of scented riceand wheat cropping sequence over traditional farmers’ practice.
Key Words: Organic Farming, Scented Rice, Wheat, Cropping Sequence.
INTRODUCTIONOrganic agriculture is a production system
which avoids or largely excludes the use ofsynthetic compounded fertilizers, pesticides,growth regulators and livestock feed additives. Ittakes an ecological approach to nutrient supplyand crop production rather than chemical one.Nutrient supply to crops under organic cultivationare mainly dependent on organic sources ofnitrogen such as legumes, manures, composts, bio-fertilizers and crop rotations. The primary goal oforganic agriculture is to optimize the health andproductivity of inter-dependent communities ofsoil life, plant, animals and people. When soil isin good health the population of soil fauna andflora multiplies rapidly which in turn sustains thebio-chemical process of dissolution and synthesisat higher rate. Under it emphasis is paid topromotion of varieties that are better adapted tolocal biotic condition.
State of Uttarakhand and Sikkim havedeclared themselves as organic state. In hilly areasof the State of Uttarakhand fertilizer, pesticide andchemical fertilizer application in negligible. Thecurrent use of chemical fertilizer is less than 7 kg/ha/year and that of pesticide is negligible. Thecultivation practiced is largely organic in nature,largely due to non-availability and lack ofknowledge of chemical fertilizer use in remotehilly areas of state. In the district Pithoragarh localscented rice is preferred by farmers for their ownconsumption. The yield of local scented varietiesis low, due to lack of proper nutrient application.In wheat crop also wide spread nitrogen deficiencyis observed in the district due to low temperatureand lack of nutrient supply. The present studywas, therefore, taken to enhance the nutrientsupply of the traditionally grown scented ricevarieties and wheat crop and compare the yieldsto the traditional cultivation practice.
*Corresponding Author’s Email : [email protected] Agronomy, GBPUA&T, Pantnagar and Former Director, Indian Institute of Jute & Allied Fiber Research Centre, Barrakpore
J Krishi Vigyan 2014, 3(1) : 67-70 DOI: 10.5958/2349-4433.2014.01253.7
J Krishi Vigyan 2014, 3(1) : 67-70
68
MATERIALS AND METHODSThe experiment was conducted at farmers’
field in Pithoragarh district of Uttarakhand. Twovillages namely Egyardevi and Bagrihat wereselected as in these villages organic farming waspromoted from 2002-03 by State Department ofAgriculture. Village Egyardevi is located at analtitude of 1600m above mean sea level, aspectof slope was north facing for the village, theaverage initial organic carbon level of the villagewas 1.98 per cent and mean pH was 6.96. Thevillage Bagrihat is located at an altitude of 1200mabove mean sea level in the valley region. Theaverage initial organic carbon level of the villagewas1.06 per cent and mean pH was 6.22. Theexperiment was conducted in 2006-07 and 2007-08 in both the villages. Experiment was conductedon 6 farmers’ field in village Bagrihat and on 5farmers’ field in village Egyardevi. All the selectedfarmers had 2-3 livestock so that enriched manurecould be generated. The different treatments usedwere as under:
T-1: Farmer’s practice.
T-2 : 20 t/ha FYM to rice and 20 t/ha FYM towheat + PSB
T-2: 20 t/ha FYM to rice+ Azotobacter +Azospirillum and 20 t/ha FYM to wheat +Azotobacter + Azospirillum+ PSB.
Enrichment of compost was done by PSB,azotobacter and azospirillum during composting.Sowing of rice nursery was done on 1st Mayduring both the years, for it sprouted seeds weresown. The local basmati variety whose aroma ispreferred by the farmers was grown. 35 d old riceseedlings were transplanted with the spacing of15x15 cm . Sowing of wheat was done on 16th ofOctober in 2006 and on 14th of October in 2007and harvesting of wheat was done from 15 to 20April in village Bagrihat and from 5th to 10th Mayin Village Egyardevi. In rice crop local scentedvarieties were grown while in wheat crop varietyVL-616 was grown. Plant growth parameters likeplant height, number of tillers were recorded, andseed yield is expressed at 14 per cent moisturelevel. Following plant protection measures werepracticed to control weeds, insects and diseasesin both the villages.
i). To control weeds two hand weeding were
done, first at 30 d after transplanting andsecond after 55 d after transplanting in riceand in wheat two hand weeding at 35 and 65d after sowing was done.
ii). To control insect pests in rice crop 20Pheromone traps per hectare at an distance of20x 25 m were placed after one week oftransplanting for control of stem borer, andthe lure was replaced after 30 d. The heightof trap was maintained at 30 cm above cropcanopy. In wheat no occurrence of insect pestwas observed.
iii). In rice crop spraying of mixed formulation ofcompatible strains of Pseodomonasfluorescence+ Ttrichoderma harzianum @ 5g/l at panicle initiation for control of sheathblight, sheath rot, and neck blast was done.Three sprays were done at 10 d interval. Inwheat crop no measures were taken as therewas no occurrence of insect and diseases.
RESULTS AND DISCUSSION
Farmers’ Practice Farmers of the village Bagrihat grow rice with
the average FYM application of 10 t/ha., while inthe village Egyardevi the average use of FYM was8 t/ha. Bio-fertilizer was not used in both thevillages in both crops. In wheat crop FYMapplication rate was 8 t/ha in both the villages.No chemical fertilizer was applied and no insectand pest control measures were followed in boththe villages.
Soil PropertiesThe pH range of soils of village Bagrihat was
acidic in nature, while that of village Egyardevi itwas acidic to neutral. The organic carbon per centin soil of both the villages was in high range butdue to prevailing cold temperature itsmineralization was influenced. Wide spreaddeficiencies of nitrogen were visible in wheat cropfrom December to February due to slowmineralization. Available potassium in soil wasalso in high range in both the villages. There wasvery minimal change in soil properties after twoyears of experimentations (Table 1).
Rice YieldRice crop in village Bagrihat was taken under
Kumar and Mahapatra
J Krishi Vigyan 2014, 3(1) : 67-70
69
rainfed condition during 2006 as the cementedirrigation channel was damaged, while during2007 it was grown under irrigated condition. Invillage Egyardevi rice crop was grown inrestricted irrigation condition, irrigation wasprovided only when rain water scarcity was there.Mean plant height in village Bagrihat was120.8cm and 140.7cm during year 2006 and2007, respectively (Table 2). The number of tillers/hill were also higher in 2007 as compared to year2006. The mean grain yield of local scented ricein village Bagrihat was higher in 2007 as comparedto 2006. Among the treatments, T-3 recordedhighest grain yield in both the years and it was7.3 and 13.7 per cent higher than farmers’ practicein 2006 and 2007 respectively. Similarly, invillage Egyardevi higher plant height, number oftillers and grain yield was recorded with treatmentT-3 during both the years (Table 2). Treatment T-3 recorded 5.7 and 14.9 per cent higher yield overtreatment T-1 during 2006 and 2007 respectively.Similar findings under organic practices were alsoreported by Mahapatra et al (2006).
Wheat YieldWheat crop in both the villages was grown
under rainfed condition as the irrigation in boththe villages is dependent on natural springs andthese dry up in winter and summer months. Invillage Bagrihat higher plant height and number
Table-1: Initial and final soil properties of villages Bagrihat and Egyardevi.
Soil Parameters Village Bagrihat Village Egyardevi Initial Value Final Value Initial Value Final Value
Mean Range Mean Range Mean Range Mean RangepH 6.22 5.68-6.52 6.22 5.67-6.51 6.96 6.75-7.09 6.95 6.75-7.06EC (ds/m) 0.03 0.002-0.05 0.03 0.002-0.05 0.06 0.05-0.08 0.06 0.05-0.08Organic Carbon (%) 1.06 0.36-1.56 1.08 0.40-1.60 1.98 1.83-2.15 1.95 1.73-2.10Available K (Kg/ha) 253.12 196.0-288.94 250.1 192.0-283.4 285.6 241.9-369.6 283.7 238.9-366.7
of tillers were recorded in treatment T-3 ascompared to T-2 and T-1(Table 3). Higher grainyield was also recorded under treatment T-3 andit was 16.7 and 11.7 per cent higher over farmers’practice (T-1) during 2006 and 2007, respectively.In village Egyardevi higher plant height, numberof tillers and grain yield was recorded undertreatment T-3 as compared to T-2 and T-1 (Table3). The wheat grain yield under treatment T-3 was17.4 and 17.3 per cent higher over treatment T-1during 2006 and 2007, respectively. Applicationof well decomposed enriched FYM helped inhigher nutrient availability and results higher grainyield of wheat crop. The results were inconformity with the findings of Patro et al(2005).
CONCLUSIONIn the view of the results obtained in this study
it may be concluded that inoculation of FYM withbiofertilizers holds promise for organic farmingof scented rice and wheat.
ACKNOWLEDGEMENTThe authors are grateful to Department of
Agriculture, Government of Uttarakhand forproviding financial assistance to carry out thisinvestigation under the project “ Development ofOrganic package of practice for various farmingsituations of Uttarakhand”
Table 2. Growth, yield attributes and yield of rice as influenced by various organic treatments.
Treatments Village- Bagrihat Village-EgyardeviPlant height Number Grain Plant Number of Grainat of tillers/ yield height at tillers/ hill yieldharvest (cm) hill at harvest (q/ha) harvest (cm) at harvest (q/ha)2006 2007 2006 2007 2006 2007 2006 2007 2006 2007 2006 2007
T-1 117.8 137.3 3.0 5.5 17.8 27.8 113.0 119.5 3.0 3.8 17.6 19.5T-2 121.3 140.5 3.5 6.7 18.4 29.5 115.6 124.2 3.0 4.6 18.1 21.2T-3 123.3 144.2 3.8 7.2 19.1 31.6 119.0 126.4 3.4 5.2 18.6 22.4
Enriched Compost Application in Rice Wheat Cropping Sequence
J Krishi Vigyan 2014, 3(1) : 67-70
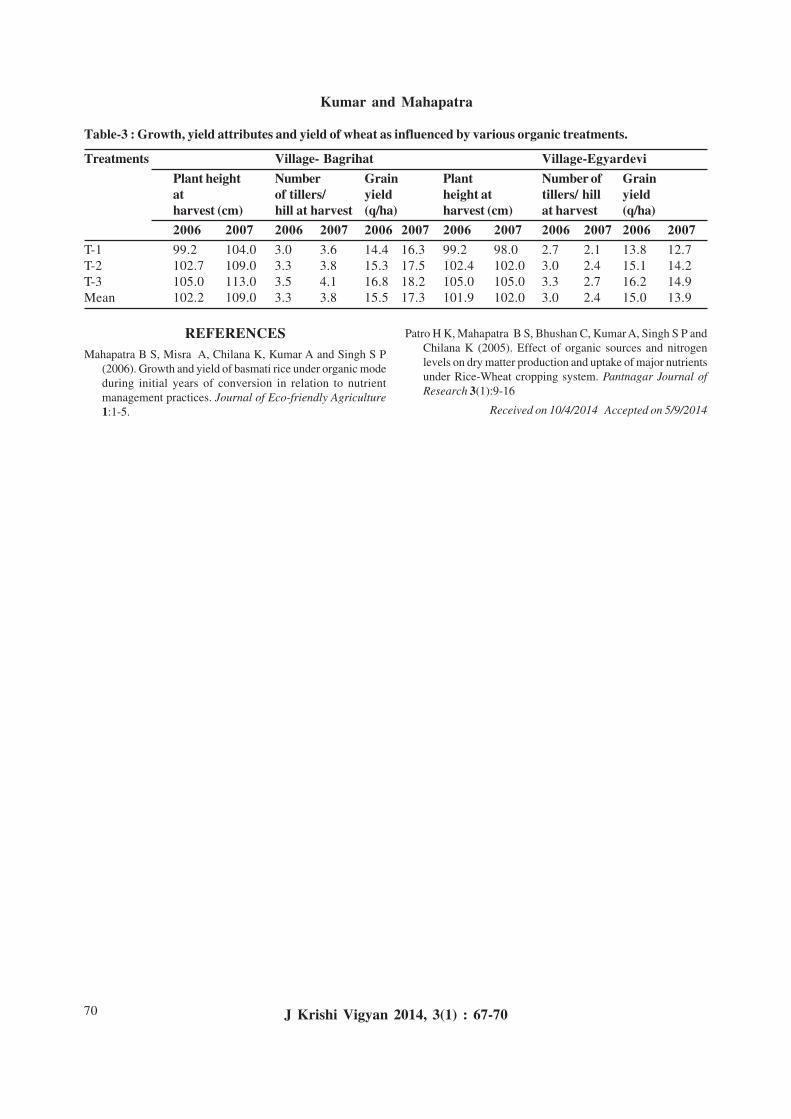
70
REFERENCESMahapatra B S, Misra A, Chilana K, Kumar A and Singh S P
(2006). Growth and yield of basmati rice under organic modeduring initial years of conversion in relation to nutrientmanagement practices. Journal of Eco-friendly Agriculture1:1-5.
Table-3 : Growth, yield attributes and yield of wheat as influenced by various organic treatments.
Treatments Village- Bagrihat Village-EgyardeviPlant height Number Grain Plant Number of Grainat of tillers/ yield height at tillers/ hill yieldharvest (cm) hill at harvest (q/ha) harvest (cm) at harvest (q/ha)2006 2007 2006 2007 2006 2007 2006 2007 2006 2007 2006 2007
T-1 99.2 104.0 3.0 3.6 14.4 16.3 99.2 98.0 2.7 2.1 13.8 12.7T-2 102.7 109.0 3.3 3.8 15.3 17.5 102.4 102.0 3.0 2.4 15.1 14.2T-3 105.0 113.0 3.5 4.1 16.8 18.2 105.0 105.0 3.3 2.7 16.2 14.9Mean 102.2 109.0 3.3 3.8 15.5 17.3 101.9 102.0 3.0 2.4 15.0 13.9
Patro H K, Mahapatra B S, Bhushan C, Kumar A, Singh S P andChilana K (2005). Effect of organic sources and nitrogenlevels on dry matter production and uptake of major nutrientsunder Rice-Wheat cropping system. Pantnagar Journal ofResearch 3(1):9-16
Received on 10/4/2014 Accepted on 5/9/2014
Kumar and Mahapatra
J Krishi Vigyan 2014, 3(1) : 67-70
71
Protected Nursery Aided Popularization of Jehlum –A High Yielding Rice Variety to Enhance
Productivity and Profitability under Mid AltitudeTemperate Conditions of Kashmir Valley
T Mubarak and F A SheikhKrishi Vigyan Kendra-Kulgam (Pombay)
Sher- e- Kashmir University of Agricultural Sciences and Technology of Kashmir, Jammu andKashmir-192233( J & K)
ABSTRACTTemperature fluctuations and lower night temperature during April and May not only posegreat threat to paddy nurseries but also results in slow growth of seedlings, which delays ricetransplanting in temperate Kashmir valley. The farmers of mid altitude alleviations growtraditional varieties like K-332 and Kohsar, which have low yield potential. Jhelum, a highyielding rice cultivar famous for yield potential and quality in the planes of valley is nowoccupying maximum area under mid altitude temperate conditions. The adaption of ModifiedProtected nursery, to save nursery from climatic vagaries and to simultaneously provide robustand healthy seedlings in a short period, ensures early transplanting and boost the yield potentialof the variety in mid altitudes. In view of this-on-farm trials on modified protected nursery(Improved practice) verses open nursery (Farmers’ practice) were conducted at Farmers’ field.In modified protected nursery the medium consisted of a 20-25 cm layer of soil, sand, organicmanure and ash mixed in the ratio of 2:2:1:1, which was laid on polythene sheet. Nursery waskept covered with polythene during cloudy/rainy days and also during night hours particularlyfor initial 10-15 days after sowing. Seedlings under protected nursery technique were healthyand robust and ready for transplanting 8-10 days earlier compared to farmers’ practice. Yieldattributes and grain yield improved appreciably in improved practice over farmers’ practice.Panicles/m2(387), grains/panicle (85) and 1000 gain weight (22.9g) were higher in protectedpractice as compared to farmers’ practice. Grain yield was more (61.7q/ha) in the improvedpractice. An increase in the grain yield to the tune of 12 per cent with wet profit (Rs.61,240/ha) and B:C ratio (2.4:1) was recorded in the improved practice of modified protected nursery asagainst net returns of Rs. 53,580/ha and B: C ratio (2.1:1) in farmers’ practice.
Key Words: Protected Nursery, Jehlum, High Yielding Rice, Productivity, Profitability, MidAltitude.
INTRODUCTIONDespite the fact that India has largest area
under rice in the world, the productivity level ofrice (2.2 t/ha) in the country is far below the worldaverage of 4 t/ha (Dass and Chandra, 2012). Manybiotic and abiotic factors are responsible for this.Temperature fluctuations and lower nighttemperature during April and May not only posegreat threat to paddy nurseries but also results in
slow growth of seedlings, which delays ricetransplanting in temperate Kashmir valley. Thefarmers of mid altitude alleviations(1600-1850ma.m.s.l.) grow traditional varieties like K-332 andKohsar, which have low grain as well as strawyield potential. Jhelum, a high yielding ricecultivar famous for yield potential and quality inthe planes of valley has been successfullydemonstrated for last six years , The variety has
J Krishi Vigyan 2014, 3(1) : 71-74 DOI: 10.5958/2349-4433.2014.01254.9
*Corresponding Author’s Email : [email protected]
J Krishi Vigyan 2014, 3(1) : 71-74
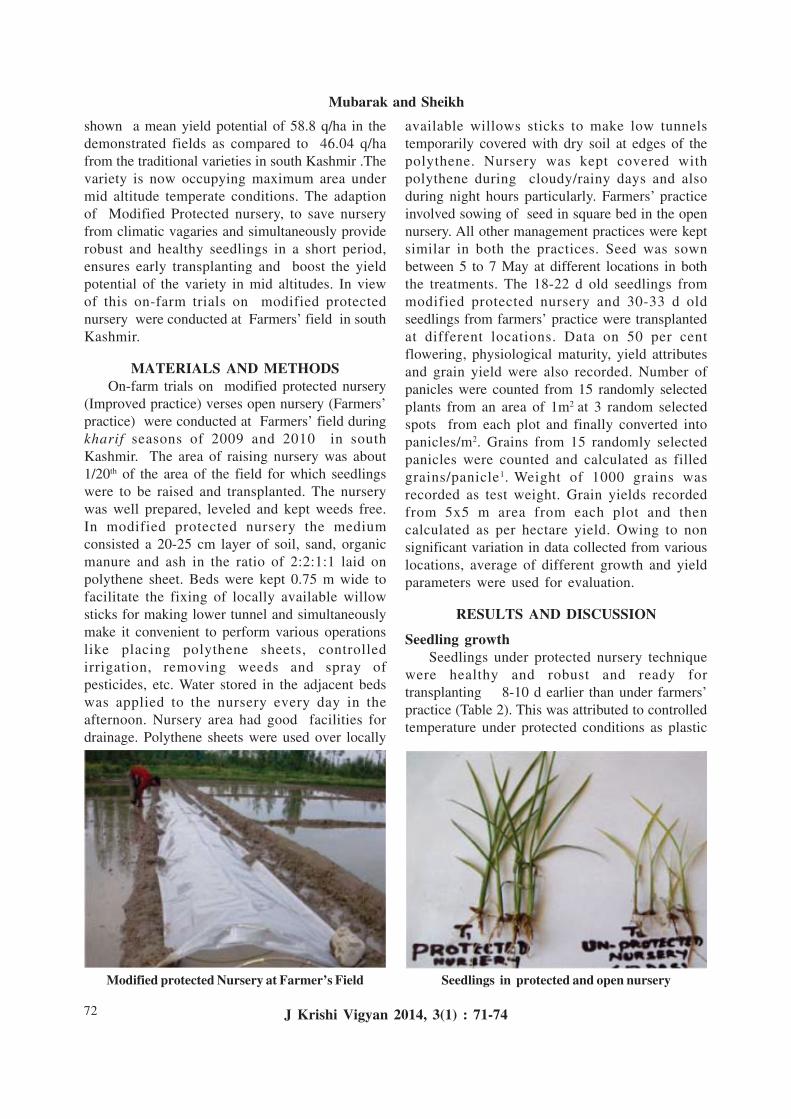
72
shown a mean yield potential of 58.8 q/ha in thedemonstrated fields as compared to 46.04 q/hafrom the traditional varieties in south Kashmir .Thevariety is now occupying maximum area undermid altitude temperate conditions. The adaptionof Modified Protected nursery, to save nurseryfrom climatic vagaries and simultaneously providerobust and healthy seedlings in a short period,ensures early transplanting and boost the yieldpotential of the variety in mid altitudes. In viewof this on-farm trials on modified protectednursery were conducted at Farmers’ field in southKashmir.
MATERIALS AND METHODSOn-farm trials on modified protected nursery
(Improved practice) verses open nursery (Farmers’practice) were conducted at Farmers’ field duringkharif seasons of 2009 and 2010 in southKashmir. The area of raising nursery was about1/20th of the area of the field for which seedlingswere to be raised and transplanted. The nurserywas well prepared, leveled and kept weeds free.In modified protected nursery the mediumconsisted a 20-25 cm layer of soil, sand, organicmanure and ash in the ratio of 2:2:1:1 laid onpolythene sheet. Beds were kept 0.75 m wide tofacilitate the fixing of locally available willowsticks for making lower tunnel and simultaneouslymake it convenient to perform various operationslike placing polythene sheets, controlledirrigation, removing weeds and spray ofpesticides, etc. Water stored in the adjacent bedswas applied to the nursery every day in theafternoon. Nursery area had good facilities fordrainage. Polythene sheets were used over locally
available willows sticks to make low tunnelstemporarily covered with dry soil at edges of thepolythene. Nursery was kept covered withpolythene during cloudy/rainy days and alsoduring night hours particularly. Farmers’ practiceinvolved sowing of seed in square bed in the opennursery. All other management practices were keptsimilar in both the practices. Seed was sownbetween 5 to 7 May at different locations in boththe treatments. The 18-22 d old seedlings frommodified protected nursery and 30-33 d oldseedlings from farmers’ practice were transplantedat different locations. Data on 50 per centflowering, physiological maturity, yield attributesand grain yield were also recorded. Number ofpanicles were counted from 15 randomly selectedplants from an area of 1m2 at 3 random selectedspots from each plot and finally converted intopanicles/m2. Grains from 15 randomly selectedpanicles were counted and calculated as filledgrains/panicle1. Weight of 1000 grains wasrecorded as test weight. Grain yields recordedfrom 5x5 m area from each plot and thencalculated as per hectare yield. Owing to nonsignificant variation in data collected from variouslocations, average of different growth and yieldparameters were used for evaluation.
RESULTS AND DISCUSSION
Seedling growthSeedlings under protected nursery technique
were healthy and robust and ready fortransplanting 8-10 d earlier than under farmers’practice (Table 2). This was attributed to controlledtemperature under protected conditions as plastic
Mubarak and Sheikh
J Krishi Vigyan 2014, 3(1) : 71-74
Seedlings in protected and open nurseryModified protected Nursery at Farmer’s Field
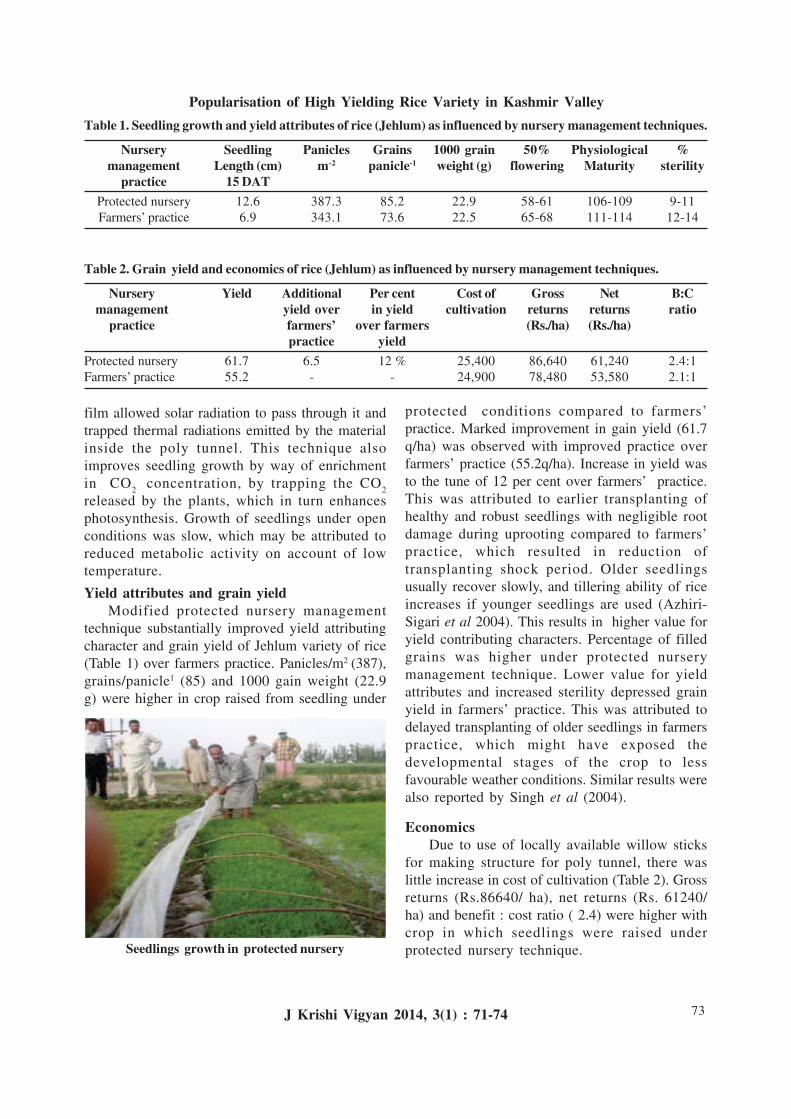
73
film allowed solar radiation to pass through it andtrapped thermal radiations emitted by the materialinside the poly tunnel. This technique alsoimproves seedling growth by way of enrichmentin CO
2 concentration, by trapping the CO
2
released by the plants, which in turn enhancesphotosynthesis. Growth of seedlings under openconditions was slow, which may be attributed toreduced metabolic activity on account of lowtemperature.
Yield attributes and grain yieldModified protected nursery management
technique substantially improved yield attributingcharacter and grain yield of Jehlum variety of rice(Table 1) over farmers practice. Panicles/m2 (387),grains/panicle1 (85) and 1000 gain weight (22.9g) were higher in crop raised from seedling under
protected conditions compared to farmers’practice. Marked improvement in gain yield (61.7q/ha) was observed with improved practice overfarmers’ practice (55.2q/ha). Increase in yield wasto the tune of 12 per cent over farmers’ practice.This was attributed to earlier transplanting ofhealthy and robust seedlings with negligible rootdamage during uprooting compared to farmers’practice, which resulted in reduction oftransplanting shock period. Older seedlingsusually recover slowly, and tillering ability of riceincreases if younger seedlings are used (Azhiri-Sigari et al 2004). This results in higher value foryield contributing characters. Percentage of filledgrains was higher under protected nurserymanagement technique. Lower value for yieldattributes and increased sterility depressed grainyield in farmers’ practice. This was attributed todelayed transplanting of older seedlings in farmerspractice, which might have exposed thedevelopmental stages of the crop to lessfavourable weather conditions. Similar results werealso reported by Singh et al (2004).
EconomicsDue to use of locally available willow sticks
for making structure for poly tunnel, there waslittle increase in cost of cultivation (Table 2). Grossreturns (Rs.86640/ ha), net returns (Rs. 61240/ha) and benefit : cost ratio ( 2.4) were higher withcrop in which seedlings were raised underprotected nursery technique.
Popularisation of High Yielding Rice Variety in Kashmir Valley
J Krishi Vigyan 2014, 3(1) : 71-74
Seedlings growth in protected nursery
Table 1. Seedling growth and yield attributes of rice (Jehlum) as influenced by nursery management techniques.
Nursery Seedling Panicles Grains 1000 grain 50% Physiological %management Length (cm) m-2 panicle-1 weight (g) flowering Maturity sterility
practice 15 DATProtected nursery 12.6 387.3 85.2 22.9 58-61 106-109 9-11Farmers’ practice 6.9 343.1 73.6 22.5 65-68 111-114 12-14
Table 2. Grain yield and economics of rice (Jehlum) as influenced by nursery management techniques.
Nursery Yield Additional Per cent Cost of Gross Net B:Cmanagement yield over in yield cultivation returns returns ratio
practice farmers’ over farmers (Rs./ha) (Rs./ha)practice yield
Protected nursery 61.7 6.5 12 % 25,400 86,640 61,240 2.4:1Farmers’ practice 55.2 - - 24,900 78,480 53,580 2.1:1
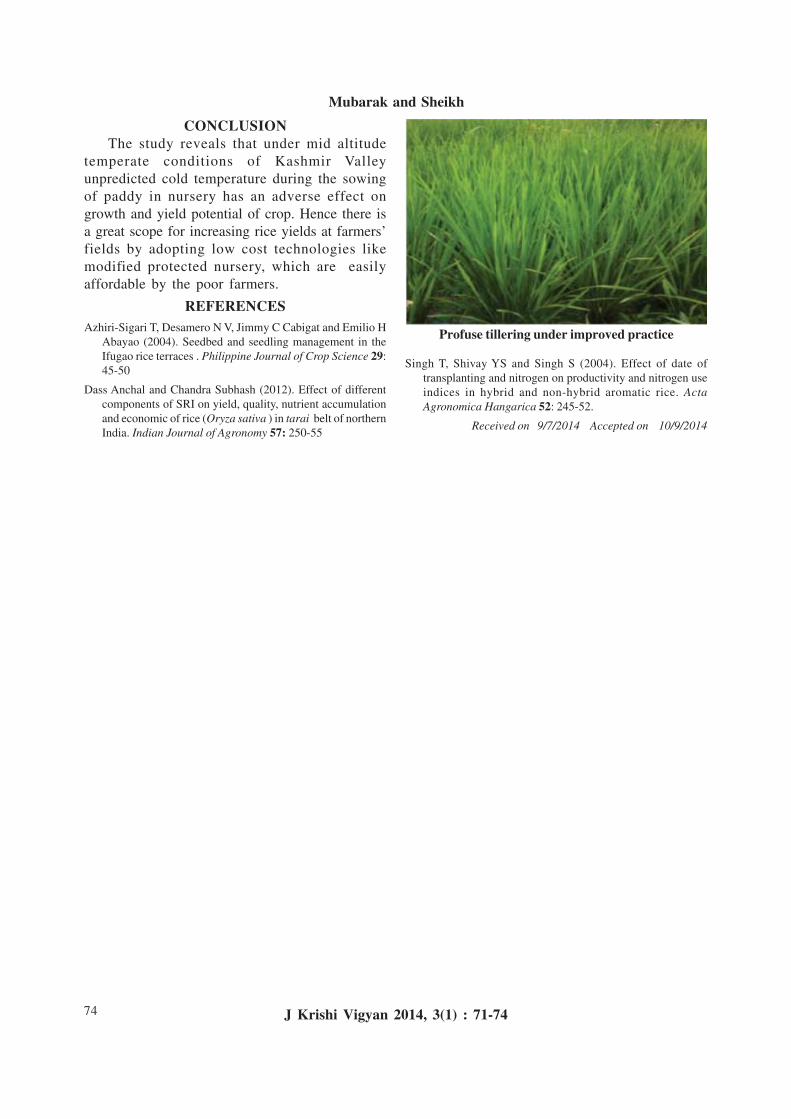
74
CONCLUSIONThe study reveals that under mid altitude
temperate conditions of Kashmir Valleyunpredicted cold temperature during the sowingof paddy in nursery has an adverse effect ongrowth and yield potential of crop. Hence there isa great scope for increasing rice yields at farmers’fields by adopting low cost technologies likemodified protected nursery, which are easilyaffordable by the poor farmers.
REFERENCESAzhiri-Sigari T, Desamero N V, Jimmy C Cabigat and Emilio H
Abayao (2004). Seedbed and seedling management in theIfugao rice terraces . Philippine Journal of Crop Science 29:45-50
Dass Anchal and Chandra Subhash (2012). Effect of differentcomponents of SRI on yield, quality, nutrient accumulationand economic of rice (Oryza sativa ) in tarai belt of northernIndia. Indian Journal of Agronomy 57: 250-55
Mubarak and Sheikh
J Krishi Vigyan 2014, 3(1) : 71-74
Profuse tillering under improved practice
Singh T, Shivay YS and Singh S (2004). Effect of date oftransplanting and nitrogen on productivity and nitrogen useindices in hybrid and non-hybrid aromatic rice. ActaAgronomica Hangarica 52: 245-52.
Received on 9/7/2014 Accepted on 10/9/2014
75
Quality of Groundwater for Irrigation in PhagwaraBlock of District KapurthalaKuldip Singh, Onkar Singh1 and Gobinder Singh2
Department of Soil Science Punjab Agricultural University, Ludhiana-141004 (Punjab)
ABSTRACTTwenty groundwater samples were collected from Phagwara block of Kapurthala district ofPunjab during the pre-monsoon season. These water samples were tested for major cations andanions which are important from irrigation point of view. To determine the suitability ofgroundwater of Phagwara for irrigation purpose, the parameters like electrical conductivity(EC) and residual sodium carbonate (RSC) were calculated on the basis of chemical data.Based on EC and RSC values together, it was found that 40 per cent water samples were fit, 40per cent were marginal and 20 per cent were unfit for irrigation purpose. A large proportion ofsamples falling in marginal and unfit category indicate the need of water testing for sustainablecrop production without deteriorating the soil health. Irrigation water having problem of sodicityshould be used along with application of inorganic (gypsum) or organic (FYM) amendments.
Key Words: Groundwater Quality, Irrigation Water, Residual Sodium Carbonate, ElectricalConductivity.
INTRODUCTIONGroundwater is being used for irrigation
purpose in the state of Punjab. Water is an essentialnatural resource for sustaining life and theenvironment that is typically thought to beavailable in abundance. Fresh water occurs assurface water and groundwater. Thoughgroundwater contributes only 0.6 per cent of thetotal water resources on earth, it is the major andpreferred source of drinking water in rural as wellas urban areas, particularly in developingcountries like India (Nash, 1995). It caters to 80per cent of the total drinking water requirementand 50 per cent of agricultural requirement in ruralIndia.
Irrigation water quality refers to the kind andamount of salts present in the water and theireffects on crop growth and development. Salts arepresent in variable concentrations in all waters,and the salt concentrations influence osmoticpressure of the soil solution: higher theconcentration, greater the osmotic pressure.Osmotic pressure in turn affects the ability of
plants to absorb water through their roots. Plantscan absorb water readily when osmotic pressureis low, but absorption becomes more difficult asthe pressure increases. Even if the soil isthoroughly wet, plant roots have difficulty inabsorbing water when the osmotic pressure ishigh. When the pressure is unusually high, it mayeven be impossible for plants to absorb sufficientwater for normal plant growth. Under theseconditions, plants may actually wilt when the rootsare in water.
Irrigation water quality is determined inseveral ways, including the degree of acidity oralkalinity (pH), electrical conductivity (EC),residual sodium carbonate (RSC) and sodiumadsorption ratio (SAR). The deterioration ofgroundwater quality as well as decline in watertable is one of the factors responsible for variousproblems in central districts of Indian Punjabincluding Kapurthala. Therefore, the presentinvestigation was undertaken to assess the qualityof groundwater for irrigation purposes inPhagwara block of Kapurthala district of Punjab.
*Corresponding Author’s Email: [email protected] , Regional Research Station, Kapurthala2Assistant Professor ( Soil Science) KVK, Kapurthala
J Krishi Vigyan 2014, 3(1) : 75-78 DOI: 10.5958/2349-4433.2014.01255.0
J Krishi Vigyan 2014, 3(1) : 75-78
76
Site descriptionPhysiography: Kapurthala district is situated inthe Bist Doab and comprises two non-contiguousparts, separated by some 32 km. Kapurthala,Sultanpur Lodhi and Bholath tehsils form one partand Phagwara Tehsil, the second separatedportion. The former area lies between northlatitude 310 07’ and 310 39’ and east longitude740 55’ and 750 36’. Total geographical area ofthe district is 1633 sq.km. The climate of thedistrict is characterised by general dryness exceptfor a short period during south-west monsoonseason. The normal annual rainfall of the districtis 779 mm, which is distributed over 33 d in ayear. The numerous hill streams coming down fromHoshiarpur District keep the soil moist all the yearround. Some of these streams are silt laden and atfirst deposit fertile soil though their later depositsare more and more sandy.
Hydrogeology: The district is occupied by Indo-Gangetic alluvial plain of quaternary age. Inalluvium thin, granular zones exist down to theentire thickness. The top aquifer ranges from 20to 45 m. The depth of the top aquifer in the north,south and central parts is 40, 45 and 20mrespectively. The top granular zone is interspersedby 2 to 3 thin clay lenses. A thick clay bed ofthickness from 15 to 35m is present beneath theGranular zone. Broadly it indicates that six toseven prominent sand horizons exist down to 300m. and are separated by thick clay layers. Thegranular material is comprised of fine to coarsesand and are between 12 to 21m bgl. with deeperwater levels in the southern part of the block placesmixed with gravel and pebble. In Phagwara blockground water decline is 0.4 to 0.7 m yr-1 (CGWB,2007). The overall flow of ground water is fromnorth to southeast direction.
MATERIALS AND METHODSTwenty groundwater samples were collected
during March 2014 from Phagwara block ofKapurthala district. Water samples were collectedfrom different alluvial aquifers representing soilassociations of Phagwara block of Kapurthaladistrict (Sidhu et al 1995). Water samples werecollected in clean polyethylene bottles of 250 mlcapacity. At the time of sampling, bottles werethoroughly washed 2–3 times with groundwater
to be sampled. In the case of bore wells the watersamples were collected after pumping for 30 min.This was done to remove groundwater stored inthe well. Samples were analyzed for pH, EC, totaldissolved solids, bicarbonate, calcium plusmagnesium and chloride as per the standardprocedures given in American Public HealthAssociation (APHA, 1998) within 24 h ofsampling. The reliability of pH analysis waschecked after every ten samples using standardbuffer solutions of pH 7.0 and 9.2, whereas thatof EC analysis was checked using standard ECsolution provided by M/s Crison Instruments SAhaving EC = 1413 µS cm-1. Overall, measurementreproducibility and precision for each analysis wasless than 2 per cent.
RESULTS AND DISCUSSION
Groundwater chemistryThe suitability of groundwater for agricultural
purposes can be better understood by studyingthe effect of different factors such as seasonalvariations. Statistical parameters derived from thechemical analysis of water samples collected fromPhagwara block of Kapurthala district of Punjabare presented in Table 1.
pHThe hydrogen ion concentration (pH) of water
is a measure of its acidity or alkalinity. A neutralpH, neither acid nor alkaline, is 7.0; waters withpH below 7 are acidic and above 7 are alkaline. ApH of 8.5 or higher is a good indication that thewater is high in soluble salts. Using waters withhigh pH may require special cropping andirrigation practices. In Phagwara block, thegroundwater was found to be alkaline in naturewith an average pH of 7.6.
Electrical Conductivity (EC)The total concentration of salts in the irrigation
water is measured by the electrical currentconducted by the ions in solution. Thismeasurement is expressed as electricalconductivity or EC × 106. EC is an estimate of thequantity of salts in solution and is normallyexpressed in parts per million (ppm). The higherthe salt concentration the higher the EC. In ourstudy, the electrical conductivity (EC) ranged from
Singh et al
J Krishi Vigyan 2014, 3(1) : 75-78
77
650 to 1300 µS cm-1 with a mean of 960 µS cm-1.Hundred per cent water samples had EC < 2000µS cm-1 and thus could be used for irrigationwithout any possible risk of soil salinization (Table2). Therefore, electrical conductivity does notseem to be the major problem of this area.
Residual Sodium Carbonate (RSC)Water containing a carbonate plus bicarbonate
concentration greater than the calcium plusmagnesium concentration have what is termed“residual sodium carbonate” [RSC = (CO
3 +
HCO3) “ (Ca + Mg)]. The potential for a sodium
hazard is increased as RSC increases, and muchof the calcium and sometimes the magnesium isprecipitated out of solution when water is appliedto the soil. Salts become concentrated when thesoil dries out, as less soluble ions such as calciumand magnesium tend to precipitate out and areremoved from the solution. The sodiumpercentage increases when calcium andmagnesium are removed from the solution,increasing the rate of sodium adsorption on soilparticles. Waters having high chlorides andsulphates do not cause as much change in theRSC, as chlorides and sulphates are more solublethan carbonates and bicarbonates.
Alkalinity is a measure of the ability ofgroundwater to neutralize acids to the equivalencepoint of carbonate or bicarbonate. Carbonates wereabsent in all the samples. Bicarbonate representsthe major source of alkalinity in the water.Bicarbonates ranged from 5 to 10.4 meqL-1 witha mean value of 7.8 meq L-1 (Table 1). Slightvariations were generally observed in the spatialdistribution of HCO
3-, these variations were
significant at certain locations. It may be due tocontribution from carbonate lithology. Chlorideshowed a large variation between minimum andmaximum values and expressed high standarddeviation. This inference not only suggests thatthe water chemistry in the study region is nothomogeneous but also reveal the influences ofcomplex contamination sources and geochemicalprocess. Calcium + Magnesium concentrationvaried from 3.8to 6.9 meq L-1 with an averagevalue of 4.8 in the Phagwara.
The increasing concentration of carbonatesand bicarbonates in irrigation water results in the
precipitation of calcium and magnesium and thusenhance the sodium saturation of soil. Thereforethe residual sodium carbonate (RSC) concept ofEaton (1950) has a merit of judging the suitabilityof water for irrigation. The RSC of undergroundirrigation water of Phagwara block varied from -1.7 to 6.1 meq L-I with a mean value of 3.1 (Table1). In this block 40, 40 and 20 per cent of thesamples tested RSC < 2.5 (safe), 2.5 to 5.0(marginal) and > 5.0 meq L-1 (unsafe), respectively(Table 2). In general irrigation water having RSCvalues greater than meq L-1 has been observed tobe harmful for soil properties and crop growthand such water is declared unsafe for irrigationpurposes (Bhumbla and Abrol, 1972).
The suitability of groundwater for agriculturalpurposes depends on the amount of variouschemical constituents in it. Salts may harm plantgrowth physically by limiting the uptake of waterthrough modification of the osmotic processes,or chemically by metabolic reactions such as thosecaused by toxic-constituents (Todd, 2007). Theimportant chemical constituents that affect thesuitability of water for irrigation are the totalconcentration of dissolved salts (EC), relativeproportion of bicarbonate to calcium, magnesium(RSC) and relative proportion of sodium tocalcium. Water quality problems in irrigationinclude salinity and alkalinity.
Various classification systems have beenproposed for determining the quality of water forirrigation purposes. Three classification systemsproposed by different research workers were usedto classify water samples collected from thePhagwara block of Kapurthala district.
Water quality based on EC and RSC takentogether
Bhumbla and Abrol (1972) proposed acriterion for assessing the quality of water forirrigation purpose by considering the EC and RSCtogether. Residual sodium carbonate is an excessquantity of sodium bicarbonate and carbonate overcalcium and magnesium, which is detrimental tothe physical properties of soils as it causesdissolution of organic matter in the soil, which inturn leaves a black stain on the soil surface ondrying. It can be calculated as follows :
RSC= (CO3
2-+HCO3
-)-(Ca2++Mg2+) where, all
Quality of Groundwater for Irrigation
J Krishi Vigyan 2014, 3(1) : 75-78
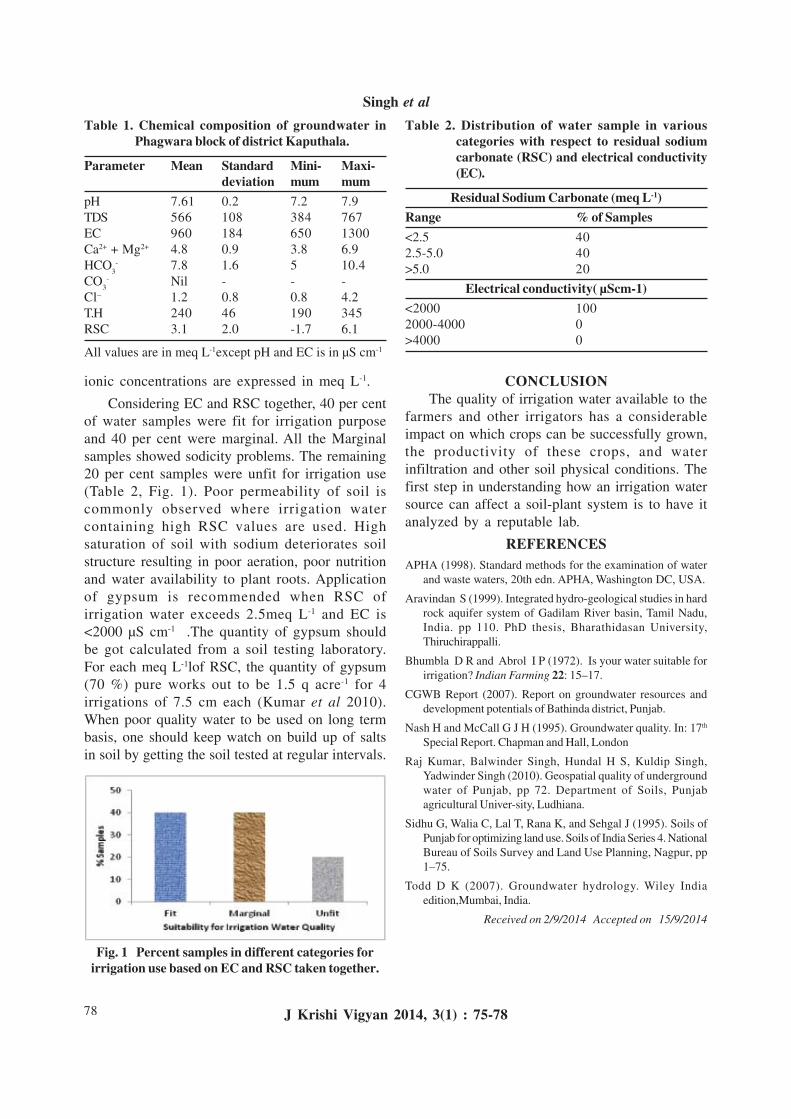
78
ionic concentrations are expressed in meq L-1.
Considering EC and RSC together, 40 per centof water samples were fit for irrigation purposeand 40 per cent were marginal. All the Marginalsamples showed sodicity problems. The remaining20 per cent samples were unfit for irrigation use(Table 2, Fig. 1). Poor permeability of soil iscommonly observed where irrigation watercontaining high RSC values are used. Highsaturation of soil with sodium deteriorates soilstructure resulting in poor aeration, poor nutritionand water availability to plant roots. Applicationof gypsum is recommended when RSC ofirrigation water exceeds 2.5meq L-1 and EC is<2000 µS cm-1 .The quantity of gypsum shouldbe got calculated from a soil testing laboratory.For each meq L-1lof RSC, the quantity of gypsum(70 %) pure works out to be 1.5 q acre-1 for 4irrigations of 7.5 cm each (Kumar et al 2010).When poor quality water to be used on long termbasis, one should keep watch on build up of saltsin soil by getting the soil tested at regular intervals.
CONCLUSIONThe quality of irrigation water available to the
farmers and other irrigators has a considerableimpact on which crops can be successfully grown,the productivity of these crops, and waterinfiltration and other soil physical conditions. Thefirst step in understanding how an irrigation watersource can affect a soil-plant system is to have itanalyzed by a reputable lab.
REFERENCESAPHA (1998). Standard methods for the examination of water
and waste waters, 20th edn. APHA, Washington DC, USA.
Aravindan S (1999). Integrated hydro-geological studies in hardrock aquifer system of Gadilam River basin, Tamil Nadu,India. pp 110. PhD thesis, Bharathidasan University,Thiruchirappalli.
Bhumbla D R and Abrol I P (1972). Is your water suitable forirrigation? Indian Farming 22: 15–17.
CGWB Report (2007). Report on groundwater resources anddevelopment potentials of Bathinda district, Punjab.
Nash H and McCall G J H (1995). Groundwater quality. In: 17th
Special Report. Chapman and Hall, London
Raj Kumar, Balwinder Singh, Hundal H S, Kuldip Singh,Yadwinder Singh (2010). Geospatial quality of undergroundwater of Punjab, pp 72. Department of Soils, Punjabagricultural Univer-sity, Ludhiana.
Sidhu G, Walia C, Lal T, Rana K, and Sehgal J (1995). Soils ofPunjab for optimizing land use. Soils of India Series 4. NationalBureau of Soils Survey and Land Use Planning, Nagpur, pp1–75.
Todd D K (2007). Groundwater hydrology. Wiley Indiaedition,Mumbai, India.
Received on 2/9/2014 Accepted on 15/9/2014
Table 1. Chemical composition of groundwater inPhagwara block of district Kaputhala.
Parameter Mean Standard Mini- Maxi-deviation mum mum
pH 7.61 0.2 7.2 7.9TDS 566 108 384 767EC 960 184 650 1300Ca2+ + Mg2+ 4.8 0.9 3.8 6.9HCO
3- 7.8 1.6 5 10.4
CO3
- Nil - - -Cl– 1.2 0.8 0.8 4.2T.H 240 46 190 345RSC 3.1 2.0 -1.7 6.1
All values are in meq L-1except pH and EC is in µS cm-1
Table 2. Distribution of water sample in variouscategories with respect to residual sodiumcarbonate (RSC) and electrical conductivity(EC).
Residual Sodium Carbonate (meq L-1)Range % of Samples<2.5 402.5-5.0 40>5.0 20
Electrical conductivity( µScm-1)<2000 1002000-4000 0>4000 0
Fig. 1 Percent samples in different categories forirrigation use based on EC and RSC taken together.
Singh et al
J Krishi Vigyan 2014, 3(1) : 75-78
79
Study on the Zooplankton Production in PondsUnder Different Fish Farming System in West Bengal
Soma Banerjee¹, Ruksa Nur2 and Sudip Barat2
Krishi Vigyan Kendra West Bengal University of Animal and Fishery Sciences, P.O+Vill- Ramsai, 735 219, District
Jalpaiguri ( West Bengal).
ABSTRACTThe present study was designed to estimate zooplankton abundance qualitatively andquantitatively in different Fish-Livestock Integrated Farming Systems (FLIFS) over the NonIntegrated Fish-Livestock Farming System (NIFLFS) in Terai region of West Bengal. Threetreatments in triplicates for four consecutive years (2008-2011) were studied in Belacoba villageof Jalpaiguri district involving nine pond of 0.01hectare (ha) namely, NIFLFS (Control): Theaquaculture was not integrated with the animal waste, FLIFS -I: Integration of cattle manurewith aquaculture and FLIFS -II: FLIFS-I+ ducks grazing on the ponds. Zooplankton sampleswere collected bimonthly from the treated ponds for the analysis (qualitatively and quantitatively).Ponds under FLIFS-II and FLIFS-I were found to contain significantly higher concentration ofzooplanktons (131±12 no l-1 and 128±11 no l-1 , respectively) than NIFLFS (27 ± 2 no l-1). Theidentified zooplanktons were under 4 orders namely copepoda, rotifera, cladocera, andDiaptomus. Dominant groups of the zooplankton available in all the samples were observed tobe Copepoda and Cladocera represented by Cyclops sp.and Daphnia sp., respectively. Totalseven and six species were identified in the FLIFS-II and FLIFS-I, respectively in comparisonto the four species in NIFLFS. In the present study the Daphnia was also significantly increasedby 32.8% and 31.8% in FLIFS-I and FLIFS-II, respectively, where frequently manure wasapplied. Again Bosmina sp. was observed to be contributing in the FLIFS-II where ducks aregrazing and the duck droppings are introduced in the ponds. Hence, it was concluded thatutilization of cow dung and duck manure for aquaculture can successfully increase the availabilityand diversity of the natural food (zooplankton) to support the growing fishes under the integrated
fish farming systems followed in the terai region of West Bengal.
Key words: Zooplankton, Integrated Fish Farming, Indian Major Carp, Grass Carp(Ctenopharyngodon idella), Organic Manure, West Bengal.
INTRODUCTIONThe plankton community is composed of
phytoplankton (primary producers) andzooplankton (secondary producers). Thephytoplankton presents biological wealth of thewater body and form the base of food chain inponds (Pokorny et al 2005). Zooplankton is aprincipal component of food for omnivorous fishthat are usually farmed in extensive aquaculture
(Brummett and Noble, 1995). Ekelemu (2010)emphasized on the fact that zooplankton is veryimportant in the food web of open water ecosystem. Damle and Chari (2011) observed thatlack of zooplankton caused poor survival ofspawn in nursery ponds. The zooplankton iscommonly divided to following groups Rotifers(Rotatoria), Cladocerans (Cladocera) andCopepods (Copepoda). Composition of
1 Corresponding Author’s Email: [email protected] and Limnology Research Unit, Department of Zoology, University of North Bengal, Siliguri, 734 013, District Darjeeling,
West Bengal.
J Krishi Vigyan 2014, 3(1) : 79-83 DOI: 10.5958/2349-4433.2014.01256.2
J Krishi Vigyan 2014, 3(1) : 79-83
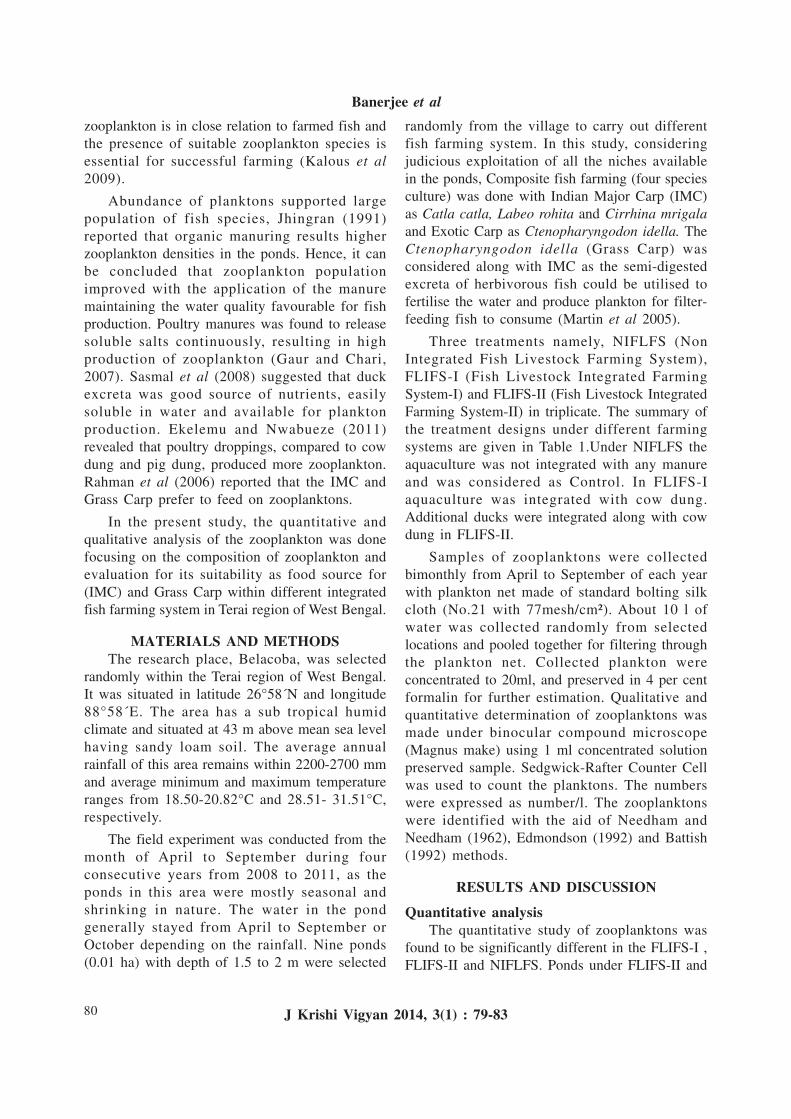
80
zooplankton is in close relation to farmed fish andthe presence of suitable zooplankton species isessential for successful farming (Kalous et al2009).
Abundance of planktons supported largepopulation of fish species, Jhingran (1991)reported that organic manuring results higherzooplankton densities in the ponds. Hence, it canbe concluded that zooplankton populationimproved with the application of the manuremaintaining the water quality favourable for fishproduction. Poultry manures was found to releasesoluble salts continuously, resulting in highproduction of zooplankton (Gaur and Chari,2007). Sasmal et al (2008) suggested that duckexcreta was good source of nutrients, easilysoluble in water and available for planktonproduction. Ekelemu and Nwabueze (2011)revealed that poultry droppings, compared to cowdung and pig dung, produced more zooplankton.Rahman et al (2006) reported that the IMC andGrass Carp prefer to feed on zooplanktons.
In the present study, the quantitative andqualitative analysis of the zooplankton was donefocusing on the composition of zooplankton andevaluation for its suitability as food source for(IMC) and Grass Carp within different integratedfish farming system in Terai region of West Bengal.
MATERIALS AND METHODSThe research place, Belacoba, was selected
randomly within the Terai region of West Bengal.It was situated in latitude 26°58´N and longitude88°58´E. The area has a sub tropical humidclimate and situated at 43 m above mean sea levelhaving sandy loam soil. The average annualrainfall of this area remains within 2200-2700 mmand average minimum and maximum temperatureranges from 18.50-20.82°C and 28.51- 31.51°C,respectively.
The field experiment was conducted from themonth of April to September during fourconsecutive years from 2008 to 2011, as theponds in this area were mostly seasonal andshrinking in nature. The water in the pondgenerally stayed from April to September orOctober depending on the rainfall. Nine ponds(0.01 ha) with depth of 1.5 to 2 m were selected
randomly from the village to carry out differentfish farming system. In this study, consideringjudicious exploitation of all the niches availablein the ponds, Composite fish farming (four speciesculture) was done with Indian Major Carp (IMC)as Catla catla, Labeo rohita and Cirrhina mrigalaand Exotic Carp as Ctenopharyngodon idella. TheCtenopharyngodon idella (Grass Carp) wasconsidered along with IMC as the semi-digestedexcreta of herbivorous fish could be utilised tofertilise the water and produce plankton for filter-feeding fish to consume (Martin et al 2005).
Three treatments namely, NIFLFS (NonIntegrated Fish Livestock Farming System),FLIFS-I (Fish Livestock Integrated FarmingSystem-I) and FLIFS-II (Fish Livestock IntegratedFarming System-II) in triplicate. The summary ofthe treatment designs under different farmingsystems are given in Table 1.Under NIFLFS theaquaculture was not integrated with any manureand was considered as Control. In FLIFS-Iaquaculture was integrated with cow dung.Additional ducks were integrated along with cowdung in FLIFS-II.
Samples of zooplanktons were collectedbimonthly from April to September of each yearwith plankton net made of standard bolting silkcloth (No.21 with 77mesh/cm²). About 10 l ofwater was collected randomly from selectedlocations and pooled together for filtering throughthe plankton net. Collected plankton wereconcentrated to 20ml, and preserved in 4 per centformalin for further estimation. Qualitative andquantitative determination of zooplanktons wasmade under binocular compound microscope(Magnus make) using 1 ml concentrated solutionpreserved sample. Sedgwick-Rafter Counter Cellwas used to count the planktons. The numberswere expressed as number/l. The zooplanktonswere identified with the aid of Needham andNeedham (1962), Edmondson (1992) and Battish(1992) methods.
RESULTS AND DISCUSSION
Quantitative analysisThe quantitative study of zooplanktons was
found to be significantly different in the FLIFS-I ,FLIFS-II and NIFLFS. Ponds under FLIFS-II and
Banerjee et al
J Krishi Vigyan 2014, 3(1) : 79-83
81
Table 1. Summary of the treatment designs under different farming system.
Treatment NIFLFS(Control) FLIFS-I FLIFS-IIComponents of farming Fish , cow and crop Fish , cow and crop Fish ,cow , duck and cropType of farming Non-integrated Integrated IntegratedNo. of ponds 3 3 3Average size of pond(ha) 0.01 0.01 0.01
Manuring No manuring Manuring @ 2600kg/ ha / Manuring @ 2600kg/ ha /ten days with ten days with cowdung
cowdung Manuring
Stocking density of 10,000 10,000 10,000fingerlings/ha
Types of fish stocked IMC+Grass carp IMC+Grass carp IMC+Grass carp
Stocking ratio 3:3:3:1 3:3:3:1 3:3:3:1
Fish feeding @ 2% of total body weight @ 2% of total body weight @ 2% of total body weightschedule with Mustard oil with Mustard oil with Mustard oil(on daily basis) cake and Rice Bran (1:1) cake and Rice Bran (1:1) cake and Rice Bran (1:1)
Type/No. of Non descriptive type, Non descriptive type, Non descriptive type,Cattle per pond 1 lactating cow 1 lactating cow 1 lactating cow
System of cattle rearing Extensive Semi extensive Semi extensiveFeeding schedule of cow 12 hours grazing with 6 hours grazing and 6 hours grazing and
3-4kg paddy straw Concentrate feed and green Concentrate feed and greengrass along with paddy straw grass along with paddy straw
System of duck rearing Nil Nil ExtensiveType/No. of ducks per pond Nil Nil Non descriptive type,
20 Ducks of 22 wks of age
Type of crop cultivated Turmeric plant Turmeric plant Turmeric plant(Patnai Variety) (Patnai Variety) (Patnai Variety)
System of cultivation Separately on On pond dykes utilizing On pond dykes utilizingagricultural field pond bottom soil pond bottom soil
Duration of Study 2008-2011(4 years) 2008-2011(4 years) 2008-2011(4 years)
Harvesting of Fish After 150 days of stocking After 150 days of stocking After 150 days of stocking
Fig 1. Trend of total Zooplankton production in thepond water during the study period from April toSeptember under NIFLFS, FLIFS-I and FLIFS-II
Table 2. Mean ± SE of zooplankton parameters underdifferent treatment
Parameters Treatments Mean ± S.E.
Zooplankton NIFLFS 27 ± 2a
FLIFS-I 128 ± 11b
FLIFS-II 131 ± 12b
Different superscript (a, b and c) bears significantdifference in the mean value.
Zooplankton Production in Ponds in West Bengal
J Krishi Vigyan 2014, 3(1) : 79-83
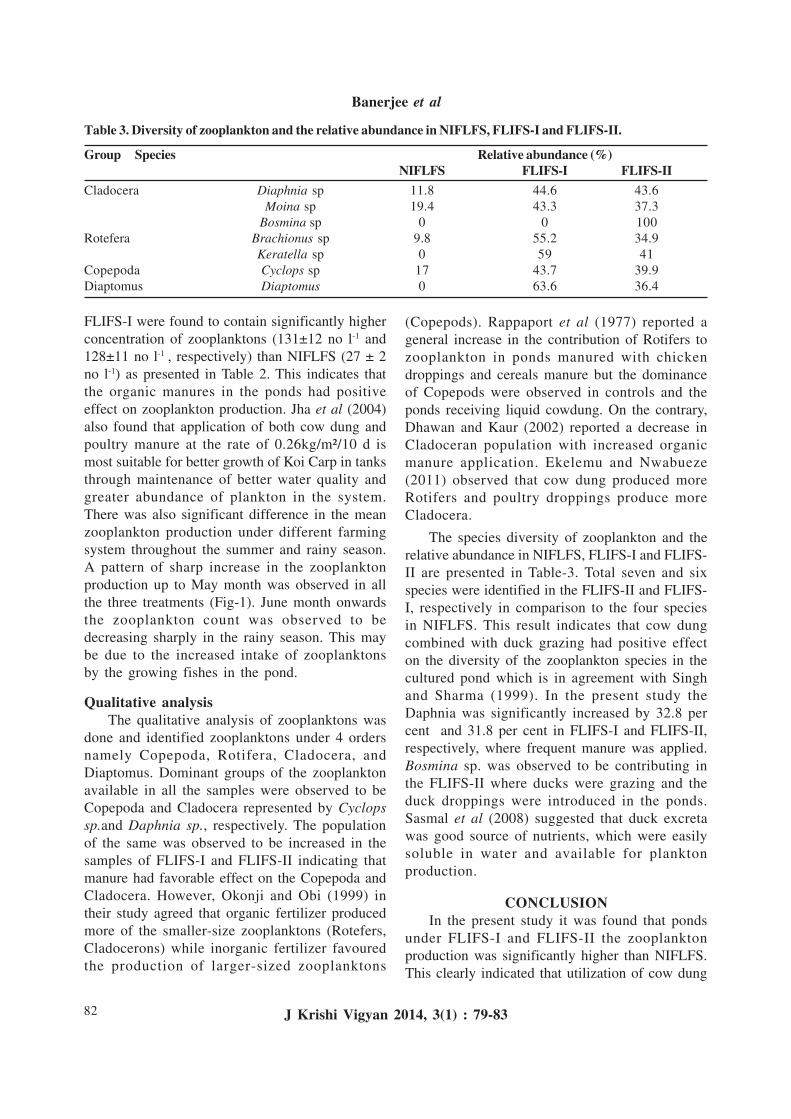
82
FLIFS-I were found to contain significantly higherconcentration of zooplanktons (131±12 no l-1 and128±11 no l-1 , respectively) than NIFLFS (27 ± 2no l-1) as presented in Table 2. This indicates thatthe organic manures in the ponds had positiveeffect on zooplankton production. Jha et al (2004)also found that application of both cow dung andpoultry manure at the rate of 0.26kg/m²/10 d ismost suitable for better growth of Koi Carp in tanksthrough maintenance of better water quality andgreater abundance of plankton in the system.There was also significant difference in the meanzooplankton production under different farmingsystem throughout the summer and rainy season.A pattern of sharp increase in the zooplanktonproduction up to May month was observed in allthe three treatments (Fig-1). June month onwardsthe zooplankton count was observed to bedecreasing sharply in the rainy season. This maybe due to the increased intake of zooplanktonsby the growing fishes in the pond.
Qualitative analysisThe qualitative analysis of zooplanktons was
done and identified zooplanktons under 4 ordersnamely Copepoda, Rotifera, Cladocera, andDiaptomus. Dominant groups of the zooplanktonavailable in all the samples were observed to beCopepoda and Cladocera represented by Cyclopssp.and Daphnia sp., respectively. The populationof the same was observed to be increased in thesamples of FLIFS-I and FLIFS-II indicating thatmanure had favorable effect on the Copepoda andCladocera. However, Okonji and Obi (1999) intheir study agreed that organic fertilizer producedmore of the smaller-size zooplanktons (Rotefers,Cladocerons) while inorganic fertilizer favouredthe production of larger-sized zooplanktons
(Copepods). Rappaport et al (1977) reported ageneral increase in the contribution of Rotifers tozooplankton in ponds manured with chickendroppings and cereals manure but the dominanceof Copepods were observed in controls and theponds receiving liquid cowdung. On the contrary,Dhawan and Kaur (2002) reported a decrease inCladoceran population with increased organicmanure application. Ekelemu and Nwabueze(2011) observed that cow dung produced moreRotifers and poultry droppings produce moreCladocera.
The species diversity of zooplankton and therelative abundance in NIFLFS, FLIFS-I and FLIFS-II are presented in Table-3. Total seven and sixspecies were identified in the FLIFS-II and FLIFS-I, respectively in comparison to the four speciesin NIFLFS. This result indicates that cow dungcombined with duck grazing had positive effecton the diversity of the zooplankton species in thecultured pond which is in agreement with Singhand Sharma (1999). In the present study theDaphnia was significantly increased by 32.8 percent and 31.8 per cent in FLIFS-I and FLIFS-II,respectively, where frequent manure was applied.Bosmina sp. was observed to be contributing inthe FLIFS-II where ducks were grazing and theduck droppings were introduced in the ponds.Sasmal et al (2008) suggested that duck excretawas good source of nutrients, which were easilysoluble in water and available for planktonproduction.
CONCLUSIONIn the present study it was found that ponds
under FLIFS-I and FLIFS-II the zooplanktonproduction was significantly higher than NIFLFS.This clearly indicated that utilization of cow dung
Table 3. Diversity of zooplankton and the relative abundance in NIFLFS, FLIFS-I and FLIFS-II.
Group Species Relative abundance (%)NIFLFS FLIFS-I FLIFS-II
Cladocera Diaphnia sp 11.8 44.6 43.6Moina sp 19.4 43.3 37.3
Bosmina sp 0 0 100Rotefera Brachionus sp 9.8 55.2 34.9
Keratella sp 0 59 41Copepoda Cyclops sp 17 43.7 39.9Diaptomus Diaptomus 0 63.6 36.4
Banerjee et al
J Krishi Vigyan 2014, 3(1) : 79-83
83
and duck manure for aquaculture can successfullyincrease the availability of the natural food tosupport the growing fishes in the integrated fishfarming systems followed in the terai region ofWest Bengal and thus can help to reduce the feedcost. It was also observed that from April to Maythere was sharp increase in the availability of thezooplankton but June onwards continuousdecreasing trend was followed along with thegrowing fishes in the cultured ponds. The findingsof the present study will help to improve themanagement strategies of the ponds culture underdifferent farming system so that the input cost canbe reduced by the utilization of the farm wasteswhich interns can control environmental pollution.
REFERENCESBattish S K (1992). Freshwater zooplankton of India, Oxford and
IBH publishing Co.Pvt. Ltd., 66 Janpath, New Delhi, 233 p.
Brummett R E and Noble R (1995). Aquaculture for African SmallHolders. ICLARM – The World Fish Center, Penang, Malaysiapp. 1–69.
Damle D K and Chari M S (2011). Performance evaluation ofdifferent animal wastes on culture of Daphnia. Sp. Journal ofFisheries and Aquatic Science 6(1):57-61.
Dhawan A and Kaur S (2002). Pig dung as pond manure: Effecton water quality, pond productivity and growth of carps inpolyculture system. Naga, The World Fish Center Quarterly25(1):11-14.
Edmondson W T (1992). Fresh-water Biology, 2nd Edition,International Books and Periodicals Supply Service, NewDelhi.
Ekelemu J K (2010). A Survey of the zooplankton community Ona Lake,Southern Nigeria. International Journal of Agriculturaland Rural Research,IJARD1(2).185-90.
Ekelemu J K and Nwabueze A A (2011). Comparative studies onzooplankton production using different types of organicmanure. International Journal of Science and Nature 2(1):140-43.
Gaur Sulochana S R and Chari M S (2007). Comparative efficiencyof organic manures as producers of fish food organism.Environ. Ecol 25:481- 83.
Jha P, Sarkar K and Barat S (2004). Effect of different applicationrates of cowdung and poultry excreta on water quality andgrowth of ornamental carp, Cyprinus Carpio vr. Koi, inconcrete tanks. Turkish Journal of Fisheries and AquaticSciences 4: 17 – 22.
Jhingran V G (1991). Fish and fisheries of India, HindustanPublishing corpertion (India) Delhi. Pp. 502-16.
Kalous L, Kurfürst J, Petrtýl M, Holíková P and Trefil P (2009).zooplankton of small ponds in integrated fish and duckproduction in bié province, angola. Agricultura Tropica EtSubtropica.42(4):197-99.
Martin S, Kumar, Thai Thanh Binh, Le Thanh Luu, Steven MClarke ( 2005). Evaluation of fish production using organicand inorganic fertiliser: Application to grass carp polyculture.Journal of Applied Aquaculture 17 (1):19.
Needham J G and Needham P R (1962). A Guide to the study ofFresh Water Biology, 5th ed Holder – Day Inc. San Francisco,Calif.
Okojni V A and Obi A (1999). Effects of three fertilizer treatmentson zooplankton productivity in plastic tanks. Indian Journalof Animal Sciences 69(5): 360-63.
Pokorny J, Prikryl I, Faina R, Kansiime F, Kaggwa R C,Kipkemboi J, Kitaka N, Denny P, Bailey R, Lamtane H A andMgaya Y D (2005). Will fish pond management principlesfrom the temperate zone work in tropical Fingerponds. In:Vymazal J.: Natural and Constructed Wetlands: Nutrients,Metals and Management, pp. 382–99. Backhuys Publishers,Leiden, The Netherlands.
Rahman M M, Verdegem M C J, Nagelkerke L A J, Wahab M A,Milstein A and Verreth J A J (2006). Growth, production andfood preference of rohu Labeo rohita ( H.) in mono cultureand in poly culture with common carp Cyprinus carpio ( L.)under fed and non –fed ponds. Aquaculture 257: 359-72.
Rappaport U, Sarig S and Bejerano Y. (1977). Observations onthe use of organic fertilizers in intensive fish farming at theGenosar station in 1976. Bamidgeh 29:57- 70.
Sasmal S, Bhunia D S and Chari M S (2008). Role of ducks forimproving nutrient levels in fish pond ecosystem. J. Agric13:104-10.
Singh V K and Sharma A P (1999). Comparative effect of threeorganic manures viz. cowdung, pigdung and poultry excretaon the growth of Labeo rohita (Ham.). J. Ijnhland Fish. Soc31(1): 1-5.
Received on 20/8/2014 Accepted on 20/9/2014
Zooplankton Production in Ponds in West Bengal
J Krishi Vigyan 2014, 3(1) : 79-83
84
Traditional Phulkari: A Successful Enterprise forRural Women in Patiala
Gurupdesh Kaur and G P S SodhiKrishi Vigyan Kendra, Patiala-147 001 (Punjab)
ABSTRACTKrishi Vigyan Kendra, Patiala is playing an important role in preserving the art of Phulakrimaking and its popularity by developing novelty items through value addition. In the presentstudy, an attempt was made to study the socio-economic profile and discuss the empowermentindicators of sixty women artisans who acquired training from the Krishi Vigyan Kendra, Patiala.The socio-economic profile of these women revealed that 53.3 per cent of them were educatedup to matriculation and above whereas 75.0 per cent were above 35 years of age. The resultsrevealed that 73.3 per cent women artisans had formed self help groups (SHG) while 26.6 percent worked individually. It was also noticed that women who formed SHGs reaped the benefitsof various developmental schemes initiated by Government of India because most of the schemesprefer a group or institution to extend the benefits of a particular scheme.
Key Words: Empowerment, Rural Women, Phulkari, Handicraft, Self Help Group.
INTRODUCTIONIndia’s rich heritage of ornamentation of
fabrics dates back to the epic age. The splendorand versatility of Indian hand printed and handembroidered fabrics glitter in every part of theworld even today. Tremendous interest arousedin the consumers in the western markets for ourtraditional textile products. It stems from an acutesensitivity to aesthetics imbibed among the peopledue to an over exposure to monotonous machinesand mass produced products. The pleasure andthe sense of satisfaction derived at owning anunique and traditional beauty is at the back ofminds of the consumers which give Indianhandicraft items a distinctive position in the eraof fast changing fashion textiles.
Malhotra (2011) reported that needle workplays a significant role in the life of women ofPunjab, it has beautiful names because of itsassociation with beautiful aspects of life. Thetraditional Punjabi embroidery art is phulkari.Now the artisans involved in embroidery work inPunjab are very keen in creating several kinds ofembroidery stitches on shawls, cardigans, scarves,table covers, cushions and bedspreads. Malik(2011) reported that a traditional phulkari was
prepared putting in a lot of hard work spannedover months and years by the elderly women ofthe household. These were presented to thedaughters of the family on their weddings.Phulkaris were made for personal adoration withpure silk floss i.e. pat . But today thecontemporary phulkaris made for morecommercial purposes have taken the shape of acommodity and are currently sold in both localand foreign markets. This new popularity is owingto their unfading lure, beauty and artistry to attractlocal and foreign buyers.
Gupta (2012) reported that women of Punjabhave developed the art of phulkari production atthe cost of some of their very precious momentsof leisure. The accomplishment of a bride and hermother and the affluence of the family were judgedby the number and elaboration of the Phulkariand the Baghs that she received as a part of hertrousseau.
Phulkari literally means flower craft. It isanalysed as “Phul’, flower and ‘kari’, work i.e.floral work. The phulkari is the embroidered shawlformerly worn by the women of Punjab. It depictsthe cultural heritage of Punjab. In Patiala, phulkari
*Corresponding Author’s Email: [email protected]
J Krishi Vigyan 2014, 3(1) : 84-87 DOI: 10.5958/2349-4433.2014.01257.4
J Krishi Vigyan 2014, 3(1) : 84-87
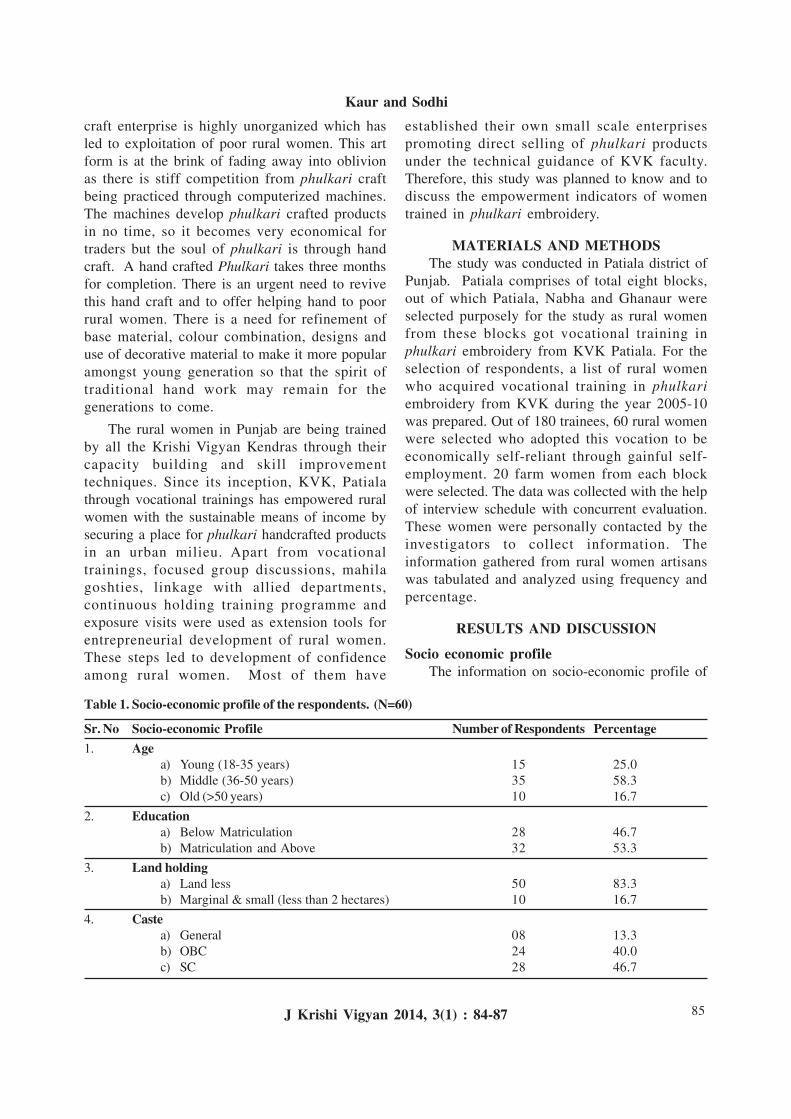
85
craft enterprise is highly unorganized which hasled to exploitation of poor rural women. This artform is at the brink of fading away into oblivionas there is stiff competition from phulkari craftbeing practiced through computerized machines.The machines develop phulkari crafted productsin no time, so it becomes very economical fortraders but the soul of phulkari is through handcraft. A hand crafted Phulkari takes three monthsfor completion. There is an urgent need to revivethis hand craft and to offer helping hand to poorrural women. There is a need for refinement ofbase material, colour combination, designs anduse of decorative material to make it more popularamongst young generation so that the spirit oftraditional hand work may remain for thegenerations to come.
The rural women in Punjab are being trainedby all the Krishi Vigyan Kendras through theircapacity building and skill improvementtechniques. Since its inception, KVK, Patialathrough vocational trainings has empowered ruralwomen with the sustainable means of income bysecuring a place for phulkari handcrafted productsin an urban milieu. Apart from vocationaltrainings, focused group discussions, mahilagoshties, linkage with allied departments,continuous holding training programme andexposure visits were used as extension tools forentrepreneurial development of rural women.These steps led to development of confidenceamong rural women. Most of them have
established their own small scale enterprisespromoting direct selling of phulkari productsunder the technical guidance of KVK faculty.Therefore, this study was planned to know and todiscuss the empowerment indicators of womentrained in phulkari embroidery.
MATERIALS AND METHODSThe study was conducted in Patiala district of
Punjab. Patiala comprises of total eight blocks,out of which Patiala, Nabha and Ghanaur wereselected purposely for the study as rural womenfrom these blocks got vocational training inphulkari embroidery from KVK Patiala. For theselection of respondents, a list of rural womenwho acquired vocational training in phulkariembroidery from KVK during the year 2005-10was prepared. Out of 180 trainees, 60 rural womenwere selected who adopted this vocation to beeconomically self-reliant through gainful self-employment. 20 farm women from each blockwere selected. The data was collected with the helpof interview schedule with concurrent evaluation.These women were personally contacted by theinvestigators to collect information. Theinformation gathered from rural women artisanswas tabulated and analyzed using frequency andpercentage.
RESULTS AND DISCUSSION
Socio economic profileThe information on socio-economic profile of
Table 1. Socio-economic profile of the respondents. (N=60)
Sr. No Socio-economic Profile Number of Respondents Percentage1. Age
a) Young (18-35 years) 15 25.0b) Middle (36-50 years) 35 58.3c) Old (>50 years) 10 16.7
2. Educationa) Below Matriculation 28 46.7b) Matriculation and Above 32 53.3
3. Land holdinga) Land less 50 83.3b) Marginal & small (less than 2 hectares) 10 16.7
4. Castea) General 08 13.3b) OBC 24 40.0c) SC 28 46.7
Kaur and Sodhi
J Krishi Vigyan 2014, 3(1) : 84-87
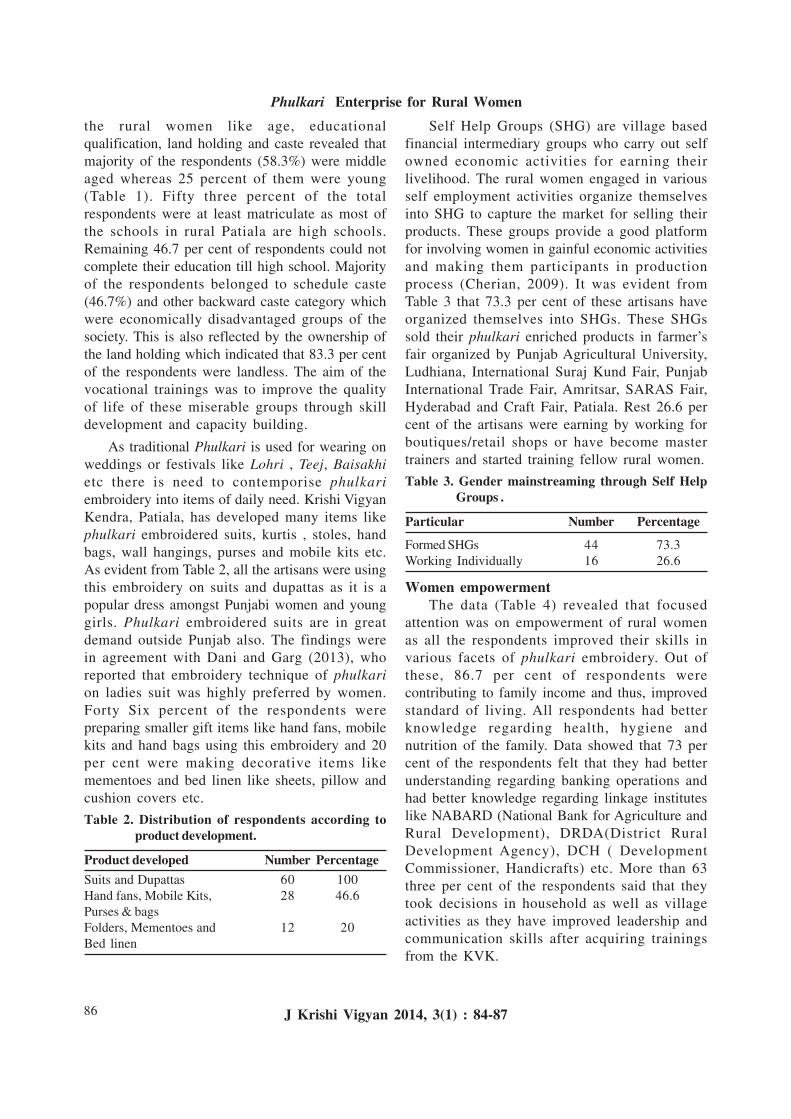
86
the rural women like age, educationalqualification, land holding and caste revealed thatmajority of the respondents (58.3%) were middleaged whereas 25 percent of them were young(Table 1). Fifty three percent of the totalrespondents were at least matriculate as most ofthe schools in rural Patiala are high schools.Remaining 46.7 per cent of respondents could notcomplete their education till high school. Majorityof the respondents belonged to schedule caste(46.7%) and other backward caste category whichwere economically disadvantaged groups of thesociety. This is also reflected by the ownership ofthe land holding which indicated that 83.3 per centof the respondents were landless. The aim of thevocational trainings was to improve the qualityof life of these miserable groups through skilldevelopment and capacity building.
As traditional Phulkari is used for wearing onweddings or festivals like Lohri , Teej, Baisakhietc there is need to contemporise phulkariembroidery into items of daily need. Krishi VigyanKendra, Patiala, has developed many items likephulkari embroidered suits, kurtis , stoles, handbags, wall hangings, purses and mobile kits etc.As evident from Table 2, all the artisans were usingthis embroidery on suits and dupattas as it is apopular dress amongst Punjabi women and younggirls. Phulkari embroidered suits are in greatdemand outside Punjab also. The findings werein agreement with Dani and Garg (2013), whoreported that embroidery technique of phulkarion ladies suit was highly preferred by women.Forty Six percent of the respondents werepreparing smaller gift items like hand fans, mobilekits and hand bags using this embroidery and 20per cent were making decorative items likemementoes and bed linen like sheets, pillow andcushion covers etc.
Table 2. Distribution of respondents according toproduct development.
Product developed Number PercentageSuits and Dupattas 60 100Hand fans, Mobile Kits, 28 46.6Purses & bagsFolders, Mementoes and 12 20Bed linen
Self Help Groups (SHG) are village basedfinancial intermediary groups who carry out selfowned economic activities for earning theirlivelihood. The rural women engaged in variousself employment activities organize themselvesinto SHG to capture the market for selling theirproducts. These groups provide a good platformfor involving women in gainful economic activitiesand making them participants in productionprocess (Cherian, 2009). It was evident fromTable 3 that 73.3 per cent of these artisans haveorganized themselves into SHGs. These SHGssold their phulkari enriched products in farmer’sfair organized by Punjab Agricultural University,Ludhiana, International Suraj Kund Fair, PunjabInternational Trade Fair, Amritsar, SARAS Fair,Hyderabad and Craft Fair, Patiala. Rest 26.6 percent of the artisans were earning by working forboutiques/retail shops or have become mastertrainers and started training fellow rural women.
Table 3. Gender mainstreaming through Self HelpGroups .
Particular Number Percentage
Formed SHGs 44 73.3Working Individually 16 26.6
Women empowermentThe data (Table 4) revealed that focused
attention was on empowerment of rural womenas all the respondents improved their skills invarious facets of phulkari embroidery. Out ofthese, 86.7 per cent of respondents werecontributing to family income and thus, improvedstandard of living. All respondents had betterknowledge regarding health, hygiene andnutrition of the family. Data showed that 73 percent of the respondents felt that they had betterunderstanding regarding banking operations andhad better knowledge regarding linkage instituteslike NABARD (National Bank for Agriculture andRural Development), DRDA(District RuralDevelopment Agency), DCH ( DevelopmentCommissioner, Handicrafts) etc. More than 63three per cent of the respondents said that theytook decisions in household as well as villageactivities as they have improved leadership andcommunication skills after acquiring trainingsfrom the KVK.
Phulkari Enterprise for Rural Women
J Krishi Vigyan 2014, 3(1) : 84-87
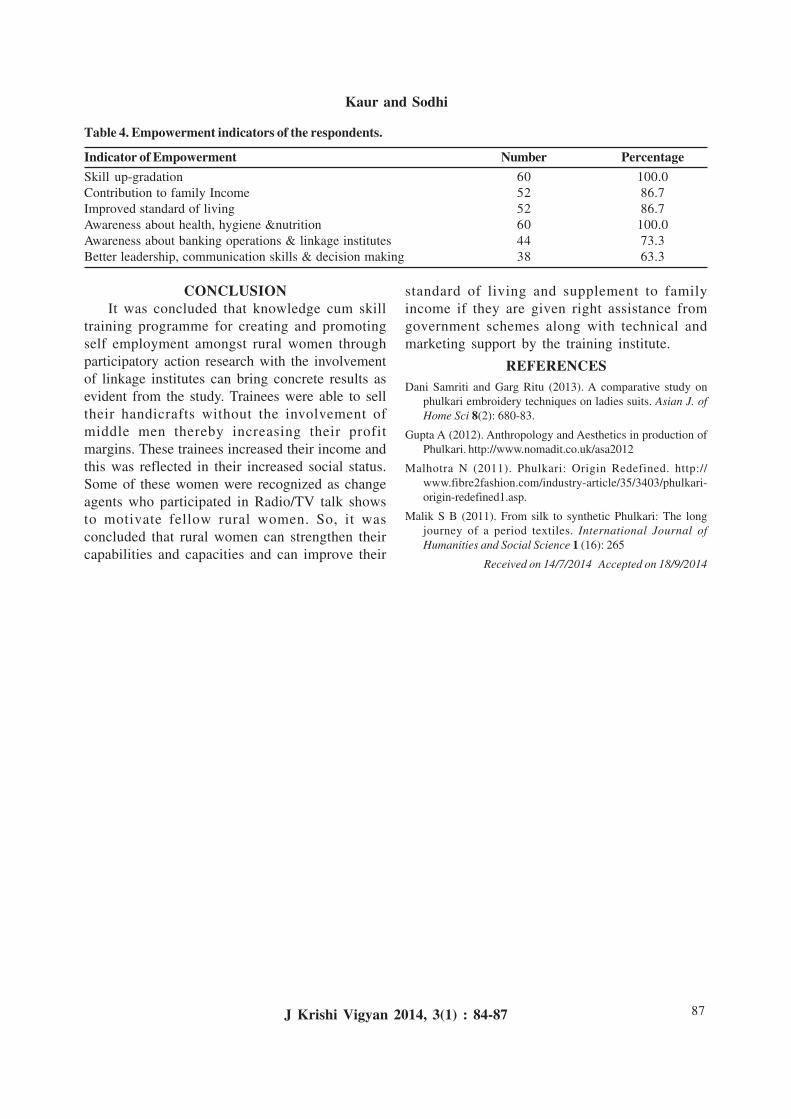
87
CONCLUSIONIt was concluded that knowledge cum skill
training programme for creating and promotingself employment amongst rural women throughparticipatory action research with the involvementof linkage institutes can bring concrete results asevident from the study. Trainees were able to selltheir handicrafts without the involvement ofmiddle men thereby increasing their profitmargins. These trainees increased their income andthis was reflected in their increased social status.Some of these women were recognized as changeagents who participated in Radio/TV talk showsto motivate fellow rural women. So, it wasconcluded that rural women can strengthen theircapabilities and capacities and can improve their
Table 4. Empowerment indicators of the respondents.
Indicator of Empowerment Number PercentageSkill up-gradation 60 100.0Contribution to family Income 52 86.7Improved standard of living 52 86.7Awareness about health, hygiene &nutrition 60 100.0Awareness about banking operations & linkage institutes 44 73.3Better leadership, communication skills & decision making 38 63.3
standard of living and supplement to familyincome if they are given right assistance fromgovernment schemes along with technical andmarketing support by the training institute.
REFERENCESDani Samriti and Garg Ritu (2013). A comparative study on
phulkari embroidery techniques on ladies suits. Asian J. ofHome Sci 8(2): 680-83.
Gupta A (2012). Anthropology and Aesthetics in production ofPhulkari. http://www.nomadit.co.uk/asa2012
Malhotra N (2011). Phulkari: Origin Redefined. http://www.fibre2fashion.com/industry-article/35/3403/phulkari-origin-redefined1.asp.
Malik S B (2011). From silk to synthetic Phulkari: The longjourney of a period textiles. International Journal ofHumanities and Social Science 1 (16): 265
Received on 14/7/2014 Accepted on 18/9/2014
Kaur and Sodhi
J Krishi Vigyan 2014, 3(1) : 84-87

88
Short Communication
Enhancing Flower Productivity During Off Season inJasmine (Jasminum sambac)
V KrishnamoorthyKrishi Vigyan Kendra, Tamil Nadu Agricultural University,
Vamban Colony, Pudukkottai – 622 303 (Tamil Nadu)
INTRODUCTIONJasmine (Jasminum sambac) is one of the
important major traditional loose flower inPudukkottai district of Tamil Nadu. The flowersare used in family functions, social and religiousfunctions, to prepare garland and to adorn hairsby the females. The prices are higher duringreligious auspicious days, Tuesday and Friday ofthe week. Its demand is constant throughout theTamil calendar year except Chitrai and Aadi (April-May, July-Aug). Generally each farmer usuallygrows 100 to 250 plants depending upon thefamily members involved in plucking of flowers.The flowering of jasmine continues throughoutthe year and the farmers prune the plants duringDecember- January and allowed to produce newflowering shoots. The market price duringDecember to March is 10 times higher than theremaining part of the year. The exorbitant peakprice is mainly due to non availability of flowers,as nearly 100 per cent of the farmers go forpruning. After pruning the jasmine plants startsbearing and produce large quantity of flowersduring June-July which results in reduced marketprice during this period which sometimes is noteven equal to its picking cost. Hence, in order toproduce Jasmine flowers during off season i.e.December to March and change the attitude ofthe farmer, the present study was undertaken toproduce Jasmine flowers by making use of twopruning times and application of chemicals.
MATERIALS AND METHODSThe present study was undertaken by Krishi
Vigyan Kendra, Tamil Nadu Agricultural
University, Vamban, Pudukkottai during 2009-2010 and 2010-2011 at the farmers’ field. Thetreatments were T
1- Pruning during November last
week at 50 cm height and pinching after threemonths. T
2-Pruning during July month followed
by spraying of 2 per cent humic acid at 15 dintervals, T
3- Pruning during July month and
spraying of Nitrobenzene 20 per cent @ 2.5ml/lalong with Tricontanol 0.2 per cent duringNovember-April once in 15 d. The variety understudy was Ramanathapuram local and age of plantwas five years old. Each treatment was appliedon 50 plants. The study was carried out at tenfarmers’ field of Manjanvidhuthi village for twosuccessive years under irrigated condition. Theregular cultural practices were followed during thestudy period. The soil samples were collectedand analyzed for the available major andmicronutrients. The soil pH was 6.9, EC 1.1,Nitrogen 123 kg/ha, Phosphorus 14 kg/ha,Potassium 201 kg/ha, Zinc 1.4 ppm, Iron 5.82ppm, Manganese 3.48 ppm and Copper 0.27 ppm.The various growth and yield parameters wererecorded by using standard procedures. The dataobtained were statistically analyzed using analysisof variance.
RESULTS AND DISCUSSIONThe data presented in the Table 1 revealed that
there was no significant difference among theprimary, secondary and tertiary branches per plantin all the three treatments. The flower bearingshoots per plant were higher during off season,main season and throughout the year in treatmentof pruning during July month and spraying of
*Corresponding Author’s Email: [email protected]
J Krishi Vigyan 2014, 3(1) : 88-90 DOI: 10.5958/2349-4433.2014.01258.6
J Krishi Vigyan 2014, 3(1) : 88-90
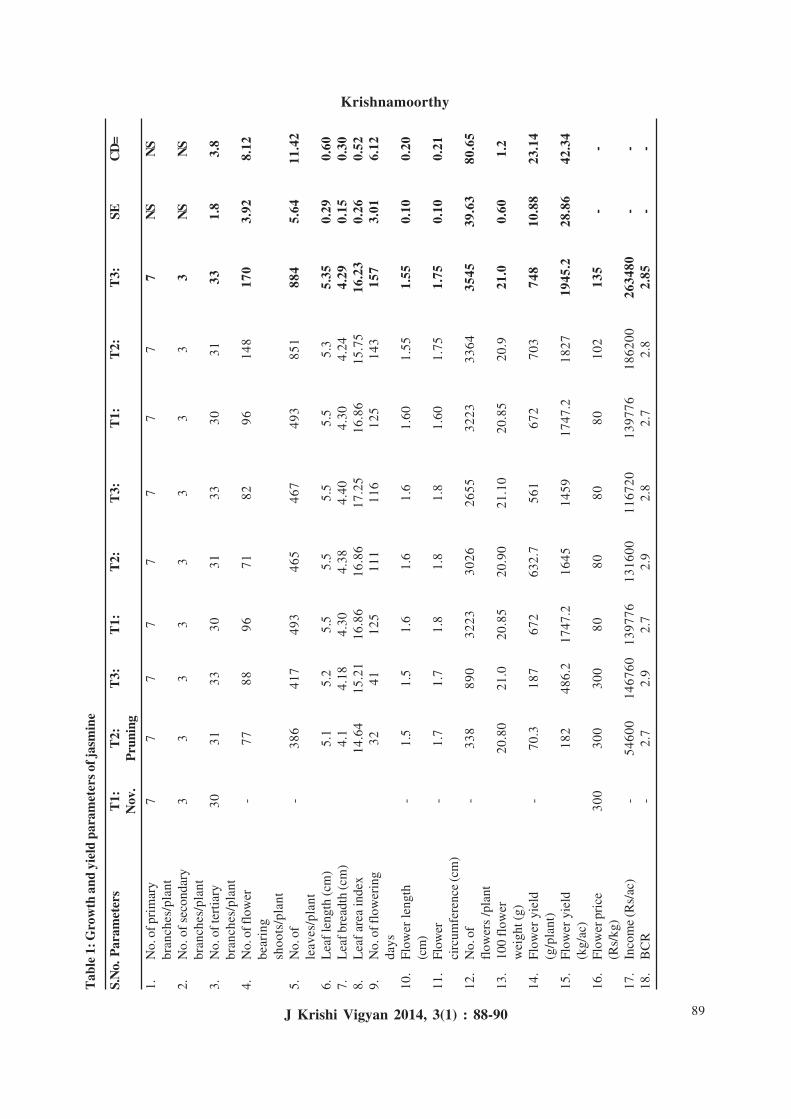
89
Krishnamoorthy
J Krishi Vigyan 2014, 3(1) : 88-90
Tab
le 1
: Gro
wth
and
yie
ld p
aram
eter
s of j
asm
ine
S.N
o. P
aram
eter
sT
1:T
2:T
3:T
1:T
2:T
3:T
1:T
2:T
3:SE
CD
=N
ov.
Pru
ning
1.N
o. o
f pri
mar
y7
77
77
77
77
NS
NS
bran
ches
/pla
nt2.
No.
of
seco
ndar
y3
33
33
33
33
NS
NS
bran
ches
/pla
nt3.
No.
of t
erti
ary
3031
3330
3133
3031
331.
83.
8br
anch
es/p
lant
4.N
o. o
f flo
wer
-77
8896
7182
9614
817
03.
928.
12be
arin
gsh
oots
/pla
nt5.
No.
of
-38
641
749
346
546
749
385
188
45.
6411
.42
leav
es/p
lant
6.L
eaf l
engt
h (c
m)
5.1
5.2
5.5
5.5
5.5
5.5
5.3
5.35
0.29
0.60
7.L
eaf b
read
th (c
m)
4.1
4.18
4.30
4.38
4.40
4.30
4.24
4.29
0.15
0.30
8.L
eaf
area
inde
x14
.64
15.2
116
.86
16.8
617
.25
16.8
615
.75
16.2
30.
260.
529.
No.
of f
low
erin
g32
4112
511
111
612
514
315
73.
016.
12da
ys10
.Fl
ower
len
gth
-1.
51.
51.
61.
61.
61.
601.
551.
550.
100.
20(c
m)
11.
Flow
er-
1.7
1.7
1.8
1.8
1.8
1.60
1.75
1.75
0.10
0.21
circ
umfe
renc
e (c
m)
12.
No.
of
-33
889
032
2330
2626
5532
2333
6435
4539
.63
80.6
5fl
ower
s /p
lant
13.
100
flow
er20
.80
21.0
20.8
520
.90
21.1
020
.85
20.9
21.0
0.60
1.2
wei
ght (
g)14
.Fl
ower
yie
ld-
70.3
187
672
632.
756
167
270
374
810
.88
23.1
4(g
/pla
nt)
15.
Flow
er y
ield
182
486.
217
47.2
1645
1459
1747
.218
2719
45.2
28.8
642
.34
(kg/
ac)
16.
Flow
er p
rice
300
300
300
8080
8080
102
135
--
(Rs/
kg)
17.
Inco
me
(Rs/
ac)
-54
600
1467
6013
9776
1316
0011
6720
1397
7618
6200
2634
80-
-18
.B
CR
-2.
72.
92.
72.
92.
82.
72.
82.
85-
-
90
Flower Productivity during Off Season in Jasmine
J Krishi Vigyan 2014, 3(1) : 88-90
nitrobenzene 20 per cent @ 2.5ml/l along withTricontanol 0.2 per cent once in 15 d duringNovember-April and followed by T
2 and T
1.
Similarly number of leaves was higher in T3
during off season and for one year followed byT
2 and T
1. During main season the plants were
pruned which resulted in less number of leavesper plant. Similar results were reported in Tomatoby Mithila et al (2012). The data on leaf length,leaf breadth and leaf area index showed nosignificant difference.
The number of flowering days was higher inT
3 followed by T
2 and T
1. It was attributed by
flower induction due to the spraying ofNitrobenzene 20% @ 2.5ml/l along withTricontanol 0.2 per cent once in 15 d duringNovember-April and pruning during July month.The treatments T
3 and T
2 did not influenced the
flower size where as number of flowers per plantwas higher in T
3 followed by T
2 and T
1. Though it
recorded less numbers during main seasoncompared to T
1 but it was enhanced during off
season due to presence of more number of flowerbearing shoots. Kannan et al (2008) reportedsimilar results in Paprika. The highest flower yieldper plant (748 g), flower yield per hectare (4863kg) was recorded in T
3 compared to T
2 and T
1. It
was attributed by highest number of flowers perplant. Though it was less during main season butwas compensated by flower yield during offseason.
The total income of Rs.2,63,480/- was highestin (T3) spraying of Nitrobenzene 20 per cent @2.5ml/l along with Tricontanol 0.2 per cent oncein 15 d during November-April and pruningduring July month followed by Rs.1,86,200/- totalincome recorded in T
2. It was attributed by higher
flower yield and higher market price during offseason which resulted in higher benefit cost ratioof 2.85:1.
CONCLUSIONSpraying of Nitrobenzene 20 per cent @
2.5ml/l along with Tricontanol 0.2 per cent oncein 15 d during November-April followed bypruning during July month recorded highestnumber of flower bearing shoots (170 year/plant),number of leaves (884/plant/year), flowering days(157/year), number of flowers (3545/plant/year),flower yield per plant (748g/year), flower yieldper hectare (4863kg/year) and Benefit cost ratio(2.85:1).
REFERENCESKannan K, Jawaharlal M, Prabhu M and Senthilkumar T (2008).
Effect of growth regulators on yield and quality of paprika cvKtPI-19. Indian J of Agric Res 42 (4):293-294.
Deb Mithila, Roy Sajal and Imamul Hug S M (2012). Effects ofnitrobenzene on growth of tomato plants and accumulation ofArsenic. Bangaladesh J Sci and Res 25 (1): 43-52.
Agarwal Kavita and Guhey Arti (2010). Growth and yield attributesof sunflower influenced by foliar application of nitrobenzene.International J plant Sci 5 (1): 120-128.
Received on 27/6/2014 Accepted on 20/9/2014
91
Short Communication
Performance of Some Tomato Hybrids at Farmers’Field in District Kokrajhar in Assam
Anjan BorahKrishi Vigyan Kendra
Assam Agricultural University, Kokrajhar (Assam)
INTRODUCTIONKokrajhar district of west Assam under lower
Brahmaputra Valley Zone has great potential forvegetable cultivation and farmers of this regionare growing vegetables commercially. Tomato isone of the major vegetables that grown extensivelyin the district during rabi season and most of thefarmers grow traditional varieties which are notonly low yielder but also susceptible to the attackof leaf curl virus. Initially in the entire Kokrajhardistrict, only some progressive farmers used tocultivate hybrid varieties of tomato available inthe market but now the hybrid vegetablecultivation has attracted a large number of farmersand gradually gaining popularity among thefarmers of the district. In fact, majority of thefarmers of the area are completely unaware aboutthe yield potential and performance of tomatohybrids available in the market which aredeveloped by government and privateorganisations. Therefore, the experiment wasconducted on five locations in Kokrajhar districtof Assam to assess the comparative performanceof three tomato hybrids namely Arka Abhijit, ArkaShresth and Rocky at the farmers’ field.
MATERIALS AND METHODSIn order to carry out the study during rabi
seasons of 2005–06 and 2006–07, five villagesnamely Bajugaon, Bhomrabil No. 2, Haraputa,Matiajuri and Telipara under Gossaigaon sub-division of Kokrajhar district of Assam wereselected for the on–farm farmers participatory trialon three hybrids of tomato viz. Arka Abhijit, ArkaShresth and Rocky. Total ten farmers were selectedfrom these five villages for conducting the
experiment. The soils were mostly acidic inreaction, sandy to loam in texture and waterholding capacity was medium to low. In this, twohybrids (Arka Abhijit and Arka Shresth) were fromIIHR, Bangalore and one (Rocky) was fromprivate company. The experiment was laid out inrandomized block design (RBD) with threetreatments and seven replications, considering thevarieties as treatment and experimental plot asreplication. The nursery raising of seedling wasdone with standard procedure of raising seedlingsfor transplanted vegetables and were transplantedon farmers field with a spacing of 60 cm X 45cm. Size of the experimental plot of size 40 m2
(8.0 m X 5.0 m). A fertilisers dose of 80:60:60 kgNPK/ha was applied. The entire quantity ofphosphorous and potassium along with half ofnitrogen was used before transplanting, while theremaining half of nitrogen was top dressed after40 days of transplanting. Monitoring and fieldvisits were conducted regularly to collect feedbackand provide instant solution to the problemsreported by the participating farmers. Theobservations on number of fruit per plant, fruitweight (g), yield per plant (g) etc. were recordedand the economics of cultivation was alsocalculated. All the observations were recorded onrandomly selected twenty five plants, except theyield (q/ha), which was computed based on thenet plot yield.
RESULTS AND DISCUSSIONAmong all the three hybrid varieties of tomato,
Arka Abhijit performed significantly well at allthe locations of the experiment. All the threehybrids significantly differed from each other in
*Corresponding Author’s Email : [email protected] Address: Krishi Vigyan Kendra, AAU, Howly, Barpeta, – 781316 (Assam)
J Krishi Vigyan 2014, 3(1) : 91-92 DOI: 10.5958/2349-4433.2014.01259.8
J Krishi Vigyan 2014, 3(1) : 91-92
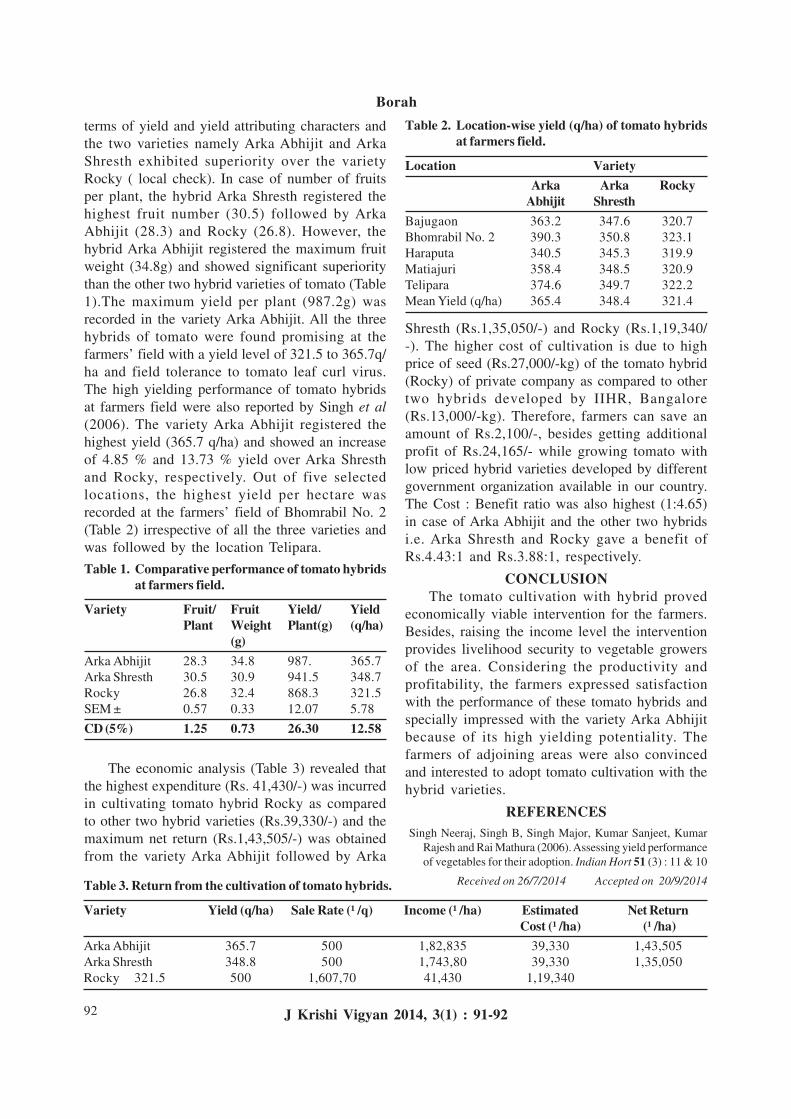
92
terms of yield and yield attributing characters andthe two varieties namely Arka Abhijit and ArkaShresth exhibited superiority over the varietyRocky ( local check). In case of number of fruitsper plant, the hybrid Arka Shresth registered thehighest fruit number (30.5) followed by ArkaAbhijit (28.3) and Rocky (26.8). However, thehybrid Arka Abhijit registered the maximum fruitweight (34.8g) and showed significant superioritythan the other two hybrid varieties of tomato (Table1).The maximum yield per plant (987.2g) wasrecorded in the variety Arka Abhijit. All the threehybrids of tomato were found promising at thefarmers’ field with a yield level of 321.5 to 365.7q/ha and field tolerance to tomato leaf curl virus.The high yielding performance of tomato hybridsat farmers field were also reported by Singh et al(2006). The variety Arka Abhijit registered thehighest yield (365.7 q/ha) and showed an increaseof 4.85 % and 13.73 % yield over Arka Shresthand Rocky, respectively. Out of five selectedlocations, the highest yield per hectare wasrecorded at the farmers’ field of Bhomrabil No. 2(Table 2) irrespective of all the three varieties andwas followed by the location Telipara.
Table 1. Comparative performance of tomato hybridsat farmers field.
Variety Fruit/ Fruit Yield/ YieldPlant Weight Plant(g) (q/ha)
(g)Arka Abhijit 28.3 34.8 987. 365.7Arka Shresth 30.5 30.9 941.5 348.7Rocky 26.8 32.4 868.3 321.5SEM ± 0.57 0.33 12.07 5.78
CD (5%) 1.25 0.73 26.30 12.58
The economic analysis (Table 3) revealed thatthe highest expenditure (Rs. 41,430/-) was incurredin cultivating tomato hybrid Rocky as comparedto other two hybrid varieties (Rs.39,330/-) and themaximum net return (Rs.1,43,505/-) was obtainedfrom the variety Arka Abhijit followed by Arka
Shresth (Rs.1,35,050/-) and Rocky (Rs.1,19,340/-). The higher cost of cultivation is due to highprice of seed (Rs.27,000/-kg) of the tomato hybrid(Rocky) of private company as compared to othertwo hybrids developed by IIHR, Bangalore(Rs.13,000/-kg). Therefore, farmers can save anamount of Rs.2,100/-, besides getting additionalprofit of Rs.24,165/- while growing tomato withlow priced hybrid varieties developed by differentgovernment organization available in our country.The Cost : Benefit ratio was also highest (1:4.65)in case of Arka Abhijit and the other two hybridsi.e. Arka Shresth and Rocky gave a benefit ofRs.4.43:1 and Rs.3.88:1, respectively.
CONCLUSIONThe tomato cultivation with hybrid proved
economically viable intervention for the farmers.Besides, raising the income level the interventionprovides livelihood security to vegetable growersof the area. Considering the productivity andprofitability, the farmers expressed satisfactionwith the performance of these tomato hybrids andspecially impressed with the variety Arka Abhijitbecause of its high yielding potentiality. Thefarmers of adjoining areas were also convincedand interested to adopt tomato cultivation with thehybrid varieties.
REFERENCES Singh Neeraj, Singh B, Singh Major, Kumar Sanjeet, Kumar
Rajesh and Rai Mathura (2006). Assessing yield performanceof vegetables for their adoption. Indian Hort 51 (3) : 11 & 10
Received on 26/7/2014 Accepted on 20/9/2014Table 3. Return from the cultivation of tomato hybrids.
Variety Yield (q/ha) Sale Rate (¹ /q) Income (¹ /ha) Estimated Net ReturnCost (¹ /ha) (¹ /ha)
Arka Abhijit 365.7 500 1,82,835 39,330 1,43,505Arka Shresth 348.8 500 1,743,80 39,330 1,35,050Rocky 321.5 500 1,607,70 41,430 1,19,340
Table 2. Location-wise yield (q/ha) of tomato hybridsat farmers field.
Location VarietyArka Arka Rocky
Abhijit ShresthBajugaon 363.2 347.6 320.7Bhomrabil No. 2 390.3 350.8 323.1Haraputa 340.5 345.3 319.9Matiajuri 358.4 348.5 320.9Telipara 374.6 349.7 322.2Mean Yield (q/ha) 365.4 348.4 321.4
Borah
J Krishi Vigyan 2014, 3(1) : 91-92
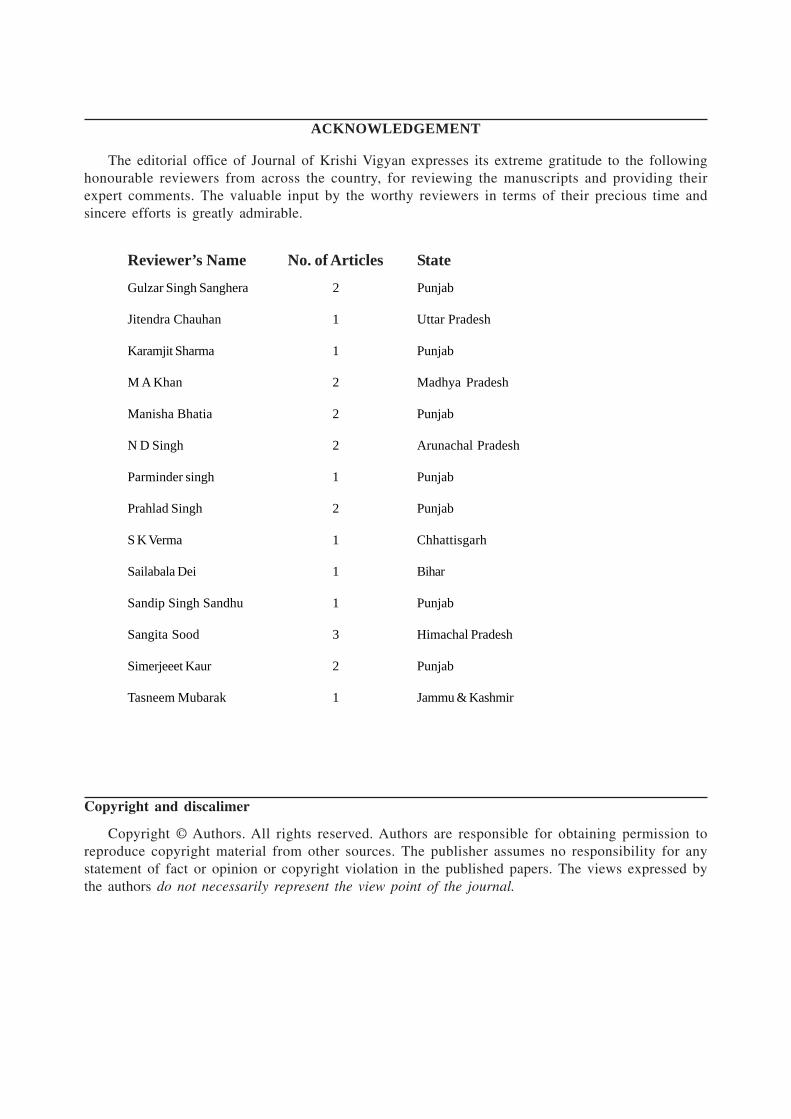
ACKNOWLEDGEMENT
The editorial office of Journal of Krishi Vigyan expresses its extreme gratitude to the followinghonourable reviewers from across the country, for reviewing the manuscripts and providing theirexpert comments. The valuable input by the worthy reviewers in terms of their precious time andsincere efforts is greatly admirable.
Reviewer’s Name No. of Articles State
Gulzar Singh Sanghera 2 Punjab
Jitendra Chauhan 1 Uttar Pradesh
Karamjit Sharma 1 Punjab
M A Khan 2 Madhya Pradesh
Manisha Bhatia 2 Punjab
N D Singh 2 Arunachal Pradesh
Parminder singh 1 Punjab
Prahlad Singh 2 Punjab
S K Verma 1 Chhattisgarh
Sailabala Dei 1 Bihar
Sandip Singh Sandhu 1 Punjab
Sangita Sood 3 Himachal Pradesh
Simerjeeet Kaur 2 Punjab
Tasneem Mubarak 1 Jammu & Kashmir
Copyright and discalimer
Copyright © Authors. All rights reserved. Authors are responsible for obtaining permission toreproduce copyright material from other sources. The publisher assumes no responsibility for anystatement of fact or opinion or copyright violation in the published papers. The views expressed bythe authors do not necessarily represent the view point of the journal.

SOCIETY OF KRISHI VIGYAN [email protected]
www.iskv.in
MEMBERSHIP APPLICATION FORM
1. Name in Capital letters
(Surname) (First Name) (Middle Name) 2. Membership Category (Please tick one) For 1 year Rs.1000/- 3 years Rs.2500/- 5 years Rs.3500/- Life Member (10 years) Rs.5000/-
3. Designation
4. Date of Birth 5. Sex F M DD MM Year 6. Organization currently attached to
7. Mailing Address & Contact Details
City Pin Code State Country Phone Off. Fax Res. E-mail
8. Academic Qualifications Degree Institution Year Major field of study
9. Professional Experience (Scientific/ Technical/ Administrative/ Managerial)
Name of Organization Work period Job Description/ Title From To
10. Mode of Payment Demand Draft/ Cash______________ dated_________ for Rs.________ favoring Treasurer, Society of Krishi Vigyan, Payable at Ludhiana and/or Funds Can Be Transferred Electronically In Society’s Saving Account No.29380100008424 In Bank Of Baroda, Ludhiana and The IFSC Code of the Branch is BARBOPAULUD. Please complete this form, and mail to: Dr. Manoj Sharma, Secretary (SKV) KRISHI VIGYAN KENDRA, KAPURTHALA 144620 (PUNJAB) E-mail: [email protected] Call 09872745890
Signature of the Applicant

ARTICLE SUBMISSION CERTIFICATE
Manuscript Title:
Manuscript type: Review article/Full length paper/Short communication (Check one):
Name(s) of the author(s):
Name and address of
corresponding author :
Contact No. # :
E-mail:
I (we) affirm that:
1. The manuscript has been prepared in accordance with the latest “Instructions for author’s guidelines ofthe Journal of Krishi Vigyan.
2. The article is original and has not been published previously, is not under consideration for publicationelsewhere, and if accepted, it will not be published elsewhere in the same or, in English or any otherlanguage. The submission of the article has the approval of the all the authors and the authorities of thehost institute where work had been carried out.
3. All the authors have made substantive and intellectual contributions to the article and assume fullresponsibility for all opinions, conclusions and statements expressed in the articles.
4. I (we) agree to abide by the comments of referees/editorial board and will modify the article as per theirrecommendations for publication in Journal of Krishi Vigyan.
5. If the above article is published in Journal of Krishi Vigyan, the copyright of this article will vest with theSociety of Krishi Vigyan, who will have the right to enter into any agreement with any organization inIndia or abroad engaged in reprography, photocopying, storage and dissemination of information containedin it, and neither we nor our legal heirs will have any claims on royalty.
Name of the author(s) Designation Present official address Signature with date
1.
2.
INSTRUCTIONS FOR AUTHORS
The Journal of Krishi Vigyan, a peer-reviewed, half yearly, journal is being published by theSociety of Krishi Vigyan. The publication is aimed at providing access to academicians, researchers,extension workers and industry professionals from across the globe to publish their work on all aspectsof agriculture and allied fields through research papers, short communications and review articles.
The editorial board of SKV welcomes the submission of manuscripts within the aim and scope ofthe journal for publication. The articles may be submitted via regular mail in duplicate, each with a setof original figures and photographs to the Editor, Journal of Krishi Vigyan electronically in MS WORDformat as e-mail attachments to the [email protected] or [email protected] .
Please refer to the instructions for authors before submitting an article.
General guidelinesIt is the responsibility of the authors to ensure that
1. Papers are submitted strictly as per the style and format of JKV. The articles not confirming fullyto the style and format of JKV will be returned to author(s) by the editorial office foramendment, prior to a review for its scientific merit.
2. Submission of an article is understood to imply that the article is original and has not been publishedpreviously, is not under consideration for publication elsewhere, and if accepted, it will not bepublished elsewhere in the same form, in English or any other language. The submission ofthe article has the approval of the all co-authors and the authorities of the host institute where workhas been carried out.
3. The editorial board of JKV discourages the submission of more than one article dealing withrelated aspects from the same study; this includes different aspects of data derived from oneparticular experiment, or cases in which the analytical techniques, animals or experimentalprocedures are common to all papers. If author(s) have valid reasons for separation of reports ofone particular experiment or study into more than one paper, these must be submitted simultaneously.
4. The Author(s) may suggest the names of at least three experts/reviewers, not from the hostorganization/institute where the work had been carried out (along with their complete mailingaddress, contact nos. and e-mail id) whom they feel qualified to evaluate their research article.These suggestions will only be considered if e-mail Ids are also provided. Submission of suchnames does not imply that they will definitely be used for scrutiny.
5. The “Article submission certificate” duly signed by all the authors/head of host department / institute(optional) on a prescribed format must be furnished along with article at the time of submission. Ifthe article is sent through e-mail, the scanned copy of certificate (signed / stamped) may be attached.
6. For publication of articles in JKV, all the contributing authors has to be the member (either life orannual) of Society of Krishi Vigyan.
7. The submitted manuscripts will be assessed from editorial points of view, at first, and if foundsuitable for publication, it will be sent for peer-review. The review process will be a double-blindprocess where author(s) and referees are unaware of each others’ name. The author(s) must abideby the suggestions of referee and the editorial board of JKV. The final decision to publish anarticle will lie with the Editor and Publisher of the journal.
8. The corresponding author will be sent the PDF file of his/her published article free of cost via e-mail. No hard copies of the reprints will be provided.
9. Journal of Krishi Vigyan has no page charges.
10. For enquiries regarding submission, please contact the editorial office [email protected]
Manuscript preparationLanguage: Papers must be written in English. The text and all supporting materials must use UKspelling conventions. It is up to the authors to make sure there are no typographical errors in themanuscript.
Typescript: Manuscripts must be typed in Microsoft Word, using Times New Roman font at 12 points,double spaced on one side of A4 size bond paper with 2.5 cm margin on all sides. All pages should benumbered consecutively in the right corner on the top. Indent new paragraphs.
Words: Papers should not normally exceed up to 8000 words for review articles; 4000 words fororiginal full length papers and 1500 words for short communications.
Headings: Main Headings - Major headings are centered, all capitals, boldface in Times New Romanfont at 12 points, and consist of ABSTRACT, INTRODUCTION, MATERIALS AND MATHODS,RESULTS AND DISCUSSION, CONCLUSION. ACKNOWLEDGEMENTS (optional) andREFERENCES.
First subheadings are placed in a separate line, begin at the left margin, and are in italics. Text thatfollows should be in a new paragraph.
Second Subheadings should begin with the first line of a paragraph, indented and in italic. The textfollows immediately after the second subheading.
Contents: The contents must be arranged in an orderly way with suitable headings for each subsection.The recommended subdivision of contents is as follows:-
Running head: The running head or short title of not more than 50 characters, in title case andcentered should be placed above the main title of the study.
Title: The title must be informative and brief. The initials and name of the author(s), the address of thehost institution where the work was done must follow the title.
Superscripts (1,2,3) should be used in cases where authors are from different institutions. Thesuperscript # should be appended to the author to whom correspondence should be addressed, andindicated as such together with an e-mail address in the line immediately following the keywords. Thepresent postal address of authors, if currently different from that of the host institution should also besuperscripted appropriately and inserted in the lines following the key words.
Abstracts: It must summarize the major objectives, methods, results, conclusions, and practicalapplications of the study conducted. The Abstract must consist of complete sentences and use ofabbreviations should be limited.
Keywords: The Abstract is followed by three to five keywords from the title to be used for subjectindexing. These should be singular (e.g. paper, not papers). The abstract, including key words shouldbe separated by horizontal lines places before and after the text.
Introduction: This should include a statement of why the subject under investigation is considered tobe of importance, a concise indication of the status quo of published work in this field and a declarationof the aims of the experiment or study i.e. the hypothesis.
Materials and Methods: These should be concise but of sufficient detail to enable the experiment tobe replicated by an outside party. Particular care should be taken to ensure that the appropriatestatistical analyses have been carried out. Specify the design used, factors tested or the statisticalmodel employed. Non significant differences (P> 0.05) should not be discussed.
Results and Discussion: Results and discussion should be combined to avoid repetition. It should bepresented in a logical sequence in the text, tables and figures. The repetitive presentation of the samedata in different forms should be avoided. The discussion should consider the results in relation to anyhypotheses advanced in the Introduction and place the study in the context of other work.
Conclusion: The conclusion should consist of a short integration of results that refer directly to thestated aims of the experiment and a statement on the practical implications of the results.
Acknowledgements (optional): A brief and formal acknowledgment section, if desired, should followthe conclusion statement. Do not include titles of persons; such as Dr., Mr., or Ms., use only initialsand surnames.
References: The existing relevant literature restricted to those with a direct bearing upon the findingsmust be appropriately cited.
References appearing in the text – References in the text should be given as : Sharma and Rao(1983). Use änd” and not “&”. A reference by three or more authors should be identified in the textonly by the first author followed by et al (in italic) and the year.
Where several references are quoted consecutively in the text, the order should be chronological or,within a year, alphabetical (by first author or, if necessary, by first and second author(s).
Where references are made to several papers by the same author(s) in the same year, the year shouldbe followed by a, b, c, etc.
Personal communications and unpublished work should be cited in the text only and not in the referencelist, giving the initials, name: for example (M. S. Gill, unpublished), (M.S. Gill, personalcommunication).
References to internet sites should be quoted in the normal way in the text e.g. FDA (2008). In thereference list, the full URL must be given, followed by the date that the website was assessed.
References appearing in reference section : All publications cited in the text should be presented inthe list under Reference section, in alphabetical order. The title of the article should be given in thereference and journal’s name should be cited in italic as abbreviated by the journal. It is the fullresponsibility of the authors to cross check reference in the text of the article with those in the list ofreferences. In all cases, a reference must provide sufficient information to enables the reader to locateit.
Examples of references – (Hanging indent 1 cm)
For journals/periodicals
Mufeed S (1998). Evaluating employee performance: A successful instrument for human resourcedevelopment. Indian J Trg and Dev 28 (2): 72-93.
For books
AOAC (1980). Official Methods of Analysis. 13th edn. Association of Official Analytical Chemists.Washington, DC.
For Chapters in bookBarnabas A P and Lakshmiswaramma M (1980). “Assessment of Evaluation system for Rural
development”. In: Monitoring and Evaluation of Rural Development: Some Asian Experiences.(eds Kuldeep Mathu and Inayatulloah) Kuala Lumpur U.N. Asian and Pacific Development Centre.Pp: 121-22.
Bray R A (1994). The leucaena psylid. In: Forage Tree Legumes in Tropical Agriculture (eds. R CGutteridge and H M Shelton). CAB International, Oxford. Pp. 283-91.
For proceedings of conferences/symposia etc.
Vivero J L P (2002). Forest is not only wood: the importance of non-wood forest products for the foodsecurity of rural households in Ethiopia. In: Proceedings of the Fourth, Annual Conference forestrysociety of Ethiopia 14-15 January 2002, Ethiopia pp 102.