Embed Size (px)
Citation preview


Journal Editorial Board
Editor-in-Chief
Prof. Thomas Byeongnam YOON, PhD.
Founding Editor-in-Chief
ICACT Transactions on the Advanced Communications Technology (TACT)
Editors
Prof. Jun-Chul Chun, Kyonggi University, Korea Dr. JongWon Kim, GIST (Gwangju Institute of Science & Technology), Korea Dr. Xi Chen, State Grid Corparation of China, China Prof. Arash Dana, Islamic Azad university , Central Tehran Branch, Iran Dr. Pasquale Pace, University of Calabria - DEIS - Italy, Italy Dr. Mitch Haspel, Stochastikos Solutions R&D, Israel Prof. Shintaro Uno, Aichi University of Technology, Japan Dr. Tony Tsang, Hong Kong Polytechnic UNiversity, Hong Kong Prof. Kwang-Hoon Kim, Kyonggi University, Korea Prof. Rosilah Hassan, Universiti Kebangsaan Malaysia(UKM), Malaysia Dr. Sung Moon Shin, ETRI, Korea Dr. Takahiro Matsumoto, Yamaguchi University, Japan Dr. Christian Esteve Rothenberg, CPqD - R&D Center for. Telecommunications, Brazil Prof. Lakshmi Prasad Saikia, Assam down town University, India Prof. Moo Wan Kim, Tokyo University of Information Sciences, Japan Prof. Yong-Hee Jeon, Catholic Univ. of Daegu, Korea Dr. E.A.Mary Anita, Prathyusha Institute of Technology and Management, India Dr. Chun-Hsin Wang, Chung Hua University, Taiwan Prof. Wilaiporn Lee, King Mongkut’s University of Technology North, Thailand Dr. Zhi-Qiang Yao, XiangTan University, China Prof. Bin Shen, Chongqing Univ. of Posts and Telecommunications (CQUPT), China Prof. Vishal Bharti, Dronacharya College of Engineering, India Dr. Marsono, Muhammad Nadzir , Universiti Teknologi Malaysia, Malaysia Mr. Muhammad Yasir Malik, Samsung Electronics, Korea Prof. Yeonseung Ryu, Myongji University, Korea Dr. Kyuchang Kang, ETRI, Korea Prof. Plamena Zlateva, BAS(Bulgarian Academy of Sciences), Bulgaria Dr. Pasi Ojala, University of Oulu, Finland Prof. CheonShik Kim, Sejong University, Korea Dr. Anna bruno, University of Salento, Italy Prof. Jesuk Ko, Gwangju University, Korea Dr. Saba Mahmood, Air University Islamabad Pakistan, Pakistan Prof. Zhiming Cai, Macao University of Science and Technology, Macau Prof. Man Soo Han, Mokpo National Univ., Korea Mr. Jose Gutierrez, Aalborg University, Denmark
Copyright ⓒ 2016 GiRI (Global IT Research Institute)
Dr. Youssef SAID, Tunisie Telecom, Tunisia Dr. Noor Zaman, King Faisal University, Al Ahsa Hofuf, Saudi Arabia Dr. Srinivas Mantha, SASTRA University, Thanjavur, India Dr. Shahriar Mohammadi, KNTU University, Iran Prof. Beonsku An, Hongik University, korea Dr. Guanbo Zheng, University of Houston, USA Prof. Sangho Choe, The Catholic University of Korea, korea Dr. Gyanendra Prasad Joshi, Yeungnam University, korea Dr. Tae-Gyu Lee, Korea Institue of Industrial Technology(KITECH), korea Prof. Ilkyeun Ra, University of Colorado Denver, USA Dr. Yong Sun, Beijing University of Posts and Telecommunications, China Dr. Yulei Wu, Chinese Academy of Sciences, China Mr. Anup Thapa, Chosun University, korea Dr. Vo Nguyen Quoc Bao, Posts and Telecommunications Institute of Technology, Vietnam Dr. Harish Kumar, Bhagwant institute of technology, India Dr. Jin REN, North china university of technology, China Dr. Joseph Kandath, Electronics & Commn Engg, India Dr. Mohamed M. A. Moustafa, Arab Information Union (AIU), Egypt Dr. Mostafa Zaman Chowdhury, Kookmin University, Korea Prof. Francis C.M. Lau, Hong Kong Polytechnic University, Hong Kong Prof. Ju Bin Song, Kyung Hee University, korea Prof. KyungHi Chang, Inha University, Korea Prof. Sherif Welsen Shaker, Kuang-Chi Institute of Advanced Technology, China Prof. Seung-Hoon Hwang, Dongguk University, Korea Prof. Dal-Hwan Yoon, Semyung University, korea Prof. Chongyang ZHANG, Shanghai Jiao Tong University, China Dr. H K Lau, The Open University of Hong Kong, Honh Kong Prof. Ying-Ren Chien, Department of Electrical Engineering, National Ilan University, Taiwan Prof. Mai Yi-Ting, Hsiuping University of Science and Technology, Taiwan Dr. Sang-Hwan Ryu, Korea Railroad Research Institute, Korea Dr. Yung-Chien Shih, MediaTek Inc., Taiwan Dr. Kuan Hoong Poo, Multimedia University, Malaysia Dr. Michael Leung, CEng MIET SMIEEE, Hong Kong Dr. Abu sahman Bin mohd Supa'at, Universiti Teknologi Malaysia, Malaysia Prof. Amit Kumar Garg, Deenbandhu Chhotu Ram University of Science & Technology, India Dr. Jens Myrup Pedersen, Aalborg University, Denmark Dr. Augustine Ikechi Ukaegbu, KAIST, Korea Dr. Jamshid Sangirov, KAIST, Korea Prof. Ahmed Dooguy KORA, Ecole Sup. Multinationale des Telecommunications, Senegal Dr. Se-Jin Oh, Korea Astronomy & Space Science Institute, Korea Dr. Rajendra Prasad Mahajan, RGPV Bhopal, India Dr. Woo-Jin Byun, ETRI, Korea Dr. Mohammed M. Kadhum, School of Computing, Goodwin Hall, Queen's University , Canada Prof. Seong Gon Choi, Chungbuk National University, Korea Prof. Yao-Chung Chang, National Taitung University, Taiwan Dr. Abdallah Handoura, Engineering school of Gabes - Tunisia, Tunisia Dr. Gopal Chandra Manna, BSNL, India
Copyright ⓒ 2016 GiRI (Global IT Research Institute)
Dr. Il Kwon Cho, National Information Society Agency, Korea Prof. Jiann-Liang Chen, National Taiwan University of Science and Technology, Taiwan Prof. Ruay-Shiung Chang, National Dong Hwa University, Taiwan Dr. Vasaka Visoottiviseth, Mahidol University, Thailand Prof. Dae-Ki Kang, Dongseo University, Korea Dr. Yong-Sik Choi, Research Institute, IDLE co., ltd, Korea Dr. Xuena Peng, Northeastern University, China Dr. Ming-Shen Jian, National Formosa University, Taiwan Dr. Soobin Lee, KAIST Institute for IT Convergence, Korea Prof. Yongpan Liu, Tsinghua University, China Prof. Chih-Lin HU, National Central University, Taiwan Prof. Chen-Shie Ho, Oriental Institute of Technology, Taiwan Dr. Hyoung-Jun Kim, ETRI, Korea Prof. Bernard Cousin, IRISA/Universite de Rennes 1, France Prof. Eun-young Lee, Dongduk Woman s University, Korea Dr. Porkumaran K, NGP institute of technology India, India Dr. Feng CHENG, Hasso Plattner Institute at University of Potsdam, Germany Prof. El-Sayed M. El-Alfy, King Fahd University of Petroleum and Minerals, Saudi Arabia Prof. Lin You, Hangzhou Dianzi Univ, China Mr. Nicolai Kuntze, Fraunhofer Institute for Secure Information Technology, Germany Dr. Min-Hong Yun, ETRI, Korea Dr. Seong Joon Lee, Korea Electrotechnology Research Institute, korea Dr. Kwihoon Kim, ETRI, Korea Dr. Jin Woo HONG, Electronics and Telecommunications Research Inst., Korea Dr. Heeseok Choi, KISTI(Korea Institute of Science and Technology Information), korea Dr. Somkiat Kitjongthawonkul, Australian Catholic University, St Patrick's Campus, Australia Dr. Dae Won Kim, ETRI, Korea Dr. Ho-Jin CHOI, KAIST(Univ), Korea Dr. Su-Cheng HAW, Multimedia University, Faculty of Information Technology, Malaysia Dr. Myoung-Jin Kim, Soongsil University, Korea Dr. Gyu Myoung Lee, Institut Mines-Telecom, Telecom SudParis, France Dr. Dongkyun Kim, KISTI(Korea Institute of Science and Technology Information), Korea Prof. Yoonhee Kim, Sookmyung Women s University, Korea Prof. Li-Der Chou, National Central University, Taiwan Prof. Young Woong Ko, Hallym University, Korea Prof. Dimiter G. Velev, UNWE(University of National and World Economy), Bulgaria Dr. Tadasuke Minagawa, Meiji University, Japan Prof. Jun-Kyun Choi, KAIST (Univ.), Korea Dr. Brownson ObaridoaObele, Hyundai Mobis Multimedia R&D Lab , Korea Prof. Anisha Lal, VIT university, India Dr. kyeong kang, University of technology sydney, faculty of engineering and IT , Australia Prof. Chwen-Yea Lin, Tatung Institute of Commerce and Technology, Taiwan Dr. Ting Peng, Chang'an University, China Prof. ChaeSoo Kim, Donga University in Korea, Korea Prof. kirankumar M. joshi, m.s.uni.of baroda, India Dr. Chin-Feng Lin, National Taiwan Ocean University, Taiwan Dr. Chang-shin Chung, TTA(Telecommunications Technology Association), Korea
Copyright ⓒ 2016 GiRI (Global IT Research Institute)
Dr. Che-Sheng Chiu, Chunghwa Telecom Laboratories, Taiwan Dr. Chirawat Kotchasarn, RMUTT, Thailand Dr. Fateme Khalili, K.N.Toosi. University of Technology, Iran Dr. Izzeldin Ibrahim Mohamed Abdelaziz, Universiti Teknologi Malaysia , Malaysia Dr. Kamrul Hasan Talukder, Khulna University, Bangladesh Prof. HwaSung Kim, Kwangwoon University, Korea Prof. Jongsub Moon, CIST, Korea University, Korea Prof. Juinn-Horng Deng, Yuan Ze University, Taiwan Dr. Yen-Wen Lin, National Taichung University, Taiwan Prof. Junhui Zhao, Beijing Jiaotong University, China Dr. JaeGwan Kim, SamsungThales co, Korea Prof. Davar PISHVA, Ph.D., Asia Pacific University, Japan Ms. Hela Mliki, National School of Engineers of Sfax, Tunisia Prof. Amirmansour Nabavinejad, Ph.D., Sepahan Institute of Higher Education, Iran
Copyright ⓒ 2016 GiRI (Global IT Research Institute)
Editor Guide
Introduction for Editor or Reviewer
All the editor group members are to be assigned as a evaluator(editor or reviewer) to submitted journal
papers at the discretion of the Editor-in-Chief. It will be informed by eMail with a Member Login ID and
Password.
Once logined the Website via the Member Login menu in left as a evaluator, you can find out the paper
assigned to you. You can evaluate it there. All the results of the evaluation are supposed to be shown in
the Author Homepage in the real time manner. You can also enter the Author Homepage assigned to
you by the Paper ID and the author's eMail address shown in your Evaluation Webpage. In the Author
Homepage, you can communicate each other efficiently under the peer review policy. Please don't miss
it!
All the editor group members are supposed to be candidates of a part of the editorial board, depending
on their contribution which comes from history of ICACT TACT as an active evaluator. Because the main
contribution comes from sincere paper reviewing role.
Role of the Editor
The editor's primary responsibilities are to conduct the peer review process, and check the final camera-
ready manuscripts for any technical, grammatical or typographical errors.
As a member of the editorial board of the publication, the editor is responsible for ensuring that the
publication maintains the highest quality while adhering to the publication policies and procedures of
the ICACT TACT(Transactions on the Advanced Communications Technology).
For each paper that the editor-in-chief gets assigned, the Secretariat of ICACT Journal will send the
editor an eMail requesting the review process of the paper.
The editor is responsible to make a decision on an "accept", "reject", or "revision" to the Editor-in-Chief
via the Evaluation Webpage that can be shown in the Author Homepage also.
Deadlines for Regular Review
Editor-in-Chief will assign a evalaution group( a Editor and 2 reviewers) in a week upon receiving a
completed Journal paper submission. Evaluators are given 2 weeks to review the paper. Editors are
given a week to submit a recommendation to the Editor-in-Chief via the evaluation Webpage, once all or
enough of the reviews have come in. In revision case, authors have a maximum of a month to submit
their revised manuscripts. The deadlines for the regular review process are as follows:
Copyright ⓒ 2016 GiRI (Global IT Research Institute)

Evalution Procedure Deadline
Selection of Evaluation Group 1 week
Review processing 2 weeks
Editor's recommendation 1 week
Final Decision Noticing 1 week
Making Decisions on Manuscript
Editor will make a decision on the disposition of the manuscript, based on remarks of the reviewers. The
editor's recommendation must be well justified and explained in detail. In cases where the revision is
requested, these should be clearly indicated and explained. The editor must then promptly convey this
decision to the author. The author may contact the editor if instructions regarding amendments to the
manuscript are unclear. All these actions could be done via the evaluation system in this Website. The
guidelines of decisions for publication are as follows:
Decision Description Accept An accept decision means that an editor is accepting the paper with
no further modifications. The paper will not be seen again by the editor or by the reviewers.
Reject The manuscript is not suitable for the ICACT TACT publication.
Revision The paper is conditionally accepted with some requirements. A revision means that the paper should go back to the original reviewers for a second round of reviews. We strongly discourage editors from making a decision based on their own review of the manuscript if a revision had been previously required.
Role of the Reviewer
Reviewer Webpage:
Once logined the Member Login menu in left, you can find out papers assigned to you. You can also
login the Author Homepage assigned to you with the paper ID and author's eMail address. In there you
can communicate each other via a Communication Channel Box.
Quick Review Required:
You are given 2 weeks for the first round of review and 1 week for the second round of review. You must
agree that time is so important for the rapidly changing IT technologies and applications trend. Please
respect the deadline. Authors undoubtedly appreciate your quick review.
Copyright ⓒ 2016 GiRI (Global IT Research Institute)

Anonymity:
Do not identify yourself or your organization within the review text.
Review:
Reviewer will perform the paper review based on the main criteria provided below. Please provide
detailed public comments for each criterion, also available to the author.
How this manuscript advances this field of research and/or contributes something new to the literature?
Relevance of this manuscript to the readers of TACT? Is the manuscript technically sound? Is the paper clearly written and well organized? Are all figures and tables appropriately provided and are their resolution good quality? Does the introduction state the objectives of the manuscript encouraging the reader to read on? Are the references relevant and complete?
Supply missing references:
Please supply any information that you think will be useful to the author in revision for enhancing
quality of the paperor for convincing him/her of the mistakes.
Review Comments:
If you find any already known results related to the manuscript, please give references to earlier papers
which contain these or similar results. If the reasoning is incorrect or ambiguous, please indicate
specifically where and why. If you would like to suggest that the paper be rewritten, give specific
suggestions regarding which parts of the paper should be deleted, added or modified, and please
indicate how.
Copyright ⓒ 2016 GiRI (Global IT Research Institute)
Journal Procedure
Dear Author,
You can see all your paper information & progress.
Step 1. Journal Full Paper Submission
Using the Submit button, submit your journal paper through ICACT Website, then you will get new
paper ID of your journal, and send your journal Paper ID to the [email protected] for the review and
editorial processing. Once you got your Journal paper ID, never submit again! Journal Paper/CRF
Template
Step 2. Full Paper Review
Using the evaluation system in the ICACT Website, the editor, reviewer and author can communicate
each other for the good quality publication. It may take about 1 month.
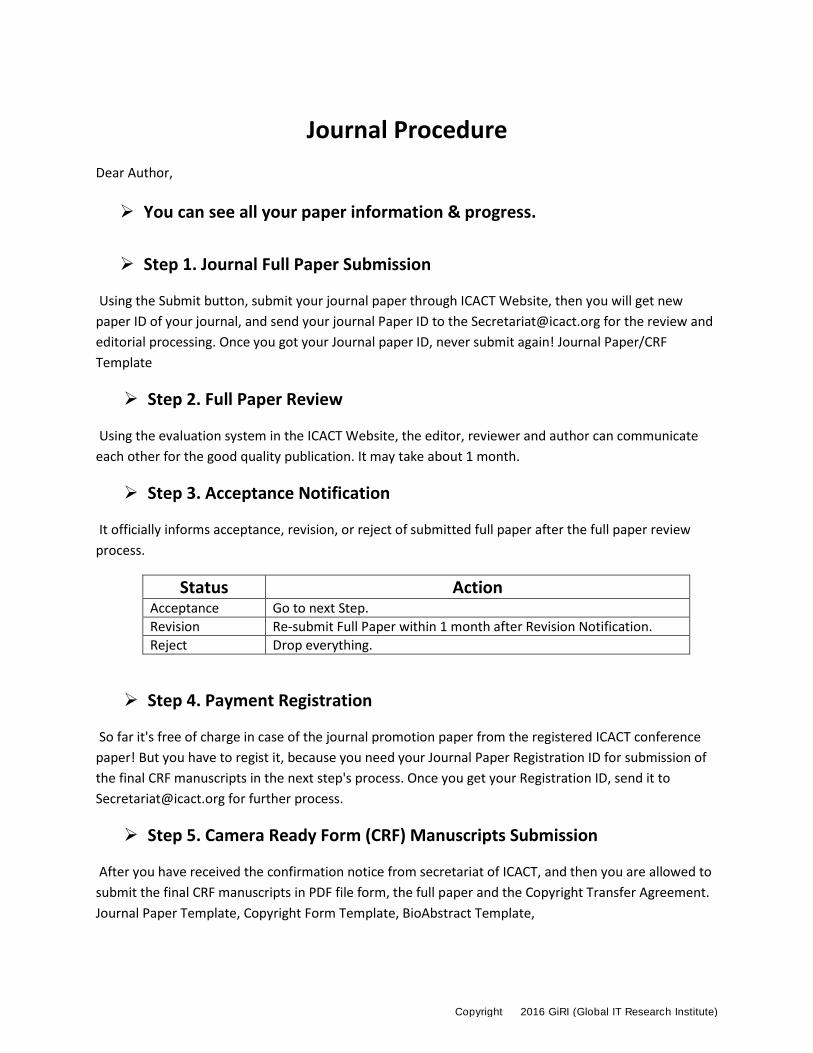
Step 3. Acceptance Notification
It officially informs acceptance, revision, or reject of submitted full paper after the full paper review
process.
Status Action Acceptance Go to next Step.
Revision Re-submit Full Paper within 1 month after Revision Notification.
Reject Drop everything.
Step 4. Payment Registration
So far it's free of charge in case of the journal promotion paper from the registered ICACT conference
paper! But you have to regist it, because you need your Journal Paper Registration ID for submission of
the final CRF manuscripts in the next step's process. Once you get your Registration ID, send it to
[email protected] for further process.
Step 5. Camera Ready Form (CRF) Manuscripts Submission
After you have received the confirmation notice from secretariat of ICACT, and then you are allowed to
submit the final CRF manuscripts in PDF file form, the full paper and the Copyright Transfer Agreement.
Journal Paper Template, Copyright Form Template, BioAbstract Template,
Copyright ⓒ 2016 GiRI (Global IT Research Institute)
Journal Submission Guide
All the Out-Standing ICACT conference papers have been invited to this "ICACT Transactions on the
Advanced Communications Technology" Journal, and also welcome all the authors whose conference
paper has been accepted by the ICACT Technical Program Committee, if you could extend new contents
at least 30% more than pure content of your conference paper. Journal paper must be followed to
ensure full compliance with the IEEE Journal Template Form attached on this page.
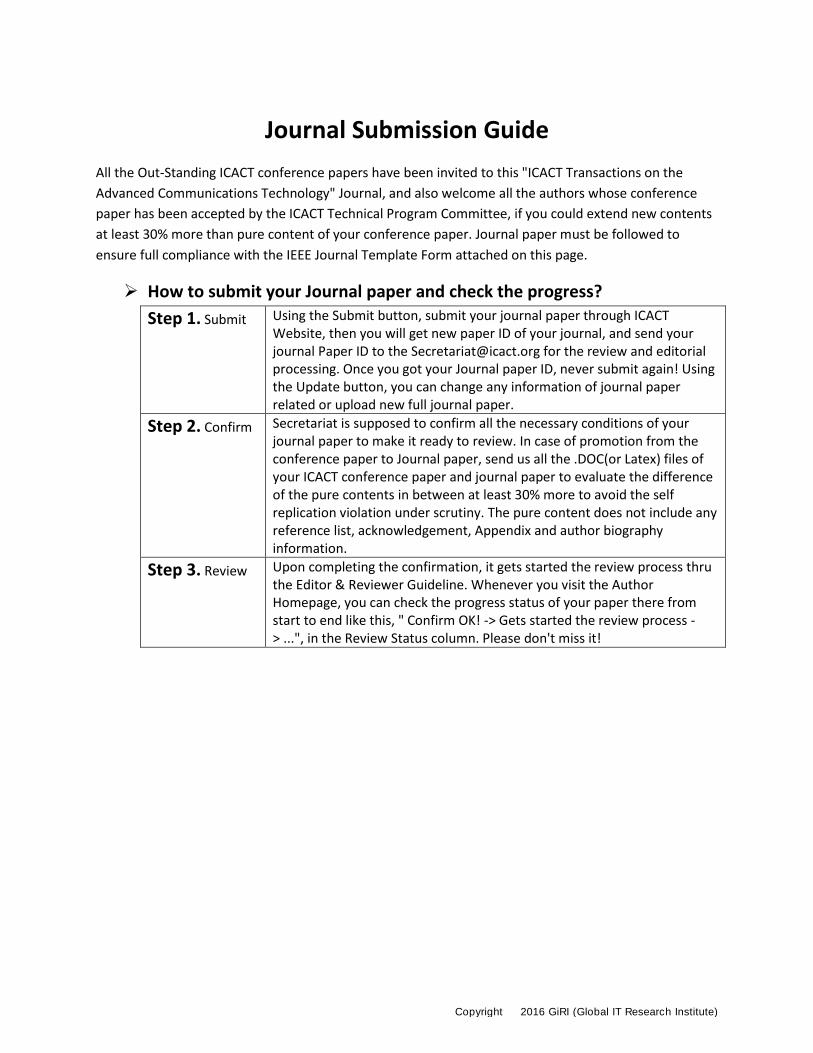
How to submit your Journal paper and check the progress?
Step 1. Submit Using the Submit button, submit your journal paper through ICACT Website, then you will get new paper ID of your journal, and send your journal Paper ID to the [email protected] for the review and editorial processing. Once you got your Journal paper ID, never submit again! Using the Update button, you can change any information of journal paper related or upload new full journal paper.
Step 2. Confirm Secretariat is supposed to confirm all the necessary conditions of your journal paper to make it ready to review. In case of promotion from the conference paper to Journal paper, send us all the .DOC(or Latex) files of your ICACT conference paper and journal paper to evaluate the difference of the pure contents in between at least 30% more to avoid the self replication violation under scrutiny. The pure content does not include any reference list, acknowledgement, Appendix and author biography information.
Step 3. Review Upon completing the confirmation, it gets started the review process thru the Editor & Reviewer Guideline. Whenever you visit the Author Homepage, you can check the progress status of your paper there from start to end like this, " Confirm OK! -> Gets started the review process -> ...", in the Review Status column. Please don't miss it!
Copyright ⓒ 2016 GiRI (Global IT Research Institute)

6J
780
787
797
809
816
4 CampusSense - A Smart Vehicle Parking Monitoring and Management System using ANPR
Cameras and Android Phones
Mohammed Y Aalsalem, Wazir Zada Khan
Farasan Networking Res. Lab, Faculty of Computer Science & Information System, Jazan University,
Kingdom of Saudi
5 An Effective Speedup Metric Considering I/O Constraint in Large-scale Parallel Computer
Systems
Guilin Cai*, Wei Hu*, Guangming Liu*,**, Qiong Li*, Xiaofeng Wang*, Wenrui Dong*
*College of Computer, National University of Defense Technology, Changsha, China
**National Supercomputer Center in Tianjin, Tianjin, China
3 Internet of Things: Security and Privacy Issues and Possible Solution
Davar PISHVA
Ritsumeikan Asia Pacific University, 1-1 Jumonjibaru, Beppu, Oita 874-8577 Japan
Volume. 5 Issue. 2
1 The Current State of Mobile Apps Development of Higher Education in Taiwan
Hsu-Chen CHENG *, Tsuei-Ping KUNG *, Chia-Ming LI *, Yu-Jou SUN *
* Wisdom Garden Research Center, Taiwan
2 Investigation of Different Ethernet Wiring and Different Frame Size to Enhance the
Performance of LAN
Ashraf M. Khalaf*, Mostafa S. Abd El Salam**, Khalil A. Ahmed*
*Faculty of Engineering, Department of Electricity, Minia University, Minia, Egypt
**Egyptian Electricity Holding Company, Cairo, Egypt
Copyright ⓒ 2016 GiRI (Global IT Research Institute)

1 Abstract—Mobile apps have had a large impact on many
industries including higher education for many years since it emerged. The goal of this research is to deepen our understanding of the state of mobile apps development at higher education institutions in Taiwan, and it focuses on three major issues: (a) how many institutions are there in Taiwan adopting mobile apps; (b) what are the popular mobile services in higher education; (c) and whether mobile apps play a more important role than mobile webs in delivering the mobile service on campus.
The research process was broken down into few phases. In
the beginning, this research searched all the institution-related mobile apps on Apple App Store and Google Play, and determined whether it was owned by an institution based on the decision tree. Next, the classification of mobile services was proposed for analyzing the content of every official mobile app. Last, the institutions which had both mobile apps as well as mobile webs were sorted out, and the difference of mobile services between the two deliveries was compared.
The results indicates that less than half of the institutions in
Taiwan have their own mobile apps, and the most popular mobile services on apps are general information as well as library services. And it also shows that the services delivered via mobile apps are more abundant than via mobile webs.
Keyword—Mobile App, Development, Higher Education in Taiwan, Classification of Mobile App Services, Mobile Web
I. INTRODUCTION
N this research, the state of mobile apps development consists of the following three issues: (a) the mobile apps
usage rate; (b) the popular mobile service; and (c) the main access to mobile service. Hence, the introduction would be given by the issues above.
A. The Mobile Apps Usage Rate
In recent years, mobile apps are more and more important in higher education. The NMC Horizon Report by 2012 indicated that mobile apps were the key technology that higher education would adopt within a year [1]. Besides, the relevant surveys showed that there were upward trends of
——————————————————————— Manuscript received April 8, 2015. This work is a follow-up of the invited
journal to the accepted conference paper of the 17th International Conference on Advanced Communication Technology.
Hsu-Chen Cheng is with Wisdom Garden Research Center, New Taipei City, 23444 Taiwan. (Corresponding author, phone: +886-2-7730-8100; fax: +886-2-2923-2589; e-mail: [email protected])
using mobile apps at higher education institutions in the United States and in Taiwan (see Fig. 1.), and the proportion got to 83% [2] and 56.7% [3] in 2014 respectively.
Evidently, implementing mobile apps is an inevitable tendency for higher education in the future, and there would be more and more institutions starting to adopt it. In other words, the percentage of institutions adopting mobile apps in 2015 would be larger than in 2014.
As a result, it is necessary to investigate how many institutions provide its own mobile apps in 2015. The concern would be addressed specifically in Taiwan.
B. The Popular Mobile Service
The EDUCAUSE survey [4] showed that American universities and colleges tended to place high priority on student- and public-facing mobile services, and the top three of them were primary web presence, learning/course management services as well as library services.
In addition, when it came to the “killer mobile app” for
higher education [4], most people regarded LMS (Learning Management System) and student services as top priority. Moreover, university libraries were moving toward the mobile web to deliver information access at the early stage of mobile enablement [5], so the library service was an important category for mobile services.
In this case, the research concerns what the most popular service is in higher education.
Tsuei-Ping Kung is with Wisdom Garden Research Center, New Taipei City, 23444 Taiwan. (phone: +886-2-7730-8100; fax: +886-2-2923-2589; e-mail: [email protected])
Chia-Ming Li is with Wisdom Garden Research Center, New Taipei City, 23444 Taiwan. (phone: +886-2-7730-8100; fax: +886-2-2923-2589; e-mail: [email protected])
Yu-Jou Sun is with Wisdom Garden Research Center, New Taipei City, 23444 Taiwan. (phone: +886-2-7730-8100; fax: +886-2-2923-2589; e-mail: rora @wisdomgarden.com)
The Current State of Mobile Apps Development
of Higher Education in Taiwan
Hsu-Chen CHENG *, Tsuei-Ping KUNG *, Chia-Ming LI *, Yu-Jou SUN *
* Wisdom Garden Research Center, Taiwan
{michael, evelyn, achilles.lee, rora}@wisdomgarden.com
I
Fig. 1. The trends of adopting mobile apps at higher education institutions in U.S. and in Taiwan
23%
42%
60%
78%83%
30.2%
53.2% 56.7%
0%
20%
40%
60%
80%
100%
2010 2011 2012 2013 2014
CCP survey in U.S. ISAC survey in Taiwan
ICACT Transactions on Advanced Communications Technology (TACT) Vol. 5, Issue 2, March 2016 780
Copyright ⓒ 2016 GiRI (Global IT Research Institute)

C. Mobile Apps vs. Mobile Webs
A mobile app is a program which is developed for small handheld devices [6] and installed directly onto it [7]. A mobile web is a website which is also developed specifically for mobile devices [8] but accessed through the mobile browser [7].
In most cases, mobile webs are more affordable than mobile app development [9], because it can be released in any form and any time without an approval by the app store or marketplace [7]. Moreover, mobile webs could be accessed by all types of platforms [10], and it is more flexible in the light of updating and changing content [9]. From the point of view of institutions, as a result, they prefer mobile webs rather than mobile apps.
However, students prefer to use mobile apps when they have the most mobile activities in their daily affairs (e.g. weather) as well as course-related tasks (e.g. access my course schedule) [11]. In addition, they consider that mobile apps have better performance in effectiveness of speed and ease of use than mobile webs [11]. Therefore, which access to provide is a major concern for institutions.
In light of these concerns, the assumptions of the research are listed below: (a) the mobile apps usage rate would be larger than the counterpart of the ISAC survey in 2014 [3] which is the researchers’ previous study; (b) LMS and library
services are the most popular categories of mobile services in higher education in Taiwan; and (c) mobile apps are the main access to mobile service base on the trend of using mobile apps in higher education.
II. RESEARCH DESIGN AND METHODS
The research was conducted during the period from January 25, 2015, through April 7, 2015. The content analysis was undertaken in this research and composed of five phases, which was summarized as follows:
A. Collecting Mobile Apps Related to Institutions
The related survey [3] suggested that the institutions in Taiwan preferred to publish their mobile apps for distribution via Android (100%) and iOS (70.8%). As a result, the search for mobile apps related to all the higher education institutions in Taiwan [12] would be limited to the two platforms, Google Play and Apple App Store, for this research.
Then, the researcher typed every institution’s Chinese
name as well as its English abbreviation sequentially in the search bar on the two platforms. Finally, around 670 apps associated with all the institutions in Taiwan were founded during the period from February 6, 2015, through February 10, 2015.
B. Determining Whether a Mobile Apps Is Official
The first issue of this paper is how many institutions are there in Taiwan adopting mobile apps. Therefore, it is necessary to justify whether an institution has its own mobile apps or not, and then the decision tree (see Fig. 2.) is developed for determining whether a mobile app is owned by an institution. The criteria was summarized as follows:
First, official mobile apps of institutions should be maintained properly, and its renewal should not be so long ago from now. As a result, if the mobile app was not updated in the past three years, it would not be regarded as an official
one. Second, the use of an institution-owned mobile app
should be widespread on campus. If the installs of a mobile app did not exceed 500 times, it would be regarded as non-official.
Third, the official mobile apps should be introduced in the name of an institution or a corporation, or it would be considered as non-official. In the case of a corporation being the developer of the mobiles app, it was assumed that the institution outsourced their mobile apps to the corporation.
Forth, the services provided through an official apps should be institution-wide. If the mobile app’s description did
so, it would be regarded as official and would be downloaded to the researcher’s mobile device.
Finally, the research got 177 official mobile apps associated with higher education institutions in Taiwan based on the decision tree.
C. Proposing the Classification of Mobile Services
In order to analyze what the content of every mobile app is, it is necessary to propose the classification of mobile services.
According to the category of the killer apps for higher education [4], the research drafted the classification of mobile services and then made use of it to examine the content of official apps in the analysis of pretest.
In the process of the pretest, the classification was adjusted and refined gradually and it became more mutually exclusive as well as collectively exhaustive. The revision of the classification of mobile services in higher education is showed on TABLEⅠ.
D. Analyzing the Content of Official Mobile Apps
Then, the researchers examined the content of every official mobile apps based on the classification (see TABLEⅠ) and recorded what services it provides. The frequency data was record by mobile apps initially, but it was converted into the statistics by institutions later.
For instance, the app 01, app 02 as well as app 03 belonged to the institution A, and the frequency of their services in sum was below: category A got three times, category B got two times, and category C got nothing. Then this research concluded that the institution A provided the service of category A and B, but not category C.
Fig. 2. The decision tree for determining whether a mobile app is official
ICACT Transactions on Advanced Communications Technology (TACT) Vol. 5, Issue 2, March 2016 781
Copyright ⓒ 2016 GiRI (Global IT Research Institute)

E. Comparing Mobile Webs to Mobile Apps
The third issue of this research is to discuss whose service is more diversified, mobile apps or mobile webs. The research design of the section is as follows:
At the beginning, the researcher visited every institution’s
primary websites presence via a mobile browser and determined whether it was a mobile web or not (see TABLE Ⅱ). Then it was filtered out that the institutions having both a mobile web and mobile apps, which amounted to 30 institutions.
Next, the mobile webs of these 30 institutions were categorized into two types, the general type and the special type. This research focused on the mobile webs belonging to the special type which included 16 institutions.
Third, what service the mobile web provided was analyzed. If the icon of a service on the mobile web was linked to a standard website instead of a page with responsive design (RD), then it was concluded that the mobile web did not provide this kind of service.
Finally, the services between mobile webs and mobile apps of the 16 institutions were compared.
III. RESULTS
A number of interesting findings emerged from this process, but this section focused on the three issues: (a) the mobile apps usage rate; (b) the popular mobile service; and (c) the main access to mobile services.
A. The Mobile Apps Usage Rate
Around 43% of institutions, which was 68 of 159, adopted mobile apps (see TABLE Ⅲ) in Taiwan and they seemingly preferred to deploy their mobiles apps for iOS (82%) rather than Android (75%).
According to the results, institution’s size did matter in
reference to the mobile apps usage rate. Large institutions were more likely than medium and small institutions to adopt mobile apps with the rate at 78 percent, as opposed to 49% of medium institutions as well as 23% of small institutions.
Generally speaking, institutions in Taiwan tended to publish their mobile apps on iOS instead of Android, and small institutions was the most evident example of that viewpoint because of its greatest difference of usage rate between the two platforms among all types of institutions. However, there was a result in the opposite direction. In relation to the type of institutions by education system, universities and colleges slightly favored Android.
Interestingly, such a few types of institutions as large institutions and medium institutions had the same usage rate between iOS and Android, but it did not mean that every institution deployed their apps for the two platforms simultaneously.
Approximately two thirds of institutions (68%) owned one or two mobiles apps, leading those who had three or four (19%) as well as five and more (13%). The average for those surveyed was 2.6 units, which indicated that only a third of institutions (32%) above the average (see TABLE Ⅳ).
TABLEⅠ THE CLASSIFICATION OF MOBILE SERVICES IN HIGHER EDUCATION
Categories Examples
Administration Making Complaints Punch in/out
General Information Directory Campus Maps Events Calendar
Personal Information Push Notification Financial Services Inquiry Social Network
LMS Learning Management System Courses/Grades Inquiry
e-Learning e-Books Videos/Images
Productivity Cloud e-Mail
Student Services Reservations Emergency Call
Library Services Library Catalog Renew Materials
Alumni Services Events Information
PS. Each category is including but not limited to above examples.
TABLE Ⅲ
THE MOBILE APPS USAGE RATE For all
institutions For institutions
adopting mobile apps
Mobile apps
For iOS For Android
All institutions 42.8% 82.4% 75.0%
Universities & Colleges 47.9% 85.3% 88.2%
Technical Colleges 38.6% 79.4% 61.8%
Large institutions 77.8% 92.9% 92.9%
Medium institutions 49.4% 77.5% 77.5%
Small institutions 23.3% 85.7% 50.0%
Public institutions 45.1% 91.3% 73.9%
Private institutions 41.7% 77.8% 75.6%
TABLE Ⅱ THE CRITERIA FOR ANALYZING MOBILE WEB
Issues Criteria
Does the institution have a mobile web?
Yes, if the layout of the website on the mobile browser was a responsive design. No, if the layout of the website was like the page of standard websites on computer.
What the type dose the mobile web belong to?
General type, if the layout of the page would be automatically adjusted according to a device’s screen size. Special type, if there were additional modular icons on the page in addition to the features of the general type.
Does a mobile web provide some kind of service?
Yes, if the icon of a service was linked to a page with responsive design No, if the icon of a service was linked to a standard website.
ICACT Transactions on Advanced Communications Technology (TACT) Vol. 5, Issue 2, March 2016 782
Copyright ⓒ 2016 GiRI (Global IT Research Institute)

B. The Popular Mobile Service
The most popular mobile service provided by institutions through their mobile apps was general information (75%), leading library services (62%), personal information (60%), LMS (54%), e-learning (52%), student services (50%), productivity (16%), alumni services (9%), and administration (6%) (see TABLE V). The number in the parentheses referred to the percentage of institutions which offered a certain kind of mobile service and was named “the supply rate” in this
research. Consequently, the result showed that six of nine mobile services were offered by more than half of institutions while the others were furnished by less than 20% of institutions. In researcher’s opinion, higher education
institutions in Taiwan had a strong preference in some mobile services.
When it came to the most prevalent mobile service in institutions’ mobile apps, the ranking of mobile services was
identical to the order by the supply rate. However, only one of them, general information (57%), existed in more than half of institutions’ mobile apps. Less than half of mobile apps were equipped with the following mobile services, including library services (42%), personal information (40%), LMS (37%), e-learning (36%), student services (33%), productivity (15%), alumni services (5%), and administration (3%) (see TABLE V).
Besides, it was observed that institutions’ preference for
mobile services seemed to alter by control of school. For
example, public institutions gave top priority to library services (74%) while private institutions put greater emphasis on general information (84%) (see TABLE VI). Second, e-Learning was one of the top three mobile services for private institutions but not for public institutions. Third, an ANOVA test showed that private institutions were more likely than public institutions to provide general information as well as e-Learning.
How many mobile services an institution offered was examined in this research. Less than half of institutions (47%) supplied three or fewer mobile services (see TABLE VII), and the average for those surveyed was 4 units. There was an obvious gap between six units (18%) and seven units (10%), which displayed that providing more than seven units of mobile services was a high threshold for higher education in Taiwan.
Moreover, the researcher wondered how many mobile services an institution provided though a mobile app. The researcher set a value called efficiency and its formula was “the number of mobile services of the institution” divided by
“the number of that institution’s mobile apps. The value of
efficiency presented the mean of mobile services per mobile app of an institution. The larger the value was, the more services a mobile app provided.
The institutions with value of efficiency between 1.00~1.99 accounted for 41 percent of the total, and those whose value of efficiency exceed 4.0 merely accounted 9 percent (see TABLE VIII). Interesting, there was roughly
TABLE VII. THE DISTRIBUTION OF MOBILE SERVICES AN INSTITUTION PROVIDED
Number of unit(s)
Pct. of institutions (n=68)
Cumulated pct. of institutions
(n=68)
One 11.8% 11.8%
Two 14.7% 26.5%
Three 20.6% 47.1%
Four 13.2% 60.3%
Five 11.8% 72.1%
Six 17.6% 89.7%
Seven 5.9% 95.6%
Eight 4.4% 100.0%
TABLE Ⅳ THE DISTRIBUTION OF MOBILE APPS AN INSTITUTION OWNED
Number of official app(s)
Pct. of institutions (n=68)
Cumulated pct. of institutions
(n=68)
One 33.8% 33.8%
Two 33.8% 67.6%
Three 10.3% 77.9%
Four 8.8% 86.8%
Five 4.4% 91.2%
Six 2.9% 94.1%
Seven 2.9% 97.1%
Eight and more 2.9% 100.0%
TABLE V. THE STATISTICS ABOUT MOBILE SERVICES
Pct. of institutions
(n=68)
Pct. of mobile apps
(n=177)
General Information 75.0% 57.1%
Library Services 61.8% 42.4%
Personal Information 60.3% 40.1%
LMS 54.4% 37.3%
e-Learning 51.5% 36.2%
Student Services 50.0% 33.3%
Productivity 16.2% 14.7%
Alumni Services 8.8% 5.1%
Administration 5.9% 3.4%
TABLE VI. THE STATISTICS ABOUT MOBILE SERVICES BY CONTROL OF SCHOOL
Pct. of public institutions
(n=23)
Pct. of private institutions
(n=45)
General Information 56.5% 84.4%
e-Learning 21.7% 66.7%
Personal Information 60.9% 60.0%
LMS 47.8% 57.8%
Library Services 73.9% 55.6%
Student Services 52.2% 48.9%
Productivity 21.7% 13.3%
Alumni Services 8.7% 8.9%
Administration 4.3% 6.7%
ICACT Transactions on Advanced Communications Technology (TACT) Vol. 5, Issue 2, March 2016 783
Copyright ⓒ 2016 GiRI (Global IT Research Institute)

10% of institutions with value of efficiency less than 1.00, which showed that their mobile services were overlapping largely. Briefly, the average for those surveyed was 2 units.
There was a significant difference in the value of efficiency with respect to control of school: private institutions were more likely than public institutions to provide more mobile services with less mobile apps.
Next, the mobile services were focused again. In this research, two numbers, “the multi-app rate” and “the service
multiple”, were calculated in order to understand the degree
of diversity or redundancy of a mobile service. The multi-app rate was the proportion of institutions
offering a certain kind of mobile service via two or more apps. The larger the multi-app rate was, the larger degree of diversity or redundancy a mobile service was. Among the mobile services, productivity had the highest multi-app rate (91%), leading e-Learning (69%), student services (68%) and so on (see TABLE IX).
The service multiple was the division gained from the number of mobile apps furnishing a certain mobile service divided by the number of institutions providing the same mobile service. It displayed how many mobile apps was used to support a mobile service by an institution. The larger the service multiple was, the larger degree of diversity or redundancy a mobile service was. Among the mobile services, productivity also had the highest value (2.36), followed by general information (1.98), e-Learning (1.83), etc. (see TABLE IX).
The supply rate mentioned above stood for the degree of widespread of a mobile service because it presented “how
many institutions offer the mobile service”. On the other hand,
the multi-app rate and the service multiple represented “the
degree of diversity or redundancy of a mobile service”. From the aspect of the supply rate, personal information
was one of the top three mobile services, trailing behind general information and library services, yet it came in seventh place with respect to the degree of diversity or redundancy of mobile services. It showed that personal information was offered by most intuitions via just one or two mobile apps (see TABLE X).
However, the result of productivity was in the opposite direction: productivity had a quite low ranking by the supply rate but became the top one by the degree of diversity or redundancy. That was, once productivity was offered by an institution, it would be supported by relatively more mobile apps (see TABLE X).
C. Mobile Apps vs. Mobile Webs
Around 33% of institutions in Taiwan adopted mobile webs (see TABLE XI). Again, the institutions’ size had much
things to do with the mobile webs usage rate. For example, large institutions (56%) were more likely than medium (40%) and small institutions (17%) to adopt mobile webs.
Besides, among all types of institutions, the mobile webs usage rate was always lower than the mobile apps usage rate (see TABLE XI), which indicated that the institutions in Taiwan tended to focus their mobile enablement on apps instead of webs.
For those institutions who adopted mobile apps and mobile webs simultaneously, a certain kind of mobile service might be provided by their mobile apps but not mobile webs, and
TABLE X. THE RANKING OF MOBILE SERVICES BY THREE CRITERIA
By supply rate
By multi-app rate
By service multiple
General Information 1 4 2
Library Services 2 5 4
Personal Information 3 7 7
LMS 4 6 5
e-Learning 5 2 3
Student Services 6 3 6
Productivity 7 1 1
Alumni Services 8 8 8
Administration 9 8 8
TABLE VIII. THE DISTRIBUTION OF THE VALUE OF EFFICIENCY
Value of efficiency
Pct. of institutions (n=68)
5.00~5.99 2.9%
4.00~4.99 5.9%
3.00~3.99 19.1%
2.00~2.99 19.1%
1.00~1.99 41.2%
0.00~0.99 11.8%
TABLE IX. THE DEGREE OF DIVERSITY OR REDUNDANCY OF MOBILE SERVICES
The multi-app
rate The service
multiple
Productivity 90.9% 2.36
e-Learning 68.6% 1.83
Student Services 67.6% 1.74
General Information 64.7% 1.98
Library Services 64.3% 1.79
LMS 62.2% 1.78
Personal Information 56.1% 1.73
Administration 50.0% 1.50
Alumni Services 50.0% 1.50
TABLE XI. THE USAGE RATE: MOBILE WEBS VS. MOBILE APPS
Pct. of institutions adopting
mobile webs (n=159)
Pct. of institutions adopting
mobile apps (n=159)
All institutions 32.7% 42.8%
Universities & Colleges 32.4% 47.9%
Technical Colleges 33.0% 38.6%
Large institutions 55.6% 77.8%
Medium institutions 39.5% 49.4%
Small institutions 16.7% 23.3%
Public institutions 37.3% 45.1%
Private institutions 38.1% 41.7%
ICACT Transactions on Advanced Communications Technology (TACT) Vol. 5, Issue 2, March 2016 784
Copyright ⓒ 2016 GiRI (Global IT Research Institute)

vice versa. The four possible situations were described in Fig. 3. A mobile service was placed in the corresponding quadrant according to the situation the majority of institutions belonged to. Frist, many institutions offered general information (88%) and library services (31%) via both their apps and webs. Second, three mobile services was provided via apps but not webs, including personal information (63%), LMS (56%) and e-Learning (38%). Third, most of institutions did not provide some kinds of mobile services via neither mobile apps nor mobile webs, such as alumni services (88%), administration (81%), productivity (69%), and student services (44%). Apparently, there was no mobile service offered via mobile webs but not mobile apps.
Furthermore, the detail of the percentage by mobile services was viewed. Among the services provided by both mobile apps and mobile webs, only general information exceeded 80% of institutions while the other night of ten were below 35%, even four of them were zero (see TABLE XII). It showed that there was no room for mobile webs to replace mobile apps.
Besides, there were four mobile services that mobile apps provided but mobile webs did not, including personal information (62.5%), LMS (56.3%), administration (18.8%) and productivity (18.8%). It specified that the mobile services delivered via mobile apps were more abundant than via mobile webs. Hence, the conclusion of this part was that the main access to mobile service for institutions in Taiwan was mobile apps instead of mobile webs.
IV. CONCLUSIONS
The last two of the assumptions of the research are supported while the first one is not. There is an explanation for the result. Besides, four limitations of the research would be summarized.
A. Findings
The result indicates that the mobile apps usage rate of higher education institutions in Taiwan is 42.8%, as opposed to 56.7% of the ISAC 2014 survey, which rejects the first
assumption. There is a way to explain such a result. The criteria of this research for determining whether a mobile app is official is strict that the percentage of adopting mobile apps declined. For example, a mobile app whose developer is a person would be regarded as non-official even though its copyright belongs to an institution or a corporation.
The most popular mobile services provided by institution in Taiwan via official apps are as follows: general information, library services, personal information and LMS. In addition, more than half of the institutions offer these services. Hence, the second assumption is supported.
The services delivered via mobile apps are more abundant than via mobile webs, which indicates that mobile app is the main tool for delivering mobile services for higher education in Taiwan. As results, it is concluded that the third assumption is supported and serving users takes priority over cutting cost in the consideration of the institutions in Taiwan.
B. Limitations
First, if the name or the developer of an official app was irrelevant to the institution’s name then researchers could not
find it out, which may affected the usage rate.
TABLE XIII. THE OUTCOMES OF THE RESEARCH
Assumptions Results The usage rate of the institutions of this research is larger than the counterpart of the ISAC survey in 2014.
The percentage of this paper is 42.8% as opposed to 56.7% of the ISAC 2014 survey.
LMS and library services are the most popular categories of mobile services in higher education in Taiwan.
In terms of frequency, library services and LMS are at top 2 and top 4 respectively, and both of them are provided by more than half of institutions in Taiwan.
The main access to mobile services for institution in Taiwan is mobile app instead of mobile web.
The services delivered via mobile apps are more abundant than via mobile webs
TABLE XII. CONTENT ANALYSIS ACROSS MOBILE APP AND MOBILE WEB
Does It Provide? App does Web does
(n=16)
App doesn’t
Web does (n=16)
App does Web doesn’t
(n=16)
Administration 0.0% 0.0% 18.8%
General Information 87.5% 12.5% 0.0%
Personal Information 0.0% 0.0% 62.5%
LMS 0.0% 0.0% 56.3%
e-Learning 25.0% 12.5% 37.5%
Productivity 12.5% 0.0% 18.8%
Student Services 12.5% 6.3% 37.5%
Library Services 31.3% 18.8% 25.0%
Alumni Services 0.0% 37.5% 0.0%
Others 12.5% 12.5% 12.5%
PS. The number is the percentage of institutions.
Fig. 3. The situation the majority of institutions belonged to by mobile services
Not Adopting Mobile Webs
Adopting Mobile Apps
Not Adopting Mobile Apps
Adopting Mobile Webs
General Information (87.5%)Library Services (31.3%)
Personal Information (62.5%)LMS (56.3%)e-Learning (37.5%)
Alumni Services (87.5%)Administration (81.3%)Productivity (68.8%)Student Services (43.8%)
ICACT Transactions on Advanced Communications Technology (TACT) Vol. 5, Issue 2, March 2016 785
Copyright ⓒ 2016 GiRI (Global IT Research Institute)

Second, there was no information about the installs of an app on Apple App Store. If the installs of an app were less than 500 times then the researcher could not cross it out.
Third, it was impossible to analyze the content of some mobile services on the mobile app or the mobile web due to no user accounts to log in. If the researcher could not ensure that the institution did provide the service, then it didn’t.
Finally, a concise method of analysis was taken because of the restriction of time. For mobile apps, the researcher regarded the app on iOS and Android as the same in case that its name, developer and user interface are the same. The analysis result of one of them would be applied to the other. For mobile webs, analyzing the institutions belonging to the special type of 16 were focused on instead of the general type of 30.
REFERENCES
[1] L. Johnson, S. Adams and M. Cummins, The NMC Horizon Report: 2012 Higher Education Edition, The New Media Consortium, Austin, Texas, 2012.
[2] C. Green and K. C. Green, The 2014 National Survey of Computing and Information Technology in US Higher Education, The Campus Computing Project, Los Angeles, California, 2014.
[3] D. M. Hwang and C. H. Cheng, The 2014 National Survey of Information Techonology in Taiwan Higer Education, Information Service Association of Chinese Colleges (ISAC), Taipei, Taiwan, 2014.
[4] G. Dobbin, E. Dahlstrom and M. C. Sheehan, Mobile IT in Higher Education, 2011 (Research Report), EDUCAUSE Center for Applied Research, Louisville, Colorado, 2011.
[5] A. Aldrich, Universities and Libraries Move to the Mobile Web., Jun. 24, 2010. [Online]. Available: http://www.educause.edu/ero/article/universities-and-libraries-move-mobile-web. [Accessed Jan. 1, 2015].
[6] P. Viswanathan, What is a Mobile Application?, About.com, [Online]. Available: http://mobiledevices.about.com/od/glossary/g/What-Is-A-Mobile-Application.htm. [Accessed Mar. 25, 2015].
[7] M. Hostad and S. Owczarek, Mobile Apps, Mobile Web, and Other Cool Tools, Nov. 9, 2012. [Online]. Available: https://registrar.wisc.edu/documents/UMACRAO_WACRAO_Mobile.pdf. [Accessed Jan. 12, 2015].
[8] J. Brewer, Mobile Site vs. Mobile App: What You Need to Know About Going Mobile, BROLIK PRODUCTIONS, INC, Mar. 2, 2011. [Online]. Available: http://brolik.com/blog/mobile-site-vs-mobile-app/. [Accessed Apr. 2, 2015].
[9] I. Bizness Apps, Mobile Apps VS Mobile Websites, Mar. 21, 2013. [Online]. Available: http://www.slideshare.net/biznessapps/mobile-apps-vs-mobile-websites-17466120?qid=2e38e3df-6648-4ba5-8a4c-e110ee165156&v=qf1&b=&from_search=2. [Accessed Feb. 5, 2015].
[10] J. Summerfield, Mobile Website vs. Mobile App (Application):Which is Best for Your Organization?, Human Service Solutions, [Online]. Available: http://www.hswsolutions.com/services/mobile-web-development/mobile-website-vs-apps/. [Accessed Jan. 16, 2015].
[11] K. Bowen and M. D. Pistilli, Student Preferences for Mobile App Usage, EDUCAUSE Center for Applied Research, Louisville, Colorado, 2012.
[12] Bureau of Statistics, Directory of Colleges and Universities in Taiwan by 2014-2015, Ministry of Education, Taiwan, Taipei, Taiwan, 2014.
Hsu-Chen CHENG became a Member (M) of IEEE in 2000. He earned his Ph.D. in information management in National Taiwan University, Taipei, Taiwan, in 2005. He is the PRESIDENT of WisdomGarden in Taipei and has been working in the field of educational technology in higher education for more than 20 years with a focus on campus IT research, implementation of credit systems, teachers’ IT literary,
and ICT integration in teaching and learning. Prior to
his current role, he served as a campus CIO and an associate professor, accumulating rich knowledge and experiences in campus IT operation, IT management, and student teaching.
He is also a regular speaker at many important educational technology conferences and a project initiator for developing innovative educational products. So far his products have been used by over 30 universities and enterprises in Greater China, and are awarded several patents in USA, mainland China, and Taiwan.
Tsuei-Ping Kung earned her MA degree in learning, design and technology in Stanford University, CA, USA, in 2008. She is the MANAGING CONSULTANT of WisdomGarden in Taipei and has been working in the field of educational technology for nearly 10 years. At her current role, she is responsible for formulating institutional strategies, reengineering business processes, implementing academic ERP, and conducting campus IT research of higher education.
Prior to that, she served as a consultant in IBM, aiming to apply multiple technologies and blended learning methods to enterprise learning. With her professionalism, many of the top 100 enterprises had been successfully transformed to vigorous learning enterprises.
Chia-Ming Li graduated with a degree in history in 2009 and earned his MBA in 2013 both from National Chengchi University (NCCU), Taipei, Taiwan. Now he is the RESEARCHER of WisdomGarden in Taipei, and takes responsibility for industry study of educational technology in higher education. Furthermore, he is in charge of collecting, organizing and carrying out complex data analysis in support of management as well as customer requests, and also
involved in reporting statistical findings to developing data-driven strategies with senior managers.
Prior to the current position, Mr. Li served as a second lieutenant while fulfilling his compulsory military service in 2010. Besides, Mr. Li had an overseas internship for two months at Sinyi Realty in Shanghai, China, when he was an MBA student in 2012.
Yu-Jou Sun earned her MBA in 2014 from Feng Chia University, Taichung City, Taiwan, and Double Bachelor Commerce Degrees in 2012 in financial and economic law as well as finance from Chihlee Institute of Technology, New Taipei City, Taiwan. Now she is the ASSISTANT RESEARCHER of WisdomGarden in Taipei, and responsible for industry study of educational technology in higher education. Prior to the current position, she had an overseas internship for
two months at ACE group International Management Consulting Co. in Dongguan, China, when she was an undergraduate in 2011.
ICACT Transactions on Advanced Communications Technology (TACT) Vol. 5, Issue 2, March 2016 786
Copyright ⓒ 2016 GiRI (Global IT Research Institute)

Abstract—A computer network that covers only a small
area networks abbreviated Local Area Network LAN, is used in campus computer networks, buildings, offices, in homes, schools or smaller.Currently, most LANs based on the IEEE 802.3 Ethernet technology using devices such as hubs and switches, which have a data transfer speed of 10, 100, or 1000 Mega bit /s (Mbps). In this paper, we are investigating the different Ethernet wiring standard and different frame size.
Keyword—frame size,10BaseT,100BaseT,LAN performance,Switch, Hub.
I. INTRODUCTION
A LAN is a computer network limited to a small area such as an office building, university, or even a residential home. Most mid to large-sized businesses today use LANs, which makes it easy for employees to share information. Currently, the most common type of LANs are Ethernet-based.
The Ethernet standard comprise several wiring and signaling variants of the OSI physical layer in use with Ethernet. The original 10BASE5 Ethernet used coaxial cable as a shared medium. Later the coaxial cables were replaced with twisted pair and fiber optics links in conjunction with hubs or switches.
System communicating over Ethernet divide a stream of data into shorter piece called frames. Each frame contains source and destination addresses and error-checking data so that damaged data can be detected and re-transmitted. As per the OSI model. Ethernet provides services up to and including the data link layer.
Collisions happen when two stations attempt to transmit at the same time. They corrupt transmitted fata and require stations to transmit. The lost data and retransmissions reduce throughput. In the worst case where multiple active hosts
———————————————————————
Manuscript received at October 11, 2014. This work was self-supported, and a follow-up of the invited journal to the accepted conference paper of the 17th International Conference on Advanced Communication Technology, and with no Grants.
Ashraf M. Khalaf is with the Faculty of Engineering, Department of Electrical Engineering. (Ashraf M. Khalaf, Phone: +20 86 2355261; fax: +20 86 2346674; e-mail: [email protected]).
Mostafa S. Abd El Salam, was with Egyptian Electricity Holding Company, Houston, Ministry of Electricity and Renewable Energy (Phone: +20227271045; e-mail: [email protected]).
Khalil A. Ahmed is with the Faculty of Engineering, Department of Electrical Engineering. (E-mail: [email protected]).
connected with maximum allowed cable length attempt to transmit many short frames, excessive collisions can reduce throughput dramatically.
LAN is found in many business environments thatlinks a workgroup of task-related personal computers (PCs), for example, engineering workstations or accounting PCs. One of the computers is given a large capacity disk drive and become a server toall other PCs. Software can be stored on this server and used by the wholeclients of the group.
In the implementation of LAN, we use different types of devices such as repeater, switches, hubs, connectors and different cables. Currently, most LANs based on the IEEE 802.3 Ethernet technology using devices such as hubs and switches, which have a data transfer speed of 10, 100, or 1000 Mega bit/s (Mbps).
In the work done in [1], they are measuring the LAN performance. Their work depends on variation of the time of simulation and the number of hubs and making the frame size fixed value of (46, 2000 bytes)with segmentation (1500 bytes).
In the work done in [2], they are evaluating the performance of the LAN by varying the frame size between (1500, 1024 and 512) only and the variation of the Ethernet wiring standard.
In this paper, we evaluate and test the performance of LANs under different conditions of Ethernet wiring (10BaseT and 100BaseT) and different frame size (1500, 1024, 512, 128 and 64 bytes). The collision count, utilization, data traffic received and data traffic sent is calculated in each case of conditions for hub. For switch the parameters that will be measured is data traffic sent, data traffic received and filtered traffic. Simulations are performed by using Riverbed Modeler Academic edition. In our work we are seeking to simulate 1000BaseT as another type of Ethernet cables with data transmission speed 1000Mbps but the problem that the simulation tool that we used contains 10BaseT, 100BaseT and 10Gig but not contains 1000BaseT as an Ethernet cable.
A network station wishing to transmit will first check the cable plant to ensure that no other station is currently transmitting (CARRIER SENSE) since the communications medium us one cable, therefore, it does allow multiple stations access to it with all being able to transmit and receive on the same cable (MULTIPLE ACCESS). Error detection is implemented throughout the use of station “listening” while
it is transmitting its data. Two or more stations transmitting cause a collision (COLLISION DETECTION), jam signal is transmitted to network by a jam signal is transmitted to
Investigation of Different Ethernet Wiring and Different Frame Size to Enhance the
Performance of LAN
Ashraf M. Khalaf*, Mostafa S. Abd El Salam**, Khalil A. Ahmed*
*Faculty of Engineering, Department of Electricity, Minia University, Minia, Egypt
**Egyptian Electricity Holding Company, Cairo, Egypt
[email protected],[email protected], [email protected]
ICACT Transactions on Advanced Communications Technology (TACT) Vol. 5, Issue 2, March 2016 787
Copyright ⓒ 2016 GiRI (Global IT Research Institute)
network by the transmitting stations that detected the collision, to ensure that all stations know of the collision. All stations will “back off” for a random time. Detection and
retransmission is accomplished in microseconds.
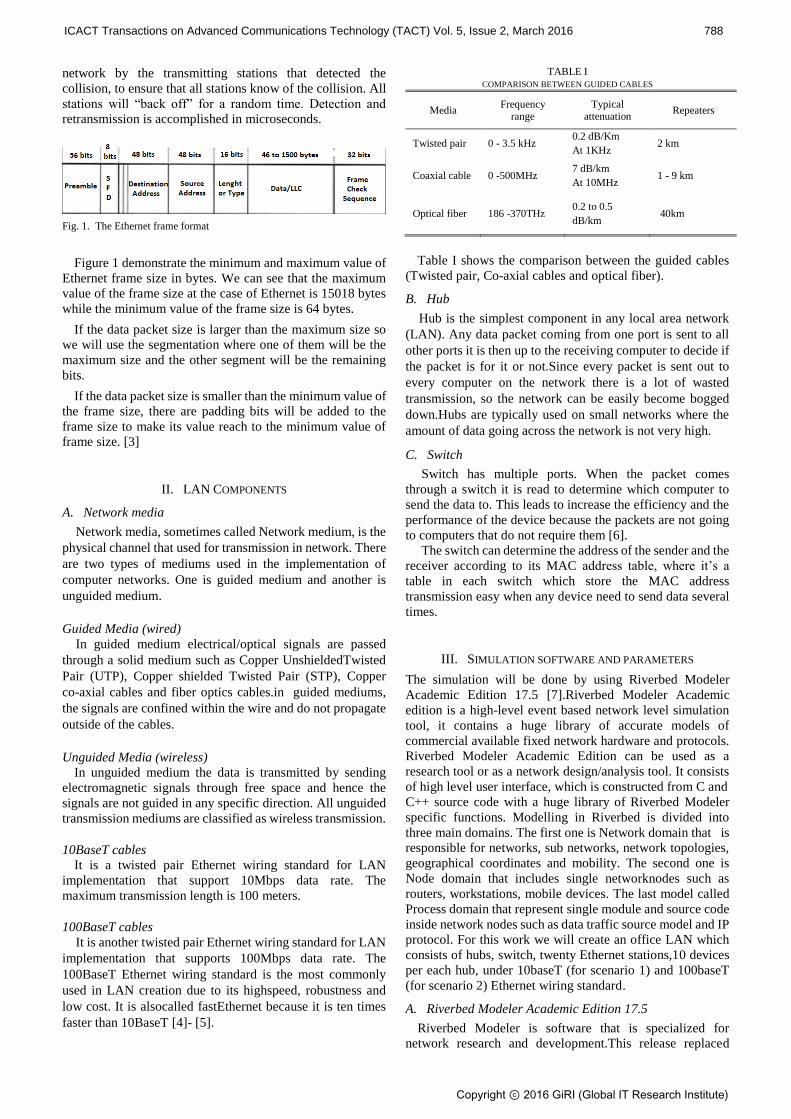
Fig. 1. The Ethernet frame format
Figure 1 demonstrate the minimum and maximum value of Ethernet frame size in bytes. We can see that the maximum value of the frame size at the case of Ethernet is 15018 bytes while the minimum value of the frame size is 64 bytes.
If the data packet size is larger than the maximum size so we will use the segmentation where one of them will be the maximum size and the other segment will be the remaining bits.
If the data packet size is smaller than the minimum value of the frame size, there are padding bits will be added to the frame size to make its value reach to the minimum value of frame size. [3]
II. LAN COMPONENTS
A. Network media
Network media, sometimes called Network medium, is the physical channel that used for transmission in network. There are two types of mediums used in the implementation of computer networks. One is guided medium and another is unguided medium.
Guided Media (wired)
In guided medium electrical/optical signals are passed through a solid medium such as Copper UnshieldedTwisted Pair (UTP), Copper shielded Twisted Pair (STP), Copper co-axial cables and fiber optics cables.in guided mediums, the signals are confined within the wire and do not propagate outside of the cables.
Unguided Media (wireless)
In unguided medium the data is transmitted by sending electromagnetic signals through free space and hence the signals are not guided in any specific direction. All unguided transmission mediums are classified as wireless transmission. 10BaseT cables
It is a twisted pair Ethernet wiring standard for LAN implementation that support 10Mbps data rate. The maximum transmission length is 100 meters.
100BaseT cables
It is another twisted pair Ethernet wiring standard for LAN implementation that supports 100Mbps data rate. The 100BaseT Ethernet wiring standard is the most commonly used in LAN creation due to its highspeed, robustness and low cost. It is alsocalled fastEthernet because it is ten times faster than 10BaseT [4]- [5].
TABLE I COMPARISON BETWEEN GUIDED CABLES
Media Frequency
range Typical
attenuation Repeaters
Twisted pair 0 - 3.5 kHz 0.2 dB/Km At 1KHz
2 km
Coaxial cable 0 -500MHz 7 dB/km At 10MHz
1 - 9 km
Optical fiber 186 -370THz 0.2 to 0.5 dB/km
40km
Table I shows the comparison between the guided cables
(Twisted pair, Co-axial cables and optical fiber).
B. Hub
Hub is the simplest component in any local area network (LAN). Any data packet coming from one port is sent to all other ports it is then up to the receiving computer to decide if the packet is for it or not.Since every packet is sent out to every computer on the network there is a lot of wasted transmission, so the network can be easily become bogged down.Hubs are typically used on small networks where the amount of data going across the network is not very high.
C. Switch
Switch has multiple ports. When the packet comes through a switch it is read to determine which computer to send the data to. This leads to increase the efficiency and the performance of the device because the packets are not going to computers that do not require them [6].
The switch can determine the address of the sender and the receiver according to its MAC address table, where it’s a
table in each switch which store the MAC address transmission easy when any device need to send data several times.
III. SIMULATION SOFTWARE AND PARAMETERS
The simulation will be done by using Riverbed Modeler Academic Edition 17.5 [7].Riverbed Modeler Academic edition is a high-level event based network level simulation tool, it contains a huge library of accurate models of commercial available fixed network hardware and protocols. Riverbed Modeler Academic Edition can be used as a research tool or as a network design/analysis tool. It consists of high level user interface, which is constructed from C and C++ source code with a huge library of Riverbed Modeler specific functions. Modelling in Riverbed is divided into three main domains. The first one is Network domain that is responsible for networks, sub networks, network topologies, geographical coordinates and mobility. The second one is Node domain that includes single networknodes such as routers, workstations, mobile devices. The last model called Process domain that represent single module and source code inside network nodes such as data traffic source model and IP protocol. For this work we will create an office LAN which consists of hubs, switch, twenty Ethernet stations,10 devices per each hub, under 10baseT (for scenario 1) and 100baseT (for scenario 2) Ethernet wiring standard.
A. Riverbed Modeler Academic Edition 17.5
Riverbed Modeler is software that is specialized for network research and development.This release replaced
ICACT Transactions on Advanced Communications Technology (TACT) Vol. 5, Issue 2, March 2016 788
Copyright ⓒ 2016 GiRI (Global IT Research Institute)
OPNET IT guru academic edition “Optimized Network
Engineering Tool”. I used that software to implement the office LAN because it offers relatively much powerful visual or graphical support for the users.
B. Parameters of nodes
Traffic Generation Parameters Start time in seconds will be constant (5.0), ON State Time
in second is constant (1000), OFF state Time is (0).
Packet Generation Arguments Packet size in bytes will be varied according to the frame
size in each case which will be (1500,1024,512,128,64), segmentation size in bytes will be No segmentation.
C. Performance parameters
For Hub Utilization, Collision count, Traffic forwarded (bits/sec)
and Traffic received (bits/sec). For Switch
Traffic forwarded (bits/sec), Traffic received (bits/sec), Traffic filtered (bits/sec).
D. Running time parameters
The simulation are performed for 4 min and we make the time of simulation is constant for all the scenarios that we made.
IV. SIMULATION SCENARIOS
In our simulation we used two different scenarios for implementation of LANs with two different wiring Ethernet standard. At each scenario we changed the frame size to calculate some parameters of the network, then we evaluate the performance of the network.
A. Scenario 1
Fig. 2. Office LAN under 10BaseT wiring standard
Figure 2 illustrates scenario 1 which contains connection of
20 Ethernet stations to hubs, each hub connected to 10 Ethernet stations, and the hubs connected to Ethernet switch. 10BaseT Ethernet wiring standard will be used in that scenario.
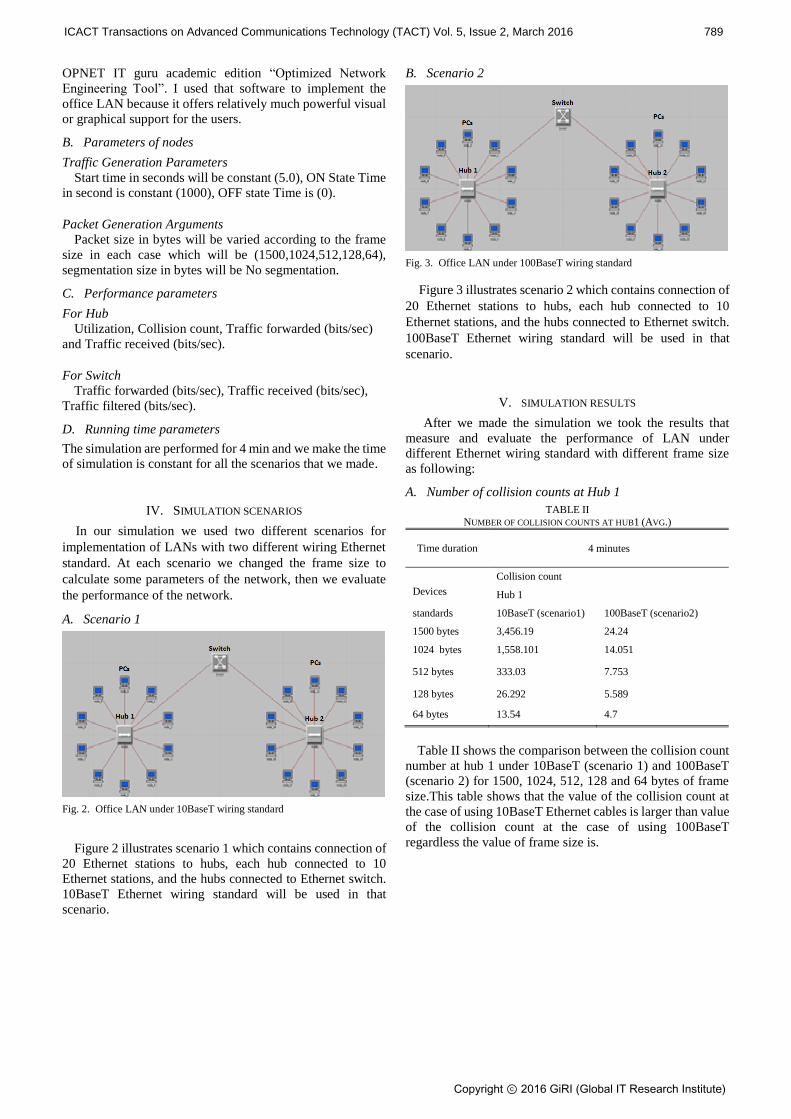
B. Scenario 2
Fig. 3. Office LAN under 100BaseT wiring standard
Figure 3 illustrates scenario 2 which contains connection of 20 Ethernet stations to hubs, each hub connected to 10 Ethernet stations, and the hubs connected to Ethernet switch. 100BaseT Ethernet wiring standard will be used in that scenario.
V. SIMULATION RESULTS
After we made the simulation we took the results that measure and evaluate the performance of LAN under different Ethernet wiring standard with different frame size as following:
A. Number of collision counts at Hub 1 TABLE II
NUMBER OF COLLISION COUNTS AT HUB1 (AVG.)
Time duration 4 minutes
Collision count
Devices Hub 1
standards 10BaseT (scenario1) 100BaseT (scenario2)
1500 bytes 3,456.19 24.24
1024 bytes 1,558.101 14.051
512 bytes 333.03 7.753
128 bytes 26.292 5.589
64 bytes 13.54 4.7
Table II shows the comparison between the collision count
number at hub 1 under 10BaseT (scenario 1) and 100BaseT (scenario 2) for 1500, 1024, 512, 128 and 64 bytes of frame size.This table shows that the value of the collision count at the case of using 10BaseT Ethernet cables is larger than value of the collision count at the case of using 100BaseT regardless the value of frame size is.
ICACT Transactions on Advanced Communications Technology (TACT) Vol. 5, Issue 2, March 2016 789
Copyright ⓒ 2016 GiRI (Global IT Research Institute)

Fig. 4. Comparison between numbers of collision count at Hub1 under different frame size at 10BaseT Ethernet wiring standard.
Fig. 5. Comparison between numbers of collision count at Hub1 under different frame size at 100BaseT Ethernet wiring standard
Fig. 6. Graphs for number of collision count at Hub1
Figures 4, 5 and 6 show that the number of collision counts in 10BaseT is more than 100BaseT for all frame sizesregardless the value of the frame size which is used.
B. Utilization of Hub TABLE III
UTILIZATION OF HUB1 (AVG.)
Time duration
4 minutes
Utilization
Devices Hub 1
standards 10BaseT (scenario1) 100BaseT (scenario2)
1500 bytes 0.883 0.091
1024 bytes 0.627 0.062
512 bytes 0.321 0.032
128 bytes 0.092 0.009
64 bytes 0.053 0.005
Table III shows the comparison between the utilization of
hub 1 under 10BaseT (scenario1) and 100BaseT (scenario2) for 1500, 1024, 512, 128 and 64 bytes of frame size.This table shows that the value of the utilization at the case of using 10BaseT cables is larger than the value of the utilization when using 100BaseT cables regardless the value of the frame size that is used because the value of utilization proportional directly with the value of the collision count.
Fig. 7. Comparison between utilization at Hub1 under different frame size at 10BaseT Ethernet wiring standard.
Fig. 8. Comparison between utilization at Hub1 under different frame size at 100BaseT Ethernet wiring standard
Fig. 9. Graphs for Utilization of Hub1
ICACT Transactions on Advanced Communications Technology (TACT) Vol. 5, Issue 2, March 2016 790
Copyright ⓒ 2016 GiRI (Global IT Research Institute)

Figures 7, 8 and 9 demonstrate that the utilization in 10BaseT is more than 100BaseT for all frame sizesregardless the value of the frame size that is used.
C. Traffic forwarded (bits/sec) at Hub 1 TABLE IV
TRAFFIC FORWARDED (BITS/SEC) TO HUB 1 (AVG.)
Time duration 4 minutes
Traffic Forwarded (bps)
Devices Hub 1
Standards 10BaseT (scenario1) 100BaseT (scenario2)
1500 bytes 8,815,602 9,100,506
1024 bytes 6,259,192 6,263,042
512 bytes 3,209,531 3,214,534
128 bytes 919,988 918,550
64 bytes 538,601 538,967
Table IV shows the comparison between the traffic forwarded to Hub 1 under 10BaseT (scenario1) and 100BaseT (scenario2) for 1500, 1024, 512, 128 and 64 bytes of frame size.
Fig. 10. Comparison between traffic forwarded (bps) at Hub1 under different frame size at 10BaseT Ethernet wiring standard
Fig. 11. Comparison between traffic forwarded (bps) at Hub1 under different frame size at 100BaseT Ethernet wiring standard
Fig. 12. Graphs of traffic forwarded at Hub1 (bit/sec)
Figures 10, 11 and 12 show that at some points both curves overlap to each other; it means that traffic forwarded to hub1 is approximately same at these points.
D. Traffic received (bits/sec) at Hub 1 TABLE V
TRAFFIC RECEIVED (BITS/SEC) TO HUB 1 (AVG.)
Time duration 4 minutes
Traffic Received (bps)
Devices Hub 1
Standards 10BaseT (scenario1) 100BaseT (scenario2)
1500 bytes 8,815,602 9,100,506
1024 bytes 6,259,192 6,263,042
512 bytes 3,209,531 3,214,534
128 bytes 919,988 918,550
64 bytes 538,601 538,967
Table V shows the comparison between the traffic received
to Hub 1 under 10BaseT (scenario1) and 100BaseT (scenario2) for 1500, 1024, 512, 128 and 64 bytes of frame size.
Tables V and IV shows that the value of the traffic sent in bits per second and the value of the traffic received in bits per second at the case of hub is equivalent because hub doesn’t
understand addressing the data which the hub receive is broadcasted to all device in the network so the amount of received data is the same as the amount of sent data.
Fig. 13. Comparison between traffic received (bps) at Hub1 under different frame size at 10BaseT Ethernet wiring standard
ICACT Transactions on Advanced Communications Technology (TACT) Vol. 5, Issue 2, March 2016 791
Copyright ⓒ 2016 GiRI (Global IT Research Institute)

Fig. 14. Comparison between traffic received (bps) at Hub1 under different frame size at 100BaseT Ethernet wiring standard.
Fig. 15. Graphs of traffic received at hub1 (bit/sec)
Figures 13, 14 and 15 demonstrate that at some points both curves overlap to each other; it means that traffic received to hub1 is approximately same at these points.
E. Number of collision counts at Hub 2 TABLE VI
NUMBER OF COLLISION COUNTS AT HUB 2 (AVG.)
Time duration 4 minutes
Collision count
Devices Hub 2
Standards 10BaseT (scenario1) 100BaseT (scenario2)
1500 bytes 3,435.919 27.70
1024 bytes 1,572.666 14.877
512 bytes 340.3 7.626
128 bytes 29.4 5.29
64 bytes 12.4 5.13
Table VI illustrates the comparison between the collision
count number at hub 2 under 10BaseT (scenario 1) and 100BaseT (scenario 2) for 1500, 1024, 512, 128 and 64 bytes of frame size.The table VI illustrates that the value of the collision count at the case of using 10BaseT Ethernet cable is larger than the amount of collision count when using 100BaseT cables regardless the value of the frame size that is used.
Fig. 16. Comparison between numbers of collision count at Hub2 under different frame size at 10BaseT Ethernet wiring standard
Fig. 17. Comparison between numbers of collision count at Hub2 under different frame size at 100BaseT Ethernet wiring standard
Fig. 18. Graphs for number of collision count at Hub2
Figures 16, 17 and 18show that the number of collision count in 10BaseT is more than 100BaseT for all frame sizesregardless the value of the frame size that is used.
F. Utilization of Hub 2 TABLE VII
UTILIZATION OF HUB 2 (AVG.)
Time duration 4 minutes
Utilization
Devices Hub 2
Standards 10BaseT (scenario1) 100BaseT (scenario2) 1500 bytes 0.8836 0.0910
1024 bytes 0.6288 0.0626
512 bytes 0.3217 0.0321
ICACT Transactions on Advanced Communications Technology (TACT) Vol. 5, Issue 2, March 2016 792
Copyright ⓒ 2016 GiRI (Global IT Research Institute)

128 bytes 0.092 0.009
64 bytes 0.053 0.005
Table 7 shows the comparison between the utilization at
hub 2 under 10BaseT (scenario 1) and 100BaseT (scenario 2) for 1500, 1024, 512, 128 and 64 bytes of frame size. The table demonstrates that the value of collision count at the case of using 10BaseT Ethernet cable is larger than its value when using 100BaseT cables regardless the frame size which used because the value of collision count proportional directly with the value of collision count.
Fig. 19. Comparison between utilization at Hub2 under different frame size at 10BaseT Ethernet wiring standard
Fig. 20. Comparison between utilization at Hub2 under different frame size at 100BaseT Ethernet wiring standard
Fig. 21. Graphs for Utilization of Hub2
Figures 19, 20 and 21 illustrate that the utilization in 10BaseT is more than 100BaseT for all frame sizesregardless the value of the frame size which is used.
G. Traffic forwarded (bits/sec) at Hub2 TABLE VIII
TRAFFIC FORWARDED (BITS/SEC) TO HUB 2 (AVG.)
Time duration 4 minutes
Traffic Forwarded (bps)
Devices Hub 2
Standards 10BaseT (scenario1) 100BaseT (scenario2)
1500 bytes 8,813,873 9,105,746.133
1024 bytes 6,276,727 6,266,542.4
512 bytes 3,214,211 3,212,418.33
128 bytes 920,963.466 918,889.6
64 bytes 538,082.4 539,042.4
Table VIII shows the comparison between the traffic
forwarded to Hub 2 under 10BaseT (scenario1) and 100BaseT (scenario2) for 1500, 1024, 512, 128 and 64 bytes of frame size.
Fig. 22. Comparison between traffic forwarded (bps) at Hub2 under different frame size at 10BaseT Ethernet wiring standard.
Fig. 23. Comparison between traffic forwarded (bps) at Hub2 under different frame size at 100BaseT Ethernet wiring standard.
ICACT Transactions on Advanced Communications Technology (TACT) Vol. 5, Issue 2, March 2016 793
Copyright ⓒ 2016 GiRI (Global IT Research Institute)

Fig. 24. Graphs of traffic forwarded to hub2 (bit/sec)
Figures 22, 23 and 24 demonstrate that at some points both curves overlap to each other, it means that traffic forwarded to hub2 is approximately same at these points.
H. Traffic received (bits/sec) at hub 2 TABLE IX
TRAFFIC RECEIVED (BITS/SEC) TO HUB 2 (AVG.)
Time duration
4 minutes Traffic Received (bps)
Devices Hub 2
Standards 10BaseT (scenario1) 100BaseT (scenario2)
1500 bytes 8,813,873 9,105,746.133
1024 bytes 6,276,727 6,266,542.4
512 bytes 3,214,211 3,212,418.33
128 bytes 920,963.466 918,889.6
64 bytes 538,082.4 539,042.4
Table IX shows the comparison between the traffic
received to Hub 2 under 10BaseT (scenario1) and 100BaseT (scenario2) for 1500, 1024, 512, 128 and 64 bytes of frame size.
Tables VIII and IX shows that the value of the data traffic sent in bits per second and the data traffic received in bits per second for hub are the same because hub is broadcasting all the incoming data to all the devices in the same network without filtering the traffic.
Fig. 25. Comparison between traffic received (bps) at Hub2 under different frame size at 10BaseT Ethernet wiring standard
Fig. 26. Comparison between traffic received (bps) at Hub2 under different frame size at 100BaseT Ethernet wiring standard.
Fig. 27. Graphs of traffic received to hub2 (bit/sec)
Figures 25, 26 and 27 show that at some points both
curves overlap to each other; it means that traffic received at hub2 is approximately same at these points.
I. Traffic forwarded (bits/sec) at switch TABLE X
TRAFFIC FORWARDED (BITS/SEC) TO SWITCH (AVG.)
Time duration 4 minutes
Traffic Forwarded (bps)
Devices Switch
Standards 10BaseT (scenario1) 100BaseT (scenario2)
1500 bytes 6,091,588.533 6,281,372.066
1024 bytes 4,312,105 4,327,995
512 bytes 2,212,381.533 2,220,971.6
128 bytes 634,480 633,561.133
64 bytes 370,812 372,297
Table X shows the comparison between the traffic forwarded to switch under 10BaseT (scenario1) and 100BaseT (scenario2) for 1500, 1024, 512, 128 and 64 bytes of frame size.
ICACT Transactions on Advanced Communications Technology (TACT) Vol. 5, Issue 2, March 2016 794
Copyright ⓒ 2016 GiRI (Global IT Research Institute)

Fig. 28. Comparison between traffic forwarded (bps) at Switch under different frame size at 10BaseT Ethernet wiring standard
Fig. 29. Comparison between traffic forwarded (bps) at Switch under different frame size at 100BaseT Ethernet wiring standard
Fig. 30. Graphs of traffic forwarded to switch (bit/sec)
J. Traffic received (bits/sec) at switch TABLE XI
TRAFFIC RECEIVED (BITS/SEC) TO SWITCH (AVG.)
Time duration 4 minutes
Traffic Received (bps)
Devices Switch
Standards 10BaseT (scenario1) 100BaseT (scenario2)
1500 bytes 11,559,450 11,924,876.13
1024 bytes 8,223,810 8,201,585
512 bytes 4,211,356 4,205,994.33
128 bytes 1,206,466.8 1,203,874.466
64 bytes 705,867 705,708
Table XI shows the comparison between the traffic
received by switch under 10BaseT (scenario1) and 100BaseT
(scenario2) for 1500, 1024, 512, 128 and 64 bytes of frame size.
Tables X and XI shows that the amount of the data traffic
sent in bits per second and the amount of data traffic received in bits per second at the case of switch is not the same as the case of hub. The amount of data traffic received is larger than the amount of data traffic sent because there are some filtered data. At the case of switch not all the incoming data is broadcasted because it knows the address of the sender and receiver by using the MAC address table.
Fig. 31. Comparison between traffic received (bps) at switch under different frame size at 10BaseT Ethernet wiring standard
Fig. 32. Comparison between traffic received (bps) at switch under different frame size at 100BaseT Ethernet wiring standard
Fig. 33. Graphs of traffic received at switch (bit/sec)
K. Traffic filtered (bits/sec) by switch TABLE XII
Traffic received (bits/sec) to switch (Avg.)
Time duration 4 minutes
ICACT Transactions on Advanced Communications Technology (TACT) Vol. 5, Issue 2, March 2016 795
Copyright ⓒ 2016 GiRI (Global IT Research Institute)

Traffic Filtered (bps)
Devices Switch
Standards 10BaseT (scenario1) 100BaseT (scenario2)
1500 bytes 5,467,861.67 5,643,504.04
1024 bytes 3,911,705 3,873,590
512 bytes 1,998,974.8 1,985,022.7
128 bytes 571,986.8 570,313.33
64 bytes 335,055 333,411
Table XII shows the comparison between the traffic
received by switch under 10BaseT (scenario1) and 100BaseT (scenario2) for 1500, 1024, 512, 128 and 64 bytes of frame size.From the table we can see that the amount of filtered traffic at the case of using frame size 1500 bytes is larger when using 100BaseT than 10BaseT which indicates better performance, but when we decrease the frame size to 512, 128 and 64 the amount of filtered traffic at the case of using 10BaseT is larger than the amount of filtered traffic when using 100BaseT which indicated better performance for switch.
Fig. 34. Comparison between the traffic filtered by switch under different frame size and wiring standard
Figure 34 shows that the initially filtered traffic is better in case of 100BaseT for 1500 bytes frame size than 10BaseT. For 1024, 512, 128 and 64 bytes frame size the switch under 10BaseT filtered more traffic than 100BaseT, it means that the performance of 10BaseT Ethernet wiring standard is become better at the case of low traffic data.
VI. CONCLUSION
Computer Simulation are outperformed by using Riverbed Modeler Academic edition tool. The performance of LANs is tested and investigated under different conditions of Ethernet wiring and different frame size. The result remarks and observations from our simulations outcomes are: The number of collision counts in 10BaseT is always
more than 100BaseT for all the frame sizes because of the nature of 10BaseT [8], [9].
Hubs are more utilized in case of 10BaseT because of the large value of collision count so the more retransmission attempts will be required.
The performance of a switch is better for 100BaseT wiring standard at the case of 1500 bytes frame size than
that the case of 10BaseT because it filters more traffic.When the frame size is 1024 bytes, filtered traffic will be approximately the same for both 10BaseT and 100BaseT.When frame size is further reduced to 512, 128 and 64 the results show that the performance of 10BaseT becomes better than 100BaseT because the switch filtered more traffic than 100BaseT.
If we have LAN in which high traffic is not required and the frame size will be fixed to 512, 128 or 64 bytes,10BaseT will give us good result and performs better as compared to 100BaseT Ethernet wiring standard.
At the case of small frame size we will not able to transfer more traffic per seconds (traffic receiving and forwarding is less) so we cannot use them in heavy traffic (refer tables X and XI).
REFERENCES [1] Mohammad Wazid Roshan Singh Sachan, R.H. Goudar “Analysis of a
LAN under Different Ethernet Wiring Standards with Variation in Time and Components”, UACEE International jornal of Advance in computer Networks and its security – volume 2: Issue 3 [ISSN 2250 – 3757].
[2] Mohammad Wazid, Roshan Singh Sachan, R.H. Goudar “Performance Evaluation of a LAN under Different Ethernet Wiring Standards with Different Frame Size”, International Journal of Computer Applications
(0975 – 8887) Volume 43– No.13, April 2012. [3] Charles Spurgeon and Chuck Toporek, “Ethernet: The Definitive
Guide”, 1st Edition 2000: O’Reilly & Associates [4] A. Forouzan, “Data Communication & Networking” 4th Edition 2006:
Tata McGraw Hill. [5] William Stallings, “Data and Computer Communications” 8th Edition
2006: Pearson Education [6] Todd Lammle, “Cisco Certified Network Associate Study Guide” 2nd
Edition 2000: SYBEX, Inc., Alameda, CA [7] Xinjie Chang, “Network simulations with OPNET”, IEEE Conference
Publications of Simulation Conference Proceedings, 1999 winter [8] S. Kabir, S. Khatun, M. K. Abdullah, M.A. Mahdi and S. B. A. Anas,
“Throughput Analysis of an Enhanced CSMA/CD Based Single Channel Fast Ethernet Optical LAN”, International Conference on
Advance Communication Technology (ICACT) 2005. [9] R. M. Daud, H. M. Elsayed and H. H. Amer, “Performance of Fast and
Gigabit Ethernet in Networked Control System”, 46th IEEE
International Midwest Symposium on Circuit and System 2003.
Ashraf A.M. Khalaf (M’98) received his B.Sc. and
M.Sc. degrees in electrical engineering from Minia University, Egypt, in 1989 and 1994 respectively. He received his Ph.D in electrical engineering from Graduate School of Natural Science and Technology, Kanazawa University, Japan, in March 2000. He is currently works as an associate professor at electronics and communications engineering Department, Minia University, Egypt.
Mostafa S.A. Mokademwas born in Aswan at 1989. He got his B.Sc. degree from faculty of engineering, department of communication and electronics at 2011. He works as an engineer in the Egyptian Electricity Holding company, Ministry of Electricity and renewable Energy. He is currently a master course student for M.Sc. degree in Electrical Engineering (Communication and Electronics)-Faculty of Engineering, Minia University, El-Minia, Egypt.
Khalil A. Ahmadis a professor in the department of electrical engineering, faculty of engineering, Minia University, Minia, Egypt.
ICACT Transactions on Advanced Communications Technology (TACT) Vol. 5, Issue 2, March 2016 796
Copyright ⓒ 2016 GiRI (Global IT Research Institute)

Abstract—In this paper, the author demonstrates how
commonly used communication scheme and information retrieval which are carried out via Internet using numerous types of smart devices, can turn the Internet into a very dangerous platform because of its built-in nature of making its users’ identity easily traceable and discusses some countermeasures that can be used to prevent existing and projected security breaches. It initially provides some introductory information on technology advancement, penetration of the Internet to all aspects of our life and its associated conveniences. It then discusses vulnerability of internet services, presents some typical attack cases that are carried out via smart home appliances, and explains security implementation challenges on such devices from technical, social, and practical aspects. Finally, it proposes an appropriate security model, demonstrates relevant counter measures for numerous attack scenarios, and explains why and how numerous stake holders are needed to get together for its commercial implementation.
Keyword—Internet of Things, IoT, Smart, Social Cybernetics, Social Networking, Facebook, Online Advertising, Security, Privacy, Network Tracing Tools.
I. INTRODUCTION
he 21st century has been regarded by many as the information era and penetration of Internet into all
aspects of our life is a new dimension along which technologies continue to grow. The advancement in technology has been changing the way of our life and digital information has now become a social infrastructure. We are surrounded by technologies and there are computer technologies in our cars, phones, watches, entertainment systems, and home appliances. The idea is to make use of existing electronics in the devices and, in conjunction with some specialized software, create an intelligent network with access to the Internet.
Since the expansion of the Internet in 1990s, network infrastructure has become an indispensable part of social life and industrial activity for mankind. The idea of using existing electronics in smart home appliances and connecting them to the Internet is a new dimension along which technologies
———————————————————————
Manuscript received on January 8, 2016. This work is a follow up of an accepted conference paper for the International Conference on Advanced Communication Technology.
Davar Pishva is a professor in ICT at Ritsumeikan Asia Pacific University (APU) Japan ( +81-977-78-1261, fax: +81-977-78-1261, e-mail: dpishva@ apu.ac.jp).
continue to grow, and in recent years mankind has witnessed an upsurge of usage of devices such as smart phone, smart television, home health-care device, etc. Their build-in internet-controlled function has made them quite attractive to many segments of consumers and smart phone has become a common gadget for social networking. Commercial advertising has also greatly benefitted from Internet services and social networking is also being used for online advertising and business transaction.
With adoptions of cloud computing, mobile applications and virtualized enterprise architectures have led to a tremendous expansion of applications that are connected to Internet resources [1]. Just to mention a few examples, we use Internet for various sorts of communication like VoIP and email, multimedia services like Online Music and Online Movie, business transaction like e-Banking and e-Business, administrative work like e-Governance and e-Administration, networking activities such as Online Advertising and Social Networking. Furthermore, along with the development of Internet, e-Commerce has become an efficient marketing tool for many companies and Social Networking with Facebook is an emerging market which has recently become the most visited website in the world [2][3].
Traditionally social networking was done in person and in places like schools, communities, neighborhoods, workplaces etc. and hence limited in size. Although the use of social networking for business and advertisement is not something new, its traditional approach had limited size as it required face-to-face or mouth-to-mouth interactions. Since the expansion of the Internet, however, social networking has grown exponentially and according to Statista [4], Facebook’s registered accounts have surpassed one billion
users as of March 2015. According to the same source, approximately 347 million people are active on LinkedIn, 300 million uses Google+ and another 288 million use twitter. There are of course many other social networking sites, but none of them even existed at the beginning of the 21st century. In fact, when Facebook was launched in 2004, many people considered it as a place for kids to share their pictures and emotions. Today, however, businesses and marketers love social media and indeed, 90 percent of marketers are using social media for business [5]. Seventy percent have used Facebook to successfully gain new customers and 34 percent have used Twitter to successfully generate leads [6].
In Japan, many audio visual equipment can already be connected to the Internet, enabling people to enjoy network based services, such as Video on Demand (VOD), Music on
Internet of Things: Security and Privacy Issues and Possible Solution
Davar PISHVA
Ritsumeikan Asia Pacific University, 1-1 Jumonjibaru, Beppu, Oita 874-8577 Japan
T
9ICACT Transactions on Advanced Communications Technology (TACT) Vol. 5, Issue 2, March 2016 797
Copyright ⓒ 2016 GiRI (Global IT Research Institute)

Demand (MOD), remote update, e-Commerce, remote control, and other similar services. Network connectivity is likely to be equipped in all AV equipment in the near future. Such developments have been leading mankind to a new era of technology, the era of the “Internet of Things” (hereafter:
IoT), where all the appliances are getting tiny and controllable via the Internet, thus enabling people to enjoy network based services like Video on Demand (VOD), Music on Demand (MOD), remote update, e-Commerce, remote control, and other similar services.
Furthermore, researchers around the world have come up with an abundance of resourceful ideas on how to effectively use microprocessors and Internet in other everyday household
appliances. ‘Smart’ is the new buzzword that we can hear
these days; for example, in ‘smart’ homes, ‘smart’ kitchens,
‘smart’ ovens, ‘smart’ refrigerators, etc. [7]. Table 1 indicates functional classification of smart home appliances [8][9]. There is also a tremendous business potential for them because of foreseen future demand by elderly people, where the number of people over the age of 65 is expected to double to 70 million by 2030 [10]. According to a study conducted by International Data Corporation, 212 billion “things” will be
installed based on IoT with an estimated market value of $8.9 trillion in 2020 [11]. Those “things” will be nothing special but daily used appliances ranging from watch, light bulb to smart television, refrigerator and so on.
TABLE I
FUNCTIONAL CLASSIFICATION OF SMART HOME APPLIANCES
No Function Example of Product or Usage 1 Content Retrieval Broadband TV, Microwave Oven, HDD Recorder (for TV program, etc.) 2 Content Storage/Usage HDD Recorder (for TV program, etc.), MP3 Player 3 Communication/Messaging VoIP , IP-TV Phone, All kinds of Emails System, Healthcare System 4 Remote Surveillance Security Camera, Gas/Fire Sensors, Refrigerator, Lighting Fixture, Door Lock 5 Remote Control Air Conditioner, Lighting Fixture, TV, TV Program Recording 6 Remote Maintenance Firmware Update, Trouble Report 7 Instrument Linkage Networked AV Equipment 8 Networked Game Family Type Game Machine
Commercial advertising has also greatly benefitted from Internet services and online advertising can even be considered as the foundation of web economy. However, the system of online advertising is quite unique. Unlike conventional forms of advertising, the system of online advertising allows its target to receive something in return in exchange for viewing the advertisement. Besides getting information from the advertisement itself, the target of online advertising is usually allowed to use the advertisement host website’s service. For example, as shown in Figure 1, video2mp3.net, a website that offers free file conversion from YouTube video to mp3 format, has numerous advertisements displayed on its page [12]. It even goes as far as setting a hidden advertisement that will only appear when the user clicks the “High quality” option. Nevertheless, the users are
not required to pay for the service. They are instead offered a premium service where they can get exclusive access to the website without advertisements popping up along the way. In this way, online advertising has defined a new term of “free
service”, where four parties – the advertisers, the ad network,
the ad hosts, and the users - are involved within it [13]. In other words, today's business activities depend highly on
information systems and every enterprise has its own information for its business. In an industrialized country like Japan, most enterprises use information technology to establish their management governance. This helps them improve their efficiency and cost performance. As it is called 'IT governance', information systems have significant impact on the operations. Information assets have thus become valuable commodities for business and information systems are the key factors to ensure the growths of enterprises. Hence, it is essential to control the design process, development cycle and effective utilization of information systems. Nonetheless, as information and its value continue to increase, so does the management complexity, vulnerability and attractiveness to malicious attacks. Security threats can come in the form of unauthorized accesses, computer viruses, or cyber-attacks.
II. VULNERABILITY OF INTERNET SERVICES
For various reasons, however, today’s networks are
vulnerable to numerous risks, such as information leakage, privacy infringement and data corruption. One of the main underlying factors is operating nature of the communication protocol used in the Internet domain and availability of many free software that can carry out most of these attacks. The Internet protocol suite which is commonly known as TCP/IP (Transmission Control Protocol and Internet Protocol), is used for most Internet applications. IP serving as its primary component carries out the task of delivering packets from source host to destination host solely based on the IP addresses contained in the packet headers. In order to achieve proper operation of such transaction worldwide, this requires source and destination to have unique IP address and included
Fig. 1. A view of Video2mp3.net. On the right side is one of its many
advertisements.
ICACT Transactions on Advanced Communications Technology (TACT) Vol. 5, Issue 2, March 2016 798
Copyright ⓒ 2016 GiRI (Global IT Research Institute)
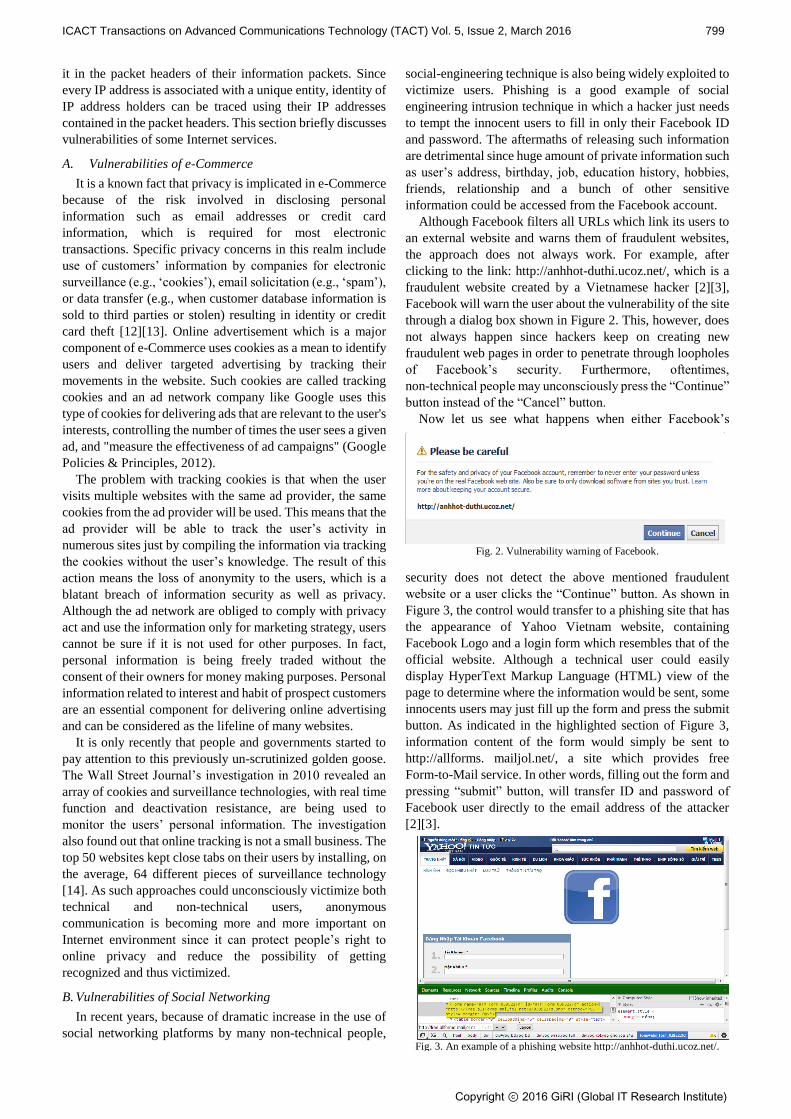
it in the packet headers of their information packets. Since every IP address is associated with a unique entity, identity of IP address holders can be traced using their IP addresses contained in the packet headers. This section briefly discusses vulnerabilities of some Internet services.
A. Vulnerabilities of e-Commerce
It is a known fact that privacy is implicated in e-Commerce because of the risk involved in disclosing personal information such as email addresses or credit card information, which is required for most electronic transactions. Specific privacy concerns in this realm include use of customers’ information by companies for electronic
surveillance (e.g., ‘cookies’), email solicitation (e.g., ‘spam’),
or data transfer (e.g., when customer database information is sold to third parties or stolen) resulting in identity or credit card theft [12][13]. Online advertisement which is a major component of e-Commerce uses cookies as a mean to identify users and deliver targeted advertising by tracking their movements in the website. Such cookies are called tracking cookies and an ad network company like Google uses this type of cookies for delivering ads that are relevant to the user's interests, controlling the number of times the user sees a given ad, and "measure the effectiveness of ad campaigns" (Google Policies & Principles, 2012).
The problem with tracking cookies is that when the user visits multiple websites with the same ad provider, the same cookies from the ad provider will be used. This means that the ad provider will be able to track the user’s activity in
numerous sites just by compiling the information via tracking the cookies without the user’s knowledge. The result of this
action means the loss of anonymity to the users, which is a blatant breach of information security as well as privacy. Although the ad network are obliged to comply with privacy act and use the information only for marketing strategy, users cannot be sure if it is not used for other purposes. In fact, personal information is being freely traded without the consent of their owners for money making purposes. Personal information related to interest and habit of prospect customers are an essential component for delivering online advertising and can be considered as the lifeline of many websites.
It is only recently that people and governments started to pay attention to this previously un-scrutinized golden goose. The Wall Street Journal’s investigation in 2010 revealed an
array of cookies and surveillance technologies, with real time function and deactivation resistance, are being used to monitor the users’ personal information. The investigation
also found out that online tracking is not a small business. The top 50 websites kept close tabs on their users by installing, on the average, 64 different pieces of surveillance technology [14]. As such approaches could unconsciously victimize both technical and non-technical users, anonymous communication is becoming more and more important on Internet environment since it can protect people’s right to
online privacy and reduce the possibility of getting recognized and thus victimized.
B. Vulnerabilities of Social Networking
In recent years, because of dramatic increase in the use of social networking platforms by many non-technical people,
social-engineering technique is also being widely exploited to victimize users. Phishing is a good example of social engineering intrusion technique in which a hacker just needs to tempt the innocent users to fill in only their Facebook ID and password. The aftermaths of releasing such information are detrimental since huge amount of private information such as user’s address, birthday, job, education history, hobbies,
friends, relationship and a bunch of other sensitive information could be accessed from the Facebook account.
Although Facebook filters all URLs which link its users to an external website and warns them of fraudulent websites, the approach does not always work. For example, after clicking to the link: http://anhhot-duthi.ucoz.net/, which is a fraudulent website created by a Vietnamese hacker [2][3], Facebook will warn the user about the vulnerability of the site through a dialog box shown in Figure 2. This, however, does not always happen since hackers keep on creating new fraudulent web pages in order to penetrate through loopholes of Facebook’s security. Furthermore, oftentimes,
non-technical people may unconsciously press the “Continue”
button instead of the “Cancel” button. Now let us see what happens when either Facebook’s
security does not detect the above mentioned fraudulent website or a user clicks the “Continue” button. As shown in
Figure 3, the control would transfer to a phishing site that has the appearance of Yahoo Vietnam website, containing Facebook Logo and a login form which resembles that of the official website. Although a technical user could easily display HyperText Markup Language (HTML) view of the page to determine where the information would be sent, some innocents users may just fill up the form and press the submit button. As indicated in the highlighted section of Figure 3, information content of the form would simply be sent to http://allforms. mailjol.net/, a site which provides free Form-to-Mail service. In other words, filling out the form and pressing “submit” button, will transfer ID and password of
Facebook user directly to the email address of the attacker [2][3].
Fig. 2. Vulnerability warning of Facebook.
Fig. 3. An example of a phishing website http://anhhot-duthi.ucoz.net/.
ICACT Transactions on Advanced Communications Technology (TACT) Vol. 5, Issue 2, March 2016 799
Copyright ⓒ 2016 GiRI (Global IT Research Institute)
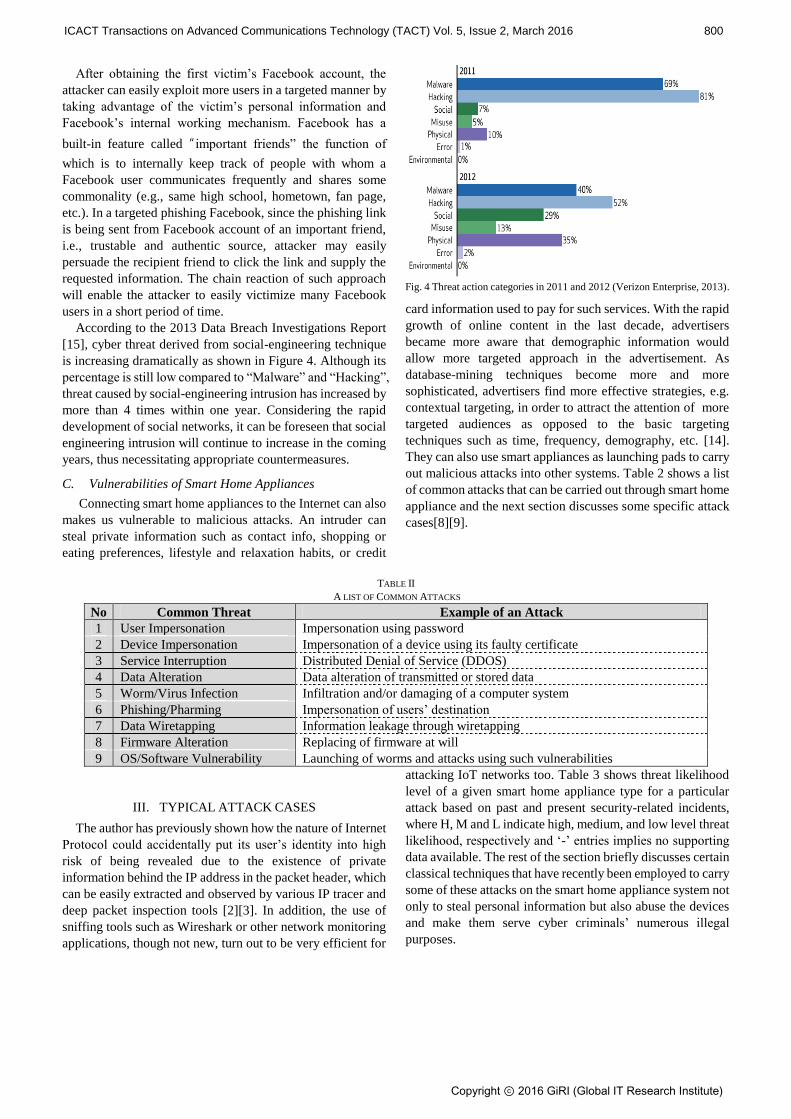
After obtaining the first victim’s Facebook account, the
attacker can easily exploit more users in a targeted manner by taking advantage of the victim’s personal information and
Facebook’s internal working mechanism. Facebook has a
built-in feature called “ important friends” the function of
which is to internally keep track of people with whom a Facebook user communicates frequently and shares some commonality (e.g., same high school, hometown, fan page, etc.). In a targeted phishing Facebook, since the phishing link is being sent from Facebook account of an important friend, i.e., trustable and authentic source, attacker may easily persuade the recipient friend to click the link and supply the requested information. The chain reaction of such approach will enable the attacker to easily victimize many Facebook users in a short period of time.
According to the 2013 Data Breach Investigations Report [15], cyber threat derived from social-engineering technique is increasing dramatically as shown in Figure 4. Although its percentage is still low compared to “Malware” and “Hacking”,
threat caused by social-engineering intrusion has increased by more than 4 times within one year. Considering the rapid development of social networks, it can be foreseen that social engineering intrusion will continue to increase in the coming years, thus necessitating appropriate countermeasures.
C. Vulnerabilities of Smart Home Appliances
Connecting smart home appliances to the Internet can also makes us vulnerable to malicious attacks. An intruder can steal private information such as contact info, shopping or eating preferences, lifestyle and relaxation habits, or credit
card information used to pay for such services. With the rapid growth of online content in the last decade, advertisers became more aware that demographic information would allow more targeted approach in the advertisement. As database-mining techniques become more and more sophisticated, advertisers find more effective strategies, e.g. contextual targeting, in order to attract the attention of more targeted audiences as opposed to the basic targeting techniques such as time, frequency, demography, etc. [14]. They can also use smart appliances as launching pads to carry out malicious attacks into other systems. Table 2 shows a list of common attacks that can be carried out through smart home appliance and the next section discusses some specific attack cases[8][9].
TABLE II A LIST OF COMMON ATTACKS
No Common Threat Example of an Attack 1 User Impersonation Impersonation using password 2 Device Impersonation Impersonation of a device using its faulty certificate 3 Service Interruption Distributed Denial of Service (DDOS) 4 Data Alteration Data alteration of transmitted or stored data 5 Worm/Virus Infection Infiltration and/or damaging of a computer system 6 Phishing/Pharming Impersonation of users’ destination 7 Data Wiretapping Information leakage through wiretapping 8 Firmware Alteration Replacing of firmware at will 9 OS/Software Vulnerability Launching of worms and attacks using such vulnerabilities
III. TYPICAL ATTACK CASES
The author has previously shown how the nature of Internet Protocol could accidentally put its user’s identity into high
risk of being revealed due to the existence of private information behind the IP address in the packet header, which can be easily extracted and observed by various IP tracer and deep packet inspection tools [2][3]. In addition, the use of sniffing tools such as Wireshark or other network monitoring applications, though not new, turn out to be very efficient for
attacking IoT networks too. Table 3 shows threat likelihood level of a given smart home appliance type for a particular attack based on past and present security-related incidents, where H, M and L indicate high, medium, and low level threat likelihood, respectively and ‘-’ entries implies no supporting
data available. The rest of the section briefly discusses certain classical techniques that have recently been employed to carry some of these attacks on the smart home appliance system not only to steal personal information but also abuse the devices and make them serve cyber criminals’ numerous illegal
purposes.
Fig. 4 Threat action categories in 2011 and 2012 (Verizon Enterprise, 2013).
ICACT Transactions on Advanced Communications Technology (TACT) Vol. 5, Issue 2, March 2016 800
Copyright ⓒ 2016 GiRI (Global IT Research Institute)

TABLE III THREAT LIKELIHOOD LEVEL OF A GIVEN SMART HOME APPLIANCE
No Common
Threat Function
1 2 3 4 5 6 7 8 9 User
Impersonation
Device Impersonatio
n
Service Interruptio
n
Data Alteration
Worm/Virus Infection
Phishing Pharming
Data Wiretapping
Firmware Alteration
OS/Software Vulnerabilit
y 1 Content
Retrieval H H M L M L L - L
2 Content Storage/Usage
- - L L M - L - L
3 Communication /Messaging
H H M L M M L - L
4 Remote Surveillance
H H L L L L L - L
5 Remote Control
H H H H L L L - L
6 Remote Maintenance
H H H M L L L L L
7 Instrument Linkage
M M M L L L L - L
8 Networked Game
H H H M M L L - L
A. Man-In-The-Middle Attack
In March 2014, a Vulnerability Research Firm named ReVuln, published a video which describes how to employ man-in-the-middle attack to penetrate into the Philips Smart Television through the wireless network that the device connects to. Consequently, the cybercriminal could steal the cookies from the built-in web browser of the television and generate a session hijacking attack to gain access to victim’s
personal pages [16]. After observing the attack video, one can easily say that
TV’s configuration for connecting to wireless network
through a default hard-coded password is not appropriate. Though it may be convenient for the users, it is quite dangerous if the cybercriminal is also within the range of wireless router. It could even cause more serious aftermath since remote control TV application can easily be downloaded from the Internet. Through such application the hacker could obtain the TV’s configuration files and control
the TV if he knew the IP address of the television.
B. Denial-of-Service (DOS) Attack
DOS attack is not a new technique and the main attacking mechanism is that a huge amount of packets are generated and sent simultaneously to a targeted appliance. As a consequence, the appliance is either brought down causing permanent crash, or reset to factory setting automatically and making it lose its configuration, stored data and applications.
This kind of attack has recently been reported [17]. A hacker named, Hemanth Joseph, shared on his blog a very simple way to carry a DOS attack on a Pebble Smart Watch. The attacker just needs to know the victim’s phone number,
Facebook ID, or any other way to interact with the Watch’s IP
address. Considering that the watch has a function of showing messages received from Facebook, tablet or phone on its screen without character limitation, the attacker can keep on sending many lengthy messages so as to cause a DOS attack on the watch. As a consequence, the Smart Watch could be
brought down, reset to factory setting, and lose all of its data as shown in Figure 5
In addition to the IoT network of home appliances, cyber criminals can also easily penetrate into internet-based-control public appliances. A study published in August 2014 by security researchers from the University of Michigan demonstrates how a series of vital security vulnerabilities in traffic light systems in the US could allow adversaries to quite easily take control of the whole network of at least 100 traffic signals from a single point of access [18].
By carefully examining the above cases, one can easily trace the main reason behind such vulnerability to the fact that those appliances make use of unencrypted wireless radio signals thus can be monitored and compromised by cybercriminals.
C. Thingbot
Thingbot is an abbreviation similar to the word botnet, which itself is a combination of the words “robot” and
“network”. In a similar manner, thingbot is comprised of the words “thing” and “robot”.
Fig. 5 After DOS attack, the Watch’s screen is full of white straight lines, all
data and applications are erased because of reset to factory setting (Hemanth Joseph, August 2014)
ICACT Transactions on Advanced Communications Technology (TACT) Vol. 5, Issue 2, March 2016 801
Copyright ⓒ 2016 GiRI (Global IT Research Institute)

In order to create a huge botnet network, many computers are compromised and abused by malware to launch cyber-attacks without awareness of internet users. In a very similar manner, thingbot composed of smart home appliances and other devices in IoT network, can be infected and easily turned into slaves by the attackers because of lack of proper security. After knowing the real IP addresses of such compromised devices, it becomes easy for the hacker to generate cyber-attacks such as spamming, or executing Distributed Denial of Service (DDOS) by manipulating them via standards-based network protocols such as Internet Relay Chat (IRC) and Hypertext Transfer Protocol (HTTP), [19].
Although no serious DDOS attack originating from IoT network has yet been reported, it is predictable that DDOS attack scheme from IoT will be on its upward trend in a near future as mentioned in a warning press from Kaspersky blog [20]. Just to do a small calculation as a reference, let us assume that only 0.01% of the IoT network is compromised by 2020. This will make around 20 million appliances vulnerable to cyber-attacks. Even granting that most of the IoT will only transmit relatively small amounts of data, considering their enormous size, the DDOS attack will be severe enough and should have no difficulty in bringing down a server, or any single host. Moreover, unlike DOS attack which is generated in a pinpointed manner from a single computer or server to flood a target, DDOS attack has an integrated effect of a huge number of compromised devices. Once it occurs, blocking becomes extremely difficult since each compromised element has its own unique IP address.
D. Some Specific Attack Cases in Japan
A DVD/HDD video recorder in Japan, which implemented a proxy server and was acessible without authentication under its default configuration, was used as an open proxy server base for spamming [21], as shown in Figure 6.
In another incident, a music player, which was infected with a virus in the factory, corrupted its user’s computer upon
connection [22], as depicted in Figure 7. In an example of privacy violation, a poorly implemented
‘referrer’ feature in a cellular phone constantly transmitted
previously accessed page information even when the page was reached via direct addressing (i.e., non-hyperlink access). The browser flaw caused private information, which may had
been required to access a previous page (e.g., user name, password), to be revealed to the next link. It also revealed the user’s favorite sites by transmitting information on a
previously accessed page [23]. A Japanese researcher has also successfully exploited buffer overflow vulnerabilities in embedded home routers and managed to remotely gain complete access to peripheral devices [24].
IV. SECURITY IMPLEMENTATION CHALLENGES
Considering the above mentioned attacks aimed at smart appliances, it is apparent that the attack techniques are not new. However, what have been changed are the attack targets, which are the smart home appliances and devices in IoT network. In most cases, the attackers make complete use of the nature of Internet Protocol to have the access to those appliances; and oftentimes, the devices do not have full-functional display or screen so it is really hard for the victims to even detect that they are being attacked and abused internally. Furthermore, different from human-controlled computers, most of smart appliances (such as LED light bulbs smart system, smart refrigerators and smart meters) can easily be accessed due to their 24 hours around-the-clock availability on the Internet. Last but not least, because each appliance is designed to serve only a specific purpose, marketability factors such as low cost, portability, tinier size, etc. make built-in full cryptography capability infeasible in most of such appliances.
Therefore, implementing security on these devices presents more challenges than traditional computer security due to the limited resources (e.g., toy CPUs that cannot handle computationally expensive cryptographic computations and battery power that prohibits long-lasting or high-peak computations). Moreover, because security of a network depends on its weakest link, security of networked smart home appliances would rely on the security of its most primitive home appliance e.g., a coffee maker or a toaster. The problem is further aggravated by the fact that home appliance users cannot be considered as “skilled”
administrators, but are instead technology-unaware people in many cases.
Fig. 6 A spamming incident
Fig. 7 A PC Infection Incident
ICACT Transactions on Advanced Communications Technology (TACT) Vol. 5, Issue 2, March 2016 802
Copyright ⓒ 2016 GiRI (Global IT Research Institute)

As such, continuous growth of diverse smart home appliances and development of numerous networking technologies make management of home network security and their associated services complex to both users and service providers, as can be seen from Figure 8.
V. APPROPRIATE SECURITY MODEL
Though it is essential to make the smart home appliance system more secure from aforementioned cyber-attacks, it is obvious that equipping each of them with its own built-in security function against cyber-attacks in the same manner that has been done on personal computers and web servers is not the right approach. In a previous work, the author together with Mr. Hoang proposed implementation of TOR-based anonymous communication into the IoT network as an effective alternative way to help smart home appliance users
protect their privacy and make the smart home appliance system more secure from aforementioned cyber-attacks [2][3]. Although such approach can be effective, particularly for technology-aware and expert users, in this paper the author would like to emphasize the concept of universal home gateways and involvement of network operators in their security challenges [8][9] so as to effectively protect technology-unaware people who are the main users of such devices.
In order to come up with a model that can deal with the security requirements of smart appliances, a functionally categorized list of which shown in Table 1 along with a list of common attacks in Table 2 and likelihood of the attacks in Table 3, this section examines a proposed countermeasures shown in Table 4 in a conventional manner for each of the common attack and demonstrates how to tailor them for smart appliances via universal home gateways.
TABLE IV SUMMARY OF PROPOSED COUNTERMEASURES
No Common Threat Proposed Countermeasure 1 User Impersonation
Introduce a certificate mechanism through memory card like devices. 2 Device Impersonation 3 Service Interruption Control through network and access mechanism to outside world. 4 Data Alteration Introduce access control and certificate mechanism. 5 Worm/Virus Infection Use virus protection software and prepare to handle new vulnerabilities. 6 Phishing/Pharming Consider using SSL to assure genuineness of displayed sites. 7 Data Wiretapping Protect communication via IPSEC, SSL/TLS. 8 Firmware Alteration Use physical access control for update procedure. 9 OS/Software Vulnerability Educate R&D people on security and conduct product test.
A. Counter Measures
This subsection examines in some details the countermeasures for common attacks listed in Table 4 and recommends how to tailor them for smart appliances.
1) User/Device Impersonation: In this scenario, a malicious attacker tries to make an unauthorized access to the appliance and possibly perform some configuration changes on the system. Since the risk level of such an attack is high for smart appliances, a certification mechanism based on standard and public-key infrastructures (PKI) must be used among the entities involved as shown in Figure 9.
Following is a list of required certification mechanisms:
A standard certification mechanism between user and server.
An easy-to-use certification mechanism (e.g., through a memory card like device, a built-in speech recognizer, or biometrics recognition method) between the following entities: o Appliance ⇔ User o Appliance ⇔ PC o Appliance ⇔ Server o Appliance ⇔ Appliance
An SSL server certificate between the appliance and server.
Fig. 8. A heterogeneous home network and its service Providers
ICACT Transactions on Advanced Communications Technology (TACT) Vol. 5, Issue 2, March 2016 803
Copyright ⓒ 2016 GiRI (Global IT Research Institute)
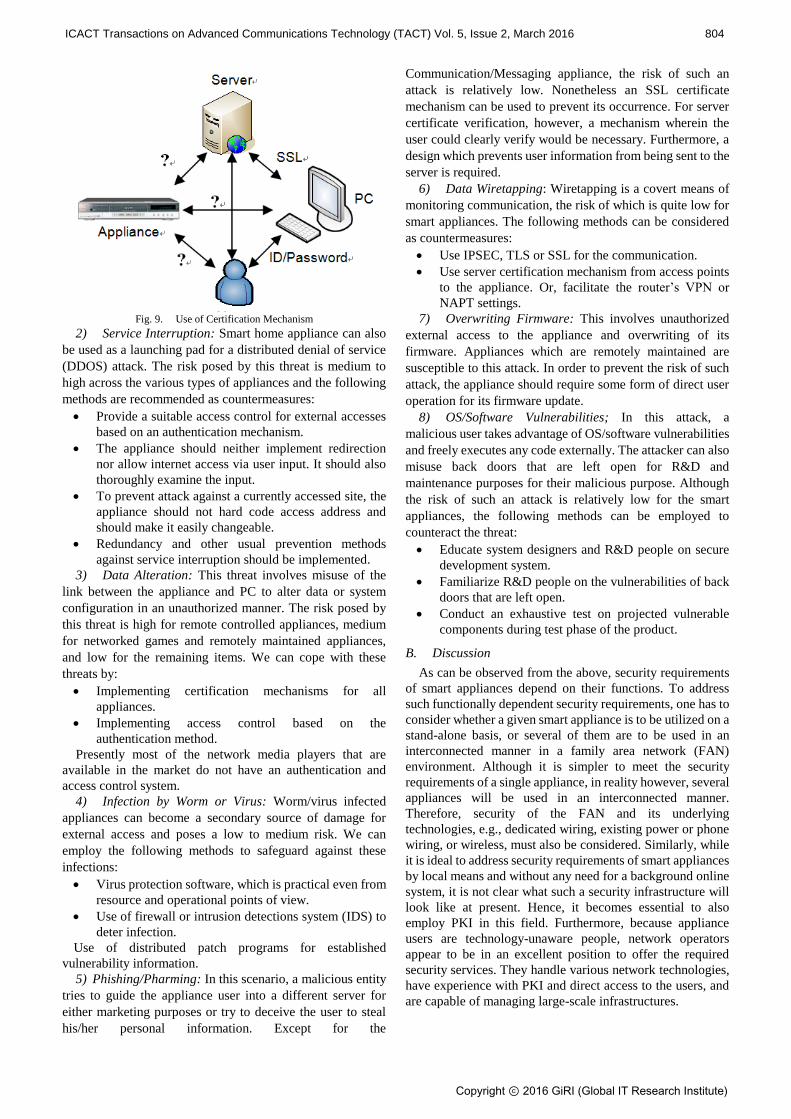
2) Service Interruption: Smart home appliance can also be used as a launching pad for a distributed denial of service (DDOS) attack. The risk posed by this threat is medium to high across the various types of appliances and the following methods are recommended as countermeasures:
Provide a suitable access control for external accesses based on an authentication mechanism.
The appliance should neither implement redirection nor allow internet access via user input. It should also thoroughly examine the input.
To prevent attack against a currently accessed site, the appliance should not hard code access address and should make it easily changeable.
Redundancy and other usual prevention methods against service interruption should be implemented.
3) Data Alteration: This threat involves misuse of the link between the appliance and PC to alter data or system configuration in an unauthorized manner. The risk posed by this threat is high for remote controlled appliances, medium for networked games and remotely maintained appliances, and low for the remaining items. We can cope with these threats by:
Implementing certification mechanisms for all appliances.
Implementing access control based on the authentication method.
Presently most of the network media players that are available in the market do not have an authentication and access control system.
4) Infection by Worm or Virus: Worm/virus infected appliances can become a secondary source of damage for external access and poses a low to medium risk. We can employ the following methods to safeguard against these infections:
Virus protection software, which is practical even from resource and operational points of view.
Use of firewall or intrusion detections system (IDS) to deter infection.
Use of distributed patch programs for established vulnerability information.
5) Phishing/Pharming: In this scenario, a malicious entity tries to guide the appliance user into a different server for either marketing purposes or try to deceive the user to steal his/her personal information. Except for the
Communication/Messaging appliance, the risk of such an attack is relatively low. Nonetheless an SSL certificate mechanism can be used to prevent its occurrence. For server certificate verification, however, a mechanism wherein the user could clearly verify would be necessary. Furthermore, a design which prevents user information from being sent to the server is required.
6) Data Wiretapping: Wiretapping is a covert means of monitoring communication, the risk of which is quite low for smart appliances. The following methods can be considered as countermeasures:
Use IPSEC, TLS or SSL for the communication. Use server certification mechanism from access points
to the appliance. Or, facilitate the router’s VPN or
NAPT settings. 7) Overwriting Firmware: This involves unauthorized
external access to the appliance and overwriting of its firmware. Appliances which are remotely maintained are susceptible to this attack. In order to prevent the risk of such attack, the appliance should require some form of direct user operation for its firmware update.
8) OS/Software Vulnerabilities; In this attack, a malicious user takes advantage of OS/software vulnerabilities and freely executes any code externally. The attacker can also misuse back doors that are left open for R&D and maintenance purposes for their malicious purpose. Although the risk of such an attack is relatively low for the smart appliances, the following methods can be employed to counteract the threat:
Educate system designers and R&D people on secure development system.
Familiarize R&D people on the vulnerabilities of back doors that are left open.
Conduct an exhaustive test on projected vulnerable components during test phase of the product.
B. Discussion
As can be observed from the above, security requirements of smart appliances depend on their functions. To address such functionally dependent security requirements, one has to consider whether a given smart appliance is to be utilized on a stand-alone basis, or several of them are to be used in an interconnected manner in a family area network (FAN) environment. Although it is simpler to meet the security requirements of a single appliance, in reality however, several appliances will be used in an interconnected manner. Therefore, security of the FAN and its underlying technologies, e.g., dedicated wiring, existing power or phone wiring, or wireless, must also be considered. Similarly, while it is ideal to address security requirements of smart appliances by local means and without any need for a background online system, it is not clear what such a security infrastructure will look like at present. Hence, it becomes essential to also employ PKI in this field. Furthermore, because appliance users are technology-unaware people, network operators appear to be in an excellent position to offer the required security services. They handle various network technologies, have experience with PKI and direct access to the users, and are capable of managing large-scale infrastructures.
Fig. 9. Use of Certification Mechanism
ICACT Transactions on Advanced Communications Technology (TACT) Vol. 5, Issue 2, March 2016 804
Copyright ⓒ 2016 GiRI (Global IT Research Institute)

C. Implementation Guidelines
It seems that no single vendor/manufacturer may be able to solve the problems faced. Nevertheless, the best way to proceed is to develop the security model around smart home appliances and network components that conform to certain standards. There are standards bodies which specify how to build these devices and meet their various requirements. It is essential to conform to these standards when building, managing and providing services for smart home appliances in the future. Such an approach will encourage more vendors/manufacturers to conform to these standards, and the standards themselves will evolve as needs arise.
The following subsections briefly explain some of the existing standards that define how to build and manage universally deployable smart home appliances. It also specifies implementation guidelines to set up a prototype system using an open architecture and a modular development scheme.
1) Association of Home Appliance Manufacturers: The Association of Home Appliance Manufacturers (AHAM) has completed an ANSI standard for generic object models for all of the major white goods in the home, including refrigerators, washing machines, dryers, dishwashers, microwave ovens, room air conditioners and ranges [25]. The AHAM Standard for Connected Home Appliances-Object Modeling (CHA-1) was also created to provide interoperability with higher-level protocols such as Universal Plug and Play (UPnP), Versatile Home Network (VHN) and others. It enables both appliance manufacturers and third-party developers to create new value-added services and features that will allow remote operation and monitoring of appliances from anywhere in the home or even when you are away from home.
2) ECHONET Consortium: ECHONET develops specifications of home network for networked household appliances, facilities and sensors. ECHONET Consortium has formulated the ECHONET Specification, which can be used to centrally monitor and control smart home appliances that are connected through an ECHONET compatible network interface and a controller [26]. The ECHONET specifications can ensure interoperability between devices of different vendors and realize easy home network at low cost. Also, ECHONET promotes the development of attractive service
and application systems using the ECHONET ™
specifications. ECHONET routers have conversion functions to
accommodate home appliances that use different transmission media. The ECHONET, which had previously only supported transmission media such as power lines, low-power radio frequency, and infrared radiation, has come to support other transmission media such as Bluetooth and Ethernet since the release of its version 3.00. Therefore, when there are multiple transmission media in the same domain, the installation of an ECHONET router specified by the ECHONET Specification will allow seamless connection between different types of transmission media.
The ECHONET consortium has over 100 members and its major sponsors are "Hitachi, Ltd.," "Matsushita Electric Industrial Co., Ltd.," "Mitsubishi Electric Corporation," "Sharp Corporation," "Tokyo Electric Power Company, Inc.," and "Toshiba Corporation." Smart home appliances
built by major Japanese companies are ECHONET compliant.
3) Open Services Gateway Initiative Alliance: The OSGi Alliance is an open forum. Their mission is to specify, create, advance, and promote an open service platform for the delivery and management of multiple applications and services to many types of networked devices. Their specifications were initially targeted at residential gateways for the connection of home devices to an external network or for interconnections between the different protocols that are used in devices at homes but have recently been extended to accommodate vehicle, mobile and other environments [28].
About half of its members are based in North America, a third are based in Europe, and the rest are based in the Asia/Pacific region. A number of products developed by member companies are based on the OSGi Service Platform specification [29].
The OSGi specification is not a new protocol technology that replaces existing ones; but rather assumes that multiple protocols could be used within the target device. Its relationship to other standards is schematically shown in Figure 10, where OSGi maps existing local network standards to broadband networks and provides portal services.
Figure 11 shows OSGi architecture which consists of OSGi Framework and a set of bundles [28].
The OSGi Framework provides the basic functionality for executing OSGi bundles which are software components that contain algorithms and protocols for controlling a device. When a bundle is required, it can be downloaded from a server on the network and then executed. This feature makes it possible to download and use the latest and most optimal bundles and allows customization of gateway functions for each user. Since only the bundles that are needed are downloaded and stored, little memory space is required.
Fig. 10. OSGi and other Standardized Technologies
Fig. 11. Structure of OSGi Gateway
ICACT Transactions on Advanced Communications Technology (TACT) Vol. 5, Issue 2, March 2016 805
Copyright ⓒ 2016 GiRI (Global IT Research Institute)

4) Next Generation Gateways: Even with the existence of standardized smart home appliances and standard specifications on how to network them together, a major challenge still falls on capabilities of gateways that connect all of these devices to the network, control the devices, and provide portal capability for using services offered by the external networks, including the Internet. The OSGi specification can be used to implement such gateway capabilities through software component technologies that use the Java language.
There are vendors like ProSyst [30] Bosch Group that use OSGi specification in their modular and open service platform. Companies like Motorola integrate ProSyst’s Service Gateway software in their advanced residential products and there are forums like Home Gateway Initiative [31] which define the next generation of residential gateway. There are also forums like UPnP [32] which provides architectural framework for self-configuring, self-describing devices.
The next logical step is to develop an experimental, secured service application for a home network consisting of open standard compliant home appliances and network components that are manufactured by different vendors. Although when using off-the-shelf products, one may need to employ several gateways and a computer as a service gateway, the above described OSGi specification maybe used to answer such problems. The next generation gateway should enable adoption of a uniform approach regardless of underlying technology and manufacturer.
D. A New Security Architecture
Considering the abovementioned security requirements and the various associated challenges, the most effective way to address security issues of the smart appliances are to:
Engage a network operator to build dedicated but nonproprietary home gateways and become the preferred trusted third party.
Motivate internet-enabled smart appliance manufacturers to develop device drivers and application software that can run on such universal home gateways to control and operate the appliances.
This idea is schematically shown in Figure 12, where a universal home gateway, managed by a network operator, functions as an entry point to the networked appliances. In this architecture, all transactions with the smart appliances, whether local or remote, are done via universal home gateways.
1) Basic Usage Scenarios: There are three basic usage scenarios here; one is access of local services by a user from
within a FAN (e.g., watch a movie using a video recorder located in another room), the other is downloading remote services, and the third one is control of smart appliances interconnected in a FAN environment, by a remote user (e.g., turn on air conditioner from the office).
From within the FAN, users can be authenticated through a common-password-based, log-on approach. Each user’s
access control information (e.g., no adult movies for kids below 17, or no movies for school-going children after 11 p.m. etc.), which is stored in the universal home gateway, can be used for access granting. To access a remote service site from within the FAN, the universal home gateway authenticates the user through an authentication server, establishes the user’s access control privilege, and initiates a secure communication between the remote service provider and the user for the transfer of the requested service. Remotely accessing home appliances is the counterpart of remote service access where the universal home gateway checks and validates a remote user’s access control privileges and allows secure communication for legitimate data transfer.
2) Desired Features of the Universal Home Gateway: In general, universal home gateways, in addition to having the general functions of supporting the underlying FAN technology, and acting as a gateway between a telecom operator’s network and the FAN and as an access point to the smart appliances for digital service providers and remote users, are envisioned to have the following security functions:
Authenticate a user from within FAN through either a common-password-based log-on approach or by the plugging of a memory card like device, containing user’s access control information, into the system. A
more user-friendly approach would require a built-in speech recognizer or biometrics recognition method.
Act as a security server and maintain each user’s access
control information (security attributes and the basic key for communication with remote services).
Provide secure communication and deal with security issues on behalf of the appliance users. Enable remote management services through providers, intermediaries, and network operators. Allow network operators to use universal home gateways to authenticate their users, or bill them on behalf of a third party e.g., service providers.
Detect connection of a new appliance to the FAN and prompt users to insert its manufacturer supplied driver/application software. Such a plug and play type auto configuration mode, however, should be manually selectable (i.e., be enabled when needed) in order to
Fig. 12. Smart Appliance Security via Network Operator
ICACT Transactions on Advanced Communications Technology (TACT) Vol. 5, Issue 2, March 2016 806
Copyright ⓒ 2016 GiRI (Global IT Research Institute)

provide an added security for wireless FAN and prevent arbitrary connection from the neighborhood.
Automatically disable, via software selectable functions, an appliance when it is detached from the FAN and auto configure when a previously detached appliance is re-connected.
Be equipped with firewall and virus protection software Such functionalities could meet security measures which
were discussed earlier. Moreover, because security requirements are handled via central universal home gateways, it could offset resource limitations of individual smart appliances.
3) Existing and Envisioned Technologies: Although at present there are some vendors who market their own brand of smart appliances, which are equipped with a central controller that links the appliances together in a FAN environment and offer limited security and exclusive digital services [33][34], history shows that such propriety approaches are prone to fail. Similarly, while some researchers, e.g., those at the University of Illinois [35], have done ingenious work in coming up with protocols and schemes that could provide security for smart home appliances, a universally deployable, user-friendly system, which is acceptable to a wide range of users, is the key issue.
VI. CONCLUSION
This paper demonstrated how commonly used communication scheme and information retrieval which are carried out via Internet using numerous types of smart devices, can turn the Internet into a very dangerous platform. After providing some introductory information and necessary background knowledge, it examined a number of security incidents that are carried out via smart devices, identified existing challenges and showed that the security requirements of smart appliances depend on their functions. The security requirements of the appliances, categorized based on their functions, were then identified and appropriate solution for each category was proposed. PKI was identified as an essential security component and easy-to-use authentication mechanisms were recommended. It considered compliance with existing standards and liaise with appropriate fora to downstream new requirements important when trying to address security requirements of smart home appliances. It argued that successive security implementation involves cooperation of manufacturers, network operators and service providers. An architecture wherein security issues are managed through universal home gateways by network operators in a product based fashion is proposed and manufacturers and service providers are recommended to adapt the technology, in order to offset resource limitations of individual smart appliances and make their security issues straightforward to ordinary users.
REFERENCES
[1] Chris Drake (2013). FireHost Detects Surge in SQL Injection for Q3 2013 and Cross-Site Scripting is Rising. Retrieved October 22, 2013, from
[2] Hoang Nguyen Phong, Davar Pishva (2014). Anonymous communication and its importance in social networking. In Proceeding of the 16th International Conference on Advanced Communication Technology (vol. 1, pp. 34-39).
[3] Hoang Nguyen Phong, Davar Pishva (2014). A TOR-Based Anonymous Communication Approach to Secure Smart Home Appliances. ICACT Transactions on Advanced Communications Technology (TACT), 3(5), 517-525.
[4] Statista (2015). Leading social networks worldwide as of March 2015, ranked by number of active users (in millions). Retrieved June 18, 2015, from http://www.statista.com/statistics/272014/global-social-networks-ranked-by-number-of-users/.
[5] Kimberlee Morrison (2015). The Growth of Social Media: From Passing Trend to International Obsession. Retrieved June 18, 2015, from http://www.adweek.com/socialtimes/the-growth-of-social-media-from-trend-to-obsession-infographic/142323.
[6] Jeffbullas (2014). 22 Social Media Facts and Statistics You Should Know in 2014. Retrieved June 18, 2015, from http://www.jeffbullas.com/2014/01/17/20-social-media-facts-and-statistics-you-should-know-in-2014/.
[7] Herper, Matthew (2003, Febuary). Emerging Technologies: 'Smart' Kitchens A Long Way Off. Paper presented at Forbes.
[8] D. Pishva, K. Takeda (2006). A Product Based Security Model for Smart Home Appliances, In Proceeding of 40th Annual IEEE International Carnahan Conferences on Security Technology (vol. 1, pp. 234-242).
[9] D. Pishva, K. Takeda (2008). A Product Based Security Model for Smart Home Appliances, IEEE Aerospace and Electronics System Magazine, 23(10), 32-41.
[10] Staff (2003). Wired News: Caregiver Tech Slowly Evolves, Associated Press, September 2003.
[11] Carrie MacGillivray, Vernon Turner, Denise Lund (2014). Worldwide Internet of Things (IoT) 2013–2020 Forecast: Billions of Things, Trillions of Dollars. Retrieved January 2014, from International Data Corporation: http://www.idc.com/getdoc.jsp?containerId=243661.
[12] Angelia, D. Pishva (2013). Online Advertising and its Security and Privacy Concerns. In Proceeding of the 15th International Conference on Advanced Communication Technology (vol. 1, pp. 372-377).
[13] Metzger, Miriam J. (2007). Communication Privacy Management in Electronic Commerce. Journal of Computer-Mediated Communication, 12(2), 335–361. Retrieved June 18, 2015, from http://dx.doi.org/10.1111/j.1083-6101.2007.00328.x.
[14] Schwartz, M. J. (2011, March 31). Schwartz On Security: Online Privacy Battles Advertising Profits. Retrieved June 7, 2015, from Information Week: http://www.informationweek.com/news/security/privacy/229400615.
[15] Verizon Enterprise (2013). The 2013 Data Breach Investigations Report. Retrieved 2013, from: http://www.verizonenterprise.com/DBIR/2013.
[16] Revuln (2014). Having fun via WIFI with Philips Smart TV. Retrieved July 8, 2015, from http://vimeo.com/90138302.
[17] Hemanth Joseph (2014). Dosing Pebble Smart Watch And Thus Deleting All Data Remotely. Retrieved August 2014, from http://www.whitehatpages.com/2014/08/dosing-pebble-smartwatch-and-thus.html.
[18] Ghena, B., Beyer, W., Hillaker, A. Pevarnek, J., & Halderman, J. A. (2014). Green lights forever: analyzing the security of traffic infrastructure. In Proceedings of the 8th USENIX conference on Offensive Technologies (vol. 1, pp. 7-7). USENIX Association.
[19] Ramneek Puri (2003, August). Bots &; Botnet: An Overview. Retrieved July 8, 2015, from SANS Institute InfoSec Reading Room: http://www.sans.org/reading-room/whitepapers/malicious/bots-botnet-overview-1299.
[20] Brian Donohue, Beware (2014). The Thingbot! Retrieved January 2014, from Kaspersky Lab: https://blog.kaspersky.com/beware-the-thingbot/.
[21] Katagi, Kizu (2004). Vulnerability of Toshiba's RD Series HDD-DVD Recorder ‘Stepping-stone’ for Danger, Retrieved (in Japanese) June 18, 2015, from Internet Watch: http://internet.watch.impress.co.jp/cda/news/2004/10/06/4882.html.
[22] Creative (2004). A Report to Customers on the Issue of ‘Creative Zen
Neeon’ Digital Audio Player and its Response. Press Release (in Japanese) retrieved June 18, 2015, from http://jp.creative.com/corporate/pressroom/releases/welcome.asp?pid=12181.
[23] AU Announcement (2005). EZweb Browser’s Home Page URL
Transmittal on AU and TU-KA Mobile Phones. Retrieved (in Japanese) December 2005, from KDDI News: http://www.au.kddi.com/news/topics/au_topics_index20051209.html.
ICACT Transactions on Advanced Communications Technology (TACT) Vol. 5, Issue 2, March 2016 807
Copyright ⓒ 2016 GiRI (Global IT Research Institute)
[24] Ukai, Yuji (2005). Exploiting Real-Time OS Based Embedded Systems Using the JTAG Emulator. PACSEC-JP, Tokyo, Japan.
[25] AHAM (2006). Association of Home Appliance Manufacturers. Retrieved January 2006, from https://www.aham.org.
[26] ECHONET (2006). Energy Conservation and Homecare Network Consortium. Retrieved January 2006, from http://www.echonet.gr.jp/english/index.htm.
[27] http://www.firehost.com/company/newsroom/press-releases/firehost-detects-surge-in-sql-injection-for-q3-2013-with-cross-site-scripting-also-rising/.
[28] OSGi Alliance (2015), OSGi and the Internet of Things (IoT). Retrieved June 18, 2015, from http://www.osgi.org/Main/HomePage.
[29] OSGi Service Platform Products (2015). OSGi Markets and Solutions. Retrieved July 8, 2015, from http://www.osgi.org/products/products.asp?section=3.
[30] ProSyst Bosch Group (2015). Internet of Things. Retrieved July 8, 2015, from http://www.prosyst.com/startseite/.
[31] HGI (2006). Home Gateway Initiative. Retrieved January 2006, from http://www.homegateway.org/aboutus/vision.html.
[32] UPnP Forum (2008). UPnP Product Scenarios. Retrieved January 2008, from http://www.upnp.org/.
[33] Kato Yoshimi (2005). Addressing Security Requirements of Network Enabled Home Appliances, Next Generation IP Infrastructure Group Report (WG3-1), Retrieved (in Japanese) December 2005, from Ministry of Internal Affairs and Communication (MIC): http://www.soumu.go.jp/joho_tsusin/policyreports/chousa/jise_ip/pdf/050217_1_s1.pdf.
[34] Tezuka Satoru (2005, February). Information Appliance System Authentication Technology, Next Generation IP Infrastructure Group Report (WG3-2). Retrieved (in Japanese) January, 2006, from Ministry of Internal Affairs and Communication (MIC): http://www.soumu.go.jp/joho_tsusin/policyreports/chousa/jise_ip/pdf/050217_1_s2.pdf.
[35] J. Al-Muhtadi, M. Anand, M.D. Mickunas, R. Campbell (2000). Secure Smart Homes Using Jini and UIUC SESAME. In Proceeding of 16th Annual Computer Security Applications Conference (vol. 1, pp. 77).
Davar Pishva is a professor in ICT at the College of Asia Pacific Studies, Ritsumeikan Asia Pacific University (APU) Japan. In teaching, he has been focusing on information security, technology management, VBA for modelers, structured decision making and carries out his lectures in an applied manner. In research, his current interests include biometrics; e-learning, environmentally sound and ICT enhanced technologies. Dr. Pishva received his
PhD degree in System Engineering from Mie University, Japan. He is a Senior Member of IEEE, a member of IEICE (Institute of Electronics Information & Communication Engineers), and University & College Management Association.
ICACT Transactions on Advanced Communications Technology (TACT) Vol. 5, Issue 2, March 2016 808
Copyright ⓒ 2016 GiRI (Global IT Research Institute)

CampusSense - A Smart Vehicle Parking
Monitoring and Management System using ANPR
Cameras and Android Phones Mohammed Y Aalsalem, Wazir Zada Khan
Farasan Networking Res. Lab, Faculty of Computer Science & Information System, Jazan University, Kingdom of Saudi
Arabia {aalsalem.m, wazirzadakhan}@jazanu.edu.sa
Abstract-- Vehicle parking monitoring and management has
become a big challenge for educational institutions with
increasing enrollments, high percentage of vehicle ownership
and decreasing parking supply which in result triggering
blockage of vehicle, congestion, wastage of time and money. In
university campuses particularly in Kingdom of Saudi Arabia,
vehicle parking monitoring and management problem is getting
worse and more frustrating due to the fact that majority of
students, faculty and staff members own cars and drive
through them to the university campuses. These common
problems include finding out people (evidence) who are
responsible for the damages (hitting, scraping, scratching and
dents) to other cars and the blockage of car due to wrong car
parking which takes much time to locate the owner of the car.
Moreover, locating or forgetting their car park location
another difficulty that is often faced by the students, faculty
and staff members. The existing cameras located at the parking
lots are only for video surveillance and cannot help in such
situations as there is a lack of proper vehicle parking
monitoring and management system. To cope with above
mentioned problems and to ensure a better parking experience
by accommodating increasing number of vehicles in a proper
convenient manner, we propose a smart vehicle parking
monitoring and management system called CampusSense. In
CampusSense, Automatic Number Plate Recognition (ANPR)
cameras and android based mobile application is developed to
efficiently monitor, manage and protect the parking facilities at
university campuses. Parking problems around the university
campus faced by the students, faculty and staff members are
analyzed by conducting a survey.
Keywords—Smart Vehicle Parking Monitoring and
Management, Android based Mobile Phones, License Plat
Recognition, Locating Vehicle, Mobile Sensing.
I. INTRODUCTION
ehicle parking monitoring and management is
challenging problem due to the growing number of
vehicles at university campuses and also for catching the
responsible persons for damaging the vehicles (like scratches,
dents, scraps etc.) of other people’s inside a campus who
remain anonymous and also result in confusion, annoyance
and wastage of time. ———————————————————————
Manuscript received Feb. 13, 2016. This work is a follow-up the invited
journal to the accepted conference paper of the 17th International
Conference on Advanced Communication Technology (ICACT2015).
Mohammed Y Aalsalem is currently Dean Faculty of Computer Science
and Information System, Jazan University, KSA and Founder & Director of
Farasan Networking Res. Lab. (Corresponding author, Phone:
+966173230004; fax: +966173210850; e-mail: aalsalem.m @
jazanu.edu.sa).
Wazir Zada Khan is currently with Faculty of Computer Science and
Information System, Jazan University, KSA and Member & Co-Founder of
Farasan Networking Res. Lab. (e-mail: [email protected]).
The problem is getting more severe day by day due to the
fact that a the number of student enrolments is increasing
year by year and a huge percentage of students and faculty
own cars with the limited number parking lots. Blocking the
other parked vehicles in the parking lots by people while
parking their cars improperly is an important issue in vehicle
parking. Due to this, finding the responsible persons and
remain stuck and frustrated for the blocked vehicle owners
until they get the vehicle out of the parking lot. The security
guards at the parking lots are unable to help in this regard
because of the lack of any monitoring and management
enforcement systems and policies. Due to this, it takes much
time in pursuing the responsible person which consequently
results in the wastage of precious time of students as well as
faculty and staff members. Another critical problem (that
arises due to the reserved and limited number of vehicle
parking lots) is that students (for whom no reserved parking
is available) may damage other parked vehicles while
improper and wrong vehicle parking. The damaged vehicle
owners remain unsuccessful in finding out the responsible
persons for damaging their vehicles and no one can help out
in this concern because there is no proper monitoring system
that can keep record of the in and out information (i.e.
entrance and exit) of the vehicles and parking information
(like parking location, parking duration) of vehicles.
Moreover, in case of suspected vehicles (involved in any
criminal activity) are unable to trace out by current system
as there is no record or way to identify them. Another most
common problem faced by students, faculty and staff
members is they often forget where they have parked their
vehicles in the parking lots. So, finding out a vehicle in such
a scenario without any automated management system is
results in anger, exasperation and wastage of time and it is
also difficult and time consuming task.
Smart phones are now days the key computing and
communication device and these mobile phones are
equipped with a rich set of embedded sensors. These
specialized sensors including ambient light sensor,
accelerometer, digital compass, gyroscope, GPS, proximity
sensor and general purpose sensors like microphone and
camera. These sensors collectively enable new applications
across a wide variety of domains like homecare, healthcare,
social networks, safety, environmental monitoring,
ecommerce and transportation [1-2]. Mobile sensing
provides the opportunity to track dynamic information about
environmental impacts and develop maps and understand
patterns of human movement, traffic, and air pollution [3].
Using these extraordinary monitoring capabilities of smart
phone sensors a wide range of mobile application are
developed for traffic monitoring for example monitoring
V
ICACT Transactions on Advanced Communications Technology (TACT) Vol. 5, Issue 2, March 2016 809
Copyright ⓒ 2016 GiRI (Global IT Research Institute)

road and traffic conditions, detecting road bumps, honks,
potholes etc. Such traffic monitoring systems include [4-9].
The current vehicle parking monitoring and management
system at the Jazan University is fully manual which only
allows the authorized vehicles that are registered by having
the entrance sticker. The whole university area including
entrance and exit gates, academic area, administrative and
parking zones are all under video surveillance. But this can
only serve for video capturing and storing and are not
connected to any proper monitoring and management
system.
In this paper we have proposed a smart vehicle parking
monitoring and Management system called CampusSense to
overcome the above mentioned problems which encountered
while vehicle parking in the parking area of the University
campus. We have also review the contribution in [10] and
after further investigation the CampusSense system by
discussing the design and the system features in more details.
CampusSense consist of hardware (ANPR Cameras) and
software components (Mobile Application and Management
System) and can assist the security department to handle the
parking problems more effectively such as locating the car if
a person forgets its exact parking location or to locate and
pursue the liable person for damaging or blocking some ones
car while wrong car parking in the parking lot.
A quantitative questionnaire based survey is also
conducted to investigate the problems encountered by the
students, faculty and staff members. The results of the
survey provide a confirmation of the above mentioned
problems that the students, faculty and staff members are
facing and thus our proposed system fulfills all the
requirements that need to be addressed by providing
appropriate solutions of these problems.
The proposed CampusSense system aims to provide an
appropriate solution for all the problems which have been
identified by analyzing the conducted survey. The aims and
objectives of the proposed systems are as follows:
• To implement a vehicle parking monitoring and
management system that will automate the existing
parking management system by keeping all the in/out
information and parking information of vehicles at
university campus.
• To facilitate the security department in assuring the
safety and satisfaction of the students, faculty and staff
members while parking at the university campus.
• To develop a mobile application which will facilitate in
reducing the frustration and annoyance of those who
often forget the exact parking location of their cars. • To assist the security department in finding out the car
owners who have blocked other cars by parking cars
improperly.
• To help the security department for tracing out the
suspected or abundant (long term parked) vehicles at
university campus.
The rest of the paper is organized as follows: Section II
describes the existing parking management systems. Section
III presents the design & working of the proposed system. In
Section IV the survey statistics are discussed. Finally
Section V concludes the paper.
II. RELATED WORK
In this section, first we have covered the Sensor and RFID
based vehicle parking monitoring and management systems
and secondly the mobile sensing applications related to
traffic monitoring.
In the literature the available vehicle parking monitoring
and management systems are either sensor based [11-13] or
RFID [14-16] based and they mostly address the issue of
finding a vacant parking location in the parking lot. These
systems are only helpful in determining the occupancy status
of parking space but are unable to figure out the solutions for
the above mentioned problems like the information about
responsible persons who either block or damage other cars
while parking their own. So of the parking problem
encountered at universities campuses are studied in [17].
The parking management systems based on sensors have
a problem as mostly sensors are unable to detect obstacles
that are not visible because of their flatness to the ground
level and thus they cannot distinguish pedestrians or objects
from the vehicles of interest, in result have more false
positives. Another challenge in Sensor and RFID based
systems is that they are prone to many attacks [18] like
denial of service attacks (DoS)[19], selective forwarding
attack[20-21], node replication attack[22-24], Sybil
attack[25-26], wormhole attack[27], black hole attack[27]
and Signal or Radio Jamming attack [29-30] etc. RFID
based systems are also suspect to many attacks like [31-32].
Many mobile sensing based systems are proposed for traffic
monitoring for example monitoring road and traffic
conditions, detecting road bumps, honks, potholes etc, these
systems include Nericell [4], VTrack [5], TrafficSense [6],
Mobile Millennium [7], TARIFA [8] and Road Bump
Monitor [9]. TABLE I shows the comparison of
CampusSense with other mobile sensing system.
Prashanth Mohan et al. have proposed two systems
Nericell [4] and TrafficSense [6] to detect potholes, bumps,
braking, and honking using phones sensors like
accelerometer, microphone, GSM radio, and/or GPS. The
authors have used the idea of triggered sensing, where
dissimilar sensors are used in tandem to conserve energy.
The data is gathered through GPS-tagged cellular tower
measurements during several drives over the course of 4
weeks. GPS-tagged accelerometer data measurements are
also separately gathered on drives on some of the same
routes over the course of 6 days. Cellular tower
measurements are also gathered over the course of a few
days in the Seattle area. The system could be used to
annotate traditional traffic maps with information such as the
bumpiness of roads, and the noisiness and level of chaos in
traffic, for the benefit of the traffic police, the road works
ICACT Transactions on Advanced Communications Technology (TACT) Vol. 5, Issue 2, March 2016 810
Copyright ⓒ 2016 GiRI (Global IT Research Institute)
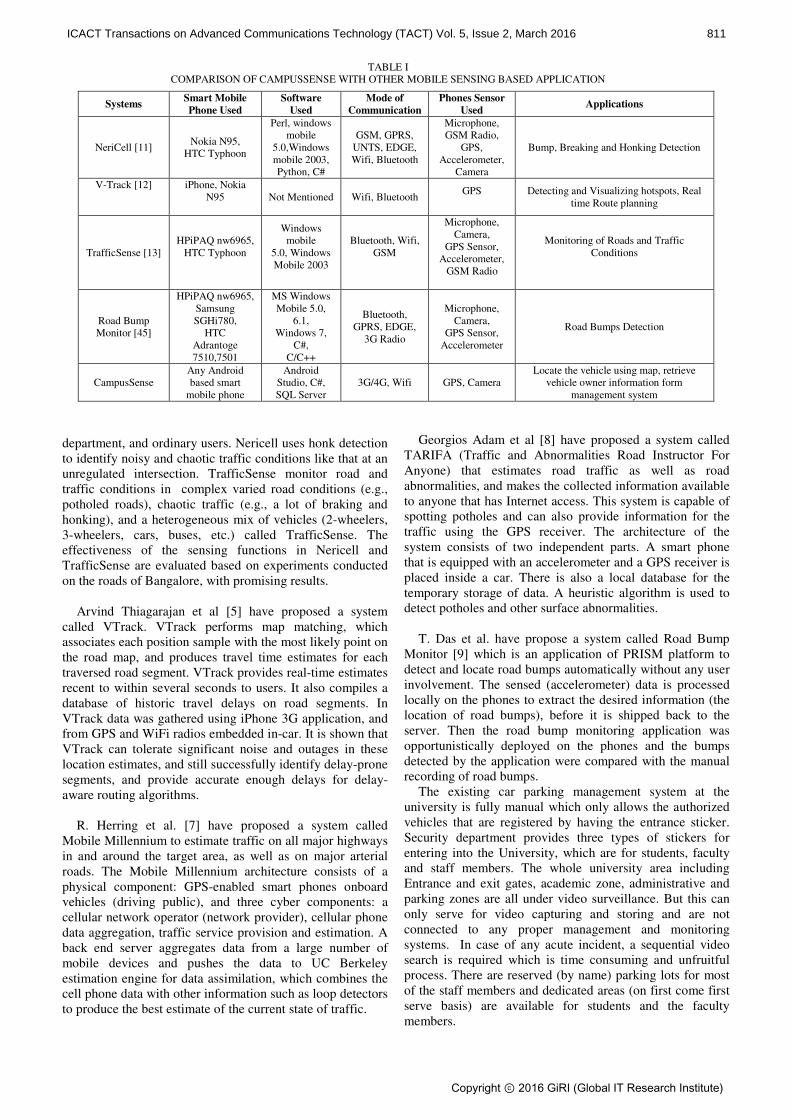
department, and ordinary users. Nericell uses honk detection
to identify noisy and chaotic traffic conditions like that at an
unregulated intersection. TrafficSense monitor road and
traffic conditions in complex varied road conditions (e.g.,
potholed roads), chaotic traffic (e.g., a lot of braking and
honking), and a heterogeneous mix of vehicles (2-wheelers,
3-wheelers, cars, buses, etc.) called TrafficSense. The
effectiveness of the sensing functions in Nericell and
TrafficSense are evaluated based on experiments conducted
on the roads of Bangalore, with promising results.
Arvind Thiagarajan et al [5] have proposed a system
called VTrack. VTrack performs map matching, which
associates each position sample with the most likely point on
the road map, and produces travel time estimates for each
traversed road segment. VTrack provides real-time estimates
recent to within several seconds to users. It also compiles a
database of historic travel delays on road segments. In
VTrack data was gathered using iPhone 3G application, and
from GPS and WiFi radios embedded in-car. It is shown that
VTrack can tolerate significant noise and outages in these
location estimates, and still successfully identify delay-prone
segments, and provide accurate enough delays for delay-
aware routing algorithms.
R. Herring et al. [7] have proposed a system called
Mobile Millennium to estimate traffic on all major highways
in and around the target area, as well as on major arterial
roads. The Mobile Millennium architecture consists of a
physical component: GPS-enabled smart phones onboard
vehicles (driving public), and three cyber components: a
cellular network operator (network provider), cellular phone
data aggregation, traffic service provision and estimation. A
back end server aggregates data from a large number of
mobile devices and pushes the data to UC Berkeley
estimation engine for data assimilation, which combines the
cell phone data with other information such as loop detectors
to produce the best estimate of the current state of traffic.
Georgios Adam et al [8] have proposed a system called
TARIFA (Traffic and Abnormalities Road Instructor For
Anyone) that estimates road traffic as well as road
abnormalities, and makes the collected information available
to anyone that has Internet access. This system is capable of
spotting potholes and can also provide information for the
traffic using the GPS receiver. The architecture of the
system consists of two independent parts. A smart phone
that is equipped with an accelerometer and a GPS receiver is
placed inside a car. There is also a local database for the
temporary storage of data. A heuristic algorithm is used to
detect potholes and other surface abnormalities.
T. Das et al. have propose a system called Road Bump
Monitor [9] which is an application of PRISM platform to
detect and locate road bumps automatically without any user
involvement. The sensed (accelerometer) data is processed
locally on the phones to extract the desired information (the
location of road bumps), before it is shipped back to the
server. Then the road bump monitoring application was
opportunistically deployed on the phones and the bumps
detected by the application were compared with the manual
recording of road bumps.
The existing car parking management system at the
university is fully manual which only allows the authorized
vehicles that are registered by having the entrance sticker.
Security department provides three types of stickers for
entering into the University, which are for students, faculty
and staff members. The whole university area including
Entrance and exit gates, academic zone, administrative and
parking zones are all under video surveillance. But this can
only serve for video capturing and storing and are not
connected to any proper management and monitoring
systems. In case of any acute incident, a sequential video
search is required which is time consuming and unfruitful
process. There are reserved (by name) parking lots for most
of the staff members and dedicated areas (on first come first
serve basis) are available for students and the faculty
members.
Systems Smart Mobile
Phone Used
Software
Used
Mode of
Communication
Phones Sensor
Used Applications
NeriCell [11] Nokia N95,
HTC Typhoon
Perl, windows
mobile
5.0,Windows
mobile 2003,
Python, C#
GSM, GPRS,
UNTS, EDGE,
Wifi, Bluetooth
Microphone,
GSM Radio,
GPS,
Accelerometer,
Camera
Bump, Breaking and Honking Detection
V-Track [12]
iPhone, Nokia
N95
Not Mentioned Wifi, Bluetooth GPS
Detecting and Visualizing hotspots, Real
time Route planning
TrafficSense [13]
HPiPAQ nw6965,
HTC Typhoon
Windows
mobile
5.0, Windows
Mobile 2003
Bluetooth, Wifi,
GSM
Microphone,
Camera,
GPS Sensor,
Accelerometer,
GSM Radio
Monitoring of Roads and Traffic
Conditions
Road Bump
Monitor [45]
HPiPAQ nw6965,
Samsung
SGHi780,
HTC
Adrantoge
7510,7501
MS Windows
Mobile 5.0,
6.1,
Windows 7,
C#,
C/C++
Bluetooth,
GPRS, EDGE,
3G Radio
Microphone,
Camera,
GPS Sensor,
Accelerometer
Road Bumps Detection
CampusSense
Any Android
based smart
mobile phone
Android
Studio, C#,
SQL Server
3G/4G, Wifi GPS, Camera
Locate the vehicle using map, retrieve
vehicle owner information form
management system
TABLE I
COMPARISON OF CAMPUSSENSE WITH OTHER MOBILE SENSING BASED APPLICATION
ICACT Transactions on Advanced Communications Technology (TACT) Vol. 5, Issue 2, March 2016 811
Copyright ⓒ 2016 GiRI (Global IT Research Institute)

III. CAMPUSSENSE
This section presents a smart vehicle parking monitoring
and management system called CampusSense. The
CampusSense is consist of both hardware and software
components.
• The hardware component will consist of Automatic
Number Plate Recognition (ANPR) cameras which are
mounted on the entrance and exit gates and parking lots
of the campus.
• The software components will include a parking
management system and a mobile application.
CampusSense leverage ANPR cameras for capturing the
license number plates of the vehicles instead of Sensor or
RFID based existing vehicle parking management systems.
These ANPR cameras are more advantageous than other
technologies. ANPR cameras are known with different
names like ALPR (Automatic License Plate Recognition),
LPR (License Plate Recognition), CPR (Car Plate
Recognition) and AVI (Automatic Vehicle Identification). It
provides faster traffic management at parking areas, ability
to automate access control systems with a setup of ticket free
systems providing new and more effective law enforcement.
ANPR cameras are suitable in all weather conditions and can
be mounted at higher mounting locations to assure a wider
field view of the whole parking lot.
Fig. 1. Capture the vehicle license plate using camera at entrance and
store it in the database.
The authorized vehicles will be registered in the parking
management system along with their owner information.
The information about the parking zones and parking lots
will already be stored in the system with the other related
information (e.g. which camera is monitoring the parking lot
with their physical locations (x & y coordinates).
Fig. 2. Capture the vehicle license plate using camera at parking lots or
when change the place then store it in the database.
Fig. 3. Capture the vehicle license plate using camera at exit and store it in
the database.
The vehicle license plate number will be capture using
ANPR cameras on entering/exiting the gates and at the
parking lots and will be store to vehicle management system.
Fig. 1 and Fig. 3 show the capturing of vehicle license plate
using camera at entrance/exit and store it in the database. Fig.
2. Shows the capturing of vehicle license plate using camera
at parking lots or when change the place then store it in the
database. A mobile application has two features. First, it is
responsible for locating the car if a person forgets its exact
parking location. This feature is for general purpose and can
guide all the persons who are parking in the parking zones of
the University. Second, it can assist the mobile security units
to locate and pursue the liable person for damaging or
blocking some ones car while wrong car parking in the
parking lot. This feature is specifically built for security
purposes that can aid the security department to ensure the
safety of the students, faculty and staff members while car
parking. Fig. 5 shows the working of the mobile application
to retrieve the required information.
Fig. 4. Flow Chart for the working of ANPR Cameras integrated with
vehicle management system.
The working of the ANPR cameras can be easily
comprehended by the flow chart in Fig. 4. It shows that the
ANPR cameras that are mounted on the entrance and exit
gates of university and placed as well in all the parking lots
will first capture the License plate number while
entering/exiting/parking of the vehicles and then store it in
the database. The ANPR cameras are integrated with the
Vehicle Parking Management System which contains the
ICACT Transactions on Advanced Communications Technology (TACT) Vol. 5, Issue 2, March 2016 812
Copyright ⓒ 2016 GiRI (Global IT Research Institute)

records of entrance and exit timing information of the
authorized vehicles along with the parking location and their
owner’s information. In case when any parked car is
damaged by the some other car, the information about the
vehicle and liable person for damaging the parked car in the
parking lot can be found by the system records. This can be
done by searching out the information about the timing and
parking location of the cars nearby the damaged car/vehicle.
Fig. 5. Working of the mobile application to retrieve the required
information.
The working of a mobile application can be shown in the
form of a flow chart as in Fig. 6. This mobile application can
assist the security manger to handle two problematic
situations during car parking in the university campus. In
case if any car is blocked by wrong car parking then this
application can locate the owner of the car who has blocked
the other parked car. This application can also help the
persons who often forget the exact location of their parked
cars. This mobile application keeps the personal information
about the vehicle owners as a secret and only the security
department personnel are able to see that information. For
developing the prototype mobile application Android Studio
is used and for parking management system the database is
developed in SQL Server and the user interface is design &
developed in C#.
Fig. 6. Flow Chart for the working of the mobile application.
The screen shots of the proposed prototype mobile
application are shown below in Fig. 7. These screen shots
show the two main features of the prototype application i.e.
locating the exact parking location of the car (Find my Car)
and finding out the owner of the vehicle who has blocked
another car (Who is this Car).
Fig. 7. Screen shots of the prototype mobile application.
The Proposed CampusSense has following benefits:
• Helps the security department to find out the
responsible for the damages (hitting, scraping,
scratching and dents) to other cars.
• Helps the security department to locate the owner
of the car which cause blockage.
• Helps the students, faculty and staff to locate their
cars on forgetting their car park location.
• Helps in finding out the owner of those cars that are
parked from many days.
• The security department can retrieve all the history
of any particular car.
IV. SURVEY STATISTICS
A survey from 26th to 30th of October 2014 was
conducted by filling out a quantitative questionnaire. A total
of 88 persons participated in the survey out of which 53
were students and 35 were faculty and staff members. A
number of questions were asked from the participants. Fig. 8
(a) shows the percentages of the different age groups of the
staff/ faculty members and Fig. 8 (b) shows the percentages
of the different age groups of students the. The survey
results show that majority of the participants from staff and
faculty were above 26 years old (91%) and on other side
majority of students were between 22 to 25 years old (66%).
Fig. 8. Percentages of different age groups of the participants.
Fig. 9 (a) shows the percentages of different modes of
transportation for reaching the university campus used by
the staff/ faculty members and Fig. 9 (b) shows the
9%
91%
Age 18-21
Age 22-25Age 26 & Above
34%
66%
0%
Age 18-21
Age 22-25
Age 26 & Above
(a) (b)
ICACT Transactions on Advanced Communications Technology (TACT) Vol. 5, Issue 2, March 2016 813
Copyright ⓒ 2016 GiRI (Global IT Research Institute)
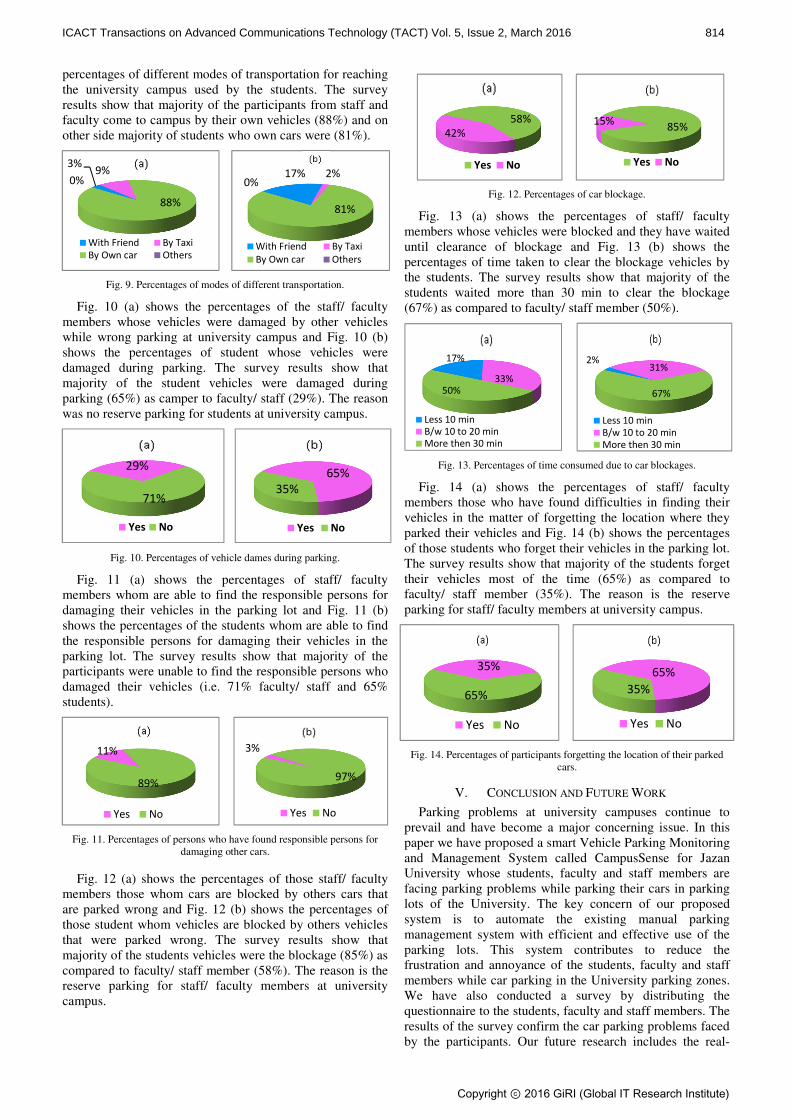
percentages of different modes of transportation for reaching
the university campus used by the students. The survey
results show that majority of the participants from staff and
faculty come to campus by their own vehicles (88%) and on
other side majority of students who own cars were (81%).
Fig. 9. Percentages of modes of different transportation.
Fig. 10 (a) shows the percentages of the staff/ faculty
members whose vehicles were damaged by other vehicles
while wrong parking at university campus and Fig. 10 (b)
shows the percentages of student whose vehicles were
damaged during parking. The survey results show that
majority of the student vehicles were damaged during
parking (65%) as camper to faculty/ staff (29%). The reason
was no reserve parking for students at university campus.
Fig. 10. Percentages of vehicle dames during parking.
Fig. 11 (a) shows the percentages of staff/ faculty
members whom are able to find the responsible persons for
damaging their vehicles in the parking lot and Fig. 11 (b)
shows the percentages of the students whom are able to find
the responsible persons for damaging their vehicles in the
parking lot. The survey results show that majority of the
participants were unable to find the responsible persons who
damaged their vehicles (i.e. 71% faculty/ staff and 65%
students).
Fig. 11. Percentages of persons who have found responsible persons for
damaging other cars.
Fig. 12 (a) shows the percentages of those staff/ faculty
members those whom cars are blocked by others cars that
are parked wrong and Fig. 12 (b) shows the percentages of
those student whom vehicles are blocked by others vehicles
that were parked wrong. The survey results show that
majority of the students vehicles were the blockage (85%) as
compared to faculty/ staff member (58%). The reason is the
reserve parking for staff/ faculty members at university
campus.
Fig. 12. Percentages of car blockage.
Fig. 13 (a) shows the percentages of staff/ faculty
members whose vehicles were blocked and they have waited
until clearance of blockage and Fig. 13 (b) shows the
percentages of time taken to clear the blockage vehicles by
the students. The survey results show that majority of the
students waited more than 30 min to clear the blockage
(67%) as compared to faculty/ staff member (50%).
Fig. 13. Percentages of time consumed due to car blockages.
Fig. 14 (a) shows the percentages of staff/ faculty
members those who have found difficulties in finding their
vehicles in the matter of forgetting the location where they
parked their vehicles and Fig. 14 (b) shows the percentages
of those students who forget their vehicles in the parking lot.
The survey results show that majority of the students forget
their vehicles most of the time (65%) as compared to
faculty/ staff member (35%). The reason is the reserve
parking for staff/ faculty members at university campus.
Fig. 14. Percentages of participants forgetting the location of their parked
cars.
V. CONCLUSION AND FUTURE WORK
Parking problems at university campuses continue to
prevail and have become a major concerning issue. In this
paper we have proposed a smart Vehicle Parking Monitoring
and Management System called CampusSense for Jazan
University whose students, faculty and staff members are
facing parking problems while parking their cars in parking
lots of the University. The key concern of our proposed
system is to automate the existing manual parking
management system with efficient and effective use of the
parking lots. This system contributes to reduce the
frustration and annoyance of the students, faculty and staff
members while car parking in the University parking zones.
We have also conducted a survey by distributing the
questionnaire to the students, faculty and staff members. The
results of the survey confirm the car parking problems faced
by the participants. Our future research includes the real-
3%9%
88%
0%
With Friend By Taxi
By Own car Others
17% 2%
81%
0%
With Friend By Taxi
By Own car Others
29%
71%
Yes No
65%
35%
Yes No
11%
89%
Yes No
3%
97%
Yes No
58%
42%
Yes No
85%15%
Yes No
17%
33%50%
Less 10 min
B/w 10 to 20 min
More then 30 min
2%31%
67%
Less 10 min
B/w 10 to 20 min
More then 30 min
35%
65%
Yes No
65%
35%
Yes No
ICACT Transactions on Advanced Communications Technology (TACT) Vol. 5, Issue 2, March 2016 814
Copyright ⓒ 2016 GiRI (Global IT Research Institute)
time implementation of our proposed system with additional
features like searching for vacant parking spaces in an
effective manner and also automating the mobile application
by adding some OCR techniques to take vehicle number
plates form camera images instead of entering it manually.
REFERENCES
[1] Khan WZ, Xiang Y, Aalsalem MY, Arshad Q (2013). Mobile phone
sensing systems: A survey. Communications Surveys & Tutorials,
IEEE, 15(1), 402–427.
[2] Lane, N.D., Miluzzo, E., Lu, H., Peebles, D., Choudhury, T. and
Campbell, A.T., 2010. A survey of mobile phone sensing.
Communications Magazine, IEEE, 48(9), pp.140-150.
[3] R. K. Rana, C. T. Chou, S. S. Kanhere, N. Bulusu, and W. Hu, “Ear-
phone: an end-to-end participatory urban noise mapping system, ” in
Proceedings of the 9th ACM/IEEE International Conference on
Information Processing in Sensor Networks, ser. IPSN ’10. New
York, NY, USA: ACM, 2010, pp. 105–116.
[4] P. Mohan, V. N. Padmanabhan, and R. Ramjee, “Nericell: rich
monitoring of road and traffic conditions using mobile
smartphones,” in Proceedings of the 6th ACM conference on
Embedded network sensor systems, ser. SenSys ’08. New York, NY,
USA: ACM, 2008, pp. 323–336.
[5] A. Thiagarajan, L. Ravindranath, K. LaCurts, S. Madden, H.
Balakrishnan, S. Toledo, and J. Eriksson, “Vtrack: accurate,
energyaware road traffic delay estimation using mobile phones,” in
Proceedings of the 7th ACM Conference on Embedded Networked
Sensor Systems, ser. SenSys ’09. New York, NY, USA: ACM, 2009,
pp. 85–98.
[6] P. Mohan, V. N. Padmanabhan, and R. Ramjee, “Trafficsense: Rich
monitoring of road and traffic conditions using mobile
smartphones,” Tech. Rep. no. MSR-TR-2008-59, April 2008.
[7] R. Herring, A. Hofleitner, D. Work, O.-P. Tossavainen, and A. M.
Bayen, “Mobile millennium - participatory traffic estimation using
mobile phones,” in CPS Forum, Cyber-Physical Systems Week
2009, San Francisco, CA, April 2009.
[8] D. G. Georgios Adam and I. Oikonomidis, “Tarifa: Traffic and
abnormalities road instructor for anyone,” in 2nd Student Workshop
on Wireless Sensor Networks, Athens, Greece, October 2009.
[9] T. Das, P. Mohan, V. N. Padmanabhan, R. Ramjee, and A. Sharma,
“Prism: platform for remote sensing using smartphones,” in
Proceedingsof the 8th international conference on Mobile systems,
applications, and services, ser. MobiSys ’10. New York, NY, USA:
ACM, 2010, pp. 63–76.
[10] Aalsalem, M.Y., Khan, W.Z. and Dhabbah, K.M., 2015, July. An
automated vehicle parking monitoring and management system
using ANPR cameras. In Advanced Communication Technology
(ICACT), 2015 17th International Conference on (pp. 706-710).
IEEE.
[11] Jung-Ho Moon, Tae Kwon Ha, “A Car Parking Monitoring System
Using Wireless Sensor Networks”, International Journal of
Electrical, Robotics, Electronics and Communications Engineering
Vol. 7, No. 10, 2013.
[12] Hongwei Wang and Wenbo He, “A Reservation-based Smart
Parking System”, The First International Workshop on Cyber-
Physical Networking system, IEEE, pp 701-706, 2011.
[13] Yang, Jihoon, Jorge Portilla, and Teresa Riesgo. "Smart parking
service based on wireless sensor networks." IECON 2012-38th
Annual Conference on IEEE Industrial Electronics Society. IEEE,
2012.
[14] Pala, Zeydin, and Nihat Inanc. "Smart parking applications using
RFID technology." RFID Eurasia, 2007 1st Annual. IEEE, 2007.
[15] Rahman, Mohammad Shaifur, Youngil Park, and Ki-Doo Kim.
"Relative location estimation of vehicles in parking management
system." Advanced Communication Technology, 2009. ICACT 2009.
11th International Conference on. Vol. 1. IEEE, 2009.
[16] Anthonyson, Robert B. "Automated vehicle parking system." U.S.
Patent No. 5,414,624. 9 May 1995.
[17] SHANG, Huayan, Wenji LIN, and Haijun HUANG. "Empirical
study of parking problem on university campus." Journal of
Transportation Systems Engineering and Information Technology
7.2 (2007): 135-140.
[18] C. Karlof, D. Wagner, “Secure Routing in Wireless Sensor
Networks: Attacks and Countermeasures”, In: Proc. of first
IEEE international workshop on sensor network protocols and
applications, May 2003.
[19] A. Wood, J. A. Stankovic, “Denial of Service in Sensor Networks,”
IEEE Computer, 3 (10):54-62, October 2002.
[20] Wazir Zada Khan,Yang Xiang,Mohammed Y Aalsalem, Quratulain
Arshad,"Comprehensive Study of Selective Forwarding Attack in
Wireless Sensor Networks", IJCNIS, vol.3, no.1, pp.1-10, 2011.
[21] C. Hartung, J. Balasalle, and R. Han, ”Node Compromise in Sensor
Networks: The Need for Secure Systems”, Technical Report
Technical Report CU-CS-988-04, Department of Computer Science,
University of Colorado at Boulder, 2004.
[22] W. Z. Khan, M. Y. Aalsalem, N. M. Saad, and Y. Xiang,
“Detection and Mitigation of Node Replication Attacks in Wireless
Sensor Networks: A Survey,” International Journal of
Distributed Sensor Networks, vol. 2013, Article ID 149023, 22
pages, 2013. doi:10.1155/2013/149023.
[23] W. T. Zhu, J. Zhou, R. H. Deng, and F. Bao,
“Detecting Node Replication Attacks in Wireless Sensor
Networks: A Survey,” Journal of Network and Computer
Applications, vol. 35, no. 3, pp.1022–1034, 2012.
[24] Wazir Zada Khan, N.M. Saad, Mohammed Y. Aalsalem,
"Scrutinizing Well-known Countermeasures against Clone Node
Attack in Mobile Wireless Sensor Networks", International Journal
of Grid and Utility Computing (IJGUC), 4 (2), 119-127, 2012,
(ACM, Scopus).
[25] John R. Douceur, "The sybil attack." In Peer-to-peer Systems,
pp. 251-260. Springer Berlin Heidelberg, 2002.
[26] James Newsome, Elaine Shi, Dawn Song, and Adrian Perrig. The
sybil attack in sensor networks: analysis & defenses. In IPSN '04:
Proceedings of the third international symposium on Information
processing in sensor networks, pages 259-268, New York, NY,
USA, 2004. ACM.
[27] Chris Karlof and David Wagner. Secure routing in wireless sensor
networks: Attacks and countermeasures. Elsevier's AdHoc Networks
Journal, Special Issue on Sensor Network Applications and
Protocols, 1(23):293-315, September 2003.
[28] Wassim Znaidi, Marine Minier, and Jean-Philippe BABAU.
Detecting wormhole attacks in wireless networks using local
neighborhood information. In IEEE International Symposium on
Personal, Indoor and Mobile Radio Communications, Cannes,
French Riviera, France, September 2008
[29] A.D. Wood, J.A. Stankovic, and S.H. Son. Jam: a jammed-area
mapping service for sensor networks. Real-Time Systems
Symposium, 2003. RTSS 2003. 24th IEEE, pages 286297, 3-5 Dec.
2003.
[30] Wenyuan Xu, Ke Ma, W. Trappe, and Yanyong Zhang. Jamming
sensor networks: attack and defense strategies. Network, IEEE,
20(3):4147, May-June 2006.
[31] Van Deursen, Ton, and Sasa Radomirovic. "Attacks on RFID
Protocols." IACR Cryptology ePrint Archive 2008 (2008): 310.
[32] Van Deursen, Ton, and Saša Radomirović. "Algebraic attacks on
RFID protocols." In Information Security Theory and Practice.
Smart Devices, Pervasive Systems, and Ubiquitous Networks, pp. 38-
51. Springer Berlin Heidelberg, 2009.
Dr. Mohammed Y Aalsalem is currently Dean
Faculty of Computer Science and Information
System, Jazan University, Kingdom of Saudi
Arabia. He received his PhD in Computer
Science from Sydney University. His research
interests include real time communication,
network security, distributed systems, and
wireless systems. In particular, he is currently
leading in a research group developing flood
warning system using real time sensors. He is
Program Committee of the International Conference on Computer
Applications in Industry and Engineering, CAINE2011. He is regular
reviewer for many international journals such as King Saud University
Journal (CCIS-KSU Journal).
Dr. Wazir Zada Khan is currently with
Faculty of Computer Science and Information
System, Jazan University, Kingdom of Saudi
Arabia. He received his PhD from Electrical
and Electronic Engineering Department,
Universiti Teknologi Petronas (UTP),
Malaysia and his MS in Computer Science
from Comsats Institute of Information
Technology, Pakistan. His research interests
include network and system security, sensor
networks, wireless and ad hoc networks. His subjects of interest include
Sensor Networks, Wireless Networks, Network Security and Digital
Image Processing, Computer Vision.
ICACT Transactions on Advanced Communications Technology (TACT) Vol. 5, Issue 2, March 2016 815
Copyright ⓒ 2016 GiRI (Global IT Research Institute)
Abstract—With supercomputer system scaling up, the
performance gap between compute and storage system increases dramatically. The traditional speedup only measures the performance of compute system. In this paper, we firstly propose the speedup metric taking into account the I/O constraint. The new metric unifies the computing and I/O performance, and evaluates practical speedup of parallel application under the limitation of I/O system. Furthermore, this paper classifies and analyzes existing parallel systems according to the proposed speedup metric, and makes suggestions on system design and application optimization. Based on the storage speedup, we also generalize these results into a general storage speedup by considering not only speedup but also costup. Finally, we provide the analysis of these new speedup metrics by case studies. The storage speedup reflects the degree of parallel application scalability affected by performance of storage system. The results indicate that the proposed speedups for parallel applications are effective metrics. Keyword—storage speedup, general storage speedup,
scalability, system classification
I. INTRODUCTION
ith the scaling up of supercomputers, the system performance advances considerably. In the latest
TOP500 supercomputing list in 2015, Tianhe-2 consisting of 3,120,000 cores reaches the performance of 33.86 petaflop/s [1]. Planed exascale supercomputers (1018 floating point
———————————————————————
Manuscript received February 21, 2016. This work is a follow-up of the invited journal to the accepted conference paper of the 18th International Conference on Advanced Communication Technology.
G. Cai is with the College of Computer, National University of Defense Technology, Changsha, 410073, China (e-mail: [email protected]).
W. Hu is with the College of Computer, National University of Defense Technology, Changsha, 410073, China (corresponding author, phone: +86-22-65375500; fax: +86-22-65375501; e-mail: [email protected]).
G. Liu is with the College of Computer, National University of Defense Technology, Changsha, 410073, China (e-mail: [email protected]).
Q. Li is with the College of Computer, National University of Defense Technology, Changsha, 410073, China (e-mail: [email protected]. cn).
X. Wang is with the College of Computer, National University of Defense Technology, Changsha, 410073, China (e-mail: xf_wang@nudt. edu.cn).
W. Dong is with the College of Computer, National University of Defense Technology, Changsha, 410073, China (e-mail: [email protected]).
operations per second or 103 petaflop/s) are promising to come in this decade [2].
Since the 1980s, the average growth of processor performance could reach 60%, while the read and write bandwidth of disk which is the main storage device only increased by 10% to 20% per year. In addition, the computing system scales much faster than I/O system. Both of above reasons exacerbated the mismatch between application requirements and I/O performance. For I/O-intensive applications, the performance is not only determined by compute system, but also greatly affected by I/O system.
Due to the increasing scale of the supercomputer system and parallel application, the I/O performance and storage capacity requirements of the supercomputer increase rapidly. The concerns about the storage scalability are not only the performance can be obtained but also the cost-effectiveness related to investment. The larger the system is, the more investments improving system performance needs. How to evaluate and promote the effectiveness of the investments of the storage system is another important problem need to be addressed.
In this research, we analyze and quantify the effects of storage bottleneck of supercomputers. Our theory provides the new metric on how to quantify the impact of I/O system on application performance, and we also present the new method to evaluate the cost-effectiveness of the storage system of supercomputer. The main contributions of our work lie in the following aspects. This paper introduces a new speedup metric called
storage speedup taking into account the I/O performance constraint. The new metric unifies the computing and I/O performance, and evaluates practical speedup of parallel application under the limitation of I/O system. The existing parallel systems are classified and analyzed
according to the storage speedup, and the suggestions are acquired on system design and application optimization. Based on the storage speedup, a general storage speedup
is generalized to evaluate the cost-effectiveness of the storage system by considering not only speedup but also costup. Through the case studies, the effectiveness of these new
An Effective Speedup Metric Considering I/O Constraint in Large-scale Parallel Computer
Systems
Guilin Cai*, Wei Hu*, Guangming Liu*,**, Qiong Li*, Xiaofeng Wang*, Wenrui Dong*
*College of Computer, National University of Defense Technology, Changsha, China
**National Supercomputer Center in Tianjin, Tianjin, China [email protected], { huwei, liugm}@nscc-tj.gov.cn, [email protected], [email protected],
W
ICACT Transactions on Advanced Communications Technology (TACT) Vol. 5, Issue 2, March 2016 816
Copyright ⓒ 2016 GiRI (Global IT Research Institute)

speedup metrics is validated. The rest of paper is organized as follows. Section 2
reviews the related work. Section 3 defines the storage speedup, classifies the existing systems according to it and presents the general storage speedup. Section 4 uses some case studies to analyze the I/O architecture in supercomputing system to validate the effectiveness of the new metrics. Finally, in section 5 we conclude this paper and discuss some future works.
II. RELATED WORK
The essentiality of supercomputer is to reduce the execution time of applications by parallel computing, while speedup has been almost exclusively used for measuring scalability in parallel computing [3].
In 1967, Amdahl advocated a speedup model for a fixed-size problem [4]:
( )1
1AmdahlSf f P
=+ −
where P is the number of processors and f represents the serial ratio of the program. Obviously, the equation reveals a pessimistic view on the usefulness of large scale parallel computers since the maximum speedup cannot exceed 1/f.
In 1988, Gustafson introduced a scaled speedup for a fix-time problem [5], which scales up the workload with the increasing number of processors to preserve the execution time:
( )1GustafsonS f f P= + −
This speedup proves the scalability of the parallel computers and overcomes the shortcomings of Amdahl’s speedup model.
Sun and Ni [6] presented a memory-bounded speedup model which scales up the workload according to the memory capacity of the system, demonstrates the relationship among memory capacity, parallel workload and speedup.
Culler [3] proposed a speedup model taking the communication and synchronization overhead into account. Researchers can improve the system performance depending on this model by reducing the overhead of communication and synchronization such as overlapping communication and computing, load balancing and so on.
Yang [7], [8] studied the reliability and power issues of supercomputers, introduced the reliability and power related speedup. They provided a new perspective to solve reliability and power related issues.
In this work, we develop our storage speedup metric to analyze and quantify the effects of I/O performance for parallel applications in supercomputing.
III. STORAGE SPEEDUP
Suppose a parallel system consisting of P nodes of single core processor, denoted by N1... NP. Let a parallel program Q be executed on the system with one process per node, resulting in a total of P processes. If a processor has more than one core or one node has more than one processor, P denotes the number of cores in the system with cores being treated as nodes. Hereby, there will be one process running on each core. In the following paper, it is assumed that there will be one process running on one node to simply the model.
A. Definition for Storage Speedup
As shown in Figure 1, for a given program Q which has I/O workloads can be divided into two kinds of phases: I/O phases and compute phases. The compute phases are denoted as shaded parts compared with the I/O phases denoted as the white parts. The single process execution case is shown in Figure 1(a), where 0 represents the process and T1 denotes the execution time. The execution case of parallel system is shown in Figure 1(b), where P represents the number of processes and TP
S denotes the practical execution time of parallel program. The I/O workloads mainly consist of reading the raw data, storing intermediate data, writing the final results and so on. Every I/O phases we denoted as an I/O operation point.
For the serial program Q running on one compute node in Figure 1(a), let NS be the amount of I/O operation points. Isint is the average time interval among I/O operation points, and on each I/O operation point the average I/O service time is Isser, then all the execution time of I/O-free phases is Tsnon, so the time of the program Q runs on a node serially is:
( )S snon s sser snon snon sint sserStoT T N I T T I I= + = + (1)
For the parallel program Q running on P compute nodes in Figure 1(b), in regard to the i-th (0≤ i<P) process in the P processes, we denote that Ni
P is the amount of I/O operation points, Ii
pint is the average time interval among I/O operation points, Ii
pser is the average I/O service time on each I/O operation point, and Ti
pnon is the execution time of I/O-free phases, so the average values of the parameters related to all processes can be given as follows.
The average value of I/O operation points: 1
0
1 Pp p
ii
N NP
−
==
The average value of average time intervals among I/O
operation points: 1
0
1 Ppint pint
ii
I IP
−
==
The average value of average I/O service time on every I/O operation point:
1
0
1 Ppser pser
ii
I IP
−
==
The average value of average I/O-free execution time: 1
0
1 Ppnon pnon
ii
T TP
−
==
Then the real execution time of program Q on P processors is approximated as follows:
( )P pnon p pser pnon pnon pint pserStoT T N I T T I I≈ + = + (2)
So we give the definition of storage speedup model. Definition 1 (Storage Speedup). When program Q runs
on a parallel system, the storage speedup achieved is defined
Tim
e
SPT
1T
Tim
e
Fig. 1. Execution state of a program on a P node system. (a)Single process.(b)P processes in parallel.
ICACT Transactions on Advanced Communications Technology (TACT) Vol. 5, Issue 2, March 2016 817
Copyright ⓒ 2016 GiRI (Global IT Research Institute)

as follows: S
P StoSto P
Sto
TS
T= (3)
According to (1) & (2), suppose that SP is the speedup of the I/O-free part in the program Q, while pser pintN I I= and sser sintM I I= , the storage speedup can be converted
below:
( )( )
( )( )1 1 1
=11 1
1
snon snon sint sserSP StoSto P pnon pnon pint pser
Sto
snon sser sint
P Ppnon pser pint
T T I ITS
T T T I I
T I I MS S
N MNT I IM
+= ≈
+
+ += = −++ ++
(4)
Let us define
( )1
N MO P
M
−=+
(5)
which reflects the variation of I/O execution with the parallel application scaling and is called the storage workload factor.
As a result, our storage speedup formula is refined to 1
1 ( )PSto PS S
O P=
+ (6)
which indicates the speedup affected by I/O performance variation with the processors scales.
In formula (6), if SP is instantiated by Amdahl’s speedup and Gustafson’s speedup, we obtain different storage speedup formula as follows.
Amdahl Storage Speedup 1 1
1 ( ) 1 ( 1) 1 ( )PAmdahl Sto Amdahl
PS S
O P f P O P− = =+ + − +
(7)
Gustafson Storage Speedup
( )( )1 11
1 ( ) 1 ( )PGustafson Sto GustafsonS S f P f
O P O P− = = + −+ +
(8)
Due to the competition of I/O resources, I/O service time is prolonged in parallel computing, resulting in O(P) ≠ 0. Ideally, if O(P)=0, our two storage speedup models are simplified into the traditional Amdahl’s and Gustafson’s speedup formulas.
PSto PS S= (9)
B. System Classification
First we make some symbols conventions. We denote ( ) ( )f x g x if ( ) ( )limx f x g x→∞ is ∞ and ( ) ( )f x g x if
( ) ( )limx f x g x→∞ is a positive constant or ∞ . Adversely,
( ) ( )f x g x indicates ( ) ( )lim x f x g x→∞ is 0 and ( ) ( )f x g x
indicates ( ) ( )lim x f x g x→∞is a non-negative constant. Suppose
Θ(x) is a set consisting of all functions of x, f(x)∈ Θ(x) and g(x) ∈ Θ(x). If ( ) ( )limx f x g x→∞ is a positive constant, it
denotes ( ) ( )( )=f x g xΘ or ( ) ( )( )=g x f xΘ .
From the definition of storage speedup formula (6), it is easy to observe that O(P) is the key factor in storage speedup variations. According to the characteristic of O(P) related to different parallel systems, considering these systems to be classified as follows.
Definition 2 (Constant and Incremental Systems). Suppose that a program Q satisfying limP PS→∞ = ∞ runs on a
W system. If ( ) (1)O P Θ , the W system is considered to be a constant system. And if ( ) (1)O P Θ , the W system is considered to be an incremental system.
As shown in Figure 2, there are three examples about the classification based on O(P). If ( ) (1)O P K= Θ , where K is a positive constant, the W system is a constant system. We find the storage speedup increases linearly with the number of nodes which indicates that the scalability of the application is not bound by the I/O performance obviously.
If ( ) lg (1)O P KP P= Θ , the W system is an incremental
system. This is different from above; the scalability of the application is bound by the I/O performance.
C. General Storage Speedup
In this subsection we generalize the storage speedup by considering not only the time cost introduced in the last subsection but also costup related to investment. Due to a powerful support provided by supercomputer, scientific exploration develops rapidly. Since more and more data need to be analyzed or calculated, I/O-intensive applications are becoming an important part of the scientific applications on the supercomputer. In order to meet the requirements of I/O-intensive applications, storage system of supercomputer need more large capacity and high performance equipment, and also more flexible and efficient software stack. All of these lead to more cost. The expansion of supercomputer system not only meets the requirements of applications, but also considers the cost-effectiveness of all the investment of manpower and money. So we want to find a metric to measure the cost-effectiveness of investment for supercomputer under the storage constraint.
We generalize a new speedup called general storage speedup to try to solve the problem. This generalization is increasingly important for modern petascale especially future exascale supercomputing systems as the storage systems employed can be more costly.
Based on the costup presented by D. A. Wood and Mark Hill [9], we introduced costups to analyze the storage scalability which is more cost-effective related to various I/O architecture.
Definition 3 (Storage Costup). When program Q runs on a parallel system from one processor to P processors, the storage costup is defined as follows:
1
cosSP
S S
costtup
cost= (10)
The cost could include not only the compute system cost but also the storage system cost. And the cost also include the
0 1000 2000 3000 4000 5000 6000 7000 8000 9000 100000
1000
2000
3000
4000
5000
6000
7000
8000
9000
10000
O(P)=KlgP
O(P)=KPlgP
P
sPSto
SP
O(P)=K
Fig. 2. Three examples about storage speedup of different kinds of systems based on O(P).
ICACT Transactions on Advanced Communications Technology (TACT) Vol. 5, Issue 2, March 2016 818
Copyright ⓒ 2016 GiRI (Global IT Research Institute)
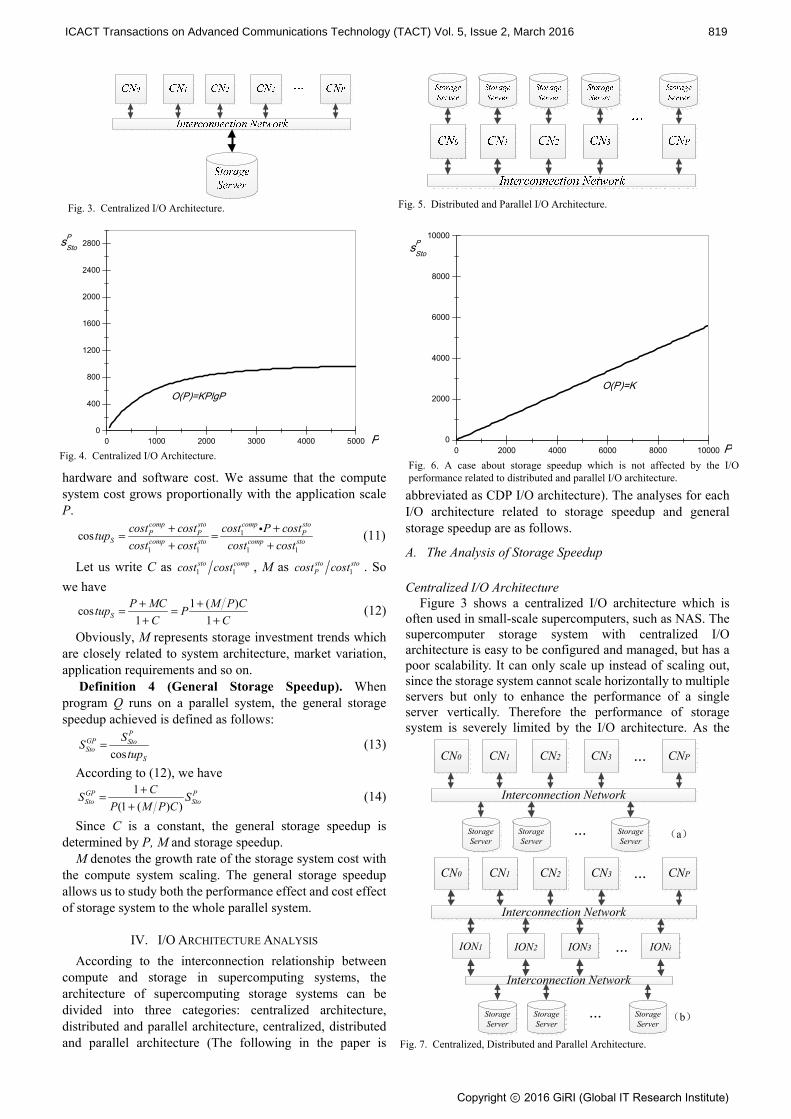
hardware and software cost. We assume that the compute system cost grows proportionally with the application scale P.
1
1 1 1 1
coscomp sto comp stoP P P
S comp sto comp sto
cost cost cost P costtup
cost cost cost cost
+ += =+ +
(11)
Let us write C as 1 1sto compcost cost , M as 1
sto stoPcost cost . So
we have 1 ( )
cos1 1S
P MC M P Ctup P
C C
+ += =+ +
(12)
Obviously, M represents storage investment trends which are closely related to system architecture, market variation, application requirements and so on.
Definition 4 (General Storage Speedup). When program Q runs on a parallel system, the general storage speedup achieved is defined as follows:
cos
PGP StoSto
S
SS
tup= (13)
According to (12), we have 1
(1 ( ) )GP PSto Sto
CS S
P M P C
+=+
(14)
Since C is a constant, the general storage speedup is determined by P, M and storage speedup.
M denotes the growth rate of the storage system cost with the compute system scaling. The general storage speedup allows us to study both the performance effect and cost effect of storage system to the whole parallel system.
IV. I/O ARCHITECTURE ANALYSIS
According to the interconnection relationship between compute and storage in supercomputing systems, the architecture of supercomputing storage systems can be divided into three categories: centralized architecture, distributed and parallel architecture, centralized, distributed and parallel architecture (The following in the paper is
abbreviated as CDP I/O architecture). The analyses for each I/O architecture related to storage speedup and general storage speedup are as follows.
A. The Analysis of Storage Speedup
Centralized I/O Architecture
Figure 3 shows a centralized I/O architecture which is often used in small-scale supercomputers, such as NAS. The supercomputer storage system with centralized I/O architecture is easy to be configured and managed, but has a poor scalability. It can only scale up instead of scaling out, since the storage system cannot scale horizontally to multiple servers but only to enhance the performance of a single server vertically. Therefore the performance of storage system is severely limited by the I/O architecture. As the
Fig. 3. Centralized I/O Architecture.
0 1000 2000 3000 4000 50000
400
800
1200
1600
2000
2400
2800
O(P)=KPlgP
P
sPSto
Fig. 4. Centralized I/O Architecture.
Fig. 5. Distributed and Parallel I/O Architecture.
0 2000 4000 6000 8000 100000
2000
4000
6000
8000
10000
O(P)=K
P
sPSto
Fig. 6. A case about storage speedup which is not affected by the I/O performance related to distributed and parallel I/O architecture.
CN0
Interconnection Network
CN1 CN2 CN3 CNP
Storage Server
Storage Server
Storage Server
(a)
...
...
CN0
Interconnection Network
CN1 CN2 CN3 CNP
...
Storage Server
Storage Server
Storage Server
(b)
ION1 ION2 ION3 IONi
Interconnection Network
...
...
Fig. 7. Centralized, Distributed and Parallel Architecture.
ICACT Transactions on Advanced Communications Technology (TACT) Vol. 5, Issue 2, March 2016 819
Copyright ⓒ 2016 GiRI (Global IT Research Institute)

storage system with centralized I/O architecture cannot scale out to more storage nodes, we obtain ( ) ( )O P PΘ . According
to definition 2, the supercomputer with centralized I/O architecture is an incremental system whose parallel computing scalability is constrained by the performance of I/O system. Figure 4 shows us a case about supercomputer with centralized I/O architecture whose storage speedup is bounded by the I/O performance. Distributed and Parallel I/O Architecture
Figure 5 shows a distributed and parallel I/O architecture. A supercomputer storage system with distributed and parallel I/O architecture usually refers to the architecture in which each compute node with built-in storage or directed attached storage server. Each compute node has file system which can provide I/O service to itself and other compute nodes. Due to this special nature, the implementations of the parallel file system are complicated due to I/O scheduling and data global consistency. And the storage servers have different positions to the compute nodes themselves and other compute nodes; therefore the system load balance also becomes a problem. So, distributed and parallel I/O architecture is usually adopted by supercomputers with small or medium scale.
For distributed and parallel I/O architecture, the storage nodes and compute nodes scaling equally. So we obtain ( ) ( )1O P = Θ . The supercomputer with distributed and
parallel I/O architecture is a constant system and the parallel
computing scalability is not constrained by the performance of I/O system, as the Figure 6 shows. With the node number increasing, the performance of storage system expands proportionally. Centralized, Distributed and Parallel Architecture
Figure 7 shows a CDP I/O architecture which is dominant in the supercomputers of TOP500 [1]. For the Medium-sized supercomputers (the amount of compute nodes reaches 103), compute nodes and storage servers are connected directly through interconnection network as shown in the Figure 7(a). Parallel storage system consists of storage servers which are usually installed with parallel file system, such as Lustre, PVFS and so on, while compute nodes access the storage system by the client of parallel file system. Typical systems are Titan, Tianhe-1A and so on. With the supercomputer’s development, I/O nodes (ION) are inserted between compute nodes and parallel storage systems to provide the function of I/O forwarding and management, as the Figure 7(b) shows. On the one hand, the amount of compute nodes can increase continually without the limitation of the client amount of parallel file systems. On the other hand, I/O performance can be improved by I/O scheduling and caching. All of these are attributed to the introduction of I/O nodes in the systems. The typical systems are IBM Bluegene series and Tianhe-2. Although the system has been improved by the I/O nodes, the essence of I/O architecture doesn’t change. Thus, to simplify the model, I/O node layer is omitted in the subsequent analysis.
In the CDP I/O architecture, the storage system can not only scale up, but also scale out. But they still have limitations, first, for a specific supercomputer the scale of storage system is fixed within a certain time period; second, parallel file system usually has up limits on the number of storage nodes, the aggregate performance and the storage capacity. So we can also obtain ( ) ( )O P PΘ . According to
definition 2, the supercomputer with CDP I/O architecture is an incremental system whose parallel computing scalability is constrained by the performance of I/O system as shown by Figure 8.
The performance of storage system with CDP I/O architecture is much higher than the system with centralized I/O architecture, so the speedup affected by the I/O
0 1000 2000 3000 4000 50000
400
800
1200
1600
2000
2400
2800
O(P)=KPlgP
P
sPSto
Fig. 8. A case about storage speedup which is constrained by the I/O perfermance related to centralized, distributed and parallel architecture.
0 1000 2000 3000 4000 50000
1000
2000
3000
4000
5000
M=aX/(bXlgX+c)
M=X f
M=dX
M
P
I/O Architecture centralized distributed and parallel CDP
Fig. 9. Examples of changing law of parameter M under different I/O architectures when the storage system scaling with compute system. a, b, c, d and f are different constants.
0 1000 2000 3000 4000 50000.0
0.5
1.0
1.5
2.0
2.5
3.0
3.5
4.0I/O Architecture
centralized distributed and parallel CDP
Gen
eral
Sto
rage
Spe
edup
PFig. 10. Examples of changing law of general storage speedup under different I/O architectures when the storage system scaling with compute system.
ICACT Transactions on Advanced Communications Technology (TACT) Vol. 5, Issue 2, March 2016 820
Copyright ⓒ 2016 GiRI (Global IT Research Institute)

performance is not obvious until the parallel application increases to a huge scale.
B. The Analysis of General Storage Speedup
Storage speedup is used to evaluate practical speedup of parallel application under the constraint of I/O system, while general storage speedup can be used to show how cost-effective when the storage system of supercomputer scaling. Since the market variation and the private cost details of system construction, there is no specific system to be described. Instead in this subsection we illustrate some examples of general storage speedup related to typical I/O architectures.
Figure 9 shows the examples of M function which is a key factor to reveal the variation ratio of storage cost with the scale of parallel application increasing. Due to a wide range of storage devices and complex price variability, these cases are only used to reveal the possible laws of M function under different I/O architectures. Different scaling methods need distinct types and quantities of hardware and software equipment, and this lead to different variation trends of M. M can be measured according to specific system at a specific time.
Figure 10 shows the examples of general storage speedup of different I/O architectures with the scale of parallel application increasing. Since the different extension methods of supercomputer storage system under different I/O architecture, general storage speedup reflects all kinds of cost-effective characteristics of storage systems. According to the definition, the larger value of general storage speedup represents a higher cost-effectiveness.
The examples in the figure 10 shows that the general storage speedup decreases slowly with the compute system and storage system scaling for the centralized I/O architecture and CDP I/O architecture, and the storage system with CDP architecture is more cost-effective than centralized I/O architecture. Since storage system scales with compute system proportionally under distributed and parallel I/O architecture, the general storage speedup is approximately to be a stable value. So, when the storage system expands to a larger scale, the system with distributed and parallel I/O architecture has better and more stable cost-effectiveness.
V. CONCLUSIONS
This paper introduces a new speedup metric called storage speedup taking into account the I/O performance constraint. The new metric unifies the compute and I/O performance, and evaluates practical speedup of parallel application under the limitation of I/O system. The existing parallel systems are classified and analyzed according to the storage speedup, and the suggestions are acquired on system design and application optimization. Based on the storage speedup, a general storage speedup is generalized to evaluate the cost-effectiveness of the storage system by considering not only speedup but also costup. Through the case studies, the effectiveness of the two new speedup metrics is validated.
In the future, our efforts will mainly focus on the following aspects. For the storage speedup, we will refine the theory and explore more factors. At the same time, we will make further research on characteristics of massively parallel
applications and supercomputer storage systems to improve the scalability of system.
REFERENCES [1] Top500 website. [Online]. Available: http://www.top500.org/. [2] Darpa sets ubiquitous hpc program in motion, http://www.hpcwire.
com/2010/08/10/darpa_sets_ubiquitous_hpc_program_in_motion/. [3] D. E. Culler, A. Gupta and J. P. Singh, Parallel Computer
Architecture: A Hardware/Software Approach, Morgan Kaufmann Publishers Inc., San Francisco, CA, USA, 1997.
[4] G. M. Amdahl, “Validity of the single processor approach to achieving large scale computing capabilities,” in Proc. AFIPS '67, 1967, pp.483-485.
[5] J. L. Gustafson, “Reevaluating amdahl’s law”, Communications of the ACM, vol. 31, no. 5, pp. 532–533, 1988.
[6] X. Sun and L. Ni, “Scalable problems and memory-bounded speedup,” Journal of Parallel and Distributed Computing, vol. 19, no. 1, pp. 27–37, 1993.
[7] Z. Wang, “Reliability speedup: an effective metric for parallel application with checkpointing”, in Porc. 2009 International Conference on Parallel and Distributed Computing, Applications and Technologies. 2009, pp. 247–254.
[8] X. Yang, J. Du, and Z. Wang, “An effective speedup metric for measuring productivity in large-scale parallel computer systems”, The Journal of Supercomputing, vol. 56, no. 2, pp. 164–181, 2011.
[9] D. Wood, M. Hill, “Cost-Effective Parallel Computing”. Computer. vol.28, no.2, pp. 69-72, 1995.
Guilin Cai is a doctor student in the College of Computer at National University of Defense Technology in China. She received the B.S. and M.S. degrees in computer science from National University of Defense Technology in 2005 and 2010, respectively. Her main research interests include high performance computing, cyber security and proactive defense. Wei Hu received the B.S. degree from PLA University of Science and Technology, China, in 2004, and the M.S. degree from National University of Defense Technology, China, in 2010. He currently pursues the Ph.D. degree in the College of Computer, National University of Defense Technology, Changsha, China. His research interests include high performance computing and machine learning.
Guangming Liu received the B.S. and M.S. degrees from National University of Defense Technology, China, in 1980 and 1986 respectively. He is now a professor in the College of Computer, National University of Defense Technology. His research interests include high performance computing, massive storage and cloud computing.
Qiong Li received the B.S., M.S. and Ph.D. degrees from National University of Defense Technology, China, in 1993, 1996 and 2010, respectively. She is now a professor in the College of Computer, National University of Defense Technology. Her research interests include high performance computing and massive storage.
Xiaofeng Wang has been working as an assistant professor in the College of Computer at National University of Defense Technology in China. He received the B.S., M.S. and Ph.D. degrees in computer science from National University of Defense Technology in 2004, 2006 and 2009 respectively. His research interests include trustworthy networks and systems, applied cryptography, network security.
ICACT Transactions on Advanced Communications Technology (TACT) Vol. 5, Issue 2, March 2016 821
Copyright ⓒ 2016 GiRI (Global IT Research Institute)
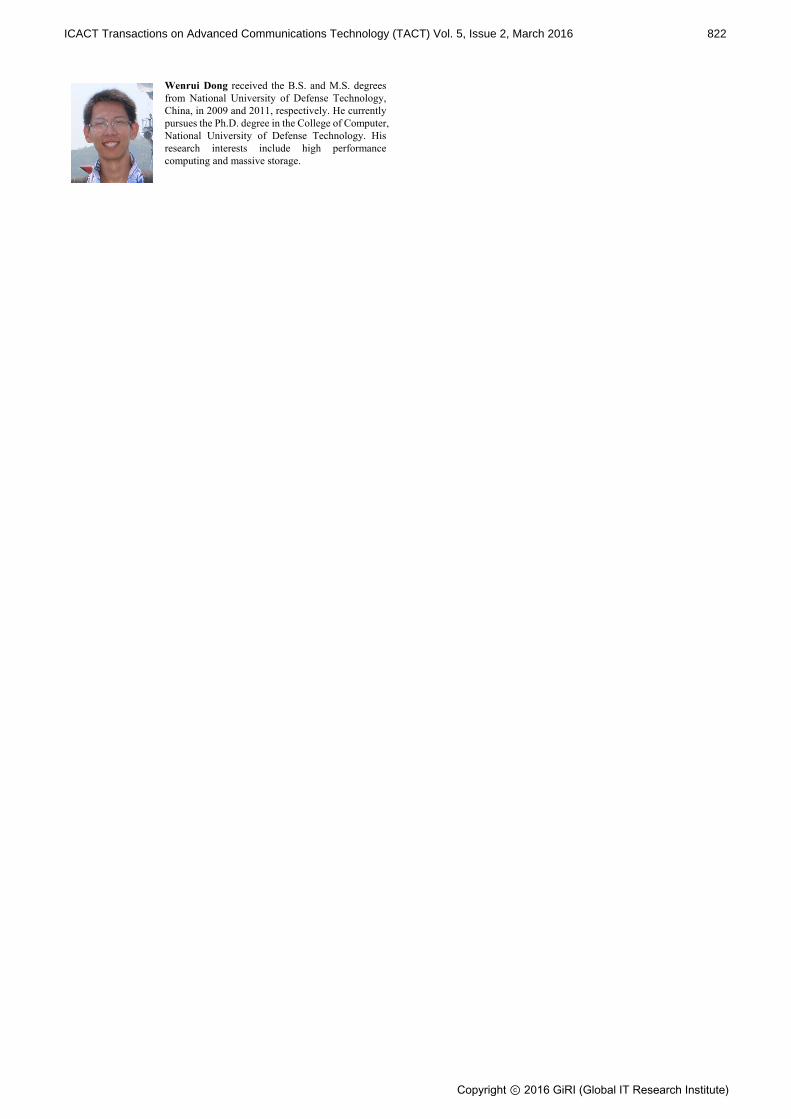
Wenrui Dong received the B.S. and M.S. degrees from National University of Defense Technology, China, in 2009 and 2011, respectively. He currently pursues the Ph.D. degree in the College of Computer, National University of Defense Technology. His research interests include high performance computing and massive storage.
ICACT Transactions on Advanced Communications Technology (TACT) Vol. 5, Issue 2, March 2016 822
Copyright ⓒ 2016 GiRI (Global IT Research Institute)