Embed Size (px)
DESCRIPTION
Using Data Mining and Bootstrapping to Develop Simple Models for Obtaining Confidence Intervals for the Percentage of Alcohol Related Crashes. Joni Nunnery and Helmut Schneider. Why Data Mining?. NHTSA Estimate is for the USA State estimates are not readily available - PowerPoint PPT Presentation
Citation preview
Using Data Mining and Using Data Mining and Bootstrapping to Develop Simple Bootstrapping to Develop Simple Models for Obtaining Confidence Models for Obtaining Confidence Intervals for the Percentage of Intervals for the Percentage of
Alcohol Related CrashesAlcohol Related Crashes
Using Data Mining and Using Data Mining and Bootstrapping to Develop Simple Bootstrapping to Develop Simple Models for Obtaining Confidence Models for Obtaining Confidence Intervals for the Percentage of Intervals for the Percentage of
Alcohol Related CrashesAlcohol Related Crashes
Joni Nunnery and Helmut Schneider Joni Nunnery and Helmut Schneider
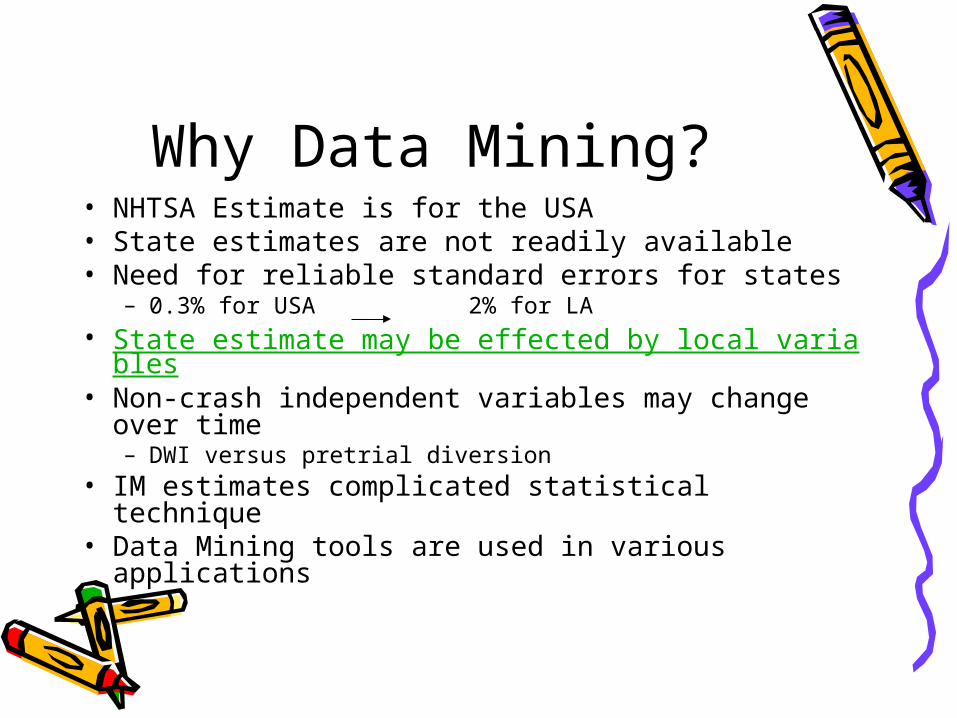
Why Data Mining?• NHTSA Estimate is for the USA• State estimates are not readily available• Need for reliable standard errors for states
– 0.3% for USA 2% for LA• State estimate may be effected by local variab
les• Non-crash independent variables may change
over time – DWI versus pretrial diversion
• IM estimates complicated statistical technique• Data Mining tools are used in various
applications
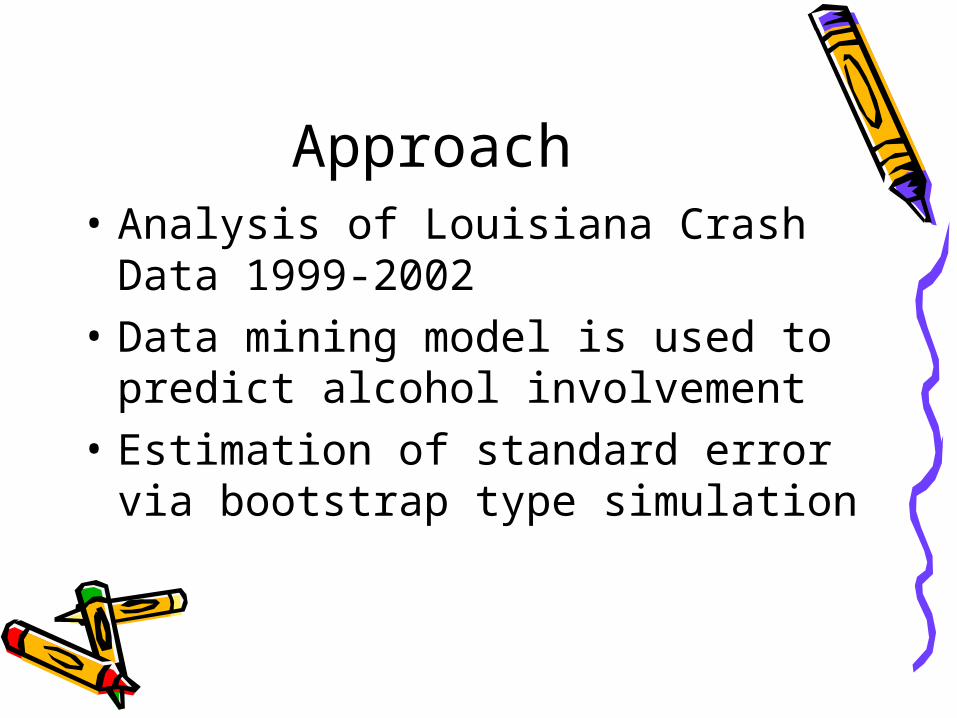
Approach• Analysis of Louisiana Crash Data
1999-2002• Data mining model is used to
predict alcohol involvement• Estimation of standard error via
bootstrap type simulation
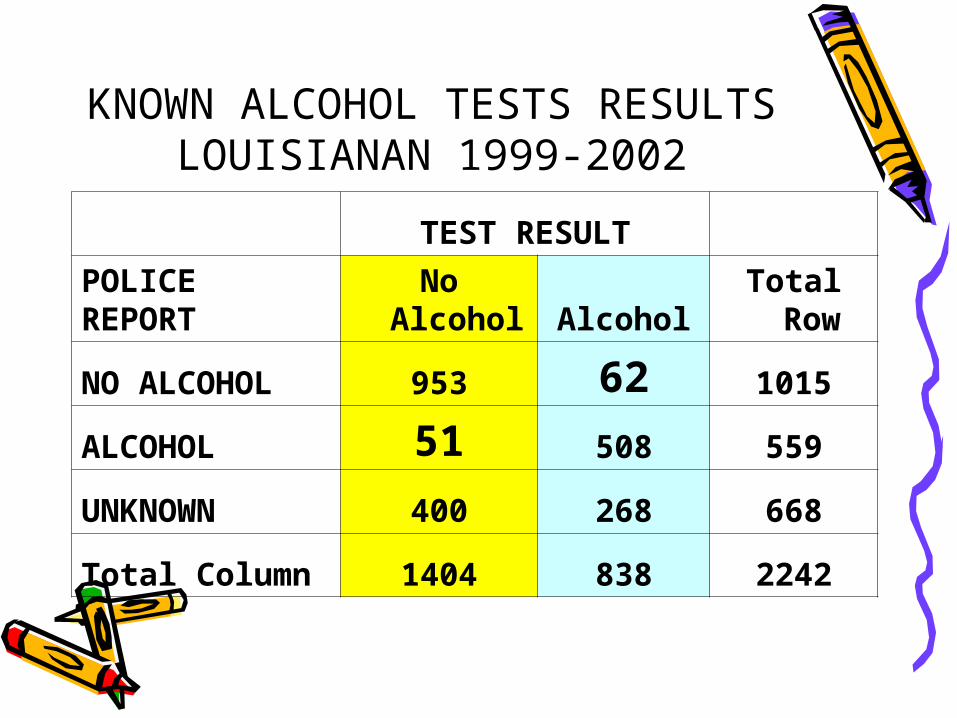
KNOWN ALCOHOL TESTS RESULTS
LOUISIANAN 1999-2002
TEST RESULT
POLICEREPORT
No Alcohol Alcohol
Total Row
NO ALCOHOL 953 62 1015
ALCOHOL 51 508 559
UNKNOWN 400 268 668
Total Column 1404 838 2242
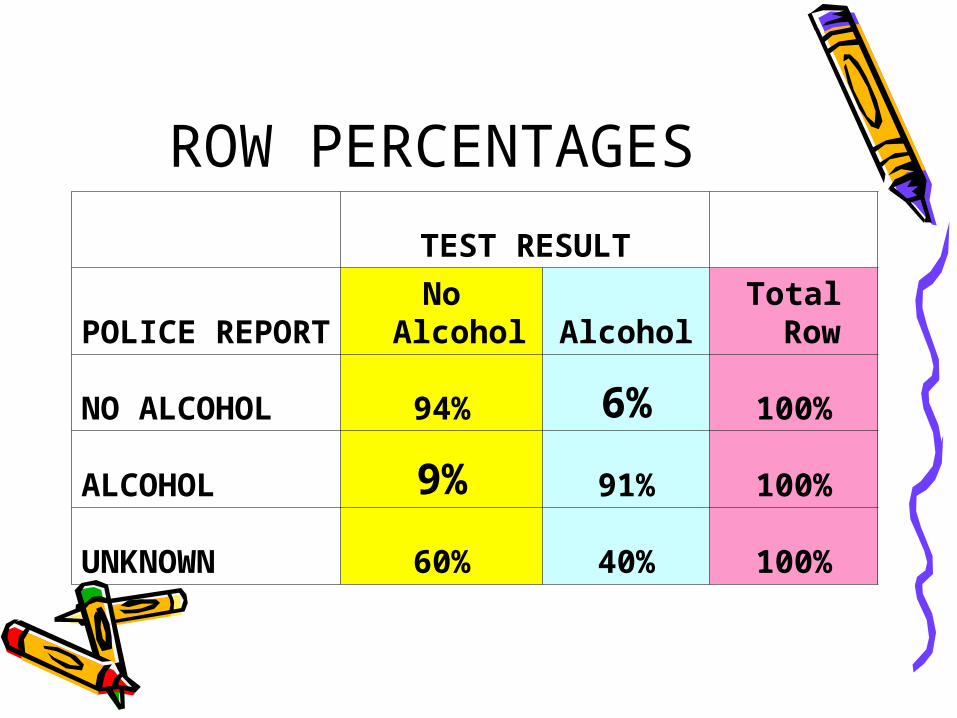
ROW PERCENTAGES
TEST RESULT
POLICE REPORT
No Alcohol Alcohol
Total Row
NO ALCOHOL 94% 6% 100%
ALCOHOL 9% 91% 100%
UNKNOWN 60% 40% 100%
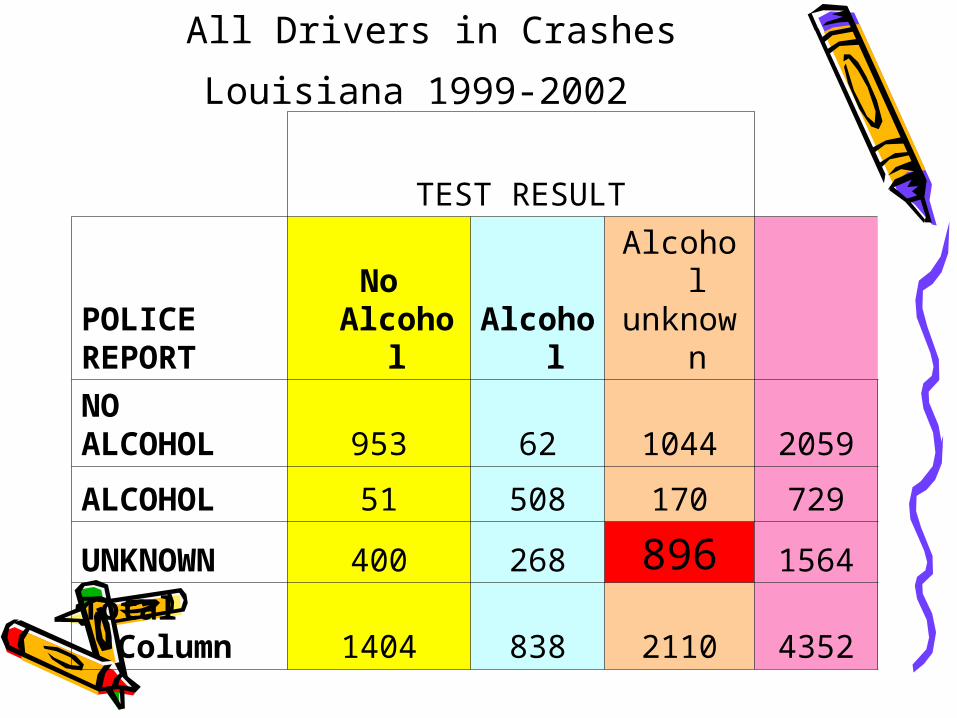
All Drivers in Crashes
Louisiana 1999-2002 TEST RESULT
POLICEREPORT
No Alcoho
lAlcoh
ol
Alcoholunknow
n
NOALCOHOL 953 62 1044 2059
ALCOHOL 51 508 170 729
UNKNOWN 400 268 896 1564
Total Column 1404 838 2110 4352

Using Insightful Miner Data Mining Software
Classification Models• Logistic Regression• Naive Bayes• Neural Network• Classification Tree

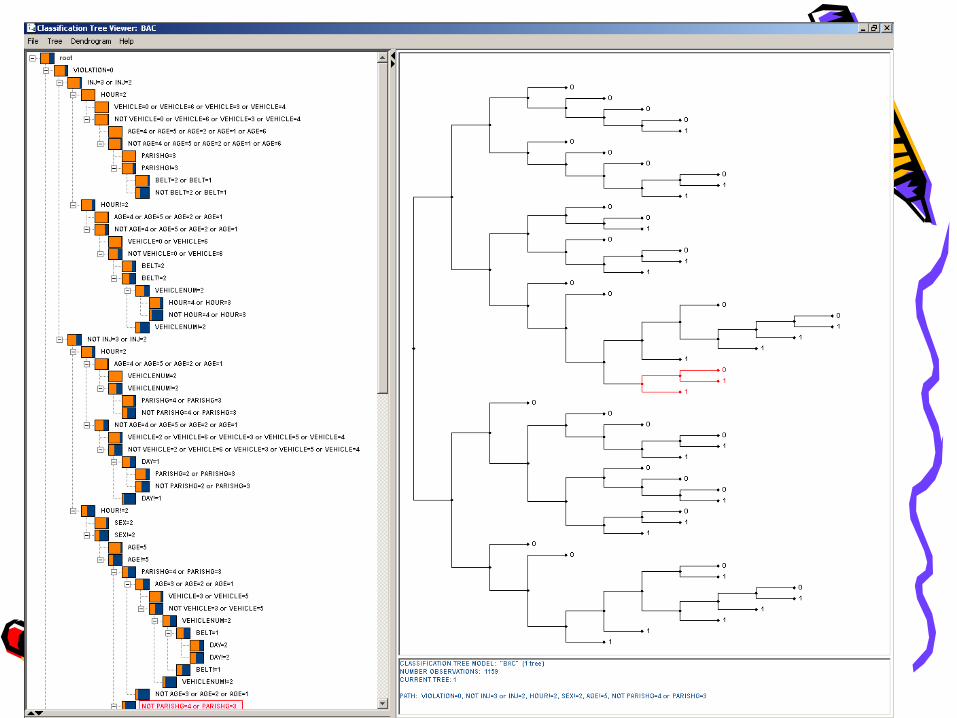
Classification Tree• Fit model to half the data• Tree model• What did we learn? –
– Importance of variables
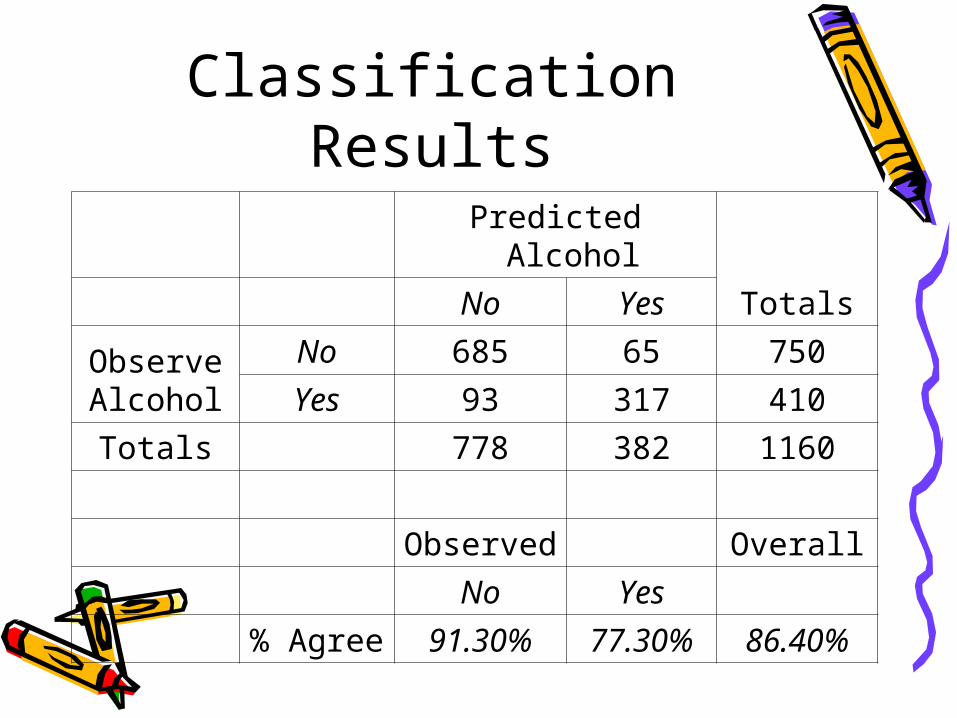
Classification Results Predicted Alcohol
Totals No Yes
ObserveAlcohol
No 685 65 750
Yes 93 317 410
Totals 778 382 1160
Observed Overall
No Yes
% Agree 91.30% 77.30% 86.40%
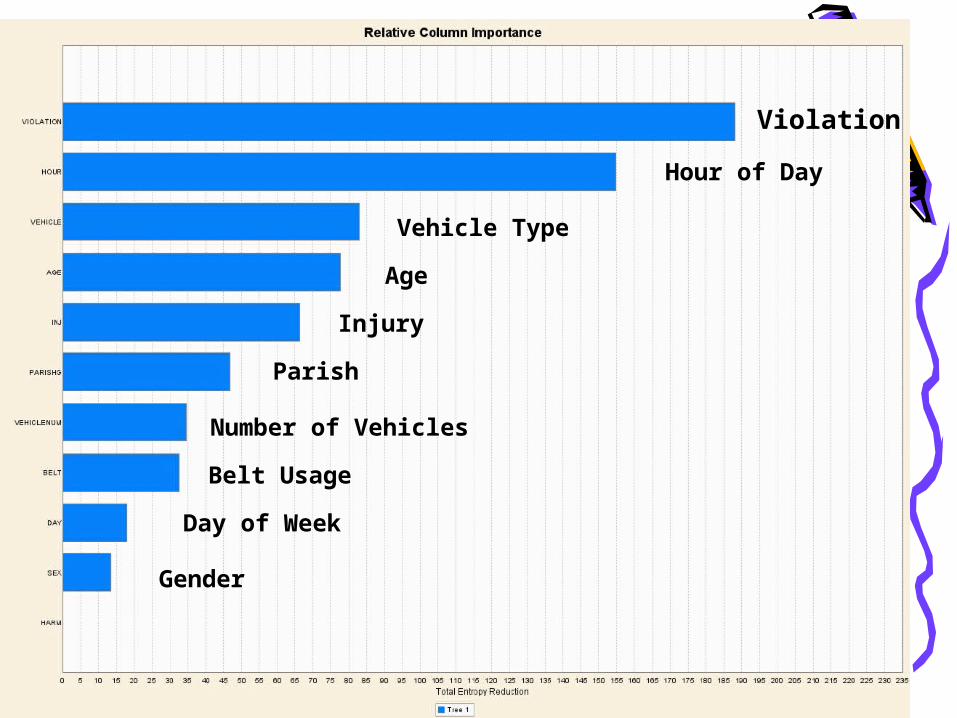
Violation
Hour of Day
Vehicle Type
Age
Injury
Parish
Number of Vehicles
Belt Usage
Day of Week
Gender
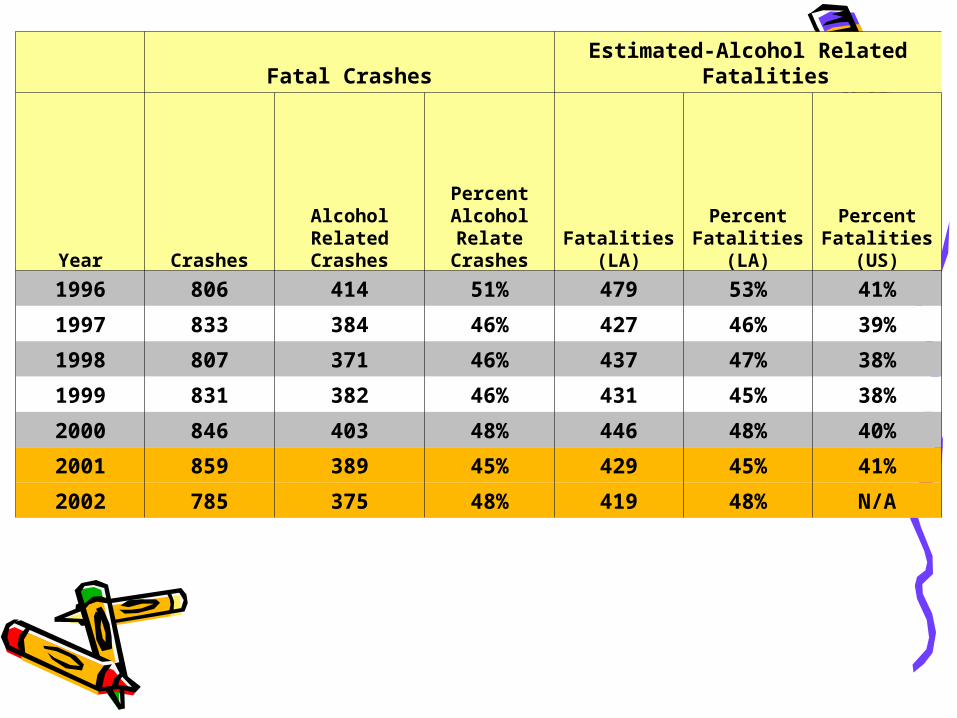
Fatal CrashesEstimated-Alcohol Related
Fatalities
Year Crashes
AlcoholRelatedCrashes
PercentAlcoholRelate
CrashesFatalities
(LA)
PercentFatalities
(LA)
PercentFatalities
(US)
1996 806 414 51% 479 53% 41%
1997 833 384 46% 427 46% 39%
1998 807 371 46% 437 47% 38%
1999 831 382 46% 431 45% 38%
2000 846 403 48% 446 48% 40%
2001 859 389 45% 429 45% 41%
2002 785 375 48% 419 48% N/A
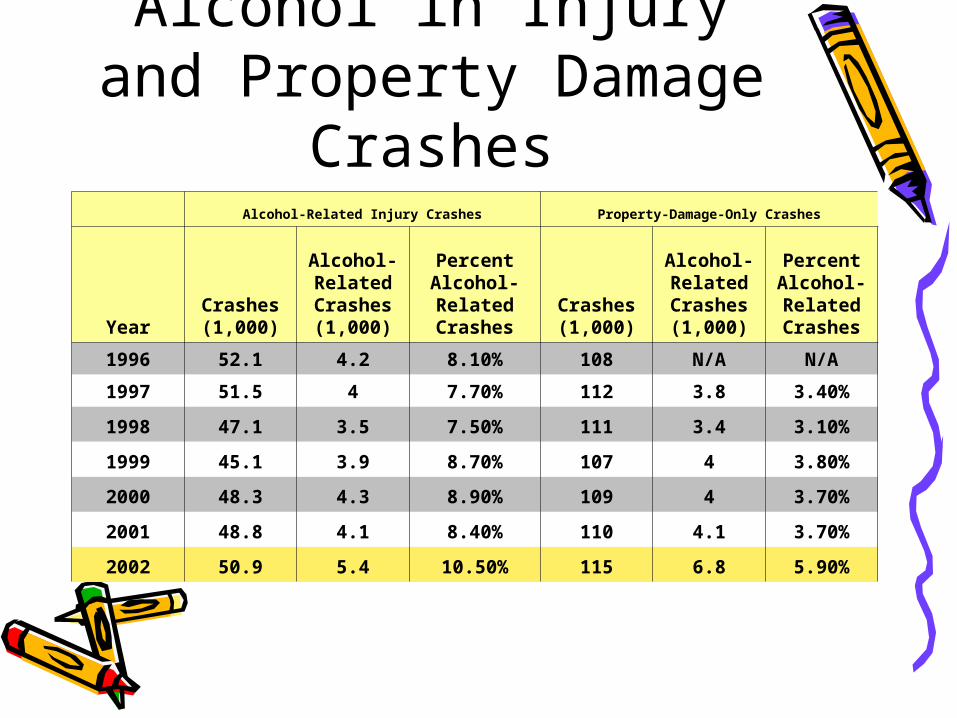
Alcohol in Injury and Property Damage
Crashes Alcohol-Related Injury Crashes Property-Damage-Only Crashes
YearCrashes (1,000)
Alcohol-Related Crashes (1,000)
Percent Alcohol- Related Crashes
Crashes (1,000)
Alcohol-Related Crashes (1,000)
Percent Alcohol-Related Crashes
1996 52.1 4.2 8.10% 108 N/A N/A
1997 51.5 4 7.70% 112 3.8 3.40%
1998 47.1 3.5 7.50% 111 3.4 3.10%
1999 45.1 3.9 8.70% 107 4 3.80%
2000 48.3 4.3 8.90% 109 4 3.70%
2001 48.8 4.1 8.40% 110 4.1 3.70%
2002 50.9 5.4 10.50% 115 6.8 5.90%
Standard Error• Using simulation on second half of
data set to get estimated error• Evaluate combined standard error • The resulting standard error is 1%
for 900 crashes
Conclusion• Data mining is a simple and useful
tool to predict missing observations
• The best predictor for alcohol related crashes are the judgment of a well trained police officer on the scene
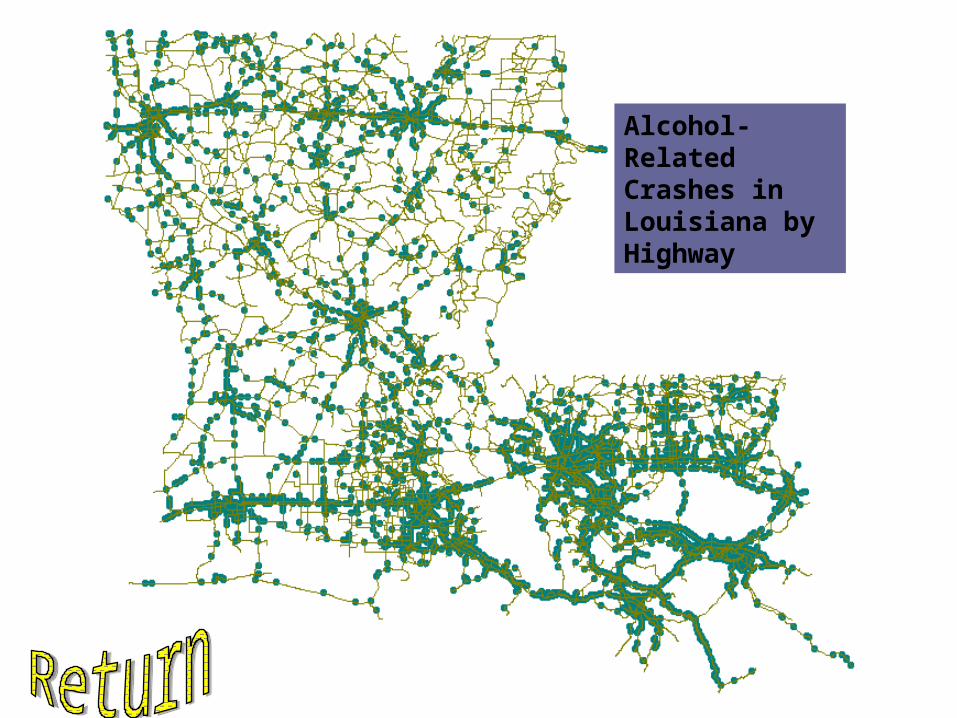
Alcohol-Related Crashes in Louisiana by Highway