Embed Size (px)
Citation preview
Joint Cash Feasibility Assessment: OverviewFebruary 2018
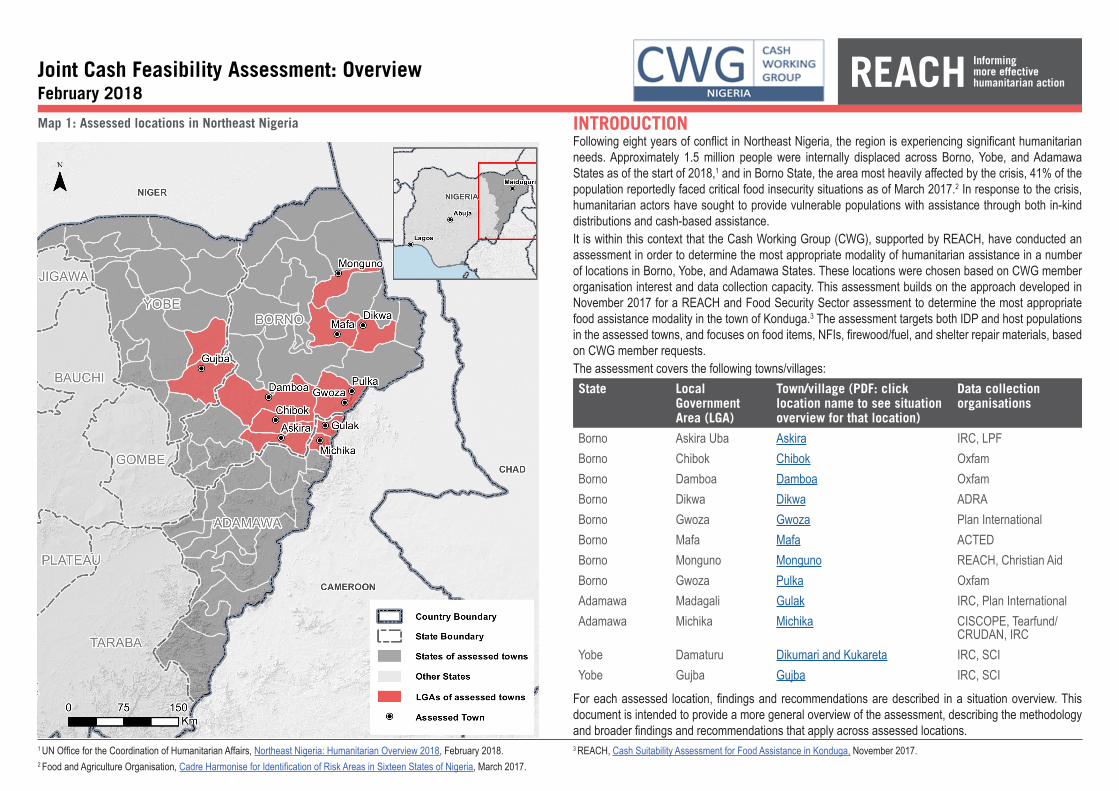
Map 1: Assessed locations in Northeast Nigeria INTRODUCTIONFollowing eight years of conflict in Northeast Nigeria, the region is experiencing significant humanitarian needs. Approximately 1.5 million people were internally displaced across Borno, Yobe, and Adamawa States as of the start of 2018,1 and in Borno State, the area most heavily affected by the crisis, 41% of the population reportedly faced critical food insecurity situations as of March 2017.2 In response to the crisis, humanitarian actors have sought to provide vulnerable populations with assistance through both in-kind distributions and cash-based assistance.It is within this context that the Cash Working Group (CWG), supported by REACH, have conducted an assessment in order to determine the most appropriate modality of humanitarian assistance in a number of locations in Borno, Yobe, and Adamawa States. These locations were chosen based on CWG member organisation interest and data collection capacity. This assessment builds on the approach developed in November 2017 for a REACH and Food Security Sector assessment to determine the most appropriate food assistance modality in the town of Konduga.3 The assessment targets both IDP and host populations in the assessed towns, and focuses on food items, NFIs, firewood/fuel, and shelter repair materials, based on CWG member requests.The assessment covers the following towns/villages:State Local
Government Area (LGA)
Town/village (PDF: click location name to see situation overview for that location)
Data collection organisations
Borno Askira Uba Askira IRC, LPFBorno Chibok Chibok OxfamBorno Damboa Damboa OxfamBorno Dikwa Dikwa ADRABorno Gwoza Gwoza Plan InternationalBorno Mafa Mafa ACTEDBorno Monguno Monguno REACH, Christian AidBorno Gwoza Pulka OxfamAdamawa Madagali Gulak IRC, Plan InternationalAdamawa Michika Michika CISCOPE, Tearfund/
CRUDAN, IRCYobe Damaturu Dikumari and Kukareta IRC, SCIYobe Gujba Gujba IRC, SCI
For each assessed location, findings and recommendations are described in a situation overview. This document is intended to provide a more general overview of the assessment, describing the methodology and broader findings and recommendations that apply across assessed locations.
1 UN Office for the Coordination of Humanitarian Affairs, Northeast Nigeria: Humanitarian Overview 2018, February 2018.2 Food and Agriculture Organisation, Cadre Harmonise for Identification of Risk Areas in Sixteen States of Nigeria, March 2017.
3 REACH, Cash Suitability Assessment for Food Assistance in Konduga, November 2017.
2
METHODOLOGYThe assessment used a mixed methodology approach in order to gather different types of data from a range of sources. This section provides an overview of the methodology, although a more detailed description can be found in the Terms of Reference for the assessment.4 Data collection for this assessment took place from 1-16 February.The focus of the assessment was on two main areas: understanding consumer household aid modality preferences along with access to items, markets and cash; and evaluating the ability of market vendors to respond to an increase in demand. These two segments of the assessment included the following data collection tools in each assessed location:Consumer households:• Structured household interviews (approximately 210 per location)• Structured Bulama (traditional community leader) interviews (approximately 15 per location)• Household focus group discussions (FGDs) (4 per location: 1 male and 1 female FGD each for IDPs
and host populations)
Market vendors:• Structured vendor interviews (approximately 30-60 per location depending on market size)• Semi-structured head of trader (informally chosen market spokesperson) interviews (1-3 per location
depending on market size)• Vendor FGDs (1-3 per location depending on market size)
For each assessed location, data from household interviews has a confidence level of 95% and a margin of error of 6-9% depending on the location. All other data is indicative rather than generalisable.Following data collection, a Joint Analysis Workshop was held, in which REACH and CWG member organisations analysed the assessment data and agreed upon recommendations for each location.Findings and recommendations from this assessment apply only to assessed villages/towns, and cannot be generalised to other parts of assessed LGAs, or to other areas outside these LGAs.
Challenges and LimitationsThe main challenges and limitations that have been identified for this assessment are as follows:• Data came from self-reporting by households and vendors, rather than external observations and
monitoring of markets and the community, and is therefore reliant on respondents providing accurate and truthful answers.
• It was often challenging for data collection teams and interviewees to estimate the number of vendors in markets, as numbers often fluctuated due to traders arriving from nearby towns on market days, and smaller-scale vendors operating in markets only on a temporary basis to generate emergency cash. This made it difficult to obtain a representative sample of vendors, particularly for larger markets.
• It was not possible to gather data on estimated trade volumes, as previous assessments had suggested such data was often unreliable when obtained through vendor self-reporting.
• While the methodology had been planned to allow stratification of household sampling based on population group (IDPs and host populations), disaggregating findings between the two groups was not possible as, in some locations with fewer IDPs, data collection teams could not find sufficient numbers of IDPs to interview.
• Population numbers for assessed locations, and the breakdown of population between IDPs and host populations in each location, were approximate estimates obtained through the triangulation of various sources including data collection team estimates, rather than precise figures. This may have led to the introduction of minor errors during aggregation and weighting of data across population groups.
• Many factors required for a humanitarian actor to decide on the exact method of providing assistance are outside the scope of this assessment. As such, actors should use the findings and recommendations of this assessment as the basis for additional assessments to determine how exactly to provide aid. Additional details on suggested areas for further investigation can be found in the recommendations section of this document.
FINDINGS AND RECOMMENDATIONS: GENERAL OVERVIEWThe following section provides a brief overview of broad patterns across assessed areas, along with recommendations that are more widely applicable in these areas. The section is intended to complement the location-specific findings and recommendations provided in the individual situation overviews for each assessed town.Findings• Amongst assessed areas, the ones where cash-based assistance was deemed to be most feasible
were Michika and Gulak in northern Adamawa State and Askira in southern Borno State. These locations had accessible markets, well-developed market systems, heavy household reliance on markets and low reliance on in-kind aid to source items, and a relatively unimpeded ability to restock from Adamawa State.
• The assessed location facing the most challenges to the implementation of cash-based assistance was Dikwa. Households in Dikwa reported a heavy preference for and reliance on in-kind aid, and most stated that they felt unsafe storing cash in their shelters or carrying it when walking in the community. In addition, market vendors reported extensive challenges in restocking goods from Maiduguri due to the security situation along the road from Maiduguri to Dikwa and the inability for vehicles to use the road except in a military-escorted convoy. The requirement to use a military-escorted convoy also applied to other towns in Borno State, including Damboa, Gwoza, and Pulka. This reportedly caused restocking challenges in these locations as well, although seemingly not to the same extent as in Dikwa.
• In general, the main reasons for households reporting a preference for cash-based aid, and unrestricted cash in particular, related to flexibility and freedom of choice. This included the freedom to choose preferred items or brands, the freedom to allocate expenditures between different types of needs (e.g. food, NFIs, health, education), and the ability to save cash for times of greater need. Reasons for preferring in-kind aid were more varied, although concerns about family members using cash for non-essential needs, insufficient and poor-quality goods at markets, and price fluctuations and price gouging were among the more common reasons cited.
4REACH, Terms of Reference: Joint Cash Feasibility Assessment, February 2018.
3
• Access to financial services and credit was low across assessed areas. In all assessed towns in Borno State, the vast majority of participants reported having no access to credit other than from vendors or from friends and relatives. In assessed parts of Yobe and Adamawa States, financial institutions such as microfinance organisations, informal savings groups, and banks were sometimes reported to be present, although most households reported not using them. Similarly, better access to cellular networks and mobile phones was reported in assessed towns in Yobe and Adamawa than in Borno.
• Across assessed locations, vendors commonly reported that the lack of cash flow for initially scaling up was a major barrier to increasing supply in response to a growth in demand. However, in many locations, vendors were able to access credit from suppliers, suggesting that a more gradual increase of supply, where vendors scale up slowly using supplier credit that they then repay with increased revenues, may be more feasible in places where vendors reported initial cash flow as a challenge but were able to get credit from suppliers.
Recommendations• For each location, a recommendation has been provided regarding the general feasibility of cash-
based assistance. However, many factors required for a humanitarian actor to decide on the exact method of providing assistance are outside the scope of this assessment. As such, actors should use the findings and recommendations of this assessment as the basis for additional location-specific assessments to determine how exactly to provide aid. Areas requiring further investigation include: mapping of the presence and reliability of financial service providers and other potential delivery mechanisms; needs assessments to determine targeting criteria (if any); regular monitoring of market prices before, during and after the provision of assistance to evaluate the amount of aid needed to meet basic needs and the effects of aid on markets; post-distribution monitoring to understand how aid is used and obtain feedback from the community on the implementation of the chosen modality; livelihoods assessments to determine the proportion of needs that should be met through aid and possible paths towards sustainable livelihoods and reduced aid dependence; internal assessments to determine an organisation’s capacity to implement programming through a given assistance modality.
• In many places, households commonly reported concerns about household members misusing cash-based aid. It would therefore be important for cash-based humanitarian actors to be aware of the effects of such aid on household and gender dynamics, and to take steps to mitigate protection concerns stemming from the provision of aid. Monitoring of protection risks should also continue during the implementation of programming, in order to detect and address any unforeseen issues arising from a given assistance modality.
• Given that some households cited concerns that vendors would unreasonably raise prices following the provision of cash-based aid, cash-based actors should develop mechanisms through which they can address the risk of price gouging. Such mechanisms could include mediation through traders’ associations or heads of traders, particularly in places with well-developed traders’ associations and market systems. This could also be done through restricted cash-based modalities, in which humanitarian actors work with verified vendors and can agree upon prices periodically.
• In most assessed locations, only a minority of vendors reported being able to read and write fluently
in any language. Actors implementing more complex cash-based modalities such as e-vouchers or mobile money transfers should therefore ensure they are designed to be user-friendly even for those with no or partial levels of literacy.
• In many locations, findings suggested that cash-based aid may be feasible in the near future, but that transitional measures needed to be taken to prepare markets to absorb additional demand. In these locations, and also in assessed areas more generally, humanitarian actors interested in a transition towards cash should consider market-strengthening measures, such as linking vendors to financial services and credit sources, supporting the development of traders’ associations and market systems, and assisting markets in developing more robust storage and transportation methods. In addition, actors should trial cash-based interventions through small-scale pilot programmes before deciding to implement such assistance more widely. In places where many households are currently reliant on in-kind aid, any transition towards cash-based aid should be implemented in a phased manner to reduce the risk of markets being unable to cope with a sudden surge in demand.
• Many assessed locations are currently facing, or have recently faced, security challenges. Humanitarian actors should continuously monitor the security situation in their areas of implementation, and should carry out contingency planning in case of a security deterioration that would prevent households from receiving aid through their programming or put humanitarian staff at significant risk. For cash-based actors, this could include plans for alternate aid delivery mechanisms in case market functionality is disrupted. Similarly, programmes should include measures for the inclusion of new IDP or returnee arrivals in places where inward displacement might cause populations and needs to increase.
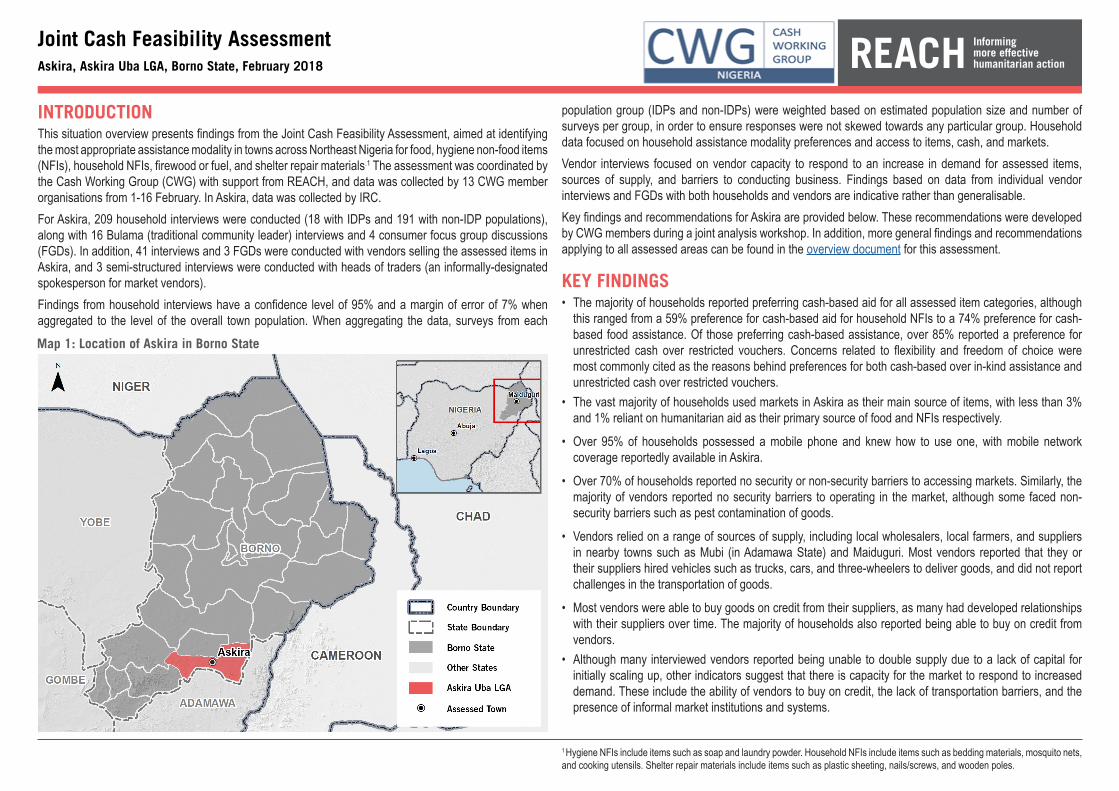
INTRODUCTIONThis situation overview presents findings from the Joint Cash Feasibility Assessment, aimed at identifying the most appropriate assistance modality in towns across Northeast Nigeria for food, hygiene non-food items (NFIs), household NFIs, firewood or fuel, and shelter repair materials.1 The assessment was coordinated by the Cash Working Group (CWG) with support from REACH, and data was collected by 13 CWG member organisations from 1-16 February. In Askira, data was collected by IRC.For Askira, 209 household interviews were conducted (18 with IDPs and 191 with non-IDP populations), along with 16 Bulama (traditional community leader) interviews and 4 consumer focus group discussions (FGDs). In addition, 41 interviews and 3 FGDs were conducted with vendors selling the assessed items in Askira, and 3 semi-structured interviews were conducted with heads of traders (an informally-designated spokesperson for market vendors).Findings from household interviews have a confidence level of 95% and a margin of error of 7% when aggregated to the level of the overall town population. When aggregating the data, surveys from each
Joint Cash Feasibility AssessmentAskira, Askira Uba LGA, Borno State, February 2018
population group (IDPs and non-IDPs) were weighted based on estimated population size and number of surveys per group, in order to ensure responses were not skewed towards any particular group. Household data focused on household assistance modality preferences and access to items, cash, and markets.Vendor interviews focused on vendor capacity to respond to an increase in demand for assessed items, sources of supply, and barriers to conducting business. Findings based on data from individual vendor interviews and FGDs with both households and vendors are indicative rather than generalisable.Key findings and recommendations for Askira are provided below. These recommendations were developed by CWG members during a joint analysis workshop. In addition, more general findings and recommendations applying to all assessed areas can be found in the overview document for this assessment.
KEY FINDINGS• The majority of households reported preferring cash-based aid for all assessed item categories, although
this ranged from a 59% preference for cash-based aid for household NFIs to a 74% preference for cash-based food assistance. Of those preferring cash-based assistance, over 85% reported a preference for unrestricted cash over restricted vouchers. Concerns related to flexibility and freedom of choice were most commonly cited as the reasons behind preferences for both cash-based over in-kind assistance and unrestricted cash over restricted vouchers.
• The vast majority of households used markets in Askira as their main source of items, with less than 3% and 1% reliant on humanitarian aid as their primary source of food and NFIs respectively.
• Over 95% of households possessed a mobile phone and knew how to use one, with mobile network coverage reportedly available in Askira.
• Over 70% of households reported no security or non-security barriers to accessing markets. Similarly, the majority of vendors reported no security barriers to operating in the market, although some faced non-security barriers such as pest contamination of goods.
• Vendors relied on a range of sources of supply, including local wholesalers, local farmers, and suppliers in nearby towns such as Mubi (in Adamawa State) and Maiduguri. Most vendors reported that they or their suppliers hired vehicles such as trucks, cars, and three-wheelers to deliver goods, and did not report challenges in the transportation of goods.
• Most vendors were able to buy goods on credit from their suppliers, as many had developed relationships with their suppliers over time. The majority of households also reported being able to buy on credit from vendors.
• Although many interviewed vendors reported being unable to double supply due to a lack of capital for initially scaling up, other indicators suggest that there is capacity for the market to respond to increased demand. These include the ability of vendors to buy on credit, the lack of transportation barriers, and the presence of informal market institutions and systems.
Map 1: Location of Askira in Borno State
1 Hygiene NFIs include items such as soap and laundry powder. Household NFIs include items such as bedding materials, mosquito nets, and cooking utensils. Shelter repair materials include items such as plastic sheeting, nails/screws, and wooden poles.
5
610170+220
RECOMMENDATIONS2
• Findings show that cash-based aid, including multipurpose cash assistance, would be feasible in Askira. Multipurpose cash would align with household preferences, and the added burden of additional households using the market due to cash-based aid is likely to be low as the majority of households already report using the market as their main source of items. In addition, findings suggest that the market would be able to respond to an increase in demand, with vendors generally reporting using diverse supply sources, accessing credit from suppliers, and not facing barriers to the transportation of goods into Askira.
• Humanitarian actors implementing cash-based assistance should consider market-strengthening measures, specifically steps to link market vendors with financial services and additional sources of credit. Many vendors reported lacking the capital necessary to increase supply and, while vendors do have access to credit from suppliers, easier access to financial services would likely enable the market to grow more quickly and become more resistant to potential disruptions in supply.
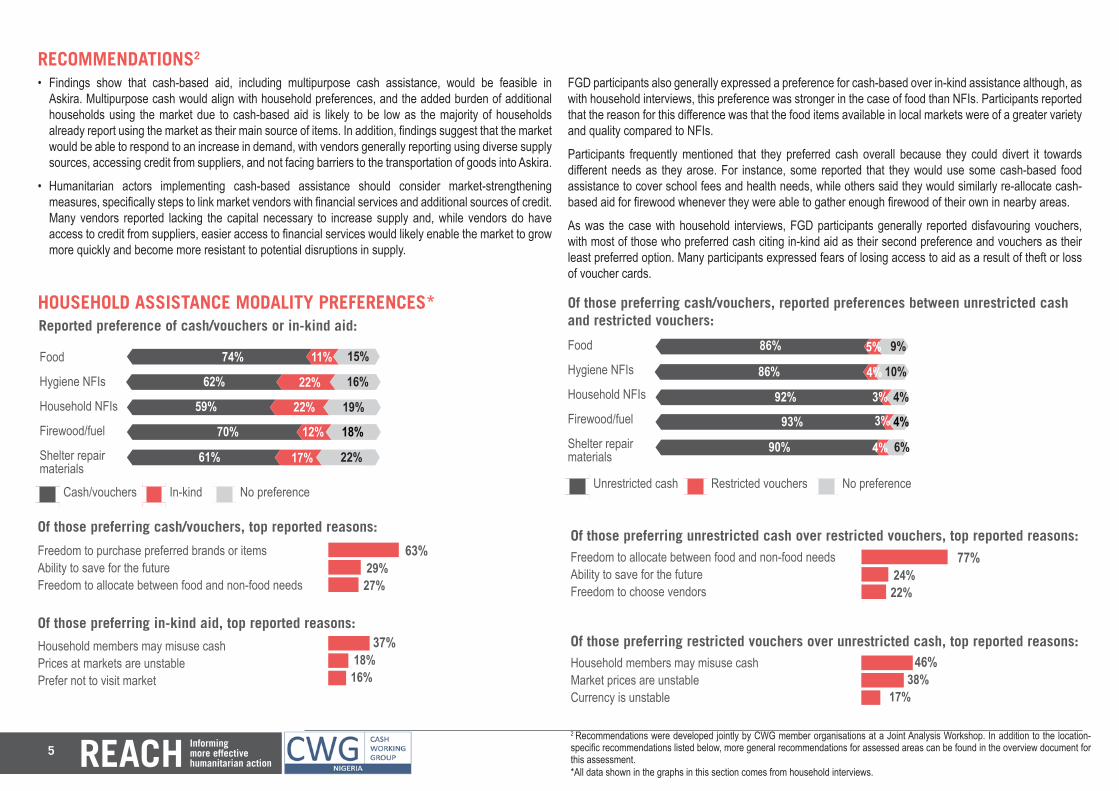
HOUSEHOLD ASSISTANCE MODALITY PREFERENCES*
FGD participants also generally expressed a preference for cash-based over in-kind assistance although, as with household interviews, this preference was stronger in the case of food than NFIs. Participants reported that the reason for this difference was that the food items available in local markets were of a greater variety and quality compared to NFIs.
Participants frequently mentioned that they preferred cash overall because they could divert it towards different needs as they arose. For instance, some reported that they would use some cash-based food assistance to cover school fees and health needs, while others said they would similarly re-allocate cash-based aid for firewood whenever they were able to gather enough firewood of their own in nearby areas.
As was the case with household interviews, FGD participants generally reported disfavouring vouchers, with most of those who preferred cash citing in-kind aid as their second preference and vouchers as their least preferred option. Many participants expressed fears of losing access to aid as a result of theft or loss of voucher cards.
6060
Reported preference of cash/vouchers or in-kind aid:
Food
Hygiene NFIs
Household NFIs
Firewood/fuel
Shelter repair materials
Of those preferring in-kind aid, top reported reasons:
Household members may misuse cash Prices at markets are unstable Prefer not to visit market
37+18+16 37% 18% 16%
740110+150
60
74% 11% 15%
Of those preferring cash/vouchers, top reported reasons:
Freedom to purchase preferred brands or items Ability to save for the futureFreedom to allocate between food and non-food needs
Cash/vouchers In-kind No preference
620220+16060
62% 22% 16%
590220+19060
59% 22% 19%
700120+18070% 12% 18%
61% 17% 22%63+29+27 63% 29% 27%
Of those preferring cash/vouchers, reported preferences between unrestricted cash and restricted vouchers:
Food
Hygiene NFIs
Household NFIs
Firewood/fuel
Shelter repair materials
Of those preferring restricted vouchers over unrestricted cash, top reported reasons:Household members may misuse cash Market prices are unstable Currency is unstable
46+38+17 46% 38% 17%
Of those preferring unrestricted cash over restricted vouchers, top reported reasons:77+24+22 77% 24% 22%
Freedom to allocate between food and non-food needs Ability to save for the futureFreedom to choose vendors
6060
86050+90
60
86% 5% 9%
86040+100
60
86% 4% 10%
92030+5060
92% 3% 4%
93030+4093% 3% 4%
90040+6090% 4% 6%
Unrestricted cash Restricted vouchers No preference
2 Recommendations were developed jointly by CWG member organisations at a Joint Analysis Workshop. In addition to the location-specific recommendations listed below, more general recommendations for assessed areas can be found in the overview document for this assessment.*All data shown in the graphs in this section comes from household interviews.
6
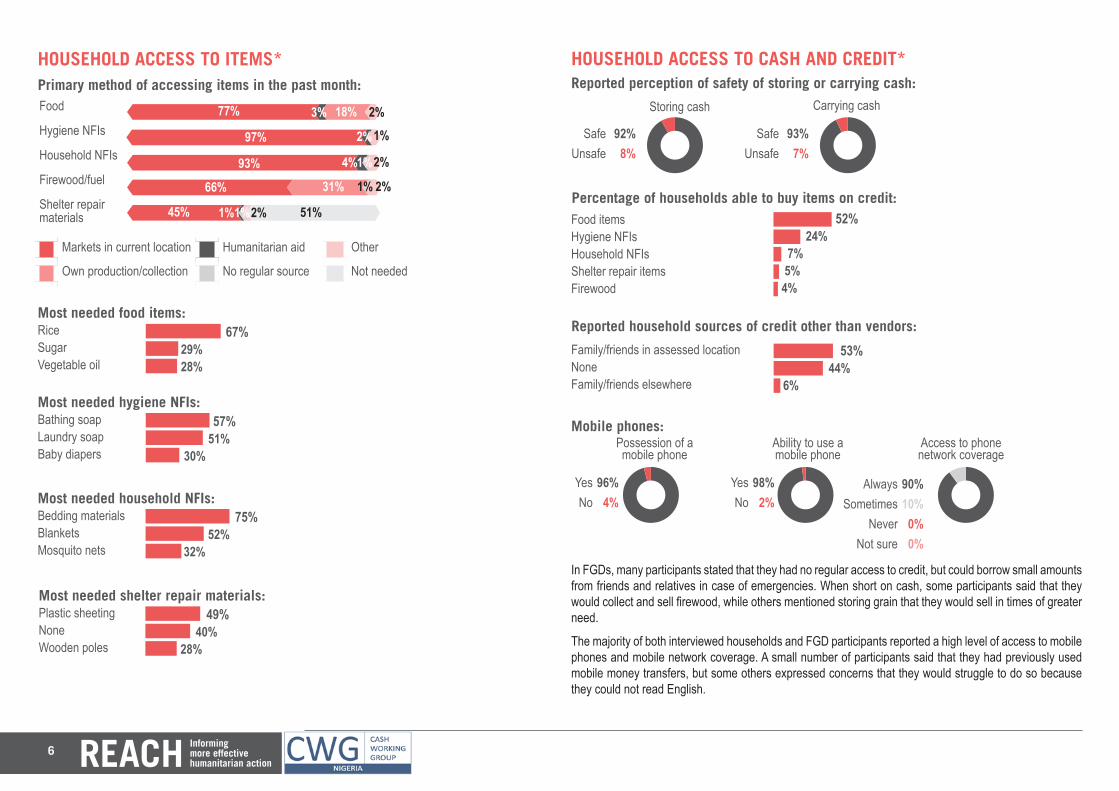
HOUSEHOLD ACCESS TO ITEMS*
Most needed food items:67+29+28 67% 29% 28%
RiceSugarVegetable oil
Most needed hygiene NFIs:57+51+30 57% 51% 30%
Bathing soapLaundry soapBaby diapers
Most needed household NFIs:75+52+32 75% 52% 32%
Bedding materialsBlanketsMosquito nets
Most needed shelter repair materials:49+40+28 49% 40% 28%
Plastic sheetingNoneWooden poles
HOUSEHOLD ACCESS TO CASH AND CREDIT*
In FGDs, many participants stated that they had no regular access to credit, but could borrow small amounts from friends and relatives in case of emergencies. When short on cash, some participants said that they would collect and sell firewood, while others mentioned storing grain that they would sell in times of greater need.
The majority of both interviewed households and FGD participants reported a high level of access to mobile phones and mobile network coverage. A small number of participants said that they had previously used mobile money transfers, but some others expressed concerns that they would struggle to do so because they could not read English.
Percentage of households able to buy items on credit:Food items Hygiene NFIs Household NFIsShelter repair itemsFirewood
52+24+7+5+4 52% 24% 7% 5% 4%
Reported household sources of credit other than vendors:53+44+6Family/friends in assessed locationNoneFamily/friends elsewhere
53% 44% 6%
98+2+zMobile phones:
YesNo 96+4+z
Possession of a mobile phone
96%4%
YesNo
98%2%
Ability to use a mobile phone
AlwaysSometimes
NeverNot sure
90%10%
0%0%
Access to phone network coverage
93+7+zReported perception of safety of storing or carrying cash:
SafeUnsafe 92+8+z
Storing cash Carrying cash
92%8%
SafeUnsafe
93%7%
9010+0+0+z60606060
Primary method of accessing items in the past month:
Markets in current location Humanitarian aid Other
Own production/collection No regular source Not needed
Food
Hygiene NFIs
Household NFIs
Firewood/fuel
Shelter repair materials
60
77030+180+0+2077% 3% 18%
97020+0+0+1097% 2%
930+400+10+2093% 4%
660+0310+10+2066% 31%
450+1010+20+51045% 1%1%
1%
1%
2%
2%1%
2%
2%
51%
7
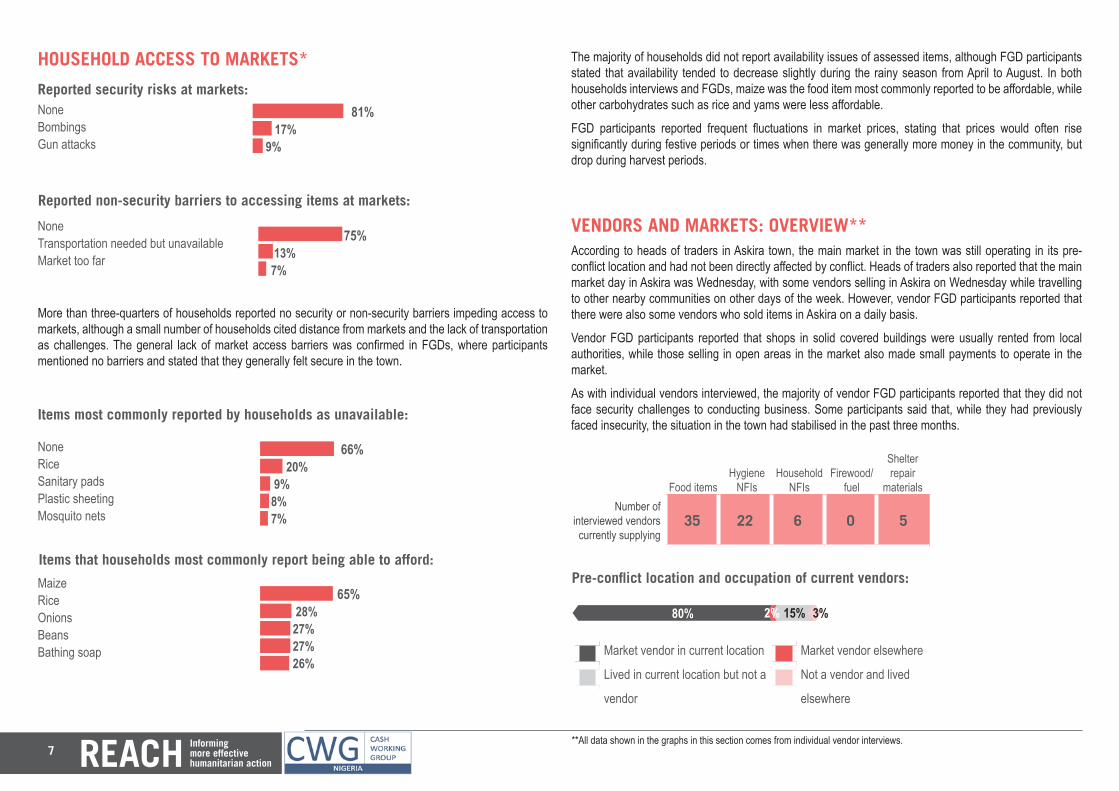
HOUSEHOLD ACCESS TO MARKETS*
More than three-quarters of households reported no security or non-security barriers impeding access to markets, although a small number of households cited distance from markets and the lack of transportation as challenges. The general lack of market access barriers was confirmed in FGDs, where participants mentioned no barriers and stated that they generally felt secure in the town.
Reported non-security barriers to accessing items at markets:
Reported security risks at markets: 81+17+9NoneBombingsGun attacks
81% 17% 9%75+13+7None
Transportation needed but unavailableMarket too far
75% 13% 7%
The majority of households did not report availability issues of assessed items, although FGD participants stated that availability tended to decrease slightly during the rainy season from April to August. In both households interviews and FGDs, maize was the food item most commonly reported to be affordable, while other carbohydrates such as rice and yams were less affordable.
FGD participants reported frequent fluctuations in market prices, stating that prices would often rise significantly during festive periods or times when there was generally more money in the community, but drop during harvest periods.
Items most commonly reported by households as unavailable:66+20+9+8+7 66% 20% 9% 8% 7%
NoneRiceSanitary padsPlastic sheetingMosquito nets
Items that households most commonly report being able to afford:65+28+27+27+26 65% 28% 27% 27% 26%
MaizeRiceOnionsBeansBathing soap
VENDORS AND MARKETS: OVERVIEW**According to heads of traders in Askira town, the main market in the town was still operating in its pre-conflict location and had not been directly affected by conflict. Heads of traders also reported that the main market day in Askira was Wednesday, with some vendors selling in Askira on Wednesday while travelling to other nearby communities on other days of the week. However, vendor FGD participants reported that there were also some vendors who sold items in Askira on a daily basis.
Vendor FGD participants reported that shops in solid covered buildings were usually rented from local authorities, while those selling in open areas in the market also made small payments to operate in the market.
As with individual vendors interviewed, the majority of vendor FGD participants reported that they did not face security challenges to conducting business. Some participants said that, while they had previously faced insecurity, the situation in the town had stabilised in the past three months.
Number of interviewed vendors currently supplying
35 22 6 0 5
Food itemsHygiene
NFIsHousehold
NFIsFirewood/
fuel
Shelter repair
materials
60
Market vendor in current location Market vendor elsewhere
Lived in current location but not a Not a vendor and lived
vendor elsewhere
Pre-conflict location and occupation of current vendors:
80020+150+32% 3%80% 15%
**All data shown in the graphs in this section comes from individual vendor interviews.
8
66+29+12+
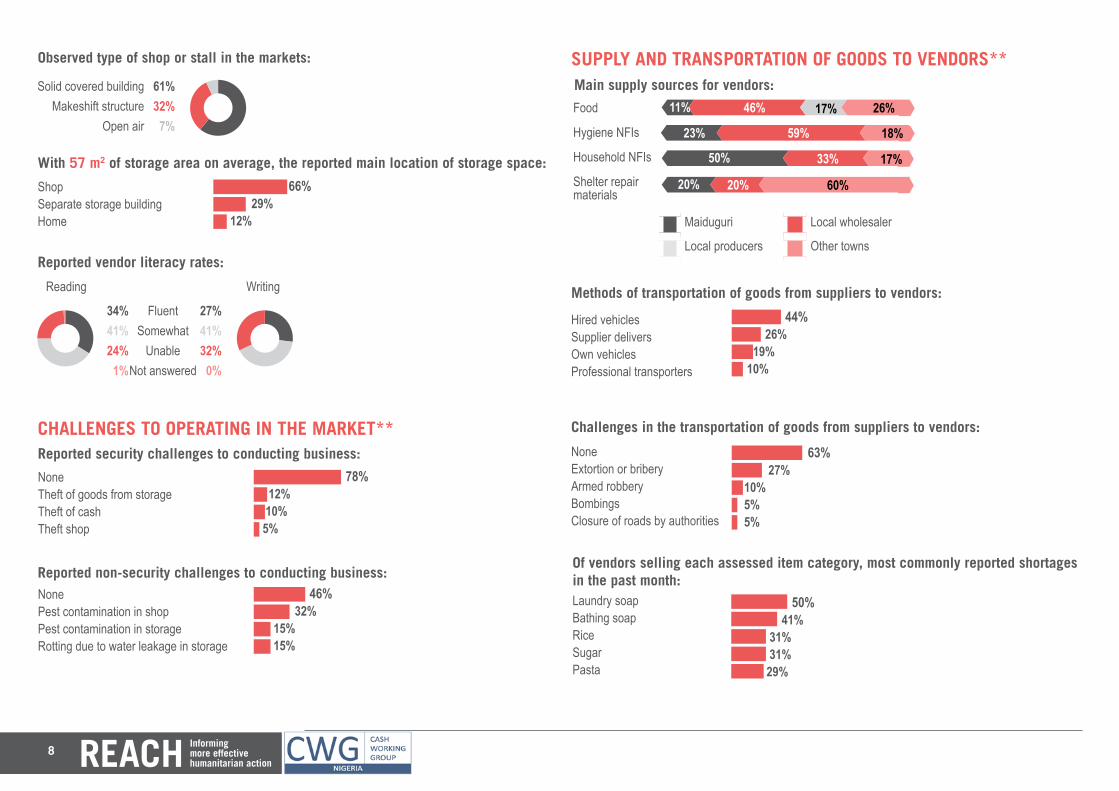
Observed type of shop or stall in the markets:
With 57 m2 of storage area on average, the reported main location of storage space:
Solid covered buildingMakeshift structure
Open air 61327z61%32%
7%
ShopSeparate storage buildingHome
66% 29% 12%
Reported vendor literacy rates:
FluentSomewhat
UnableNot answered
Reading Writing
2741+32+0+z34+4124+1z27%41%32%
0%
34%41%24%
1%
CHALLENGES TO OPERATING IN THE MARKET**
Reported non-security challenges to conducting business:NonePest contamination in shopPest contamination in storageRotting due to water leakage in storage
NoneTheft of goods from storageTheft of cashTheft shop 46+32+15+15
78+12+10+5
46% 32% 15% 15%
78% 12% 10% 5%
Reported security challenges to conducting business:
60606060
SUPPLY AND TRANSPORTATION OF GOODS TO VENDORS**Main supply sources for vendors:
Maiduguri Local wholesaler
Local producers Other towns
110460+170+26011% 46%
230590+0+18023% 59%
500330+0+17050% 33%
200200+0+60020% 20%
Hired vehiclesSupplier deliversOwn vehiclesProfessional transporters
44+26+19+10+ 44% 26% 19% 10%
Methods of transportation of goods from suppliers to vendors:
Food
Hygiene NFIs
Household NFIs
Shelter repair materials
17%
60%
17%
18%
26%
Challenges in the transportation of goods from suppliers to vendors:
NoneExtortion or briberyArmed robberyBombingsClosure of roads by authorities
63+27+10+5+5 63% 27% 10% 5% 5%
Of vendors selling each assessed item category, most commonly reported shortages in the past month: 50+41+31+31+29 50%
41% 31% 31%29%
Laundry soapBathing soapRiceSugarPasta
9
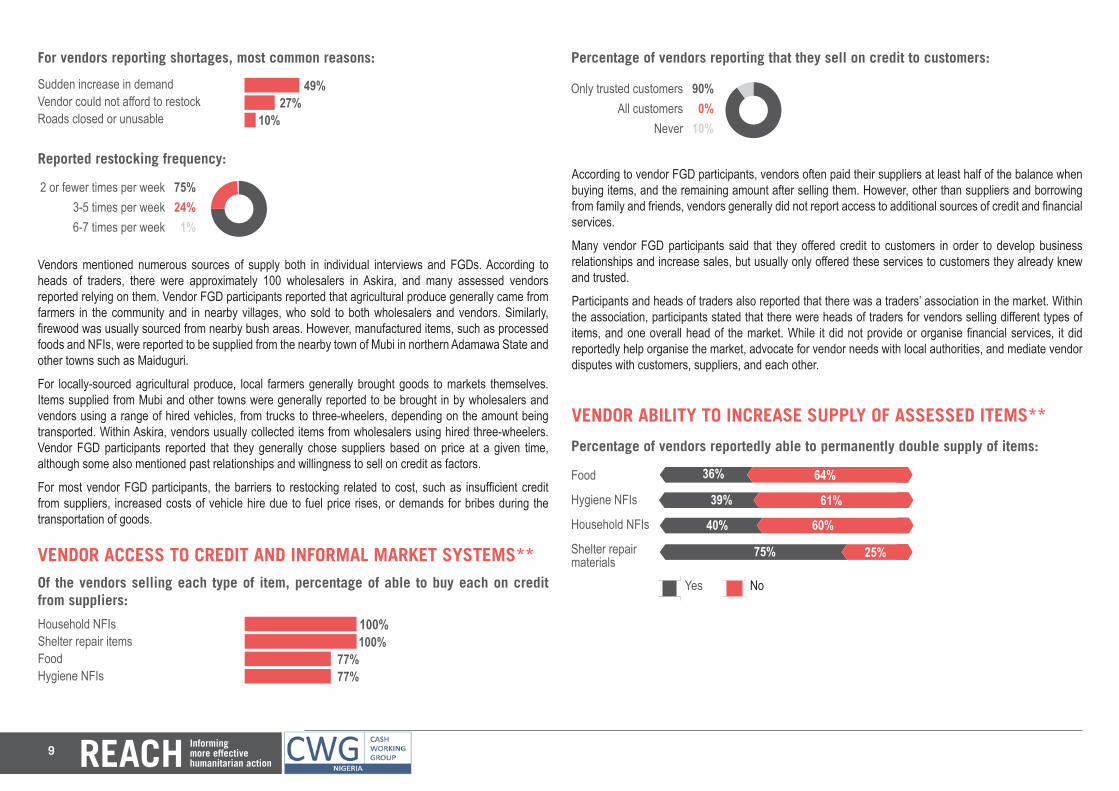
For vendors reporting shortages, most common reasons:49+27+10 49% 27%10%
Sudden increase in demandVendor could not afford to restockRoads closed or unusable
Reported restocking frequency:
2 or fewer times per week3-5 times per week6-7 times per week 75241z75%
24%1%
VENDOR ACCESS TO CREDIT AND INFORMAL MARKET SYSTEMS**
According to vendor FGD participants, vendors often paid their suppliers at least half of the balance when buying items, and the remaining amount after selling them. However, other than suppliers and borrowing from family and friends, vendors generally did not report access to additional sources of credit and financial services.
Many vendor FGD participants said that they offered credit to customers in order to develop business relationships and increase sales, but usually only offered these services to customers they already knew and trusted.
Participants and heads of traders also reported that there was a traders’ association in the market. Within the association, participants stated that there were heads of traders for vendors selling different types of items, and one overall head of the market. While it did not provide or organise financial services, it did reportedly help organise the market, advocate for vendor needs with local authorities, and mediate vendor disputes with customers, suppliers, and each other.
Vendors mentioned numerous sources of supply both in individual interviews and FGDs. According to heads of traders, there were approximately 100 wholesalers in Askira, and many assessed vendors reported relying on them. Vendor FGD participants reported that agricultural produce generally came from farmers in the community and in nearby villages, who sold to both wholesalers and vendors. Similarly, firewood was usually sourced from nearby bush areas. However, manufactured items, such as processed foods and NFIs, were reported to be supplied from the nearby town of Mubi in northern Adamawa State and other towns such as Maiduguri.
For locally-sourced agricultural produce, local farmers generally brought goods to markets themselves. Items supplied from Mubi and other towns were generally reported to be brought in by wholesalers and vendors using a range of hired vehicles, from trucks to three-wheelers, depending on the amount being transported. Within Askira, vendors usually collected items from wholesalers using hired three-wheelers. Vendor FGD participants reported that they generally chose suppliers based on price at a given time, although some also mentioned past relationships and willingness to sell on credit as factors.
For most vendor FGD participants, the barriers to restocking related to cost, such as insufficient credit from suppliers, increased costs of vehicle hire due to fuel price rises, or demands for bribes during the transportation of goods.
Of the vendors selling each type of item, percentage of able to buy each on credit from suppliers:
Household NFIsShelter repair itemsFoodHygiene NFIs
100+100+77+77 100% 100%77%77%
Percentage of vendors reporting that they sell on credit to customers:
Only trusted customersAll customers
Never 9010+z90%0%
10%
VENDOR ABILITY TO INCREASE SUPPLY OF ASSESSED ITEMS**
Percentage of vendors reportedly able to permanently double supply of items:
Yes No
60
360640
60
36% 64%
390610
60
39% 61%
400600
60
40% 60%
75025075% 25%
Food
Hygiene NFIs
Household NFIs
Shelter repair materials
10
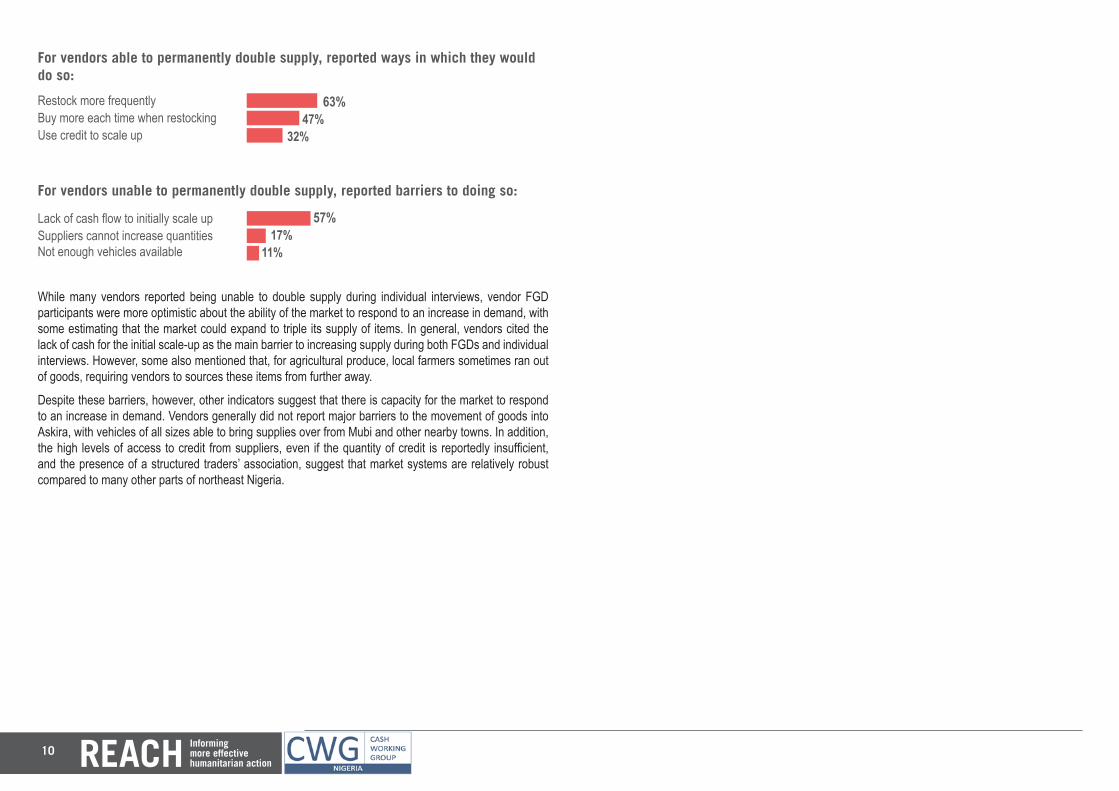
For vendors able to permanently double supply, reported ways in which they would do so:
Restock more frequentlyBuy more each time when restockingUse credit to scale up
63+47+32 63% 47% 32%
For vendors unable to permanently double supply, reported barriers to doing so:
Lack of cash flow to initially scale upSuppliers cannot increase quantitiesNot enough vehicles available
57+17+11 57% 17% 11%
While many vendors reported being unable to double supply during individual interviews, vendor FGD participants were more optimistic about the ability of the market to respond to an increase in demand, with some estimating that the market could expand to triple its supply of items. In general, vendors cited the lack of cash for the initial scale-up as the main barrier to increasing supply during both FGDs and individual interviews. However, some also mentioned that, for agricultural produce, local farmers sometimes ran out of goods, requiring vendors to sources these items from further away.
Despite these barriers, however, other indicators suggest that there is capacity for the market to respond to an increase in demand. Vendors generally did not report major barriers to the movement of goods into Askira, with vehicles of all sizes able to bring supplies over from Mubi and other nearby towns. In addition, the high levels of access to credit from suppliers, even if the quantity of credit is reportedly insufficient, and the presence of a structured traders’ association, suggest that market systems are relatively robust compared to many other parts of northeast Nigeria.
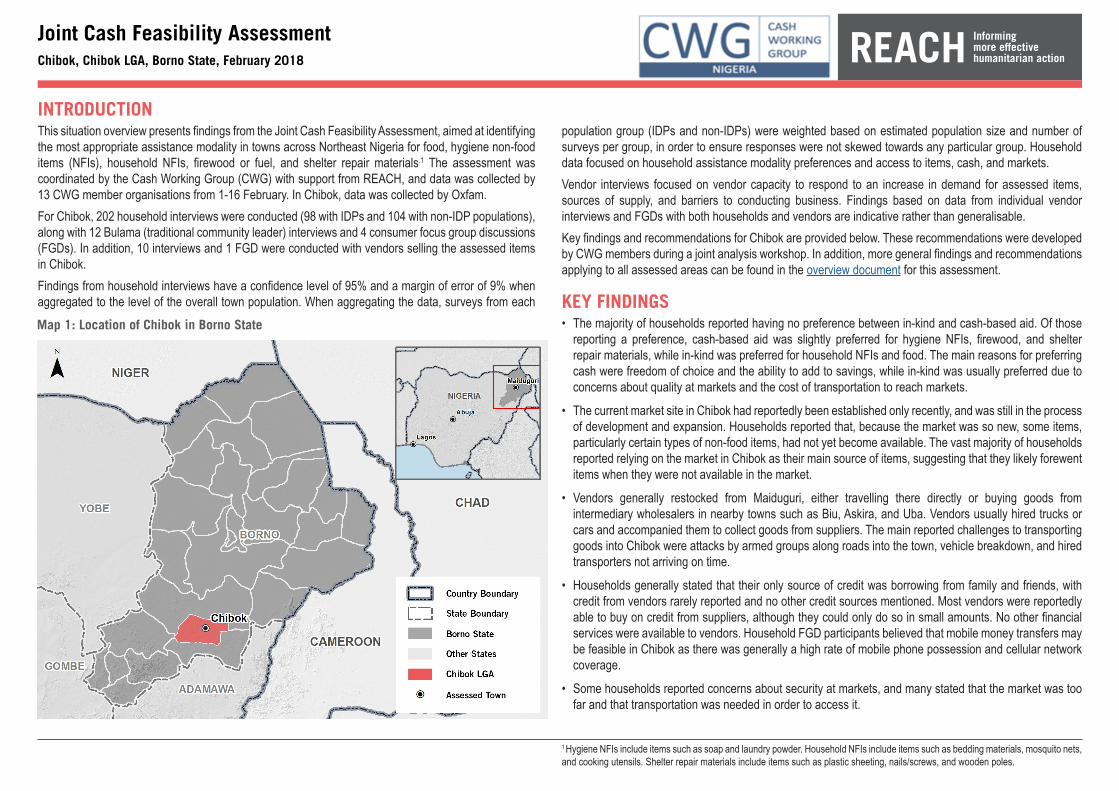
INTRODUCTIONThis situation overview presents findings from the Joint Cash Feasibility Assessment, aimed at identifying the most appropriate assistance modality in towns across Northeast Nigeria for food, hygiene non-food items (NFIs), household NFIs, firewood or fuel, and shelter repair materials.1 The assessment was coordinated by the Cash Working Group (CWG) with support from REACH, and data was collected by 13 CWG member organisations from 1-16 February. In Chibok, data was collected by Oxfam.For Chibok, 202 household interviews were conducted (98 with IDPs and 104 with non-IDP populations), along with 12 Bulama (traditional community leader) interviews and 4 consumer focus group discussions (FGDs). In addition, 10 interviews and 1 FGD were conducted with vendors selling the assessed items in Chibok.Findings from household interviews have a confidence level of 95% and a margin of error of 9% when aggregated to the level of the overall town population. When aggregating the data, surveys from each
Joint Cash Feasibility AssessmentChibok, Chibok LGA, Borno State, February 2018
population group (IDPs and non-IDPs) were weighted based on estimated population size and number of surveys per group, in order to ensure responses were not skewed towards any particular group. Household data focused on household assistance modality preferences and access to items, cash, and markets.Vendor interviews focused on vendor capacity to respond to an increase in demand for assessed items, sources of supply, and barriers to conducting business. Findings based on data from individual vendor interviews and FGDs with both households and vendors are indicative rather than generalisable.Key findings and recommendations for Chibok are provided below. These recommendations were developed by CWG members during a joint analysis workshop. In addition, more general findings and recommendations applying to all assessed areas can be found in the overview document for this assessment.
KEY FINDINGS• The majority of households reported having no preference between in-kind and cash-based aid. Of those
reporting a preference, cash-based aid was slightly preferred for hygiene NFIs, firewood, and shelter repair materials, while in-kind was preferred for household NFIs and food. The main reasons for preferring cash were freedom of choice and the ability to add to savings, while in-kind was usually preferred due to concerns about quality at markets and the cost of transportation to reach markets.
• The current market site in Chibok had reportedly been established only recently, and was still in the process of development and expansion. Households reported that, because the market was so new, some items, particularly certain types of non-food items, had not yet become available. The vast majority of households reported relying on the market in Chibok as their main source of items, suggesting that they likely forewent items when they were not available in the market.
• Vendors generally restocked from Maiduguri, either travelling there directly or buying goods from intermediary wholesalers in nearby towns such as Biu, Askira, and Uba. Vendors usually hired trucks or cars and accompanied them to collect goods from suppliers. The main reported challenges to transporting goods into Chibok were attacks by armed groups along roads into the town, vehicle breakdown, and hired transporters not arriving on time.
• Households generally stated that their only source of credit was borrowing from family and friends, with credit from vendors rarely reported and no other credit sources mentioned. Most vendors were reportedly able to buy on credit from suppliers, although they could only do so in small amounts. No other financial services were available to vendors. Household FGD participants believed that mobile money transfers may be feasible in Chibok as there was generally a high rate of mobile phone possession and cellular network coverage.
• Some households reported concerns about security at markets, and many stated that the market was too far and that transportation was needed in order to access it.
Map 1: Location of Chibok in Borno State
1 Hygiene NFIs include items such as soap and laundry powder. Household NFIs include items such as bedding materials, mosquito nets, and cooking utensils. Shelter repair materials include items such as plastic sheeting, nails/screws, and wooden poles.
12
180140+680
RECOMMENDATIONS2
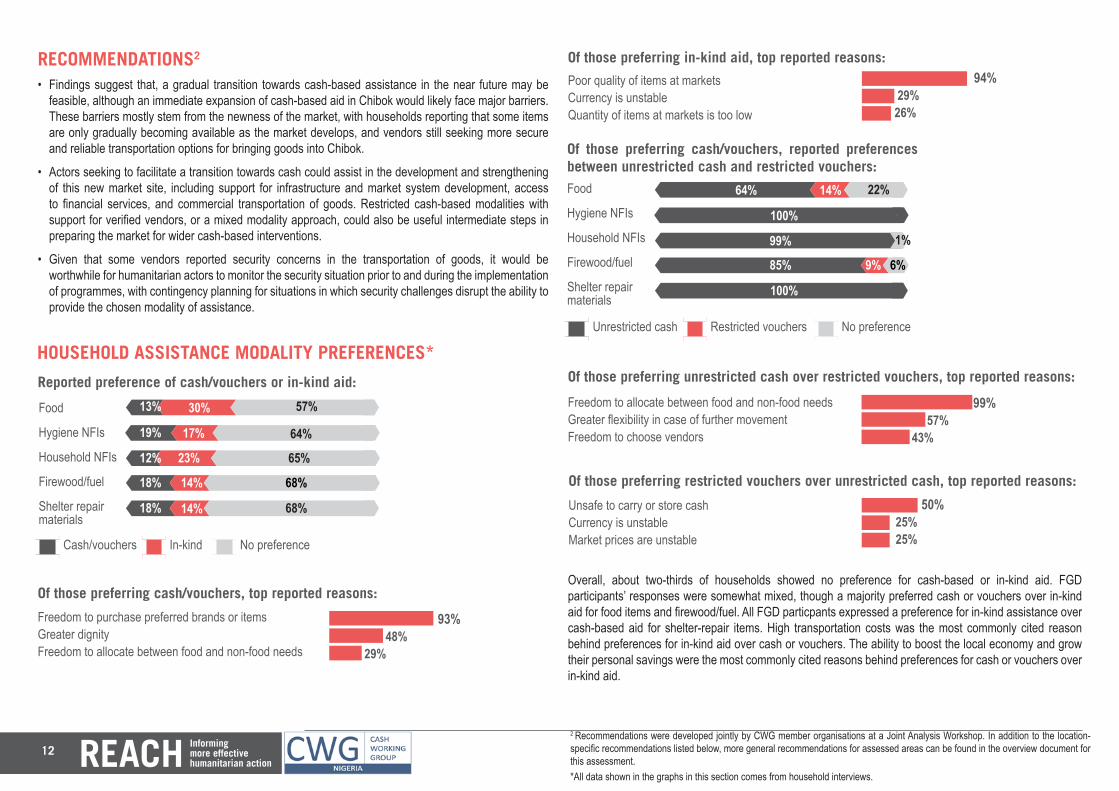
• Findings suggest that, a gradual transition towards cash-based assistance in the near future may be feasible, although an immediate expansion of cash-based aid in Chibok would likely face major barriers. These barriers mostly stem from the newness of the market, with households reporting that some items are only gradually becoming available as the market develops, and vendors still seeking more secure and reliable transportation options for bringing goods into Chibok.
• Actors seeking to facilitate a transition towards cash could assist in the development and strengthening of this new market site, including support for infrastructure and market system development, access to financial services, and commercial transportation of goods. Restricted cash-based modalities with support for verified vendors, or a mixed modality approach, could also be useful intermediate steps in preparing the market for wider cash-based interventions.
• Given that some vendors reported security concerns in the transportation of goods, it would be worthwhile for humanitarian actors to monitor the security situation prior to and during the implementation of programmes, with contingency planning for situations in which security challenges disrupt the ability to provide the chosen modality of assistance.
HOUSEHOLD ASSISTANCE MODALITY PREFERENCES*
Overall, about two-thirds of households showed no preference for cash-based or in-kind aid. FGD participants’ responses were somewhat mixed, though a majority preferred cash or vouchers over in-kind aid for food items and firewood/fuel. All FGD particpants expressed a preference for in-kind assistance over cash-based aid for shelter-repair items. High transportation costs was the most commonly cited reason behind preferences for in-kind aid over cash or vouchers. The ability to boost the local economy and grow their personal savings were the most commonly cited reasons behind preferences for cash or vouchers over in-kind aid.
6060
Reported preference of cash/vouchers or in-kind aid:
Food
Hygiene NFIs
Household NFIs
Firewood/fuel
Shelter repair materials
Of those preferring in-kind aid, top reported reasons:
Poor quality of items at markets Currency is unstable Quantity of items at markets is too low
94+29+26 94% 29% 26%
130300+57060
13% 30% 57%
Of those preferring cash/vouchers, top reported reasons:
Freedom to purchase preferred brands or items Greater dignityFreedom to allocate between food and non-food needs
Cash/vouchers In-kind No preference
190170+640
60
19% 17% 64%
120230+650
60
12% 23% 65%
180140+68018% 14% 68%
18% 14% 68%
93+48+29 93% 48% 29%
2 Recommendations were developed jointly by CWG member organisations at a Joint Analysis Workshop. In addition to the location-specific recommendations listed below, more general recommendations for assessed areas can be found in the overview document for this assessment.
Of those preferring cash/vouchers, reported preferences between unrestricted cash and restricted vouchers:Food
Hygiene NFIs
Household NFIs
Firewood/fuel
Shelter repair materials
Of those preferring restricted vouchers over unrestricted cash, top reported reasons:
Unsafe to carry or store cash Currency is unstable Market prices are unstable
50+25+25 50% 25% 25%
Of those preferring unrestricted cash over restricted vouchers, top reported reasons:99+57+43 99% 57% 43%
Freedom to allocate between food and non-food needs Greater flexibility in case of further movementFreedom to choose vendors
6060
640140+220
60
64% 14% 22%
10000+0
60
100%
99010+0
60
99% 1%
85090+6085% 9% 6%
10000+0100%
Unrestricted cash Restricted vouchers No preference
*All data shown in the graphs in this section comes from household interviews.
13
606060
Primary method of accessing items:
Markets in current location Humanitarian aid Other
Own production/collection No regular source Not needed
Food
Hygiene NFIs
Household NFIs
Firewood/fuel
Shelter repair materials
6060
9800+0+20+098%
82070+0+110+082% 7%
730+600+210+073% 6%
730+0270+0+073% 27%
500+20280+0+20050% 2% 28%
HOUSEHOLD ACCESS TO ITEMS*
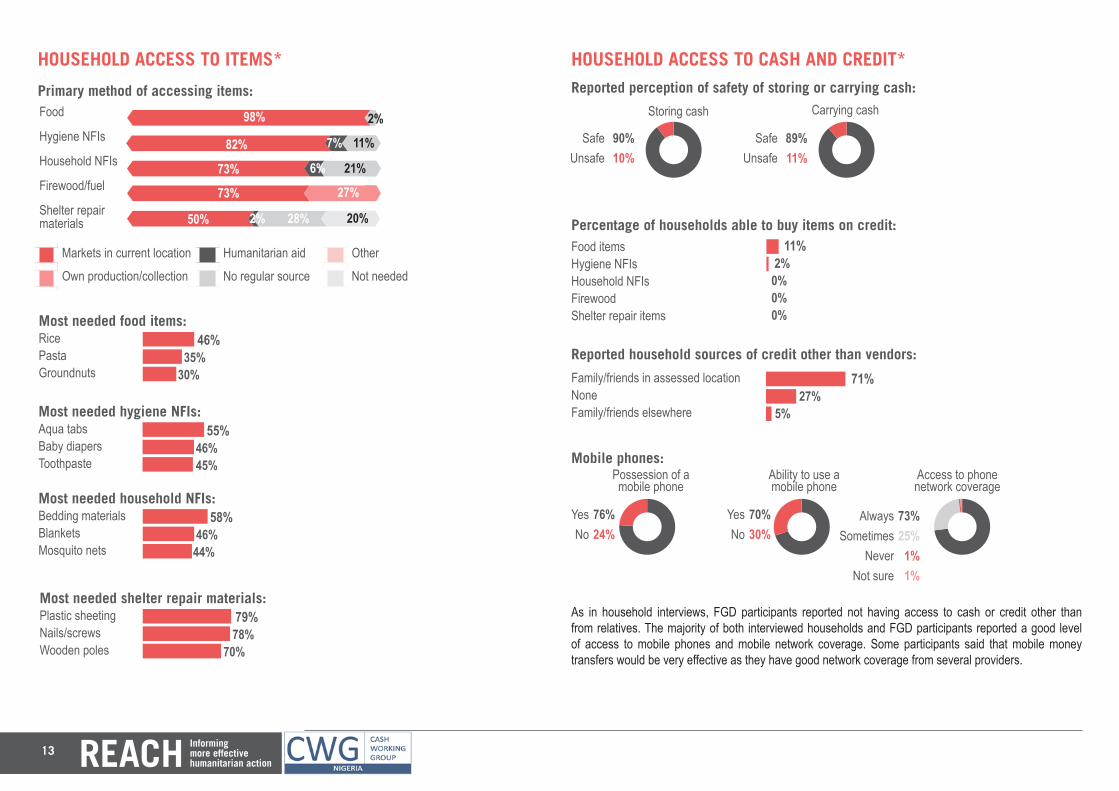
Most needed food items:46+35+30 46% 35% 30%
RicePastaGroundnuts
Most needed hygiene NFIs:55+46+45 55% 46% 45%
Aqua tabsBaby diapersToothpaste
Most needed household NFIs:58+46+44 58% 46% 44%
Bedding materialsBlanketsMosquito nets
Most needed shelter repair materials:79+78+70 79% 78% 70%
Plastic sheetingNails/screwsWooden poles
HOUSEHOLD ACCESS TO CASH AND CREDIT*
As in household interviews, FGD participants reported not having access to cash or credit other than from relatives. The majority of both interviewed households and FGD participants reported a good level of access to mobile phones and mobile network coverage. Some participants said that mobile money transfers would be very effective as they have good network coverage from several providers.
2%
11%
21%
20% Percentage of households able to buy items on credit:Food items Hygiene NFIs Household NFIsFirewoodShelter repair items
11+2+0+0+0 11% 2%0%0%0%
Reported household sources of credit other than vendors:71+27+5Family/friends in assessed locationNoneFamily/friends elsewhere
71% 27% 5%
70+30+zMobile phones:
YesNo 76+24+z
Possession of a mobile phone
76%24%
YesNo
70%30%
Ability to use a mobile phone
AlwaysSometimes
NeverNot sure
73%25%
1%1%
Access to phone network coverage
89+11+zReported perception of safety of storing or carrying cash:
SafeUnsafe 90+10+z
Storing cash Carrying cash
90%10%
SafeUnsafe
89%11%
7325+1+1+z
14
HOUSEHOLD ACCESS TO MARKETS*
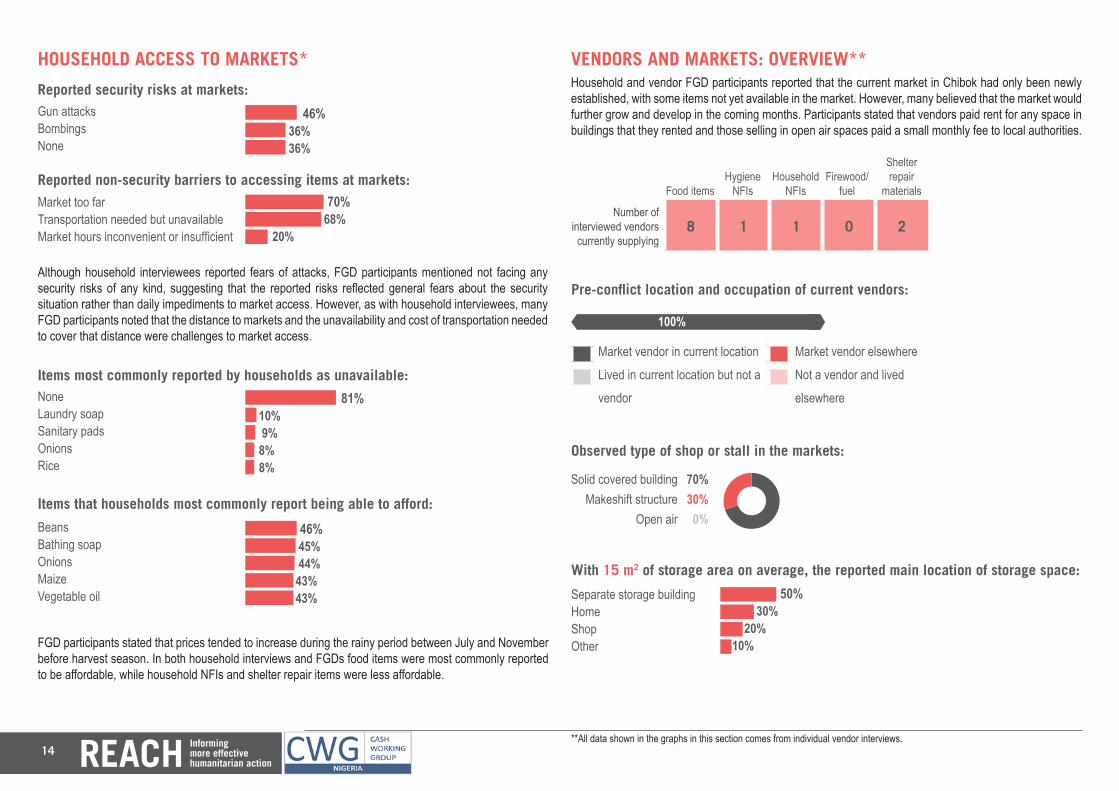
Although household interviewees reported fears of attacks, FGD participants mentioned not facing any security risks of any kind, suggesting that the reported risks reflected general fears about the security situation rather than daily impediments to market access. However, as with household interviewees, many FGD participants noted that the distance to markets and the unavailability and cost of transportation needed to cover that distance were challenges to market access.
Reported non-security barriers to accessing items at markets:
Reported security risks at markets:Gun attacksBombingsNone
46+36+36 46% 36% 36%
Market too farTransportation needed but unavailableMarket hours inconvenient or insufficient
70+68+20 70% 68% 20%
FGD participants stated that prices tended to increase during the rainy period between July and November before harvest season. In both household interviews and FGDs food items were most commonly reported to be affordable, while household NFIs and shelter repair items were less affordable.
Items most commonly reported by households as unavailable:81+10+9+8+8 81%10% 9%8%8%
NoneLaundry soapSanitary padsOnionsRice
Items that households most commonly report being able to afford:46+45+44+43+43 46% 45% 44% 43% 43%
BeansBathing soapOnionsMaizeVegetable oil
VENDORS AND MARKETS: OVERVIEW**Household and vendor FGD participants reported that the current market in Chibok had only been newly established, with some items not yet available in the market. However, many believed that the market would further grow and develop in the coming months. Participants stated that vendors paid rent for any space in buildings that they rented and those selling in open air spaces paid a small monthly fee to local authorities.
Number of interviewed vendors currently supplying
8 1 1 0 2
Food itemsHygiene
NFIsHousehold
NFIsFirewood/
fuel
Shelter repair
materials
Market vendor in current location Market vendor elsewhere
Lived in current location but not a Not a vendor and lived
vendor elsewhere
Pre-conflict location and occupation of current vendors:
10000+0+0
60
100%
Observed type of shop or stall in the markets:
With 15 m2 of storage area on average, the reported main location of storage space:
Solid covered buildingMakeshift structure
Open air 70300z70%30%
0%
Separate storage buildingHomeShopOther
50+30+20+10 50% 30% 20% 10%
**All data shown in the graphs in this section comes from individual vendor interviews.
15
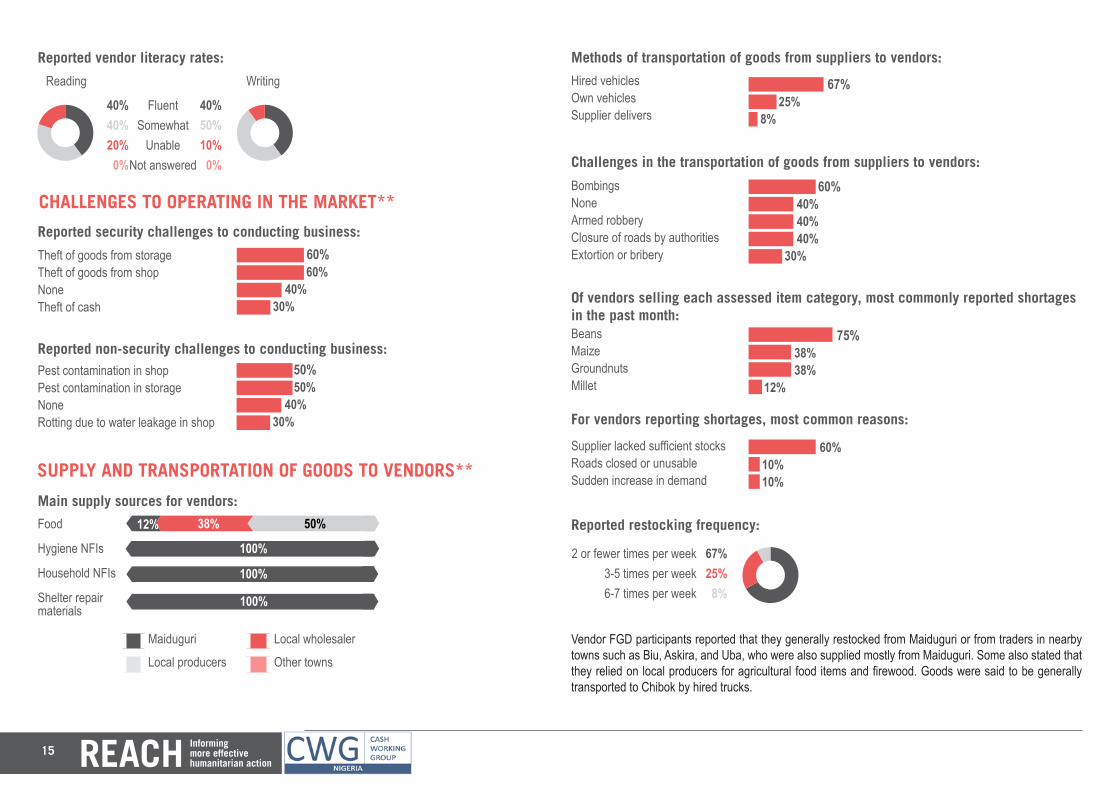
Reported vendor literacy rates:
FluentSomewhat
UnableNot answered
Reading Writing
4050+10+0+z40+4020+0z40%50%10%
0%
40%40%20%
0%
CHALLENGES TO OPERATING IN THE MARKET**
Reported non-security challenges to conducting business:Pest contamination in shopPest contamination in storageNoneRotting due to water leakage in shop
Theft of goods from storageTheft of goods from shopNoneTheft of cash 50+50+40+30 50%
50% 40% 30%
60+60+40+30 60% 60% 40% 30%
Reported security challenges to conducting business:
SUPPLY AND TRANSPORTATION OF GOODS TO VENDORS**
60606060Main supply sources for vendors:
Maiduguri Local wholesaler
Local producers Other towns
120380+500+012% 38%
10000+0+0100%
10000+0+0100%
10000+0+0100%
Food
Hygiene NFIs
Household NFIs
Shelter repair materials
50%
Vendor FGD participants reported that they generally restocked from Maiduguri or from traders in nearby towns such as Biu, Askira, and Uba, who were also supplied mostly from Maiduguri. Some also stated that they relied on local producers for agricultural food items and firewood. Goods were said to be generally transported to Chibok by hired trucks.
Hired vehiclesOwn vehiclesSupplier delivers
67+25+8+ 67% 25% 8%
Methods of transportation of goods from suppliers to vendors:
Challenges in the transportation of goods from suppliers to vendors:
BombingsNoneArmed robberyClosure of roads by authoritiesExtortion or bribery
60+40+40+40+30 60% 40% 40% 40% 30%
Of vendors selling each assessed item category, most commonly reported shortages in the past month: 75+38+38+12+ 75%
38% 38%12%
BeansMaizeGroundnutsMillet
For vendors reporting shortages, most common reasons:60+10+10 60%10%10%
Supplier lacked sufficient stocksRoads closed or unusableSudden increase in demand
Reported restocking frequency:
2 or fewer times per week3-5 times per week6-7 times per week 67258z67%
25%8%
16
VENDOR ACCESS TO CREDIT AND INFORMAL MARKET SYSTEMS**
Most vendor FGD participants mentioned that their suppliers sold to them on credit, albeit at small amounts, and reported no other sources of credit.
Participants also reported that there is a traders’ association for vendors in the market, working on members’ rights and financially contributing to the wedding costs of members getting married. The traders’ association also reportedly helped resolve commercial disputes between members, imposing fines or suspending those who committed offences.
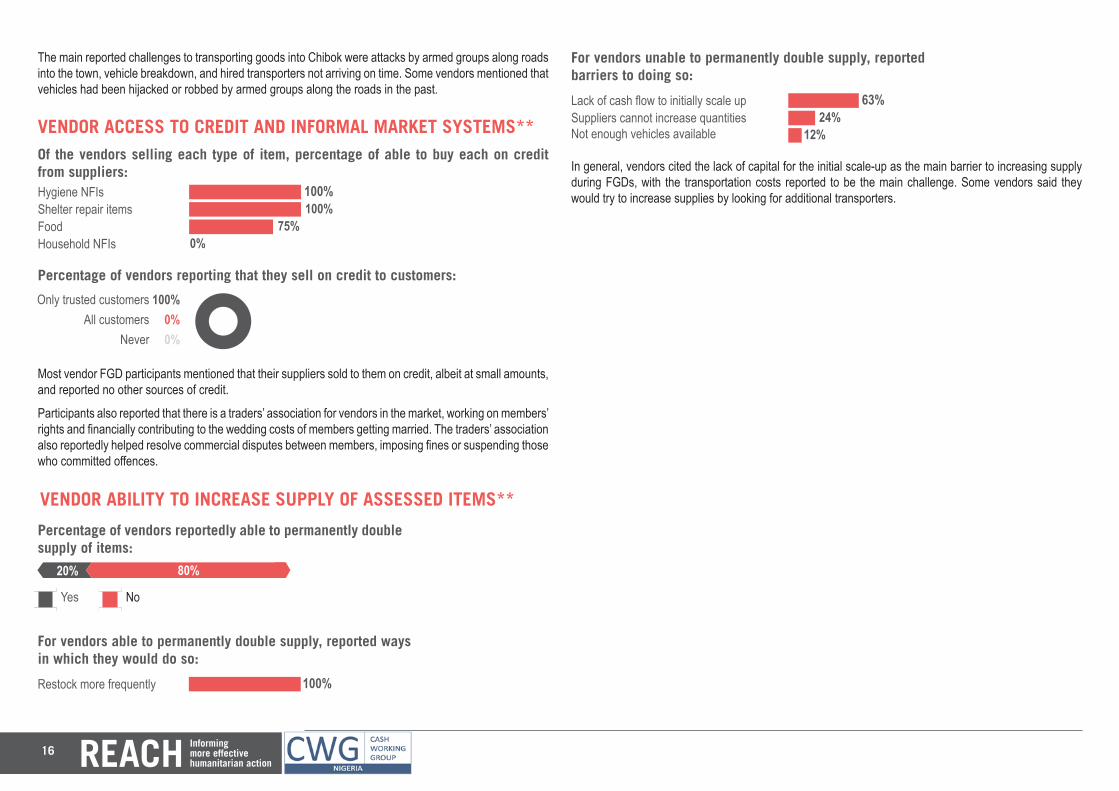
The main reported challenges to transporting goods into Chibok were attacks by armed groups along roads into the town, vehicle breakdown, and hired transporters not arriving on time. Some vendors mentioned that vehicles had been hijacked or robbed by armed groups along the roads in the past.
Of the vendors selling each type of item, percentage of able to buy each on credit from suppliers:Hygiene NFIsShelter repair itemsFoodHousehold NFIs
100+100+75+ 100% 100% 75% 0%
Percentage of vendors reporting that they sell on credit to customers:
Only trusted customersAll customers
Never 10000z100%0%0%
VENDOR ABILITY TO INCREASE SUPPLY OF ASSESSED ITEMS**
Yes No
Percentage of vendors reportedly able to permanently double supply of items:
200800
60
80%20%
For vendors able to permanently double supply, reported ways in which they would do so:
Restock more frequently
100+ 100%
For vendors unable to permanently double supply, reported barriers to doing so:
Lack of cash flow to initially scale upSuppliers cannot increase quantitiesNot enough vehicles available
63+24+12 63% 24% 12%
In general, vendors cited the lack of capital for the initial scale-up as the main barrier to increasing supply during FGDs, with the transportation costs reported to be the main challenge. Some vendors said they would try to increase supplies by looking for additional transporters.
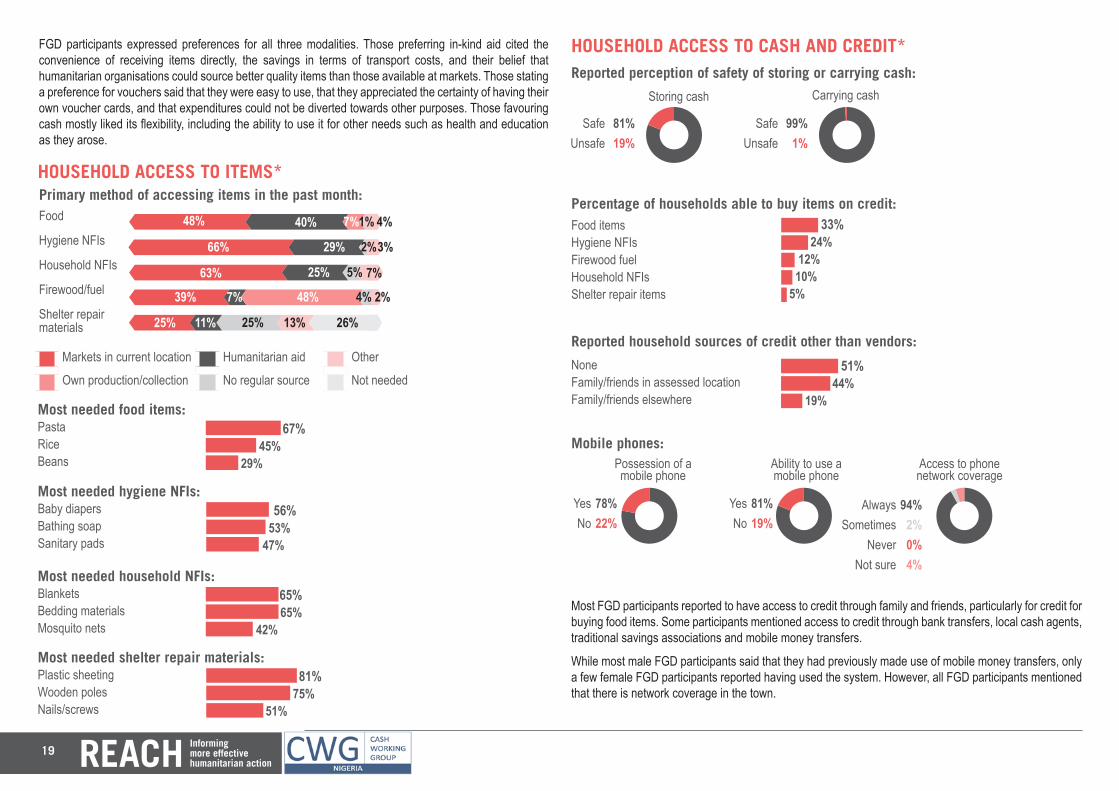
INTRODUCTIONThis situation overview presents findings from the Joint Cash Feasibility Assessment, aimed at identifying the most appropriate assistance modality in towns across Northeast Nigeria for food, hygiene non-food items (NFIs), household NFIs, firewood or fuel, and shelter repair materials.1 The assessment was coordinated by the Cash Working Group (CWG) with support from REACH, and data was collected by 13 CWG member organisations from 1-16 February. In Kukareta and Dikumari, data was collected by IRC and SCI.For Kukareta and Dikumari, 220 household interviews were conducted (116 with IDPs and 104 with non-IDP populations), along with 6 Bulama (traditional community leader) interviews and 4 consumer focus group discussions (FGDs). In addition, 36 interviews and 2 FGDs were conducted with vendors selling the assessed items in these villages, and 2 semi-structured interviews were conducted with heads of traders (an informally-designated spokesperson for market vendors).
Joint Cash Feasibility AssessmentKukareta and Dikumari, Damaturu LGA, Yobe State, February 2018
Findings from household interviews have a confidence level of 95% and a margin of error of 7% when aggregated to the level of the overall town population. When aggregating the data, surveys from each population group (IDPs and non-IDPs) were weighted based on estimated population size and number of surveys per group, in order to ensure responses were not skewed towards any particular group. Household data focused on household assistance modality preferences and access to items, cash, and markets.Vendor interviews focused on vendor capacity to respond to an increase in demand for assessed items, sources of supply, and barriers to conducting business. Findings based on data from individual vendor interviews and FGDs with both households and vendors are indicative rather than generalisable.Key findings and recommendations for Kukareta and Dikumari are provided below. These recommendations were developed by CWG members during a joint analysis workshop. In addition, more general findings and recommendations applying to all assessed areas can be found in the overview document for this assessment.
KEY FINDINGS• The majority of households in Kukareta and Dikumari reported a preference for cash-based over in-kind aid,
most commonly due to the freedom of choice and flexibility of cash-based assistance. Of those preferring cash-based aid, only a slight majority preferred unrestricted cash, for similar reasons. The most common reasons for preferring in-kind aid, or for preferring vouchers over unrestricted cash, were concerns about cash being diverted towards non-essential expenditures and the instability of market prices.
• Markets in the assessed towns were reported as the main source of items, other than firewood, which was most commonly gathered from nearby bush areas, and shelter repair items. However, substantial minorities of households reported relying on humanitarian aid as their main sources of food and, to a lesser extent, hygiene and household NFIs.
• Vendors most commonly restocked from Damaturu, although some items were also sourced from Potiskum, Maiduguri, and Kano. The main challenges to restocking were the high number of checkpoints in the area, at which vendors reported frequent delays and required payments, and insufficient numbers of professional transporters. Some vendors also reported cash flow challenges. However, despite these challenges, most vendors estimated that they could increase the supply of items. Other indicators, such as vendor access to credit and proximity to the state capital of Damaturu also suggest that this may be possible.
• While household interviewees did not report access to sources of credit other than borrowing from relatives and friends, FGD participants reported that other sources of cash and credit were present in the assessed villages, including local cash agents, traditional savings groups, and mobile money transfers.
• The vast majority of households and vendors in both assessed villages did not report security or other barriers to market access. While some vendors mentioned that security had been a problem in the past, vendors now paid a small monthly fee to local groups to help secure the market.
Map 1: Location of Kukareta and Dikumari in Yobe State
1 Hygiene NFIs include items such as soap and laundry powder. Household NFIs include items such as bedding materials, mosquito nets, and cooking utensils. Shelter repair materials include items such as plastic sheeting, nails/screws, and wooden poles.
18
620330+50
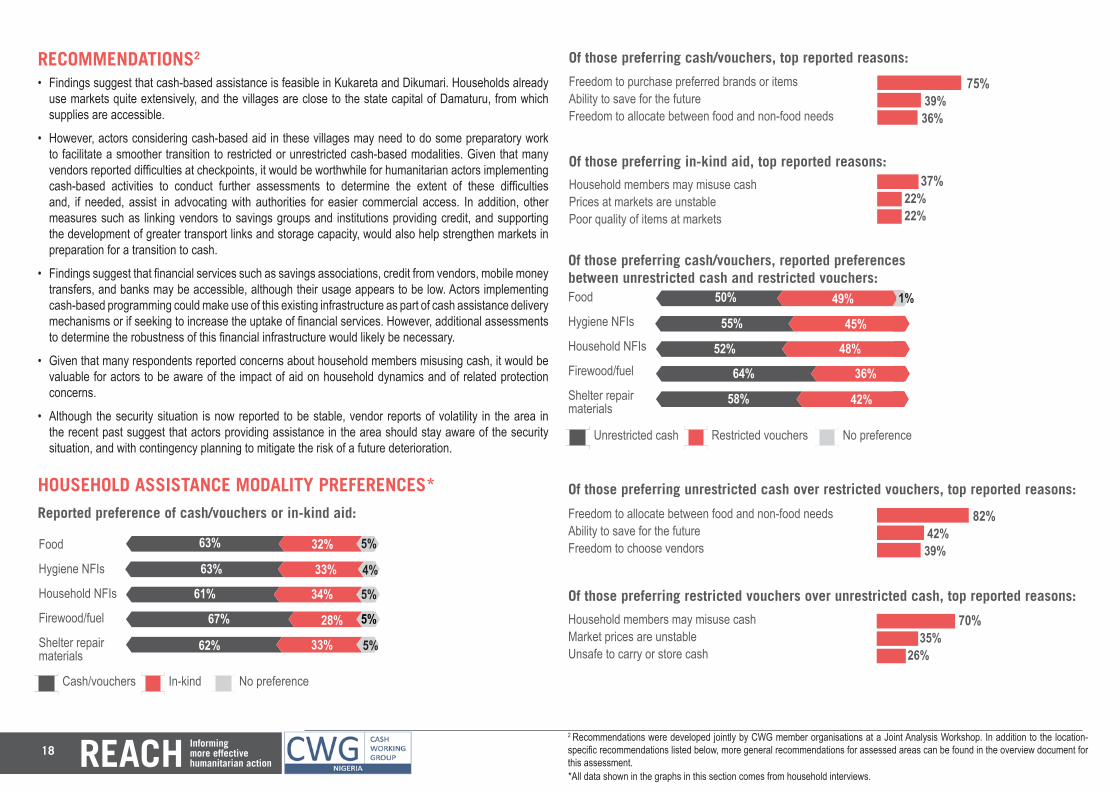
RECOMMENDATIONS2
• Findings suggest that cash-based assistance is feasible in Kukareta and Dikumari. Households already use markets quite extensively, and the villages are close to the state capital of Damaturu, from which supplies are accessible.
• However, actors considering cash-based aid in these villages may need to do some preparatory work to facilitate a smoother transition to restricted or unrestricted cash-based modalities. Given that many vendors reported difficulties at checkpoints, it would be worthwhile for humanitarian actors implementing cash-based activities to conduct further assessments to determine the extent of these difficulties and, if needed, assist in advocating with authorities for easier commercial access. In addition, other measures such as linking vendors to savings groups and institutions providing credit, and supporting the development of greater transport links and storage capacity, would also help strengthen markets in preparation for a transition to cash.
• Findings suggest that financial services such as savings associations, credit from vendors, mobile money transfers, and banks may be accessible, although their usage appears to be low. Actors implementing cash-based programming could make use of this existing infrastructure as part of cash assistance delivery mechanisms or if seeking to increase the uptake of financial services. However, additional assessments to determine the robustness of this financial infrastructure would likely be necessary.
• Given that many respondents reported concerns about household members misusing cash, it would be valuable for actors to be aware of the impact of aid on household dynamics and of related protection concerns.
• Although the security situation is now reported to be stable, vendor reports of volatility in the area in the recent past suggest that actors providing assistance in the area should stay aware of the security situation, and with contingency planning to mitigate the risk of a future deterioration.
HOUSEHOLD ASSISTANCE MODALITY PREFERENCES*
6060
Reported preference of cash/vouchers or in-kind aid:
Food
Hygiene NFIs
Household NFIs
Firewood/fuel
Shelter repair materials
Of those preferring in-kind aid, top reported reasons:
Household members may misuse cash Prices at markets are unstable Poor quality of items at markets
37+22+22 37% 22% 22%
630320+50
60
63% 32% 5%
Of those preferring cash/vouchers, top reported reasons:
Freedom to purchase preferred brands or items Ability to save for the futureFreedom to allocate between food and non-food needs
Cash/vouchers In-kind No preference
630330+40
60
63% 33% 4%
610340+50
60
61% 34% 5%
670280+5067% 28% 5%
62% 33% 5%
75+39+36 75% 39% 36%
2 Recommendations were developed jointly by CWG member organisations at a Joint Analysis Workshop. In addition to the location-specific recommendations listed below, more general recommendations for assessed areas can be found in the overview document for this assessment.
Of those preferring cash/vouchers, reported preferences between unrestricted cash and restricted vouchers:Food
Hygiene NFIs
Household NFIs
Firewood/fuel
Shelter repair materials
Of those preferring restricted vouchers over unrestricted cash, top reported reasons:
Household members may misuse cash Market prices are unstable Unsafe to carry or store cash
70+37+26 70% 35% 26%
Of those preferring unrestricted cash over restricted vouchers, top reported reasons:82+42+39 82% 42% 39%
Freedom to allocate between food and non-food needs Ability to save for the futureFreedom to choose vendors
6060
500490+10
60
50% 49% 1%
550450
60
55% 45%
520480
60
52% 48%
64036064% 36%
58042058% 42%
Unrestricted cash Restricted vouchers No preference
*All data shown in the graphs in this section comes from household interviews.
19
Primary method of accessing items in the past month:
Markets in current location Humanitarian aid Other
Own production/collection No regular source Not needed
Food
Hygiene NFIs
Household NFIs
Firewood/fuel
Shelter repair materials
6060
480400+70+10+40
60
48% 40% 7%
660290+0+20+30
60
66% 29%
630+2500+50+70
60
63% 25%
390+70480+40+2039% 7% 48%
250+110250+130+26025% 11% 25%
HOUSEHOLD ACCESS TO ITEMS*
Most needed food items: 67+45+29 67% 45% 29%
PastaRiceBeans
Most needed hygiene NFIs: 56+53+47 56% 53% 47%
Baby diapersBathing soapSanitary pads
Most needed household NFIs:65+65+42 65% 65% 42%
BlanketsBedding materialsMosquito nets
Most needed shelter repair materials:81+75+51 81% 75% 51%
Plastic sheetingWooden polesNails/screws
HOUSEHOLD ACCESS TO CASH AND CREDIT*
Most FGD participants reported to have access to credit through family and friends, particularly for credit for buying food items. Some participants mentioned access to credit through bank transfers, local cash agents, traditional savings associations and mobile money transfers.
While most male FGD participants said that they had previously made use of mobile money transfers, only a few female FGD participants reported having used the system. However, all FGD participants mentioned that there is network coverage in the town.
1%
2%
5%
4%
13%
4%
3%
7%
2%
26%
FGD participants expressed preferences for all three modalities. Those preferring in-kind aid cited the convenience of receiving items directly, the savings in terms of transport costs, and their belief that humanitarian organisations could source better quality items than those available at markets. Those stating a preference for vouchers said that they were easy to use, that they appreciated the certainty of having their own voucher cards, and that expenditures could not be diverted towards other purposes. Those favouring cash mostly liked its flexibility, including the ability to use it for other needs such as health and education as they arose.
Percentage of households able to buy items on credit:Food items Hygiene NFIs Firewood fuelHousehold NFIsShelter repair items
33+24+12+10+5 33% 24% 12% 10% 5%
Reported household sources of credit other than vendors:51+44+19NoneFamily/friends in assessed locationFamily/friends elsewhere
51% 44% 19%
81+19+zMobile phones:
YesNo 78+22+z
Possession of a mobile phone
78%22%
YesNo
81%19%
Ability to use a mobile phone
AlwaysSometimes
NeverNot sure
94%2%0%4%
Access to phone network coverage
99+1+zReported perception of safety of storing or carrying cash:
SafeUnsafe 81+19+z
Storing cash Carrying cash
81%19%
SafeUnsafe
99%1%
923+5+z
20
HOUSEHOLD ACCESS TO MARKETS*
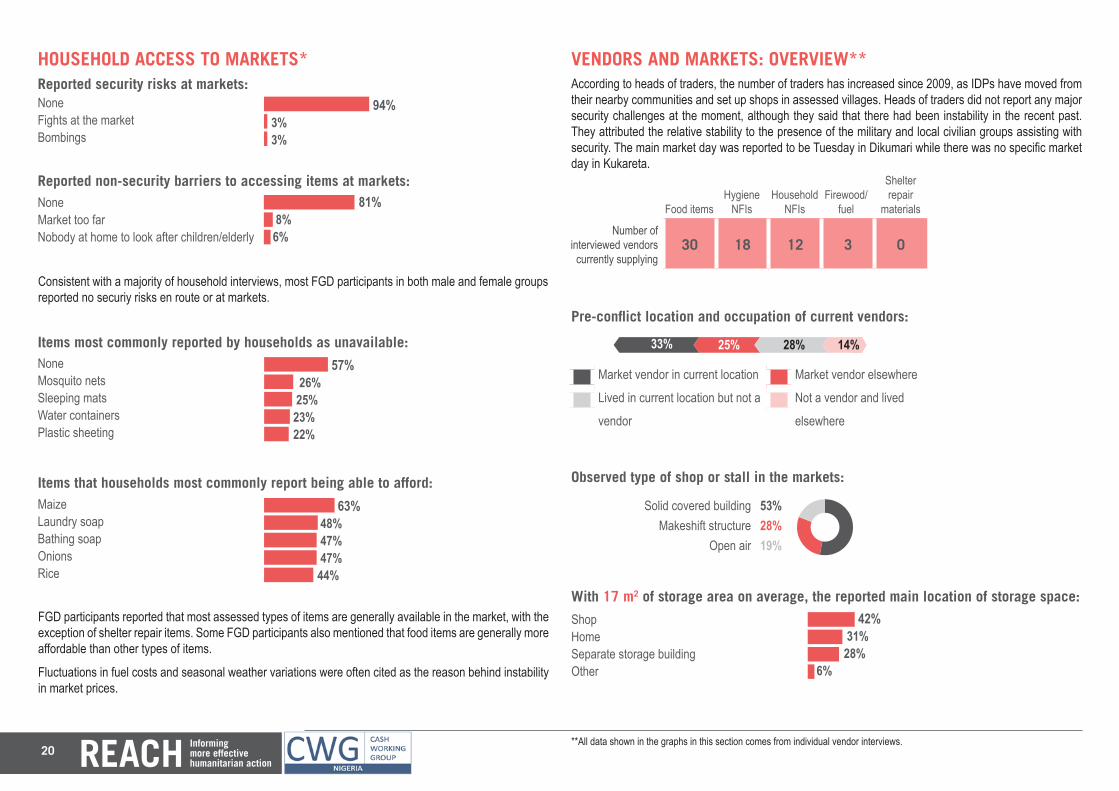
Consistent with a majority of household interviews, most FGD participants in both male and female groups reported no securiy risks en route or at markets.
Reported non-security barriers to accessing items at markets:
Reported security risks at markets: 94+3+3NoneFights at the marketBombings
94% 3% 3%81+8+6None
Market too farNobody at home to look after children/elderly
81% 8% 6%
FGD participants reported that most assessed types of items are generally available in the market, with the exception of shelter repair items. Some FGD participants also mentioned that food items are generally more affordable than other types of items.
Fluctuations in fuel costs and seasonal weather variations were often cited as the reason behind instability in market prices.
Items most commonly reported by households as unavailable:57+26+25+23+22 57% 26% 25% 23% 22%
NoneMosquito netsSleeping matsWater containersPlastic sheeting
Items that households most commonly report being able to afford:63+48+47+47+44 63% 48% 47% 47% 44%
MaizeLaundry soapBathing soapOnionsRice
VENDORS AND MARKETS: OVERVIEW**According to heads of traders, the number of traders has increased since 2009, as IDPs have moved from their nearby communities and set up shops in assessed villages. Heads of traders did not report any major security challenges at the moment, although they said that there had been instability in the recent past. They attributed the relative stability to the presence of the military and local civilian groups assisting with security. The main market day was reported to be Tuesday in Dikumari while there was no specific market day in Kukareta.
Number of interviewed vendors currently supplying
30 18 12 3 0
Food itemsHygiene
NFIsHousehold
NFIsFirewood/
fuel
Shelter repair
materials
Market vendor in current location Market vendor elsewhere
Lived in current location but not a Not a vendor and lived
vendor elsewhere
Pre-conflict location and occupation of current vendors:
330250+280+140
60
33% 25% 28% 14%
42+31+28+6Observed type of shop or stall in the markets:
With 17 m2 of storage area on average, the reported main location of storage space:
Solid covered buildingMakeshift structure
Open air 532819z53%28%19%
ShopHomeSeparate storage buildingOther
42% 31% 28% 6%
**All data shown in the graphs in this section comes from individual vendor interviews.
21
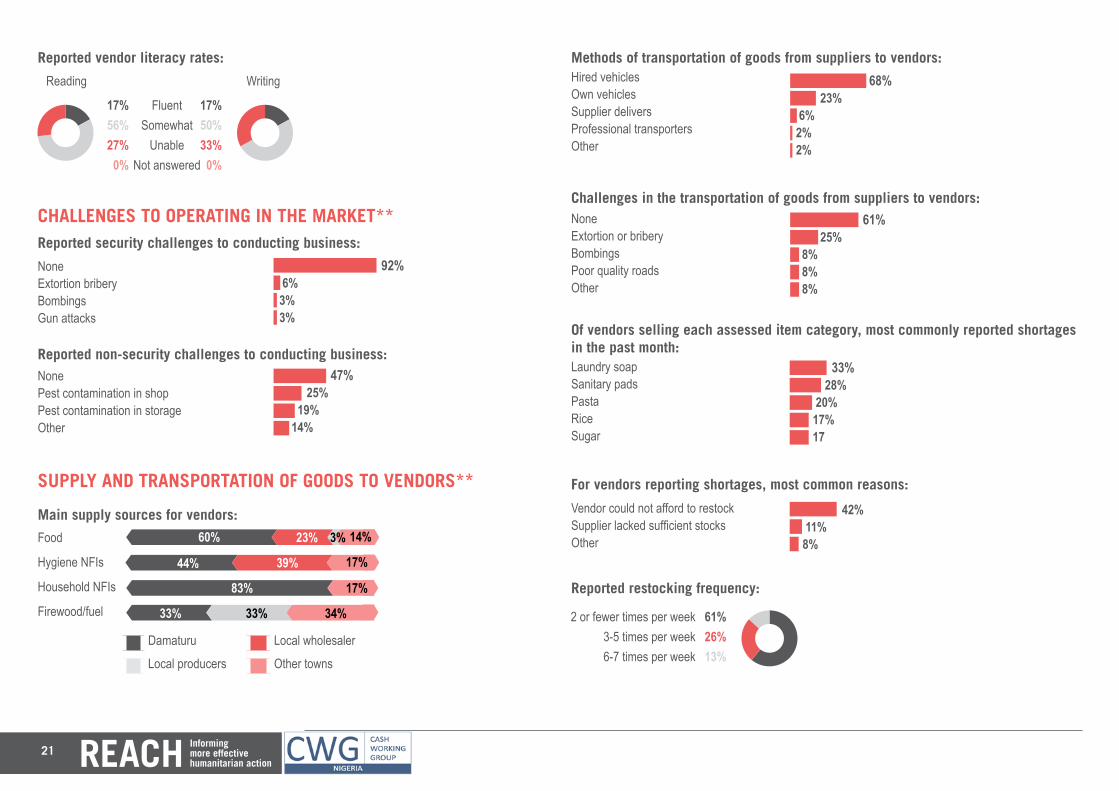
Reported vendor literacy rates:
FluentSomewhat
UnableNot answered
Reading Writing
1750+33+0+z17+5627+0z17%50%33%
0%
17%56%27%
0%
CHALLENGES TO OPERATING IN THE MARKET**
Reported non-security challenges to conducting business:NonePest contamination in shopPest contamination in storageOther
NoneExtortion briberyBombingsGun attacks 47+25+19+14
92+6+3+3
47% 25% 19% 14%
92% 6% 3% 3%
Reported security challenges to conducting business:
SUPPLY AND TRANSPORTATION OF GOODS TO VENDORS**
60606060Main supply sources for vendors:
Damaturu Local wholesaler
Local producers Other towns
600230+30+14060% 23%
440390+0+17044% 39%
8300+0+17083%
3300+330+34033% 33%
Food
Hygiene NFIs
Household NFIs
Firewood/fuel
3%
34%
17%
17%
14%
Hired vehiclesOwn vehiclesSupplier deliversProfessional transportersOther
68+23+6+2+2 68% 23% 6% 2% 2%
Methods of transportation of goods from suppliers to vendors:
Challenges in the transportation of goods from suppliers to vendors:NoneExtortion or briberyBombingsPoor quality roadsOther
61+25+8+8+8 61% 25% 8% 8% 8%
Of vendors selling each assessed item category, most commonly reported shortages in the past month: 33+28+20+17+17 33%
28% 20%17%17
Laundry soapSanitary padsPastaRiceSugar
For vendors reporting shortages, most common reasons:42+11+8 42% 11% 8%
Vendor could not afford to restockSupplier lacked sufficient stocksOther
Reported restocking frequency:
2 or fewer times per week3-5 times per week6-7 times per week 612613z61%
26%13%
22
Vendor FGD participants reported that vendors were mostly supplied from Damaturu town, with some also getting goods from Potiskum, Maiduguri, and occasionally Kano. Suppliers were reportedly chosen mostly based on perceived reliability and trustworthiness, as well as the prices at which they sold goods. Vendors usually travelled to their supply locations and then hired vehicles such as taxis and three-wheelers to bring back goods, although larger cars were more commonly used when restocking from further off places like Maiduguri and Kano.
The main transportation challenge reported by FGD participants was the high number of checkpoints along roads in the area. Participants reported facing delays and being required to make payments at checkpoints. The lack of professional transporters travelling to these villages was also cited by participants as a difficulty.
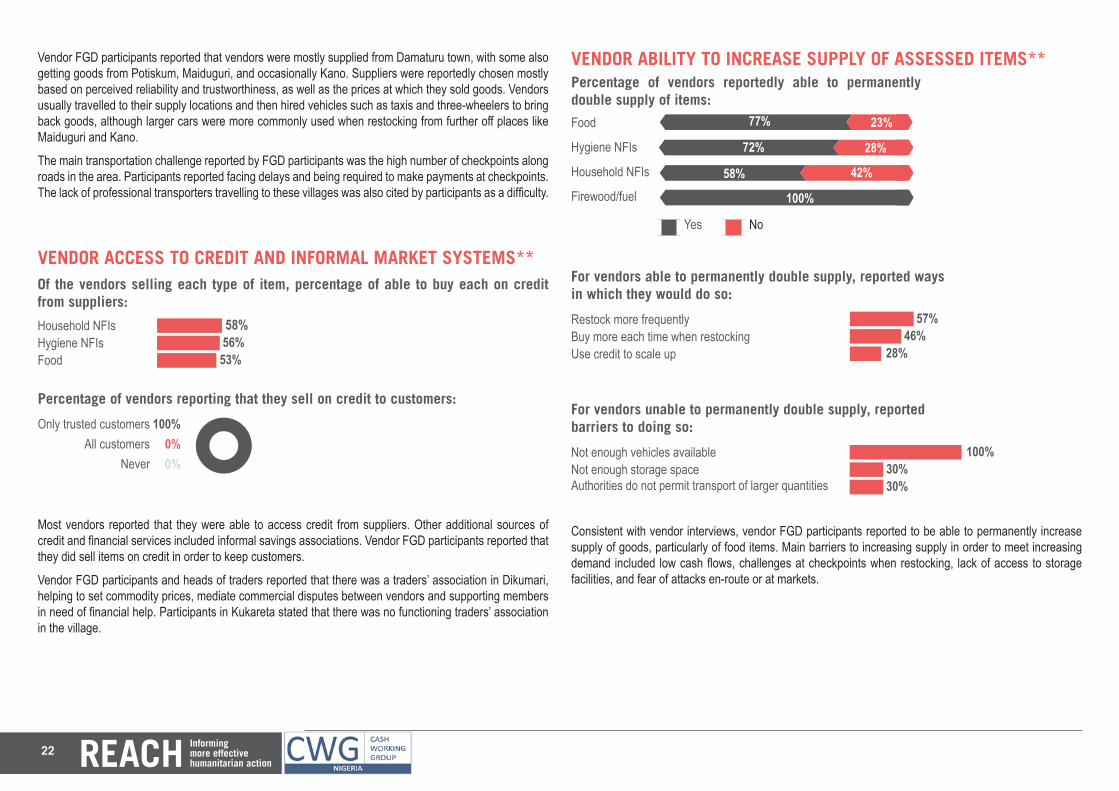
VENDOR ACCESS TO CREDIT AND INFORMAL MARKET SYSTEMS**
Most vendors reported that they were able to access credit from suppliers. Other additional sources of credit and financial services included informal savings associations. Vendor FGD participants reported that they did sell items on credit in order to keep customers.
Vendor FGD participants and heads of traders reported that there was a traders’ association in Dikumari, helping to set commodity prices, mediate commercial disputes between vendors and supporting members in need of financial help. Participants in Kukareta stated that there was no functioning traders’ association in the village.
Of the vendors selling each type of item, percentage of able to buy each on credit from suppliers:
Household NFIsHygiene NFIsFood
58+56+53+ 58% 56% 53%
Percentage of vendors reporting that they sell on credit to customers:
Only trusted customersAll customers
Never 10000z100%0%0%
VENDOR ABILITY TO INCREASE SUPPLY OF ASSESSED ITEMS**
Yes No
Percentage of vendors reportedly able to permanently double supply of items:
60
770230
60
77% 23%
720280
60
72% 28%
580420
60
58% 42%
10000100%
Food
Hygiene NFIs
Household NFIs
Firewood/fuel
For vendors able to permanently double supply, reported ways in which they would do so:
Restock more frequentlyBuy more each time when restockingUse credit to scale up
57+46+28 57% 46% 28%
For vendors unable to permanently double supply, reported barriers to doing so:
Not enough vehicles availableNot enough storage spaceAuthorities do not permit transport of larger quantities
100+30+30 100% 30% 30%
Consistent with vendor interviews, vendor FGD participants reported to be able to permanently increase supply of goods, particularly of food items. Main barriers to increasing supply in order to meet increasing demand included low cash flows, challenges at checkpoints when restocking, lack of access to storage facilities, and fear of attacks en-route or at markets.
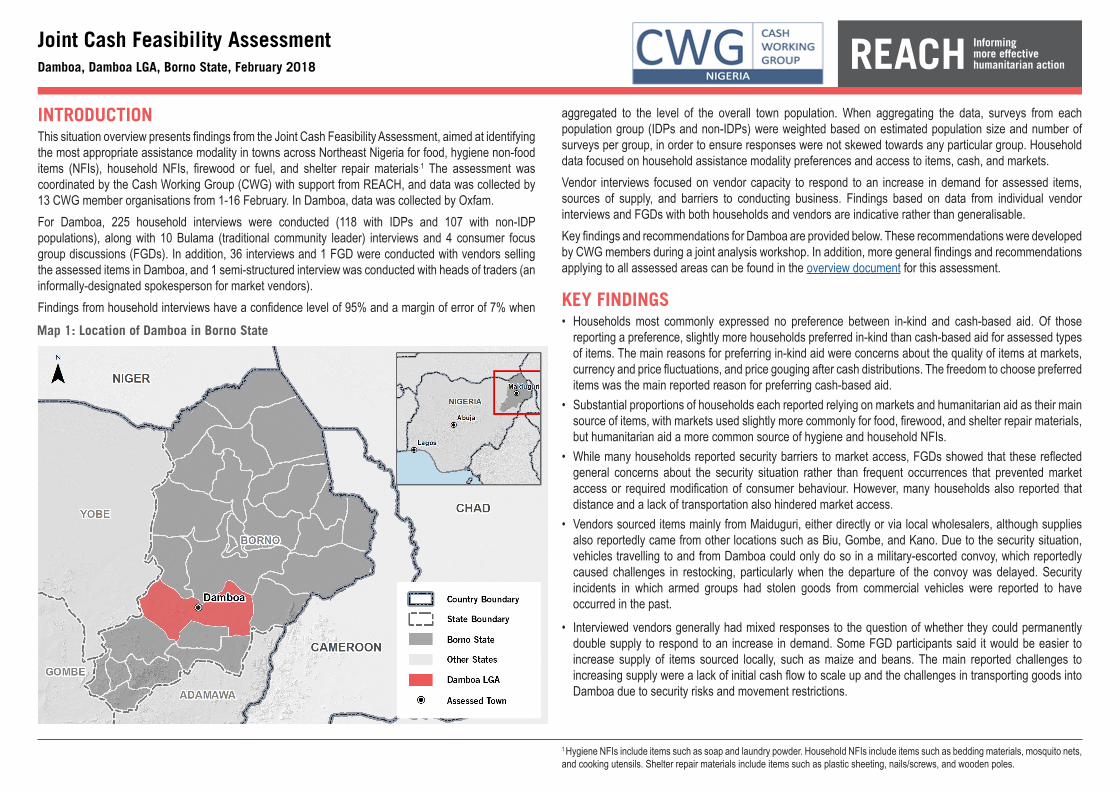
INTRODUCTIONThis situation overview presents findings from the Joint Cash Feasibility Assessment, aimed at identifying the most appropriate assistance modality in towns across Northeast Nigeria for food, hygiene non-food items (NFIs), household NFIs, firewood or fuel, and shelter repair materials.1 The assessment was coordinated by the Cash Working Group (CWG) with support from REACH, and data was collected by 13 CWG member organisations from 1-16 February. In Damboa, data was collected by Oxfam.For Damboa, 225 household interviews were conducted (118 with IDPs and 107 with non-IDP populations), along with 10 Bulama (traditional community leader) interviews and 4 consumer focus group discussions (FGDs). In addition, 36 interviews and 1 FGD were conducted with vendors selling the assessed items in Damboa, and 1 semi-structured interview was conducted with heads of traders (an informally-designated spokesperson for market vendors).Findings from household interviews have a confidence level of 95% and a margin of error of 7% when
Joint Cash Feasibility AssessmentDamboa, Damboa LGA, Borno State, February 2018
aggregated to the level of the overall town population. When aggregating the data, surveys from each population group (IDPs and non-IDPs) were weighted based on estimated population size and number of surveys per group, in order to ensure responses were not skewed towards any particular group. Household data focused on household assistance modality preferences and access to items, cash, and markets.Vendor interviews focused on vendor capacity to respond to an increase in demand for assessed items, sources of supply, and barriers to conducting business. Findings based on data from individual vendor interviews and FGDs with both households and vendors are indicative rather than generalisable.Key findings and recommendations for Damboa are provided below. These recommendations were developed by CWG members during a joint analysis workshop. In addition, more general findings and recommendations applying to all assessed areas can be found in the overview document for this assessment.
KEY FINDINGS• Households most commonly expressed no preference between in-kind and cash-based aid. Of those
reporting a preference, slightly more households preferred in-kind than cash-based aid for assessed types of items. The main reasons for preferring in-kind aid were concerns about the quality of items at markets, currency and price fluctuations, and price gouging after cash distributions. The freedom to choose preferred items was the main reported reason for preferring cash-based aid.
• Substantial proportions of households each reported relying on markets and humanitarian aid as their main source of items, with markets used slightly more commonly for food, firewood, and shelter repair materials, but humanitarian aid a more common source of hygiene and household NFIs.
• While many households reported security barriers to market access, FGDs showed that these reflected general concerns about the security situation rather than frequent occurrences that prevented market access or required modification of consumer behaviour. However, many households also reported that distance and a lack of transportation also hindered market access.
• Vendors sourced items mainly from Maiduguri, either directly or via local wholesalers, although supplies also reportedly came from other locations such as Biu, Gombe, and Kano. Due to the security situation, vehicles travelling to and from Damboa could only do so in a military-escorted convoy, which reportedly caused challenges in restocking, particularly when the departure of the convoy was delayed. Security incidents in which armed groups had stolen goods from commercial vehicles were reported to have occurred in the past.
• Interviewed vendors generally had mixed responses to the question of whether they could permanently double supply to respond to an increase in demand. Some FGD participants said it would be easier to increase supply of items sourced locally, such as maize and beans. The main reported challenges to increasing supply were a lack of initial cash flow to scale up and the challenges in transporting goods into Damboa due to security risks and movement restrictions.
Map 1: Location of Damboa in Borno State
1 Hygiene NFIs include items such as soap and laundry powder. Household NFIs include items such as bedding materials, mosquito nets, and cooking utensils. Shelter repair materials include items such as plastic sheeting, nails/screws, and wooden poles.
24
220310+470
RECOMMENDATIONS2
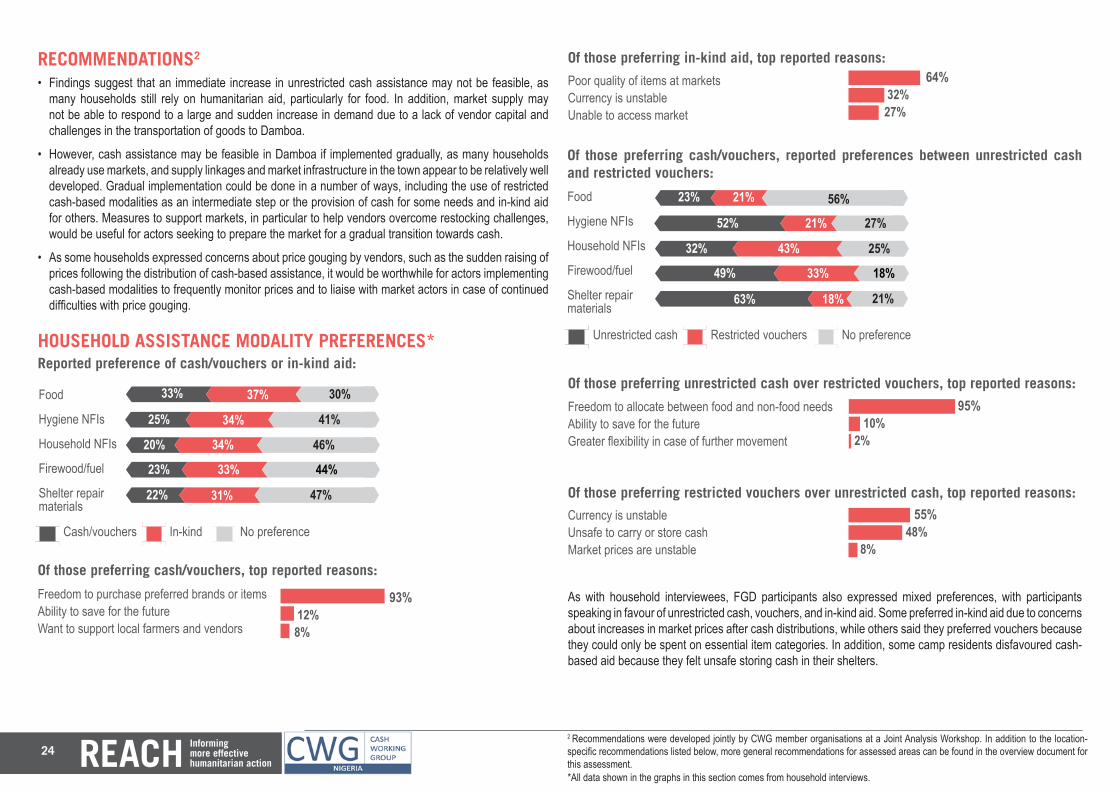
• Findings suggest that an immediate increase in unrestricted cash assistance may not be feasible, as many households still rely on humanitarian aid, particularly for food. In addition, market supply may not be able to respond to a large and sudden increase in demand due to a lack of vendor capital and challenges in the transportation of goods to Damboa.
• However, cash assistance may be feasible in Damboa if implemented gradually, as many households already use markets, and supply linkages and market infrastructure in the town appear to be relatively well developed. Gradual implementation could be done in a number of ways, including the use of restricted cash-based modalities as an intermediate step or the provision of cash for some needs and in-kind aid for others. Measures to support markets, in particular to help vendors overcome restocking challenges, would be useful for actors seeking to prepare the market for a gradual transition towards cash.
• As some households expressed concerns about price gouging by vendors, such as the sudden raising of prices following the distribution of cash-based assistance, it would be worthwhile for actors implementing cash-based modalities to frequently monitor prices and to liaise with market actors in case of continued difficulties with price gouging.
HOUSEHOLD ASSISTANCE MODALITY PREFERENCES*
As with household interviewees, FGD participants also expressed mixed preferences, with participants speaking in favour of unrestricted cash, vouchers, and in-kind aid. Some preferred in-kind aid due to concerns about increases in market prices after cash distributions, while others said they preferred vouchers because they could only be spent on essential item categories. In addition, some camp residents disfavoured cash-based aid because they felt unsafe storing cash in their shelters.
6060
Reported preference of cash/vouchers or in-kind aid:
Food
Hygiene NFIs
Household NFIs
Firewood/fuel
Shelter repair materials
Of those preferring in-kind aid, top reported reasons:
Poor quality of items at markets Currency is unstable Unable to access market
64+32+27 64% 32% 27%
330370+30060
33% 37% 30%
Of those preferring cash/vouchers, top reported reasons:
Freedom to purchase preferred brands or items Ability to save for the futureWant to support local farmers and vendors
Cash/vouchers In-kind No preference
250340+410
60
25% 34% 41%
200340+460
60
20% 34% 46%
230330+44023% 33% 44%
22% 31% 47%93+12+8 93% 12%8%
2 Recommendations were developed jointly by CWG member organisations at a Joint Analysis Workshop. In addition to the location-specific recommendations listed below, more general recommendations for assessed areas can be found in the overview document for this assessment.
Of those preferring cash/vouchers, reported preferences between unrestricted cash and restricted vouchers:
Food
Hygiene NFIs
Household NFIs
Firewood/fuel
Shelter repair materials
Of those preferring restricted vouchers over unrestricted cash, top reported reasons:
Currency is unstable Unsafe to carry or store cash Market prices are unstable
55+48+8 55% 48%8%
Of those preferring unrestricted cash over restricted vouchers, top reported reasons:95+10+2 95% 10% 2%
Freedom to allocate between food and non-food needs Ability to save for the futureGreater flexibility in case of further movement
6060
230210+560
60
23% 56%21%
520210+270
60
52% 21% 27%
320430+250
60
32% 43% 25%
490330+18049% 33% 18%
630160+21063% 18% 21%
Unrestricted cash Restricted vouchers No preference
*All data shown in the graphs in this section comes from household interviews.
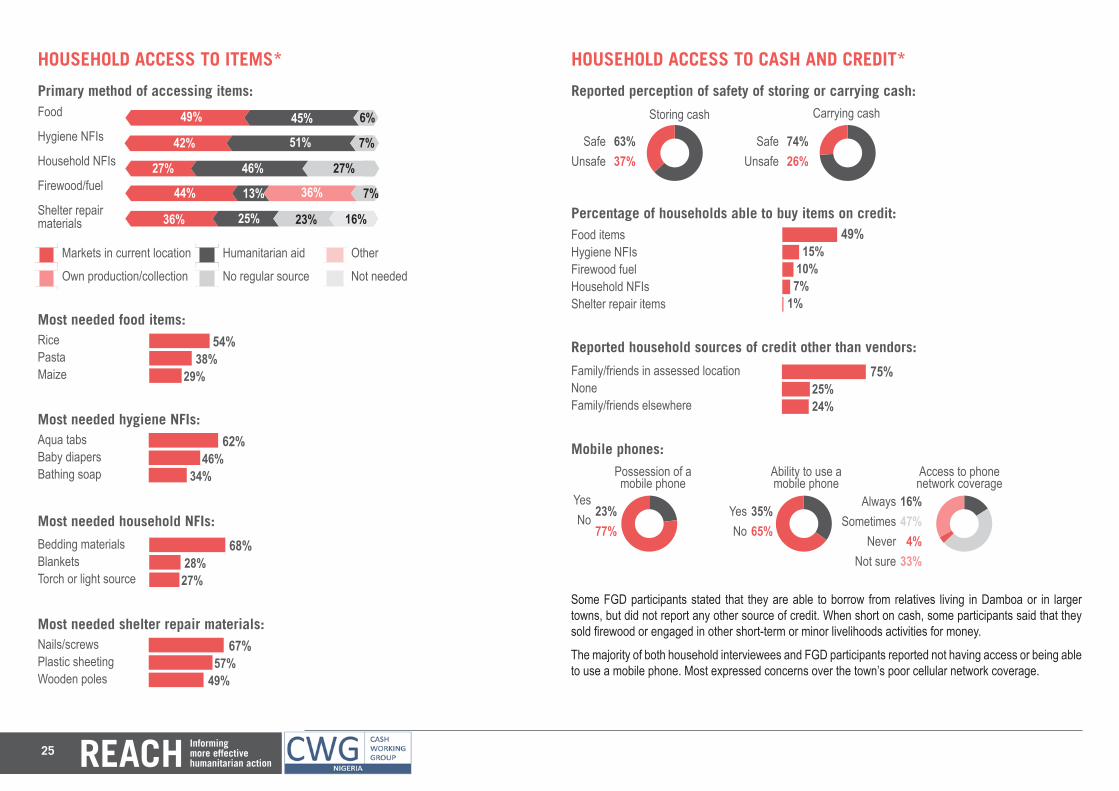
25
Primary method of accessing items:
Markets in current location Humanitarian aid Other
Own production/collection No regular source Not needed
HOUSEHOLD ACCESS TO ITEMS*
Most needed food items:54+38+29 54% 38% 29%
RicePastaMaize
Most needed hygiene NFIs:62+46+34 62% 46% 34%
Aqua tabsBaby diapersBathing soap
Most needed household NFIs:68+28+27 68% 28% 27%
Bedding materialsBlanketsTorch or light source
Most needed shelter repair materials:67+57+49 67% 57% 49%
Nails/screwsPlastic sheetingWooden poles
HOUSEHOLD ACCESS TO CASH AND CREDIT*
Some FGD participants stated that they are able to borrow from relatives living in Damboa or in larger towns, but did not report any other source of credit. When short on cash, some participants said that they sold firewood or engaged in other short-term or minor livelihoods activities for money.
The majority of both household interviewees and FGD participants reported not having access or being able to use a mobile phone. Most expressed concerns over the town’s poor cellular network coverage.
Food
Hygiene NFIs
Household NFIs
Firewood/fuel
Shelter repair materials
6060
490450+0+60+0
60
49% 45%
420510+0+70+0
60
42% 51%
270+4600+270+0
60
27% 46%
440+130360+70+044% 13% 36%
360+250230+0+16036% 25% 23%
6%
7%
27%
7%
16% Percentage of households able to buy items on credit:Food items Hygiene NFIs Firewood fuelHousehold NFIsShelter repair items
49+15+10+7+1 49% 15% 10% 7%1%
Reported household sources of credit other than vendors:75+25+24Family/friends in assessed locationNoneFamily/friends elsewhere
75% 25% 24%
35+65+zMobile phones:
YesNo 23+77+z
Possession of a mobile phone
23%77%
YesNo
35%65%
Ability to use a mobile phone
AlwaysSometimes
NeverNot sure
16%47%
4%33%
Access to phone network coverage
74+26+zReported perception of safety of storing or carrying cash:
SafeUnsafe 63+37+z
Storing cash Carrying cash
63%37%
SafeUnsafe
74%26%
1647+4+33+z
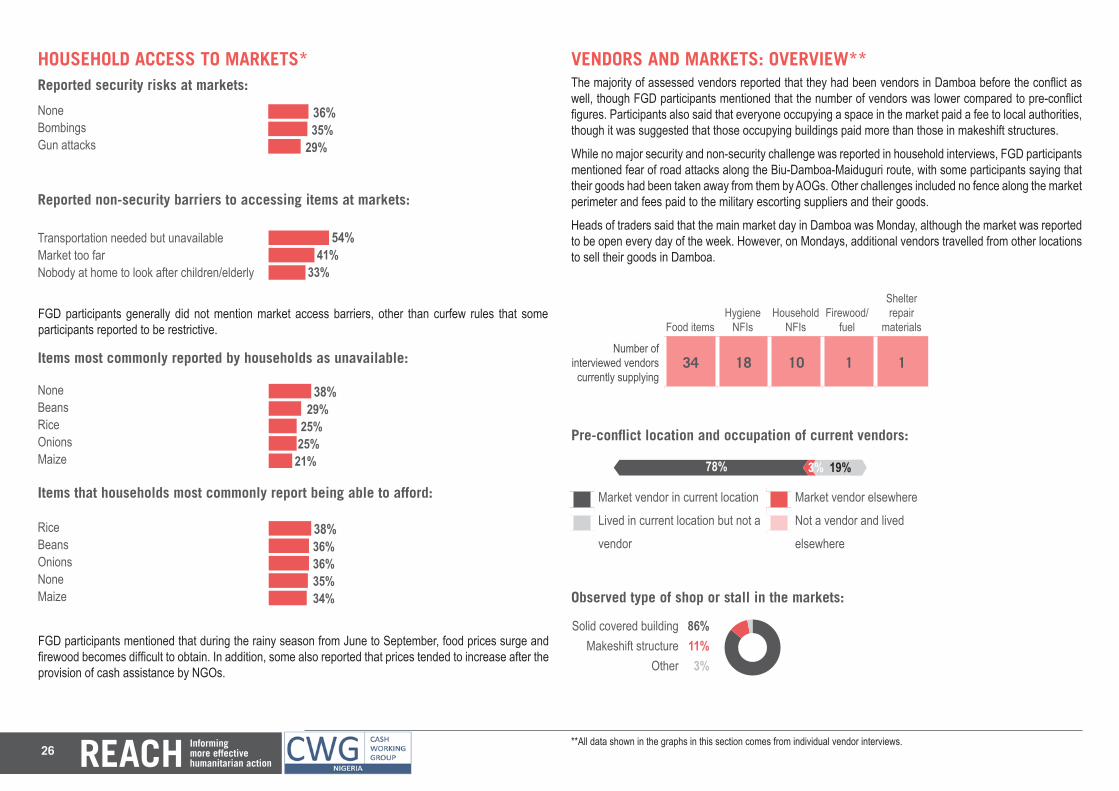
26
HOUSEHOLD ACCESS TO MARKETS*
FGD participants generally did not mention market access barriers, other than curfew rules that some participants reported to be restrictive.
Reported non-security barriers to accessing items at markets:
Reported security risks at markets: 36+35+29NoneBombingsGun attacks
36% 35% 29% 54+41+33Transportation needed but unavailable
Market too farNobody at home to look after children/elderly
54% 41% 33%
FGD participants mentioned that during the rainy season from June to September, food prices surge and firewood becomes difficult to obtain. In addition, some also reported that prices tended to increase after the provision of cash assistance by NGOs.
Items most commonly reported by households as unavailable:38+29+25+25+21+ 38% 29% 25% 25% 21%
NoneBeansRiceOnionsMaize
Items that households most commonly report being able to afford:38+36+36+35+34 38% 36% 36% 35% 34%
RiceBeansOnionsNoneMaize
VENDORS AND MARKETS: OVERVIEW**The majority of assessed vendors reported that they had been vendors in Damboa before the conflict as well, though FGD participants mentioned that the number of vendors was lower compared to pre-conflict figures. Participants also said that everyone occupying a space in the market paid a fee to local authorities, though it was suggested that those occupying buildings paid more than those in makeshift structures.
While no major security and non-security challenge was reported in household interviews, FGD participants mentioned fear of road attacks along the Biu-Damboa-Maiduguri route, with some participants saying that their goods had been taken away from them by AOGs. Other challenges included no fence along the market perimeter and fees paid to the military escorting suppliers and their goods.
Heads of traders said that the main market day in Damboa was Monday, although the market was reported to be open every day of the week. However, on Mondays, additional vendors travelled from other locations to sell their goods in Damboa.
Number of interviewed vendors currently supplying
34 18 10 1 1
Food itemsHygiene
NFIsHousehold
NFIsFirewood/
fuel
Shelter repair
materials
Market vendor in current location Market vendor elsewhere
Lived in current location but not a Not a vendor and lived
vendor elsewhere
Pre-conflict location and occupation of current vendors:
78030+190+0
60
78% 3% 19%
Observed type of shop or stall in the markets:
Solid covered buildingMakeshift structure
Other 86113z86%11%3%
**All data shown in the graphs in this section comes from individual vendor interviews.
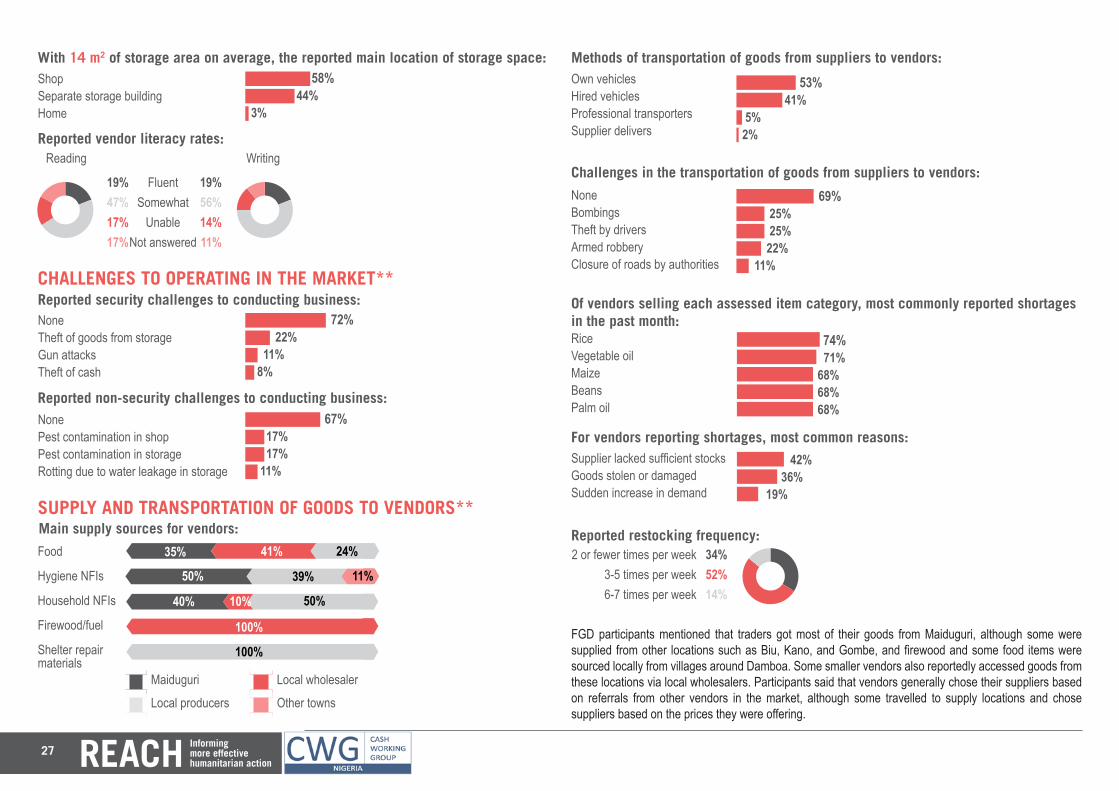
27
58+44+3+With 14 m2 of storage area on average, the reported main location of storage space:ShopSeparate storage buildingHome
58% 44% 3%
Reported vendor literacy rates:
FluentSomewhat
UnableNot answered
Reading Writing
1956+14+11+z19+4717+17z19%56%14%11%
19%47%17%17%
CHALLENGES TO OPERATING IN THE MARKET**
Reported non-security challenges to conducting business:NonePest contamination in shopPest contamination in storageRotting due to water leakage in storage
NoneTheft of goods from storageGun attacksTheft of cash 67+17+17+11
72+22+11+8
67% 17% 17% 11%
72% 22% 11% 8%
Reported security challenges to conducting business:
SUPPLY AND TRANSPORTATION OF GOODS TO VENDORS**
6060606060Main supply sources for vendors:
Maiduguri Local wholesaler
Local producers Other towns
350410+240+035% 41%
5000+390+11050%
400100+500+040% 10%
01000+0+0100%
00+1000+0
Food
Hygiene NFIs
Household NFIs
Firewood/fuel
Shelter repair materials
100%
50%
39%
24%
11%
Own vehiclesHired vehiclesProfessional transportersSupplier delivers
53+41+5+2+ 53% 41% 5% 2%
Methods of transportation of goods from suppliers to vendors:
Challenges in the transportation of goods from suppliers to vendors:
NoneBombingsTheft by driversArmed robberyClosure of roads by authorities
69+25+25+22+11 69% 25% 25% 22% 11%
Of vendors selling each assessed item category, most commonly reported shortages in the past month: 74+71+68+68+68 74%
71% 68% 68% 68%
RiceVegetable oilMaizeBeansPalm oil
For vendors reporting shortages, most common reasons:42+36+19 42% 36% 19%
Supplier lacked sufficient stocksGoods stolen or damagedSudden increase in demand
Reported restocking frequency:2 or fewer times per week
3-5 times per week6-7 times per week 345214z34%
52%14%
FGD participants mentioned that traders got most of their goods from Maiduguri, although some were supplied from other locations such as Biu, Kano, and Gombe, and firewood and some food items were sourced locally from villages around Damboa. Some smaller vendors also reportedly accessed goods from these locations via local wholesalers. Participants said that vendors generally chose their suppliers based on referrals from other vendors in the market, although some travelled to supply locations and chose suppliers based on the prices they were offering.
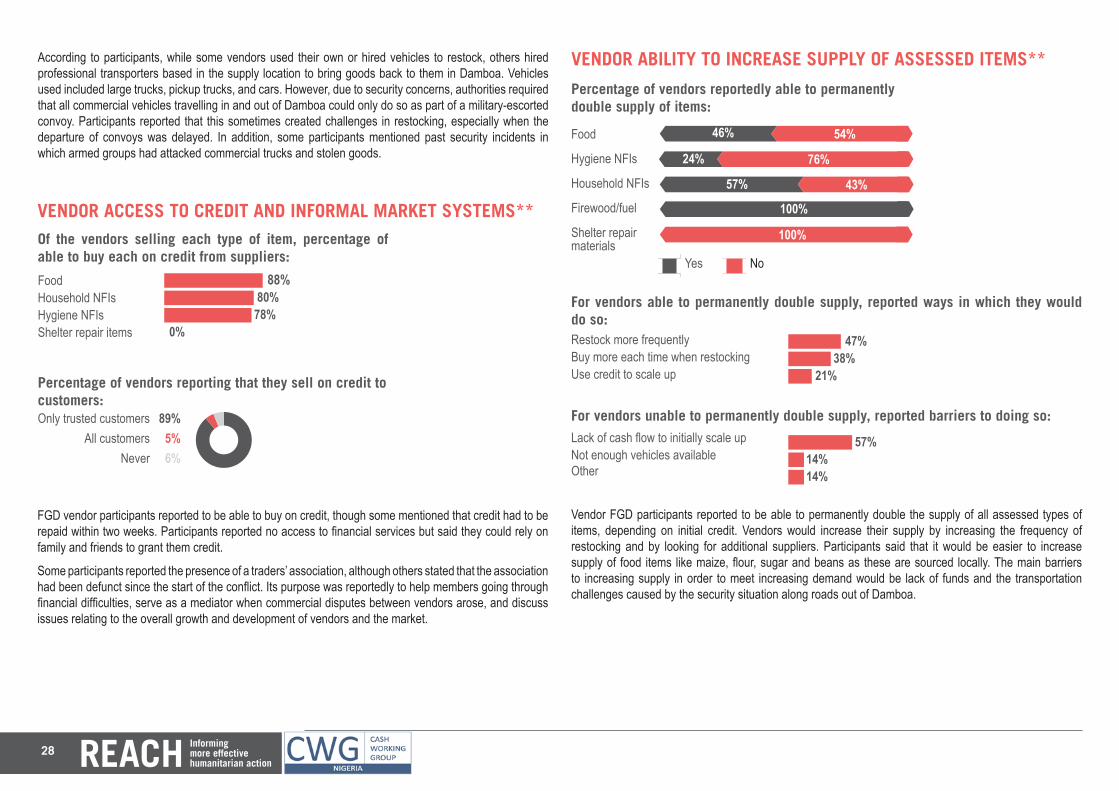
28
VENDOR ACCESS TO CREDIT AND INFORMAL MARKET SYSTEMS**
FGD vendor participants reported to be able to buy on credit, though some mentioned that credit had to be repaid within two weeks. Participants reported no access to financial services but said they could rely on family and friends to grant them credit.
Some participants reported the presence of a traders’ association, although others stated that the association had been defunct since the start of the conflict. Its purpose was reportedly to help members going through financial difficulties, serve as a mediator when commercial disputes between vendors arose, and discuss issues relating to the overall growth and development of vendors and the market.
Of the vendors selling each type of item, percentage of able to buy each on credit from suppliers:
FoodHousehold NFIsHygiene NFIsShelter repair items
88+80+78+ 88% 80% 78%0%
Percentage of vendors reporting that they sell on credit to customers:Only trusted customers
All customersNever 8956z89%
5%6%
VENDOR ABILITY TO INCREASE SUPPLY OF ASSESSED ITEMS**
Yes No
Percentage of vendors reportedly able to permanently double supply of items:
6060
460540
60
46% 54%
240760
60
24% 76%
570430
60
57% 43%
10000100%
01000100%
Food
Hygiene NFIs
Household NFIs
Firewood/fuel
Shelter repair materials
For vendors able to permanently double supply, reported ways in which they would do so:Restock more frequentlyBuy more each time when restockingUse credit to scale up
47+38+21 47% 38% 21%
For vendors unable to permanently double supply, reported barriers to doing so:Lack of cash flow to initially scale upNot enough vehicles availableOther
57+14+14 57% 14% 14%
Vendor FGD participants reported to be able to permanently double the supply of all assessed types of items, depending on initial credit. Vendors would increase their supply by increasing the frequency of restocking and by looking for additional suppliers. Participants said that it would be easier to increase supply of food items like maize, flour, sugar and beans as these are sourced locally. The main barriers to increasing supply in order to meet increasing demand would be lack of funds and the transportation challenges caused by the security situation along roads out of Damboa.
According to participants, while some vendors used their own or hired vehicles to restock, others hired professional transporters based in the supply location to bring goods back to them in Damboa. Vehicles used included large trucks, pickup trucks, and cars. However, due to security concerns, authorities required that all commercial vehicles travelling in and out of Damboa could only do so as part of a military-escorted convoy. Participants reported that this sometimes created challenges in restocking, especially when the departure of convoys was delayed. In addition, some participants mentioned past security incidents in which armed groups had attacked commercial trucks and stolen goods.
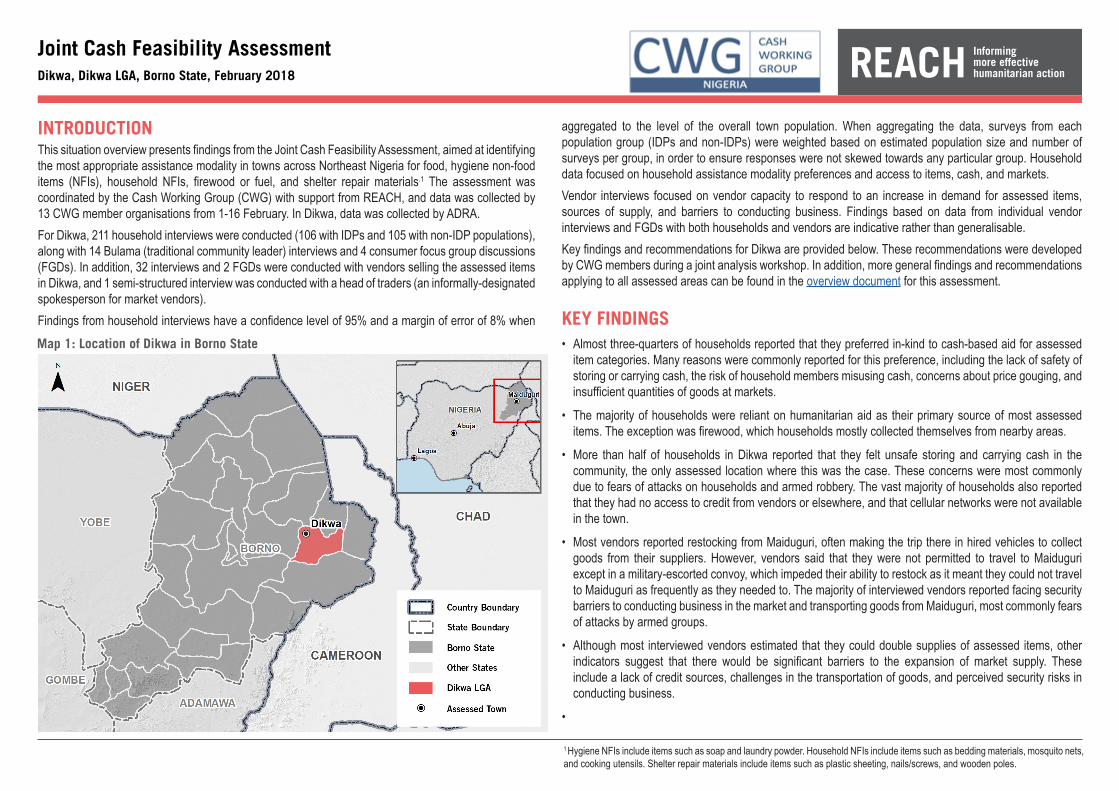
INTRODUCTIONThis situation overview presents findings from the Joint Cash Feasibility Assessment, aimed at identifying the most appropriate assistance modality in towns across Northeast Nigeria for food, hygiene non-food items (NFIs), household NFIs, firewood or fuel, and shelter repair materials.1 The assessment was coordinated by the Cash Working Group (CWG) with support from REACH, and data was collected by 13 CWG member organisations from 1-16 February. In Dikwa, data was collected by ADRA.For Dikwa, 211 household interviews were conducted (106 with IDPs and 105 with non-IDP populations), along with 14 Bulama (traditional community leader) interviews and 4 consumer focus group discussions (FGDs). In addition, 32 interviews and 2 FGDs were conducted with vendors selling the assessed items in Dikwa, and 1 semi-structured interview was conducted with a head of traders (an informally-designated spokesperson for market vendors).Findings from household interviews have a confidence level of 95% and a margin of error of 8% when
Joint Cash Feasibility AssessmentDikwa, Dikwa LGA, Borno State, February 2018
aggregated to the level of the overall town population. When aggregating the data, surveys from each population group (IDPs and non-IDPs) were weighted based on estimated population size and number of surveys per group, in order to ensure responses were not skewed towards any particular group. Household data focused on household assistance modality preferences and access to items, cash, and markets.Vendor interviews focused on vendor capacity to respond to an increase in demand for assessed items, sources of supply, and barriers to conducting business. Findings based on data from individual vendor interviews and FGDs with both households and vendors are indicative rather than generalisable.Key findings and recommendations for Dikwa are provided below. These recommendations were developed by CWG members during a joint analysis workshop. In addition, more general findings and recommendations applying to all assessed areas can be found in the overview document for this assessment.
KEY FINDINGS• Almost three-quarters of households reported that they preferred in-kind to cash-based aid for assessed
item categories. Many reasons were commonly reported for this preference, including the lack of safety of storing or carrying cash, the risk of household members misusing cash, concerns about price gouging, and insufficient quantities of goods at markets.
• The majority of households were reliant on humanitarian aid as their primary source of most assessed items. The exception was firewood, which households mostly collected themselves from nearby areas.
• More than half of households in Dikwa reported that they felt unsafe storing and carrying cash in the community, the only assessed location where this was the case. These concerns were most commonly due to fears of attacks on households and armed robbery. The vast majority of households also reported that they had no access to credit from vendors or elsewhere, and that cellular networks were not available in the town.
• Most vendors reported restocking from Maiduguri, often making the trip there in hired vehicles to collect goods from their suppliers. However, vendors said that they were not permitted to travel to Maiduguri except in a military-escorted convoy, which impeded their ability to restock as it meant they could not travel to Maiduguri as frequently as they needed to. The majority of interviewed vendors reported facing security barriers to conducting business in the market and transporting goods from Maiduguri, most commonly fears of attacks by armed groups.
• Although most interviewed vendors estimated that they could double supplies of assessed items, other indicators suggest that there would be significant barriers to the expansion of market supply. These include a lack of credit sources, challenges in the transportation of goods, and perceived security risks in conducting business.
•
Map 1: Location of Dikwa in Borno State
1 Hygiene NFIs include items such as soap and laundry powder. Household NFIs include items such as bedding materials, mosquito nets, and cooking utensils. Shelter repair materials include items such as plastic sheeting, nails/screws, and wooden poles.
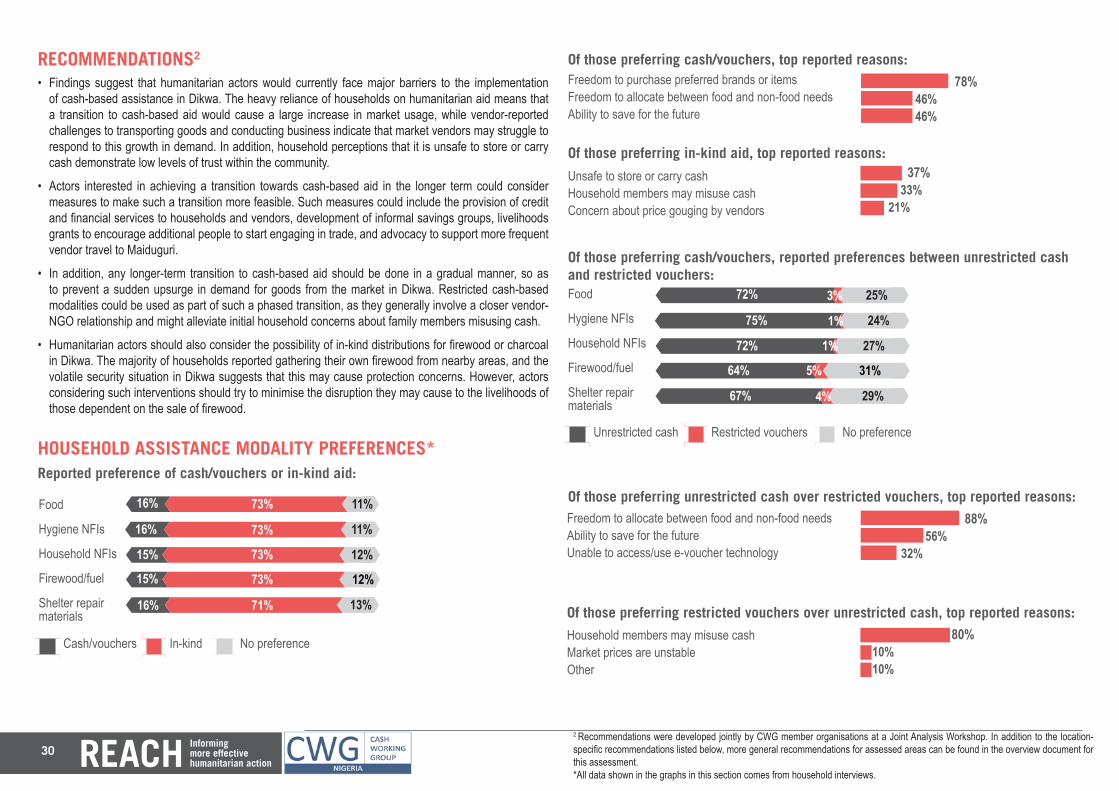
30
160710+130
RECOMMENDATIONS2
• Findings suggest that humanitarian actors would currently face major barriers to the implementation of cash-based assistance in Dikwa. The heavy reliance of households on humanitarian aid means that a transition to cash-based aid would cause a large increase in market usage, while vendor-reported challenges to transporting goods and conducting business indicate that market vendors may struggle to respond to this growth in demand. In addition, household perceptions that it is unsafe to store or carry cash demonstrate low levels of trust within the community.
• Actors interested in achieving a transition towards cash-based aid in the longer term could consider measures to make such a transition more feasible. Such measures could include the provision of credit and financial services to households and vendors, development of informal savings groups, livelihoods grants to encourage additional people to start engaging in trade, and advocacy to support more frequent vendor travel to Maiduguri.
• In addition, any longer-term transition to cash-based aid should be done in a gradual manner, so as to prevent a sudden upsurge in demand for goods from the market in Dikwa. Restricted cash-based modalities could be used as part of such a phased transition, as they generally involve a closer vendor-NGO relationship and might alleviate initial household concerns about family members misusing cash.
• Humanitarian actors should also consider the possibility of in-kind distributions for firewood or charcoal in Dikwa. The majority of households reported gathering their own firewood from nearby areas, and the volatile security situation in Dikwa suggests that this may cause protection concerns. However, actors considering such interventions should try to minimise the disruption they may cause to the livelihoods of those dependent on the sale of firewood.
HOUSEHOLD ASSISTANCE MODALITY PREFERENCES*
6060
Reported preference of cash/vouchers or in-kind aid:
Food
Hygiene NFIs
Household NFIs
Firewood/fuel
Shelter repair materials
Of those preferring in-kind aid, top reported reasons:
Unsafe to store or carry cash Household members may misuse cash Concern about price gouging by vendors
37+33+21 37% 33% 21%
160730+110
60
16% 73% 11%
Of those preferring cash/vouchers, top reported reasons:Freedom to purchase preferred brands or items Freedom to allocate between food and non-food needsAbility to save for the future
Cash/vouchers In-kind No preference
160730+110
60
16% 73% 11%
150730+120
60
15% 73% 12%
150730+12015% 73% 12%
16% 71% 13%
78+46+46 78% 46% 46%
Of those preferring cash/vouchers, reported preferences between unrestricted cash and restricted vouchers:Food
Hygiene NFIs
Household NFIs
Firewood/fuel
Shelter repair materials
Of those preferring restricted vouchers over unrestricted cash, top reported reasons:
Household members may misuse cash Market prices are unstable Other
80+10+10 80% 10% 10%
Of those preferring unrestricted cash over restricted vouchers, top reported reasons:88+56+32 88% 56% 32%
Freedom to allocate between food and non-food needs Ability to save for the futureUnable to access/use e-voucher technology
6060
72030+250
60
72% 3% 25%
75010+240
60
75% 1% 24%
72010+270
60
72% 1% 27%
64050+31064% 5% 31%
67040+29067% 4% 29%
Unrestricted cash Restricted vouchers No preference
2 Recommendations were developed jointly by CWG member organisations at a Joint Analysis Workshop. In addition to the location-specific recommendations listed below, more general recommendations for assessed areas can be found in the overview document for this assessment.*All data shown in the graphs in this section comes from household interviews.
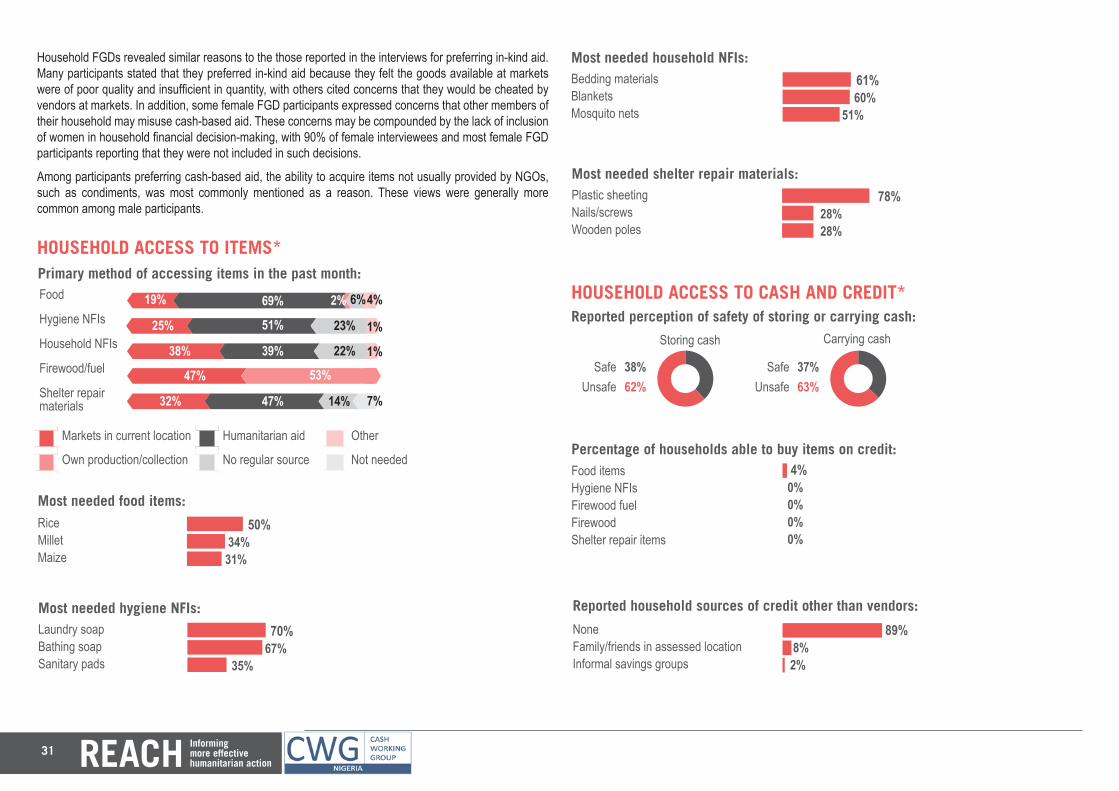
31
Primary method of accessing items in the past month:
Markets in current location Humanitarian aid Other
Own production/collection No regular source Not needed
Food
Hygiene NFIs
Household NFIs
Firewood/fuel
Shelter repair materials
6060
190690+20+60+40
60
19% 69% 2%
250510+0+230+10
60
25% 51%
380+3900+220+10
60
38% 39%
470+0530+0+047% 53%
320+470140+0+7032% 47% 14%
HOUSEHOLD ACCESS TO ITEMS*
Most needed food items: 50+34+31 50% 34% 31%
RiceMilletMaize
Most needed hygiene NFIs:70+67+35 70% 67% 35%
Laundry soapBathing soapSanitary pads
Most needed household NFIs: 61+60+51 61% 60% 51%
Bedding materialsBlanketsMosquito nets
Most needed shelter repair materials:78+28+28 78% 28% 28%
Plastic sheetingNails/screwsWooden poles
HOUSEHOLD ACCESS TO CASH AND CREDIT*6%
23%
22%
4%
1%
1%
7%
Household FGDs revealed similar reasons to the those reported in the interviews for preferring in-kind aid. Many participants stated that they preferred in-kind aid because they felt the goods available at markets were of poor quality and insufficient in quantity, with others cited concerns that they would be cheated by vendors at markets. In addition, some female FGD participants expressed concerns that other members of their household may misuse cash-based aid. These concerns may be compounded by the lack of inclusion of women in household financial decision-making, with 90% of female interviewees and most female FGD participants reporting that they were not included in such decisions.
Among participants preferring cash-based aid, the ability to acquire items not usually provided by NGOs, such as condiments, was most commonly mentioned as a reason. These views were generally more common among male participants.
Percentage of households able to buy items on credit:Food items Hygiene NFIs Firewood fuelFirewoodShelter repair items
4+0+0+0+0 4%0%0%0%0%
Reported household sources of credit other than vendors:89+8+2NoneFamily/friends in assessed locationInformal savings groups
89% 8% 2%
37+63+zReported perception of safety of storing or carrying cash:
SafeUnsafe 38+62+z
Storing cash Carrying cash
38%62%
SafeUnsafe
37%63%

32
HOUSEHOLD ACCESS TO MARKETS*
More than half of households reported facing security barriers to market access, most commonly citing the risks of bombings and gun attacks as threats. However, FGD data indicated that these were general fears that community members held, rather than barriers preventing market access and modifying consumer behaviour on a daily basis.
Reported non-security barriers to accessing items at markets:
Reported security risks at markets: 52+46+4BombingsNoneGun attacks
52% 46%4%89+4+3None
Nobody at home to look after children/elderlyInadequate quality of food
89% 4% 3%
While the vast majority of households did not report any items as unavailable, this is likely because many of them may not be aware of availability issues in markets due to reliance on humanitarian aid and infrequent visits to markets due to affordability issues. This is corroborated by FGD data, where many participants said that markets had insufficient quantities and variety of items, particularly NFIs. FGD participants also reported that market prices fluctuated frequently, decreasing when humanitarian aid was available and rising during times of greater need amongst households.
Items most commonly reported by households as unavailable:89+9+4+4+3 89% 9% 4% 4%3%
NoneRicePlastic sheetingBeansMaize
Items that households most commonly report being able to afford:45+34+24+20+13 45% 34% 24% 20%13%
NoneMaizeVegetable oilOnionsBeans
30+70+zMobile phones:
YesNo 17+83+z
Possession of a mobile phone
17%83%
YesNo
30%70%
Ability to use a mobile phone
AlwaysSometimes
NeverNot sure
0%0%
99%1%
Access to phone network coverage
00+99+1+zAs was the case in household interviews, FGD participants also mentioned the lack of credit sources, while vendor FGD participants mentioned that they generally did not want to provide credit to customers they perceived as unreliable.
FGD participants also expressed a disinclination towards mobile money, largely because no cellular network coverage was available in Dikwa.
VENDORS AND MARKETS: OVERVIEW**According to the head of traders, the pre-conflict site of the main market in Dikwa was still in use. Most vendors reported that they faced security challenges to conducting business, with the risk of bombings, theft from storage facilities, and the risk of gun attacks the most commonly reported challenges. FGD participants stated that, due to perceived security challenges, local authorities imposed an early curfew in the town and frequently closed the market at short notice. More than half of vendors also reported a range of non-seucirty challenges, most commonly pest contamination and rotting of goods due to water leakage.
Number of interviewed vendors currently supplying
32 10 5 0 1
Food itemsHygiene
NFIsHousehold
NFIsFirewood/
fuel
Shelter repair
materials
**All data shown in the graphs in this section comes from individual vendor interviews.
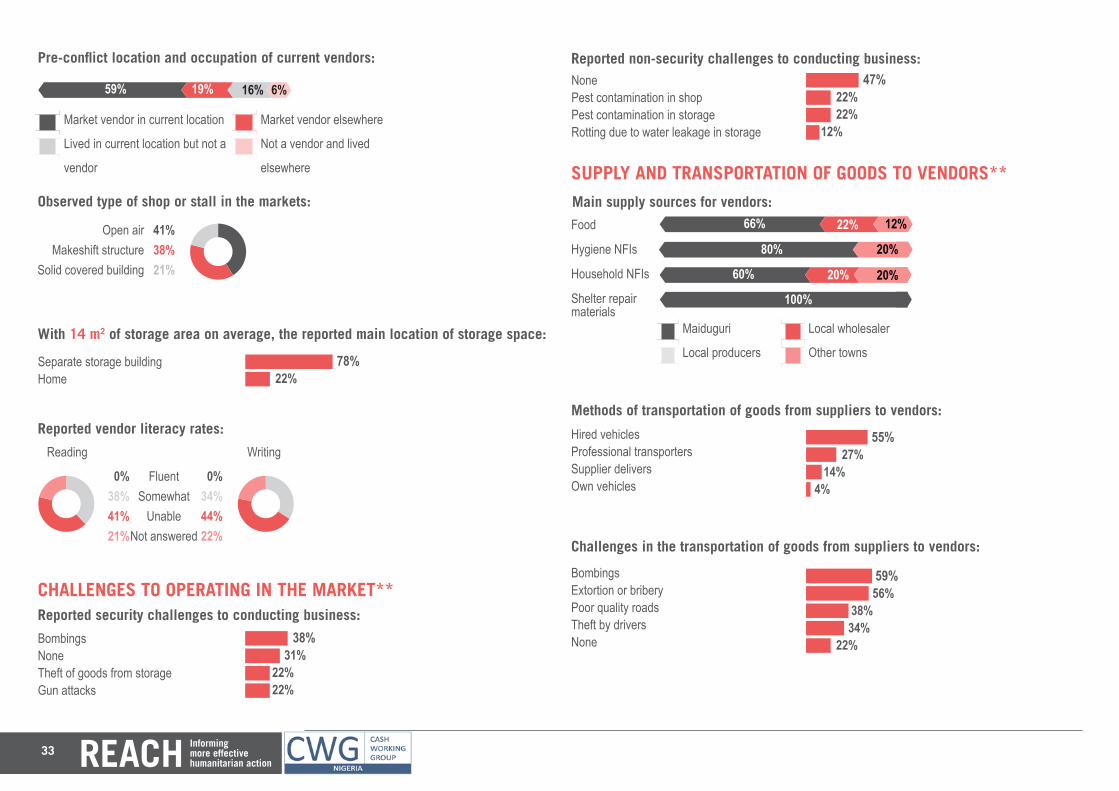
33
78+22+
Observed type of shop or stall in the markets:
With 14 m2 of storage area on average, the reported main location of storage space:
Open airMakeshift structure
Solid covered building 413821z41%38%21%
Separate storage buildingHome
78% 22%
Reported vendor literacy rates:
FluentSomewhat
UnableNot answered
Reading Writing
034+44+22+z0+3841+21z0%
34%44%22%
0%38%41%21%
CHALLENGES TO OPERATING IN THE MARKET**
Reported non-security challenges to conducting business:NonePest contamination in shopPest contamination in storageRotting due to water leakage in storage
BombingsNoneTheft of goods from storageGun attacks
47+22+22+12
38+31+22+22
47% 22% 22% 12%
38% 31% 22% 22%
Reported security challenges to conducting business:
Market vendor in current location Market vendor elsewhere
Lived in current location but not a Not a vendor and lived
vendor elsewhere
Pre-conflict location and occupation of current vendors:
590190+160+60
60
59% 19% 16% 6%
SUPPLY AND TRANSPORTATION OF GOODS TO VENDORS**
60606060Main supply sources for vendors:
Maiduguri Local wholesaler
Local producers Other towns
660220+0+12066% 22%
8000+0+20080%
600200+0+20060% 20%
10000+0+0100%
Hired vehiclesProfessional transportersSupplier deliversOwn vehicles
55+27+14+4+ 55% 27% 14% 4%
Methods of transportation of goods from suppliers to vendors:
Food
Hygiene NFIs
Household NFIs
Shelter repair materials
20%
20%
12%
Challenges in the transportation of goods from suppliers to vendors:
BombingsExtortion or briberyPoor quality roadsTheft by driversNone
59+56+38+34+22 59% 56% 38% 34% 22%
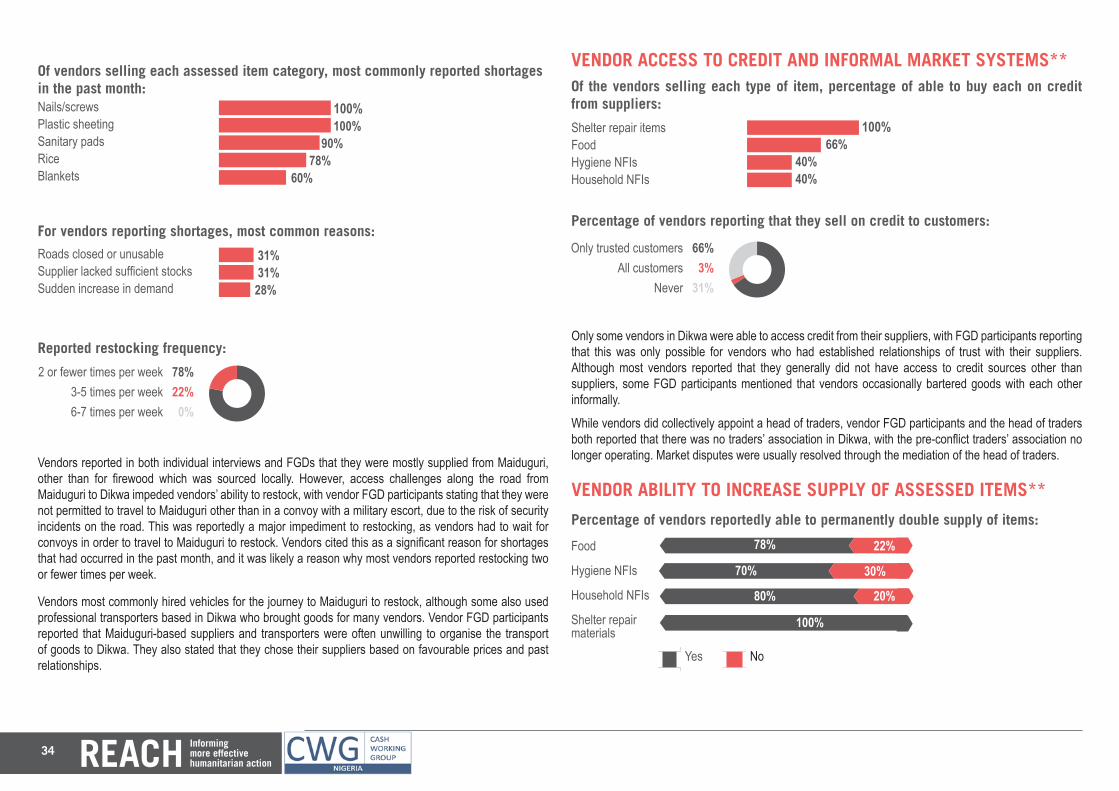
34
Of vendors selling each assessed item category, most commonly reported shortages in the past month: 100+100+90+78+60 100%
100% 90% 78% 60%
Nails/screwsPlastic sheetingSanitary padsRiceBlankets
For vendors reporting shortages, most common reasons:31+31+28 31% 31% 28%
Roads closed or unusableSupplier lacked sufficient stocksSudden increase in demand
Reported restocking frequency:
2 or fewer times per week3-5 times per week6-7 times per week 78220z78%
22%0%
VENDOR ACCESS TO CREDIT AND INFORMAL MARKET SYSTEMS**
Only some vendors in Dikwa were able to access credit from their suppliers, with FGD participants reporting that this was only possible for vendors who had established relationships of trust with their suppliers. Although most vendors reported that they generally did not have access to credit sources other than suppliers, some FGD participants mentioned that vendors occasionally bartered goods with each other informally.
While vendors did collectively appoint a head of traders, vendor FGD participants and the head of traders both reported that there was no traders’ association in Dikwa, with the pre-conflict traders’ association no longer operating. Market disputes were usually resolved through the mediation of the head of traders.Vendors reported in both individual interviews and FGDs that they were mostly supplied from Maiduguri,
other than for firewood which was sourced locally. However, access challenges along the road from Maiduguri to Dikwa impeded vendors’ ability to restock, with vendor FGD participants stating that they were not permitted to travel to Maiduguri other than in a convoy with a military escort, due to the risk of security incidents on the road. This was reportedly a major impediment to restocking, as vendors had to wait for convoys in order to travel to Maiduguri to restock. Vendors cited this as a significant reason for shortages that had occurred in the past month, and it was likely a reason why most vendors reported restocking two or fewer times per week.
Vendors most commonly hired vehicles for the journey to Maiduguri to restock, although some also used professional transporters based in Dikwa who brought goods for many vendors. Vendor FGD participants reported that Maiduguri-based suppliers and transporters were often unwilling to organise the transport of goods to Dikwa. They also stated that they chose their suppliers based on favourable prices and past relationships.
Of the vendors selling each type of item, percentage of able to buy each on credit from suppliers:
Shelter repair itemsFoodHygiene NFIsHousehold NFIs
100+66+40+40 100% 66%40%40%
Percentage of vendors reporting that they sell on credit to customers:
Only trusted customersAll customers
Never 66331z66%3%
31%
VENDOR ABILITY TO INCREASE SUPPLY OF ASSESSED ITEMS**
Yes No
Percentage of vendors reportedly able to permanently double supply of items:
60
780220
60
78% 22%
700300
60
70% 30%
800200
60
80% 20%
10000100%
Food
Hygiene NFIs
Household NFIs
Shelter repair materials
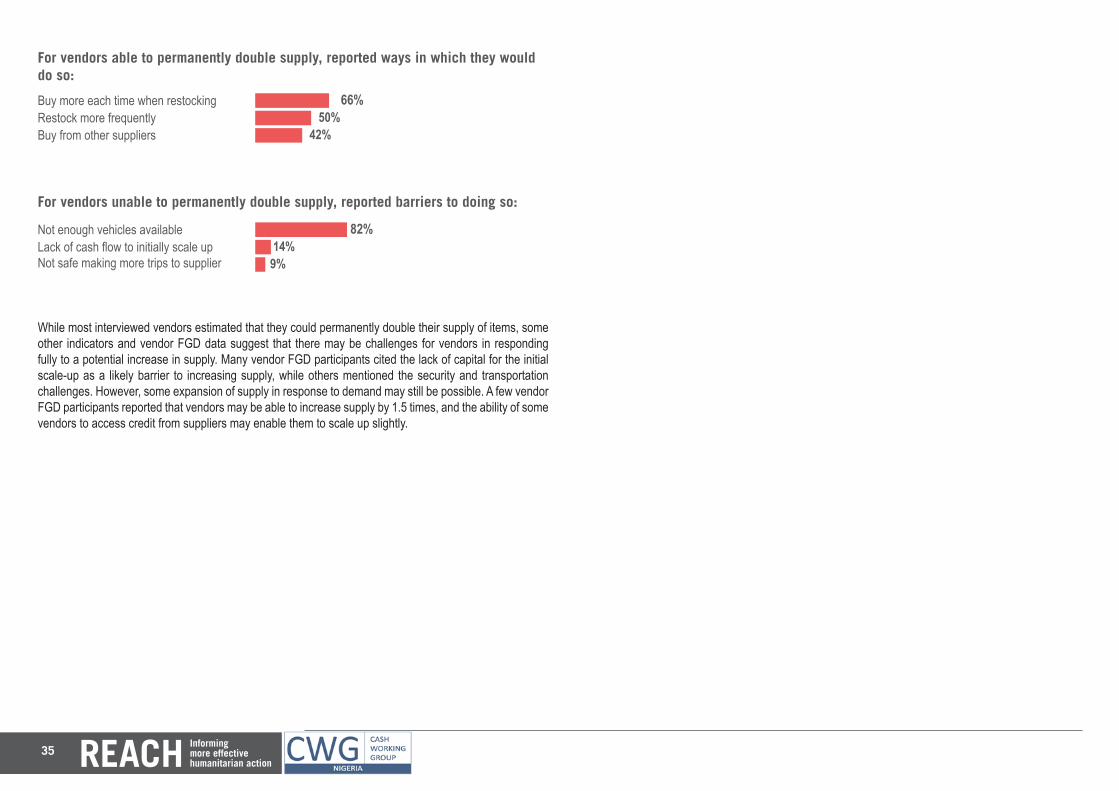
35
For vendors able to permanently double supply, reported ways in which they would do so:
Buy more each time when restockingRestock more frequentlyBuy from other suppliers
66+50+42 66% 50% 42%
For vendors unable to permanently double supply, reported barriers to doing so:
Not enough vehicles availableLack of cash flow to initially scale upNot safe making more trips to supplier
82+14+9 82% 14% 9%
While most interviewed vendors estimated that they could permanently double their supply of items, some other indicators and vendor FGD data suggest that there may be challenges for vendors in responding fully to a potential increase in supply. Many vendor FGD participants cited the lack of capital for the initial scale-up as a likely barrier to increasing supply, while others mentioned the security and transportation challenges. However, some expansion of supply in response to demand may still be possible. A few vendor FGD participants reported that vendors may be able to increase supply by 1.5 times, and the ability of some vendors to access credit from suppliers may enable them to scale up slightly.
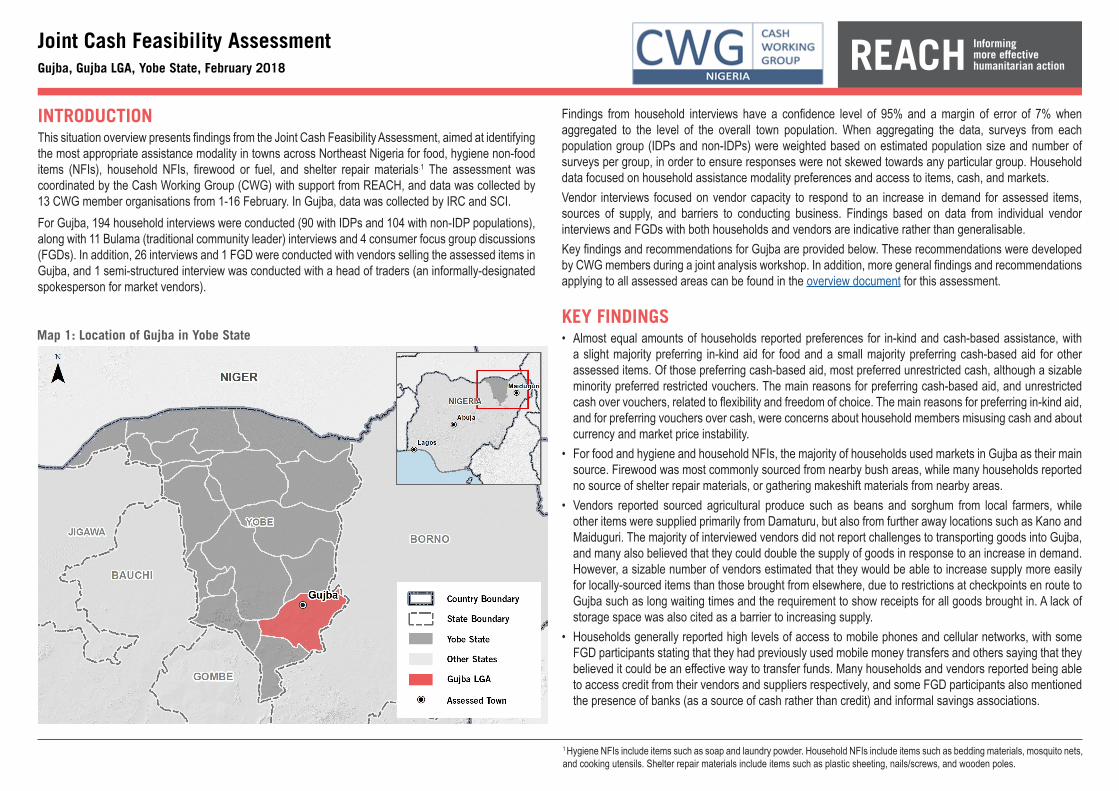
INTRODUCTIONThis situation overview presents findings from the Joint Cash Feasibility Assessment, aimed at identifying the most appropriate assistance modality in towns across Northeast Nigeria for food, hygiene non-food items (NFIs), household NFIs, firewood or fuel, and shelter repair materials.1 The assessment was coordinated by the Cash Working Group (CWG) with support from REACH, and data was collected by 13 CWG member organisations from 1-16 February. In Gujba, data was collected by IRC and SCI.For Gujba, 194 household interviews were conducted (90 with IDPs and 104 with non-IDP populations), along with 11 Bulama (traditional community leader) interviews and 4 consumer focus group discussions (FGDs). In addition, 26 interviews and 1 FGD were conducted with vendors selling the assessed items in Gujba, and 1 semi-structured interview was conducted with a head of traders (an informally-designated spokesperson for market vendors).
Joint Cash Feasibility AssessmentGujba, Gujba LGA, Yobe State, February 2018
Findings from household interviews have a confidence level of 95% and a margin of error of 7% when aggregated to the level of the overall town population. When aggregating the data, surveys from each population group (IDPs and non-IDPs) were weighted based on estimated population size and number of surveys per group, in order to ensure responses were not skewed towards any particular group. Household data focused on household assistance modality preferences and access to items, cash, and markets.Vendor interviews focused on vendor capacity to respond to an increase in demand for assessed items, sources of supply, and barriers to conducting business. Findings based on data from individual vendor interviews and FGDs with both households and vendors are indicative rather than generalisable.Key findings and recommendations for Gujba are provided below. These recommendations were developed by CWG members during a joint analysis workshop. In addition, more general findings and recommendations applying to all assessed areas can be found in the overview document for this assessment.
KEY FINDINGS• Almost equal amounts of households reported preferences for in-kind and cash-based assistance, with
a slight majority preferring in-kind aid for food and a small majority preferring cash-based aid for other assessed items. Of those preferring cash-based aid, most preferred unrestricted cash, although a sizable minority preferred restricted vouchers. The main reasons for preferring cash-based aid, and unrestricted cash over vouchers, related to flexibility and freedom of choice. The main reasons for preferring in-kind aid, and for preferring vouchers over cash, were concerns about household members misusing cash and about currency and market price instability.
• For food and hygiene and household NFIs, the majority of households used markets in Gujba as their main source. Firewood was most commonly sourced from nearby bush areas, while many households reported no source of shelter repair materials, or gathering makeshift materials from nearby areas.
• Vendors reported sourced agricultural produce such as beans and sorghum from local farmers, while other items were supplied primarily from Damaturu, but also from further away locations such as Kano and Maiduguri. The majority of interviewed vendors did not report challenges to transporting goods into Gujba, and many also believed that they could double the supply of goods in response to an increase in demand. However, a sizable number of vendors estimated that they would be able to increase supply more easily for locally-sourced items than those brought from elsewhere, due to restrictions at checkpoints en route to Gujba such as long waiting times and the requirement to show receipts for all goods brought in. A lack of storage space was also cited as a barrier to increasing supply.
• Households generally reported high levels of access to mobile phones and cellular networks, with some FGD participants stating that they had previously used mobile money transfers and others saying that they believed it could be an effective way to transfer funds. Many households and vendors reported being able to access credit from their vendors and suppliers respectively, and some FGD participants also mentioned the presence of banks (as a source of cash rather than credit) and informal savings associations.
Map 1: Location of Gujba in Yobe State
1 Hygiene NFIs include items such as soap and laundry powder. Household NFIs include items such as bedding materials, mosquito nets, and cooking utensils. Shelter repair materials include items such as plastic sheeting, nails/screws, and wooden poles.
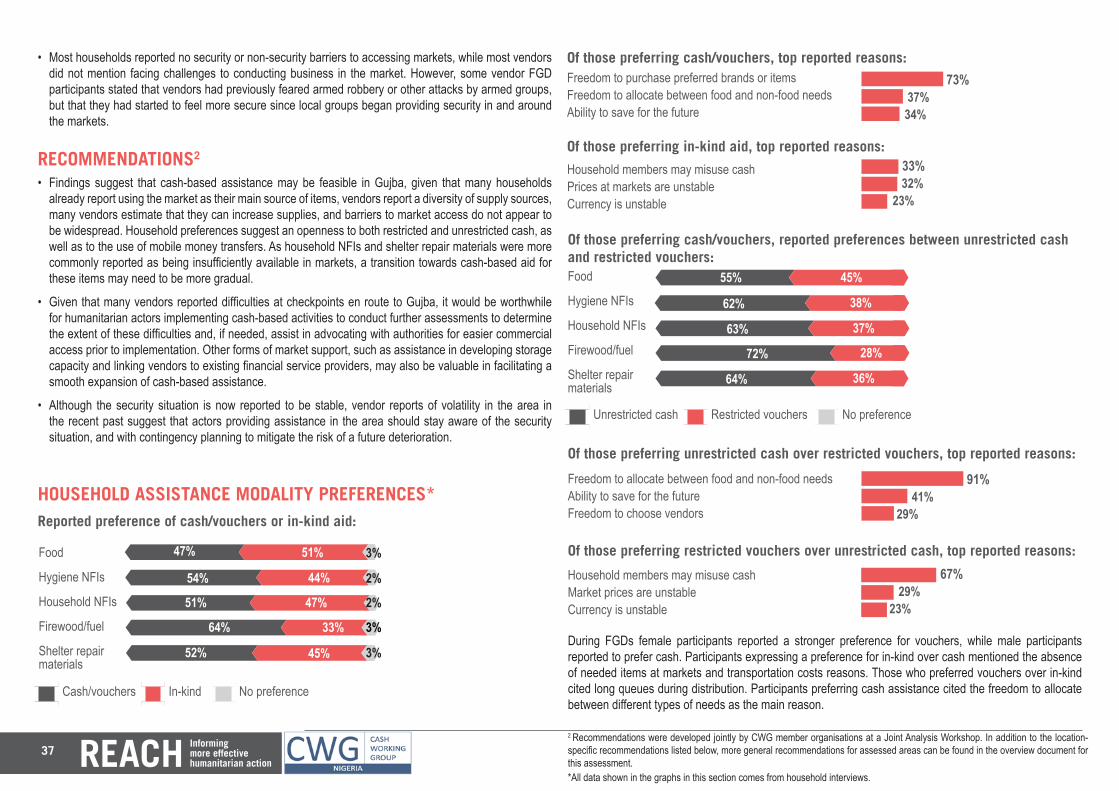
37
60
606060
520450+30
RECOMMENDATIONS2
• Findings suggest that cash-based assistance may be feasible in Gujba, given that many households already report using the market as their main source of items, vendors report a diversity of supply sources, many vendors estimate that they can increase supplies, and barriers to market access do not appear to be widespread. Household preferences suggest an openness to both restricted and unrestricted cash, as well as to the use of mobile money transfers. As household NFIs and shelter repair materials were more commonly reported as being insufficiently available in markets, a transition towards cash-based aid for these items may need to be more gradual.
• Given that many vendors reported difficulties at checkpoints en route to Gujba, it would be worthwhile for humanitarian actors implementing cash-based activities to conduct further assessments to determine the extent of these difficulties and, if needed, assist in advocating with authorities for easier commercial access prior to implementation. Other forms of market support, such as assistance in developing storage capacity and linking vendors to existing financial service providers, may also be valuable in facilitating a smooth expansion of cash-based assistance.
• Although the security situation is now reported to be stable, vendor reports of volatility in the area in the recent past suggest that actors providing assistance in the area should stay aware of the security situation, and with contingency planning to mitigate the risk of a future deterioration.
HOUSEHOLD ASSISTANCE MODALITY PREFERENCES*
During FGDs female participants reported a stronger preference for vouchers, while male participants reported to prefer cash. Participants expressing a preference for in-kind over cash mentioned the absence of needed items at markets and transportation costs reasons. Those who preferred vouchers over in-kind cited long queues during distribution. Participants preferring cash assistance cited the freedom to allocate between different types of needs as the main reason.
60
Reported preference of cash/vouchers or in-kind aid:
Food
Hygiene NFIs
Household NFIs
Firewood/fuel
Shelter repair materials
Of those preferring in-kind aid, top reported reasons:
Household members may misuse cash Prices at markets are unstable Currency is unstable
33+32+23 33% 32% 23%
470510+3047% 51% 3%
Of those preferring cash/vouchers, top reported reasons:Freedom to purchase preferred brands or items Freedom to allocate between food and non-food needsAbility to save for the future
Cash/vouchers In-kind No preference
540440+2054% 44% 2%
510470+2051% 47% 2%
6403330+3064% 33% 3%
52% 45% 3%
73+37+34+ 73% 37% 34%
• Most households reported no security or non-security barriers to accessing markets, while most vendors did not mention facing challenges to conducting business in the market. However, some vendor FGD participants stated that vendors had previously feared armed robbery or other attacks by armed groups, but that they had started to feel more secure since local groups began providing security in and around the markets.
Of those preferring cash/vouchers, reported preferences between unrestricted cash and restricted vouchers:Food
Hygiene NFIs
Household NFIs
Firewood/fuel
Shelter repair materials
Of those preferring restricted vouchers over unrestricted cash, top reported reasons:
Household members may misuse cash Market prices are unstable Currency is unstable
67+29+23 67% 29% 23%
Of those preferring unrestricted cash over restricted vouchers, top reported reasons:91+41+29 91% 41% 29%
Freedom to allocate between food and non-food needs Ability to save for the futureFreedom to choose vendors
6060
550450+0
60
55% 45%
620380+0
60
62% 38%
630370+0
60
63% 37%
720280+072% 28%
640360+064% 36%
Unrestricted cash Restricted vouchers No preference
2 Recommendations were developed jointly by CWG member organisations at a Joint Analysis Workshop. In addition to the location-specific recommendations listed below, more general recommendations for assessed areas can be found in the overview document for this assessment.*All data shown in the graphs in this section comes from household interviews.
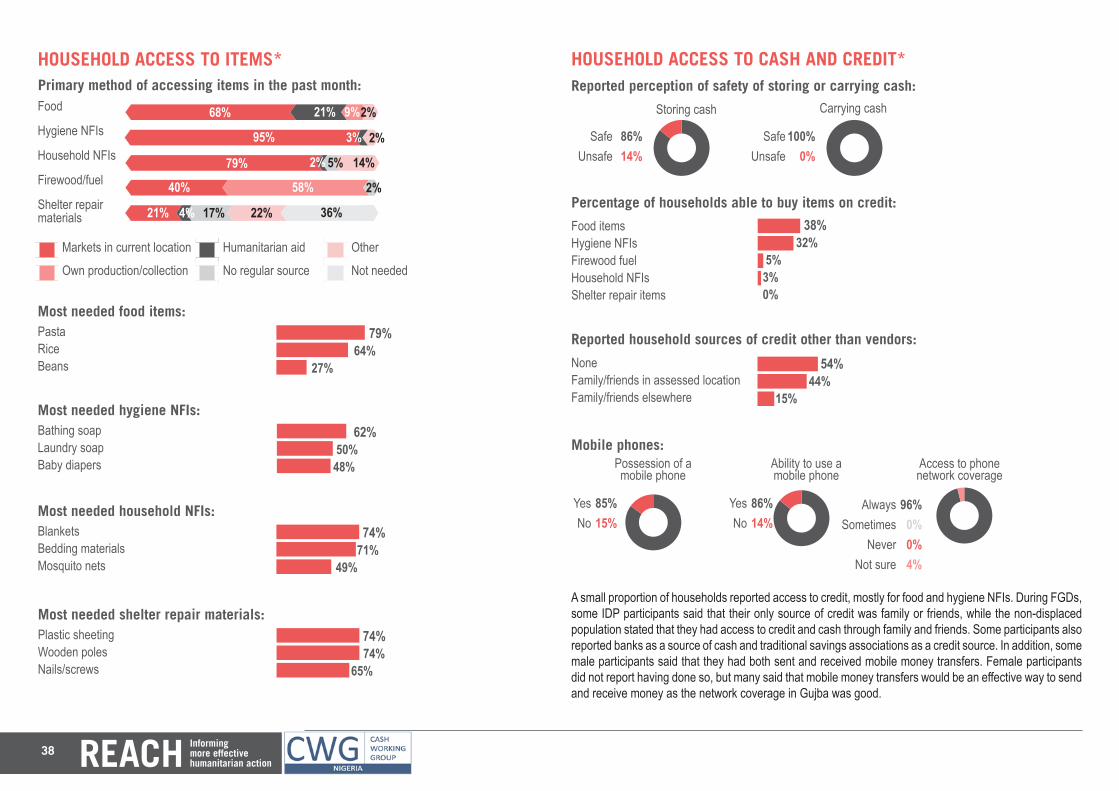
38
60
Primary method of accessing items in the past month:
Markets in current location Humanitarian aid Other
Own production/collection No regular source Not needed
Food
Hygiene NFIs
Household NFIs
Firewood/fuel
Shelter repair materials
6060
680210+90+0+20
60
68% 9%
95030+0+2095% 3%
790+200+50+140
60
79% 2%
400+0580+20+040% 58%
210+40170+220+36021% 4% 17%
HOUSEHOLD ACCESS TO ITEMS*
Most needed food items: 79+64+27 79% 64% 27%
PastaRiceBeans
Most needed hygiene NFIs: 62+50+48 62% 50% 48%
Bathing soapLaundry soapBaby diapers
Most needed household NFIs: 74+71+49 74% 71% 49%
BlanketsBedding materialsMosquito nets
Most needed shelter repair materials: 74+74+65 74% 74% 65%
Plastic sheetingWooden polesNails/screws
HOUSEHOLD ACCESS TO CASH AND CREDIT*
A small proportion of households reported access to credit, mostly for food and hygiene NFIs. During FGDs, some IDP participants said that their only source of credit was family or friends, while the non-displaced population stated that they had access to credit and cash through family and friends. Some participants also reported banks as a source of cash and traditional savings associations as a credit source. In addition, some male participants said that they had both sent and received mobile money transfers. Female participants did not report having done so, but many said that mobile money transfers would be an effective way to send and receive money as the network coverage in Gujba was good.
5%
2%
22%
2%
2%
14%
36%
21%
Percentage of households able to buy items on credit:
Food items Hygiene NFIs Firewood fuelHousehold NFIsShelter repair items
38+32+5+3+0 38% 32% 5%3%0%
Reported household sources of credit other than vendors:54+44+15NoneFamily/friends in assessed locationFamily/friends elsewhere
54% 44% 15%
86+14+zMobile phones:
YesNo 85+15+z
Possession of a mobile phone
85%15%
YesNo
86%14%
Ability to use a mobile phone
AlwaysSometimes
NeverNot sure
96%0%0%4%
Access to phone network coverage
100+zReported perception of safety of storing or carrying cash:
SafeUnsafe 86+14+z
Storing cash Carrying cash
86%14%
SafeUnsafe
100%0%
964+z
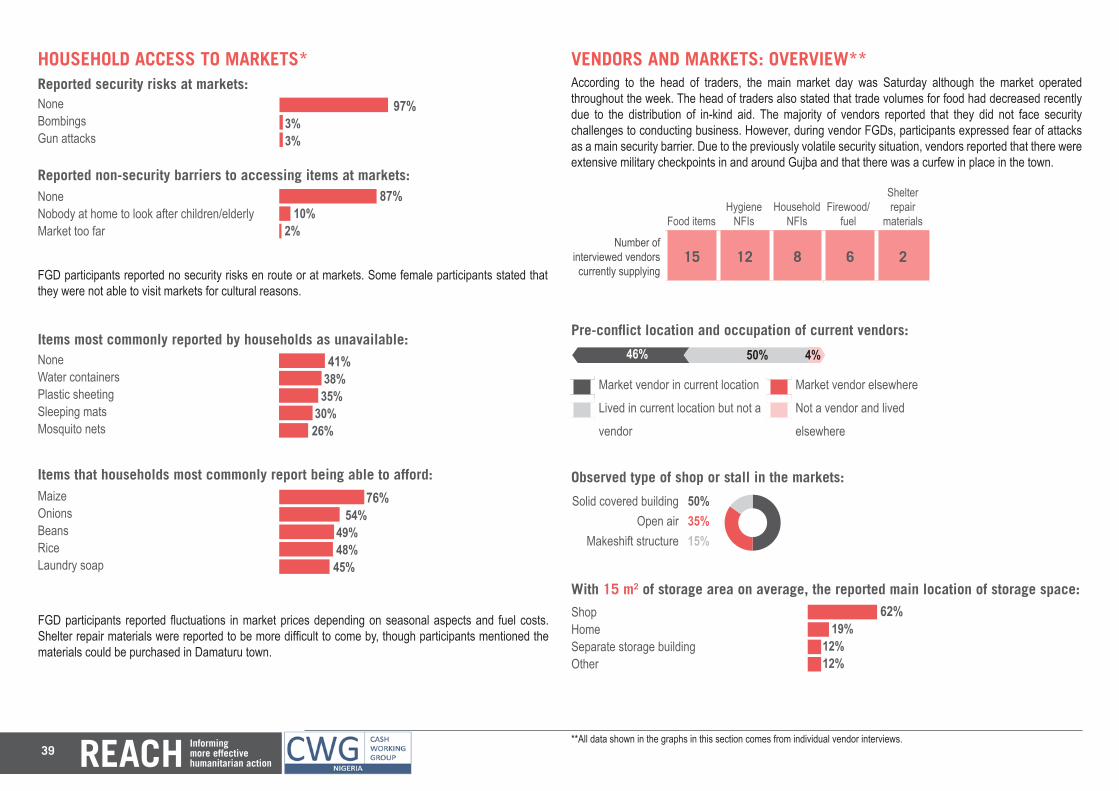
39
HOUSEHOLD ACCESS TO MARKETS*
FGD participants reported no security risks en route or at markets. Some female participants stated that they were not able to visit markets for cultural reasons.
Reported non-security barriers to accessing items at markets:
Reported security risks at markets: 97+3+3NoneBombingsGun attacks
97% 3% 3% 87+10+2None
Nobody at home to look after children/elderlyMarket too far
87% 10% 2%
FGD participants reported fluctuations in market prices depending on seasonal aspects and fuel costs. Shelter repair materials were reported to be more difficult to come by, though participants mentioned the materials could be purchased in Damaturu town.
Items most commonly reported by households as unavailable:41+38+35+30+26 41% 38% 35% 30% 26%
NoneWater containersPlastic sheetingSleeping matsMosquito nets
Items that households most commonly report being able to afford:76+54+49+48+45 76% 54% 49% 48% 45%
MaizeOnionsBeansRiceLaundry soap
VENDORS AND MARKETS: OVERVIEW**According to the head of traders, the main market day was Saturday although the market operated throughout the week. The head of traders also stated that trade volumes for food had decreased recently due to the distribution of in-kind aid. The majority of vendors reported that they did not face security challenges to conducting business. However, during vendor FGDs, participants expressed fear of attacks as a main security barrier. Due to the previously volatile security situation, vendors reported that there were extensive military checkpoints in and around Gujba and that there was a curfew in place in the town.
Number of interviewed vendors currently supplying
15 12 8 6 2
Food itemsHygiene
NFIsHousehold
NFIsFirewood/
fuel
Shelter repair
materials
Market vendor in current location Market vendor elsewhere
Lived in current location but not a Not a vendor and lived
vendor elsewhere
Pre-conflict location and occupation of current vendors:
62+19+12+12Observed type of shop or stall in the markets:
With 15 m2 of storage area on average, the reported main location of storage space:
Solid covered buildingOpen air
Makeshift structure 503515z50%35%15%
ShopHomeSeparate storage buildingOther
62% 19% 12% 12%
4600+500+40
60
46% 50% 4%
**All data shown in the graphs in this section comes from individual vendor interviews.
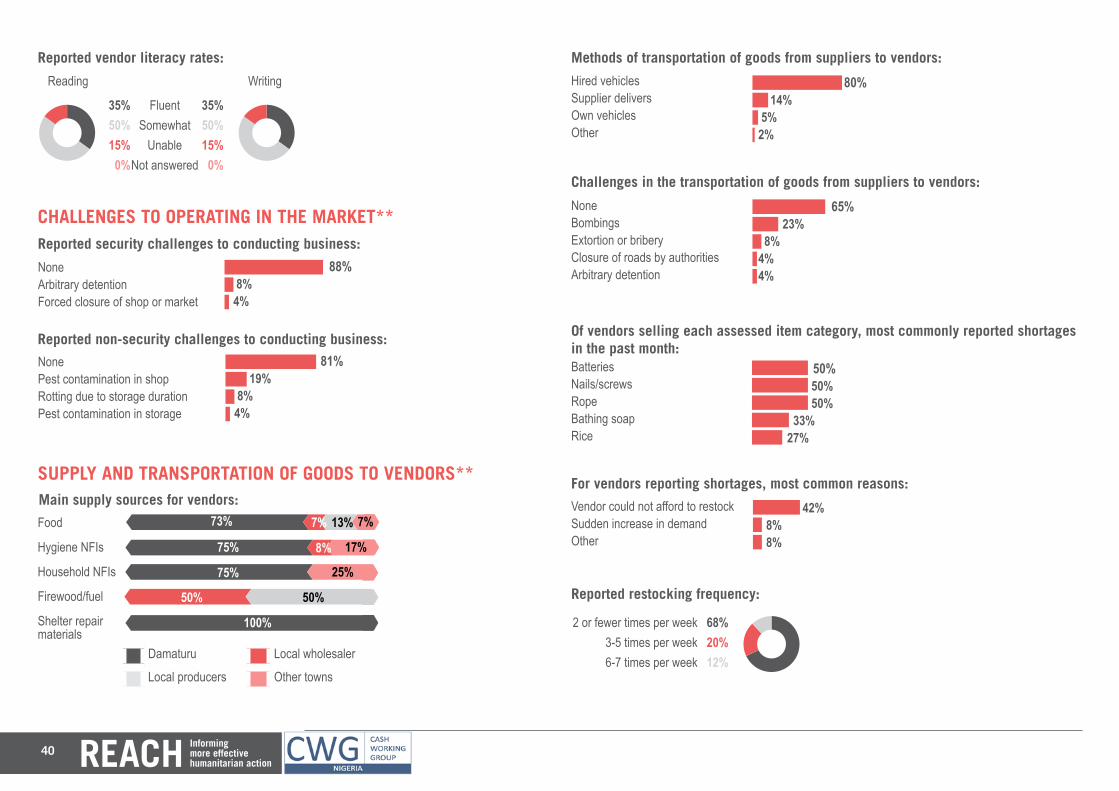
40
Reported vendor literacy rates:
FluentSomewhat
UnableNot answered
Reading Writing
3550+15+0+z35+5015+0z35%50%15%
0%
35%50%15%
0%
CHALLENGES TO OPERATING IN THE MARKET**
Reported non-security challenges to conducting business:
NonePest contamination in shopRotting due to storage durationPest contamination in storage
NoneArbitrary detentionForced closure of shop or market 81+19+8+4+
88+8+4+
81% 19% 8% 4%
88% 8% 4%
Reported security challenges to conducting business:
SUPPLY AND TRANSPORTATION OF GOODS TO VENDORS**
6060606060Main supply sources for vendors:
Damaturu Local wholesaler
Local producers Other towns
73070+130+7073% 7%
75080+0+17075% 8%
7500+0+25075%
0500+500+050% 50%
1000+0+0+0100%
Hired vehiclesSupplier deliversOwn vehiclesOther
80+14+5+2+ 80% 14% 5% 2%
Methods of transportation of goods from suppliers to vendors:
Food
Hygiene NFIs
Household NFIs
Firewood/fuel
Shelter repair materials
13%
25%
17%
7%
Challenges in the transportation of goods from suppliers to vendors:
NoneBombingsExtortion or briberyClosure of roads by authoritiesArbitrary detention
65+23+8+4+4 65% 23% 8% 4% 4%
Of vendors selling each assessed item category, most commonly reported shortages in the past month: 50+50+50+33+27 50%
50% 50% 33% 27%
BatteriesNails/screwsRopeBathing soapRice
For vendors reporting shortages, most common reasons:42+8+8 42% 8% 8%
Vendor could not afford to restockSudden increase in demandOther
Reported restocking frequency:
2 or fewer times per week3-5 times per week6-7 times per week 682012z68%
20%12%
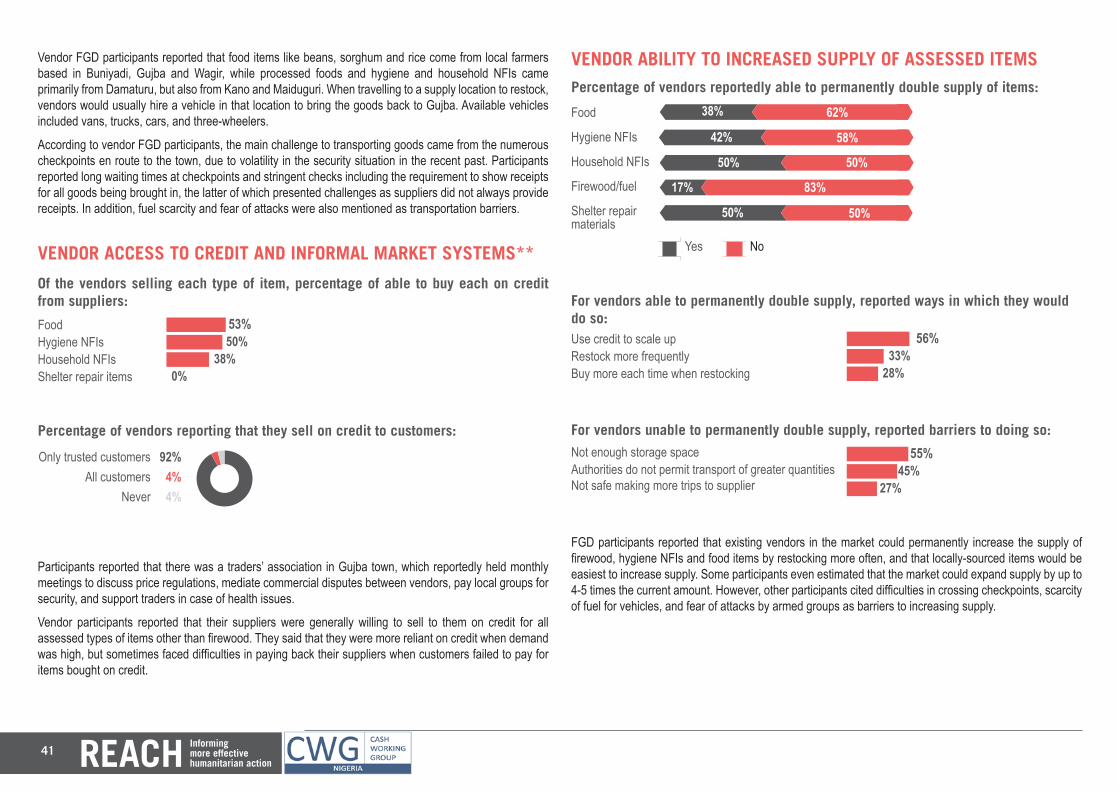
41
Vendor FGD participants reported that food items like beans, sorghum and rice come from local farmers based in Buniyadi, Gujba and Wagir, while processed foods and hygiene and household NFIs came primarily from Damaturu, but also from Kano and Maiduguri. When travelling to a supply location to restock, vendors would usually hire a vehicle in that location to bring the goods back to Gujba. Available vehicles included vans, trucks, cars, and three-wheelers.
According to vendor FGD participants, the main challenge to transporting goods came from the numerous checkpoints en route to the town, due to volatility in the security situation in the recent past. Participants reported long waiting times at checkpoints and stringent checks including the requirement to show receipts for all goods being brought in, the latter of which presented challenges as suppliers did not always provide receipts. In addition, fuel scarcity and fear of attacks were also mentioned as transportation barriers.
VENDOR ACCESS TO CREDIT AND INFORMAL MARKET SYSTEMS**
Participants reported that there was a traders’ association in Gujba town, which reportedly held monthly meetings to discuss price regulations, mediate commercial disputes between vendors, pay local groups for security, and support traders in case of health issues.
Vendor participants reported that their suppliers were generally willing to sell to them on credit for all assessed types of items other than firewood. They said that they were more reliant on credit when demand was high, but sometimes faced difficulties in paying back their suppliers when customers failed to pay for items bought on credit.
Of the vendors selling each type of item, percentage of able to buy each on credit from suppliers:
FoodHygiene NFIsHousehold NFIsShelter repair items
53+50+38+0 53% 50% 38%0%
Percentage of vendors reporting that they sell on credit to customers:
Only trusted customersAll customers
Never 9244z92%4%4%
VENDOR ABILITY TO INCREASED SUPPLY OF ASSESSED ITEMS
Yes No
Percentage of vendors reportedly able to permanently double supply of items:
6060
380620
60
38% 62%
420580
60
42% 58%
500500
60
50% 50%
17083017% 83%
50050050% 50%
Food
Hygiene NFIs
Household NFIs
Firewood/fuel
Shelter repair materials
For vendors able to permanently double supply, reported ways in which they would do so:Use credit to scale upRestock more frequentlyBuy more each time when restocking
56+33+28 56% 33% 28%
For vendors unable to permanently double supply, reported barriers to doing so:Not enough storage spaceAuthorities do not permit transport of greater quantitiesNot safe making more trips to supplier
55+45+27 55% 45% 27%
FGD participants reported that existing vendors in the market could permanently increase the supply of firewood, hygiene NFIs and food items by restocking more often, and that locally-sourced items would be easiest to increase supply. Some participants even estimated that the market could expand supply by up to 4-5 times the current amount. However, other participants cited difficulties in crossing checkpoints, scarcity of fuel for vehicles, and fear of attacks by armed groups as barriers to increasing supply.
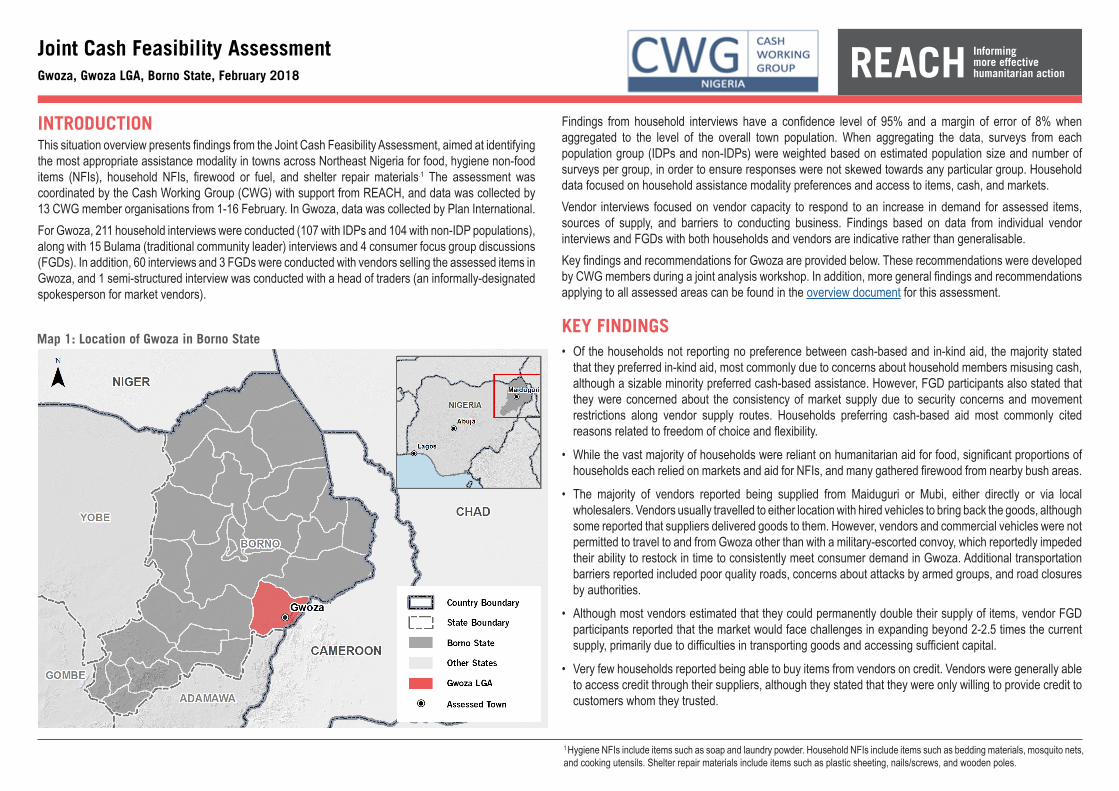
INTRODUCTIONThis situation overview presents findings from the Joint Cash Feasibility Assessment, aimed at identifying the most appropriate assistance modality in towns across Northeast Nigeria for food, hygiene non-food items (NFIs), household NFIs, firewood or fuel, and shelter repair materials.1 The assessment was coordinated by the Cash Working Group (CWG) with support from REACH, and data was collected by 13 CWG member organisations from 1-16 February. In Gwoza, data was collected by Plan International.For Gwoza, 211 household interviews were conducted (107 with IDPs and 104 with non-IDP populations), along with 15 Bulama (traditional community leader) interviews and 4 consumer focus group discussions (FGDs). In addition, 60 interviews and 3 FGDs were conducted with vendors selling the assessed items in Gwoza, and 1 semi-structured interview was conducted with a head of traders (an informally-designated spokesperson for market vendors).
Joint Cash Feasibility AssessmentGwoza, Gwoza LGA, Borno State, February 2018
Findings from household interviews have a confidence level of 95% and a margin of error of 8% when aggregated to the level of the overall town population. When aggregating the data, surveys from each population group (IDPs and non-IDPs) were weighted based on estimated population size and number of surveys per group, in order to ensure responses were not skewed towards any particular group. Household data focused on household assistance modality preferences and access to items, cash, and markets.Vendor interviews focused on vendor capacity to respond to an increase in demand for assessed items, sources of supply, and barriers to conducting business. Findings based on data from individual vendor interviews and FGDs with both households and vendors are indicative rather than generalisable.Key findings and recommendations for Gwoza are provided below. These recommendations were developed by CWG members during a joint analysis workshop. In addition, more general findings and recommendations applying to all assessed areas can be found in the overview document for this assessment.
KEY FINDINGS• Of the households not reporting no preference between cash-based and in-kind aid, the majority stated
that they preferred in-kind aid, most commonly due to concerns about household members misusing cash, although a sizable minority preferred cash-based assistance. However, FGD participants also stated that they were concerned about the consistency of market supply due to security concerns and movement restrictions along vendor supply routes. Households preferring cash-based aid most commonly cited reasons related to freedom of choice and flexibility.
• While the vast majority of households were reliant on humanitarian aid for food, significant proportions of households each relied on markets and aid for NFIs, and many gathered firewood from nearby bush areas.
• The majority of vendors reported being supplied from Maiduguri or Mubi, either directly or via local wholesalers. Vendors usually travelled to either location with hired vehicles to bring back the goods, although some reported that suppliers delivered goods to them. However, vendors and commercial vehicles were not permitted to travel to and from Gwoza other than with a military-escorted convoy, which reportedly impeded their ability to restock in time to consistently meet consumer demand in Gwoza. Additional transportation barriers reported included poor quality roads, concerns about attacks by armed groups, and road closures by authorities.
• Although most vendors estimated that they could permanently double their supply of items, vendor FGD participants reported that the market would face challenges in expanding beyond 2-2.5 times the current supply, primarily due to difficulties in transporting goods and accessing sufficient capital.
• Very few households reported being able to buy items from vendors on credit. Vendors were generally able to access credit through their suppliers, although they stated that they were only willing to provide credit to customers whom they trusted.
Map 1: Location of Gwoza in Borno State
1 Hygiene NFIs include items such as soap and laundry powder. Household NFIs include items such as bedding materials, mosquito nets, and cooking utensils. Shelter repair materials include items such as plastic sheeting, nails/screws, and wooden poles.
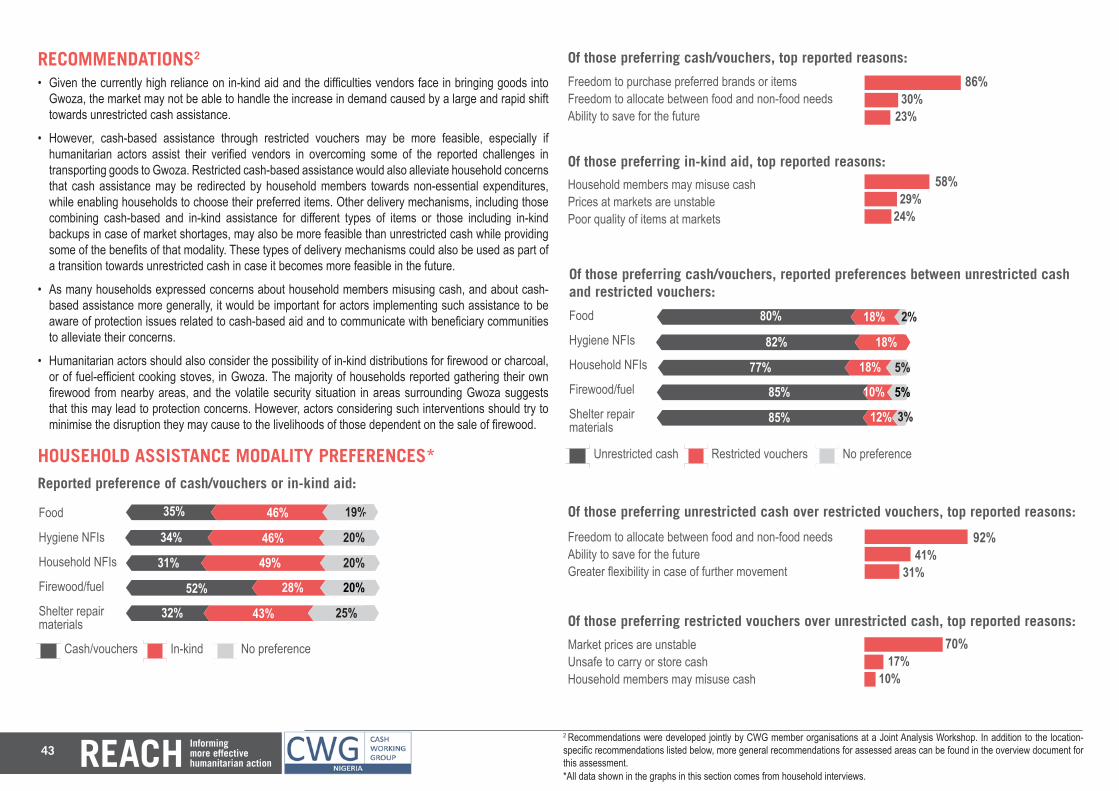
43
60
320430+250
RECOMMENDATIONS2
• Given the currently high reliance on in-kind aid and the difficulties vendors face in bringing goods into Gwoza, the market may not be able to handle the increase in demand caused by a large and rapid shift towards unrestricted cash assistance.
• However, cash-based assistance through restricted vouchers may be more feasible, especially if humanitarian actors assist their verified vendors in overcoming some of the reported challenges in transporting goods to Gwoza. Restricted cash-based assistance would also alleviate household concerns that cash assistance may be redirected by household members towards non-essential expenditures, while enabling households to choose their preferred items. Other delivery mechanisms, including those combining cash-based and in-kind assistance for different types of items or those including in-kind backups in case of market shortages, may also be more feasible than unrestricted cash while providing some of the benefits of that modality. These types of delivery mechanisms could also be used as part of a transition towards unrestricted cash in case it becomes more feasible in the future.
• As many households expressed concerns about household members misusing cash, and about cash-based assistance more generally, it would be important for actors implementing such assistance to be aware of protection issues related to cash-based aid and to communicate with beneficiary communities to alleviate their concerns.
• Humanitarian actors should also consider the possibility of in-kind distributions for firewood or charcoal, or of fuel-efficient cooking stoves, in Gwoza. The majority of households reported gathering their own firewood from nearby areas, and the volatile security situation in areas surrounding Gwoza suggests that this may lead to protection concerns. However, actors considering such interventions should try to minimise the disruption they may cause to the livelihoods of those dependent on the sale of firewood.
HOUSEHOLD ASSISTANCE MODALITY PREFERENCES*
6060
Reported preference of cash/vouchers or in-kind aid:
Food
Hygiene NFIs
Household NFIs
Firewood/fuel
Shelter repair materials
Of those preferring in-kind aid, top reported reasons:
Household members may misuse cash Prices at markets are unstable Poor quality of items at markets
58+29+24 58% 29% 24%
350460+190
60
35% 46% 19%
Of those preferring cash/vouchers, top reported reasons:
Freedom to purchase preferred brands or items Freedom to allocate between food and non-food needsAbility to save for the future
Cash/vouchers In-kind No preference
340460+200
60
34% 46% 20%
310490+200
60
31% 49% 20%
520280+20052% 28% 20%
32% 43% 25%
86+30+23 86% 30% 23%
60Of those preferring cash/vouchers, reported preferences between unrestricted cash and restricted vouchers:
Food
Hygiene NFIs
Household NFIs
Firewood/fuel
Shelter repair materials
Of those preferring restricted vouchers over unrestricted cash, top reported reasons:
Market prices are unstable Unsafe to carry or store cash Household members may misuse cash
70+17+10 70% 17%10%
Of those preferring unrestricted cash over restricted vouchers, top reported reasons:92+41+31 92% 41% 31%
Freedom to allocate between food and non-food needs Ability to save for the futureGreater flexibility in case of further movement
6060
800180+2080% 18% 2%
820180
60
82% 18%
770170+50
60
77% 18% 5%
850100+5085% 10% 5%
850120+3085% 12% 3%
Unrestricted cash Restricted vouchers No preference
2 Recommendations were developed jointly by CWG member organisations at a Joint Analysis Workshop. In addition to the location-specific recommendations listed below, more general recommendations for assessed areas can be found in the overview document for this assessment.*All data shown in the graphs in this section comes from household interviews.
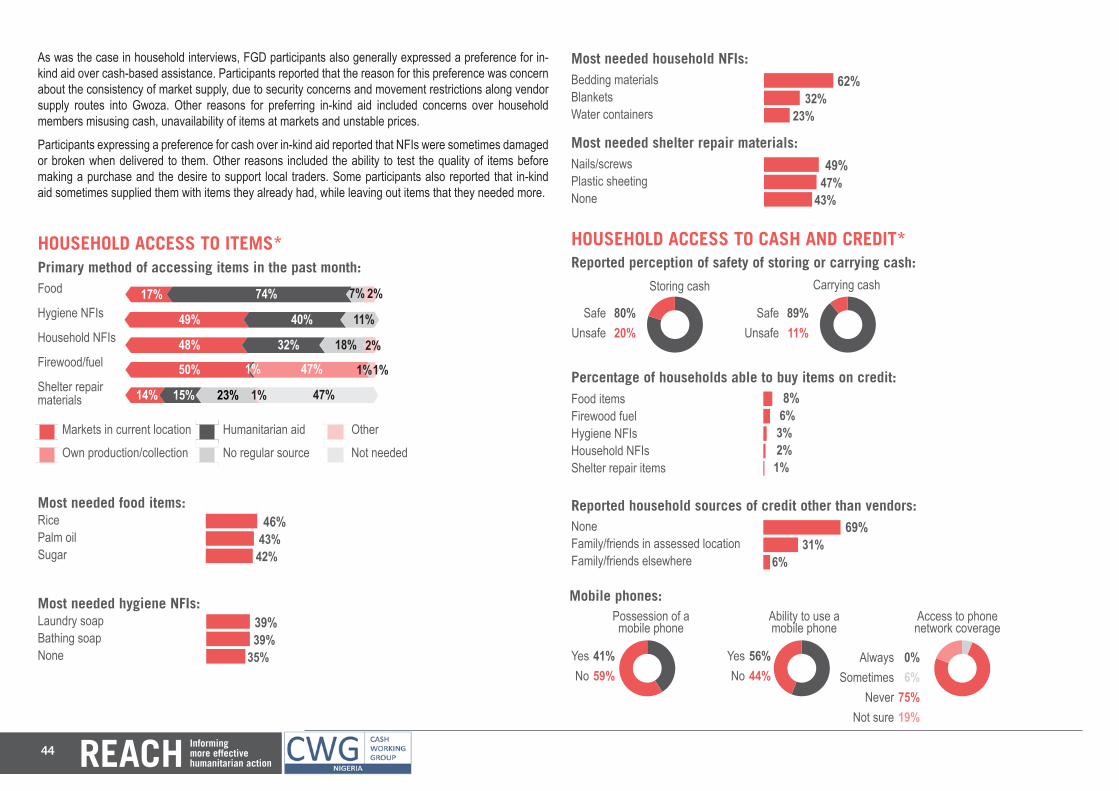
44
Primary method of accessing items in the past month:
Markets in current location Humanitarian aid Other
Own production/collection No regular source Not needed
Food
Hygiene NFIs
Household NFIs
Firewood/fuel
Shelter repair materials
6060
170740+0+70+20
60
17% 74%
490400+0+110+0
60
49% 40%
480+3200+180+20
60
48% 32%
500+10470+10+1050% 1% 47%
140+150230+10+47014% 15% 23%
HOUSEHOLD ACCESS TO ITEMS*
Most needed food items: 46+43+42 46% 43% 42%
RicePalm oilSugar
Most needed hygiene NFIs: 39+39+35 39% 39% 35%
Laundry soapBathing soapNone
Most needed household NFIs: 62+32+23+ 62% 32% 23%
Bedding materialsBlanketsWater containers
Most needed shelter repair materials:49+47+43 49% 47% 43%
Nails/screwsPlastic sheetingNone
HOUSEHOLD ACCESS TO CASH AND CREDIT*
7%
11%
18%
1%
1%
2%
2%
1%
47%
As was the case in household interviews, FGD participants also generally expressed a preference for in-kind aid over cash-based assistance. Participants reported that the reason for this preference was concern about the consistency of market supply, due to security concerns and movement restrictions along vendor supply routes into Gwoza. Other reasons for preferring in-kind aid included concerns over household members misusing cash, unavailability of items at markets and unstable prices.
Participants expressing a preference for cash over in-kind aid reported that NFIs were sometimes damaged or broken when delivered to them. Other reasons included the ability to test the quality of items before making a purchase and the desire to support local traders. Some participants also reported that in-kind aid sometimes supplied them with items they already had, while leaving out items that they needed more.
Percentage of households able to buy items on credit:Food items Firewood fuel Hygiene NFIsHousehold NFIsShelter repair items
8+6+3+2+1 8% 6% 3% 2% 1%
Reported household sources of credit other than vendors:69+31+6NoneFamily/friends in assessed locationFamily/friends elsewhere
69% 31% 6%
89+11+zReported perception of safety of storing or carrying cash:
SafeUnsafe 80+20+z
Storing cash Carrying cash
80%20%
SafeUnsafe
89%11%
56+44+zMobile phones:
YesNo 41+59+z
Possession of a mobile phone
41%59%
YesNo
56%44%
Ability to use a mobile phone
AlwaysSometimes
NeverNot sure
0%6%
75%19%
Access to phone network coverage
06+75+19+z
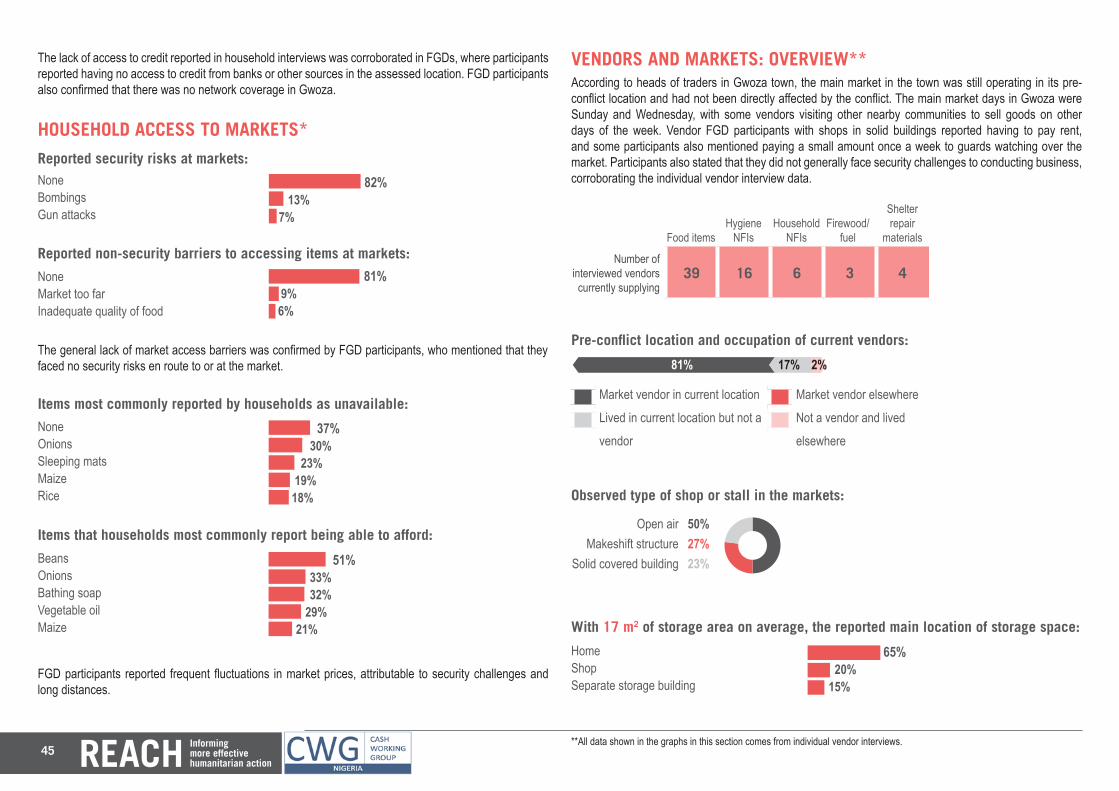
45
HOUSEHOLD ACCESS TO MARKETS*
The general lack of market access barriers was confirmed by FGD participants, who mentioned that they faced no security risks en route to or at the market.
Reported non-security barriers to accessing items at markets:
Reported security risks at markets: 82+13+7NoneBombingsGun attacks
82% 13%7%81+9+6None
Market too farInadequate quality of food
81% 9% 6%
FGD participants reported frequent fluctuations in market prices, attributable to security challenges and long distances.
Items most commonly reported by households as unavailable:37+30+23+19+18 37% 30% 23% 19%18%
NoneOnionsSleeping matsMaizeRice
Items that households most commonly report being able to afford:51+33+32+29+21 51% 33% 32% 29% 21%
BeansOnionsBathing soapVegetable oilMaize
The lack of access to credit reported in household interviews was corroborated in FGDs, where participants reported having no access to credit from banks or other sources in the assessed location. FGD participants also confirmed that there was no network coverage in Gwoza.
VENDORS AND MARKETS: OVERVIEW**According to heads of traders in Gwoza town, the main market in the town was still operating in its pre-conflict location and had not been directly affected by the conflict. The main market days in Gwoza were Sunday and Wednesday, with some vendors visiting other nearby communities to sell goods on other days of the week. Vendor FGD participants with shops in solid buildings reported having to pay rent, and some participants also mentioned paying a small amount once a week to guards watching over the market. Participants also stated that they did not generally face security challenges to conducting business, corroborating the individual vendor interview data.
Number of interviewed vendors currently supplying
39 16 6 3 4
Food itemsHygiene
NFIsHousehold
NFIsFirewood/
fuel
Shelter repair
materials
Market vendor in current location Market vendor elsewhere
Lived in current location but not a Not a vendor and lived
vendor elsewhere
Pre-conflict location and occupation of current vendors:
8100+170+20
60
81% 17% 2%
65+20+15+Observed type of shop or stall in the markets:
With 17 m2 of storage area on average, the reported main location of storage space:
Open airMakeshift structure
Solid covered building 502723z50%27%23%
HomeShopSeparate storage building
65% 20% 15%
**All data shown in the graphs in this section comes from individual vendor interviews.
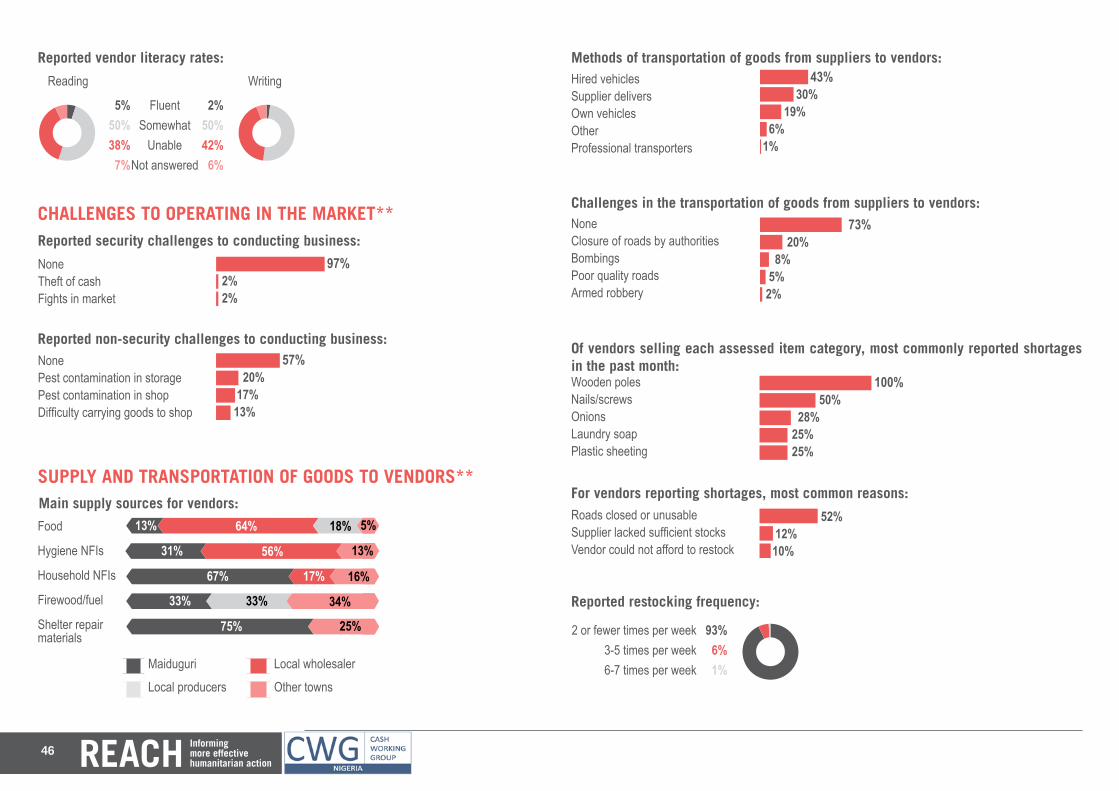
46
Reported vendor literacy rates:
FluentSomewhat
UnableNot answered
Reading Writing
250+42+6+z5+5038+7z2%
50%42%
6%
5%50%38%
7%
CHALLENGES TO OPERATING IN THE MARKET**
Reported non-security challenges to conducting business:NonePest contamination in storagePest contamination in shopDifficulty carrying goods to shop
NoneTheft of cashFights in market 57+20+17+13+
97+2+2+
57% 20% 17% 13%
97% 2% 2%
Reported security challenges to conducting business:
SUPPLY AND TRANSPORTATION OF GOODS TO VENDORS**
6060606060Main supply sources for vendors:
Maiduguri Local wholesaler
Local producers Other towns
130640+180+5013% 64%
310560+0+13031% 56%
670170+0+16067% 17%
3300+330+34033% 33%
7500+0+25075%
Food
Hygiene NFIs
Household NFIs
Firewood/fuel
Shelter repair materials
18%
25%
34%
16%
13%
5%
Hired vehiclesSupplier deliversOwn vehiclesOtherProfessional transporters
43+30+19+6+1 43% 30% 19% 6% 1%
Methods of transportation of goods from suppliers to vendors:
Challenges in the transportation of goods from suppliers to vendors:NoneClosure of roads by authoritiesBombingsPoor quality roadsArmed robbery
73+20+8+5+2 73% 20% 8% 5% 2%
Of vendors selling each assessed item category, most commonly reported shortages in the past month: 100+50+28+25+25 100%
50% 28% 25% 25%
Wooden polesNails/screwsOnionsLaundry soapPlastic sheeting
For vendors reporting shortages, most common reasons:52+12+10 52% 12% 10%
Roads closed or unusableSupplier lacked sufficient stocksVendor could not afford to restock
Reported restocking frequency:
2 or fewer times per week3-5 times per week6-7 times per week 9361z93%
6%1%
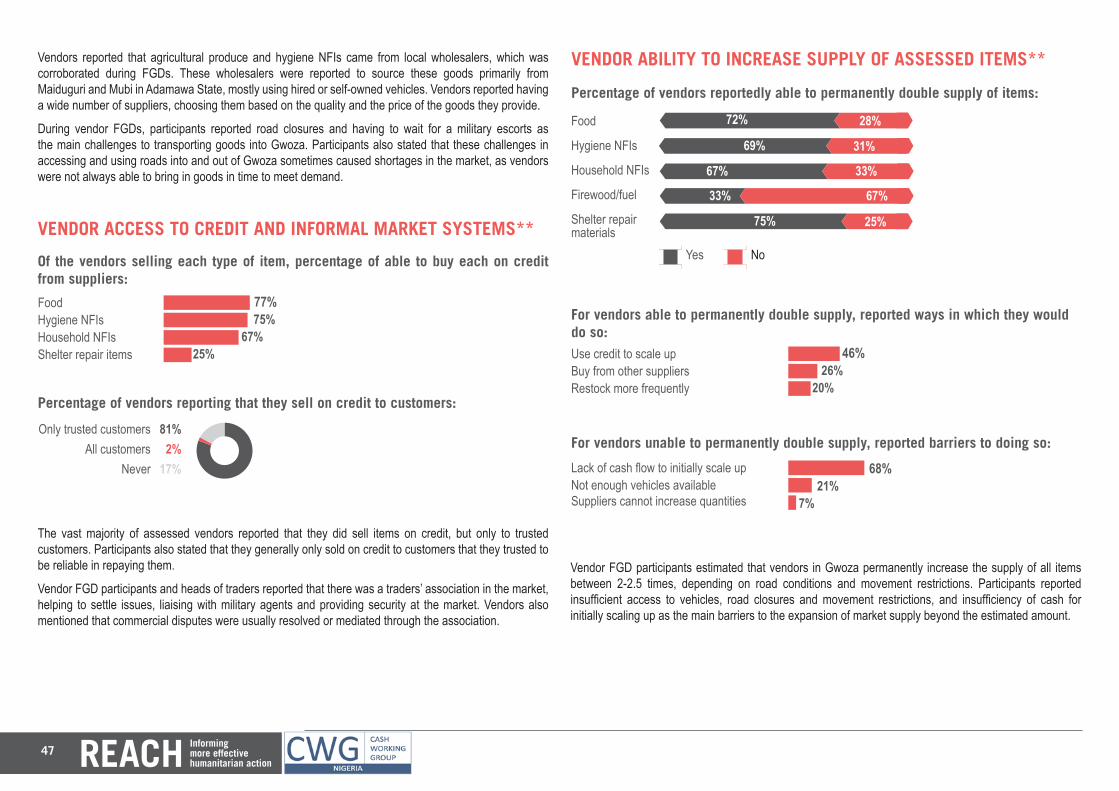
47
Vendors reported that agricultural produce and hygiene NFIs came from local wholesalers, which was corroborated during FGDs. These wholesalers were reported to source these goods primarily from Maiduguri and Mubi in Adamawa State, mostly using hired or self-owned vehicles. Vendors reported having a wide number of suppliers, choosing them based on the quality and the price of the goods they provide.
During vendor FGDs, participants reported road closures and having to wait for a military escorts as the main challenges to transporting goods into Gwoza. Participants also stated that these challenges in accessing and using roads into and out of Gwoza sometimes caused shortages in the market, as vendors were not always able to bring in goods in time to meet demand.
VENDOR ACCESS TO CREDIT AND INFORMAL MARKET SYSTEMS**
The vast majority of assessed vendors reported that they did sell items on credit, but only to trusted customers. Participants also stated that they generally only sold on credit to customers that they trusted to be reliable in repaying them.
Vendor FGD participants and heads of traders reported that there was a traders’ association in the market, helping to settle issues, liaising with military agents and providing security at the market. Vendors also mentioned that commercial disputes were usually resolved or mediated through the association.
Of the vendors selling each type of item, percentage of able to buy each on credit from suppliers:
FoodHygiene NFIsHousehold NFIsShelter repair items
77+75+67+25+ 77% 75% 67% 25%
Percentage of vendors reporting that they sell on credit to customers:
Only trusted customersAll customers
Never 81217z81%2%
17%
VENDOR ABILITY TO INCREASE SUPPLY OF ASSESSED ITEMS**
Yes No
Percentage of vendors reportedly able to permanently double supply of items:
6060
720280
60
72% 28%
690310
60
69% 31%
670330
60
67% 33%
33067033% 67%
75025075% 25%
Food
Hygiene NFIs
Household NFIs
Firewood/fuel
Shelter repair materials
For vendors able to permanently double supply, reported ways in which they would do so:Use credit to scale upBuy from other suppliersRestock more frequently
46+26+20 46% 26% 20%
For vendors unable to permanently double supply, reported barriers to doing so:
Lack of cash flow to initially scale upNot enough vehicles availableSuppliers cannot increase quantities
68+21+7 68% 21% 7%
Vendor FGD participants estimated that vendors in Gwoza permanently increase the supply of all items between 2-2.5 times, depending on road conditions and movement restrictions. Participants reported insufficient access to vehicles, road closures and movement restrictions, and insufficiency of cash for initially scaling up as the main barriers to the expansion of market supply beyond the estimated amount.
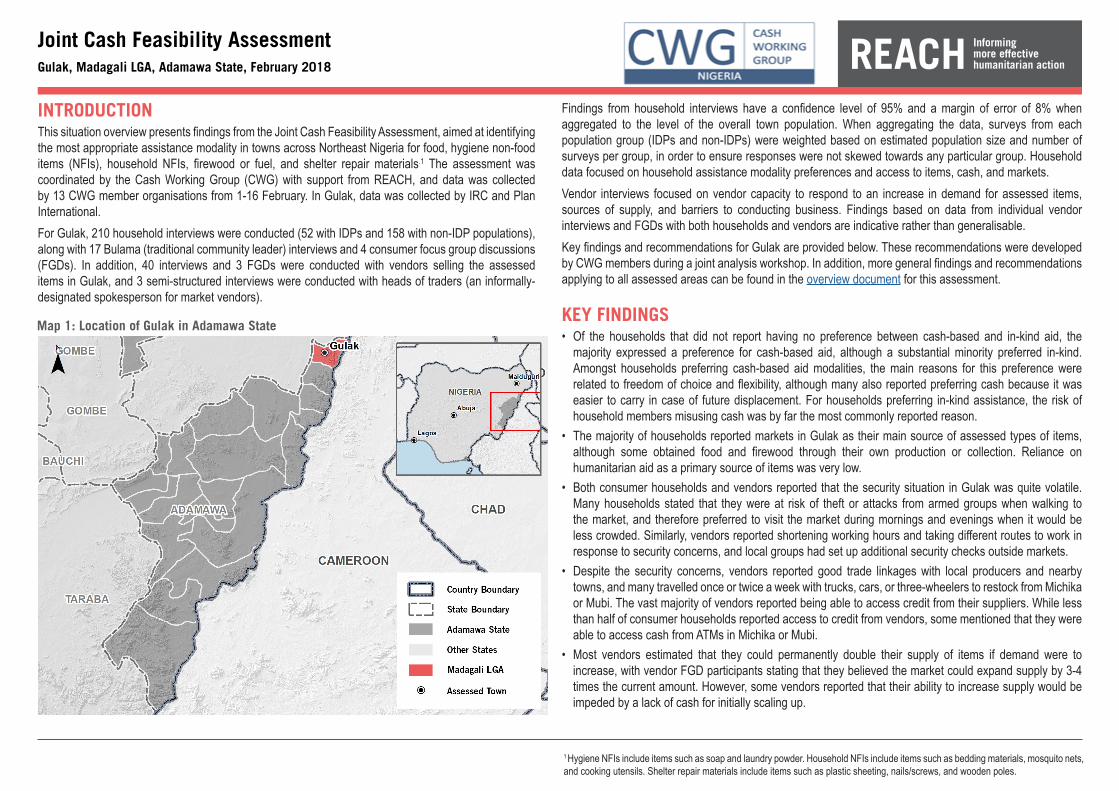
INTRODUCTIONThis situation overview presents findings from the Joint Cash Feasibility Assessment, aimed at identifying the most appropriate assistance modality in towns across Northeast Nigeria for food, hygiene non-food items (NFIs), household NFIs, firewood or fuel, and shelter repair materials.1 The assessment was coordinated by the Cash Working Group (CWG) with support from REACH, and data was collected by 13 CWG member organisations from 1-16 February. In Gulak, data was collected by IRC and Plan International.For Gulak, 210 household interviews were conducted (52 with IDPs and 158 with non-IDP populations), along with 17 Bulama (traditional community leader) interviews and 4 consumer focus group discussions (FGDs). In addition, 40 interviews and 3 FGDs were conducted with vendors selling the assessed items in Gulak, and 3 semi-structured interviews were conducted with heads of traders (an informally-designated spokesperson for market vendors).
Joint Cash Feasibility AssessmentGulak, Madagali LGA, Adamawa State, February 2018
Findings from household interviews have a confidence level of 95% and a margin of error of 8% when aggregated to the level of the overall town population. When aggregating the data, surveys from each population group (IDPs and non-IDPs) were weighted based on estimated population size and number of surveys per group, in order to ensure responses were not skewed towards any particular group. Household data focused on household assistance modality preferences and access to items, cash, and markets.Vendor interviews focused on vendor capacity to respond to an increase in demand for assessed items, sources of supply, and barriers to conducting business. Findings based on data from individual vendor interviews and FGDs with both households and vendors are indicative rather than generalisable.Key findings and recommendations for Gulak are provided below. These recommendations were developed by CWG members during a joint analysis workshop. In addition, more general findings and recommendations applying to all assessed areas can be found in the overview document for this assessment.
KEY FINDINGS• Of the households that did not report having no preference between cash-based and in-kind aid, the
majority expressed a preference for cash-based aid, although a substantial minority preferred in-kind. Amongst households preferring cash-based aid modalities, the main reasons for this preference were related to freedom of choice and flexibility, although many also reported preferring cash because it was easier to carry in case of future displacement. For households preferring in-kind assistance, the risk of household members misusing cash was by far the most commonly reported reason.
• The majority of households reported markets in Gulak as their main source of assessed types of items, although some obtained food and firewood through their own production or collection. Reliance on humanitarian aid as a primary source of items was very low.
• Both consumer households and vendors reported that the security situation in Gulak was quite volatile. Many households stated that they were at risk of theft or attacks from armed groups when walking to the market, and therefore preferred to visit the market during mornings and evenings when it would be less crowded. Similarly, vendors reported shortening working hours and taking different routes to work in response to security concerns, and local groups had set up additional security checks outside markets.
• Despite the security concerns, vendors reported good trade linkages with local producers and nearby towns, and many travelled once or twice a week with trucks, cars, or three-wheelers to restock from Michika or Mubi. The vast majority of vendors reported being able to access credit from their suppliers. While less than half of consumer households reported access to credit from vendors, some mentioned that they were able to access cash from ATMs in Michika or Mubi.
• Most vendors estimated that they could permanently double their supply of items if demand were to increase, with vendor FGD participants stating that they believed the market could expand supply by 3-4 times the current amount. However, some vendors reported that their ability to increase supply would be impeded by a lack of cash for initially scaling up.
Map 1: Location of Gulak in Adamawa State
1 Hygiene NFIs include items such as soap and laundry powder. Household NFIs include items such as bedding materials, mosquito nets, and cooking utensils. Shelter repair materials include items such as plastic sheeting, nails/screws, and wooden poles.
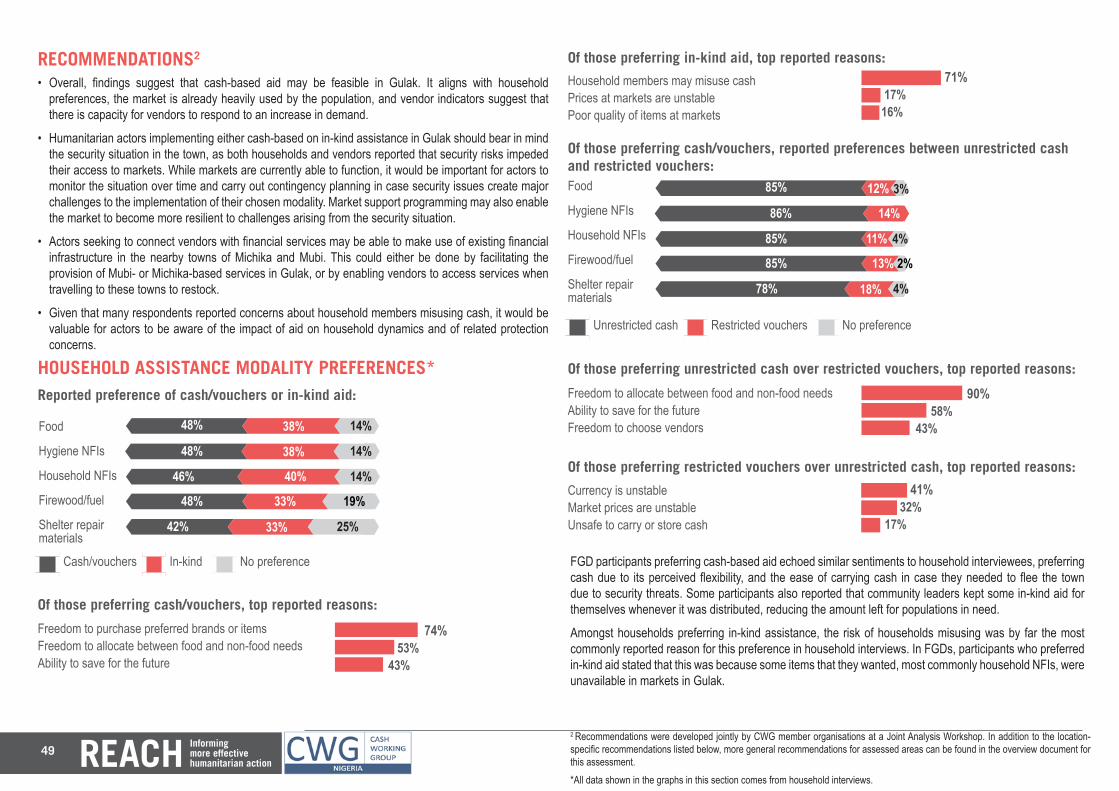
49
60
420330+250
RECOMMENDATIONS2
• Overall, findings suggest that cash-based aid may be feasible in Gulak. It aligns with household preferences, the market is already heavily used by the population, and vendor indicators suggest that there is capacity for vendors to respond to an increase in demand.
• Humanitarian actors implementing either cash-based on in-kind assistance in Gulak should bear in mind the security situation in the town, as both households and vendors reported that security risks impeded their access to markets. While markets are currently able to function, it would be important for actors to monitor the situation over time and carry out contingency planning in case security issues create major challenges to the implementation of their chosen modality. Market support programming may also enable the market to become more resilient to challenges arising from the security situation.
• Actors seeking to connect vendors with financial services may be able to make use of existing financial infrastructure in the nearby towns of Michika and Mubi. This could either be done by facilitating the provision of Mubi- or Michika-based services in Gulak, or by enabling vendors to access services when travelling to these towns to restock.
• Given that many respondents reported concerns about household members misusing cash, it would be valuable for actors to be aware of the impact of aid on household dynamics and of related protection concerns.
HOUSEHOLD ASSISTANCE MODALITY PREFERENCES*
FGD participants preferring cash-based aid echoed similar sentiments to household interviewees, preferring cash due to its perceived flexibility, and the ease of carrying cash in case they needed to flee the town due to security threats. Some participants also reported that community leaders kept some in-kind aid for themselves whenever it was distributed, reducing the amount left for populations in need.
Amongst households preferring in-kind assistance, the risk of households misusing was by far the most commonly reported reason for this preference in household interviews. In FGDs, participants who preferred in-kind aid stated that this was because some items that they wanted, most commonly household NFIs, were unavailable in markets in Gulak.
6060
Reported preference of cash/vouchers or in-kind aid:
Food
Hygiene NFIs
Household NFIs
Firewood/fuel
Shelter repair materials
Of those preferring in-kind aid, top reported reasons:
Household members may misuse cash Prices at markets are unstable Poor quality of items at markets
71+17+16 71% 17% 16%
480380+140
60
48% 38% 14%
Of those preferring cash/vouchers, top reported reasons:
Freedom to purchase preferred brands or items Freedom to allocate between food and non-food needsAbility to save for the future
Cash/vouchers In-kind No preference
480380+140
60
48% 38% 14%
460400+140
60
46% 40% 14%
480330+19048% 33% 19%
42% 33% 25%74+53+43 74% 53% 43%
Of those preferring cash/vouchers, reported preferences between unrestricted cash and restricted vouchers:Food
Hygiene NFIs
Household NFIs
Firewood/fuel
Shelter repair materials
Of those preferring restricted vouchers over unrestricted cash, top reported reasons:
Currency is unstable Market prices are unstable Unsafe to carry or store cash
41+32+17 41% 32% 17%
Of those preferring unrestricted cash over restricted vouchers, top reported reasons:90+58+43 90% 58% 43%
Freedom to allocate between food and non-food needs Ability to save for the futureFreedom to choose vendors
6060
850120+3085% 12% 3%
8600+140
60
86% 14%
850110+40
60
85% 11% 4%
850130+2085% 13% 2%
780180+4078% 18% 4%
Unrestricted cash Restricted vouchers No preference
2 Recommendations were developed jointly by CWG member organisations at a Joint Analysis Workshop. In addition to the location-specific recommendations listed below, more general recommendations for assessed areas can be found in the overview document for this assessment.*All data shown in the graphs in this section comes from household interviews.
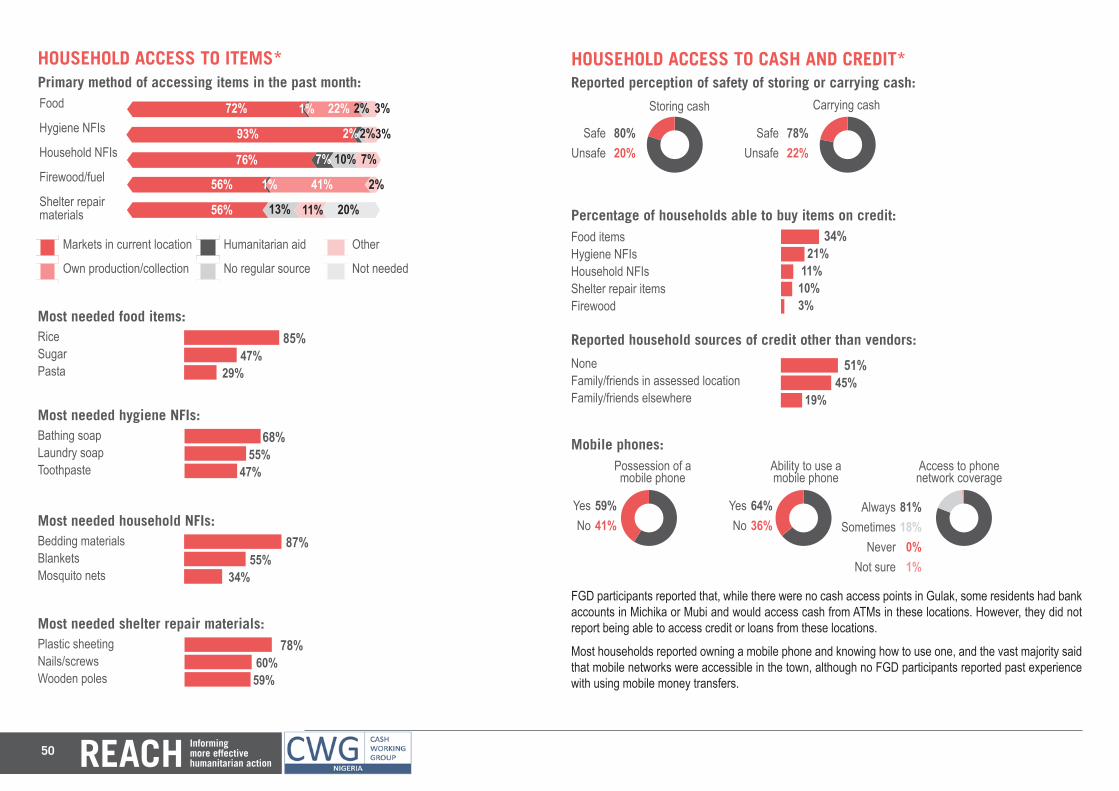
50
Primary method of accessing items in the past month:
Markets in current location Humanitarian aid Other
Own production/collection No regular source Not needed
Food
Hygiene NFIs
Household NFIs
Firewood/fuel
Shelter repair materials
6060
72010+220+20+30
60
72% 1% 22%
93020+0+20+30
60
93% 2%
760+700+100+70
60
76% 7%
560+10410+0+2056% 1% 41%
560+0130+110+20056% 13%
HOUSEHOLD ACCESS TO ITEMS*
Most needed food items:85+47+29 85% 47% 29%
RiceSugarPasta
Most needed hygiene NFIs:68+55+47 68% 55% 47%
Bathing soapLaundry soapToothpaste
Most needed household NFIs:87+55+34 87% 55% 34%
Bedding materialsBlanketsMosquito nets
Most needed shelter repair materials:78+60+59 78% 60% 59%
Plastic sheetingNails/screwsWooden poles
HOUSEHOLD ACCESS TO CASH AND CREDIT*
FGD participants reported that, while there were no cash access points in Gulak, some residents had bank accounts in Michika or Mubi and would access cash from ATMs in these locations. However, they did not report being able to access credit or loans from these locations.
Most households reported owning a mobile phone and knowing how to use one, and the vast majority said that mobile networks were accessible in the town, although no FGD participants reported past experience with using mobile money transfers.
2%
2%
10%
11%
3%
3%
7%
2%
20% Percentage of households able to buy items on credit:Food items Hygiene NFIs Household NFIsShelter repair itemsFirewood
34+21+11+10+3 34% 21% 11% 10% 3%
Reported household sources of credit other than vendors:51+45+19NoneFamily/friends in assessed locationFamily/friends elsewhere
51% 45% 19%
64+36+zMobile phones:
YesNo 59+41+z
Possession of a mobile phone
59%41%
YesNo
64%36%
Ability to use a mobile phone
AlwaysSometimes
NeverNot sure
81%18%
0%1%
Access to phone network coverage
78+22+zReported perception of safety of storing or carrying cash:
SafeUnsafe 80+20+z
Storing cash Carrying cash
80%20%
SafeUnsafe
78%22%
8118+1+z
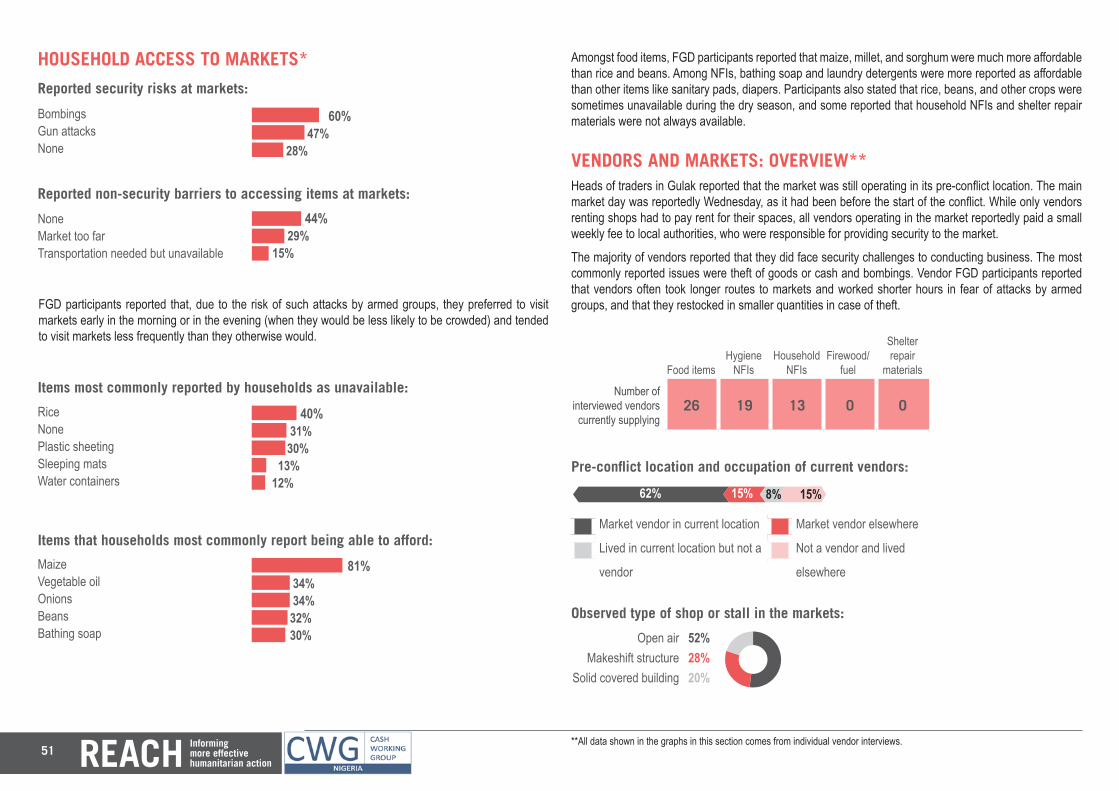
51
HOUSEHOLD ACCESS TO MARKETS*
FGD participants reported that, due to the risk of such attacks by armed groups, they preferred to visit markets early in the morning or in the evening (when they would be less likely to be crowded) and tended to visit markets less frequently than they otherwise would.
Reported non-security barriers to accessing items at markets:
Reported security risks at markets: 60+47+28BombingsGun attacksNone
60% 47% 28%44+29+15None
Market too farTransportation needed but unavailable
44% 29% 15%
Amongst food items, FGD participants reported that maize, millet, and sorghum were much more affordable than rice and beans. Among NFIs, bathing soap and laundry detergents were more reported as affordable than other items like sanitary pads, diapers. Participants also stated that rice, beans, and other crops were sometimes unavailable during the dry season, and some reported that household NFIs and shelter repair materials were not always available.
Items most commonly reported by households as unavailable:40+31+30+13+12 40% 31% 30% 13%12%
RiceNonePlastic sheetingSleeping matsWater containers
Items that households most commonly report being able to afford:81+34+34+32+30 81% 34% 34% 32% 30%
MaizeVegetable oilOnionsBeansBathing soap
VENDORS AND MARKETS: OVERVIEW**Heads of traders in Gulak reported that the market was still operating in its pre-conflict location. The main market day was reportedly Wednesday, as it had been before the start of the conflict. While only vendors renting shops had to pay rent for their spaces, all vendors operating in the market reportedly paid a small weekly fee to local authorities, who were responsible for providing security to the market.
The majority of vendors reported that they did face security challenges to conducting business. The most commonly reported issues were theft of goods or cash and bombings. Vendor FGD participants reported that vendors often took longer routes to markets and worked shorter hours in fear of attacks by armed groups, and that they restocked in smaller quantities in case of theft.
Number of interviewed vendors currently supplying
26 19 13 0 0
Food itemsHygiene
NFIsHousehold
NFIsFirewood/
fuel
Shelter repair
materials
Market vendor in current location Market vendor elsewhere
Lived in current location but not a Not a vendor and lived
vendor elsewhere
Pre-conflict location and occupation of current vendors:
620150+80+150
60
62% 15% 8% 15%
Observed type of shop or stall in the markets:
Open airMakeshift structure
Solid covered building 522820z52%28%20%
**All data shown in the graphs in this section comes from individual vendor interviews.
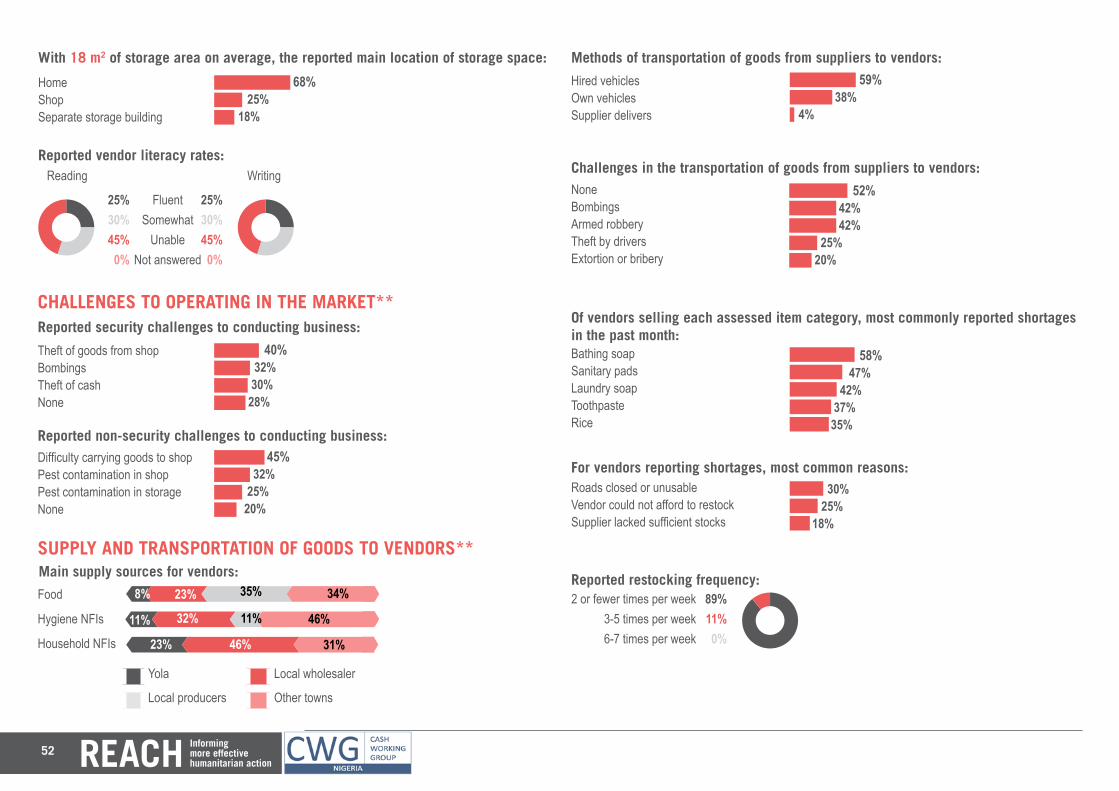
52
68+25+18+With 18 m2 of storage area on average, the reported main location of storage space:
HomeShopSeparate storage building
68% 25% 18%
Reported vendor literacy rates:
FluentSomewhat
UnableNot answered
Reading Writing
2530+45+0+z25+3045+0z25%30%45%
0%
25%30%45%
0%
CHALLENGES TO OPERATING IN THE MARKET**
Reported non-security challenges to conducting business:Difficulty carrying goods to shopPest contamination in shopPest contamination in storageNone
Theft of goods from shopBombingsTheft of cashNone 45+32+25+20
40+32+30+28
45% 32% 25% 20%
40% 32% 30% 28%
Reported security challenges to conducting business:
SUPPLY AND TRANSPORTATION OF GOODS TO VENDORS**
606060Main supply sources for vendors:
Yola Local wholesaler
Local producers Other towns
80230+350+3408% 23%
110320+110+46011% 32%
230460+0+31023% 46%
Food
Hygiene NFIs
Household NFIs
11%
35%
31%
46%
34%
Hired vehiclesOwn vehiclesSupplier delivers
59+38+4+ 59% 38% 4%
Methods of transportation of goods from suppliers to vendors:
Challenges in the transportation of goods from suppliers to vendors:NoneBombingsArmed robberyTheft by driversExtortion or bribery
52+42+42+25+20 52% 42% 42% 25% 20%
Of vendors selling each assessed item category, most commonly reported shortages in the past month: 58+47+42+37+35 58%
47% 42% 37% 35%
Bathing soapSanitary padsLaundry soapToothpasteRice
For vendors reporting shortages, most common reasons:30+25+18 30% 25% 18%
Roads closed or unusableVendor could not afford to restockSupplier lacked sufficient stocks
Reported restocking frequency:2 or fewer times per week
3-5 times per week6-7 times per week 89110z89%
11%0%
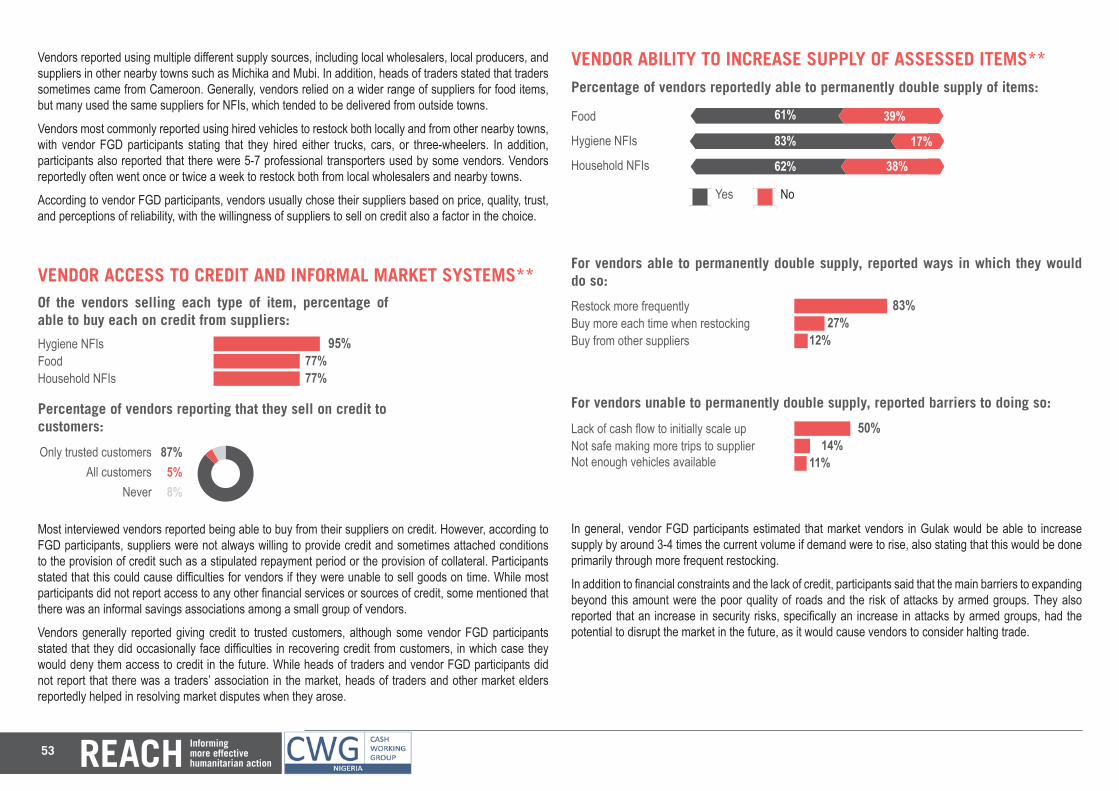
53
Vendors reported using multiple different supply sources, including local wholesalers, local producers, and suppliers in other nearby towns such as Michika and Mubi. In addition, heads of traders stated that traders sometimes came from Cameroon. Generally, vendors relied on a wider range of suppliers for food items, but many used the same suppliers for NFIs, which tended to be delivered from outside towns.
Vendors most commonly reported using hired vehicles to restock both locally and from other nearby towns, with vendor FGD participants stating that they hired either trucks, cars, or three-wheelers. In addition, participants also reported that there were 5-7 professional transporters used by some vendors. Vendors reportedly often went once or twice a week to restock both from local wholesalers and nearby towns.
According to vendor FGD participants, vendors usually chose their suppliers based on price, quality, trust, and perceptions of reliability, with the willingness of suppliers to sell on credit also a factor in the choice.
VENDOR ACCESS TO CREDIT AND INFORMAL MARKET SYSTEMS**
Most interviewed vendors reported being able to buy from their suppliers on credit. However, according to FGD participants, suppliers were not always willing to provide credit and sometimes attached conditions to the provision of credit such as a stipulated repayment period or the provision of collateral. Participants stated that this could cause difficulties for vendors if they were unable to sell goods on time. While most participants did not report access to any other financial services or sources of credit, some mentioned that there was an informal savings associations among a small group of vendors.
Vendors generally reported giving credit to trusted customers, although some vendor FGD participants stated that they did occasionally face difficulties in recovering credit from customers, in which case they would deny them access to credit in the future. While heads of traders and vendor FGD participants did not report that there was a traders’ association in the market, heads of traders and other market elders reportedly helped in resolving market disputes when they arose.
Of the vendors selling each type of item, percentage of able to buy each on credit from suppliers:
Hygiene NFIsFoodHousehold NFIs
95+77+77+ 95% 77% 77%
Percentage of vendors reporting that they sell on credit to customers:
Only trusted customersAll customers
Never 8758z87%5%8%
VENDOR ABILITY TO INCREASE SUPPLY OF ASSESSED ITEMS**
Yes No
Percentage of vendors reportedly able to permanently double supply of items:
610390
60
61% 39%
830170
60
83% 17%
620380
60
62% 38%
Food
Hygiene NFIs
Household NFIs
For vendors able to permanently double supply, reported ways in which they would do so:
Restock more frequentlyBuy more each time when restockingBuy from other suppliers
83+27+12 83% 27% 12%
For vendors unable to permanently double supply, reported barriers to doing so:
Lack of cash flow to initially scale upNot safe making more trips to supplierNot enough vehicles available
50+14+11 50% 14% 11%
In general, vendor FGD participants estimated that market vendors in Gulak would be able to increase supply by around 3-4 times the current volume if demand were to rise, also stating that this would be done primarily through more frequent restocking.
In addition to financial constraints and the lack of credit, participants said that the main barriers to expanding beyond this amount were the poor quality of roads and the risk of attacks by armed groups. They also reported that an increase in security risks, specifically an increase in attacks by armed groups, had the potential to disrupt the market in the future, as it would cause vendors to consider halting trade.
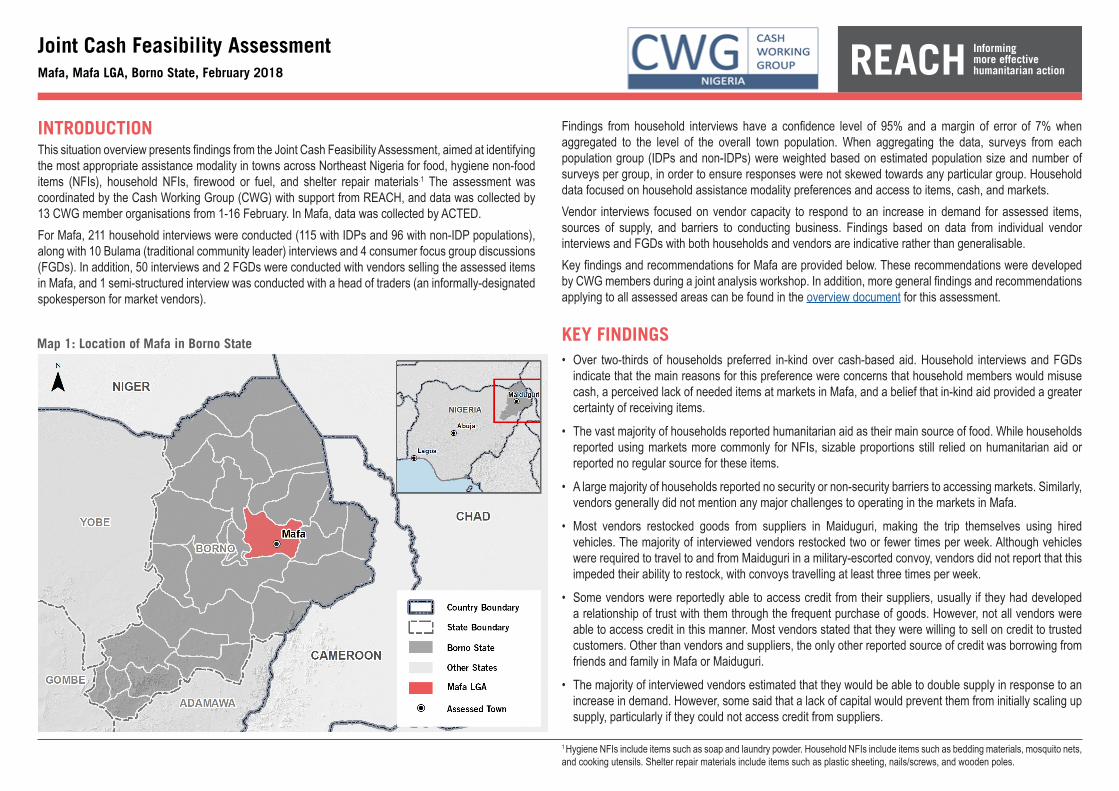
INTRODUCTIONThis situation overview presents findings from the Joint Cash Feasibility Assessment, aimed at identifying the most appropriate assistance modality in towns across Northeast Nigeria for food, hygiene non-food items (NFIs), household NFIs, firewood or fuel, and shelter repair materials.1 The assessment was coordinated by the Cash Working Group (CWG) with support from REACH, and data was collected by 13 CWG member organisations from 1-16 February. In Mafa, data was collected by ACTED.For Mafa, 211 household interviews were conducted (115 with IDPs and 96 with non-IDP populations), along with 10 Bulama (traditional community leader) interviews and 4 consumer focus group discussions (FGDs). In addition, 50 interviews and 2 FGDs were conducted with vendors selling the assessed items in Mafa, and 1 semi-structured interview was conducted with a head of traders (an informally-designated spokesperson for market vendors).
Joint Cash Feasibility AssessmentMafa, Mafa LGA, Borno State, February 2018
Findings from household interviews have a confidence level of 95% and a margin of error of 7% when aggregated to the level of the overall town population. When aggregating the data, surveys from each population group (IDPs and non-IDPs) were weighted based on estimated population size and number of surveys per group, in order to ensure responses were not skewed towards any particular group. Household data focused on household assistance modality preferences and access to items, cash, and markets.Vendor interviews focused on vendor capacity to respond to an increase in demand for assessed items, sources of supply, and barriers to conducting business. Findings based on data from individual vendor interviews and FGDs with both households and vendors are indicative rather than generalisable.Key findings and recommendations for Mafa are provided below. These recommendations were developed by CWG members during a joint analysis workshop. In addition, more general findings and recommendations applying to all assessed areas can be found in the overview document for this assessment.
KEY FINDINGS• Over two-thirds of households preferred in-kind over cash-based aid. Household interviews and FGDs
indicate that the main reasons for this preference were concerns that household members would misuse cash, a perceived lack of needed items at markets in Mafa, and a belief that in-kind aid provided a greater certainty of receiving items.
• The vast majority of households reported humanitarian aid as their main source of food. While households reported using markets more commonly for NFIs, sizable proportions still relied on humanitarian aid or reported no regular source for these items.
• A large majority of households reported no security or non-security barriers to accessing markets. Similarly, vendors generally did not mention any major challenges to operating in the markets in Mafa.
• Most vendors restocked goods from suppliers in Maiduguri, making the trip themselves using hired vehicles. The majority of interviewed vendors restocked two or fewer times per week. Although vehicles were required to travel to and from Maiduguri in a military-escorted convoy, vendors did not report that this impeded their ability to restock, with convoys travelling at least three times per week.
• Some vendors were reportedly able to access credit from their suppliers, usually if they had developed a relationship of trust with them through the frequent purchase of goods. However, not all vendors were able to access credit in this manner. Most vendors stated that they were willing to sell on credit to trusted customers. Other than vendors and suppliers, the only other reported source of credit was borrowing from friends and family in Mafa or Maiduguri.
• The majority of interviewed vendors estimated that they would be able to double supply in response to an increase in demand. However, some said that a lack of capital would prevent them from initially scaling up supply, particularly if they could not access credit from suppliers.
Map 1: Location of Mafa in Borno State
1 Hygiene NFIs include items such as soap and laundry powder. Household NFIs include items such as bedding materials, mosquito nets, and cooking utensils. Shelter repair materials include items such as plastic sheeting, nails/screws, and wooden poles.
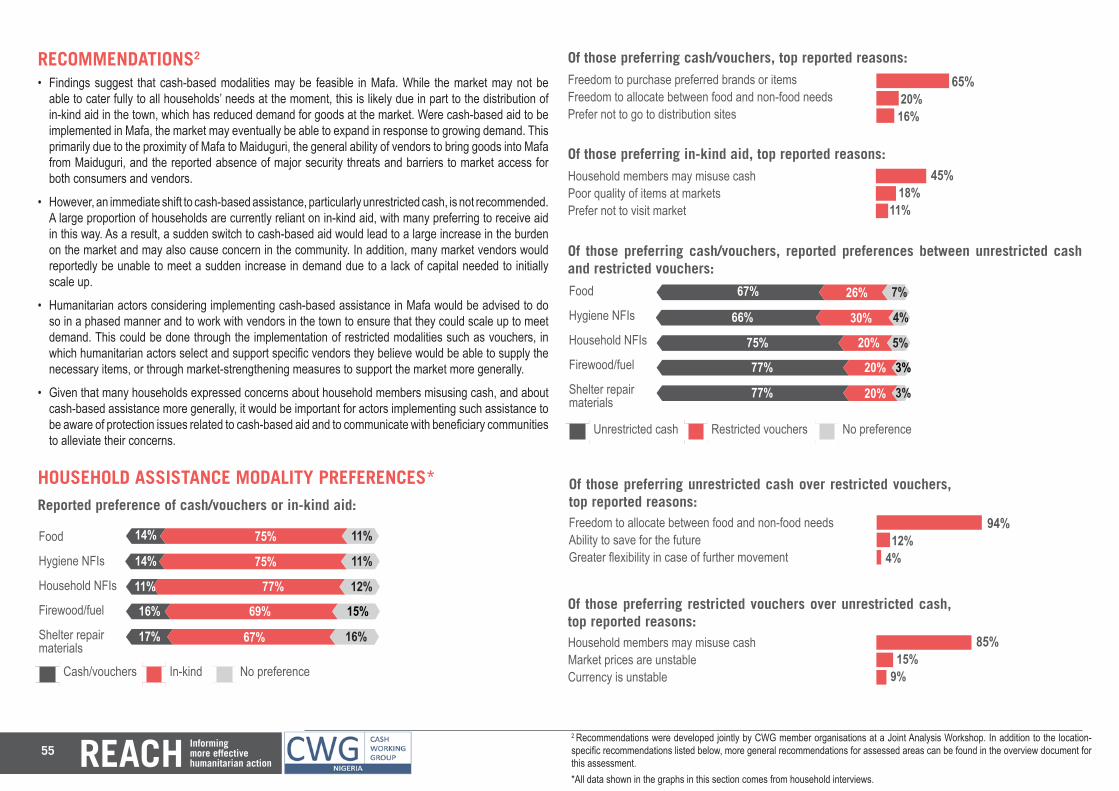
55
170670+160
RECOMMENDATIONS2
• Findings suggest that cash-based modalities may be feasible in Mafa. While the market may not be able to cater fully to all households’ needs at the moment, this is likely due in part to the distribution of in-kind aid in the town, which has reduced demand for goods at the market. Were cash-based aid to be implemented in Mafa, the market may eventually be able to expand in response to growing demand. This primarily due to the proximity of Mafa to Maiduguri, the general ability of vendors to bring goods into Mafa from Maiduguri, and the reported absence of major security threats and barriers to market access for both consumers and vendors.
• However, an immediate shift to cash-based assistance, particularly unrestricted cash, is not recommended. A large proportion of households are currently reliant on in-kind aid, with many preferring to receive aid in this way. As a result, a sudden switch to cash-based aid would lead to a large increase in the burden on the market and may also cause concern in the community. In addition, many market vendors would reportedly be unable to meet a sudden increase in demand due to a lack of capital needed to initially scale up.
• Humanitarian actors considering implementing cash-based assistance in Mafa would be advised to do so in a phased manner and to work with vendors in the town to ensure that they could scale up to meet demand. This could be done through the implementation of restricted modalities such as vouchers, in which humanitarian actors select and support specific vendors they believe would be able to supply the necessary items, or through market-strengthening measures to support the market more generally.
• Given that many households expressed concerns about household members misusing cash, and about cash-based assistance more generally, it would be important for actors implementing such assistance to be aware of protection issues related to cash-based aid and to communicate with beneficiary communities to alleviate their concerns.
HOUSEHOLD ASSISTANCE MODALITY PREFERENCES*
6060
Reported preference of cash/vouchers or in-kind aid:
Food
Hygiene NFIs
Household NFIs
Firewood/fuel
Shelter repair materials
Of those preferring in-kind aid, top reported reasons:Household members may misuse cash Poor quality of items at markets Prefer not to visit market
45+18+11 45% 18% 11%
140750+110
60
14% 75% 11%
Of those preferring cash/vouchers, top reported reasons:Freedom to purchase preferred brands or items Freedom to allocate between food and non-food needsPrefer not to go to distribution sites
Cash/vouchers In-kind No preference
140750+110
60
14% 75% 11%
110770+120
60
11% 77% 12%
160690+15016% 69% 15%
17% 67% 16%
65+20+16 65% 20% 16%
Of those preferring cash/vouchers, reported preferences between unrestricted cash and restricted vouchers:Food
Hygiene NFIs
Household NFIs
Firewood/fuel
Shelter repair materials
Of those preferring restricted vouchers over unrestricted cash, top reported reasons:Household members may misuse cash Market prices are unstable Currency is unstable
85+15+9 85% 15% 9%
Of those preferring unrestricted cash over restricted vouchers, top reported reasons: 94+12+4 94%
12% 4%
Freedom to allocate between food and non-food needs Ability to save for the futureGreater flexibility in case of further movement
6060
670260+70
60
67% 26% 7%
660300+40
60
66% 30% 4%
750200+50
60
75% 20% 5%
770200+3077% 20% 3%
770200+3077% 20% 3%
Unrestricted cash Restricted vouchers No preference
2 Recommendations were developed jointly by CWG member organisations at a Joint Analysis Workshop. In addition to the location-specific recommendations listed below, more general recommendations for assessed areas can be found in the overview document for this assessment.*All data shown in the graphs in this section comes from household interviews.
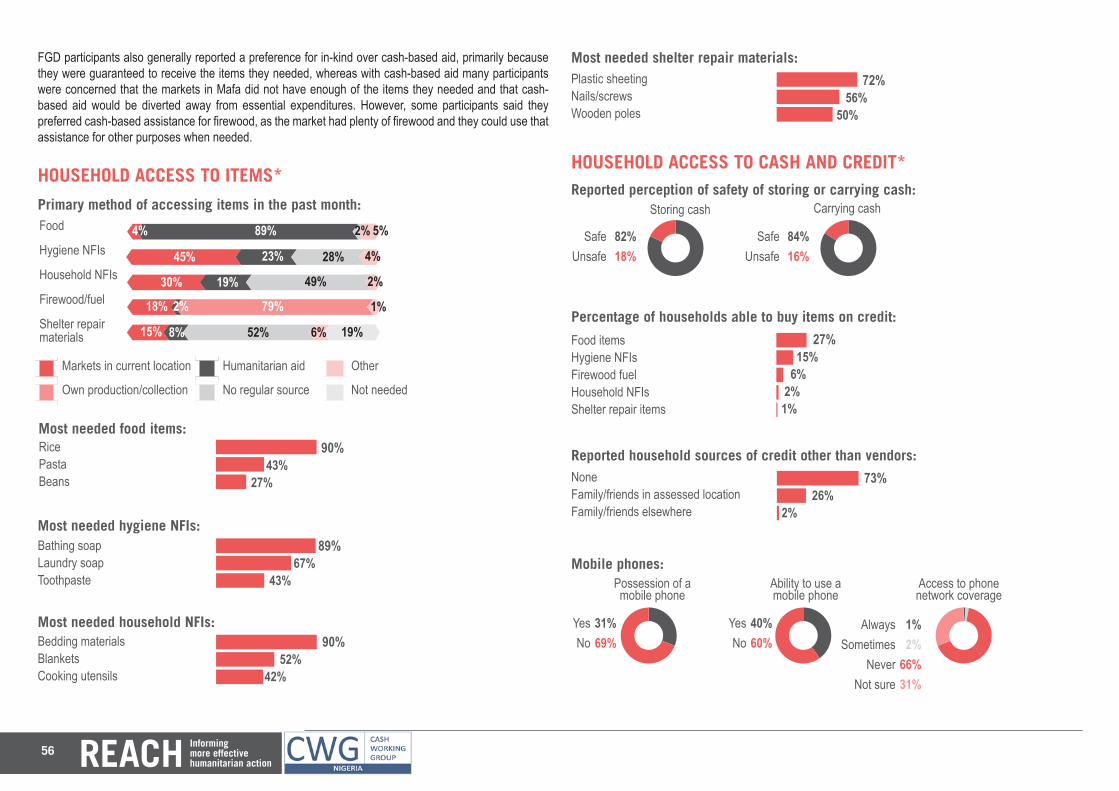
56
60
Primary method of accessing items in the past month:
Markets in current location Humanitarian aid Other
Own production/collection No regular source Not needed
Food
Hygiene NFIs
Household NFIs
Firewood/fuel
Shelter repair materials
6060
40890+0+20+50
60
4% 89%
450230+0+280+40
60
45% 23%
300+1900+490+2030% 19%
180+20790+0+1018% 2% 79%
150+80520+60+19015% 8% 52%
HOUSEHOLD ACCESS TO ITEMS*
Most needed food items: 90+43+27 90% 43% 27%
RicePastaBeans
Most needed hygiene NFIs: 89+67+43 89% 67% 43%
Bathing soapLaundry soapToothpaste
Most needed household NFIs: 90+52+42 90% 52% 42%
Bedding materialsBlanketsCooking utensils
Most needed shelter repair materials:72+56+50 72% 56% 50%
Plastic sheetingNails/screwsWooden poles
HOUSEHOLD ACCESS TO CASH AND CREDIT*
2%
28%
49%
6%
5%
4%
2%
1%
19%
FGD participants also generally reported a preference for in-kind over cash-based aid, primarily because they were guaranteed to receive the items they needed, whereas with cash-based aid many participants were concerned that the markets in Mafa did not have enough of the items they needed and that cash-based aid would be diverted away from essential expenditures. However, some participants said they preferred cash-based assistance for firewood, as the market had plenty of firewood and they could use that assistance for other purposes when needed.
Percentage of households able to buy items on credit:
Food items Hygiene NFIs Firewood fuelHousehold NFIsShelter repair items
27+15+6+2+1 27% 15% 6% 2%1%
Reported household sources of credit other than vendors:73+26+2NoneFamily/friends in assessed locationFamily/friends elsewhere
73% 26% 2%
40+60+zMobile phones:
YesNo 31+69+z
Possession of a mobile phone
31%69%
YesNo
40%60%
Ability to use a mobile phone
AlwaysSometimes
NeverNot sure
1%2%
66%31%
Access to phone network coverage
84+16+zReported perception of safety of storing or carrying cash:
SafeUnsafe 82+18+z
Storing cash Carrying cash
82%18%
SafeUnsafe
84%16%
12+66+31+z
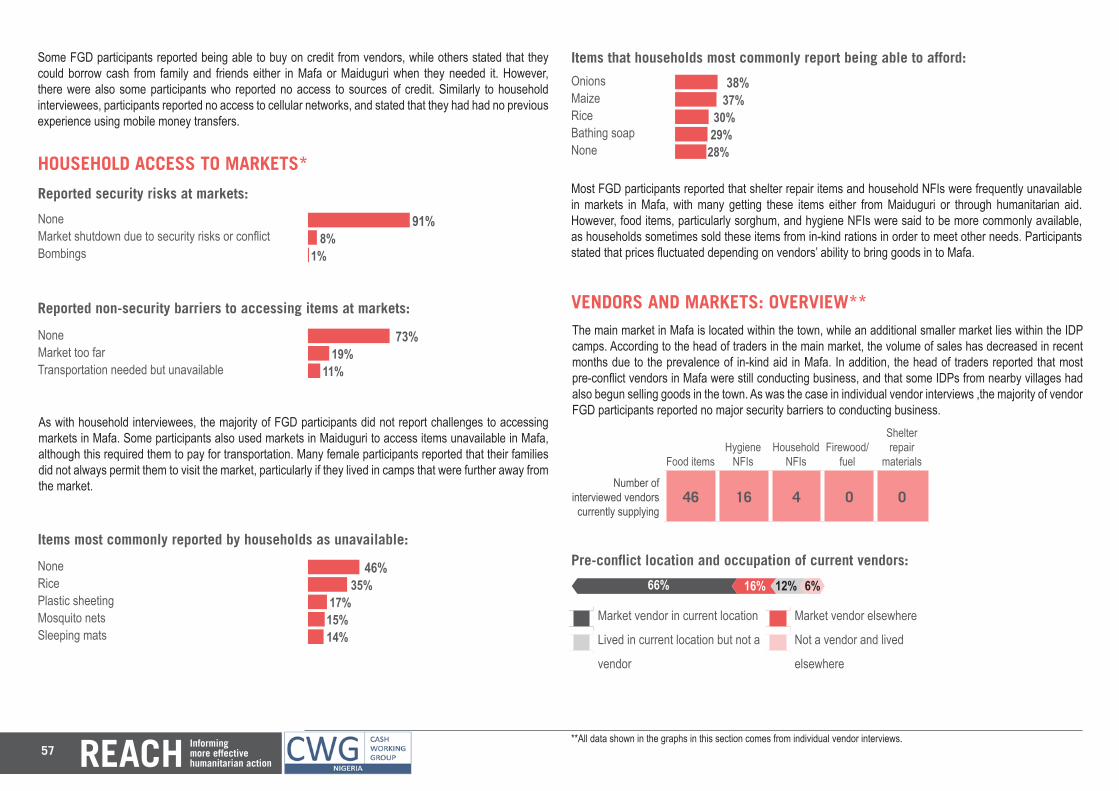
57
HOUSEHOLD ACCESS TO MARKETS*
As with household interviewees, the majority of FGD participants did not report challenges to accessing markets in Mafa. Some participants also used markets in Maiduguri to access items unavailable in Mafa, although this required them to pay for transportation. Many female participants reported that their families did not always permit them to visit the market, particularly if they lived in camps that were further away from the market.
Reported non-security barriers to accessing items at markets:
Reported security risks at markets: 91+8+1NoneMarket shutdown due to security risks or conflictBombings
91% 8%1%73+19+11None
Market too farTransportation needed but unavailable
73% 19% 11%
Most FGD participants reported that shelter repair items and household NFIs were frequently unavailable in markets in Mafa, with many getting these items either from Maiduguri or through humanitarian aid. However, food items, particularly sorghum, and hygiene NFIs were said to be more commonly available, as households sometimes sold these items from in-kind rations in order to meet other needs. Participants stated that prices fluctuated depending on vendors’ ability to bring goods in to Mafa.
Items most commonly reported by households as unavailable:46+35+17+15+14 46% 35% 17%15%14%
NoneRicePlastic sheetingMosquito netsSleeping mats
Items that households most commonly report being able to afford:38+37+30+29+28 38% 37% 30% 29%28%
OnionsMaizeRiceBathing soapNone
Some FGD participants reported being able to buy on credit from vendors, while others stated that they could borrow cash from family and friends either in Mafa or Maiduguri when they needed it. However, there were also some participants who reported no access to sources of credit. Similarly to household interviewees, participants reported no access to cellular networks, and stated that they had had no previous experience using mobile money transfers.
VENDORS AND MARKETS: OVERVIEW**The main market in Mafa is located within the town, while an additional smaller market lies within the IDP camps. According to the head of traders in the main market, the volume of sales has decreased in recent months due to the prevalence of in-kind aid in Mafa. In addition, the head of traders reported that most pre-conflict vendors in Mafa were still conducting business, and that some IDPs from nearby villages had also begun selling goods in the town. As was the case in individual vendor interviews ,the majority of vendor FGD participants reported no major security barriers to conducting business.
Number of interviewed vendors currently supplying
46 16 4 0 0
Food itemsHygiene
NFIsHousehold
NFIsFirewood/
fuel
Shelter repair
materials
Market vendor in current location Market vendor elsewhere
Lived in current location but not a Not a vendor and lived
vendor elsewhere
Pre-conflict location and occupation of current vendors:
660160+120+60
60
66% 16% 12% 6%
**All data shown in the graphs in this section comes from individual vendor interviews.
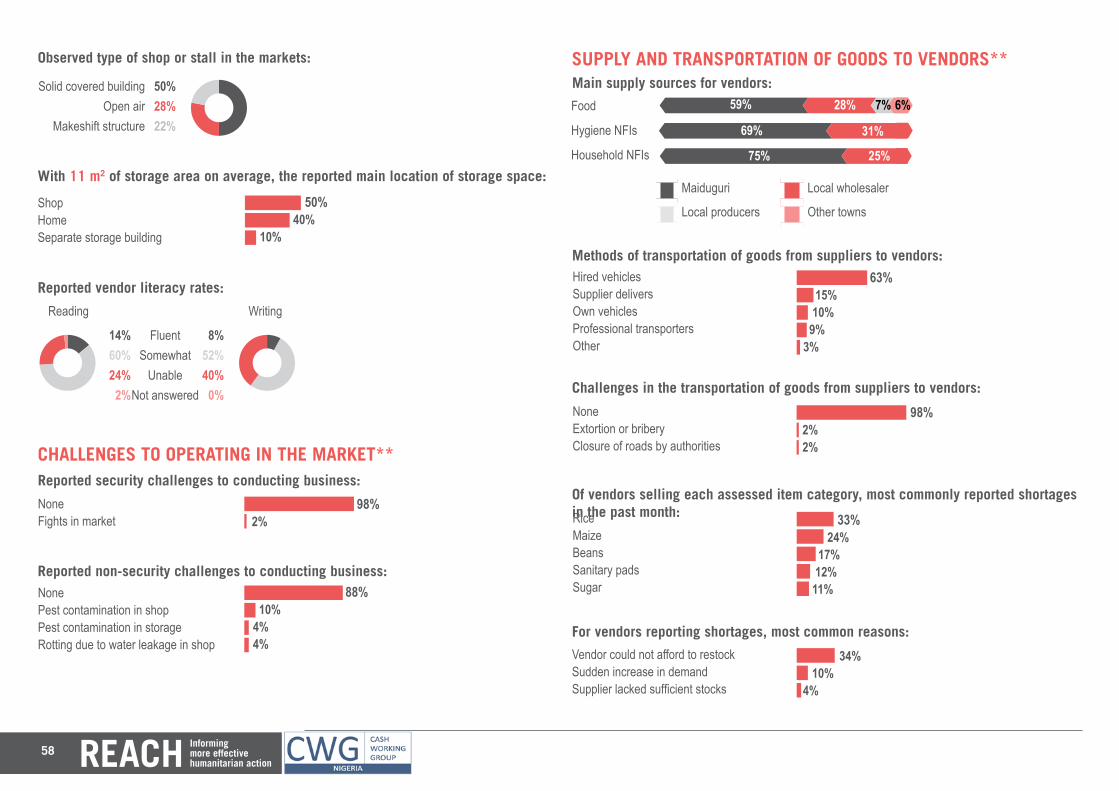
58
50+40+10+
Observed type of shop or stall in the markets:
With 11 m2 of storage area on average, the reported main location of storage space:
Solid covered buildingOpen air
Makeshift structure 502822z50%28%22%
ShopHomeSeparate storage building
50% 40% 10%
Reported vendor literacy rates:
FluentSomewhat
UnableNot answered
Reading Writing
852+40+0+z14+6024+2z8%
52%40%
0%
14%60%24%
2%
CHALLENGES TO OPERATING IN THE MARKET**
Reported non-security challenges to conducting business:NonePest contamination in shopPest contamination in storageRotting due to water leakage in shop
NoneFights in market 88+10+4+4
98+2+
88% 10% 4% 4%
98% 2%
Reported security challenges to conducting business:
606060
SUPPLY AND TRANSPORTATION OF GOODS TO VENDORS**Main supply sources for vendors:
Maiduguri Local wholesaler
Local producers Other towns
590280+70+6059% 28%
690310+0+069% 31%
750250+0+075% 25%
Hired vehiclesSupplier deliversOwn vehiclesProfessional transportersOther
63+15+10+9+3 63% 15% 10% 9% 3%
Methods of transportation of goods from suppliers to vendors:
Food
Hygiene NFIs
Household NFIs
7% 6%
Challenges in the transportation of goods from suppliers to vendors:
NoneExtortion or briberyClosure of roads by authorities
98+2+2+ 98% 2% 2%
Of vendors selling each assessed item category, most commonly reported shortages in the past month:
33+24+17+12+11 33% 24% 17% 12%11%
RiceMaizeBeansSanitary padsSugar
For vendors reporting shortages, most common reasons:34+10+4 34% 10% 4%
Vendor could not afford to restockSudden increase in demandSupplier lacked sufficient stocks
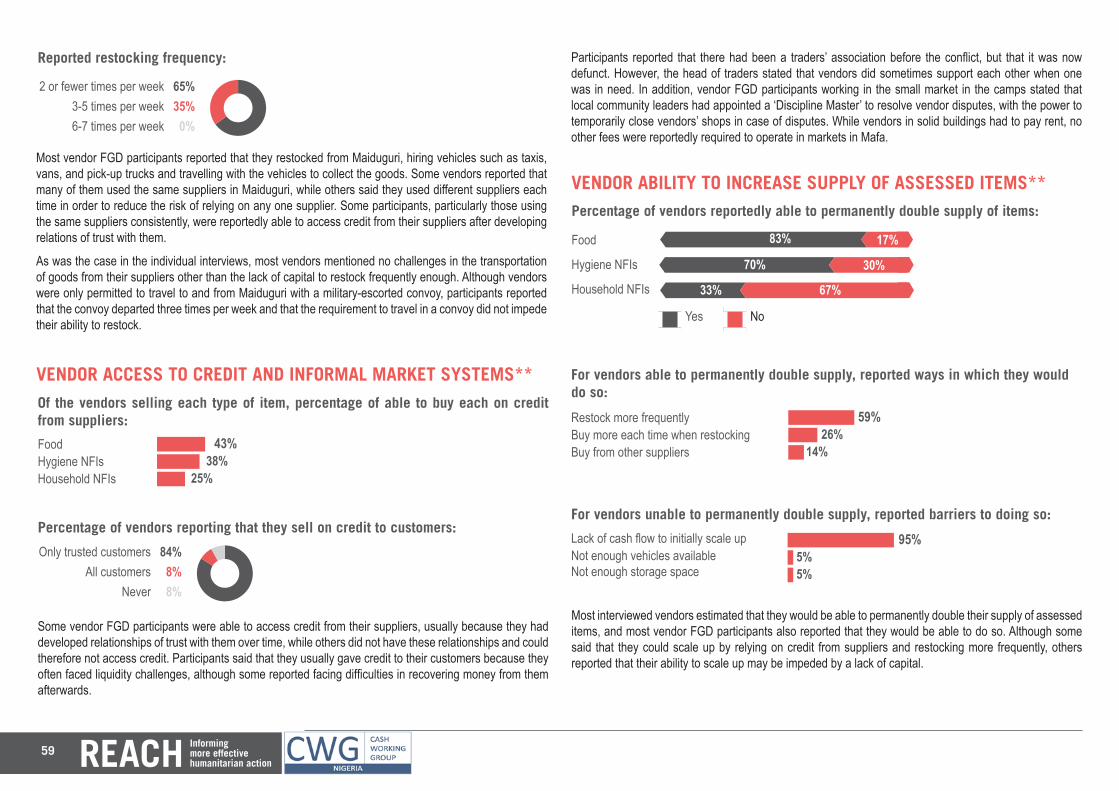
59
Reported restocking frequency:
2 or fewer times per week3-5 times per week6-7 times per week 65350z65%
35%0%
VENDOR ACCESS TO CREDIT AND INFORMAL MARKET SYSTEMS**
Some vendor FGD participants were able to access credit from their suppliers, usually because they had developed relationships of trust with them over time, while others did not have these relationships and could therefore not access credit. Participants said that they usually gave credit to their customers because they often faced liquidity challenges, although some reported facing difficulties in recovering money from them afterwards.
Most vendor FGD participants reported that they restocked from Maiduguri, hiring vehicles such as taxis, vans, and pick-up trucks and travelling with the vehicles to collect the goods. Some vendors reported that many of them used the same suppliers in Maiduguri, while others said they used different suppliers each time in order to reduce the risk of relying on any one supplier. Some participants, particularly those using the same suppliers consistently, were reportedly able to access credit from their suppliers after developing relations of trust with them.
As was the case in the individual interviews, most vendors mentioned no challenges in the transportation of goods from their suppliers other than the lack of capital to restock frequently enough. Although vendors were only permitted to travel to and from Maiduguri with a military-escorted convoy, participants reported that the convoy departed three times per week and that the requirement to travel in a convoy did not impede their ability to restock.
Of the vendors selling each type of item, percentage of able to buy each on credit from suppliers:
FoodHygiene NFIsHousehold NFIs
43+38+25+ 43% 38% 25%
Percentage of vendors reporting that they sell on credit to customers:
Only trusted customersAll customers
Never 8488z84%8%8%
VENDOR ABILITY TO INCREASE SUPPLY OF ASSESSED ITEMS**
Yes No
Percentage of vendors reportedly able to permanently double supply of items:
830170
60
83% 17%
700300
60
70% 30%
330670
60
33% 67%
Food
Hygiene NFIs
Household NFIs
For vendors able to permanently double supply, reported ways in which they would do so:
Restock more frequentlyBuy more each time when restockingBuy from other suppliers
59+26+14 59% 26% 14%
For vendors unable to permanently double supply, reported barriers to doing so:
Lack of cash flow to initially scale upNot enough vehicles availableNot enough storage space
95+5+5 95% 5% 5%
Most interviewed vendors estimated that they would be able to permanently double their supply of assessed items, and most vendor FGD participants also reported that they would be able to do so. Although some said that they could scale up by relying on credit from suppliers and restocking more frequently, others reported that their ability to scale up may be impeded by a lack of capital.
Participants reported that there had been a traders’ association before the conflict, but that it was now defunct. However, the head of traders stated that vendors did sometimes support each other when one was in need. In addition, vendor FGD participants working in the small market in the camps stated that local community leaders had appointed a ‘Discipline Master’ to resolve vendor disputes, with the power to temporarily close vendors’ shops in case of disputes. While vendors in solid buildings had to pay rent, no other fees were reportedly required to operate in markets in Mafa.
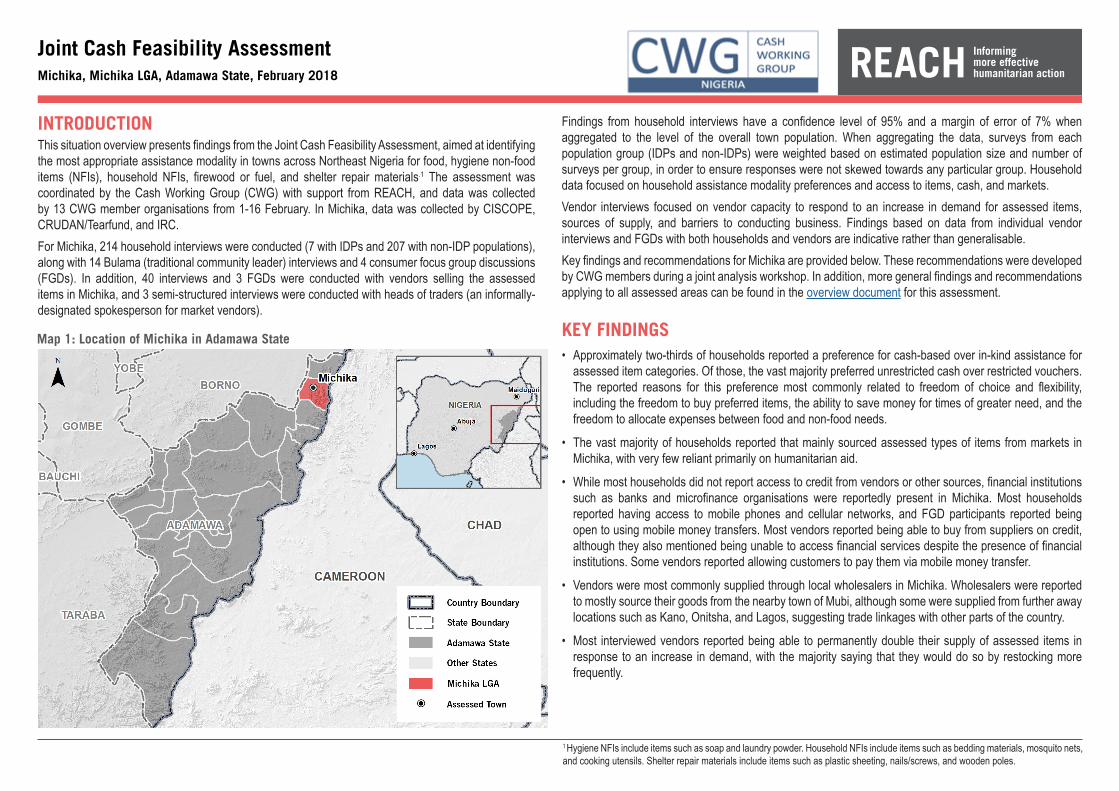
INTRODUCTIONThis situation overview presents findings from the Joint Cash Feasibility Assessment, aimed at identifying the most appropriate assistance modality in towns across Northeast Nigeria for food, hygiene non-food items (NFIs), household NFIs, firewood or fuel, and shelter repair materials.1 The assessment was coordinated by the Cash Working Group (CWG) with support from REACH, and data was collected by 13 CWG member organisations from 1-16 February. In Michika, data was collected by CISCOPE, CRUDAN/Tearfund, and IRC. For Michika, 214 household interviews were conducted (7 with IDPs and 207 with non-IDP populations), along with 14 Bulama (traditional community leader) interviews and 4 consumer focus group discussions (FGDs). In addition, 40 interviews and 3 FGDs were conducted with vendors selling the assessed items in Michika, and 3 semi-structured interviews were conducted with heads of traders (an informally-designated spokesperson for market vendors).
Joint Cash Feasibility AssessmentMichika, Michika LGA, Adamawa State, February 2018
Findings from household interviews have a confidence level of 95% and a margin of error of 7% when aggregated to the level of the overall town population. When aggregating the data, surveys from each population group (IDPs and non-IDPs) were weighted based on estimated population size and number of surveys per group, in order to ensure responses were not skewed towards any particular group. Household data focused on household assistance modality preferences and access to items, cash, and markets.Vendor interviews focused on vendor capacity to respond to an increase in demand for assessed items, sources of supply, and barriers to conducting business. Findings based on data from individual vendor interviews and FGDs with both households and vendors are indicative rather than generalisable.Key findings and recommendations for Michika are provided below. These recommendations were developed by CWG members during a joint analysis workshop. In addition, more general findings and recommendations applying to all assessed areas can be found in the overview document for this assessment.
KEY FINDINGS• Approximately two-thirds of households reported a preference for cash-based over in-kind assistance for
assessed item categories. Of those, the vast majority preferred unrestricted cash over restricted vouchers. The reported reasons for this preference most commonly related to freedom of choice and flexibility, including the freedom to buy preferred items, the ability to save money for times of greater need, and the freedom to allocate expenses between food and non-food needs.
• The vast majority of households reported that mainly sourced assessed types of items from markets in Michika, with very few reliant primarily on humanitarian aid.
• While most households did not report access to credit from vendors or other sources, financial institutions such as banks and microfinance organisations were reportedly present in Michika. Most households reported having access to mobile phones and cellular networks, and FGD participants reported being open to using mobile money transfers. Most vendors reported being able to buy from suppliers on credit, although they also mentioned being unable to access financial services despite the presence of financial institutions. Some vendors reported allowing customers to pay them via mobile money transfer.
• Vendors were most commonly supplied through local wholesalers in Michika. Wholesalers were reported to mostly source their goods from the nearby town of Mubi, although some were supplied from further away locations such as Kano, Onitsha, and Lagos, suggesting trade linkages with other parts of the country.
• Most interviewed vendors reported being able to permanently double their supply of assessed items in response to an increase in demand, with the majority saying that they would do so by restocking more frequently.
Map 1: Location of Michika in Adamawa State
1 Hygiene NFIs include items such as soap and laundry powder. Household NFIs include items such as bedding materials, mosquito nets, and cooking utensils. Shelter repair materials include items such as plastic sheeting, nails/screws, and wooden poles.
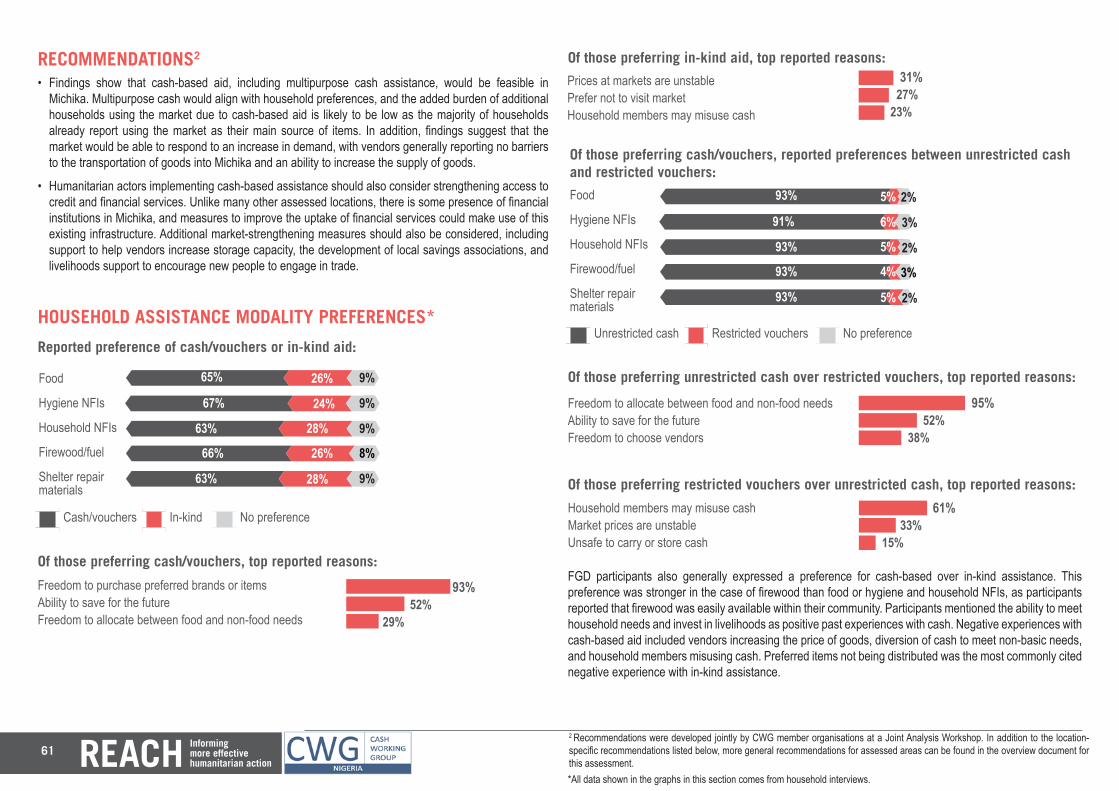
61
630280+90
RECOMMENDATIONS2
• Findings show that cash-based aid, including multipurpose cash assistance, would be feasible in Michika. Multipurpose cash would align with household preferences, and the added burden of additional households using the market due to cash-based aid is likely to be low as the majority of households already report using the market as their main source of items. In addition, findings suggest that the market would be able to respond to an increase in demand, with vendors generally reporting no barriers to the transportation of goods into Michika and an ability to increase the supply of goods.
• Humanitarian actors implementing cash-based assistance should also consider strengthening access to credit and financial services. Unlike many other assessed locations, there is some presence of financial institutions in Michika, and measures to improve the uptake of financial services could make use of this existing infrastructure. Additional market-strengthening measures should also be considered, including support to help vendors increase storage capacity, the development of local savings associations, and livelihoods support to encourage new people to engage in trade.
HOUSEHOLD ASSISTANCE MODALITY PREFERENCES*
FGD participants also generally expressed a preference for cash-based over in-kind assistance. This preference was stronger in the case of firewood than food or hygiene and household NFIs, as participants reported that firewood was easily available within their community. Participants mentioned the ability to meet household needs and invest in livelihoods as positive past experiences with cash. Negative experiences with cash-based aid included vendors increasing the price of goods, diversion of cash to meet non-basic needs, and household members misusing cash. Preferred items not being distributed was the most commonly cited negative experience with in-kind assistance.
6060
Reported preference of cash/vouchers or in-kind aid:
Food
Hygiene NFIs
Household NFIs
Firewood/fuel
Shelter repair materials
Of those preferring in-kind aid, top reported reasons:
Prices at markets are unstable Prefer not to visit market Household members may misuse cash
31+27+23 31% 27% 23%
650260+90
60
65% 26% 9%
Of those preferring cash/vouchers, top reported reasons:
Freedom to purchase preferred brands or items Ability to save for the futureFreedom to allocate between food and non-food needs
Cash/vouchers In-kind No preference
670240+9060
67% 24% 9%
630280+90
60
63% 28% 9%
660260+8066% 26% 8%
63% 28% 9%93+52+29 93% 52% 29%
Of those preferring cash/vouchers, reported preferences between unrestricted cash and restricted vouchers:
Food
Hygiene NFIs
Household NFIs
Firewood/fuel
Shelter repair materials
Of those preferring restricted vouchers over unrestricted cash, top reported reasons:
Household members may misuse cash Market prices are unstable Unsafe to carry or store cash
61+33+15 61% 33% 15%
Of those preferring unrestricted cash over restricted vouchers, top reported reasons:95+52+38 95% 52% 38%
Freedom to allocate between food and non-food needs Ability to save for the futureFreedom to choose vendors
6060
93050+20
60
93% 5% 2%
91060+30
60
91% 6% 3%
93050+20
60
93% 5% 2%
93040+3093% 4% 3%
93050+2093% 5% 2%
Unrestricted cash Restricted vouchers No preference
2 Recommendations were developed jointly by CWG member organisations at a Joint Analysis Workshop. In addition to the location-specific recommendations listed below, more general recommendations for assessed areas can be found in the overview document for this assessment.*All data shown in the graphs in this section comes from household interviews.
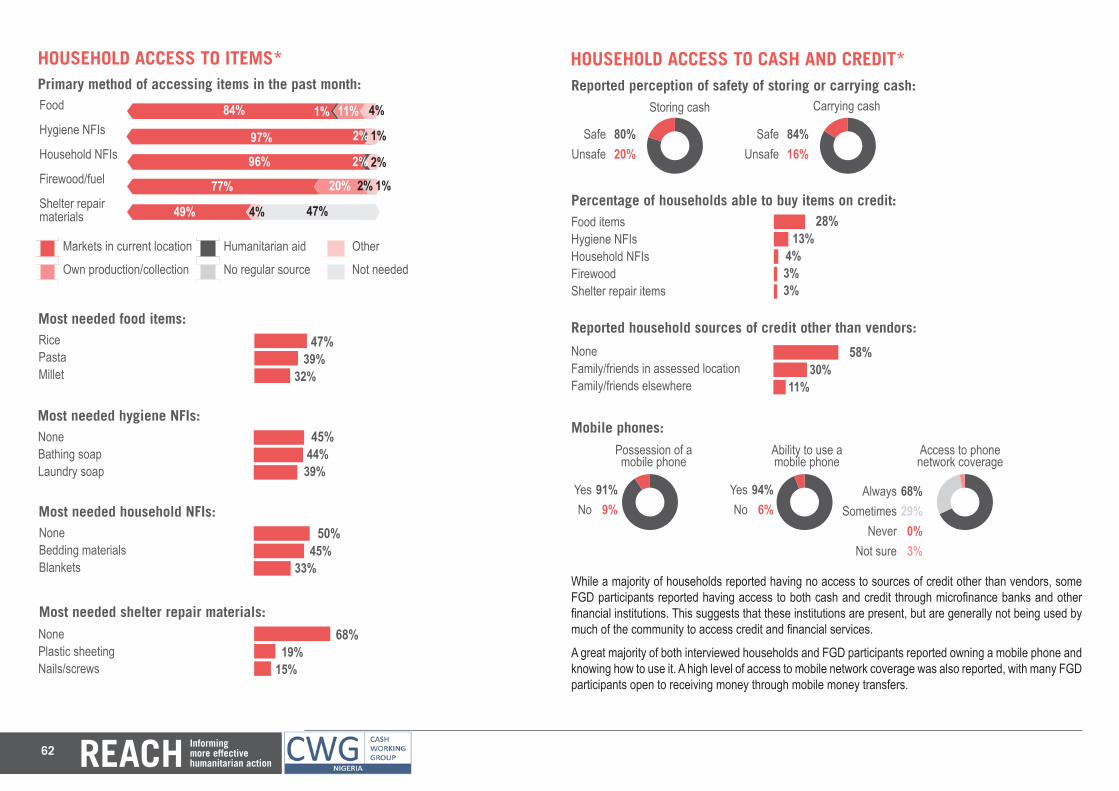
62
60
Primary method of accessing items in the past month:
Markets in current location Humanitarian aid Other
Own production/collection No regular source Not needed
Food
Hygiene NFIs
Household NFIs
Firewood/fuel
Shelter repair materials
6060
84010+110+0+40
60
84% 1% 11%
97020+0+0+10
60
97% 2%
960+200+0+2096% 2%
770+0200+20+1077% 20%
490+00+40+47049%
HOUSEHOLD ACCESS TO ITEMS*
Most needed food items: 47+39+32 47% 39% 32%
RicePastaMillet
Most needed hygiene NFIs: 45+44+39 45% 44% 39%
NoneBathing soapLaundry soap
Most needed household NFIs: 50+45+33 50% 45% 33%
NoneBedding materialsBlankets
Most needed shelter repair materials:68+19+15 68% 19% 15%
NonePlastic sheetingNails/screws
HOUSEHOLD ACCESS TO CASH AND CREDIT*
While a majority of households reported having no access to sources of credit other than vendors, some FGD participants reported having access to both cash and credit through microfinance banks and other financial institutions. This suggests that these institutions are present, but are generally not being used by much of the community to access credit and financial services.
A great majority of both interviewed households and FGD participants reported owning a mobile phone and knowing how to use it. A high level of access to mobile network coverage was also reported, with many FGD participants open to receiving money through mobile money transfers.
2%
4%
4%
1%
2%1%
47%Percentage of households able to buy items on credit:Food items Hygiene NFIs Household NFIsFirewoodShelter repair items
28+13+4+3+3 28% 13% 4% 3% 3%
Reported household sources of credit other than vendors:58+30+11NoneFamily/friends in assessed locationFamily/friends elsewhere
58% 30% 11%
94+6+zMobile phones:
YesNo 91+9+z
Possession of a mobile phone
91%9%
YesNo
94%6%
Ability to use a mobile phone
AlwaysSometimes
NeverNot sure
68%29%
0%3%
Access to phone network coverage
84+16+zReported perception of safety of storing or carrying cash:
SafeUnsafe 80+20+z
Storing cash Carrying cash
80%20%
SafeUnsafe
84%16%
6829+3+z
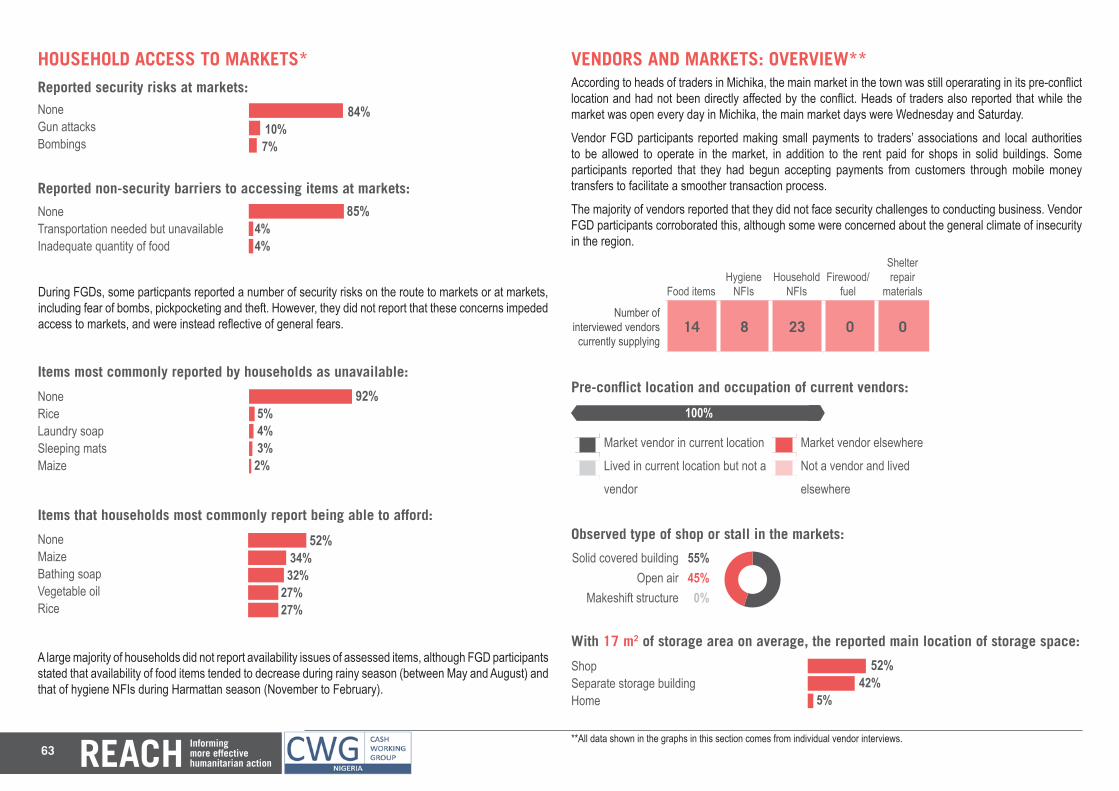
63
HOUSEHOLD ACCESS TO MARKETS*
During FGDs, some particpants reported a number of security risks on the route to markets or at markets, including fear of bombs, pickpocketing and theft. However, they did not report that these concerns impeded access to markets, and were instead reflective of general fears.
Reported non-security barriers to accessing items at markets:
Reported security risks at markets: 84+10+7NoneGun attacksBombings
84% 10% 7%85+4+4None
Transportation needed but unavailableInadequate quantity of food
85% 4% 4%
A large majority of households did not report availability issues of assessed items, although FGD participants stated that availability of food items tended to decrease during rainy season (between May and August) and that of hygiene NFIs during Harmattan season (November to February).
Items most commonly reported by households as unavailable:92+5+4+3+2 92% 5% 4% 3%2%
NoneRiceLaundry soapSleeping matsMaize
Items that households most commonly report being able to afford:52+34+32+27+27 52% 34% 32%27%27%
NoneMaizeBathing soapVegetable oilRice
VENDORS AND MARKETS: OVERVIEW**According to heads of traders in Michika, the main market in the town was still operarating in its pre-conflict location and had not been directly affected by the conflict. Heads of traders also reported that while the market was open every day in Michika, the main market days were Wednesday and Saturday.
Vendor FGD participants reported making small payments to traders’ associations and local authorities to be allowed to operate in the market, in addition to the rent paid for shops in solid buildings. Some participants reported that they had begun accepting payments from customers through mobile money transfers to facilitate a smoother transaction process.
The majority of vendors reported that they did not face security challenges to conducting business. Vendor FGD participants corroborated this, although some were concerned about the general climate of insecurity in the region.
Number of interviewed vendors currently supplying
14 8 23 0 0
Food itemsHygiene
NFIsHousehold
NFIsFirewood/
fuel
Shelter repair
materials
Market vendor in current location Market vendor elsewhere
Lived in current location but not a Not a vendor and lived
vendor elsewhere
Pre-conflict location and occupation of current vendors:
10000+0+0
60100%
52+42+5+
Observed type of shop or stall in the markets:
With 17 m2 of storage area on average, the reported main location of storage space:
Solid covered buildingOpen air
Makeshift structure 55450z55%45%
0%
ShopSeparate storage buildingHome
52% 42% 5%
**All data shown in the graphs in this section comes from individual vendor interviews.
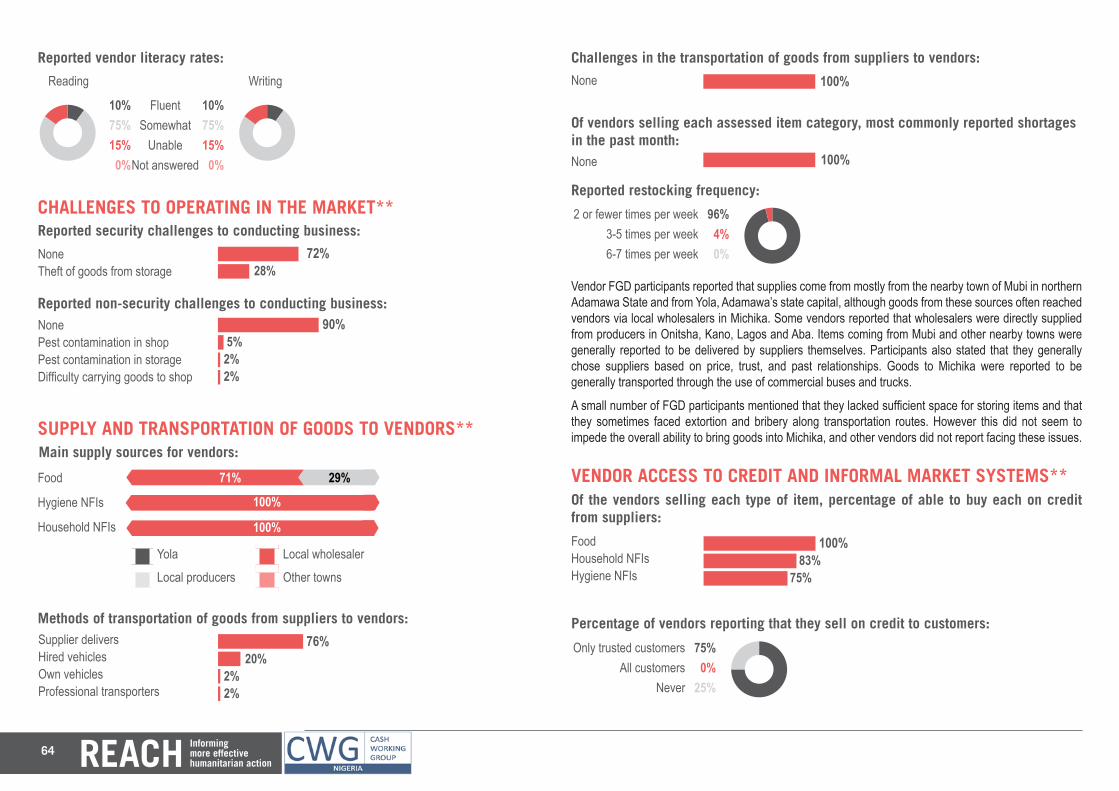
64
Reported vendor literacy rates:
FluentSomewhat
UnableNot answered
Reading Writing
1075+15+0+z10+7515+0z10%75%15%
0%
10%75%15%
0%
CHALLENGES TO OPERATING IN THE MARKET**
Reported non-security challenges to conducting business:NonePest contamination in shopPest contamination in storageDifficulty carrying goods to shop
NoneTheft of goods from storage 90+5+2+2
72+28
90% 5% 2% 2%
72% 28%
Reported security challenges to conducting business:
SUPPLY AND TRANSPORTATION OF GOODS TO VENDORS**
606060Main supply sources for vendors:
Yola Local wholesaler
Local producers Other towns
0710+290+071%
01000+0+001000+0+0
Supplier deliversHired vehiclesOwn vehiclesProfessional transporters
76+20+2+2+ 76% 20% 2% 2%
Methods of transportation of goods from suppliers to vendors:
Food
Hygiene NFIs
Household NFIs 100%
29%
100%
Challenges in the transportation of goods from suppliers to vendors:
None
100+ 100%
Of vendors selling each assessed item category, most commonly reported shortages in the past month:None
Reported restocking frequency:
2 or fewer times per week3-5 times per week6-7 times per week 9640z96%
4%0%
100
100%
Vendor FGD participants reported that supplies come from mostly from the nearby town of Mubi in northern Adamawa State and from Yola, Adamawa’s state capital, although goods from these sources often reached vendors via local wholesalers in Michika. Some vendors reported that wholesalers were directly supplied from producers in Onitsha, Kano, Lagos and Aba. Items coming from Mubi and other nearby towns were generally reported to be delivered by suppliers themselves. Participants also stated that they generally chose suppliers based on price, trust, and past relationships. Goods to Michika were reported to be generally transported through the use of commercial buses and trucks.
A small number of FGD participants mentioned that they lacked sufficient space for storing items and that they sometimes faced extortion and bribery along transportation routes. However this did not seem to impede the overall ability to bring goods into Michika, and other vendors did not report facing these issues.
Of the vendors selling each type of item, percentage of able to buy each on credit from suppliers:
FoodHousehold NFIsHygiene NFIs
100+83+75 100% 83% 75%
VENDOR ACCESS TO CREDIT AND INFORMAL MARKET SYSTEMS**
Percentage of vendors reporting that they sell on credit to customers:
Only trusted customersAll customers
Never 7525z75%0%
25%
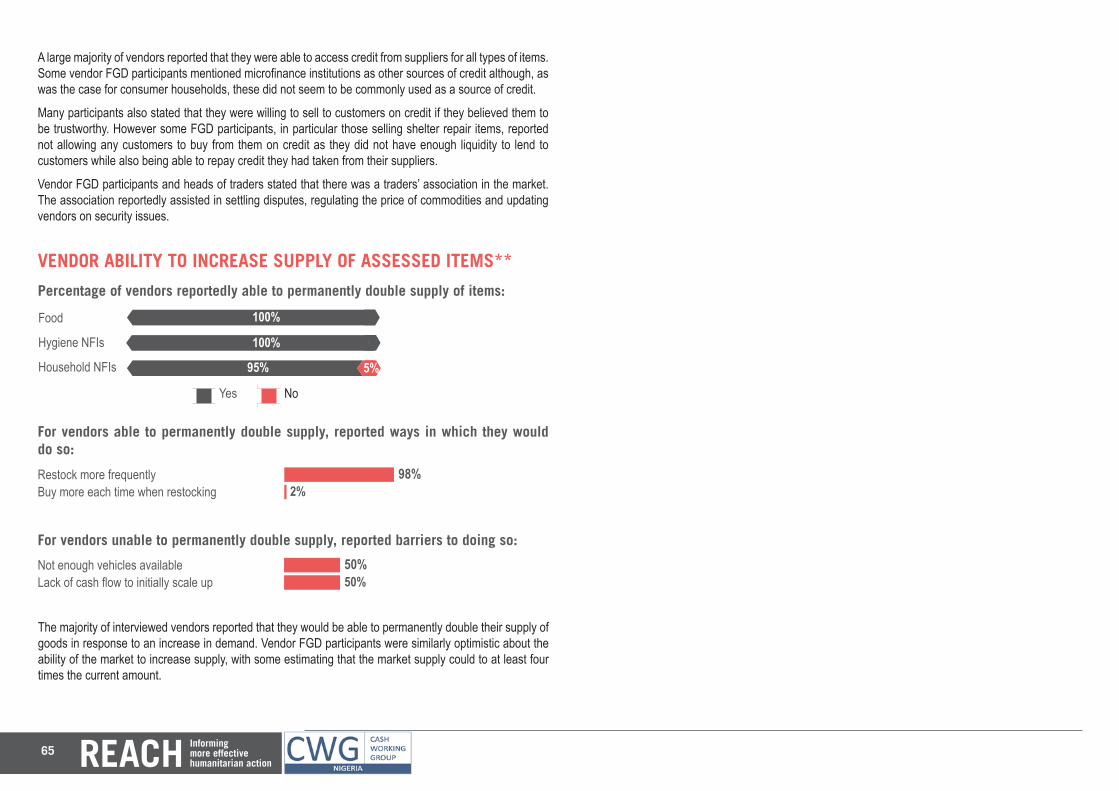
65
A large majority of vendors reported that they were able to access credit from suppliers for all types of items. Some vendor FGD participants mentioned microfinance institutions as other sources of credit although, as was the case for consumer households, these did not seem to be commonly used as a source of credit.
Many participants also stated that they were willing to sell to customers on credit if they believed them to be trustworthy. However some FGD participants, in particular those selling shelter repair items, reported not allowing any customers to buy from them on credit as they did not have enough liquidity to lend to customers while also being able to repay credit they had taken from their suppliers.
Vendor FGD participants and heads of traders stated that there was a traders’ association in the market. The association reportedly assisted in settling disputes, regulating the price of commodities and updating vendors on security issues.
VENDOR ABILITY TO INCREASE SUPPLY OF ASSESSED ITEMS**
Yes No
Percentage of vendors reportedly able to permanently double supply of items:
10000
60
100%
10000
60
100%
95050
60
95% 5%
Food
Hygiene NFIs
Household NFIs
For vendors able to permanently double supply, reported ways in which they would do so:
Restock more frequentlyBuy more each time when restocking
98+2 98% 2%
For vendors unable to permanently double supply, reported barriers to doing so:
Not enough vehicles availableLack of cash flow to initially scale up
50+50+ 50% 50%
The majority of interviewed vendors reported that they would be able to permanently double their supply of goods in response to an increase in demand. Vendor FGD participants were similarly optimistic about the ability of the market to increase supply, with some estimating that the market supply could to at least four times the current amount.
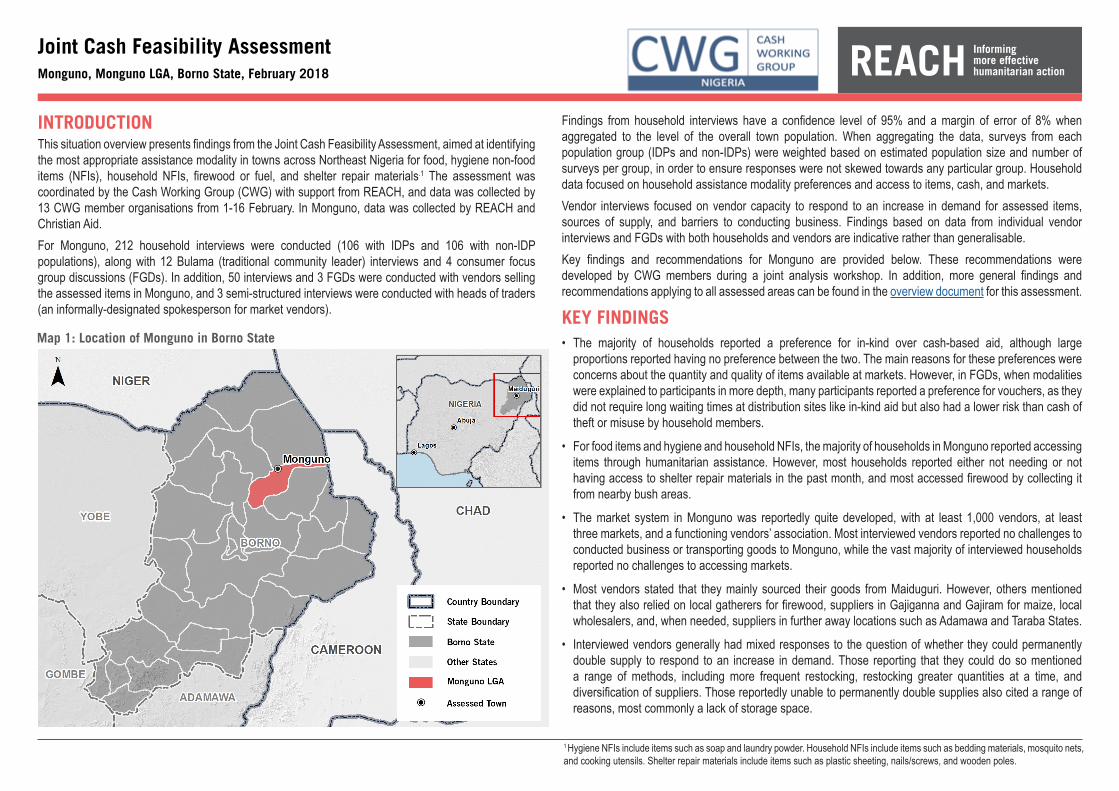
INTRODUCTIONThis situation overview presents findings from the Joint Cash Feasibility Assessment, aimed at identifying the most appropriate assistance modality in towns across Northeast Nigeria for food, hygiene non-food items (NFIs), household NFIs, firewood or fuel, and shelter repair materials.1 The assessment was coordinated by the Cash Working Group (CWG) with support from REACH, and data was collected by 13 CWG member organisations from 1-16 February. In Monguno, data was collected by REACH and Christian Aid.For Monguno, 212 household interviews were conducted (106 with IDPs and 106 with non-IDP populations), along with 12 Bulama (traditional community leader) interviews and 4 consumer focus group discussions (FGDs). In addition, 50 interviews and 3 FGDs were conducted with vendors selling the assessed items in Monguno, and 3 semi-structured interviews were conducted with heads of traders (an informally-designated spokesperson for market vendors).
Joint Cash Feasibility AssessmentMonguno, Monguno LGA, Borno State, February 2018
Findings from household interviews have a confidence level of 95% and a margin of error of 8% when aggregated to the level of the overall town population. When aggregating the data, surveys from each population group (IDPs and non-IDPs) were weighted based on estimated population size and number of surveys per group, in order to ensure responses were not skewed towards any particular group. Household data focused on household assistance modality preferences and access to items, cash, and markets.Vendor interviews focused on vendor capacity to respond to an increase in demand for assessed items, sources of supply, and barriers to conducting business. Findings based on data from individual vendor interviews and FGDs with both households and vendors are indicative rather than generalisable.Key findings and recommendations for Monguno are provided below. These recommendations were developed by CWG members during a joint analysis workshop. In addition, more general findings and recommendations applying to all assessed areas can be found in the overview document for this assessment.
KEY FINDINGS• The majority of households reported a preference for in-kind over cash-based aid, although large
proportions reported having no preference between the two. The main reasons for these preferences were concerns about the quantity and quality of items available at markets. However, in FGDs, when modalities were explained to participants in more depth, many participants reported a preference for vouchers, as they did not require long waiting times at distribution sites like in-kind aid but also had a lower risk than cash of theft or misuse by household members.
• For food items and hygiene and household NFIs, the majority of households in Monguno reported accessing items through humanitarian assistance. However, most households reported either not needing or not having access to shelter repair materials in the past month, and most accessed firewood by collecting it from nearby bush areas.
• The market system in Monguno was reportedly quite developed, with at least 1,000 vendors, at least three markets, and a functioning vendors’ association. Most interviewed vendors reported no challenges to conducted business or transporting goods to Monguno, while the vast majority of interviewed households reported no challenges to accessing markets.
• Most vendors stated that they mainly sourced their goods from Maiduguri. However, others mentioned that they also relied on local gatherers for firewood, suppliers in Gajiganna and Gajiram for maize, local wholesalers, and, when needed, suppliers in further away locations such as Adamawa and Taraba States.
• Interviewed vendors generally had mixed responses to the question of whether they could permanently double supply to respond to an increase in demand. Those reporting that they could do so mentioned a range of methods, including more frequent restocking, restocking greater quantities at a time, and diversification of suppliers. Those reportedly unable to permanently double supplies also cited a range of reasons, most commonly a lack of storage space.
Map 1: Location of Monguno in Borno State
1 Hygiene NFIs include items such as soap and laundry powder. Household NFIs include items such as bedding materials, mosquito nets, and cooking utensils. Shelter repair materials include items such as plastic sheeting, nails/screws, and wooden poles.
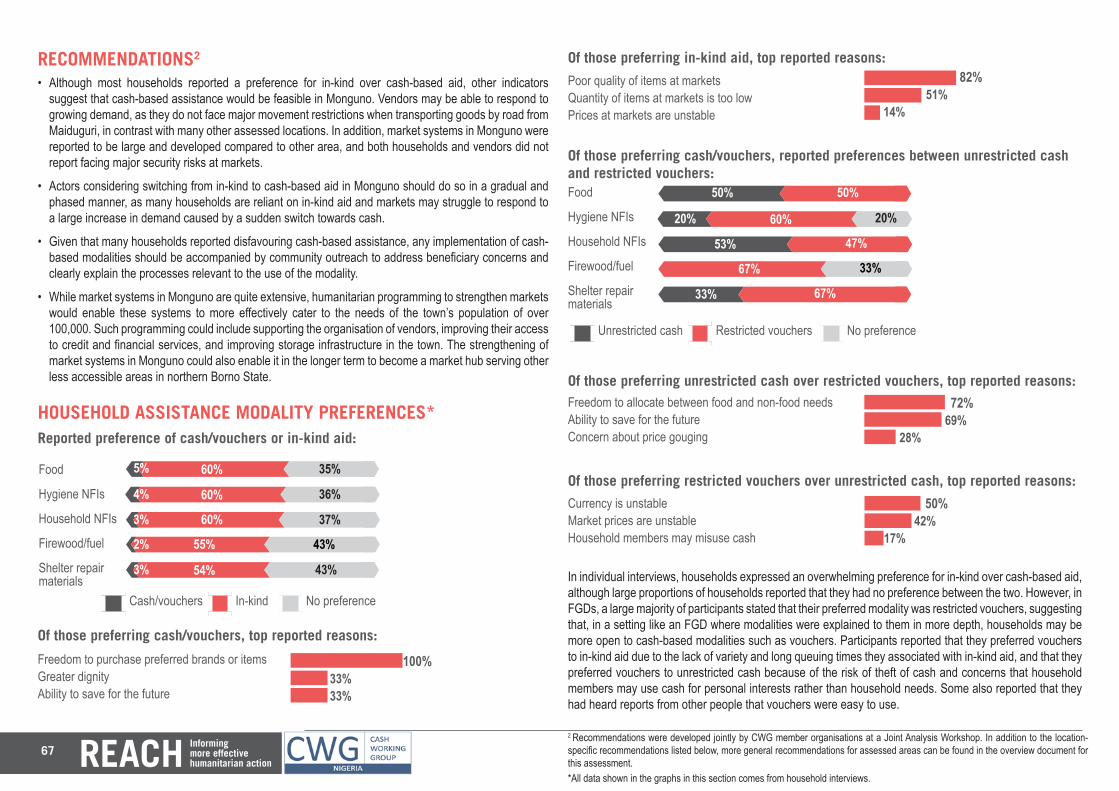
67
30540+430
RECOMMENDATIONS2
• Although most households reported a preference for in-kind over cash-based aid, other indicators suggest that cash-based assistance would be feasible in Monguno. Vendors may be able to respond to growing demand, as they do not face major movement restrictions when transporting goods by road from Maiduguri, in contrast with many other assessed locations. In addition, market systems in Monguno were reported to be large and developed compared to other area, and both households and vendors did not report facing major security risks at markets.
• Actors considering switching from in-kind to cash-based aid in Monguno should do so in a gradual and phased manner, as many households are reliant on in-kind aid and markets may struggle to respond to a large increase in demand caused by a sudden switch towards cash.
• Given that many households reported disfavouring cash-based assistance, any implementation of cash-based modalities should be accompanied by community outreach to address beneficiary concerns and clearly explain the processes relevant to the use of the modality.
• While market systems in Monguno are quite extensive, humanitarian programming to strengthen markets would enable these systems to more effectively cater to the needs of the town’s population of over 100,000. Such programming could include supporting the organisation of vendors, improving their access to credit and financial services, and improving storage infrastructure in the town. The strengthening of market systems in Monguno could also enable it in the longer term to become a market hub serving other less accessible areas in northern Borno State.
HOUSEHOLD ASSISTANCE MODALITY PREFERENCES*
In individual interviews, households expressed an overwhelming preference for in-kind over cash-based aid, although large proportions of households reported that they had no preference between the two. However, in FGDs, a large majority of participants stated that their preferred modality was restricted vouchers, suggesting that, in a setting like an FGD where modalities were explained to them in more depth, households may be more open to cash-based modalities such as vouchers. Participants reported that they preferred vouchers to in-kind aid due to the lack of variety and long queuing times they associated with in-kind aid, and that they preferred vouchers to unrestricted cash because of the risk of theft of cash and concerns that household members may use cash for personal interests rather than household needs. Some also reported that they had heard reports from other people that vouchers were easy to use.
6060
Reported preference of cash/vouchers or in-kind aid:
Food
Hygiene NFIs
Household NFIs
Firewood/fuel
Shelter repair materials
Of those preferring in-kind aid, top reported reasons:
Poor quality of items at markets Quantity of items at markets is too low Prices at markets are unstable
82+51+14 82% 51% 14%
50600+350
60
5% 60% 35%
Of those preferring cash/vouchers, top reported reasons:
Freedom to purchase preferred brands or items Greater dignityAbility to save for the future
Cash/vouchers In-kind No preference
40600+360
60
4% 60% 36%
30600+370
60
3% 60% 37%
20550+4302% 55% 43%
3% 54% 43%100+33+33 100% 33% 33%
Of those preferring cash/vouchers, reported preferences between unrestricted cash and restricted vouchers:Food
Hygiene NFIs
Household NFIs
Firewood/fuel
Shelter repair materials
Of those preferring restricted vouchers over unrestricted cash, top reported reasons:
Currency is unstable Market prices are unstable Household members may misuse cash
50+42+17 50% 42% 17%
Of those preferring unrestricted cash over restricted vouchers, top reported reasons:72+69+28 72% 69% 28%
Freedom to allocate between food and non-food needs Ability to save for the futureConcern about price gouging
6060
500+0+500
60
50% 50%
200600+200
60
20% 60% 20%
5300+470
60
53% 47%
0670+33067% 33%
3300+67033% 67%
Unrestricted cash Restricted vouchers No preference
2 Recommendations were developed jointly by CWG member organisations at a Joint Analysis Workshop. In addition to the location-specific recommendations listed below, more general recommendations for assessed areas can be found in the overview document for this assessment.*All data shown in the graphs in this section comes from household interviews.
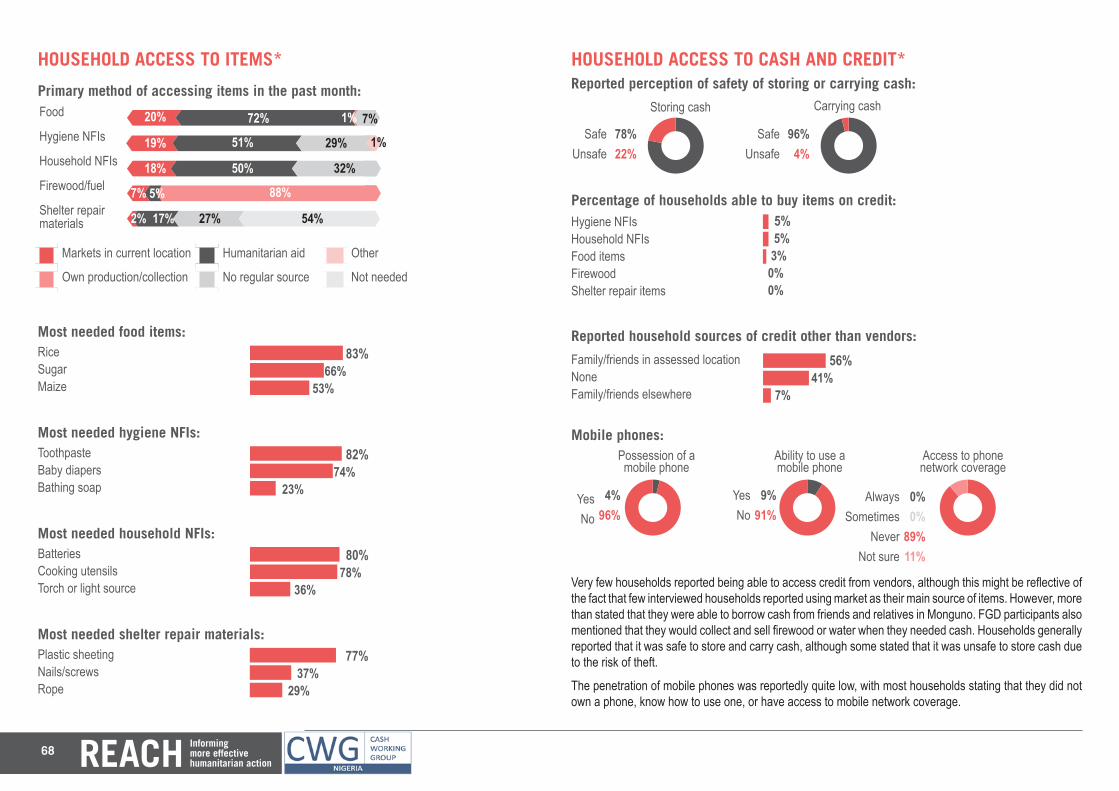
68
60
Primary method of accessing items in the past month:
Markets in current location Humanitarian aid Other
Own production/collection No regular source Not needed
Food
Hygiene NFIs
Household NFIs
Firewood/fuel
Shelter repair materials
6060
200720+10+70+0
60
20% 72% 1%
190510+0+290+1019% 51%
180+5000+320+0
60
18% 50%
70+50880+0+07% 5% 88%
20+170270+0+5402% 17% 27%
HOUSEHOLD ACCESS TO ITEMS*
Most needed food items: 83+66+53 83% 66% 53%
RiceSugarMaize
Most needed hygiene NFIs: 82+74+23 82% 74% 23%
ToothpasteBaby diapersBathing soap
Most needed household NFIs: 80+78+36 80% 78% 36%
BatteriesCooking utensilsTorch or light source
Most needed shelter repair materials:77+37+29 77% 37% 29%
Plastic sheetingNails/screwsRope
HOUSEHOLD ACCESS TO CASH AND CREDIT*
Very few households reported being able to access credit from vendors, although this might be reflective of the fact that few interviewed households reported using market as their main source of items. However, more than stated that they were able to borrow cash from friends and relatives in Monguno. FGD participants also mentioned that they would collect and sell firewood or water when they needed cash. Households generally reported that it was safe to store and carry cash, although some stated that it was unsafe to store cash due to the risk of theft.
The penetration of mobile phones was reportedly quite low, with most households stating that they did not own a phone, know how to use one, or have access to mobile network coverage.
7%
29%
32%
1%
54%Percentage of households able to buy items on credit:Hygiene NFIs Household NFIs Food itemsFirewoodShelter repair items
5+5+3+0+0 5% 5% 3%0%0%
Reported household sources of credit other than vendors:56+41+7Family/friends in assessed locationNoneFamily/friends elsewhere
56% 41% 7%
9+91+zMobile phones:
YesNo 4+96+z
Possession of a mobile phone
4%96%
YesNo
9%91%
Ability to use a mobile phone
AlwaysSometimes
NeverNot sure
0%0%
89%11%
Access to phone network coverage
96+4+zReported perception of safety of storing or carrying cash:
SafeUnsafe 78+22+z
Storing cash Carrying cash
78%22%
SafeUnsafe
96%4%
00+89+11+z
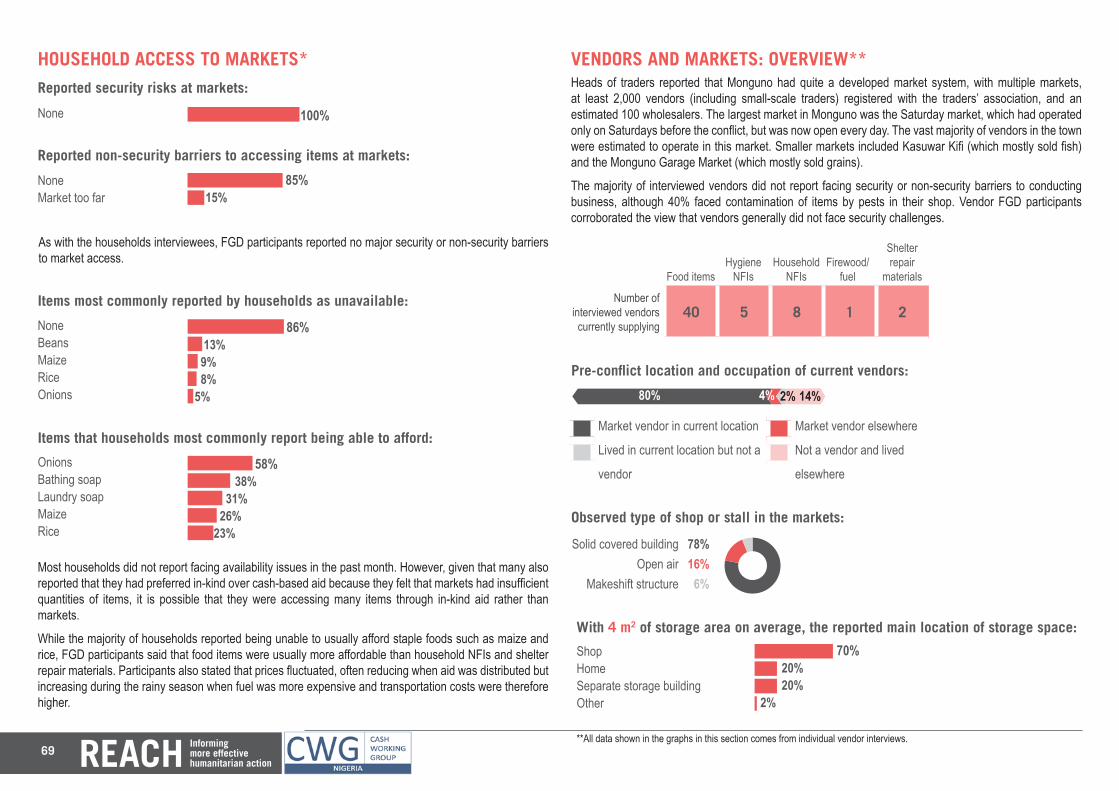
69
HOUSEHOLD ACCESS TO MARKETS*
As with the households interviewees, FGD participants reported no major security or non-security barriers to market access.
Reported non-security barriers to accessing items at markets:
Reported security risks at markets:100+None 100%85+15+NoneMarket too far
85% 15%
Most households did not report facing availability issues in the past month. However, given that many also reported that they had preferred in-kind over cash-based aid because they felt that markets had insufficient quantities of items, it is possible that they were accessing many items through in-kind aid rather than markets.
While the majority of households reported being unable to usually afford staple foods such as maize and rice, FGD participants said that food items were usually more affordable than household NFIs and shelter repair materials. Participants also stated that prices fluctuated, often reducing when aid was distributed but increasing during the rainy season when fuel was more expensive and transportation costs were therefore higher.
Items most commonly reported by households as unavailable:86+13+9+8+5 86% 13% 9% 8%5%
NoneBeansMaizeRiceOnions
Items that households most commonly report being able to afford:58+38+31+26+23 58% 38% 31% 26% 23%
OnionsBathing soapLaundry soapMaizeRice
VENDORS AND MARKETS: OVERVIEW**Heads of traders reported that Monguno had quite a developed market system, with multiple markets, at least 2,000 vendors (including small-scale traders) registered with the traders’ association, and an estimated 100 wholesalers. The largest market in Monguno was the Saturday market, which had operated only on Saturdays before the conflict, but was now open every day. The vast majority of vendors in the town were estimated to operate in this market. Smaller markets included Kasuwar Kifi (which mostly sold fish) and the Monguno Garage Market (which mostly sold grains).
The majority of interviewed vendors did not report facing security or non-security barriers to conducting business, although 40% faced contamination of items by pests in their shop. Vendor FGD participants corroborated the view that vendors generally did not face security challenges.
Number of interviewed vendors currently supplying
40 5 8 1 2
Food itemsHygiene
NFIsHousehold
NFIsFirewood/
fuel
Shelter repair
materials
Market vendor in current location Market vendor elsewhere
Lived in current location but not a Not a vendor and lived
vendor elsewhere
Pre-conflict location and occupation of current vendors:
80040+20+14060
80% 4% 2%
70+20+20+2Observed type of shop or stall in the markets:
With 4 m2 of storage area on average, the reported main location of storage space:
Solid covered buildingOpen air
Makeshift structure 78166z78%16%
6%
ShopHomeSeparate storage buildingOther
70% 20% 20% 2%
14%
**All data shown in the graphs in this section comes from individual vendor interviews.
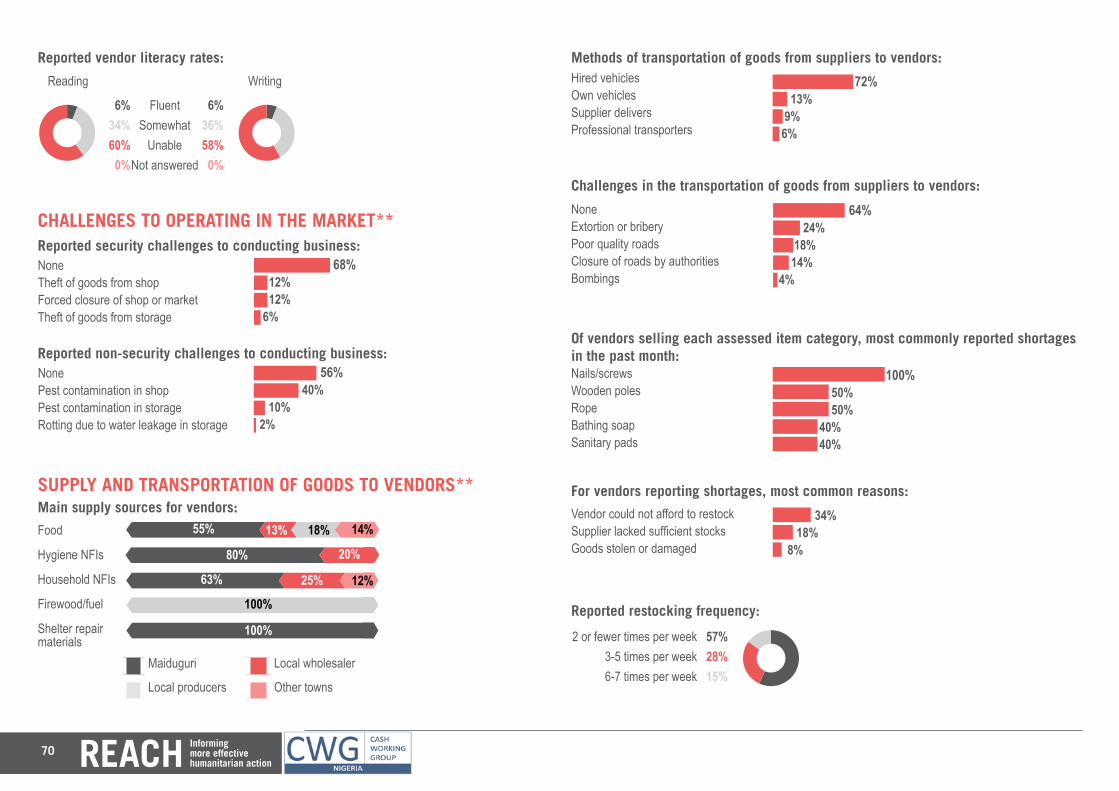
70
Reported vendor literacy rates:
FluentSomewhat
UnableNot answered
Reading Writing
636+58+0+z6+3460+0z6%
36%58%
0%
6%34%60%
0%
CHALLENGES TO OPERATING IN THE MARKET**
Reported non-security challenges to conducting business:NonePest contamination in shopPest contamination in storageRotting due to water leakage in storage
NoneTheft of goods from shopForced closure of shop or marketTheft of goods from storage 56+40+10+2
68+12+12+6
56% 40% 10% 2%
68% 12% 12% 6%
Reported security challenges to conducting business:
SUPPLY AND TRANSPORTATION OF GOODS TO VENDORS**
6060606060Main supply sources for vendors:
Maiduguri Local wholesaler
Local producers Other towns
550130+180+14055% 13%
800200+0+080% 20%
630250+0+12063% 25%
00+1000+0100%
10000+0+0100%
Food
Hygiene NFIs
Household NFIs
Firewood/fuel
Shelter repair materials
18%
12%
14%
Hired vehiclesOwn vehiclesSupplier deliversProfessional transporters
72+13+9+6+0 72% 13% 9% 6%
Methods of transportation of goods from suppliers to vendors:
Challenges in the transportation of goods from suppliers to vendors:
NoneExtortion or briberyPoor quality roadsClosure of roads by authoritiesBombings
64+24+18+14+4 64% 24% 18% 14% 4%
Of vendors selling each assessed item category, most commonly reported shortages in the past month: 100+50+50+40+40 100%
50% 50%40%40%
Nails/screwsWooden polesRopeBathing soapSanitary pads
For vendors reporting shortages, most common reasons:34+18+8 34% 18% 8%
Vendor could not afford to restockSupplier lacked sufficient stocksGoods stolen or damaged
Reported restocking frequency:
2 or fewer times per week3-5 times per week6-7 times per week 572815z57%
28%15%
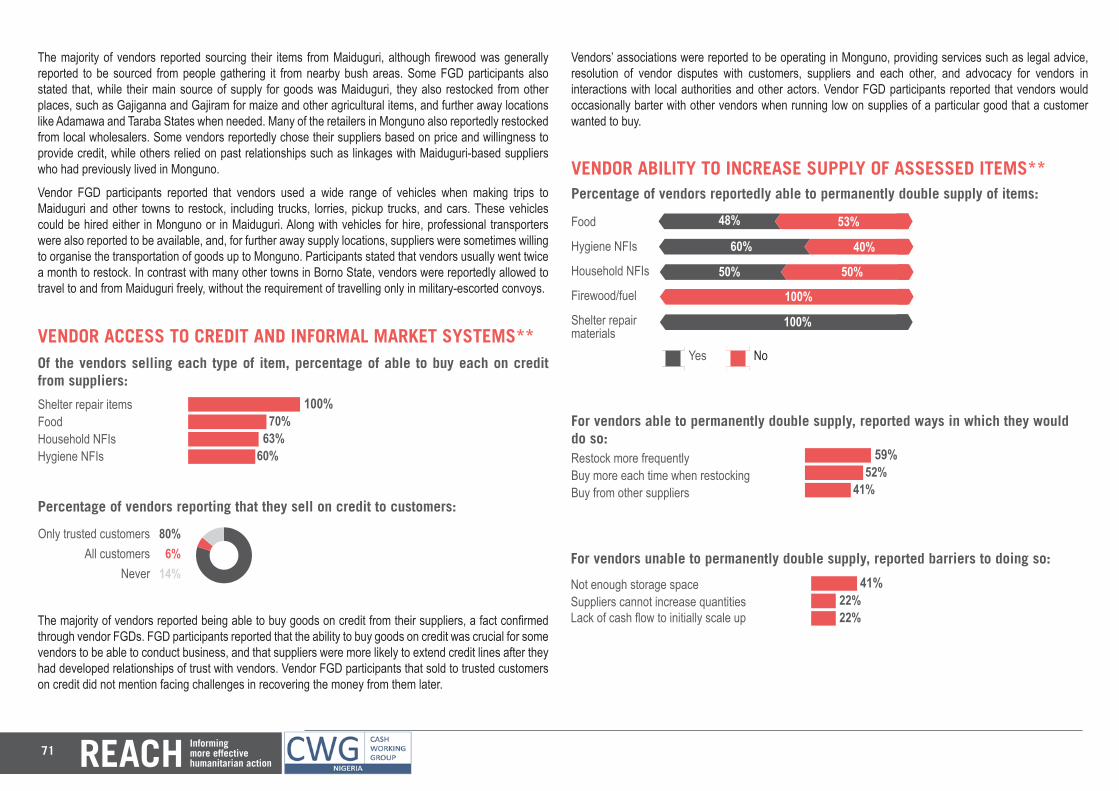
71
The majority of vendors reported sourcing their items from Maiduguri, although firewood was generally reported to be sourced from people gathering it from nearby bush areas. Some FGD participants also stated that, while their main source of supply for goods was Maiduguri, they also restocked from other places, such as Gajiganna and Gajiram for maize and other agricultural items, and further away locations like Adamawa and Taraba States when needed. Many of the retailers in Monguno also reportedly restocked from local wholesalers. Some vendors reportedly chose their suppliers based on price and willingness to provide credit, while others relied on past relationships such as linkages with Maiduguri-based suppliers who had previously lived in Monguno.
Vendor FGD participants reported that vendors used a wide range of vehicles when making trips to Maiduguri and other towns to restock, including trucks, lorries, pickup trucks, and cars. These vehicles could be hired either in Monguno or in Maiduguri. Along with vehicles for hire, professional transporters were also reported to be available, and, for further away supply locations, suppliers were sometimes willing to organise the transportation of goods up to Monguno. Participants stated that vendors usually went twice a month to restock. In contrast with many other towns in Borno State, vendors were reportedly allowed to travel to and from Maiduguri freely, without the requirement of travelling only in military-escorted convoys.
VENDOR ACCESS TO CREDIT AND INFORMAL MARKET SYSTEMS**
The majority of vendors reported being able to buy goods on credit from their suppliers, a fact confirmed through vendor FGDs. FGD participants reported that the ability to buy goods on credit was crucial for some vendors to be able to conduct business, and that suppliers were more likely to extend credit lines after they had developed relationships of trust with vendors. Vendor FGD participants that sold to trusted customers on credit did not mention facing challenges in recovering the money from them later.
Of the vendors selling each type of item, percentage of able to buy each on credit from suppliers:
Shelter repair itemsFoodHousehold NFIsHygiene NFIs
100+70+63+60 100% 70% 63% 60%
Percentage of vendors reporting that they sell on credit to customers:
Only trusted customersAll customers
Never 80614z80%6%
14%
Vendors’ associations were reported to be operating in Monguno, providing services such as legal advice, resolution of vendor disputes with customers, suppliers and each other, and advocacy for vendors in interactions with local authorities and other actors. Vendor FGD participants reported that vendors would occasionally barter with other vendors when running low on supplies of a particular good that a customer wanted to buy.
VENDOR ABILITY TO INCREASE SUPPLY OF ASSESSED ITEMS**
Yes No
Percentage of vendors reportedly able to permanently double supply of items:
6060
480530
60
48% 53%
600400
60
60% 40%
500500
60
50% 50%
01000100%
1000100%
Food
Hygiene NFIs
Household NFIs
Firewood/fuel
Shelter repair materials
For vendors able to permanently double supply, reported ways in which they would do so:Restock more frequentlyBuy more each time when restockingBuy from other suppliers
59+52+41 59% 52% 41%
For vendors unable to permanently double supply, reported barriers to doing so:
Not enough storage spaceSuppliers cannot increase quantitiesLack of cash flow to initially scale up
41+22+22 41% 22% 22%
72
Interviewed vendors generally had mixed responses to the question of whether they could permanently double supply to respond to an increase in demand. Those reporting that they could do so mentioned a range of methods, including more frequent restocking, restocking greater quantities at a time, and diversification of suppliers. Those reportedly unable to permanently double supplies also cited a range of reasons, most commonly a lack of storage space.
In vendor FGDs, participants estimated that they would not face major challenges in restocking, with some saying that, as long as demand increased, vendors in Monguno could expand supply to meet it. However, some others mentioned that vendors without credit lines from suppliers may struggle to expand due to a lack of capital for the initial scale-up. Participants also stated that they believed new people could become vendors in Monguno market if they could access the start-up capital to do so. Some others speculated that vendors displaced from other nearby towns in the future might want to start selling goods in Monguno.
Overall, indicators from vendor interviews and FGDs suggest that many vendors would be able to increase supply in response to a growth in demand for items from the market. Unlike many other assessed locations in Borno State, goods could be transported from Maiduguri to Monguno by road without the need for a military escort. In addition, the large size of the market, the availability of supplier credit, and the presence of informal market systems such as traders’ associations and inter-vendor bartering suggest that the market has some capacity to expand.
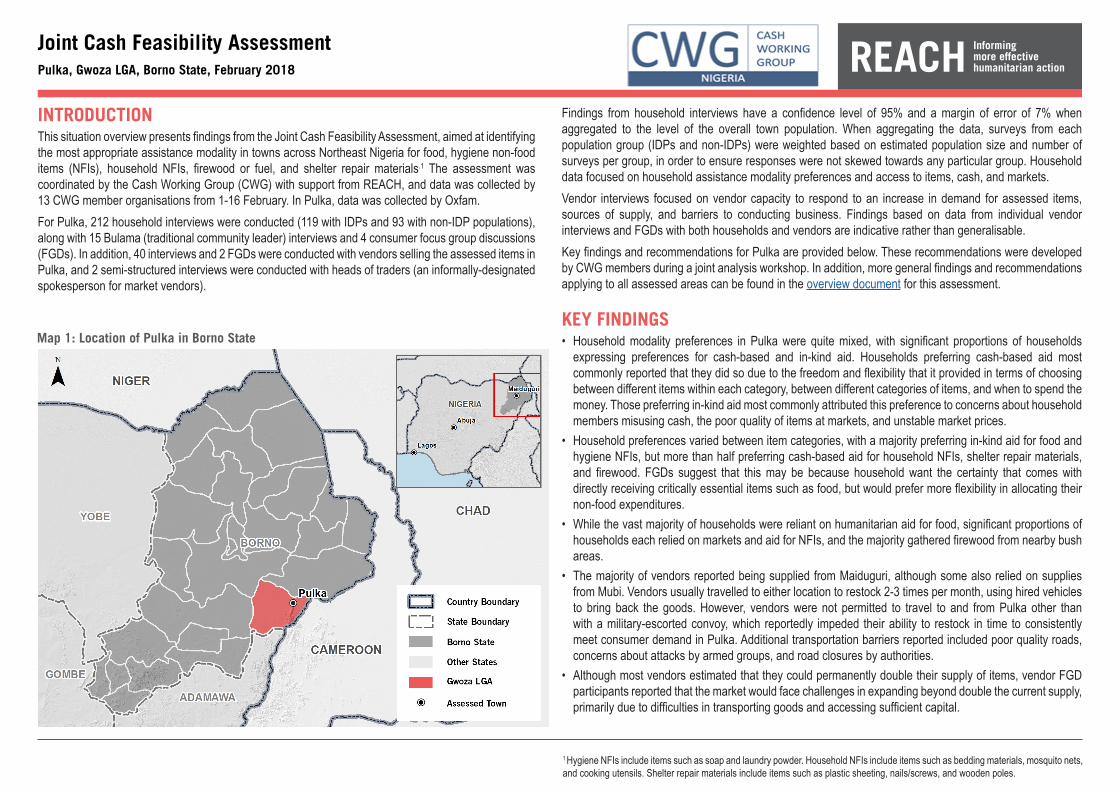
INTRODUCTIONThis situation overview presents findings from the Joint Cash Feasibility Assessment, aimed at identifying the most appropriate assistance modality in towns across Northeast Nigeria for food, hygiene non-food items (NFIs), household NFIs, firewood or fuel, and shelter repair materials.1 The assessment was coordinated by the Cash Working Group (CWG) with support from REACH, and data was collected by 13 CWG member organisations from 1-16 February. In Pulka, data was collected by Oxfam.For Pulka, 212 household interviews were conducted (119 with IDPs and 93 with non-IDP populations), along with 15 Bulama (traditional community leader) interviews and 4 consumer focus group discussions (FGDs). In addition, 40 interviews and 2 FGDs were conducted with vendors selling the assessed items in Pulka, and 2 semi-structured interviews were conducted with heads of traders (an informally-designated spokesperson for market vendors).
Joint Cash Feasibility AssessmentPulka, Gwoza LGA, Borno State, February 2018
Findings from household interviews have a confidence level of 95% and a margin of error of 7% when aggregated to the level of the overall town population. When aggregating the data, surveys from each population group (IDPs and non-IDPs) were weighted based on estimated population size and number of surveys per group, in order to ensure responses were not skewed towards any particular group. Household data focused on household assistance modality preferences and access to items, cash, and markets.Vendor interviews focused on vendor capacity to respond to an increase in demand for assessed items, sources of supply, and barriers to conducting business. Findings based on data from individual vendor interviews and FGDs with both households and vendors are indicative rather than generalisable.Key findings and recommendations for Pulka are provided below. These recommendations were developed by CWG members during a joint analysis workshop. In addition, more general findings and recommendations applying to all assessed areas can be found in the overview document for this assessment.
KEY FINDINGS• Household modality preferences in Pulka were quite mixed, with significant proportions of households
expressing preferences for cash-based and in-kind aid. Households preferring cash-based aid most commonly reported that they did so due to the freedom and flexibility that it provided in terms of choosing between different items within each category, between different categories of items, and when to spend the money. Those preferring in-kind aid most commonly attributed this preference to concerns about household members misusing cash, the poor quality of items at markets, and unstable market prices.
• Household preferences varied between item categories, with a majority preferring in-kind aid for food and hygiene NFIs, but more than half preferring cash-based aid for household NFIs, shelter repair materials, and firewood. FGDs suggest that this may be because household want the certainty that comes with directly receiving critically essential items such as food, but would prefer more flexibility in allocating their non-food expenditures.
• While the vast majority of households were reliant on humanitarian aid for food, significant proportions of households each relied on markets and aid for NFIs, and the majority gathered firewood from nearby bush areas.
• The majority of vendors reported being supplied from Maiduguri, although some also relied on supplies from Mubi. Vendors usually travelled to either location to restock 2-3 times per month, using hired vehicles to bring back the goods. However, vendors were not permitted to travel to and from Pulka other than with a military-escorted convoy, which reportedly impeded their ability to restock in time to consistently meet consumer demand in Pulka. Additional transportation barriers reported included poor quality roads, concerns about attacks by armed groups, and road closures by authorities.
• Although most vendors estimated that they could permanently double their supply of items, vendor FGD participants reported that the market would face challenges in expanding beyond double the current supply, primarily due to difficulties in transporting goods and accessing sufficient capital.
Map 1: Location of Pulka in Borno State
1 Hygiene NFIs include items such as soap and laundry powder. Household NFIs include items such as bedding materials, mosquito nets, and cooking utensils. Shelter repair materials include items such as plastic sheeting, nails/screws, and wooden poles.
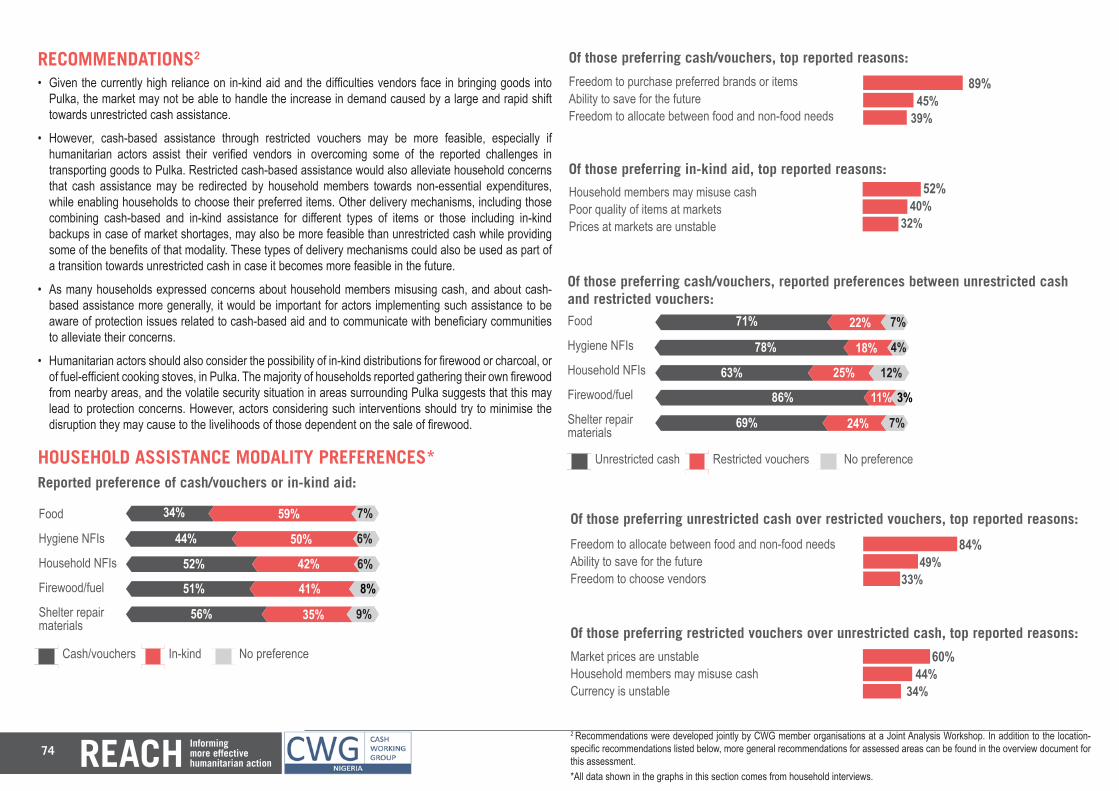
74
560350+90
RECOMMENDATIONS2
• Given the currently high reliance on in-kind aid and the difficulties vendors face in bringing goods into Pulka, the market may not be able to handle the increase in demand caused by a large and rapid shift towards unrestricted cash assistance.
• However, cash-based assistance through restricted vouchers may be more feasible, especially if humanitarian actors assist their verified vendors in overcoming some of the reported challenges in transporting goods to Pulka. Restricted cash-based assistance would also alleviate household concerns that cash assistance may be redirected by household members towards non-essential expenditures, while enabling households to choose their preferred items. Other delivery mechanisms, including those combining cash-based and in-kind assistance for different types of items or those including in-kind backups in case of market shortages, may also be more feasible than unrestricted cash while providing some of the benefits of that modality. These types of delivery mechanisms could also be used as part of a transition towards unrestricted cash in case it becomes more feasible in the future.
• As many households expressed concerns about household members misusing cash, and about cash-based assistance more generally, it would be important for actors implementing such assistance to be aware of protection issues related to cash-based aid and to communicate with beneficiary communities to alleviate their concerns.
• Humanitarian actors should also consider the possibility of in-kind distributions for firewood or charcoal, or of fuel-efficient cooking stoves, in Pulka. The majority of households reported gathering their own firewood from nearby areas, and the volatile security situation in areas surrounding Pulka suggests that this may lead to protection concerns. However, actors considering such interventions should try to minimise the disruption they may cause to the livelihoods of those dependent on the sale of firewood.
HOUSEHOLD ASSISTANCE MODALITY PREFERENCES*
6060
Reported preference of cash/vouchers or in-kind aid:
Food
Hygiene NFIs
Household NFIs
Firewood/fuel
Shelter repair materials
Of those preferring in-kind aid, top reported reasons:
Household members may misuse cash Poor quality of items at markets Prices at markets are unstable
52+40+32 52% 40% 32%
340590+70
60
34% 59% 7%
Of those preferring cash/vouchers, top reported reasons:
Freedom to purchase preferred brands or items Ability to save for the futureFreedom to allocate between food and non-food needs
Cash/vouchers In-kind No preference
440500+60
60
44% 50% 6%
520420+60
60
52% 42% 6%
510410+8051% 41% 8%
56% 35% 9%
89+45+39 89% 45% 39%
Of those preferring cash/vouchers, reported preferences between unrestricted cash and restricted vouchers:Food
Hygiene NFIs
Household NFIs
Firewood/fuel
Shelter repair materials
Of those preferring restricted vouchers over unrestricted cash, top reported reasons:
Market prices are unstable Household members may misuse cash Currency is unstable
60+44+34 60% 44% 34%
Of those preferring unrestricted cash over restricted vouchers, top reported reasons:84+49+33 84% 49% 33%
Freedom to allocate between food and non-food needs Ability to save for the futureFreedom to choose vendors
6060
710220+70
60
71% 22% 7%
780180+40
60
78% 18% 4%
630250+120
60
63% 25% 12%
860110+3086% 11% 3%
690240+7069% 24% 7%
Unrestricted cash Restricted vouchers No preference
2 Recommendations were developed jointly by CWG member organisations at a Joint Analysis Workshop. In addition to the location-specific recommendations listed below, more general recommendations for assessed areas can be found in the overview document for this assessment.*All data shown in the graphs in this section comes from household interviews.
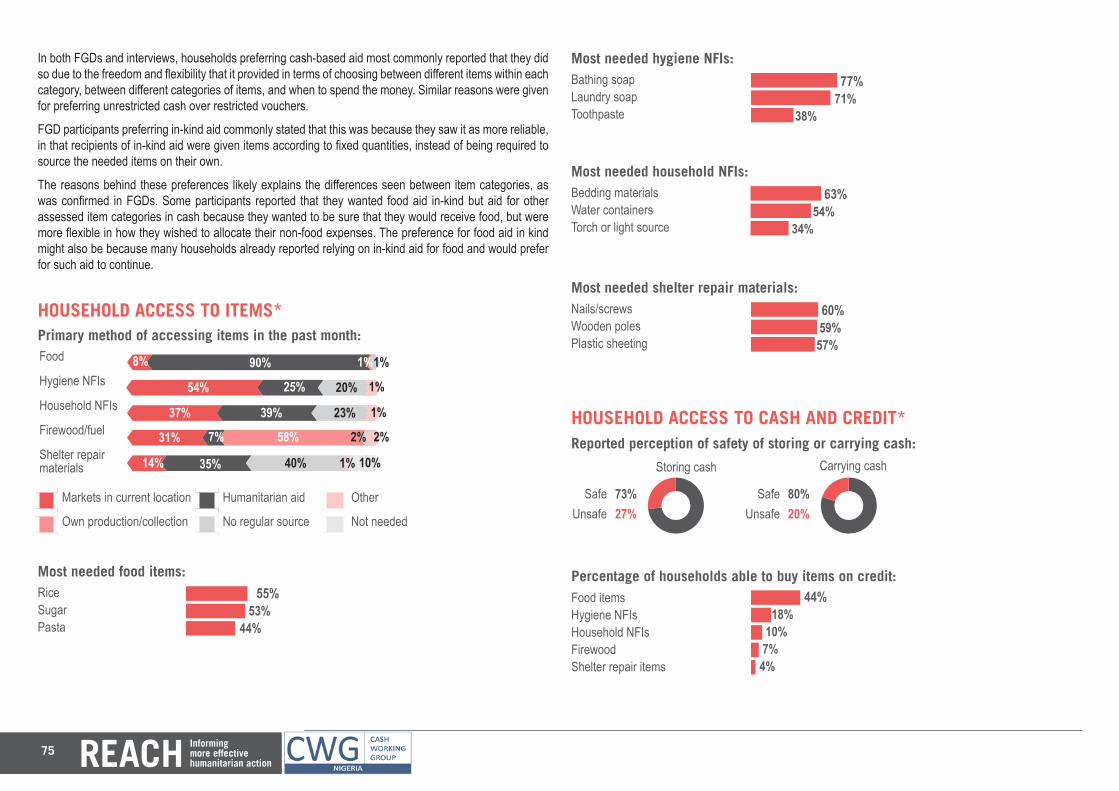
75
HOUSEHOLD ACCESS TO ITEMS*
Most needed food items: 55+53+44 55% 53% 44%
RiceSugarPasta
Most needed hygiene NFIs: 77+71+38 77% 71% 38%
Bathing soapLaundry soapToothpaste
Most needed household NFIs: 63+54+34 63% 54% 34%
Bedding materialsWater containersTorch or light source
Most needed shelter repair materials:60+59+57 60% 59% 57%
Nails/screwsWooden polesPlastic sheeting
HOUSEHOLD ACCESS TO CASH AND CREDIT*
In both FGDs and interviews, households preferring cash-based aid most commonly reported that they did so due to the freedom and flexibility that it provided in terms of choosing between different items within each category, between different categories of items, and when to spend the money. Similar reasons were given for preferring unrestricted cash over restricted vouchers.
FGD participants preferring in-kind aid commonly stated that this was because they saw it as more reliable, in that recipients of in-kind aid were given items according to fixed quantities, instead of being required to source the needed items on their own.
The reasons behind these preferences likely explains the differences seen between item categories, as was confirmed in FGDs. Some participants reported that they wanted food aid in-kind but aid for other assessed item categories in cash because they wanted to be sure that they would receive food, but were more flexible in how they wished to allocate their non-food expenses. The preference for food aid in kind might also be because many households already reported relying on in-kind aid for food and would prefer for such aid to continue.
Percentage of households able to buy items on credit:Food items Hygiene NFIs Household NFIsFirewoodShelter repair items
44+18+10+7+4 44% 18% 10% 7% 4%
80+20+zReported perception of safety of storing or carrying cash:
SafeUnsafe 73+27+z
Storing cash Carrying cash
73%27%
SafeUnsafe
80%20%
Markets in current location Humanitarian aid Other
Own production/collection No regular source Not needed
60
Primary method of accessing items in the past month:Food
Hygiene NFIs
Household NFIs
Firewood/fuel
Shelter repair materials
6060
80900+10+10+08% 90% 1%
540250+0+200+1060
54% 25%
370+3900+230+10
6037% 39%
310+70580+20+2031% 7% 58%
140+350400+10+10014% 35% 40%
1%
20%
23%
2%
1%
1%
1%
2%
10%

76
Reported household sources of credit other than vendors:60+40+29Family/friends in assessed locationFamily/friends elsewhereNone
60% 40% 29%
81+19+zMobile phones:
YesNo 53+47+z
Possession of a mobile phone
53%47%
YesNo
81%19%
Ability to use a mobile phone
AlwaysSometimes
NeverNot sure
0%94%
0%6%
Access to phone network coverage
HOUSEHOLD ACCESS TO MARKETS*
While some FGD participants reported being concerned about the general security situation in the area, they did not report modifying their behaviour in response to market access barriers. Some female FGD participants mentioned that their families sometimes restricted them from accessing markets.
Reported non-security barriers to accessing items at markets:
Reported security risks at markets: 64+17+9NoneBombingsGun attacks
64% 17% 9%39+39+17None
Nobody at home to look after children/elderlyInadequate quality of food
39% 39% 17%
Many FGD participants stated that key NFIs were frequently unavailable in markets, particularly household NFIs and shelter repair materials. According to participants, availability issues were usually linked to difficulties for vendors in accessing their suppliers in Maiduguri or Mubi.
Items most commonly reported by households as unavailable:41+33+33+31+26 41% 33% 33% 31% 26%
MaizeRiceVegetable oilBeansNone
Items that households most commonly report being able to afford:52+39+29+27+26 52% 39% 29% 27% 26%
BeansRiceOnionsBathing soapVegetable oil
94+6+zWhile fewer than half of households reported being able to buy items on credit from vendors, the majority were able to borrow money from family and friends either within or outside Pulka. FGD participants corroborated this information, and some participants also reported selling food items when short on cash.
FGD participants also reported never having received money through mobile money transfers. While not many households reported knowing how to use phones, almost half owned phones and most reported that network coverage was sometimes available.
VENDORS AND MARKETS: OVERVIEW**According to heads of traders in Pulka, the market still operated in its pre-conflict location, although some pre-conflict vendors had not yet resumed business in the market. Heads of traders also estimated that there were 5-10 wholesalers operating in Pulka. The main market day in Pulka, Tuesday, was chosen not to conflict with market days other nearby towns, enabling vendors from these towns to come to Pulka and sell goods only on the market day.
Number of interviewed vendors currently supplying
22 10 24 1 1
Food itemsHygiene
NFIsHousehold
NFIsFirewood/
fuel
Shelter repair
materials
**All data shown in the graphs in this section comes from individual vendor interviews.
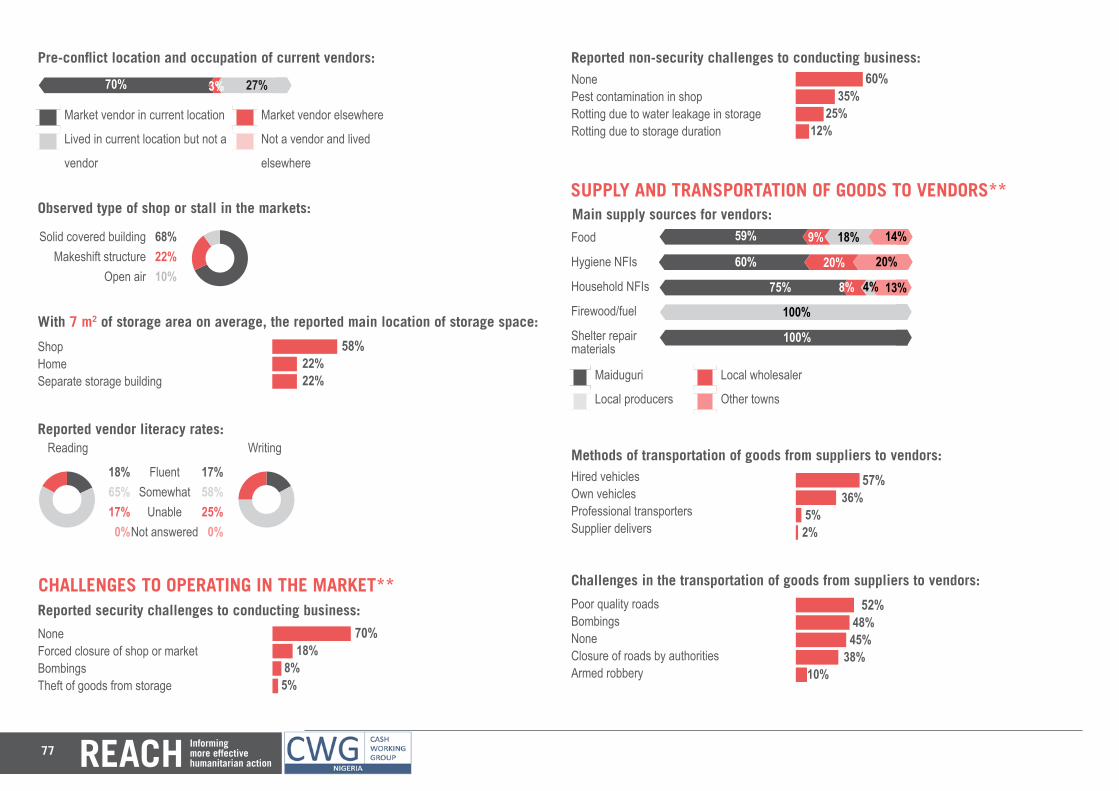
77
Market vendor in current location Market vendor elsewhere
Lived in current location but not a Not a vendor and lived
vendor elsewhere
Pre-conflict location and occupation of current vendors:
70030+270+0
60
70% 3% 27%
58+22+22
Observed type of shop or stall in the markets:
With 7 m2 of storage area on average, the reported main location of storage space:
Solid covered buildingMakeshift structure
Open air 682210z68%22%10%
ShopHomeSeparate storage building
58% 22% 22%
Reported vendor literacy rates:
FluentSomewhat
UnableNot answered
Reading Writing
1758+25+0+z18+6517+0z17%58%25%
0%
18%65%17%
0%
CHALLENGES TO OPERATING IN THE MARKET**
Reported non-security challenges to conducting business:NonePest contamination in shopRotting due to water leakage in storageRotting due to storage duration
NoneForced closure of shop or marketBombingsTheft of goods from storage
60+35+25+12
70+18+8+5
60% 35% 25% 12%
70% 18% 8% 5%
Reported security challenges to conducting business:
SUPPLY AND TRANSPORTATION OF GOODS TO VENDORS**
6060606060Main supply sources for vendors:
Maiduguri Local wholesaler
Local producers Other towns
59090+180+14059% 9%
600200+0+20060% 20%
75080+40+13075% 8%
00+1000+0100%
10000+0+0100%
Hired vehiclesOwn vehiclesProfessional transportersSupplier delivers
57+36+5+2 57% 36% 5%2%
Methods of transportation of goods from suppliers to vendors:
Food
Hygiene NFIs
Household NFIs
Firewood/fuel
Shelter repair materials
4%
18%
13%
20%
14%
Challenges in the transportation of goods from suppliers to vendors:
Poor quality roadsBombingsNoneClosure of roads by authoritiesArmed robbery
52+48+45+38+10 52% 48% 45% 38% 10%
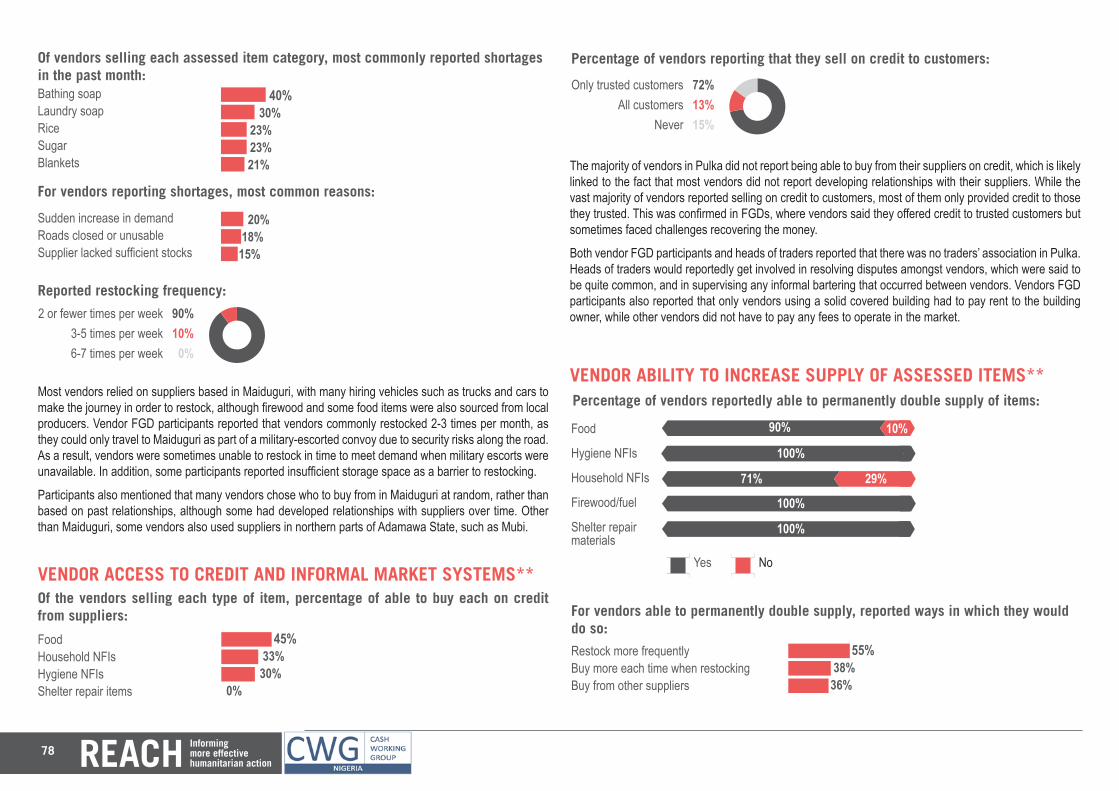
78
For vendors reporting shortages, most common reasons:20+18+15 20% 18% 15%
Sudden increase in demandRoads closed or unusableSupplier lacked sufficient stocks
Reported restocking frequency:
2 or fewer times per week3-5 times per week6-7 times per week 90100z90%
10%0%
VENDOR ACCESS TO CREDIT AND INFORMAL MARKET SYSTEMS**
The majority of vendors in Pulka did not report being able to buy from their suppliers on credit, which is likely linked to the fact that most vendors did not report developing relationships with their suppliers. While the vast majority of vendors reported selling on credit to customers, most of them only provided credit to those they trusted. This was confirmed in FGDs, where vendors said they offered credit to trusted customers but sometimes faced challenges recovering the money.
Both vendor FGD participants and heads of traders reported that there was no traders’ association in Pulka. Heads of traders would reportedly get involved in resolving disputes amongst vendors, which were said to be quite common, and in supervising any informal bartering that occurred between vendors. Vendors FGD participants also reported that only vendors using a solid covered building had to pay rent to the building owner, while other vendors did not have to pay any fees to operate in the market.
Most vendors relied on suppliers based in Maiduguri, with many hiring vehicles such as trucks and cars to make the journey in order to restock, although firewood and some food items were also sourced from local producers. Vendor FGD participants reported that vendors commonly restocked 2-3 times per month, as they could only travel to Maiduguri as part of a military-escorted convoy due to security risks along the road. As a result, vendors were sometimes unable to restock in time to meet demand when military escorts were unavailable. In addition, some participants reported insufficient storage space as a barrier to restocking.
Participants also mentioned that many vendors chose who to buy from in Maiduguri at random, rather than based on past relationships, although some had developed relationships with suppliers over time. Other than Maiduguri, some vendors also used suppliers in northern parts of Adamawa State, such as Mubi.
Of vendors selling each assessed item category, most commonly reported shortages in the past month: 40+30+23+23+21 40%
30% 23% 23% 21%
Bathing soapLaundry soapRiceSugarBlankets
Of the vendors selling each type of item, percentage of able to buy each on credit from suppliers:
FoodHousehold NFIsHygiene NFIsShelter repair items
45+33+30 45% 33% 30%0%
Percentage of vendors reporting that they sell on credit to customers:
Only trusted customersAll customers
Never 721315z72%13%15%
VENDOR ABILITY TO INCREASE SUPPLY OF ASSESSED ITEMS**
Yes No
Percentage of vendors reportedly able to permanently double supply of items:
6060
900100
60
90% 10%
10000
60
100%
710290
60
71% 29%
10000100%
10000100%
Food
Hygiene NFIs
Household NFIs
Firewood/fuel
Shelter repair materials
For vendors able to permanently double supply, reported ways in which they would do so:
Restock more frequentlyBuy more each time when restockingBuy from other suppliers
55+38+36 55% 38% 36%
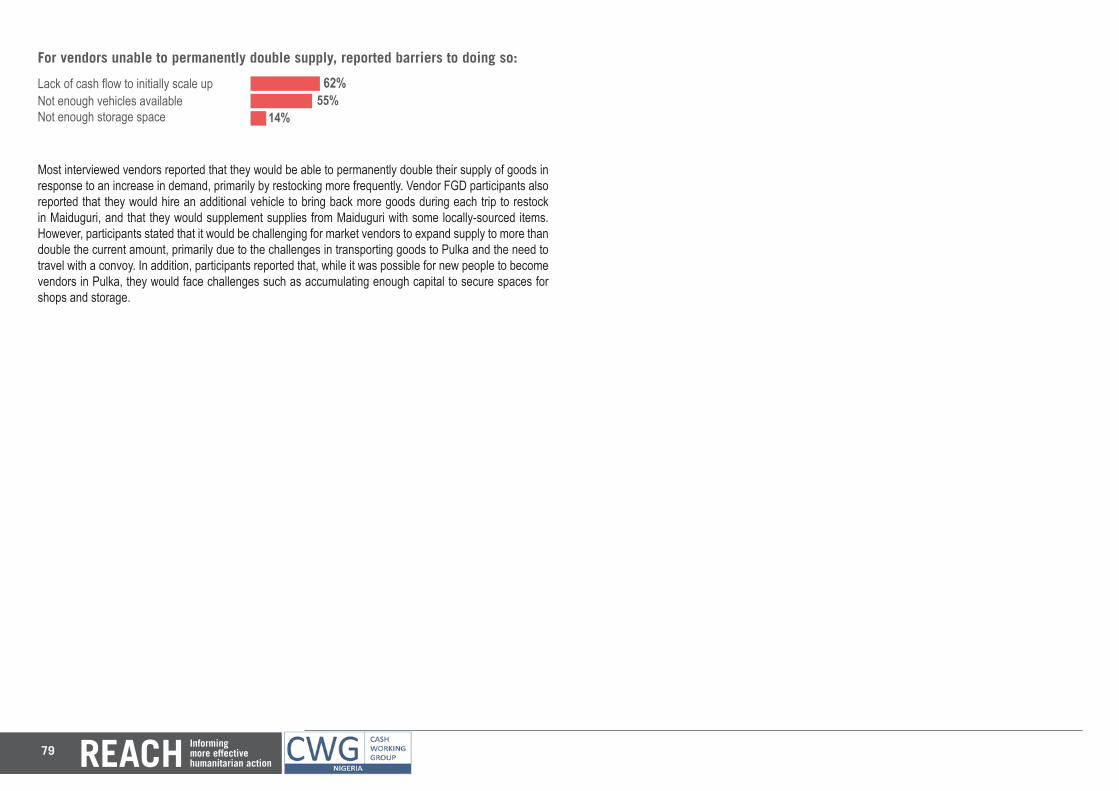
79
For vendors unable to permanently double supply, reported barriers to doing so:
Lack of cash flow to initially scale upNot enough vehicles availableNot enough storage space
62+55+14 62% 55% 14%
Most interviewed vendors reported that they would be able to permanently double their supply of goods in response to an increase in demand, primarily by restocking more frequently. Vendor FGD participants also reported that they would hire an additional vehicle to bring back more goods during each trip to restock in Maiduguri, and that they would supplement supplies from Maiduguri with some locally-sourced items. However, participants stated that it would be challenging for market vendors to expand supply to more than double the current amount, primarily due to the challenges in transporting goods to Pulka and the need to travel with a convoy. In addition, participants reported that, while it was possible for new people to become vendors in Pulka, they would face challenges such as accumulating enough capital to secure spaces for shops and storage.


![PDF] BORNO STATE UNIVERSITY - myschoolgist.com68 95434855fd isa bilkisu chemistry borno hawul 69 95417786ee ishaka saidu usman chemistry borno hawul 70 95419683hg abubakar muhammad](https://img.dokumen.tips/doc/110x75/612d22d61ecc515869420069/-borno-state-university-95434855fd-isa-bilkisu-chemistry-borno-hawul-69-95417786ee.jpg)