Embed Size (px)
Citation preview
RESEARCH ARTICLE
Joining the WTO: Why Does It Take So Long?
Kent Jones & Yunwei Gai
Published online: 19 October 2012# Springer Science+Business Media New York 2012
Abstract The WTO aspires to universal membership, but the process of joining hasbecome very lengthy and many countries have faced particularly difficult and prolongednegotiations. TheWTO applies a detailed and legalistic approach to accession, due to itsaccumulation of policy coverage over the years and the enforcement powers of theDispute Settlement Understanding. InWTO accession cases,WTO incumbent membersappear to have a superior bargaining position. At the same time, applicant countriesappear to differ in their capability or willingness to gather information and institute themany reforms required to conclude the accession negotiation. Based on the record ofcompleted and ongoing accession negotiations, the present study uses an endurancemodel to identify the factors that determine the probability of an applicant’s joining in agiven month. In addition to the number of completed accessions, World Bank indexes of“government effectiveness” have a particularly strong influence on the duration of theaccession process. In view of the difficult cases remaining in order to complete universalWTO membership, the authors propose a broader approach to WTO membership andmore flexibility in accession requirements.
Keywords WTOmembership .WTO accession . Time to event . Cox proportionalhazards model
JEL codes F13 . F42 . F53
1 Introduction
The World Trade Organization (WTO) has achieved nearly universal membership,but the negotiations to join are long, and appear to be getting even longer. This studyfocuses on the 55 countries that had either joined the WTO, or were negotiating
Open Econ Rev (2013) 24:695–716DOI 10.1007/s11079-012-9262-4
The authors gratefully acknowledge helpful comments and suggestions by the editor and an anonymousreferee. Any remaining errors are the responsibility of the authors.
K. Jones (*) : Y. GaiBabson College, Babson Park, MA 02457, USAe-mail: [email protected]
Y. Gaie-mail: [email protected]
accession, in early 2011. Twenty-five of these countries joined the organization afterit was founded in 1995. Thirty other countries, with a total population of 565 million,were negotiating accession in late 2010, most prominently the Russian Federation.1
Many of these countries had been negotiating for WTO accession for decades, andmany of them complained that existing WTO members attempted to impose termsupon them that go beyond those of existing WTO members (“WTO-plus” provi-sions), while incumbent members complained that applicants didn’t move quicklyenough to make their policies comply with WTO rules. Prior studies have focusedexclusively on countries that already completed the accession process (Jones 2009;Tang and Wei 2009; Copelovitch and Ohls 2009). This paper sets out to examine theeconomic and political factors that affect the length of the WTO accession process forcountries that had completed or are currently negotiating accession in 2011, using aduration model.
The issue of the length of the WTO accession process is important because it maysignificantly affect the gains from trade and the economic welfare of the applicantcountries. Reforms negotiated during accession potentially improve the country’sefficiency and attractiveness as a trade and investment partner, but some demands byincumbent WTO members may contribute little to efficiency and delay accessionunnecessarily, at the cost of foregone gains from trade. Furthermore, the one-sidedaccession process, dominated by existing WTO members, may be creating resent-ment that could discourage applicants from completing the process or damage futureWTO negotiations if they do join. Examining the determinants of the length of theprocess may therefore point to ways in which the efficiency of the process could beimproved.
The paper is organized as follows. The analysis begins with a brief discussion ofthe benefits of WTO membership, and a review of members, recent accessions,observers, current applicants and those outside the WTO system, along with associ-ated descriptive statistics. There follows a review of WTO accession rules and thevarious factors that may affect the length of negotiations. A brief description of theduration model methodology is followed by a discussion of the empirical results. Thepaper concludes by taking stock of WTO accession practice, and offering recom-mendations for improving the process.
2 Benefits of WTO Membership and Their Implications for AccessionNegotiations
WTO membership makes it possible for its members to gain from trade throughimproved market access to all WTO members, common trade policy rules, anddispute settlement. The main difficulty of joining the WTO lies in the adjustmentand compliance costs—political, social, and economic—that accompany trade liber-alization and de-regulation. Some of these costs are incurred because WTO member-ship requires the national government to control all aspects of trade policy, includingintellectual property protection, customs valuation and product standards compliance.
1 The Russian Federation joined in July 2012; Samoa, Vanuatu, and Montenegro also joined in 2012. As ofearly 2013, the WTO membership included 157 members, with 26 still negotiating accession.
696 K. Jones, Y. Gai

Institutional deficiencies in these areas may lengthen the accession process.Entrenched protectionist interests, through lobbies or government agencies, may alsodelay the negotiations. Yet those countries favorably disposed towards trade liberal-ization and internal market reform may want to use the WTO as an “anchor” inpromoting economic reforms, which would tend to facilitate quicker negotiations. Ingeneral, at least some of the progress in the negotiations will depend on internalfactors and attributes of the applicant country.
WTO countries involved in the Working Party (WP) for a country’s membershipwill also affect the negotiations. For example, some existing WTO members maydemand bilateral negotiations with the applicant country, affecting accession termsand the length of the negotiations.2 While it is clear that each additional member tothe WTO brings the world economy closer to fully liberalized global trade, andincreasing economic welfare for all WTO members, the total economic gains forthe existing membership will be marginal if the country is small, and even when theapplicant country is large, the stakes may be small relative to the volume of worldtrade. An applicant may therefore value its WTO membership more than the existingWTO members do, who are therefore less motivated to admit them quickly. Existingmember countries are also concerned about possible future dispute settlement caseswith new members, based on unresolved compliance issues. For this reason, waryWTO members may take a slower and more deliberate approach to the accessionprocess.3
3 Accession Rules in the WTO System
The General Agreement on Tariffs and Trade (GATT), which preceded the WTO,covered mainly manufactures trade, and its accession criteria were rather easy tomeet, especially with regard to developing countries (see Lanoszka 2001). In contrast,the WTO extends trade rules to agriculture and services, and reaches “behind theborder” into each member’s trade-related policy regimes. All new WTO membersmust comply with the obligations of all WTO agreements, including all previousGATT rules still in force. In addition, WTO membership subjects its members to thediscipline of a dispute settlement system in which all WTO members must togetherveto a dispute settlement decision in order to overturn it. The WTO thus defines eachmember’s rights and obligations and holds every member strictly to account inabiding by the rules. New members must therefore be in compliance with WTOobligations across a wide spectrum of policies, which increases the burden ofaccession negotiations.
The provisions of WTO article 12 state simply that a country may accede “onterms to be agreed between it and the WTO.” However, the complexity of thenegotiations is revealed in the 20-step procedure for accession (see WTO 2006),
2 It should be noted that any concessions granted to a WTO member in the accession negotiations must beextended on an MFN basis to all WTO members upon accession.3 The likelihood of a dispute case depends largely on the value of market access under dispute; thuscountries with smaller and less developed consumer markets may not raise serious concerns in this regard.See Bown (2009), especially chapter 9, for an analysis of the political economy of developing countryparticipation in WTO dispute settlement.
Joining the WTO: Why Does It Take So Long? 697

summarized in Table 1,4 a process that is framed by two demanding institutionalfactors. The first is the applicant’s preparation of the “Memorandum of the foreigntrade regime,” in which the applicant country must identify all governmental activ-ities that have a bearing on trade policy and WTO obligations. WP members thentypically submit questions regarding the applicant’s Memorandum, to which theapplicant must respond, and then undertake corrections needed to come into compli-ance with WTO obligations (see Table 1, steps 5–12). This process requires extensiveefforts among the applicant’s ministries, and may last from several months to severalyears. The second institutional factor is the right of any existing WTO member tonegotiate a bilateral agreement with the applicant country regarding additional rulesand concessions, which would then become part of the final accession agreement. Anapplicant may need to complete several such agreements with additional terms andconcessions (“WTO-plus” provisions; see Charnovitz 2007), often leading to furtherdelays in the negotiations. In this regard, WTO accession decisions are subjectultimately to approval by all interested members, and each incumbent member hasthe right to engage in bilateral negotiations regarding specific issues.5 IndividualWTO member countries, even small ones, can potentially stall or block the progressof the WP especially when the applicant is also a small country.6 And while WTOcountries have agreed in principle to facilitate and accelerate accession negotiationswith the least-developed countries (LDCs), this vague promise has provided noguarantee of quick accessions.7
4 Completed and Outstanding Accession Cases
The elapsed time for WTO accessions among the first 25 new members averaged101 months, and Table 3 shows that the length of the accession process has increasedover time, from the relatively short negotiations of early joiners Ecuador and theKyrgyz Republic (41 and 35 months, respectively), to the typically longer negotia-tions of later joiners such as China (186 months), Nepal (180 months) and theUkraine (175 months). Applicants as of May 2011 had already been negotiatingand/or waiting for an average of 145 months (Table 3), far longer than the average forthe first 25 acceding countries. The 30 applicant countries included large countriessuch as the Russian Federation, Iran, Iraq, and Algeria, and small countries such asAndorra, Bahamas, Bhutan, Samoa, Sao Tome & Principe, Seychelles, and Vanuatu.Eleven countries were in transition from non-market to market economies and nine
4 As Alavi (2010) has noted, Table 1 does not indicate the possible delay that may occur when a country’sformal application to join the WTO is not accepted at the General Council, which operates under the WTOconsensus rule. AWP cannot be formed until the General Council accepts a country’s application. See note9 below.5 See Constantine Michalopoulos (2002), pp. 61–70. Kavass (2007) also provides a detailed description ofthe accession process. The WTO secretariat WTO (2008) has compiled a comprehensive training handbookfor negotiators.6 See Gay (2005), examining the accession case of Vanuatu and the role of its trading partners.7 Favorable treatment in accession negotiations for LDCs is included in the Doha Declaration, available athttp://www.wto.org/english/thewto_e/minist_e/min01_e/mindecl_e.htm. See also WTO (2002). The UnitedNations maintains a list of 48 LDCs, with information available at the UNCTAD website: http://www.unctad.org/Templates/Page.asp?intItemID03641&lang01.
698 K. Jones, Y. Gai

had LDC status. Several were suffering from civil wars or insurgencies (Afghanistan,Iraq, Ethiopia, Sudan) and many others exhibited questionable political stability.8
Four appeared on the US list of “countries of concern” sponsoring terrorism (Libya,
8 The World Bank governance indexes did not show any statistically significant impact on elapsed time-to-accession for the first 25 WTO entrants (Jones 2009). However, compared with the sample of accededWTOmembers, the group of 30 applicants in this study exhibited lower governance index scores, which thefollowing empirical results will link with lengthening negotiations.
Table 1 Accession procedures in chronological order
Step Procedure
1 The applicant sends a communication to the Director-General of the WTO indicating its desire toaccede to the WTO under Article XII.
2 The communication is circulated to all WTO members.
3 A Working Party (WP) is established and a Chairperson is appointed.
4 The WTO Secretariat informs applicant about procedures to be followed.
5 The applicant submits a Memorandum on its foreign trade regime for circulation to all WTOmembers.
6 The WTO Secretariat checks the consistency of the Memorandum with the outline format (Annex I)and informs the applicant and the members of the WP of its views.
7 WP members submit questions on the Memorandum and the applicant answers. (Repeat 7 ifnecessary.)
8 The WP meets.
9 WP members submit and the applicantanswers more questions on theMemorandum.
Bilateral negotiations between the applicantand interested WP members on concessionsand commitments on market access for goodsand services (as well as on the other specificterms of accession) are undertaken.
10 WP meets again.
11 Repeat steps 9 and 10, until 12.
12 The examination of the Memorandum iscomplete
13 Terms and conditions (including commitmentsto observe WTO rules and disciplines uponaccession and transitional periods requiredto make any legislative or structural changeswhere necessary to implement thesecommitments) are agreed.
Concessions and commitments on marketaccess for goods and services (as well ason the other specific terms of accession)are agreed.
14 AWP Report is prepared. The Schedule of Concession and Commitments toGATT 1994 and the Schedule of SpecificCommitments to the GATS is prepared.
15 A draft Decision and a draft Protocol of Accession (containing commitments listed in the WP Reportand the Schedule of Concessions and Commitments to GATT 1994 and the Schedule of SpecificCommitments to the GATS) is prepared.
16 The WP adopts the “accession package.”
17 The General Council/Ministerial Conference approves the “accession package.”
18 The applicant formally accepts the “accession package.”
19 The applicant notifies the WTO Secretariat of its formal acceptance.
20 30 days after step 19, the applicant becomes a Member of the WTO.
World Trade Organization, Accessions page, http://www.wto.org/english/thewto_e/acc_e/acc_e.htm
Joining the WTO: Why Does It Take So Long? 699

Sudan, Syria, Iran), and were therefore more likely to encounter political oppositionin the negotiations.9 This group was, on average, poorer, smaller, less stable, and lesslikely to receive full support from WTO incumbents than the first 25 acceded WTOmembers. Based on these attributes, one would expect their WTO accession nego-tiations to be even lengthier than the more recently concluded cases.
5 What Determines the Length of WTO Accession Negotiations?
A growing literature documenting and commenting on many of the 55 applications forWTO membership so far shows that each case exhibits individual characteristics.However, two patterns appear to be emerging that may have a strong bearing on time-to-accession. First, countries with the weakest government structures and politicalinstitutions have the most difficulty in keeping up with the demands of the negotiationsand in generating the necessary political engagement to move the process forward.Kavass (2008) describes in detail the problems that the government of Azerbaijan hashad in coordinating the efforts of various ministries in negotiating accession. A lackof training and expertise, compounded by the lack of effective business representationand clear government commitment to the goal of WTO membership has led to manydelays in moving through the daunting process of meeting WP demands for infor-mation and responses to questions. Similar observations of deficient knowledge,training, and government institutions appear in accounts of WTO accession negotia-tions for Vanuatu (Gay 2005), Nepal (Rajkarnikar 2005), Laos (Pholsena 2001),Sudan (Basbar 2001), Yemen (Hamim 2001) and Cambodia (Sopheak 2001; Cheaand Sok 2005). Other general accounts of the nature of WTO accession negotiationsreinforce this view (Milthorp 2009; Kavass 2008; Adhikari and Dahal 2003), linkingdelays with a lack of negotiating capacity, experience, coordination, and motivationon the part of the applicant countries. In addition, a legislative action plan to bring thelegal and regulatory framework into line with WTO obligations is required. Kavass(2007) notes that many applicant countries do not realize the extent of reforms thatwill be required until after the detailed negotiations begin.
While the lack of government “capacity” suggests potentially lengthy negotiations,it is often difficult to determine exactly how much of the delay comes from theapplicant country and how much comes from the bargaining power and strategies ofWTO incumbent countries in the WP. One of the more controversial elements ofWTO accession lies in the fact that bargaining power lies squarely with the incumbentWTO members, especially the large and politically powerful countries, and thesecountries may have increased their exploitation of this power with each successiveaccession negotiation. Previous research gives support to the hypothesis that thenumber of prior accessions systematically lengthened the accession process for thefirst 25 new WTO members (Jones 2009). However, the earlier study considered onlycountries that had actually completed accession negotiations and joined the WTO,
9 Iran first submitted a request to initiate WTO accession negotiations in 1996. The United States blockedofficial receipt of this request by the WTO General Council 21 times, but finally refrained from impedingits submission, which occurred in May 2005. See Evenett and Primo Braga (2005), footnote 4. The US alsoblocked Syria’s application at the General Council beginning in 2001, before relenting in 2009. See Alavi(2010).
700 K. Jones, Y. Gai
and thus potentially suffered from selection bias—perhaps these were the easy cases.The increasing length of time that each new accession negotiation appears to takegives rise to a number of possible explanations. The first is that each new accessionincreases the network benefits of WTO membership as it approaches full coverage ofworld trade. As the number of remaining “outsiders” dwindles, their bargainingpower weakens as nearly all potential trading partners are inside the WTO system,and the WP can drive a harder bargain that takes longer to negotiate. The secondpossibility is simply that each new accession negotiation gives WP members moreexperience and insight into what additional concessions can be extracted in subsequentnegotiations. This may be the result of adaptation by WP members, in the form of a“learning curve” to the new WTO accession rules. Jones (2009), for example, providesevidence that the number of concessions in the form of WTO rule commitments andtariff reductions has indeed tended to increase with each new accession negotiation,suggesting the possibility that bilateral negotiations have systematically expanded thescope of bargaining over time. Yet another possibility is that WP members havebargained more and more aggressively with new applicants as the Doha Round nego-tiations have bogged down, with the goal of maximizing what limited new marketaccess is available through accessions that has not been attainable through multilateralnegotiations. In any case, numerous authors have suggested that asymmetric bargainingpower in the bilateral negotiations has played a significant role in lengthening theaccession process for Vanuatu (Grynberg and Joy 2001; Gay 2005), Ethiopia (Desta2009), Algeria (Medelci 2001), Jordan and Saudi Arabia (Broude 1998).
This study attempts to identify determinants of the duration of the WTO accessionprocess from both sides of the negotiating table. The dependent variable is the “relativeprobability of acceding to the WTO in a given month” beginning at the time of theGeneral Council’s acceptance of a country’s formal application to the WTO.Explanatory variables include economic control variables, such as the applicant’s realGDP per capita and real exports, measured at each month beginning with the applica-tion. Trade policy variables include the initial average applied tariff level for eachapplicant fixed at the time of application, as well as an antidumping index indicatingthe degree to which the applicant country has been targeted by such investigations in theyears prior to application. Status (dummy) variables identify the applicant as a transitioneconomy or a least-developed country (LDC).10 . All other applicants are developingcountries above LDC income. An interaction variable is based on the product of thetransition dummy value (0/1) and real exports. An additional set of explanatoryvariables comes from the World Bank “quality of government” indexes, includingmeasures of democratic institutions, political stability, government policy effective-ness, the rule of law, control of corruption and regulatory quality (see Kaufmann et al.2007). The challenges of a detailed, politically demanding, and resource-intensivenegotiation suggest that such measures of government attributes may predict thelength of the process. Finally, the number of previously completed accessions offersa potential measure of the increasing bargaining power of the WTO incumbentcountries in the WP, the hypothesis being that WTO countries, beginning with theirnew trade institution in 1995, have learned from each successive accession case toassert their superior bargaining power in driving harder bargains that presumably take
10 See note 7 above. LDC status remained constant for each country for the time period covered.
Joining the WTO: Why Does It Take So Long? 701
additional time. Additional variables, listed in Table 2, were also tested, but theirresults were statistically insignificant in each variant of the model.11
6 The Duration Model
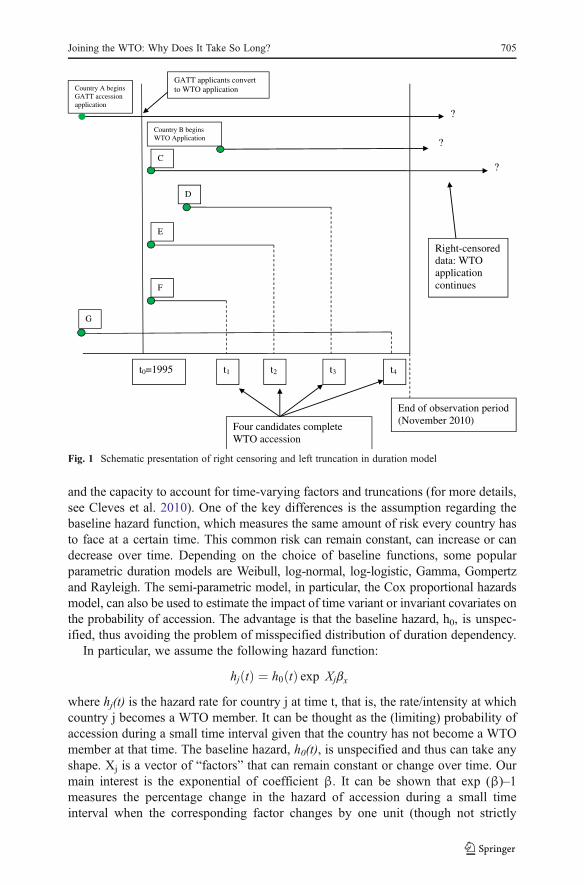
In this section, we discuss censoring problems, truncation and time-varying cova-riates that are relevant in choosing the correct duration model for our study. Aduration (survival, time-to-event) model sets out to determine those factors that eitherlengthen or shorten the time to a particular event (in our study, accession). Suchmodels have been widely used in medical studies of the survival rate of patients afterparticular medical procedures or treatments. In economics and business studies, theyhave been used to analyze the determinants of how long workers remain unemployedor the survival rate of new firms over time. With regard to WTO accession, thepresent study sets out to establish a simple model of the duration of the WTOaccession negotiation.
Denote timei the length of time in months of the “event” (final accession to theWTO) for country i. We can use a simple OLS regression to explain the impact ofvarious factors on the duration:
timei ¼ b0 þ b1xi þ "i
where xi is a vector of “factors”, and the error term εi is assumed to follow a normaldistribution. However, there are several problems with the OLS model. First, andmost important, the assumption of normal distribution is clearly violated in theduration/survival analysis. For example, the time to death after a serious surgerycan be instant or can be a long period if the patient recovers from the surgery. In thecase of WTO accession, the time to “event” is becoming longer and longer whichclearly violates the assumption of normal distribution. If survival time follows anormal distribution, it can take negative values, which violates common sense.
In addition to the fundamental violation of the normal distribution assumption, theOLS model cannot address the problems of right censoring, left truncation and timevarying covariates in the context of WTO accession. Figure 1 is a schematic presen-tation of the right censoring and left truncation problem in the duration model. Timet001995 represents the time we start our data collection on countries that applied tojoin the WTO. Each dot for countries A through G indicates when the applicant firstapplied, and the month of the “event” (final accession to the WTO) that we observe ist1 to t4 for countries D to G. Only those countries that have completed the accessionprocess will experience the event; other applicants will continue, with accessionpresumably occurring at a future date. This latter group is said to be “right censored,”in that their path toward the event continues beyond the present observations.Countries A, B and C fall into this category. The second problem with this kind ofduration analysis is “left truncation”. In Fig. 1, we don’t have information forcountries A and G before 1995 even though they started their applications before1995. This problem is common in social science studies. Because of time, data and
11 Complete results of all regression variants are available upon request.
702 K. Jones, Y. Gai
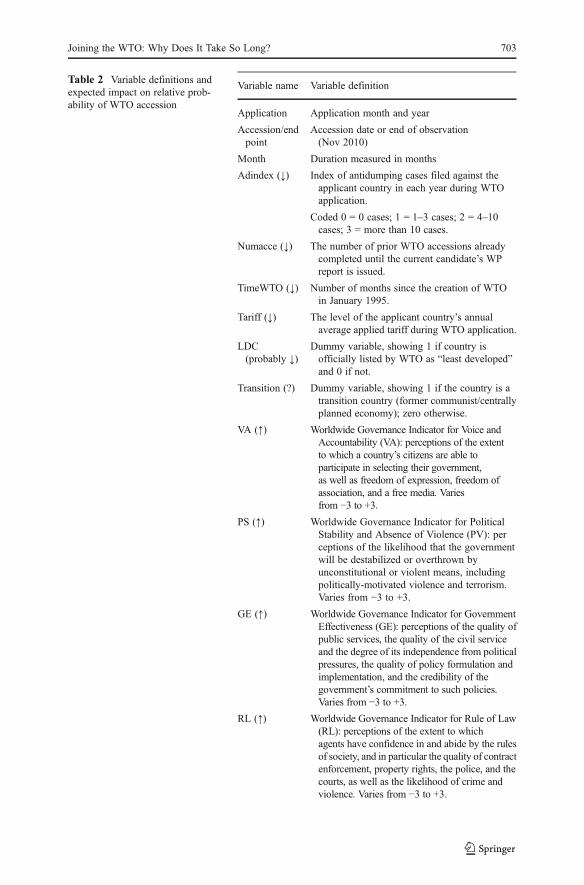
Table 2 Variable definitions andexpected impact on relative prob-ability of WTO accession
Variable name Variable definition
Application Application month and year
Accession/endpoint
Accession date or end of observation(Nov 2010)
Month Duration measured in months
Adindex (↓) Index of antidumping cases filed against theapplicant country in each year during WTOapplication.
Coded 0 0 0 cases; 1 0 1–3 cases; 2 0 4–10cases; 3 0 more than 10 cases.
Numacce (↓) The number of prior WTO accessions alreadycompleted until the current candidate’s WPreport is issued.
TimeWTO (↓) Number of months since the creation of WTOin January 1995.
Tariff (↓) The level of the applicant country’s annualaverage applied tariff during WTO application.
LDC(probably ↓)
Dummy variable, showing 1 if country isofficially listed by WTO as “least developed”and 0 if not.
Transition (?) Dummy variable, showing 1 if the country is atransition country (former communist/centrallyplanned economy); zero otherwise.
VA (↑) Worldwide Governance Indicator for Voice andAccountability (VA): perceptions of the extentto which a country’s citizens are able toparticipate in selecting their government,as well as freedom of expression, freedom ofassociation, and a free media. Variesfrom −3 to +3.
PS (↑) Worldwide Governance Indicator for PoliticalStability and Absence of Violence (PV): perceptions of the likelihood that the governmentwill be destabilized or overthrown byunconstitutional or violent means, includingpolitically-motivated violence and terrorism.Varies from −3 to +3.
GE (↑) Worldwide Governance Indicator for GovernmentEffectiveness (GE): perceptions of the quality ofpublic services, the quality of the civil serviceand the degree of its independence from politicalpressures, the quality of policy formulation andimplementation, and the credibility of thegovernment’s commitment to such policies.Varies from −3 to +3.
RL (↑) Worldwide Governance Indicator for Rule of Law(RL): perceptions of the extent to whichagents have confidence in and abide by the rulesof society, and in particular the quality of contractenforcement, property rights, the police, and thecourts, as well as the likelihood of crime andviolence. Varies from −3 to +3.
Joining the WTO: Why Does It Take So Long? 703
resource limits, researchers often do not have complete information for all theobservations for all the periods prior to the event. The estimators will be biasedwithout correcting for the right censoring and left truncation problems. A finalproblem that is not addressed in the OLS model is the time varying covariates.Countries’ GDP per capita, openness, and governance indexes, etc., may changeduring the application period, all of which cannot be included in the simple OLSmodel.
There are typically three methods to correct for these problems: parametricmodels, semi-parametric models and nonparametric models. Nonparametric modelstypically have no covariates or only have qualitative covariates (such as whether acountry is a developed country). In our study, the impacts of qualitative and quanti-tative covariates are our main interest. Therefore we focus on the first two methods,which share many common assumptions and features, including the hazard function
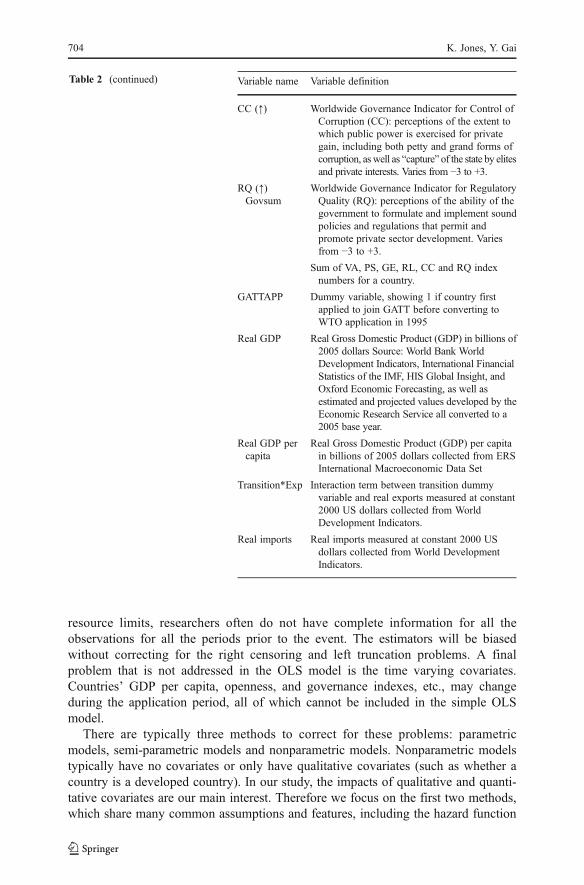
Table 2 (continued) Variable name Variable definition
CC (↑) Worldwide Governance Indicator for Control ofCorruption (CC): perceptions of the extent towhich public power is exercised for privategain, including both petty and grand forms ofcorruption, aswell as “capture” of the state by elitesand private interests. Varies from −3 to +3.
RQ (↑)Govsum
Worldwide Governance Indicator for RegulatoryQuality (RQ): perceptions of the ability of thegovernment to formulate and implement soundpolicies and regulations that permit andpromote private sector development. Variesfrom −3 to +3.
Sum of VA, PS, GE, RL, CC and RQ indexnumbers for a country.
GATTAPP Dummy variable, showing 1 if country firstapplied to join GATT before converting toWTO application in 1995
Real GDP Real Gross Domestic Product (GDP) in billions of2005 dollars Source: World Bank WorldDevelopment Indicators, International FinancialStatistics of the IMF, HIS Global Insight, andOxford Economic Forecasting, as well asestimated and projected values developed by theEconomic Research Service all converted to a2005 base year.
Real GDP percapita
Real Gross Domestic Product (GDP) per capitain billions of 2005 dollars collected from ERSInternational Macroeconomic Data Set
Transition*Exp Interaction term between transition dummyvariable and real exports measured at constant2000 US dollars collected from WorldDevelopment Indicators.
Real imports Real imports measured at constant 2000 USdollars collected from World DevelopmentIndicators.
704 K. Jones, Y. Gai
and the capacity to account for time-varying factors and truncations (for more details,see Cleves et al. 2010). One of the key differences is the assumption regarding thebaseline hazard function, which measures the same amount of risk every country hasto face at a certain time. This common risk can remain constant, can increase or candecrease over time. Depending on the choice of baseline functions, some popularparametric duration models are Weibull, log-normal, log-logistic, Gamma, Gompertzand Rayleigh. The semi-parametric model, in particular, the Cox proportional hazardsmodel, can also be used to estimate the impact of time variant or invariant covariates onthe probability of accession. The advantage is that the baseline hazard, h0, is unspec-ified, thus avoiding the problem of misspecified distribution of duration dependency.
In particular, we assume the following hazard function:
hjðtÞ ¼ h0ðtÞ exp Xjbx� �
where hj(t) is the hazard rate for country j at time t, that is, the rate/intensity at whichcountry j becomes a WTO member. It can be thought as the (limiting) probability ofaccession during a small time interval given that the country has not become a WTOmember at that time. The baseline hazard, h0(t), is unspecified and thus can take anyshape. Xj is a vector of “factors” that can remain constant or change over time. Ourmain interest is the exponential of coefficient β. It can be shown that exp (β)–1measures the percentage change in the hazard of accession during a small timeinterval when the corresponding factor changes by one unit (though not strictly
?
?
?
t0=1995 t3 t4t2t1
End of observation period (November 2010)
Right-censored data: WTO application continues
Country A begins GATT accession application
Four candidates complete WTO accession
Country B begins WTO Application
C
D
E
F
G
GATT applicants convert to WTO application
Fig. 1 Schematic presentation of right censoring and left truncation in duration model
Joining the WTO: Why Does It Take So Long? 705

correct, we will use the term relative probability instead of hazard ratio hereinafter).For instance, if β00.2 for GDP, then a one unit increase in GDP increases the relativeprobability of accession by exp (0.2)–1022 %. Likewise, if β0−0.2 for tariff, then aone unit increase in tariff decreases the relative probability of accession by 18 %because exp (−0.2)–10−0.18.
The next question is the choice of covariates, i.e. what factors have contributed tothe lengthy accession process and to the terms of accession? It is difficult togeneralize, since each country’s negotiations are unique. However, it may be reason-able to hypothesize that certain factors have played a systematic role, irrespective ofthe course of other applications. Based on the institutional provisions of the accessionprocess discussed above, one type of explanatory variable would try to capture theextent to which there is a gap between the applicant’s current trade regime and therequired WTO-compatible trade regime, such as development or transitional econo-my status, or measures of total or per-capita GDP. A greater gap would imply a longernegotiating process. These and additional explanatory variables may also indicate theextent to which the applicant country is important enough to target for additionalconcessions (and lengthier negotiations), such as those measuring market share inWTO members’ markets and other economic profile statistics. Trade and politicalprofile variables may suggest either longer or shorter negotiations, based on thetendency for the applicant country’s exports to attract antidumping cases, for thecountry to have high pre-WTO tariffs, or to exhibit strong governance characteristics(a possible indication that the country will agree to quick negotiations in order toestablish the “anchor” benefits of WTO membership for its economy). Finally,explanatory variables associated with the timing of the application, such as whetherthe original application occurred before the WTO was founded in 1995, may indicatethe importance of learning by incumbent WTOmembers involved in the negotiations,and how they view “carryover” applications from the GATT era. Table 3 summarizesthe averages of country-by-country statistics used in the regressions.
7 Results from the Cox Proportional Hazards Model
Table 4 summarizes the results from the Cox proportional hazards models. Forsimplicity of interpretation, we report only exp (β)–1, which measures the changein the relative probability of accession when the corresponding factor changes by oneunit. Negative values indicate that the covariate decreases the relative probability ofthe accession, while positive values indicate that the covariate’s effect is to increaserelative probability. The null hypothesis for a particular covariate is therefore that itsrelative probability is one. In addition, the table lists the t-statistics and p-valuesassociated with each variable in parentheses.
In column 1 of Table 4, we report results from the following Cox hazard model:
hðtÞ ¼ h0ðtÞ exp b1Adindex þ b2Numacceþ b3Tariff þ b4LDC þ b5Transitionþ b6VAð Þ
The converted coefficient for Adindex is −29.4 % and significant at 10 % level.This suggests that when the anti-dumping index increases by one unit, the relativeprobability of becoming a WTO member in a month decreases by 29.4 %. Similarly,
706 K. Jones, Y. Gai
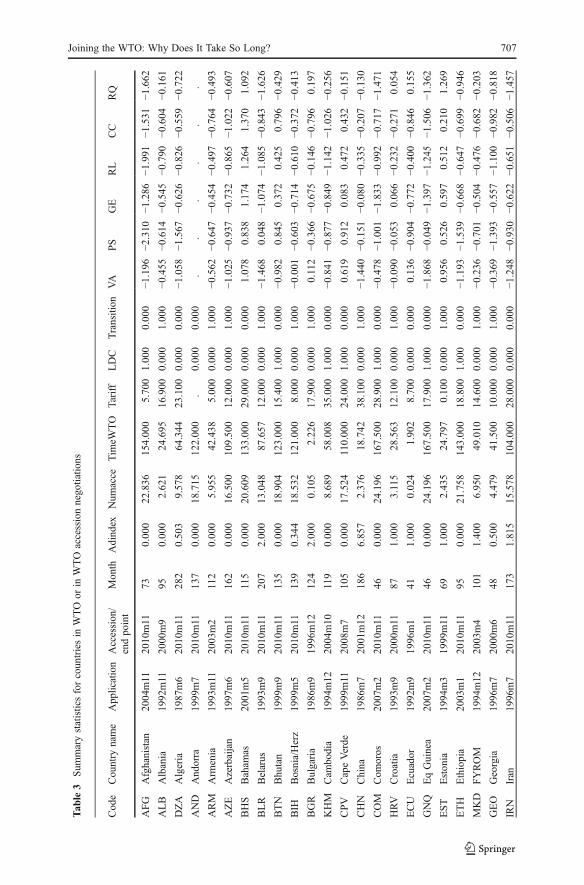
Tab
le3
Sum
marystatisticsforcountriesin
WTO
orin
WTO
accessionnegotiatio
ns
Code
Country
name
Application
Accession/
endpo
int
Month
Adind
exNum
acce
Tim
eWTO
Tariff
LDC
Transition
VA
PS
GE
RL
CC
RQ
AFG
Afghanistan
2004m11
2010m11
730.000
22.836
154.000
5.700
1.000
0.000
−1.196
−2.310
−1.286
−1.991
−1.531
−1.662
ALB
Albania
1992m11
2000m9
950.00
02.621
24.695
16.900
0.000
1.00
0−0
.455
−0.614
−0.545
−0.790
−0.604
−0.161
DZA
Algeria
1987m6
2010m11
282
0.50
39.578
64.344
23.100
0.000
0.00
0−1
.058
−1.567
−0.626
−0.826
−0.559
−0.722
AND
And
orra
1999m7
2010m11
137
0.00
018
.715
122.00
0.
0.000
0.00
0.
..
..
.
ARM
Arm
enia
1993m11
2003m2
112
0.00
05.955
42.438
5.000
0.000
1.00
0−0
.562
−0.647
−0.454
−0.497
−0.764
−0.493
AZE
Azerbaijan
1997m6
2010m11
162
0.00
016
.500
109.50
012
.000
0.000
1.00
0−1
.025
−0.937
−0.732
−0.865
−1.022
−0.607
BHS
Baham
as20
01m5
2010m11
115
0.00
020
.609
133.00
029
.000
0.000
0.00
01.078
0.838
1.17
41.264
1.370
1.09
2
BLR
Belarus
1993m9
2010m11
207
2.00
013
.048
87.657
12.000
0.000
1.00
0−1
.468
0.048
−1.074
−1.085
−0.843
−1.626
BTN
Bhutan
1999m9
2010m11
135
0.00
018
.904
123.00
015
.400
1.000
0.00
0−0
.982
0.845
0.37
20.425
0.796
−0.429
BIH
Bosnia/Herz
1999m5
2010m11
139
0.344
18.532
121.000
8.000
0.000
1.000
−0.001
−0.603
−0.714
−0.610
−0.372
−0.413
BGR
Bulgaria
1986m9
1996m12
124
2.00
00.105
2.22
617
.900
0.000
1.00
00.112
−0.366
−0.675
−0.146
−0.796
0.19
7
KHM
Cam
bodia
1994m12
2004m10
119
0.00
08.689
58.008
35.000
1.000
0.00
0−0
.841
−0.877
−0.849
−1.142
−1.026
−0.256
CPV
CapeVerde
1999m11
2008m7
105
0.00
017
.524
110.000
24.000
1.000
0.00
00.619
0.912
0.08
30.472
0.432
−0.151
CHN
China
1986m7
2001m12
186
6.85
72.376
18.742
38.100
0.000
1.00
0−1
.440
−0.151
−0.080
−0.335
−0.207
−0.130
COM
Com
oros
2007m2
2010m11
460.00
024
.196
167.50
028
.900
1.000
0.00
0−0
.478
−1.001
−1.833
−0.992
−0.717
−1.471
HRV
Croatia
1993m9
2000m11
871.00
03.115
28.563
12.100
0.000
1.00
0−0
.090
−0.053
0.06
6−0
.232
−0.271
0.05
4
ECU
Ecuador
1992m9
1996m1
411.00
00.024
1.90
28.700
0.000
0.00
00.136
−0.904
−0.772
−0.400
−0.846
0.15
5
GNQ
EqGuinea
2007m2
2010m11
460.00
024
.196
167.50
017
.900
1.000
0.00
0−1
.868
−0.049
−1.397
−1.245
−1.506
−1.362
EST
Eston
ia19
94m3
1999m11
691.00
02.435
24.797
0.100
0.000
1.00
00.956
0.526
0.59
70.512
0.210
1.26
9
ETH
Ethiopia
2003m1
2010m11
950.00
021
.758
143.00
018
.800
1.000
0.00
0−1
.193
−1.539
−0.668
−0.647
−0.699
−0.946
MKD
FYROM
1994m12
2003m4
101
1.40
06.950
49.010
14.600
0.000
1.00
0−0
.236
−0.701
−0.504
−0.476
−0.682
−0.203
GEO
Georgia
1996m7
2000m6
480.50
04.479
41.500
10.000
0.000
1.00
0−0
.369
−1.393
−0.557
−1.100
−0.982
−0.818
IRN
Iran
1996m7
2010m11
173
1.81
515
.578
104.00
028
.000
0.000
0.00
0−1
.248
−0.930
−0.622
−0.651
−0.506
−1.457
Joining the WTO: Why Does It Take So Long? 707

Code
Country
name
Application
Accession/
endpo
int
Month
Adind
exNum
acce
Tim
eWTO
Tariff
LDC
Transition
VA
PS
GE
RL
CC
RQ
IRQ
Iraq
2004m9
2010m11
750.000
22.747
153.00
0.
0.00
00.000
−1.352
−2.816
−1.671
−1.955
−1.511
−1.405
JOR
Jordan
1994m1
2000m4
760.000
2.684
26.526
16.000
0.00
00.000
−0.357
−0.065
0.044
0.416
−0.007
0.372
KAZ
Kazakhstan
1996m1
2010m11
179
2.143
15.089
101.00
010
.000
0.00
01.000
−0.992
0.08
8−0
.657
−0.885
−0.962
−0.534
KGZ
Kyrgy
z19
96m2
1998m12
350.000
2.886
30.000
8.40
00.00
01.000
−0.712
0.09
4−0
.445
−0.620
−0.681
−0.421
LAO
Lao
P.D.R.
1997m7
2010m11
161
0.000
16.584
110.000
9.50
01.00
00.000
−1.550
−0.362
−0.846
−1.031
−1.023
−1.233
LVA
Latvia
1993m11
1999m2
640.333
1.766
19.141
3.70
00.00
01.000
0.783
0.10
70.179
0.177
−0.246
0.868
LBN
LebaneseRep
1999m1
2010m11
143
0.000
18.175
119.000
13.900
0.00
00.000
−0.463
−1.304
−0.372
−0.444
−0.580
−0.215
LBR
Liberia
2007m6
2010m11
420.000
24.405
169.50
0.
1.00
00.000
−0.283
−1.114
−1.298
−1.165
−0.531
−1.289
LBY
Libya
2004m6
2010m11
780.284
22.603
151.50
017
.000
0.00
00.000
−1.888
0.27
2−0
.809
−0.636
−0.786
−1.134
LTU
Lith
uania
1994m1
2001m5
891.377
3.865
32.876
3.10
00.00
01.000
0.891
0.30
60.252
0.335
0.18
10.750
MDA
Moldova
1993m11
2001m7
930.720
3.989
33.129
5.80
00.00
01.000
−0.021
−0.044
−0.438
−0.349
−0.430
−0.173
MNG
Mongo
lia19
91m1
1997m1
730.000
0.219
4.110
8.20
00.00
01.000
0.457
0.57
6−0
.517
0.055
0.36
9−0
.755
MNE
Montenegro
2004m12
2010m11
721.000
22.875
154.50
010
.000
0.00
01.000
..
..
..
NPL
Nepal
1989m5
2004m4
180
0.357
5.106
34.533
22.600
1.00
00.000
−0.464
−0.937
−0.411
−0.351
−0.157
−0.552
OMN
Oman
1996m4
2000m11
560.000
4.786
42.500
6.00
00.00
00.000
−0.759
0.74
20.473
0.791
0.58
30.147
PAN
Panam
a19
91m8
1997m9
740.000
0.554
7.135
12.300
0.00
00.000
0.242
0.07
5−0
.404
−0.180
−0.622
0.608
RUS
Russian
Fed.
1993m6
2010m11
210
4.867
12.862
86.405
7.30
00.00
01.000
−0.652
−0.801
−0.384
−0.888
−0.845
−0.462
WSM
Sam
oa19
98m4
2010m11
152
0.000
17.342
114.500
18.000
1.00
00.000
..
..
..
STP
SaoTo
me&
Prin
2005m1
2010m11
710.000
22.915
155.00
0.
1.00
00.000
0.298
0.44
9−0
.799
−0.518
−0.574
−0.765
SAU
Saudi
Arabia
1993m6
2005m12
151
1.727
8.709
57.258
12.100
0.00
00.000
−1.516
−0.448
−0.248
0.229
0.10
1−0
.107
SRB
Serbia
2004m12
2010m11
721.000
22.875
154.50
010
.000
0.00
01.000
..
..
..
SYC
Seychelles
1995m5
2010m11
187
0.000
14.444
97.000
28.300
0.00
00.000
0.042
0.94
1−0
.033
0.305
0.27
7−0
.662
SDN
Sud
an19
94m10
2010m11
194
0.000
13.923
93.531
24.000
1.00
00.000
−1.701
−2.190
−1.238
−1.489
−1.198
−1.310
Tab
le3
(con
tinued)
708 K. Jones, Y. Gai

Code
Country
name
Application
Accession/
endpo
int
Month
Adind
exNum
acce
Tim
eWTO
Tariff
LDC
Transition
VA
PS
GE
RL
CC
RQ
SYR
Syria
2001m10
2010m11
110
0.000
20.927
135.50
035
.000
0.00
00.000
−1.634
−0.534
−0.897
−0.479
−0.710
−1.080
TWN
Taipei
1992m1
2002m1
121
5.435
3.785
29.504
11.200
0.00
00.000
0.734
0.78
81.055
0.887
0.82
31.007
TJK
Tajik
istan
2001m5
2010m11
115
0.000
20.609
133.000
8.300
0.000
1.000
−1.256
−1.218
−1.000
−1.052
−1.022
−1.080
TON
Tong
a19
95m11
2007m7
141
0.000
12.206
80.000
18.500
0.00
00.000
−0.094
0.66
3−0
.525
0.125
−0.756
−0.800
UKR
Ukraine
1993m11
2008m5
175
3.640
11.154
73.600
7.50
00.00
01.000
−0.394
−0.206
−0.586
−0.777
−0.831
−0.539
UZB
Uzbekistan
1994m12
2010m11
192
0.867
14.068
94.505
21.000
0.00
01.000
−1.740
−1.178
−0.897
−1.195
−1.027
−1.684
VUT
Vanuatu
1995m7
2010m11
185
0.000
14.600
98.000
29.000
1.00
00.000
0.564
1.13
0−0
.454
0.100
−0.218
−0.509
VNM
Vietnam
1995m1
2007m2
146
1.521
11.027
72.500
12.700
0.00
01.000
−1.451
0.30
3−0
.428
−0.466
−0.711
−0.564
YEM
Yem
en20
00m4
2010m11
128
0.000
19.570
126.50
012
.800
1.00
00.000
−1.047
−1.521
−0.890
−1.100
−0.774
−0.780
Sources:
IMFlistin
gof
transitio
necon
omies,www.im
f.org/external/np/exr/ib/2000/110300.htm
#I
UnitedNations,Com
tradedatabase,http://comtrade.un.org/db
UnitedNations
Mem
bershipdatabase,http://www.un.org/geninfo/faq/factsheets/FS25.HTM
World
BankGov
ernanceIndexdatabase,http://info.worldbank.org/governance/kkz2004/tables.asp
World
Trade
Organization,
www.wto.org,Pages
forAccessions,Anti-dumping,DevelopingCountries
WTO
tradestatistics,www.wto.org/english/res_e/statis_e/statis_e.htm
WTO
Secretariat,TariffDatabase
Tab
le3
(con
tinued)
Joining the WTO: Why Does It Take So Long? 709

Table 4 Output from Cox proportional hazards model coefficients represent changes in relative probabil-ities (t-values in parentheses, p-values in brackets)
Model 1 Model 2 Model 3 Model 4 Model 5 Model 6 Model 7
Adindexa −0.294* −0.293* −0.376** −0.299* −0.329* −0.355** −0.337**(−1.73) (−1.66) (−2.23) (−1.71) (−1.82) (−2.10) (−1.96)[0.084] [0.098] [0.025] [0.088] [0.069] [0.036] [0.050]
Numacce −0.083** −0.103** −0.100** −0.09** −0.095** −0.062 −0.092**(−1.99) (−2.42) (−2.38) (−2.15) (−2.31) (−1.51) (−2.21)[0.047] [0.016] [0.017] [0.032] [0.021] [0.130] [0.027]
Tariff −0.084* −0.075* −0.074* −0.071* −0.077* −0.045 −0.076*(−1.86) (−1.82) (−1.79) (−1.68) (−1.84) (−1.14) (−1.79)[0.063] [0.069] [0.073] [0.092] [0.066] [0.256] [0.074]
Ldc −0.408 −0.453 −0.283 −0.236 −0.418 −0.212 −0.361(−0.70) (−0.81) (−0.44) (−0.35) (−0.72) (−0.30) (−0.60)[0.482] [0.416] [0.659] [0.724] [0.470] [0.760] [0.548]
Transition −0.430 −0.444 −0.101 0.091 −0.160 −0.086 −0.185(−0.83) (−0.95) (−0.16) (0.12) (−0.26) (−0.14) (−0.31)[0.404] [0.342] [0.874] [0.904] [0.799] [0.890] [0.756]
Est_Va 1.400**
(2.49)
[0.013]
Est_Ps 0.240
(0.75)
[0.455]
Est_Ge 2.899**
(2.19)
[0.028]
Est_Rl 1.448*
(1.77)
[0.077]
Est_Cc 1.025
(1.38)
[0.167]
Est_Rq 3.891***
(3.05)
[0.002]
Govsum 0.229**
(2.27)
[0.023]
Test of proportional-hazards assumption
P00.8719 P00.8390 P00.7615 P00.5642 P00.9014 P00.4417 P00.7333
N 3264 3216 3264 3228 3228 3264 3192
WTO (2003, 2004, 2005a, b); Databases listed in Bibliography
710 K. Jones, Y. Gai
the converted coefficient of Numacce suggests that if the number of prior WTOaccessions already completed before the current candidate’s WP report is issuedincreases by one country, the relative probability of becoming a WTO member in amonth decreases by 8.3 % and the effect is significant at 5 % level. A one-percentincrease in average tariff rates causes the relative probability of accession to drop by8.4 %. Whether a country is a least developed country or a country in transition doesnot appear to have strong impacts on the success of accession. The largest effect wefind in column 1 is the Voice and Accountability from the Worldwide GovernanceIndicators. A one unit increase in VA increases the relative probability of accessionwithin each month by 140 % and the effect is significant at 5 %.
In general, the results for ADindex and Tariff (the annual tariff level) have theexpected impact of decreasing the hazards of accession and are consistent across theseven models shown, with statistical significance at the 10 % or better in most cases.Thus, countries with more protectionist “baggage” (i.e. tariffs) or with greatertendencies to be targeted for antidumping investigations will take longer to negotiateWTO accession. An increase by one in ADindex corresponds to a decreased relativeprobability of completing accession in that month by from 29.3 % to 37.6 %. Anincrease in the average tariff of 1 % decreases the relative probability of completingaccession by from 4.5 % to 8.4 % in that month.
Results for the number-of-completed-accessions variable, Numacce, are also ro-bust across the seven models, showing a decreased relative probability of accession of6.2 % to 10.3 % in the month where there is one new completed accession. Theresults are statistically significant at the 5 % level in all but one model shown. Theseresults lend support to the hypothesis that accession negotiations have becomelengthier because of the experience of earlier negotiations. Since WPs tend to includemany of the same countries in each new accession case (the US, EU, and other OECDcountries in particular), and since the applicant countries do not typically have muchinformation on previous accession negotiations, the beneficiaries appear to be thosecountries with the bargaining power in the negotiations, the WTO members on theWPs. An alternative hypothesis would be that some other factor associated with thecompletion of additional accessions, or the passage of time, is responsible forlengthier negotiations. However, the anecdotal evidence on bilateral negotiationsand increasing concessions described above lends support to the “bargaining learningcurve” hypothesis.
Several of the World Bank governance indexes provide some of the most remarkableresults, and show that political attributes of the applicant countries appear to play a largerole in the length of the accession negotiation. These index values range from −3 to +3,and in many cases have significant variations across the years under investigation.12 Asshown in Table 4, coefficients for “Voice and Accountability” (140 % increase in therelative probability of accession for an increase of one in index value), “GovernmentEffectiveness” (290 % increase) and “Regulatory Quality” (389 % increase) are largeand significant at the 5 % level or better. The “Rule of Law” index impact is 145 %with 10 % significance. Indexes for Political Stability and Corruption Control are
12 For example, the mean and standard deviation, respectively, of Regulatory Quality (RQ) for China are−0.130 and 0.198, of the Rule of Law (RL) for Albania are −0.790 and 0.500, and of Control of Corruption(CC) for Latvia are −0.246 and 0.392.
Joining the WTO: Why Does It Take So Long? 711

large and positive, but without statistical significance in most cases. An additionalvariable, Govsum, calculated as the sum of all six index numbers for each country,showed somewhat weaker, but still positive and significant results, compared with thestrongest individual index results (Model 7). An increase in Govsum by one increasedthe relative probability of accession by 22.9 %, at a 5 % significance level.13
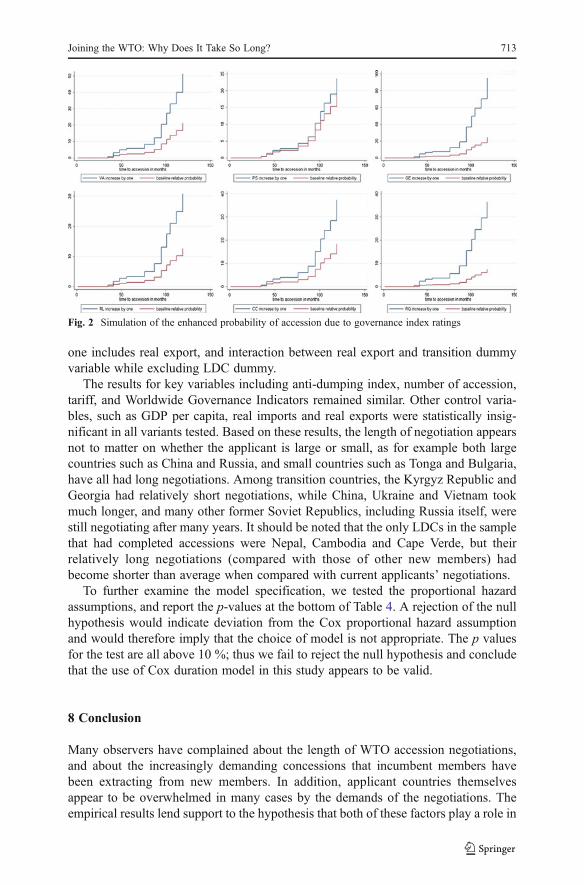
Figure 2 illustrates the dramatically enhanced probability of accession due tohigher governance index ratings using a set of simulation graphs. The horizontal axisshows “time to accession” in months, while the vertical axis measures “relativeprobability of accession” in a given month. The lower profile line shows the changein baseline hazard, i.e. the same relative probability of accession each country has toface in each month. All baseline hazard functions as shown in Fig. 2 increase at anincreasing rate, indicating that the probability of becoming a WTO member goes upfor each succeeding month. The upper profile shows the impact of an improvementby one unit in the index value (within the range −3 to +3) of the relevant governanceindex. As the statistical results imply, an increase by one in the index of regulatoryquality (RQ) led to the strongest upward shift in relative probability, followed bygovernment policy effectiveness (GE), Rule of Law (RL), and Voice/Accountability(VA), with weaker results for Control of Corruption (CC) and Political Stability (PS).
Interestingly, the LDC and Transition Economy dummies have no significantexplanatory power, although LDC has the predicted negative impact (i.e. to lengthenthe process). In addition, the dummy for pre-WTO applications was also insignificantin predicting time-to-accession (not reported in Table 4). In an earlier study by Jones(2009) using a sample of acceded countries only, a similar dummy did suggest thatpre-WTO applications experienced longer time-to-accession; the hypothesis was thatunfinished GATT applications corresponded to “problem” countries that would havelonger negotiations under the WTO. In the present study, expanding the sample toinclude all WTO applicant countries appears to have removed any significant effectof that distinction, as some pre- and post-WTO applicants have had relatively shortnegotiations, while other pre- and post-WTO applicants have had long (and in somecases continuing) negotiations.
To test the robustness of our results, we estimated 76 sets of specifications, witheach set containing 6 different models depending on the choice of WorldwideGovernance Indicators. In the 76 sets of specifications, we replaced the number ofaccessions with months since the WTO was established, and included other controlvariables and some of their interactions, such as real GDP per capita, total GDP, realimports, real exports, total imports and total exports. We then compared the 456models based on the goodness-of-fit measure by Cox-Snell residuals (Cox and Snell1968 and Cleves et al. 2010). We identified four specifications with the bestgoodness-of-fit. In addition to the reported results, the second specification includesreal GDP per capita while excluding LDC and transition dummy variables; the thirdone includes real GDP per capita while excluding LDC dummy variable; the fourth
13 Because of high correlation among the governance index variables, regressions containing all six (notreported in Table 4) showed generally insignificant coefficients, except for statistically much weaker resultsfor Regulatory Quality. The aggregate Govsum maintains the positive results of the individually testedgovernance indexes but dilutes the impact of its stronger components on probability of accession.
712 K. Jones, Y. Gai
one includes real export, and interaction between real export and transition dummyvariable while excluding LDC dummy.
The results for key variables including anti-dumping index, number of accession,tariff, and Worldwide Governance Indicators remained similar. Other control varia-bles, such as GDP per capita, real imports and real exports were statistically insig-nificant in all variants tested. Based on these results, the length of negotiation appearsnot to matter on whether the applicant is large or small, as for example both largecountries such as China and Russia, and small countries such as Tonga and Bulgaria,have all had long negotiations. Among transition countries, the Kyrgyz Republic andGeorgia had relatively short negotiations, while China, Ukraine and Vietnam tookmuch longer, and many other former Soviet Republics, including Russia itself, werestill negotiating after many years. It should be noted that the only LDCs in the samplethat had completed accessions were Nepal, Cambodia and Cape Verde, but theirrelatively long negotiations (compared with those of other new members) hadbecome shorter than average when compared with current applicants’ negotiations.
To further examine the model specification, we tested the proportional hazardassumptions, and report the p-values at the bottom of Table 4. A rejection of the nullhypothesis would indicate deviation from the Cox proportional hazard assumptionand would therefore imply that the choice of model is not appropriate. The p valuesfor the test are all above 10 %; thus we fail to reject the null hypothesis and concludethat the use of Cox duration model in this study appears to be valid.
8 Conclusion
Many observers have complained about the length of WTO accession negotiations,and about the increasingly demanding concessions that incumbent members havebeen extracting from new members. In addition, applicant countries themselvesappear to be overwhelmed in many cases by the demands of the negotiations. Theempirical results lend support to the hypothesis that both of these factors play a role in
Fig. 2 Simulation of the enhanced probability of accession due to governance index ratings
Joining the WTO: Why Does It Take So Long? 713

lengthening the negotiations. Increasingly stringent bilateral negotiations in theaccession talks appear to be linked to a learning process among WP members asthe number of accessions has increased. At the same time, lower values for four of thesix World Bank governance indexes, are associated with a significantly longernegotiations. In this regard, the prospects for the remaining WTO applicants are notencouraging, since their governance scores are generally weaker than those ofcountries that had joined the WTO by 2011. Many have already been negotiatinglonger than those countries that have acceded to the WTO, and many may face delaysfor various political reasons.
Aside from the applicant country’s institutional weaknesses, the gap between thestate of the country’s trade regime at the time of application and the state it needs toachieve in order to complete WTO accession also plays a role, and is partiallycaptured in policy and government quality variables. Results from the Cox propor-tional hazards models indicate, for example, that higher pre-application tariff levelsand a higher pre-application incidence of antidumping cases tend to lengthen theaccession negotiations. The current atmosphere of trade pessimism, marked by themoribund Doha trade negotiations and the lingering global financial crisis that beganin 2008, may also be lengthening the negotiations, although it would be difficult toisolate these factors without extensive interviews among WP participants.
While the evidence gives some support to the claims that weak governancelengthens the negotiations, and that WTO members in the WPs are driving harderbargains with applicants, one still needs to ask if longer accession processes arenecessarily a bad thing. Tang and Wei (2009) provide evidence, for example, thatextra policy commitments made by accession countries during the negotiations havethe most positive economic effects among countries with the weakest governanceindicators.14 This result suggests that WTO commitments are a partial substitute forquality of governance, perhaps justifying the lengthier negotiations. These resultsmust be interpreted carefully, however, since they draw on just the first 15 new WTOmembers’ accession cases from 1995 to 2001. This group’s accession negotiationsaveraged 78 months, compared to an average of 134 months for the next ten membersto join, so the question arises as to whether the even longer negotiations since 2001have been necessary to achieve the salutary external discipline of added commit-ments. Even if the inherent message is that “there’s no gain if there’s no pain,” theeffect of lengthier bargaining is likely to reach a point of diminishing economicreturns, a possible subject for further study. Yet these results may also suggest thatimproved governance capacity—for example through technical assistance and for-eign aid to build administrative capacity—would make shorter negotiations possible,without sacrificing the benefits of WTO discipline.
For many of the least developed countries currently in the queue, however, therigors of accession negotiations suggest a decades-long process, during which timethese countries would be foregoing some of the gains from trade that would accruefrom WTO membership. For these cases, WTO members could improve the acces-sion process by introducing more flexibility in transition periods, perhaps by linkingprogress towards compliance goals with corresponding WTO market access benefits,by limiting the demand for “WTO-plus” concessions from applicants until later
14 See also Drabek and Bacchetta (2004) for a discussion focusing on transition country accessions.
714 K. Jones, Y. Gai

stages, and by improving the coordination of aid to fund mandated internal reforms.Some of these provisions were already in place, formally or informally, for LDCapplicants, through the Integrated Framework facility and the 2002 General Councildecision on LDC accessions.15 A formal implementation of these reforms and theirextension to applicants with incomes above the LDC level, perhaps on a graduated basis,could contribute significantly to achieving the goal of universal membership. Otherwise,for many applicant countries with deficient or highly limited governmental resources,the process will be painfully slow, and perhaps drag on for many years to come.
References
Adhikari R, Dahal N (2003) “LDCs’ accession to the WTO: learning from the cases of Nepal, Cambodiaand Vanuatu.” South Asia Watch on Trade, Economics & Environment (SAWTEE), Kathmandu,Nepal. Accessible at http://www.un-ngls.org/SAWTEE.doc
Alavi SJ (2010) Letter to the editor. World Trade Rev 9(2):389–390Basbar A (2001) “Sudan’s accession to the WTO: experiences and problems arising from implementation
of economic reform programs.”WTO accessions and development policies. United Nations/UNCTAD,New York and Geneva
Bown CP (2009) Self-enforcing trade: developing countries and WTO dispute settlement. BrookingsInstitution Press, Washington
Broude T (1998) Accession to the WTO: current issues in the Arab World. J World Trade 32(6):147–166Charnovitz S (2007) “Mapping the Law of WTOAccession.” GWU Legal Studies Research Paper No. 237.
George Washington University, WashingtonChea S, Sok H (2005) Cambodia’s accession to the WTO: ‘fast track’ accession by a least developed
country. In: Gallagher P, Low P, Stoler A (eds.) Managing the challenges of WTO participation: 45case studies. Cambridge, UK: Cambridge University Press. Also available at http://www.wto.org/english/res_e/booksp_e/casestudies_e/case43_e.htm
Cleves M, Gould WW, Gutierrez RG, Marchenko Y (2010) An introduction to survival analysis usingStata. Stata Press
Copelovitch MS, Ohls D (2009) In defense of trade: post-colonial Sttes and GATT/WTO accession.Conference Paper, International Political Economy Society, Texas A&M University, Nov. 13–14
Cox DR, Snell EJ (1968) A general definition of residuals. J R Stat Soc Ser B Methodol 30(2):248–275Desta MG (2009) Accession Ofor what? an examination of Ehiopia’s decision to join the WTO. J World
Trade 43(2):339–362Drabek Z, Bacchetta M (2004) Tracing the effects of WTO accession on policy-making in sovereign states:
preliminary lessons from the recent experience of transition countries. World Econ 27(7):1083–1125Evenett SJ, Primo Braga CA (2005) “WTO accession: lessons from experience.” Trade Note 22, June 6.
International Trade Department, World Bank Group. Accessible at http://siteresources.worldbank.org/INTRANETTRADE/Resources/Pubs/TradeNote22.pdf
Gay D (2005) “Vanuatu’s suspended accession bid: second thoughts?”. In: Gallagher P, Low P, Stoler A (eds.)Managing the challenges of WTO participation: 45 case studies. Cambridge, UK: Cambridge UniversityPress. Also available at http://www.wto.org/english/res_e/booksp_e/casestudies_e/case43_e.htm
Grynberg R, Joy RM (2001) “The accession of Vanuatu to the WTO: lessons for the multilateral tradingsystem.” WTO accessions and development policies. United Nations/UNCTAD, New York and Geneva
Hamim N (2001) “Yemen’s accession to the WTO.” WTO accessions and development policies. UnitedNations/UNCTAD, New York and Geneva
Jones K (2009) The political economy of WTO accession: the unfinished business of universal member-ship. World Trade Rev 8(2):279–314
15 The WTO Enhanced Integrated Framework program helps LDCs to improve their capacity for partic-ipation in the global trade system. See http://www.wto.org/english/tratop_e/devel_e/teccop_e/if_e.htm. TheWTO took further action to streamline accession procedures for LDCs in July 2012. See http://www.wto.org/english/news_e/news12_e/acc__03jul12_e.htm.
Joining the WTO: Why Does It Take So Long? 715
Kaufmann D, Kraay A, Mastruzzi M (2007) “Governance matters VI: aggregate and individual governanceindicators.” Working Paper Series WPS 4280. Washington, D.C: World Bank
Kavass II (2007) WTO accession: procedure, requirements and costs. J World Trade 41(3):453–476Kavass II (2008) Azerbaijan’s path towards WTO accession: political concerns, technical difficulties, national
attitudes (1997–2006). An essay in the form of a country report. Rev Cent East Eur Law 33:343–384Lanoszka A (2001) The world trade organization accession process: negotiating participation in a global-
izing economy. J World Trade 35(4):575–602Medelci M (2001) “Algeria’s experience and perspective regarding the difficulties of the WTO accession
negotiations and successful integration into the multilateral trading system.” WTO accessions anddevelopment policies. United Nations/UNCTAD, New York and Geneva
Michalopoulos C (2002) WTO accession. In: Hoekman B, Mattoo A, English P (eds) Development, tradeand the WTO: a handbook. The World Bank, Washington, pp 61–70
Milthorp P (2009) WTO accessions: the story so far. Hague J Dipl 4:103–112Pholsena K (2001) “Accession to the WTO of the Lao People’s Democratic Republic.” WTO accessions
and development policies. United Nations/UNCTAD, New York and GenevaRajkarnikar PR (2005) Nepal: the roe of an NGO in support of accession. In: Gallagher P, Low P, Stoler AL
(eds) Managing the challenges of WTO participation: 45 case studies, chapter 30. Cambridge Univer-sity Press and WTO, Cambridge, pp 420–429
Sopheak S (2001) “Issues and problems arising from the integration of Cambodia into the WTO.” WTOaccessions and development policies. United Nations/UNCTAD, New York and Geneva
Tang M-K, Wei S-J (2009) The value of making commitments externally: evidence from WTO accessions.J Int Econ 78(2):216–229
World Trade Organization (2002) “Accession of least developed countries.” Decision of General Counsel,10 December, WTO Document WT/L/508
World Trade Organization (2003) Note by the secretariat, accession to the world trade organization, 28thMay. WT/ACC/10/Rev.1
World Trade Organization (2004) Technical note on the accession process (revision 2). WT/ACC/10/Rev. 2.Available at www.wto.org
World Trade Organization (2005a) Technical note on the accession process (revision 3). WT/ACC/10/Rev.3, 28 Nov. 2005
World Trade Organization (2005b) Technical note on the accession process (revision 6). WT/ACC/11/Rev.6. Available at www.wto.org
World Trade Organization (2006) “How to become a member of the WTO.” Available at http://www.wto.org/english/thewto_e/acc_e/acces_e.htm
World Trade Organization (2008) A handbook on accession to the WTO. Prepared by the WTO Secretariat.Geneva: WTO
716 K. Jones, Y. Gai