Embed Size (px)
Citation preview
Steve Chadwick
Manufacturing IT Principal Engineer, Intel IT
Executive OverviewIntel’s factory system has delivered more and more computing functionality at ever-lower cost for decades. Intel’s Manufacturing IT engineers are using a combination of the Internet of Things (IoT) and large-scale data analysis to lower costs, increase product quality, and continue Intel’s predictable silicon track record. They coordinate manufacturing operations in multiple factories worldwide, collecting and integrating data from various sources, adapting analytic methods to cope with exploding data volumes, and achieving world-class results.
The factories’ IT engineers realize the potential value of IoT and large-scale data analytics in three ways: analyzing large volumes of data, identifying the most useful data, and reporting that data in a way that meets the needs and expectations of process engineers, yield engineers, and factory managers.
They have found several use cases for advanced analytics in their manufacturing environment:
• Increasing uptime for manufacturing tools with advanced analytics
• Accelerating factory output
• Detecting and controlling faults with tool sensor data
With tools based on this approach, factory engineers and managers can perform analyses that used to take 4 hours in just 30 seconds.
Joining IoT with Advanced Data Analytics to Improve Manufacturing Results
White Paper
August 2015
IT@Intel
With tools based on this approach, factory engineers and managers can perform analyses that used to take 4 hours in just 30 seconds.
2 of 8IT@Intel White Paper: Joining IoT with Advanced Data Analytics to Improve Manufacturing Results
Share:
Contents1 Executive Overview2 Background3 Solution
– Analyzing Huge Amounts of Data
– Drilling Down to the Most Useful Data
– Delivering Reports That Meet Users’ Needs and Expectations
4 Results– Three Use Cases for IoT and
Distributed Data Analysis In Manufacturing
7 Next Steps8 Conclusion
ContributorsT. J. Lawrence, Senior Developer, Intel Manufacturing ITDarcy Ortiz, General Manager, Intel Manufacturing ITJeff Walsh, Central Services Director, Intel Manufacturing ITCory Zorker, Developer, Intel Manufacturing IT
AcronymsIoT Internet of Things TPT throughput time
BackgroundIntel maintains multiple factories worldwide. Our company’s products and manufacturing processes both grow increasingly complex with each new generation of processors. To be competitive, we must minimize costs and raise throughput despite the inevitable rise in complexity.
To coordinate the factories, engineers face significant challenges associated with collecting and analyzing data across this global system. Traditional analysis methods become inadequate as the volume of data explodes with the addition of more wafers, more locations, and more tools. Compounding this, integrating many sources of data involves data conversion and connection before a tool can provide meaningful analysis and results.
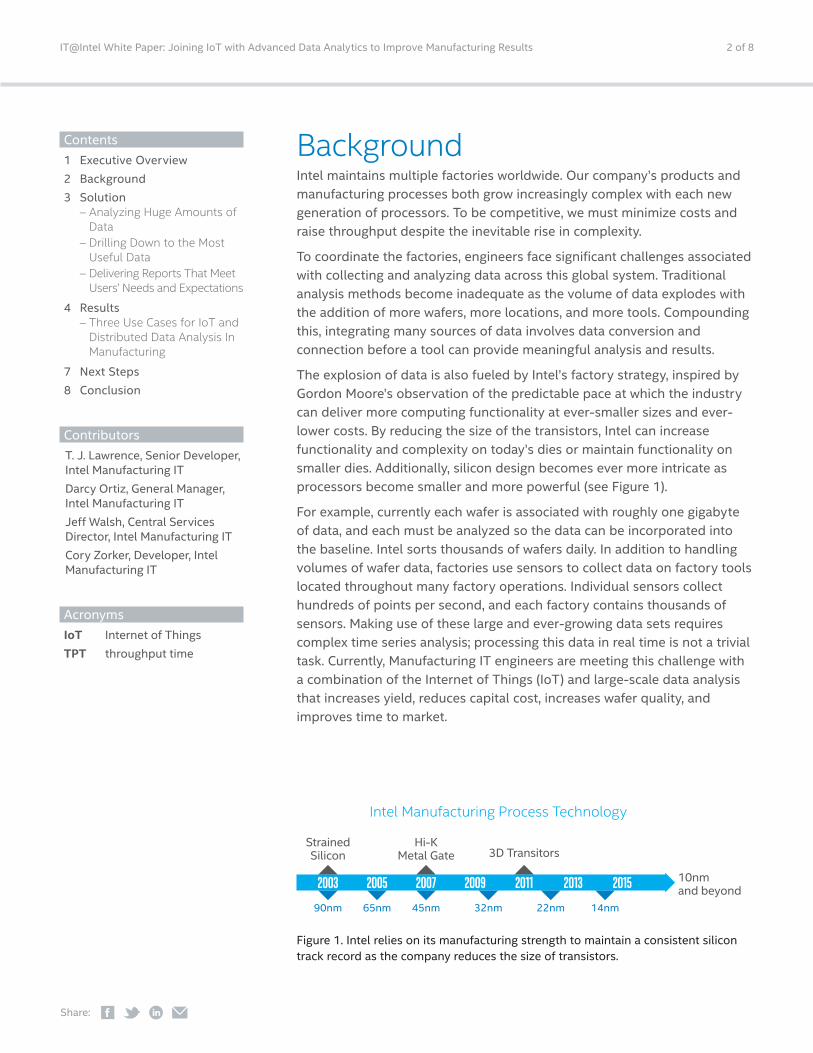
The explosion of data is also fueled by Intel’s factory strategy, inspired by Gordon Moore’s observation of the predictable pace at which the industry can deliver more computing functionality at ever-smaller sizes and ever-lower costs. By reducing the size of the transistors, Intel can increase functionality and complexity on today’s dies or maintain functionality on smaller dies. Additionally, silicon design becomes ever more intricate as processors become smaller and more powerful (see Figure 1).
For example, currently each wafer is associated with roughly one gigabyte of data, and each must be analyzed so the data can be incorporated into the baseline. Intel sorts thousands of wafers daily. In addition to handling volumes of wafer data, factories use sensors to collect data on factory tools located throughout many factory operations. Individual sensors collect hundreds of points per second, and each factory contains thousands of sensors. Making use of these large and ever-growing data sets requires complex time series analysis; processing this data in real time is not a trivial task. Currently, Manufacturing IT engineers are meeting this challenge with a combination of the Internet of Things (IoT) and large-scale data analysis that increases yield, reduces capital cost, increases wafer quality, and improves time to market.
Figure 1. Intel relies on its manufacturing strength to maintain a consistent silicon track record as the company reduces the size of transistors.
10nmand beyond
90nm 65nm 45nm 32nm 22nm 14nm
StrainedSilicon
Hi-KMetal Gate 3D Transitors
Intel Manufacturing Process Technology
2003 2005 2007 2009 2011 2013 2015
3 of 8IT@Intel White Paper: Joining IoT with Advanced Data Analytics to Improve Manufacturing Results
Share:
SolutionIntel’s Manufacturing IT group sees significant potential benefits in a combination of IoT and large-scale data analysis. Specifically, Manufacturing IT is doing three things:
• Analyzing large volumes of data
• Identifying the most useful data
• Delivering information (graphs, charts, and so on) when our users need it and in a way that meets their expectations and needs
Analyzing Huge Amounts of DataData becomes readily available through the use of integrated dashboards, streaming data analysis, and analytics at the edge—that is, very close to the activity.1 Intel’s manufacturing engineers have access to powerful data centers, with 64-bit servers based on Intel® Xeon® processors, multiple operating systems, routers, switches, firewalls, and fiber-optic cabling, and more than a petabyte of centralized storage. These high-performance Intel® architecture-based servers perform situation-specific and continuous distributed data analysis, processing over 500,000 ad hoc jobs each week. Complex time series analysis and data-processing tasks are distributed to server farms around the world.
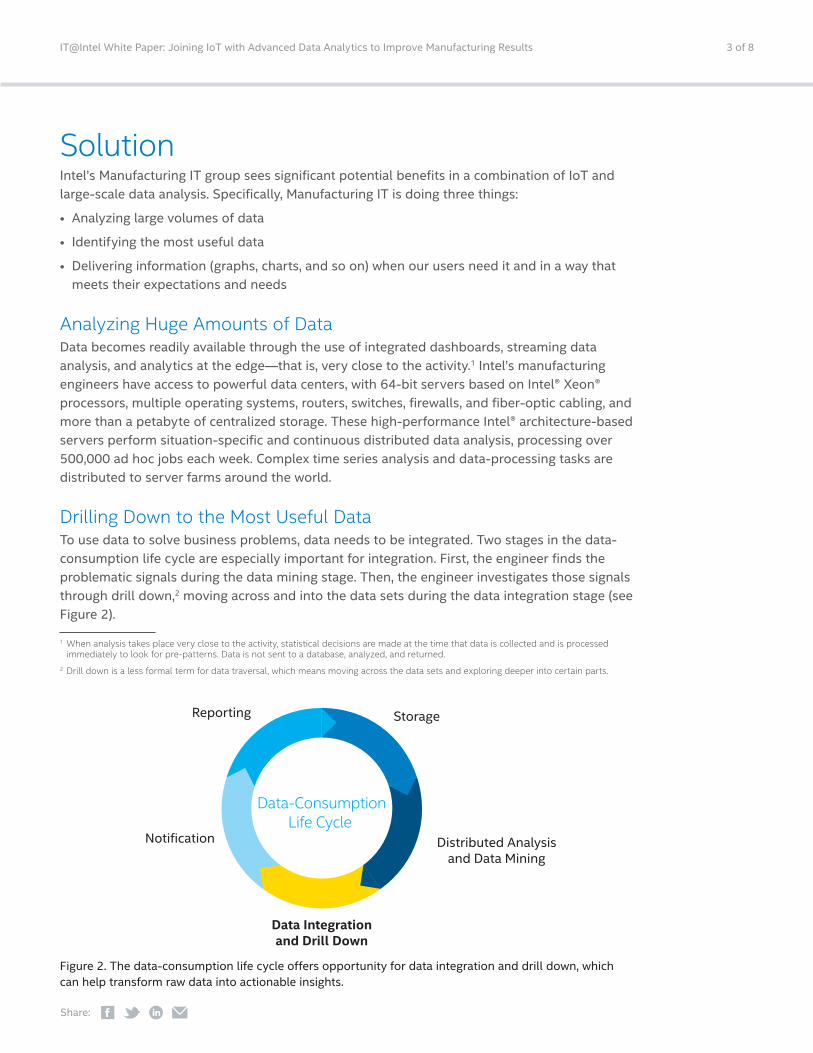
Drilling Down to the Most Useful DataTo use data to solve business problems, data needs to be integrated. Two stages in the data-consumption life cycle are especially important for integration. First, the engineer finds the problematic signals during the data mining stage. Then, the engineer investigates those signals through drill down,2 moving across and into the data sets during the data integration stage (see Figure 2).
1 When analysis takes place very close to the activity, statistical decisions are made at the time that data is collected and is processed immediately to look for pre-patterns. Data is not sent to a database, analyzed, and returned.
2 Drill down is a less formal term for data traversal, which means moving across the data sets and exploring deeper into certain parts.
Storage
Data Integrationand Drill Down
Notification
Reporting
Distributed Analysisand Data Mining
Data-ConsumptionLife Cycle
Figure 2. The data-consumption life cycle offers opportunity for data integration and drill down, which can help transform raw data into actionable insights.
4 of 8IT@Intel White Paper: Joining IoT with Advanced Data Analytics to Improve Manufacturing Results
Share:
To understand how data integration and drill down work, consider the example of trying to locate a car with the license plate as the only piece of available data. A search through the Department of Motor Vehicles’ records for all 50 states is an example of data integration. Then, a series of data traversals can help drill down to the desired result—matching the license plate to the car; then, from that car’s registration, finding an address for the owner; and finally using a map to find the car’s location.
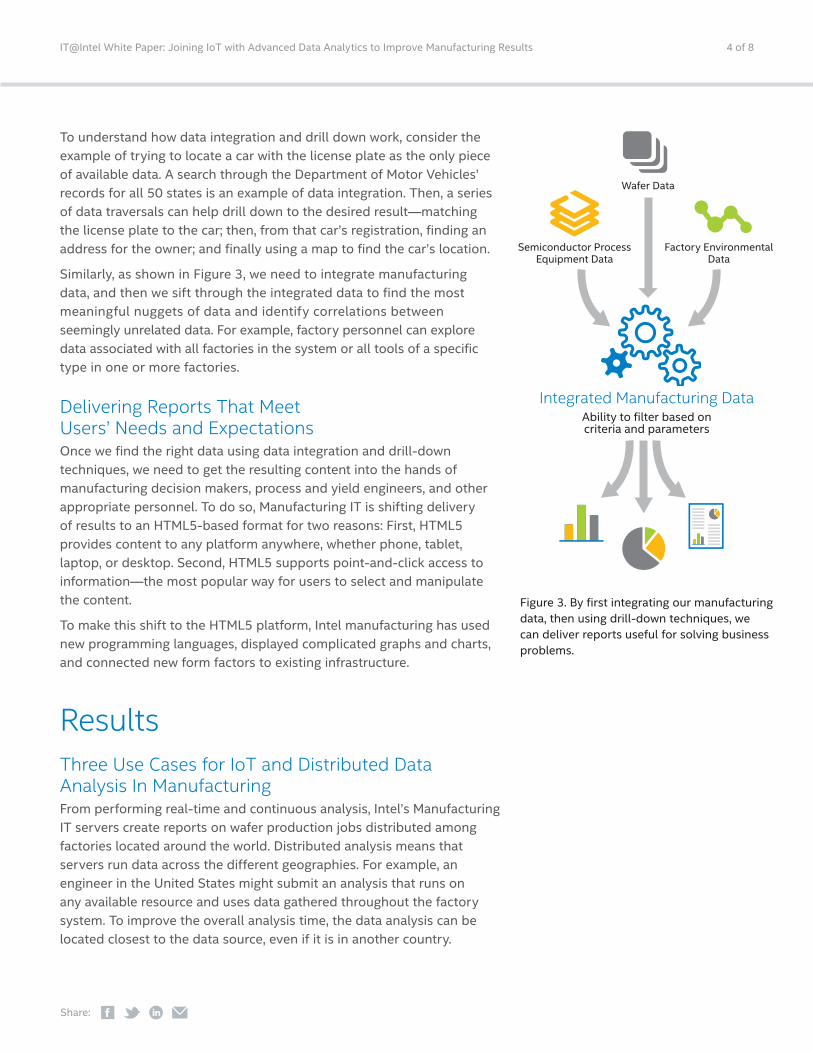
Similarly, as shown in Figure 3, we need to integrate manufacturing data, and then we sift through the integrated data to find the most meaningful nuggets of data and identify correlations between seemingly unrelated data. For example, factory personnel can explore data associated with all factories in the system or all tools of a specific type in one or more factories.
Delivering Reports That Meet Users’ Needs and ExpectationsOnce we find the right data using data integration and drill-down techniques, we need to get the resulting content into the hands of manufacturing decision makers, process and yield engineers, and other appropriate personnel. To do so, Manufacturing IT is shifting delivery of results to an HTML5-based format for two reasons: First, HTML5 provides content to any platform anywhere, whether phone, tablet, laptop, or desktop. Second, HTML5 supports point-and-click access to information—the most popular way for users to select and manipulate the content.
To make this shift to the HTML5 platform, Intel manufacturing has used new programming languages, displayed complicated graphs and charts, and connected new form factors to existing infrastructure.
ResultsThree Use Cases for IoT and Distributed Data Analysis In ManufacturingFrom performing real-time and continuous analysis, Intel’s Manufacturing IT servers create reports on wafer production jobs distributed among factories located around the world. Distributed analysis means that servers run data across the different geographies. For example, an engineer in the United States might submit an analysis that runs on any available resource and uses data gathered throughout the factory system. To improve the overall analysis time, the data analysis can be located closest to the data source, even if it is in another country.
Semiconductor ProcessEquipment Data
Ability to filter based oncriteria and parameters
Wafer Data
Integrated Manufacturing Data
Factory EnvironmentalData
Figure 3. By first integrating our manufacturing data, then using drill-down techniques, we can deliver reports useful for solving business problems.
5 of 8IT@Intel White Paper: Joining IoT with Advanced Data Analytics to Improve Manufacturing Results
Share:
Intel bases this worldwide 24/7 operation on the IoT, collecting data from numerous factories, each containing a multitude of tools. In this manufacturing environment, we have already identified three use cases for distributed data analysis:• Increasing uptime for manufacturing tools with advanced analytics• Accelerating factory output• Detecting and controlling faults with tool sensor data
Most notably, each of these use cases has resulted in significant cost savings, improved throughput time (TPT), and other benefits.
Use Case #1. Increasing Uptime for Manufacturing Tools with
Advanced Analytics
The process engineer monitors yield, cycle time, uptime, process health, and maintenance schedules. To do so, the engineer must collect data for those categories and transform it into actionable procedures. That information goes into a report that contains visual indicators and offers the capability to drill down for details.
Intel’s analytics system provides process engineers and managers with the ability to interact with the data and investigate possible courses of action. With this integrated and actionable information, leaders can save factory costs in terms of quality, labor, improved yield, and TPT.
Results come from providing the right data at the right time in the right format. We provide the information an engineer needs on critical metrics such as cycle time, uptime, process health, and maintenance. These metrics help ensure the business’s success, and factory management is held accountable for them.
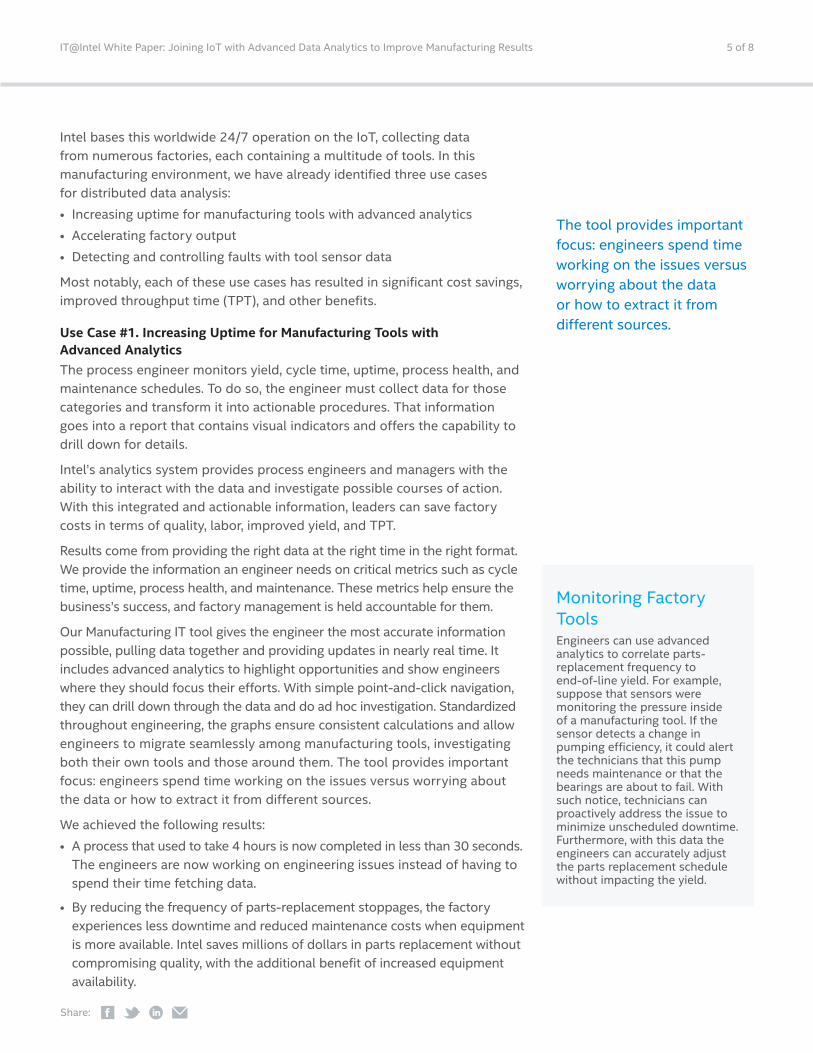
Our Manufacturing IT tool gives the engineer the most accurate information possible, pulling data together and providing updates in nearly real time. It includes advanced analytics to highlight opportunities and show engineers where they should focus their efforts. With simple point-and-click navigation, they can drill down through the data and do ad hoc investigation. Standardized throughout engineering, the graphs ensure consistent calculations and allow engineers to migrate seamlessly among manufacturing tools, investigating both their own tools and those around them. The tool provides important focus: engineers spend time working on the issues versus worrying about the data or how to extract it from different sources.
We achieved the following results:• A process that used to take 4 hours is now completed in less than 30 seconds.
The engineers are now working on engineering issues instead of having to spend their time fetching data.
• By reducing the frequency of parts-replacement stoppages, the factory experiences less downtime and reduced maintenance costs when equipment is more available. Intel saves millions of dollars in parts replacement without compromising quality, with the additional benefit of increased equipment availability.
The tool provides important focus: engineers spend time working on the issues versus worrying about the data or how to extract it from different sources.
Monitoring Factory ToolsEngineers can use advanced analytics to correlate parts-replacement frequency to end-of-line yield. For example, suppose that sensors were monitoring the pressure inside of a manufacturing tool. If the sensor detects a change in pumping efficiency, it could alert the technicians that this pump needs maintenance or that the bearings are about to fail. With such notice, technicians can proactively address the issue to minimize unscheduled downtime. Furthermore, with this data the engineers can accurately adjust the parts replacement schedule without impacting the yield.
6 of 8IT@Intel White Paper: Joining IoT with Advanced Data Analytics to Improve Manufacturing Results
Share:
Use Case #2. Accelerating Factory Output
Manufacturing IT created a new advanced analytics methodology that can examine hundreds of operations in the flow of operations that produces material. This system finds issues in seconds and provides technicians with the ability to drill down to the root cause of problems. They gain insight that would not otherwise be possible at the time. They can use the analytics system to identify daily action against issues, to help focus the team on areas with the greatest return on investment, and to take actions that could significantly improve TPT.
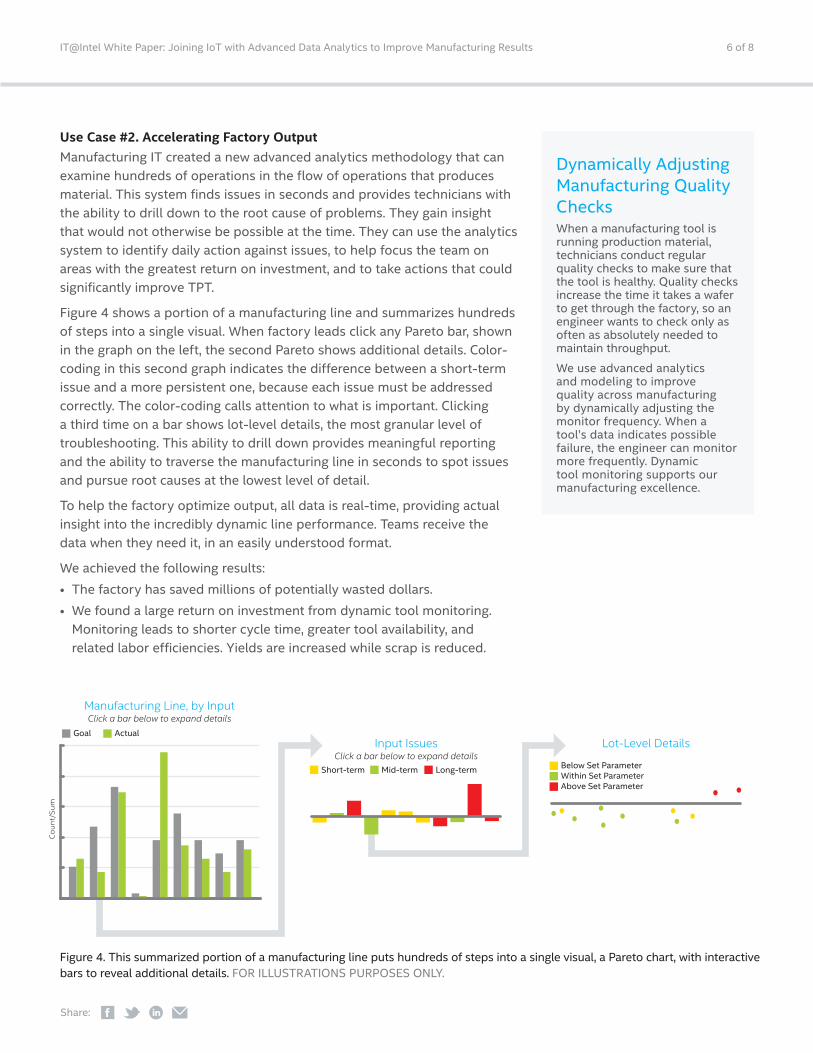
Figure 4 shows a portion of a manufacturing line and summarizes hundreds of steps into a single visual. When factory leads click any Pareto bar, shown in the graph on the left, the second Pareto shows additional details. Color-coding in this second graph indicates the difference between a short-term issue and a more persistent one, because each issue must be addressed correctly. The color-coding calls attention to what is important. Clicking a third time on a bar shows lot-level details, the most granular level of troubleshooting. This ability to drill down provides meaningful reporting and the ability to traverse the manufacturing line in seconds to spot issues and pursue root causes at the lowest level of detail.
To help the factory optimize output, all data is real-time, providing actual insight into the incredibly dynamic line performance. Teams receive the data when they need it, in an easily understood format.
We achieved the following results:• The factory has saved millions of potentially wasted dollars.• We found a large return on investment from dynamic tool monitoring.
Monitoring leads to shorter cycle time, greater tool availability, and related labor efficiencies. Yields are increased while scrap is reduced.
Figure 4. This summarized portion of a manufacturing line puts hundreds of steps into a single visual, a Pareto chart, with interactive bars to reveal additional details. FOR ILLUSTRATIONS PURPOSES ONLY.
Goal Actual
Short-term Mid-term Long-term Below Set ParameterWithin Set ParameterAbove Set Parameter
Manufacturing Line, by InputClick a bar below to expand details
Input IssuesClick a bar below to expand details
Co
un
t/S
um
Lot-Level Details
Dynamically Adjusting Manufacturing Quality ChecksWhen a manufacturing tool is running production material, technicians conduct regular quality checks to make sure that the tool is healthy. Quality checks increase the time it takes a wafer to get through the factory, so an engineer wants to check only as often as absolutely needed to maintain throughput.
We use advanced analytics and modeling to improve quality across manufacturing by dynamically adjusting the monitor frequency. When a tool’s data indicates possible failure, the engineer can monitor more frequently. Dynamic tool monitoring supports our manufacturing excellence.
7 of 8IT@Intel White Paper: Joining IoT with Advanced Data Analytics to Improve Manufacturing Results
Share:
Use Case #3. Detecting and Controlling Faults with Tool Sensor Data
With the system collecting real-time sensor data from the equipment in each factory, the volumes of data are huge snapshots of hundreds of points per second per sensor. A Manufacturing IT data analysis tool performs both real-time detection as well as end-of-line correlation.3 That is, when the tool detects signal A, end-of-line correlation traces it back to processing step B.
The tool provides engineers and manufacturing technicians with meaningful reporting by cutting through all the noise to look at the data points that matter.
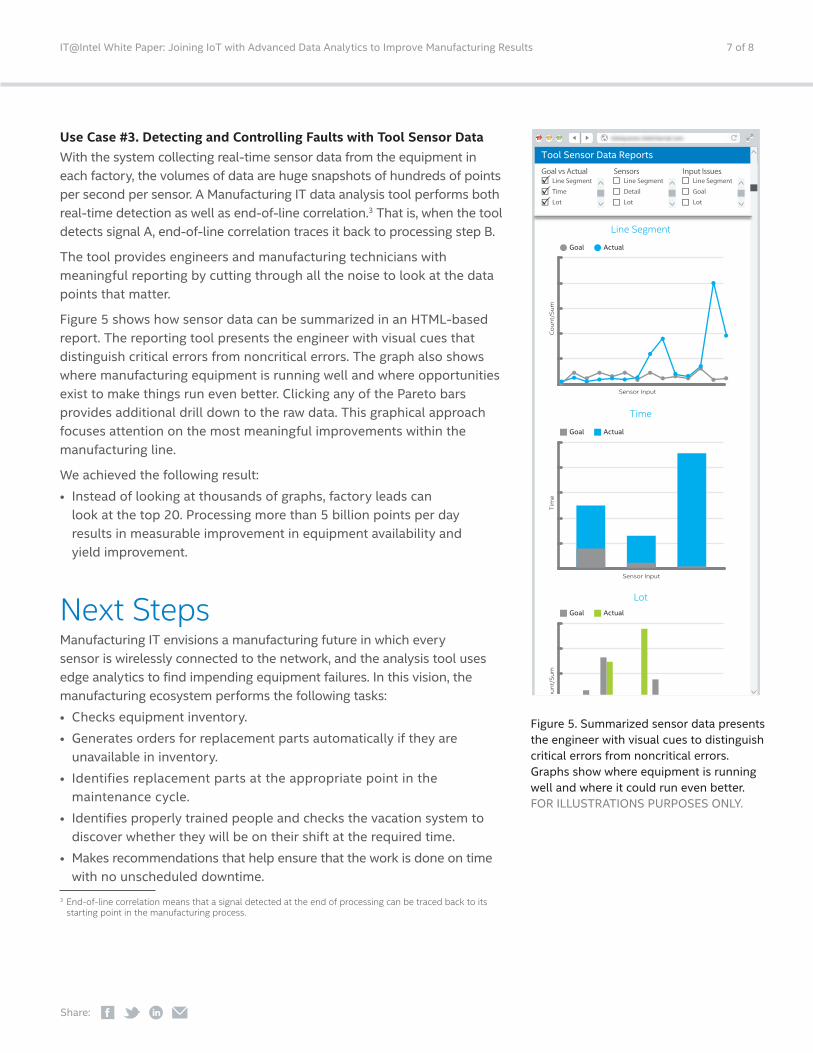
Figure 5 shows how sensor data can be summarized in an HTML-based report. The reporting tool presents the engineer with visual cues that distinguish critical errors from noncritical errors. The graph also shows where manufacturing equipment is running well and where opportunities exist to make things run even better. Clicking any of the Pareto bars provides additional drill down to the raw data. This graphical approach focuses attention on the most meaningful improvements within the manufacturing line.
We achieved the following result:• Instead of looking at thousands of graphs, factory leads can
look at the top 20. Processing more than 5 billion points per day results in measurable improvement in equipment availability and yield improvement.
Next StepsManufacturing IT envisions a manufacturing future in which every sensor is wirelessly connected to the network, and the analysis tool uses edge analytics to find impending equipment failures. In this vision, the manufacturing ecosystem performs the following tasks:• Checks equipment inventory.• Generates orders for replacement parts automatically if they are
unavailable in inventory. • Identifies replacement parts at the appropriate point in the
maintenance cycle.• Identifies properly trained people and checks the vacation system to
discover whether they will be on their shift at the required time.• Makes recommendations that help ensure that the work is done on time
with no unscheduled downtime.3 End-of-line correlation means that a signal detected at the end of processing can be traced back to its
starting point in the manufacturing process.
Figure 5. Summarized sensor data presents the engineer with visual cues to distinguish critical errors from noncritical errors. Graphs show where equipment is running well and where it could run even better. FOR ILLUSTRATIONS PURPOSES ONLY.
Tool Sensor Data Reports
Goal vs Actual Sensors Input IssuesLine SegmentTimeLot
Line SegmentDetailLot
Line SegmentGoalLot
Goal Actual
Time
Tim
e
Sensor Input
Goal Actual
Line Segment
Co
un
t/S
um
Sensor Input
Goal Actual
Lot
Co
un
t/S
um
333
8 of 8IT@Intel White Paper: Joining IoT with Advanced Data Analytics to Improve Manufacturing Results
Intel technologies’ features and benefits depend on system configuration and may require enabled hardware, software or service activation. Performance varies depending on system configuration. Check with your system manufacturer or retailer or learn more at intel.com.
THE INFORMATION PROVIDED IN THIS PAPER IS INTENDED TO BE GENERAL IN NATURE AND IS NOT SPECIFIC GUIDANCE. RECOMMENDATIONS (INCLUDING POTENTIAL COST SAVINGS) ARE BASED UPON INTEL’S EXPERIENCE AND ARE ESTIMATES ONLY. INTEL DOES NOT GUARANTEE OR WARRANT OTHERS WILL OBTAIN SIMILAR RESULTS.
INFORMATION IN THIS DOCUMENT IS PROVIDED IN CONNECTION WITH INTEL PRODUCTS AND SERVICES. NO LICENSE, EXPRESS OR IMPLIED, BY ESTOPPEL OR OTHERWISE, TO ANY INTELLECTUAL PROPERTY RIGHTS IS GRANTED BY THIS DOCUMENT. EXCEPT AS PROVIDED IN INTEL’S TERMS AND CONDITIONS OF SALE FOR SUCH PRODUCTS, INTEL ASSUMES NO LIABILITY WHATSOEVER AND INTEL DISCLAIMS ANY EXPRESS OR IMPLIED WARRANTY, RELATING TO SALE AND/OR USE OF INTEL PRODUCTS AND SERVICES INCLUDING LIABILITY OR WARRANTIES RELATING TO FITNESS FOR A PARTICULAR PURPOSE, MERCHANTABILITY, OR INFRINGEMENT OF ANY PATENT, COPYRIGHT OR OTHER INTELLECTUAL PROPERTY RIGHT.
Intel, the Intel logo, and Xeon are trademarks of Intel Corporation in the U.S. and other countries.
*Other names and brands may be claimed as the property of others.
Copyright 2015 Intel Corporation. All rights reserved. Printed in USA Please Recycle 0815/JSED/KC/PDF
In this vision, Manufacturing IT makes the factory productive by applying the IoT concept to the way the ecosystem consumes data from the wide variety of networked tools.
ConclusionUsing IoT and large-scale data analysis, Manufacturing IT continually improves product quality, cost, and the size of transistors in its processors. Within each factory, Manufacturing IT makes widespread use of sensors to monitor product quality with immediate feedback. These sensors better connect the tools in Intel’s worldwide system of factories, providing the consistency and mobility that promote cost-effective manufacturing. However, using sensors significantly increases data volumes and data complexity over previous levels.
To deal with these considerably large, complex data sets, we use large-scale data analysis to transform raw data into actionable information through data integration and drill-down techniques, enabling engineers and managers to interact with the data and investigate possible courses of action to solve business problems, continuously driving Intel’s manufacturing excellence. To deliver actionable information, we use HTML5, which facilitates data delivery to a wide variety of devices and in an array of formats. HTML5 and associated tools support point-and-click interaction to navigate integrated dashboards. We also leverage analytics at the edge and streaming data analysis.
The use cases we have identified for combining the IoT and large-scale distributed data analysis have resulted in significant benefits for Intel Manufacturing. We anticipate identifying additional use cases that will contribute to the cost effectiveness, timeliness, and quality of Intel’s manufacturing processes.
For more information on Intel IT best practices, visit www.intel.com/IT.
IT@IntelWe connect IT professionals with their IT peers inside Intel. Our IT department solves some of today’s most demanding and complex technology issues, and we want to share these lessons directly with our fellow IT professionals in an open peer-to-peer forum.
Our goal is simple: improve efficiency throughout the organization and enhance the business value of IT investments.
Follow us and join the conversation:• Twitter• #IntelIT• LinkedIn• IT Center Community
Visit us today at intel.com/IT or contact your local Intel representative if you would like to learn more.
Related ContentVisit intel.com/IT to find content on related topics:
• Exploring the Internet of Things in the Enterprise paper