Embed Size (px)
Citation preview

Retrospective Theses and Dissertations Iowa State University Capstones, Theses andDissertations
1-1-1983
Job satisfaction and job performance : a meta-analysisMichelle Teresa IaffaldanoIowa State University
Follow this and additional works at: https://lib.dr.iastate.edu/rtd
Part of the Psychology Commons
This Thesis is brought to you for free and open access by the Iowa State University Capstones, Theses and Dissertations at Iowa State University DigitalRepository. It has been accepted for inclusion in Retrospective Theses and Dissertations by an authorized administrator of Iowa State University DigitalRepository. For more information, please contact [email protected].
Recommended CitationIaffaldano, Michelle Teresa, "Job satisfaction and job performance : a meta-analysis" (1983). Retrospective Theses and Dissertations.18316.https://lib.dr.iastate.edu/rtd/18316

Job satisfaction and job performance:
A meta-analysis
by
Michelle Teresa Iaffaldano
A Thesis Submitted to the
Graduate Faculty in Partial Fulfillment of the
Requirements for the Degree of
MASTER OF SCIENCE
Major: Psychology
Signatures have been redacted for privacy
.versity Ames, Iowa
1983

ii
TABLE OF CONTENTS
ABSTRACT
ACKNOWLEDGMENTS
INTRODUCTION
Meta-Analysis
The contributions of Glass and his associates The work of Schmidt and Hunter
The Present Study
METHOD
Data Collection Procedures
Statistical Analyses
iv
v
1
3
4 6
10
13
13
32
Phase I: Estimation of population parameters 32 Phase II: Regression analysis of study characteristics 37
RESULTS 39
Sununary 54
DISCUSSION 55
The Estimated Population Parameters 56
A Nuance of the Variance Correction Procedure 60
The Impact of Study Characteristics 61
Substantive Implications 63
Suggestions for Future Research 67
Criticisms of Meta-Analysis and Limitations of this Study 72
REFERENCES 78
STUDIES INCLUDED IN THE META-ANALYSIS 83

iii
LIST OF TABLES
Table 1. Summary of studies included in the meta-analysis 18
Table 2. Average observed correlations and estimated popula-tion values 40
Table 3. Frequencies of observed correlations by year of publication 43
Table 4. Frequency of occurrence of coded study charac-teristics 44
Table 5. Intercorrelations among nine coded study charac-teris tics 46
Table 6. Bivariate and squared multiple correlation between nine coded study characteristics and observed satisfaction-performance correlations 48
Table 7. Correlations between observed satisfactionperformance correlations and coded study charac-teristics by type of satisfaction measured 51

iv
ABSTRACT
The assumption that job satisfaction and job performance should
be related has much intuitive appeal, despite the fact that many re
viewers of the satisfaction-performance literature have concluded that
there is no strong pervasive relationship between these two variables.
Research in this area has proliferated over the past fifty years, with
the results often deemed "inconclusive." In an attempt to discern the
true nature of this relationship, the present study aggregated 74 pre
viously published studies containing correlations between job satis
faction and job performance. Through the use of meta-analytic techniques,
it was demonstrated that the best estimate of the true population cor
relation between satisfaction and performance is relatively low (.17)
and that much of the variability in results obtained in previous re
search has been due to the use of small sample sizes and unreliable
measurement of the satisfaction and performance constructs. Further
more, it was shown that nine methodological/measurement characteristics
of a study are only modestly related to the magnitude of the satisfaction
performance correlation that will be obtained. The conclusions of
earlier satisfaction-performance reviewers (e.g., Brayfield & Crockett,
1955; Vroom, 1964) that these two variables are not related were thus
reaffirmed. In the light of these findings, some of the major substan
tive implications and new directions for future research were explored.

v
ACKNOWLEDGMENTS
The author would like to express appreciation to several people
who have aided in the completion of this thesis. The members of the
advisory committee, Dr. Paula Morrow, Dr. Robert Strahan, and Dr. Ken
De Meuse, provided many valuable comments and suggestions. Thanks are
also due to Janet Kottke for her aid in writing a computer program to
perform some of the analyses. Most importantly, the author would like
to thank Dr. Paul Muchinsky, major professor, for his invaluable
guidance and encouragement throughout all phases of this project.

1
INTRODUCTION
The elusive relationship between job satisfaction and job performance
has plagued industrial psychologists for nearly fifty years. In their
classic review of the early literature in this area, Brayfield and
Crockett (1955) credit Kornhauser and Sharp (1932) with the initial in
vestigation of attitudes and productivity in an industrial setting.
Although the flurry of research on this topic has abated somewhat in the
past few years, the current literature continues to be highlighted with
reports of new theoretical and empirical developments. Indeed, the
Journal of Vocational Behavior's yearly research review still references
studies of job satisfaction in which job performance is measured (e.g.,
Bartol, 1981).
In order to keep pace with this ever-expanding volume of research,
several summaries of the job satisfaction-job performance literature
have appeared, both from an empirical approach (Brayfield & Crockett,
1955; Herzberg, Mausner, Peterson, & Capwell, 1957; Vroom, 1964;
Srivastva, Sa1ipante, Cummings, Notz, Bigelow, & Waters, 1975) and a
theoretical viewpoint (Schwab & Cummings, 1970). These reviewers have
attempted to reconcile the inconsistencies among individual study re
sults by concluding that there is no strong pervasive relationship
between workers' job satisfaction and productivity. Specifically,
Vroom (1964) reported a median correlation of +.14 from the twenty
studies he reviewed, and Brayfield and Crockett reported that there
was little evidence that employee attitudes "bear any simple •.• , or
for that matter, appreciable ... relationship to performance on the

2
job" (1955, p. 408). However, Herzberg et al. (1957) were somewhat
more optimistic, and although the correlations they compiled were
generally low, they concluded that further attention to satisfaction
in relation to worker output was warranted.
Despite these generally negative conclusions by reviewers, in
vestigationsinto the connection between these two variables pro
liferated along several lines. One area which received a great deal
of attention in the literature was the question of causality between
satisfaction and performance (c.f. Lawler & Porter, 1967; Schwab &
Cummings, 1970; Siegel & Bowen, 1971; Organ, 1977). Another area of
concern has been the search for moderators of the satisfaction
performance relationship, such as the contingency of rewards (Lawler,
1973; Jacobs & Solomon, 1977), situational constraints (Herman, 1973;
Bhagat, 1982), self-esteem (Jacobs & Solomon, 1977; Lopez, 1982),
pressures for production (Triandis, 1959), and reciprocity norms
(Organ, 1977). A third line of research has focused on methodologica1/
measurement techniques for increasing the magnitude of the satisfaction
performance relationship obtained (Triandis, 1959; Jacobs & Solomon,
1977; Fisher, 1980).
The impetus behind psychologists' persistence in studying the
satisfaction-performance relationship appears to be the assumption
that the two variables should be related, and that further research
will reveal this as-yet-undiscovered "truth." However, each new study
that is reported merely serves to increase the existing data base in
this area, to the point where it is now virtually uninterpretable.
Clearly, what is needed is an integration of the already documented

3
results into some descriptive, yet quantitative form. The recent
emergence of a new approach to research integration, meta-analysis,
offers this possibility.
Meta-Analysis
Reviews of previously published research in the social sciences
have traditionally relied upon a narrative, qualitative approach to
integrating findings. Occasionally, these reviews have been accompanied
by a "vote count" of the number of studies showing positive significant,
negative significant, and nonsignificant results, with the modal category
then assumed to give the best estimate of the form of the true rela
tionship between the variables (Light & Smith, 1971). However, when
the results vary substantially across studies on a given problem, at
tempts to make sense of the literature have often yielded only very
tentative, and occasionally biased, conclusions because of the lack of
systematic methods of inferring generalizations from disparate studies
(Jackson, 1980). As a result, despite the voluminous literature on many
topics, social science researchers have found themselves to be in the
"mildly embarrassing position of knowing less than [they] have proven"
(Glass, 1976, p. 8). The pressing need has become not for additional
empirical data, but for a means of establishing general knowledge
based upon the already accumulated data.

4
The contributions of Glass and his associates
In an effort to improve upon "pedestrian reviewing where verbal
,synopses of studies are strung out in dizzying lists" (1976, p. 4),
Glass proposed the "statistical analysis of a large collection of
analysis results from individual studies, for the purpose of integrating
the findings" (1976, p. 3). He coined the term "meta-analysis" to
distinguish this from "secondary analysis" - the re-ana1ysis of the
original data from a study in order to utilize more appropriate
statistical techniques or to answer a new question using old data
(Glass, 1976).
Glass maintains that meta-analysis is not a specific technique;
rather, he calls it an "attitude" - a perspective that uses many
techniques of measurement and statistical analysis to summarize the
findings of a group of empirical studies (Glass, McGaw, & Smith, 1981).
However, he and his colleagues have typically employed and advocated
one specific methodology which involves quantifying an effect size for
each study and then relating (via regression analysis) the magnitude of
effect to various descriptive contextual characteristics of the studies,
in an attempt to determine the causes of variation in study findings
(e.g., Smith & Glass, 1977). Glass' procedure also provides for the
calculation of the mean and standard deviation of effect sizes across
studies. The variance of effect sizes across studies is implicitly
accepted at face value (i.e., as representing true differences not at
tributable to error) and is assumed to have some substantive explanation
in terms of the study characteristics (Hunter, Schmidt, & Jackson, 1982).
In general, this form of meta-analysis has been utilized by

5
several researchers to derive generalizations from the literature on a
wide variety of topics. Glass et a1. (1981) as well as Hunter et a1.
(1982) provide extensive bibliographies of meta-analytic investigations
of this sort. Examples include Hall's (1978) meta-analysis of sex
differences in decoding nonverbal cues. In addition, several studies
such as Terpstra's (1981) examination of organizational development
outcomes, and Boehm's (1977) investigation of differential prediction
have employed a similar methodology, although they have not referred to
it as meta-analysis, per see
Following Glass, researchers became more vocal in advocating
alternative methods of research integration that involve statistically
combining study results (c.f. Rosenthal, 1978; Cooper, 1979), although
many of these procedures had been in existence long before Glass'
initial 1976 article (e.g., Jones & Fiske, 1953). For example, Hedges
and Olkin (1980) undertook to correct for deficiencies in the earlier
"vote count" technique (Light & Smith, 1971) by extending the method
to estimate effect sizes. Statistical integration procedures generally
became acknowledged as superior to purely narrative reviewing because
they allowed the researcher to bypass the severe subjectivity and im
precise conclusions inherent in the traditional narrative review method
(Cooper & Rosenthal, 1980). However, no one "best" method of statistical
integration could be identified as appropriate for all situations
(Ro,sentha1, 1978).

6
The work of Schmidt and Hunter
Concurrently with Glass' work on meta-analysis, Schmidt and Hunter
and their colleagues developed an extensive set of procedures for
demonstrating the genera1izabi1ity of employment test validities (c.f.
Schmidt & Hunter, 1977; Pearlman, Schmidt, & Hunter, 1980; Schmidt,
Gast-Rosenberg, & Hunter, 1980). Although they admit to having been
unaware of Glass' work at the time (Hunter et a1., 1982), they regard
their validity generalization method as an extension of G1assian meta
analysis because both sets of procedures emphasize statistical integra
tion by determining a mean effect size across studies. They cite the
major conceptual difference between the two approaches as being the
direct focus that validity generalization procedures place upon the
role of statistical artifacts in influencing the variance in observed
effects across studies (Schmidt et a1., 1980). Alternatively,-Glass'
approach does not attempt to statistically control for artifactual
sources of variance (other than sampling error) when determining the
mean effect size.
Schmidt and Hunter's validity generalization procedure is based
on the notion that the observed variation in validity coefficients
across studies is a result of the operation of statistical artifacts.
They have identified seven such artifacts: a) sampling error due to
small sample sizes; b) criterion unreliability; c) predictor un
reliability; d) range restriction; e) criterion contamination and de
ficiency; f) slight differences in factor structure between different
tests measuring similar constructs; and g) computational and typo
graphical errors (Schmidt & Hunter, 1977). Theoretically, if one could

7
remove variation due to all seven sources of error variance, the re
maining variance in the distribution of validity coefficients across
studies (for a given test) would be virtually zero. In application,
Schmidt and Hunter have demonstrated that their procedure, which cor
rects for just the first four of these artifacts (sampling error,
predictor and criterion unreliability, and range restriction), can ex
plain a substantial amount of variation in employment test validities,
i.e., that validities are generalizable (c.f. Pearlman et al., 1980;
Schmidt, Hunter, & Pearlman, 1981; Schmidt et al., 1980).
Although Schmidt and Hunter's validity generalization procedures
were originally proposed in the context of personnel selection, the
formulae have recently been developed into a general technique of meta
analYSis, applicable to the integration of research in virtually any
domain (Hunter et al., 1982). The rationale behind the procedure re
mains the same, however, in that a large proportion (if not all) of
the variation in findings across studies is assumed to be the result
of statistical artifact.
A recent study by Terborg, Lee, Smith, Davis, and Turbin (1982)
has demonstrated the applicability of the validity generalization proce
dure to a context outside of employee selection research. These authors
employed the original validity generalization formulae to an empirical
investigation of the relationships between job satisfaction and organiza
tional commitment to absenteeism. In general, they were able to ac
count for sizable proportions of variance (over 50%) in the correla
tions between their predictors (the Job Descriptive Index and organiza
tional commitment measures) and absenteeism measures.

8
Linn, Harnisch, and Dunbar (1981) provide another example of the
original validity generalization procedures in application. These
authors found that up to 70% of the variance in validity coefficients
for the prediction of law school grades from the Law School Admission
Test (LSAT) could be accounted for by statistical artifacts.
Other examples of the application of Schmidt and Hunter's meta
analytic procedures to date are Mabe and West's (1982) review of the
literature on the validity of self-evaluation of ability and Fisher and
Gitelson's (1983) examination of the correlates of role stress and role
ambiguity. Mabe and West (1982) identified 55 studies containing cor
relations between self-evaluations and actual ability measures. They
reported a) the mean £, adjusted for sampling error and predictor and
criterion unreliability (.42), and b) the standard deviation of the
distribution of validity coefficients, corrected for the effects of
sampling error (.17). Although Hunter et ale (1982) also provide
formulae for adjusting the mean £ across studies for restriction of
range, Mabe and West (1982) found that the information necessary to
make this correction (sample and reference population variances for the
particular measure) was generally unavailable in individual studies,
and thus adjustment was not made for this source of error.
Mabe and West (1982) also employed Glassian methodology in their
meta-analysis. Each study included in the review was coded for the
presence or absence of nine measurement conditions which they hypothe
sized would moderate the variation in validity coefficients reported across
studies. As in Smith and Glass (1977), Mabe and West (1982) obtained a
mUltiple correlation coefficient ~ = .64) for these nine conditions

9
with the observed validity coefficients (converted to Fisher ~-scores).
This analysis indicated that much of the variation in study findings
could be attributed to these methodological and measurement differences,
and that those studies characterized by more of the favorable condi
tions generally reported higher correlations (see Terpstra, 1981 and
Boehm, 1977 for similar methodology and findings).
Aside from their specific results, Mabe and West's (1982) review
demonstrates the complementary nature of the Glassian and Hunter et a1.
(1982) approaches to meta-analysis. While the Hunter et a1. (1982)
technique takes a confirmatory perspective and attempts to assess the
theoretical "true" relationship between the variables in question, the
Glass et al. (1981) approach is more exploratory in nature, attempting
to discern qualitative aspects of the studies themselves which can ac
count for the obtained results. While Hunter et al. have criticized
Glass' use of large numbers of coded characteristics as capitalizing
on chance, they have acknowledged the utility of the Glassian approach
as a supplementary step to their own procedure. Specifically, they ad
vise that if the estimated variance of effect sizes (i.e., after cor
rections for artifacts have been made) across studies is substantially
greater than zero, one may correlate effect sizes with coded study
characteristics that have been developed on the basis of theoretical,
logical, statistical, and psychometric considerations. However, Hunter
et a1. warn that care must be taken to ensure that the study properties
coded are not products of the statistical artifacts controlled for via
their procedure, because this would result in their effects being par
tial1ed out twice.

10
The Present Study
The present study represents an attempt to improve upon and update
~ar1ier reviews of the job satisfaction-job performance literature by
utilizing the meta-analytic techniques of both Hunter et a1. (1982)
and Glass et a1. (1981) that have been outlined above. Although
previous narrative reviews (Brayfield & Crockett, 1955; Herzberg et al.,
1957, Vroom, 1964) have drawn some tentative conclusions regaraing the
nature of this relationship, the statistical integration now available
with these two forms of meta-analysis offers the prospect of more
exacting conclusions regarding both the "true" theoretical correlation
between these two variables, and a delineation of what types of study
conditions moderate this relationship in practice. Results of a meta
analytic review of the satisfaction-performance literature may demonstrate
that the true magnitude of this relationship is vastly different from
the low positive correlation that has been found by reviewers (e.g.,
Brayfield & Crockett, 1955; Herzberg et a1., 1957; Vroom, 1964).
The characteristics selected for inclusion in coding were based
upon variables which have been identified theoretically and/or em
pirically as appearing to influence obtained correlations, and which
were deemed to be feasible based upon pilot testing. Consequently,
although variables such as situational constraints (Herman, 1973; Bhagat,
1982), pressure for production (Triandis, 1959), or degree of job fit
(Schwab & Cummings, 1970) may contribute greatly to the variance in
performance-satisfaction correlations across studies, information re
garding such conditions is rarely provided, making the coding of such

11
variables of limited value. The resulting list of nine study charac-
teristics to be included, therefore, represents a partial list of
potential influences upon the magnitude of the satisfaction-performance
correlation obtained in a study.
Fisher (1980) discussed the importance of measurement issues to the
failure to find consistent correlations between satisfaction and per
formance. She advocated a "fit" between the specificity of ~ttit.1Ld~~@_ -* - "---. --------------------
performance criterion measures_~~e~t~_l!la_ximi_ze_ the re1ation~hip_~ __ ob~ .----.-.~--.-.-. . -.---.----.- .. ~-. -.----~--
served. Based upon her suggestions, studies reviewed here were examined
for the use of composite vs. unidimensional criteria, and for the use of
longitudinal vs. cross-sectional measurement of performance relative to
the measurement of satisfaction. Another variable which was expected
to contribute to the variation in results across studies was the pature ~
of the performance measure, i.e., whether quality or quantity of per----- ---- .--_._-_.-
formance was assessed.
A fourth condition of interest was the potential difference in
results obtained with .~~eQ..qJ'ts of performance as opposed to other .----------~--------.. -
sources such as ~~~rvisory ratings. Mabe and West's (1982) review
suggests that self-reports are potentially valid indicators of per-
formance, whereas supervisory ratings have generally been acknowledged
to be of questionable validity. A fifth variable concerned the use of
a performance measure developed specifically for experimental use. r------------- -----
Data obtained from a measure of this type might reasonably be expected
to differ from information extracted from organizational archives.
Finally, performance measures were coded on the basis of whether they
were subjective or objective, this characteristic being somewhat inter-

12
related with (yet not totally dependent upon) the quality-quantity
distinction made earlier.
Two characteristics of the studies were coded pertaining to the
job satisfaction measure employed. First, the specificity of the satis-
faction assessed was noted (i.e., specific facet satisfaction vs.
global satisfaction), based upon Fisher's (1980) argument that specific /1S
performance appraisal information should correlate more highly with
specific (rather than global) job satisfaction indices. Second, the
type of satisfaction measure used was assessed and recorded as being
either a traditional, well-documented instrument such as the Job
Descriptive Index (JDI) (Smith, Kendall, & Hulin, 1969), the Minnesota
Satisfaction Questionnaire (MSQ) (Weiss, Dawis, England, & Lofquist,
1967), or the Faces Scale (Kunin, 1955), or conversely, as an instrument
developed by the researcher specifically for the purposes of the particu-
lar study.
Lastly, as there has been some note that the strength of the
satisfaction-performance relationship may vary across occupational
gr~u2~Lawler & Porter, 1967), the nature of the sample used in the
study was coded as either white collar/professionals or blue collar em-
ployees.
Although it was proposed that these nine characteristics would
contribute significantly to the prediction of the size of correlation
obtained in a study, no specific hypotheses regarding the magnitude
of their contribution, nor hypotheses about the results of correction
of the mean and variance of this distribution of satisfaction-
performance correlations (via the Hunter et al. formulae) could be made.

13
METHOD
An extensive search of the published psychological literature was
conducted to obtain as many job satisfaction-job performance correla
tions as possible for inclusion in the analysis. While meta-analysis
does not require a specified minimum number of studies to be employed,
it was assumed that a more comprehensive review would result in more
accurate estimates of the population parameters. It was anticipated
that approximately 60-100 studies would be accessible, potentially
containing a total of several hundred correlation coefficients. For
example, Mabe and West (1982) obtained 55 published studies, yielding
a total of 267 correlations between self-evaluations of ability and
performance measures. On a larger scale, Smith and Glass (1977) obtained
833 effect size indices from 375 studies of psychotherapy effective
ness. The data collection procedures for the present study resulted
in a total of 74 studies published in 70 articles, based upon a total
subject sample size of 12,192, and providing a total sample of 217
satisfaction-performance correlations included in the meta-analysis.
Data Collection Procedures
Several steps were taken to locate potential studies containing
satisfaction-performance correlations. First, a computer search of
the Psychological Abstracts (1967-April 1983) was utilized. The
second step involved a manual search of all relevant published
references cited by the following major reviews of the job satisfaction
literature: Brayfield and Crockett (1955), Herzberg et al. (1957),

14
Vroom (1964), Schwab and Cummings (1970), Ronan (1970), and Locke
(1976). The third step involved a complete search of relevant
references cited by any of the previously located articles. At this
point in the data collection process, approximately 40 usable articles
had been obtained, a large proportion having had been published in the
Journal of Applied Psychology and the Academy of Management Journal.
Because it was felt that additional sources might be obtained which
contained satisfaction-performance correlations "embedded" within the
primary analyses (i.e., the attention given to the reported satisfaction
performance correlation was overshadowed by another focus of the study),
an additional data collection step was undertaken. This final stage
involved a manual search of each issue of the following academic journals
and publication dates: a) Journal of Vocational Behavior (1971-1983,
volumes 1-13); b) Journal of Occupational Behavior (1980-1983, volumes
1-4); c) Journal of Occupational Psychology (1960-1973, volumes 34-47;
1975-1980, volumes 48-53); d) Academy of Management Journal (1958-
June 1983, volumes 1-26); and e) Journal of Applied Psychology (1960-
May 1983, volumes 44-68). Due to time constraints, this list did not
include every potentially relevant academic journal (e.g., Personnel
Psychology), nor were early issues of some of the journals included
(e.g., Journal of Applied Psychology prior to 1960). However, the
journals and dates that were selected for inclusion in this stage of
data collection were believed to be those having the highest probability
of containing empirical research with "embedded" satisfaction-performance
correlations, based upon the results of the earlier data collection
stages. At the conclusion of this final step, 74 studies had been

15
identified in 70 published sources as providing usable information for
the meta-analysis, and the researcher was highly confident that the
vast majority of relevant published research had been examined for
potential inclusion in this study.
Individual studies were selected for inclusion in the meta-
analysis based upon the following criteria: a) the study results were
published research, thus excluding published technical reports, doc
toral dissertations, etc.; b) the individual was used as the unit of
analysis, rather than the group; c) a product-moment correlation was
reported between some measure of job satisfaction and some performance
measure (thus excluding studies using various types of need satisfaction,
but including laboratory studies implementing task satisfaction and task
performance measures); and d) correlations were taken from the highest
level of aggregation when both subsample and total sample correlations
were reported in a study, as recommended by Pearlman et al. (1980) and
Hunter et al. (1982). For example, if a study reported a correlation
for the total sample and correlations for the sample moderated by race,
sex, self-esteem, etc., only the total sample E was recorded. How-
ever, those studies employing different samples of interest to the
present study (e.g., blue collar and white collar) provided a separate
r for each group.
A performance measure was defined here as any type of measure of
productivity (objective or subjective). Studies utilizing performance
measures based upon tardiness, absence, turnover, union grievances,
etc., were excluded from this analysis. In addition, studies which
did not provide the minimum necessary information to conduct the

16
meta-analysis (the sample size, the computed correlation, and the
specific nature of the satisfaction and performance measures) were re
jected.
The inclusion of several correlations from a single study does
suggest a lack of independence in the data. This observation has
been addressed by previous researchers (e.g., Smith & Glass, 1977;
Mabe & West, 1982). While its effect is to lead to some underestima
tion of the adjustment for sampling error, their prevailing assumption
appears to be that considerable amounts of information would be lost
if one were to average the often widely discrepant correlations within
a study to obtain a single index per study. However, Hunter et al.
(1982) assert that if total group correlations are not given, subgroup
~s should be averaged; the average ~ being used in the meta-analysis
with the total group sample size. Hunter et al. point out that this
average ~ will usually be smaller than the total group ~, had it been
reported.
In the present study, an attempt was made to achieve a balance
between these two opposing points of view regarding the averaging of
study correlations. In order to minimize the nonindependence of data,
satisfaction-performance correlations within a study were averaged
following the suggestion of Hunter et al. (1982), with the average value
being utilized in the meta-analytic procedures. However, this averaging
process was not employed when it would serve to confound the appropriate
codes for the nine study characteristics that would accompany that
correlation.
For example, Nathanson and Becker (1973) reported 23 satisfaction-

17
performance correlations for the same sample of 57 physicians,
"moderated" by several variables such as income, career goals, and
type of training received. These individual correlations did not
vary in terms of the codes they would have received for the nine study
characteristics, and were based upon various subgroups of the same
subject sample. Thus, they were averaged to yield a single correla
tion which was used in the present analysis. On the other hand, studies
such as Siegel and Bowen (1971), Sheridan and Slocum (1975), and Bhagat
(1981) reported sets of both static (both variables measured at time 1
or time 2) and cross-lagged (a variable measured at time 1 correlated
with the other variable measured at time 2, and vice versa) correlations
between satisfaction and performance. Averaging across all correla
tions in these studies would have resulted in a confounding of the ap
propriate coding for study characteristic #2 (the use of longitudinal
vs. cross-sectional measurement of performance relative to the measure
ment of satisfaction). Consequently, in such situations, an average
"static" correlation and an average "cross-lagged" correlation were
included in the meta-analysis, each with its separate set of nine coded
study characteristics.
Similar averaging of correlations within other studies yielded
the total sample of 217 product-moment correlations between measures
of satisfaction and performance. The mean number of correlations
included in the meta-analysis per study was 2.9; the maximum number
contributed by a study was 18. Table 1 summarizes the studies included
in the meta-analysis, and indicates those studies which were subject
to this averaging process.

18

Table 1. Summary of studies included in the meta-analysis
Investigationa
Abdel-Hamin (1980)
Arvey & Gross (1977)
Bagozzi (1978)
Baird (1976)
Bhagat (1981)
Bhagat (1982)
Brayfield (1944)
Brayfield & Mangelsdorf (1950)
Brayfield & Marsh (1957)
Breaugh (1981)
Brief & Aldag (1976)
Carlson (1969)
Cherrington, Reitz & Scott (1971)
Dipboye, Zultowski, Dewhirst & Arvey (1979)
Doll & Gunderson (1969)
Subjects
Salespeople
Female full-time homemakers and job holders
Industrial salesmen
8 jobs in state agency
Medical students
Managers
Female office employees
Plumber apprentices
Farmers in training
Research scientists
Nursing aides
Blue collar White collar
College students
Scientists and engineers Firefighters Clerical workers
Civilian scientists and navy enlisted
aReferences to this table are included in pages 83-88 herein.
N
123
116
161
167
32
104
231
55
50
112
77
254
90
222 73
264
195
b Note: * indicates that values included here represent averages of original reported study values.

Satisfaction measure
JDI (5 subscales)
MSQ short form (overall), global self-rating
8 item (specific facets)
JDI (5 subscales)
JDI (work, supervisor, coworkers)
JDS short form
Brayfield-Rothe Job Satisfaction Blank
Brayfield-Rothe Job Satisfac tion Blank
Brayfield-Rothe Job Satisfaction Blank
JDS (work and supervision)
JDI (work and supervisor)
Hoppock Job Satisfaction Blank
Semantic differential scales (specific facets)
Single item "work itself," MSQ short form (overall)
5 items (general satisfaction)
19
Performance Included criterion 'correlation(s)
Supervisor ratings 5 ~s (.00-.23)
Self-rated effectiveness .38
Dollar volume of sales .30
Supervisor ratings 5 ~s (.03-.23)*b
Problem and test scores .39, .38*
Supervisor ratings .35
Supervisor ratings .14
Supervisor ratings .20
Instructor ratings .11
Supervisor ratings 4 ~s (-.11-.24)*
Self-ratings, supervisor 4 ~s (-.20-.17) ratings
Supervisor ratings .17, .13
Score on laboratory task 8 ~s (-.03-.22)*
Self-ratings, supervisor 6 £s (.02-.35)* ratings
Supervisor ratings, -.09, .12 peer nominations

20

Table 1. Continued
Investigation
Dyer & Theriault (1976)
Gadel & Kriedt (1952)
Gavin & Ewen (1974)
Gould (1979)
Green, Blank, & Liden (1983)
Greene (1972 & 1973a)
Greene (1973b)
Greenhaus & Badin "Study II" (1974)
Griffin "Time 1" (1980)
Hackman & Lawler (1971)
Hall, Goodale, Rabinowitz & Morgan "Time 1" (1978)
Harding & Bottenberg (1961)
Heron (1954)
Inkson (1978)
Subjects
Managers
IBM machine operators
Semi-skilled airline employees
Administrative and managerial employees in public agency
Bank managers and staff
First-line managers
First-line managers
College students
Hourly manufacturing employees
Telephone employees in plant and traffic dept.
Operating level and supervisors in transportation ministry
Airmen
Bus conductors
Semiskilled and unskilled plant workers
N
392
193
471
134
100
142
62
61
88
208
153
376
144
93

Satisfaction measure
JDI (pay scale)
10 items (general satisfaction)
53 items (5 facets)
JDI (work scale)
JDI (work, supervision and coworkers)
Bullock's Scale of Job Satisfaction
Bullock's Scale of Job Satisfaction
1 item (overall task satisfaction)
Alderfer's ERG scale (satisfaction with job and supervision)
3 items (general satisfaction)
JDI (work scale)
Combination of 8 job facets
10 items (several facets)
JDI (5 subsca1es)
21
Performance Included criterion correlation(s)
Self-ratings -.21*
Supervisor ratings .08
Supervisor ratings 5 £s (.01-.31)*
Supervisor ratings .35
Supervisor ratings, -.01, .06, .05 $ value of over/ underages
Supervisor ratings .58
Peer ratings .21, .33*
Score on laboratory task .28, .33*
Average daily pro- -.13, -.04, -.26 ductivity index
Supervisor ratings .07, .08, .16
Self-ratings .22
Supervisor ratings and .26* rankings
Composite of supervisor .35 ratings, cash shorts, lates, gross earned
Supervisor ratings 5 £s (.08-.32)

22

Table 1. Continued
Investigation
Ivancevich (1978)
Ivancevich (1979)
Ivancevich (1980)
Ivancevich & Donnelly (1975)
Ivancevich & MCMahon (1982)
Ivancevich & Smith (1981)
Jacobs & Solomon (1977)
Joyce, Slocum & Von Glinow (1982)
Kesselman, Wood & Hagen (1974)
Kirchner (1965
Landy (1971)
Lichtman (1970)
Locke "Study II, III" (1965)
Subjects
Machine repair technicians Machinists
Construction engineers Contract engineers
Discipline engineers
Trade salesmen
Discipline engineers
Field sales representatives
Chemical salesmen and managers
First-line supervisors
Telephone company operators and draftswomen
Outdoor advertising salesmen
Engineers
Technical, first-line supervisors, middle managers
College Students
N
62 108
48 42
249
295
209
150
251
193
76
72
175
95
71 112

Satisfaction measure
MSQ (intrinsic and extrinsic) short form
MSQ (intrinsic and extrinsic) short form
MSQ (intrinsic and extrinsic) short form
20 items (6 specific facets)
MSQ (intrinsic and extrinsic) short form
MSQ (intrinsic and extrinsic) short form
JDI (5 subsca1es), Faces Scale
JDI (work scale)
JDI (5 subsca1es)
Brayfield-Rothe Job Satisfaction Scale
5 facets of satisfaction
17 items (general satisfaction)
JDI (work scale)
23
Performance criterion
Supervisor ratings, daily production records
Supervisor ratings
Individual cost ratio, scheduling index, grievance index
Efficiency index, route-coverage index
Control costs, quality citations, unexcused overtime, supervisor ratings
New accounts, orders per sales presentation
Supervisor ratings
Supervisor ratings
Supervisor ratings
Total sales points
Coworker ratings
Supervisor ratings
Success on laboratory task
Included corre1ation(s)
8 .E.s (. 13-.23) *
8 .E.s (.15-.24)*
.11, .12*
6 .E.s (.05-.22)*
4.E.s (-.35-.39)*
.06, .10*
6 .E.s (-.04-.19)
.08
5 rs (.18-.46)
.46
5 £s (-.02-.06)*
.21
.43, .41

24

Table 1. Continued
Investigation
London & K1imoski (1975)
Lopez (1982)
Subjects
Registered nurses
Full-time employed MBA students
N
153
579
Mlrvis & Lawler (1977) Bank tellers 160
Mossin (1949) Dept. store saleswomen 94
Motowid1o (1982) Sales representatives 92*
Nathanson & Becker (1973) Physicians 57
Oldham, Hackman & Pearce (1976) Clerical bank employees 201
O'Reilly & Roberts (1978) Naval aviation enlisted 301 personnel
Orpen (1974) South African factory workers 225
Orpen (1978) South African first-level 103 supervisors
Penley & Hawkins (1980)
Pierce, Dunham, & Blackburn (1979)
Podsakoff, Todor & Skov (1982)
Financial organization employees, some supervisors
Insurance employees
Supervisors, administrators in nonprofit organization
264
398
72

Satisfaction measure
JDI (work supervisor, coworker scales)
JDI (5 subscales), MSQ short form (overall, intrinsic, extrinsic)
6 items (intrinsic satis~ faction)
9 items (satisfaction with various job conditions)
7 items (pay satisfaction)
9 items (various facets)
JDS (pay, security, social, supervision) facet scores
JDI (work, promotion, superviSion, subscales), Faces Scale
Brayfield-Rothe Index of Job Satisfaction
Brayfield-Rothe Index of Job Satisfaction
JDI (5 subscales)
MSQ (intrinsic, extrinsic), Index of Organizational Reac
. tions (lOR) (work satisfaction)
JDI (5 subscales)
25
Performance criterion
Self-ratings, coworker ratings, supervisor ratings
Supervisor ratings
Shortages
Shopper ratings of skills and attitudes
Sales value, supervisor ratings, self-ratings
Peer ratings
Supervisor ratings
Supervisor ratings
Increase in error-free production
Supervisor ratings
Supervisor ratings
Supervisor ratings
Supervisor ratings
Included corre1ation(s)
5 ~s (-.17-.12)*
8 ~s (.08-.52).
.10
-.05*
4 ~s (- .11-.35)
.37*
4 ~s ( - . 17-- . 01)
4 ~s (-.19--.02)
.33*
.23*
5 ~s (-.05-.07)
.09, .20, .25*
5,rs (-.11-.39)

26

Table 1. Continued
Investigation
Porac, Ferris & Fedor (1983) "Study I & II"
Pritchard (1973) "Study I & tIt.
Schriesheim (1980)
Schriesheim & Murphy (1976)
Sheridan & Slocum (1975)
Siegel & Bowen (1971)
Spencer & Steers (1981)
Steers (1975)
Strauss (1966)
Stumpf & Rabinowitz (1981) and Stumpf (1981)
Sundstrom, Burt & Kamp (1980) "Study II & III"
Szilagyi (1980)
Tharenou & Harker (1982)
Subjects
Registered nurses Production employees
College students High school and college students
Managerial and clerical public utility employees
Social service organization employees
Managers Machine operators
MBA students
Technical and nontechnical hospital employees
First-level supervisors
Supervisory and ~onsupervisory engineering and scientific personnel
Business school faculty
Hospital clericals University secretarial, clerical, mechanical
Nonsupervisory clerical ememployees
Electrical apprentices
N
81 57
106 60
308
54
35 59
86
295
133
49
102
30 67
128
166

Satisfaction measure
Single item (general satisfaction with day's performance)
MSQ (1 pay item), JDI (pay scale)
JDI (supervision scale)
MSQ (global) short form
PNDQ (13 job facets) (liE is now" affective satisfaction responses)
2 items (satisfaction with individual, group performance)
JDS (general job satisfaction)
JDS (general job satisfaction)
Hoppock's Job Satisfaction Scale
JDI (work, pay, promotion, and coworkers scales)
Single item (general satisfaction)
JDI (work scale)
JDS (general satisfaction)
27
Performance criterion
Self-ratings
Number of units laboratory task completed
Self-ratings
Supervisor ratings
Supervisor ratings, % of standard production earned
Instructor rankings, grades earned
Supervisor ratings
Supervisor ratings
Self-ratings, peer ratings, supervisor ratings
Productivity, instruction evaluation, peer nominations, merit increases, supervisor ratings
Self-ratings, supervisor ratings
% of productivity standard
Supervisor ratings
Included corre1ation(s)
.72, .69
4 £s (-.21-.28)*
.15
-.09
4 £s (-.09--.25)*
4 £s (.03-.21)*
.17
.26
.19, .29*
18£s (-.05-.29)*
.12, .12
.07*
.11

28

Table 1. Continued
Investigation
Wanous (1974)
Wex1ey, Alexander, Greenawalt & Couch (1980)
Subjects
Telephone operators
College students employed part-time
N
80
194

Satisfaction measure
JDI (overall), MSQ short form (overall), summated with 2 items (overall)
MSQ (overall, intrinsic, extrinsic), JDI (work, supervision)
29
Performance measure
Supervisor ratings, quality/quantity indices
Supervisor ratings
Included correlation(s)
.12, .21*
5 !.s (.01-.25)

30
The following information was obtained from studies for each job
satisfaction-job performance correlation included in the analysis:
the sample size ~); the subject sample (e.g., typists, clerks, etc.);
the type of satisfaction measure utilized (e.g., the JDI, MSQ, etc.);
and the type of performance criterion measured (supervisor rating,
sales volume, etc.). In addition, for any studies which reported it,
the re1iabi1ities for the satisfaction and/or performance measures
were recorded. Only estimates of internal. consistency reliability
(e.g., Spearman-Brown, coefficient alpha, KR-20) were included for
use in the Hunter et al. (1982) corrections. Estimates of "test-
retest" or "inter-rater" reliability were excluded, as were satisfaction
performance correlations specifically noted to have been corrected for
attenuation, as this would result in correcting for this source of
variance twice (Hunter et a1., 1982). The 74 studies provided a total
of 63 satisfaction measure reliability estimates and 26 performance
measure estimates, which was judged to be an adequate sample for computa
tion of the Hunter et a1. (1982) corrections described below.
Each correlation coefficient was also coded on a set of nine dummy
coded study characteristics, the derivation of which has been pre
viously discussed. Because measurement conditions often varied within
a study (e.g., two types of samples or satisfaction measures were
utilized), a separate set of study conditions was coded ("0" or "1,"
as indicated below) for each correlation used in the meta-analysis.
There were six characteristics regarding the performance measure
employed: a) whether the performance measure was composite (1) or
unidimensional (0), as far as the number of aspects of performance

31
that were measured; b) the use of longitudinal (1) or cross-sectional
(0) measurement of performance in relation to the measurement of
satisfaction; c) measurement of the quality (1) or quantity (0) of
performance; d) the use of self-reports of performance (1) or other
sources (0) such as supervisor ratings or archival data; e) the use of
a performance measure developed specifically for experimental use (1)
or the use of data obtained by other means (0) such as organizational
archival data; f) the use of an objective (1) or subjective (0) performance
measure. Two characteristics relating to the nature of the satisfaction
measure utilized were coded: g) the measurement of a specific facet of
satisfaction (1) or general (global) satisfaction (0); h) the use of
a traditional (well-established) job satisfaction instrument (1) or an
instrument developed by the researcher for the study (0). Finally,
one characteristic pertaining to the general nature of the sample used
was coded: i) the use of white collar and/or professionals (1), or
blue collar workers (0). For each study characteristic, a "1" indicates
a condition which may be facilitative of a higher correlation between
satisfaction and performance than the alternative condition coded "0"
(based upon suggestions from the satisfaction-performance literature
discussed earlier), although in some cases, this assumption is de
batable.
When information about a study was insufficient to allow for
positive determination of a given characteristic, it was coded as a
"missing" value. Occasionally, a correlation was based upon both
alternatives of a coding category (most notably, the quantity vs.
quality distinction was blurred when performance measures were

32
"composites" of several indices of performance). In order to maintain
the interpretability of results, such cases were coded as missing
values (see Table 4 for percentages of missing values).
Statistical Analyses
In general, the data analysis consisted of two phases, similar to
that employed by Mabe and West (1982). The first phase resulted in
estimates of the population parameters of the distribution of observed
correlations. This mean and variance estimate was corrected for the
effects of sampling error and attenuation due to predictor and criterion
unreliability. These estimates were computed for both the total sample
and by type of satisfaction assessed. For the purpose of this study,
satisfaction measures will be denoted "x" and job performance measures
"y," although it should be noted that this assignment is arbitrary and
no direction of causality between the two variables is tmplied. The
second phase of the analysis consisted of a multiple regression analysis
of the coded study characteristics with the obtained effect sizes, bi
variate correlational analyses, and a chi-square analysis to determine
possible differences due to year of publication. Each of these phases
will be described in detail below.
Phase!: Estimation of population parameters
The estimation procedures followed those described by Hunter et al.
(1982) as appropriate for instances in which individual studies do not
provide sufficient information to correct each obtained correlation
individually for the effects of statistical artifacts. Instead, the

33
set of studies taken as a whole provides distributional information
about the artifacts, which necessitates the use of correction formulae
tailored to this type of situation (Hunter et al., 1982). Thus, for
each sample correlation ~) reported, the accompanying sample size
was obtained. However, because of the sporadic reporting of informa-
tion regarding the reliability of the job satisfaction ~x) and job
performance ~) measures used, information on these two indices was
compiled across studies.
The first step in Hunter et al.'s (1982) analysis consisted of
the creation of two variables, "a" and "k:"
a=~ - ~ and b = r.;_ A/~
Thus, ~ was computed for each estimate of the reliability of a job
satisfaction measure recorded ~x), and k computed for each estimate
~) of a job performance measure.
Second, using the obtained data from whichever studies provided
the information, the following means and variances were computed:
1) 2
~ and cra , using all of the compiled estimates of job satis-
faction reliabili ty ~), and
2) 2 k and 0b' using all of the compiled estimates of job per-
formance reliability ~).
In addition, as recommended by Hunter et al. (1982), the frequency-
weighted (i.e., sample size weighted) mean and variance (r and ~
2 or ) of the reported satisfaction-performance correlations ~), ""'JrL
were computed using the following formulae:

r -~
=
34
and
The third step in Hunter et a1. 's (1982) procedure involved cor-
recting the mean and variance of the distribution of observed corre1a-
tions for the effects of sampling error. To the extent that the total
sample size (of all studies combined) is large, one can assume that
there is little sampling error in the average correlation (Hunter et a1.,
1982). Thus, the mean correlation corrected for sampling error was
simply:
r = p ~ ~
However, the variance of this distribution of correlations can be as-
sumed to be considerably inflated by sampling error (Hunter et a1.,
1982). Therefore, the variance predicted by sampling error (02) e
was computed and then subtracted from the observed variance in cor-
relations (ri ) as follows: r ~
(K(l -- 2
2 !'FJ..) ) 2 cl (i 0 = and 0p = ~ N r ~ 2SY ~
where ~ is the number of correlations ~), and B is the total sample
size across all studies reporting correlations. This step thus
yielded estimates of the population parameters (p and 02 ) of
::sY.. P::sY.. the distribution of correlations between job satisfaction and job
performance.
The next step involved correcting these population estimates for
the attenuating effe.cts of unreliability in the predictor (job
satisfaction measures) and job performance criterion measures (Hunter

35
et al., 1982). These corrections involved the use of the ~ and k
distributions, developed earlier, to eliminate the systematic downward
bias in the average correlation and then to eliminate the variance
across studies due to variation in reliability of the two variables.
Thus, the estimated correlation between job satisfaction and job
performance, had the studies been done with perfect measurement (i.e.,
the estimated population correlation corrected for predictor and
criterion unreliability) was given by:
= P~ = !.~ Ptrue
The corresponding variance of this distribution (i.e., corrected for
both sources of measurement unreliability) was computed from the fo1-
lowing formula:
2 (JP
true =
2 (J P~
-2 -2 a b
A final adjustment of Hunter et al.'s (1982) procedure relevant to
the present case, as in the study by Mabe and West (1982), was the
correction of the estimated population correlation first for the effects
of unreliability in the job performance measures only, and second for
the effects of unreliability in the job satisfaction measures only.
These additional estimates are made in situations in which varying
measures of the same construct are used, which, therefore, are likely
to have varying re1iabi1ities (Hunter et al., 1982). The corrected
variance remains the same, while the mean correlation was corrected
for a) sampling error and unreliability in the criterion measure only:

36
and b) sampling error and unreliability in the predictor measure only:
This resulted in estimates of the population parameters for the
distribution of job satisfaction-job performance correlations in which
the reliability of the a) criterion and b) predictor measure is always
fixed at the average value for the population. Comparison of the three
population estimates, Pt ,P "t' and P d provided some indication rue cr1 pre
of the degree to which the use of varying satisfaction and performance
measures of somewhat varying reliabilities influenced the obtained
population estimate CPt ) (c.f., Mabe & West, 1982). To the extent rue
that these three estimates appear similar upon inspection, it may be
concluded that the use of measures of varying reliabilities has little
impact upon the magnitude of the mean correlation obtained across
studies (Hunter et al., 1982).
Because the particular type of satisfaction assessed (i.e., the
use of specific facet vs. general/global satisfaction measures) was
found to correlate significantly (~ = -.17, £ < .01) with the magni-
tude of satisfaction-performance correlation obtained for the total
sample (converted to ~-scores), it was decided to compute additional
sets of population estimates for subgroupings of correlations based
upon the type of satisfaction measured. The following nine subgroups
of satisfaction measures were identified by inspection of the data,
and these groups of correlations were analyzed separately via this

37
same set of Hunter et a1. (1982) formulae: a) pay, b) promotion,
c) supervisor, d) work, e) coworkers (primarily measured via the JDI);
f) intrinsic, g) extrinsic (primarily measured via the MSQ); h) JDI
and MSQ "overall" scores; and i) other (including global/general
satisfaction and miscellaneous). Corrections for attenuation for these
subgroups were based upon a) the entire distribution of performance
measure re1iabi1ities (£),'but b) only the distribution of estimates
of reliability for that particular satisfaction measure "type." In
most cases, this greatly reduced the number of appropriate satisfaction
2 measure reliability estimates, resulting in low variances for a (0 ). a
Phase II: Regression analysis £f study characteristics
The procedures followed in this phase of the data analysis were
similar to the meta-analytic techniques employed by Smith and Glass
(1977) and Mabe and West (1982). The dependent variables in this
analysis were the reported correlation coefficients between job satis-
faction and performance, converted to Fisher ~-scores. The independent
variables in this analysis were the nine coded study characteristics,
which had been dichotomously scored.
A chi-square analysis was performed to determine possible dif-
ferences in the magnitude of observed correlations ~-scores) over
decades of publication. Point-biserial correlation coefficients
were computed to determine the degree of association between each of the
nine study characteristics and the satisfaction-performance corre1a-
tions (converted to z-scores). In addition, intercorre1ations between
the nine study characteristics were computed.

38
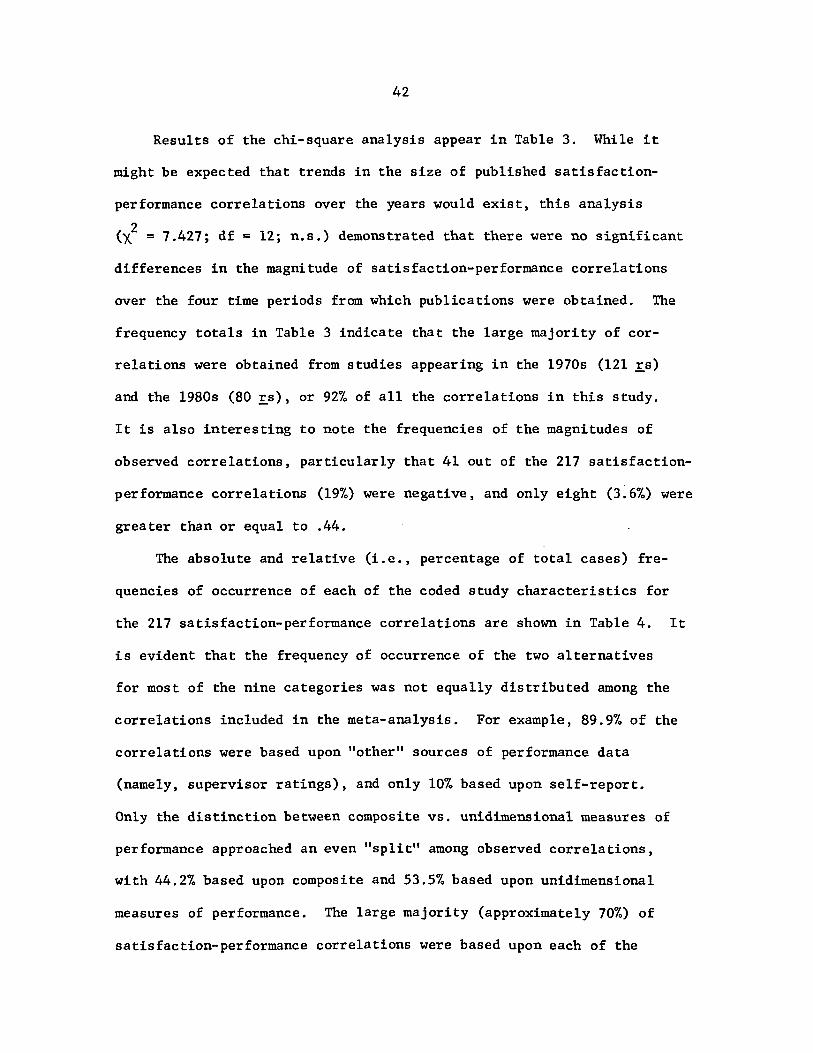
To determine the amount of variance in job satisfaction-performance
correlations that can be accounted for by these nine characteristics
of studies, a mUltiple regression analysis was performed, utilizing
simultaneous entry of the independent variables. Listwise deletion
of missing data was chosen (over pairwise), sacrificing some statistical
power in favor of greater interpretability of results. As in Mabe and
West (1982), residuals of this analysis were plotted as a check for
possible violations of the multiple regression assumptions of homo
scedasticity and linearity.
Low ~s prevented computation of a separate multiple regression
analysis for each of the nine previously identified satisfaction
"types." Therefore, bivariate correlations (point-biserial) between
satisfaction-performance correlations ~-scores) and eight of the nine
coded study characteristics were computed for each of the nine satis
faction type subgroups. Study characteristic #7 (the use of facet vs.
general/global satisfaction) was omitted from this final correlational
analysis, since the post-hoc classification of correlations into nine
satisfaction measure subgroups was simply an elaboration of this study
characteristic.

39
RESULTS
Table 2 summarizes the results of the Hunter et al. (1982) cor-
rections for both the total sample of observed satisfaction-performance
correlations and those reanalyzed by satisfaction type. The frequency
(sample-size)-weighted average correlation between performance and
satisfaction of all types ~) was found to be .146; the corresponding
variance of this distribution of observed correlations (a2 ) was .029. r ~
The number of correlations and total subject sample size upon which the
corrections are based are shown in columns two and five of Table 2.
Column six indicates the variance in correlations that would be pre-
dicted by sampling error 2 i.e. , the result of having less (a ), as than ~
infini te sample sizes. In the total sample, this value was computed
to be .017.
The final two columns present the culmination of the Hunter et al.
(1982) procedures - estimates of the population parameters for the
distribution of satisfaction-performance correlations. Based upon
these computations, the estimated "true" correlation tPt ) between rue
performance and (all types of) satisfaction measures, corrected for
the effects of sampling error and attenuation due to unreliable measure-
ment of both satisfaction and performance, is .17, with a variance
(a~ ) of .016. true
Values of the frequency-weighted mean observed correlation for
the satisfaction subgroups were based upon much smaller samples of
correlations, and nonindependent subject samples (due to the inclusion
of more than one correlation from several individual studies). The
Tab
le
2.
Ave
rage
o
bse
rved
co
rrela
tio
ns
and
esti
mat
ed p
op
ula
tio
n v
alu
es
Sati
sfacti
on
ty
pe
Pay
Pro
mo
tio
n
Su
per
vis
or
Wor
k
Cow
orke
rs
Intr
insi
c
Ex
trin
sic
JDI
& M
SQ
"ov
era
ll"
Oth
er
(e.g
.,
glo
bal
)
To
tal
sam
ple
fF r
s ~
25
18
21
35
20
18
17 9
54
217
r ~
.054
.123
.162
.17
5
.102
.196
.149
.247
.15
5
.146
2 N
ote
: V
alue
s fo
r P
and
0 tr
ue
P t ru
e
(i r -~
.02
0
.015
.036
.037
.02
1
.023
.035
.019
.025
.029
To
tal
stu
dy
sa
mpl
e si
ze
3,6
09
3,1
70
3,6
30
5,0
61
3,0
37
2,0
96
2,2
05
1,5
34
5,4
72
12
,19
2
2 <1e
pre
dic
ted
by
sa
mp
lin
g e
rro
r
.007
.005
.005
.006
.006
.007
.00
7
.005
.009
.017
Ptr
ue
.062
.145
.186
.207
.123
.230
.175
.286
.185
.172
02 P tr
ue
.01
7
.01
3
.041
.043
.02
1
.019
.039
.018
.023
.016
have
bee
n c
orr
ecte
d
for
sam
pli
ng
err
or
and
att
en
uati
on
due
to c
rite
rio
n a
nd
pre
dic
tor
un
reli
ab
ilit
y,
usi
ng
th
e H
un
ter
et
a1.
(198
2)
form
ula
e; ran
d
-~
0; re
pre
sen
t fr
equ
ency
-wei
gh
ted
o
bse
rved
val
ues
. --
:!Y
.j:-o
o

41
average observed correlations cr ) for subgroups ranged from .05 (for --:!.Y
pay satisfaction) to .24 (for "overall" job satisfaction assessed by
the JD1 and MSQ), with variances ranging from .015 to .037. After cor-
recting for the three sources of error variance (sampling error, and
predictor and criterion unreliability), the estimates of the mean cor-
relation (p ) for these subgroups ranged from .06 (pay satisfaction) true
to .28 (JD1 and MSQ "overall"), with corrected variances (ri ) Ptrue
ranging from .013 to .043.
To assess the effect that the use of varying measures of job
satisfaction and job performance (having varying reliabilities) had on
the estimated population correlation, values for P . and P d were crl.t pre
computed for the total sample and found to be .15 and .16, respectively.
These values represent estimates of the population correlation cor-
rected for a) sampling error and criterion (performance) unreliability
only, and b) sampling error and predictor (satisfaction) unreliability
only. These values are not substantially lower than the estimated total
sample mean correlation corrected for all three sources of variance
(pt ), which was .17. This suggests that the use of various satisrue
faction or performance measures (having presumably somewhat differing
re1iabi1ities) across studies had little impact upon the mean "true"
correlation that was obtained here (.17). Values for p . and P d crl.t pre
were not computed for each of the individual satisfaction subgroups
because the re1iabi1ities of measures of the satisfaction construct
utilized within these subgroups were relatively homogene.ous, as evi-
denced by extremely small variances in subgroup satisfaction re-
liabilities ~xx).
42
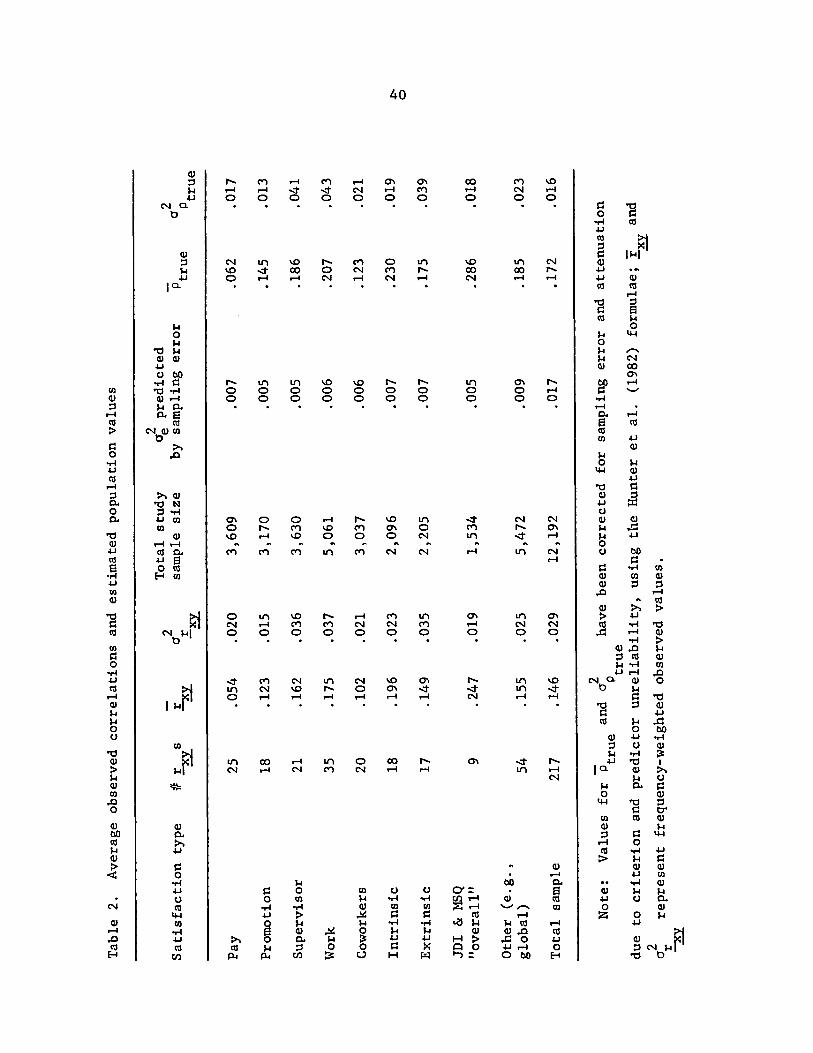
Results of the chi-square analysis appear in Table 3. While it
might be expected that trends in the size of published satisfaction-
performance correlations over the years would exist, this analysis
2 (X = 7.427; df = 12; n.s.) demonstrated that there were no significant
differences in the magnitude of satisfaction-performance correlations
over the four time periods from which publications were obtained. The
frequency totals in Table 3 indicate that the large majority of cor-
relations were obtained from studies appearing in the 1970s (121 ~s)
and the 1980s (80 ~s), or 92% of all the correlations in this study.
It is also interesting to note the frequencies of the magnitudes of
observed correlations, particularly that 41 out of the 217 satisfaction-
performance correlations (19%) were negative, and only eight (3.6%) were
greater than or equal to .44.
The absolute and relative (i.e., percentage of total cases) fre-
quencies of occurrence of each of the coded study characteristics for
the 217 satisfaction-performance correlations are shown in Table 4. It
is evident that the frequency of occurrence of the two alternatives
for most of the nine categories was not equally distributed among the
correlations included in the meta-analysis. For example, 89.9% of the
correlations were based upon "other" sources of performance data
(namely, supervisor ratings), and only 10% based upon self-report.
Only the distinction between composite vs. unidimensional measures of
performance approached an even "split" among observed correlations,
with 44.2% based upon composite and 53.5% based upon unidimensional
measures of performance. The large majority (approximately 70%) of
satisfaction-performance correlations were based upon each of the

43
Table 3. Frequencies of observed correlations by year of publication
Year of publication Prior to 1960- 1970- 1980-
Observed correlation 1960 1969 1979 1983 Total
r < .00 1 ~
1 22 17 41
.00 < r -~
< .18 3 3 42 31 79
.18< r < .30 1 3 41 17 62 - """E
.30< r < .44 1 --l£l
2 13 11 27
r > .44 Q 1 _3 -li ~ """E -
Total 6 10 121 80 217
2 = 7.427, df = 12, n.s. X

44
Table 4. Frequency of occurrence of coded study characteristicsa
Characteristic
A. Performance:
1) Composite Unidimensional
2) Longitudinal Cross-sectional
3) Quality Quantity
4) Self-report Other sources
5) Developed for experimental use Archival data
6) Objective Subjective
B. Satisfaction:
7) Specific facet General/global
8) Traditional instrument Experimenter developed
C. Sample:
9) White collar Blue collar
Absolute Relative % missing frequency frequency (%) cases
96 116
61 152
96 47
22 195
152 56
57 150
172 41
158 57
169 44
44.2 53.5
28.1 70.0
44.2 21. 7
10.1 89.9
70.0 25.8
26.3 69.1
79.3 18.9
72.8 26.3
77.9 20.3
2.3
1.8
0.0
4.1
4.6
1.8
0.9
1.8
aN = 217 satisfaction-performance correlations.
bThe large number of missing cases here is due to the coding as "missing" those performance measures which combined both aspects into one summary index.

45
following characteristics: cross-sectional measurement; performance
data provided by others; performance measures developed specifically
for experimental use; subjective performance appraisal information;
traditional job satisfaction measures; the assessment of job satis
faction with specific facets of work; and primarily white collar workers
and professionals as subjects.
Table 4 also provides an indication of the percentage of correla
tions coded as missing cases for each of the nine study characteristics.
The labeling as "missing" indicates that the information could not be
reasonably determined from the details provided within the study. How
ever, in the case of study characteristic #3 (the use of measures of
quality vs. quantity of performance), this information ~ usually
available, but could not be meaningfully coded as one of the two
alternatives because both aspects of performance were inherent in the
measure(s) utilized. For example, Wanous (1974) reported several
correlations between overall job satisfaction and performance, in
which the performance measure consisted of a composite of supervisor
ratings and company indices of both quantity and quality of performance.
These correlations were included in the analysis, but were coded as a
missing value on characteristic number three (quality vs. quantity) be
cause they were based upon both coding alternatives, and thus were
contaminated.
The intercorrelations among the nine coded characteristics are
presented in Table 5. Three study characteristics: a) the nature of
the subject sample utilized; b) the use of self-report vs, performance
data obtained from others; and c) the use of traditional vs. experimenter-

Tab
le 5
. In
terc
orr
ela
tio
ns
amon
g n
ine
code
d st
ud
y c
hara
cte
rist
icsa
,b
Ch
ara
cte
rist
ic
2 3
4 5
6 7
8 9
A.
Per
form
ance
:
1)
Com
posi
te v
s.
-.3
3*
.4
2*
.0
0
.43*
-.
52
*
-.0
7
.11
-.0
4
Un
idim
ensi
on
al
2)
Lo
ng
itu
din
al v
s.
-.4
4*
-.
11
-.
62
*
.47
*
.05
-.
07
.1
0
Cro
ss-s
ecti
on
al
3)
Qu
alit
y v
s.
.04
.4
4*
-.7
8*
-.
20
*
-.0
6
.04
Q
uan
tity
4)
Self
-rep
ort
vs.
.1
4*
.0
0
-.0
8
-.1
1
.12
O
ther
in
form
atio
n s
ou
rces
5)
Dev
elop
ed f
or
exp
erim
enta
l u
se v
s.
-.4
6*
-.
17
*
-.2
3*
-.
03
A
rch
ival
dat
a
6)
Ob
ject
ive
vs.
.2
0*
-
.11
.0
3
Su
bje
ctiv
e
B.
Sati
sfacti
on
:
7)
Sp
ecif
ic
facet
vs.
.2
5*
.2
0*
G
ener
al/g
lob
al
8)
Tra
dit
ion
al
inst
rum
ent
vs.
.0
4
Ex
per
imen
ter
dev
elo
ped
C.
Sam
ple:
9)
Whi
te co
llar
vs.
B
lue
co
llar
a S
ampl
e si
zes
ran
ge
from
13
9 to
21
7 du
e to
miss~ng
data
.
b For
eac
h c
hara
cte
rist
ic,
the
firs
t alt
ern
ati
ve li
sted
has
b
een
cod
ed a
s "1
" an
d th
e se
cond
alt
ern
ati
ve
code
d as
"0
."
*.£
< .
05
.
~
(j\

47
developed satisfaction instruments; (#4, 8, 9) ~pear to be relatively
independent of the other characteristics, as demonstrated by the
fact that they each were significantly intercorrelated with only one or
two of the other eight study characteristics. However, several of the
other characteristics were highly intercorrelated. For example, the
occurrence of characteristic #5 (the use of archival vs. experimental
performance data) was significantly (~ < .05) related to the occurrence
of all of the other characteristics except #4 (the use of self-report
vs. other information). Characteristics #3 (quality vs. quantity) and
#6 (objective vs. subjective) were each significantly ~ < .05) cor
related with the use of composite vs. unidimensional criteria, longi
tudinal vs. cross-sectional measurement, archival vs. experimental
data, and the use of specific facet vs. general/global satisfaction.
In addition, these two characteristics (#3 and #6) were highly cor
related with each other ~ = -.78, £ < .05), suggesting that the
inclusion of both of these characteristics in the coding of studies
was redundant.
One other result suggested by the set of intercorrelations stems
from the fact that some of the characteristics would be expected to
have been related. For example, characteristics #3 (quality-quantity)
and #5 (archival-experimental), and #5 and #6 (objective-subjective)
should be related, since archival data are often "hard" objective,
quantitative information, such as the number of units produced. Thus,
the significant correlations among these characteristics may be taken
as some indication of consistency in the actual coding process.
Table 6 summarizes the results of the multiple regression analysis
48
Table 6. Bivariate and squared multiple correlation between nine coded study characteristics and observed satisfactionperformance corre1ationsa ,b
Study characteristicC
1. Composite vs. unidimensional
2. Longitudinal vs. cross-sectional
3. Quality vs. quantity
4. Self-report vs. other sources
5. Experimental use vs. archival data
6. Objective vs. subjective
7. Specific facet vs. general/global
8. Traditional instrument vs. developed for experimental use
9. White collar vs. blue collar
R2 = .137
F = 2.218 <.2 < .025)
r
-.02
-.09
.05
.10
.11
.08
-.18
-.13
.09
a! = 135 due to 1istwise deletion of missing cases.
b Correlations converted to ~-scores for this analysis.
cFor each characteristic, the first alternative listed has been coded as "1," the second alternative as "0." The first six characteristics refer to performance measures, number seven and eight refer to satisfaction measures, and characteristic nine refers to sample utilized.

49
of observed satisfaction-performance correlations (converted to Fisher's
~-scores) with the nine coded study characteristics. Due to the dele
tion of cases for which data on any of the nine characteristics were
missing, the sample size for this analysis was reduced from 217 to 135.
Visual inspection of the plotted residuals of this analysis detected
no deviations from the regression assumptions of linearity and homo-
scedasticity.
A significant squared mUltiple correlation was obtained ~2 = .137,
~ < .025), indicating that the nine characteristics were able to ac-
count for approximately 14% of the variance in satisfaction-performance
correlations. Because of mu1tico1inearity among the predictors (Table 5),
an attempt to interpret beta weights to assess the relative predictive
contributions of each of the nine individual study characteristics is
not possible (Darlington, 1968). Consequently, they have been omitted
from Table 6 and bivariate (point-biserial) correlations between the
~-scores and each of the nine study characteristics have been presented
to provide some indication of the nature of these individual relation
ships. Clearly, the assessment of specific facet vs. general/global
satisfaction is the characteristic most highly related to observed
satisfaction-performance correlations ~ = -.18), indicating that
higher correlations were obtained when general or global satisfaction
measures were utilized.
Because the type of job satisfaction assessed appeared to moderate
the size of satisfaction-performance correlations obtained, the total
sample of satisfaction-performance correlations (transformed to ~-scores)
was divided into the previously described nine satisfaction "types."

50
The correlations (point-biserial) between ~-scores and eight of the
nine study characteristics were then recomputed for each of the nine
subgroups of satisfaction type. The ninth study characteristic, spe
cific facet vs. global satisfaction, was omitted from this analysis
since the creation of nine satisfaction "type" subgroups was an
elaboration of this variable. Results of this analysis appear in
Table 7.
It should be noted that many of the cells of Table 7 have small
ns due to this division into satisfaction type subgroups, and that
some of the correlations could not be computed due to a lack of
variance in the study characteristics for that particular satisfaction
category. Nevertheless, Table 7 does present some interesting re
sults.
Higher performance-supervision satisfaction correlations were
significantly related (£ < .05) to a) the use of composite measures
of performance, b) measures of the quality of performance, c) informa
tion specifically obtained for experimental use, and d) performance
data based upon subjective information. Significantly higher (.E, < .05)
performance-pay satisfaction correlations were obtained a) under
longitudinal measurement conditions, and b) using performance data ob
tained from others. Higher (.E, < .05) performance-satisfaction with
promotion correlations were observed with the use of data regarding
the quantity of performance. Observed performance-satisfaction with
coworkers correlations were significantly (.E, < .05) higher under the
conditions of a) the use of quantity of performance, and b) performance
data obtained from others.

51

Table 7. Correlations between observed satisfaction-performance correlations and coded study characteristics by type of satisfaction measureda,b,c
Observed correlations for nine satisfaction "types"
Pay Promotion Supervision
Characteristic
A. Performance:
1) Composite vs. Unidimensional
2) Longitudinal vs. Cross-sectional
3) Quality vs. Quantity
4) Self-report vs. Other sources
5) Developed for experimental use vs. Archival data
6) Objective vs. Subjective
B. Satisfaction:
8) Traditional instrument vs. Experimenter developed
C. Sample:
9) White collar vs. Blue collar
-.04 (25)
.33* (25)
-.34 (17)
-.44* (25)
-.32 (25)
.08 (25)
-.03 (25)
.07 (25)
-.04 (18)
.11 (18)
-.60* (12)
-.06 (18)
.35 (18)
-.05 (18)
-.05 (18)
Note: Correlations which cannot be computed due to lack of variance have been omitted.
aCorrelations converted to ~-scores for this analysis.
.43* (20)
-.35 (20)
.59* (10)
-.14 (21)
.49* (20)
-.48* (20)
-.23 (21)
.14 (21)
bFor each characteristic, the first alternative listed has been coded as "1" and the second alternative coded as "0."
CBs (in parentheses) vary due to missing data.
*.£ < .05.

Work Coworkers
-.16 -.11 (34) (19)
- .08 .14 (34) (19)
-.22 -.61* (21) (9)'
.00 -.37* (35) (20)
.07 -.04 (34) (19)
.02 .27 (34) (19)
-.06 -.18 (35) (20)
.15 .04 (34) (20)
52
Observed correlations for nine satisfaction "types" Intrinsic Extrinsic JDI &
.39* .44* (18) (17)
-.28 -.36 (18) (17)
.35 .52* (11)' (16)
-.21 -.04 (18) (17)
.23 .16 (18) (17)
-.37 -.45* (18) (17)
.00 (18)
-.04 -.17 (18) (17)
MSQ "overall"
-.52 (9)
.30 (9)
- .11 (9)
-.48 (9)
.48 (9)
-.30 (9)
-.10 (8)
Other (e.g. , global)
.20 (52)
-.06 (53)
.05 (34)
.48* (54)
.08 (48)
-.09 (47)
.01 (52)
.15 (52)

53
MOving from the satisfaction types primarily assessed by the JDI
to those assessed by the MSQ, Table 7 shows that correlations ob-
tained between performance and intrinsic satisfaction were significantly
higher (~ < .05) when composite measures of performance were utilized.
This same result holds for correlations between performance and ex
trinsic satisfaction. In addition, extrinsic satisfaction-based cor
relations were significantly higher ~ < .05) when based upon a) quality
of performance, and b) subjective performance data.
The only other significant relationship obtained from this
analysis involved satisfaction-performance correlations based upon
general or global job satisfaction. These correlations differed from
those of other satisfaction types in that they were significantly
higher ~ < .05) when self-report performance data were utilized.
It is interesting to note that the type of subject sample in
volved and the use of traditional vs. "homemade" satisfaction instru
ments were not significantly related to the obtained satisfaction
performance correlations under any type of satisfaction. Similarly,
satisfaction-performance correlations involving satisfaction with work
(via the JDI) and correlations based upon JDI or MSQ "overall" scores
failed to show significant relationships with any of the eight study
characteristics. It should also be noted that there were no study
characteristics that were consistently related to the satisfaction
performance correlations as a function of satisfaction type. Certain
study characteristics were paired with certain satisfaction types,
but no pervasive pattern among the characteristics was identified.

54
Summary
To briefly summarize the results obtained here, the mean observed
(frequency-weighted) correlation between job satisfaction and job
performance was computed to be .146, with a variance-of .029. When
corrected for the effects of sampling error and measurement un-
reliability, this correlation increased to .17 and its corresponding
variance decreased to .016. Similar population estimates were also
obtained using the type of job satisfaction assessed as a subgrouping
variable; these corrected correlations ranged from .062 to .286 and
variances ranged from .013 to .043. Approximately 14% of the variance
in observed satisfaction-performance correlations could be explained
by nine study characteristics, 1I!9~L!lQtabl¥ __ ~he as~essment~~_s!>~c:~~ic
facet vs. global job satisfaction. Although several of the study
characteristics were intercorrelated, significant relationships were
noted between these measurement/methodological characteristics and the
magnitude of correlations obtained between performance and various types
of job satisfaction.

55
DISCUSSION
Perhaps the most immediately striking result of this analysis is
the remarkable correspondence between the (uncorrected) frequency-
weighted mean correlation (r ) obtained here and that reported by 'EL
Vroom (1964). Based upon the twenty estimates available at the time,
Vroom reported the mean correlation between job satisfaction and job
performance to be +.14. Those who have rebuffed Vroom's 1964 conclusion
may find it disconcerting that twenty years and at least 200 satisfaction-
performance correlations later, the average correlation was found here
to be nearly the same (+.146). Despite such psychometric and
methodological advances as the development of refined measures of job
satisfaction (e.g., the JDI), the recognition of the need to utilize
larger subject samples, and the increased use of longitudinal designs,
the results of psychologists' dogged efforts to obtain high satisfaction-
performance correlations have, on the average, not been more fruitful
than those attempts reviewed by Vroom. Results of the chi-square analysis
echo this conclusion, in that there were no significant differences in
the magnitude of observed satisfaction-performance correlations over
the four time periods examined (prior to 1960, 1960-1969, 1970-1979,
and 1980-1983). The standard deviation of this distribution of cor
relations (02 = .029; SD = .17), however, indicates that there is r ~
some sizable variability between studies in the correlations obtained.
Hence, conclusions drawn from these results would necessarily be less
precise than had the observed variance (02
) been virtually zero. r """2SY

56
The Estimated Population Parameters
Although it was anticipated that the application of the Hunter et ale
(1982) corrections for the statistical artifacts of sampling error and
measurement unreliability would have a large impact on the estimate
derived for the population (pt ) correlation and yield a negligible rue
residual variance (02 ), such was not the case. The overall Ptrue
population correlation estimate of .17 was not substantially higher
than the simple frequency-weighted mean observed correlation of .146;
however, the variance of this distribution was reduced to half its
size as a result of these corrections (from .029 to .016).
Since these estimates represent the removal of the effects of
only three of the seven potential sources of error variance, the logic
behind Hunter et al.'s (1982) form of meta-analysis would suggest
that this remaining variation is the result of the effects of a) range
restriction, b) criterion contamination and deficiency, c) factor struc-
ture differences between different measures of the constructs, and
d) computational and typographical errors in the original sources (c.f.
Schmidt & Hunter, 1977; Hunter et al., 1982). Each of these remaining
potential sources of error variance will be considered below. In ad-
dition, it should be noted that some (or all) of this residual variance
may be due to true variance across situations in the satisfaction-
performance correlation (i.e., some degree of situational specificity
may exist). This possibility will be addressed further in the context
of the multiple regression results.
The effect of range restriction on the values obtained for the

57
population correlation estimates is potentially large. To the extent
that the variation in a variable (in this case, job performance) is
less in a study sample than in the population as a whole, the ob-
tained study correlation will be systematically smaller than that in
the reference population (Hunter et al., 1982). It is likely that at
least some restriction in the range of job performance scores occurred
in every study included in the present analysis, due to the fact that
job incumbents usually served as subjects. Those employees who receive
poor performance ratings are typically not retained and, thus, scores on
the job performance measures included here can probably be assumed to
have not represented the full range of performance levels.
While the Hunter et al. (1982) procedures do provide adjustments
for this source of error variance, the information required (i.e., the
study and reference population variances for the performance measure)
to make these corrections was not available in the studies reviewed.
Thus, the magnitude of the impact of range restriction on the population
estimates derived here cannot be assessed, although it is believed that
the application of this correction would have accounted for a substan
tial portion of the residual variance and would have increased the
population correlation estimates somewhat.
The second remaining uncorrected source of error variance is the
existence of criterion contamination and deficiency. Again, this
potential influence cannot be ruled out in 'the case of the present
analysis. Supervisory ratings were utilized for more than half (ap
proximately 60%) of the correlations included here; however, various
aspects of performance were rated in each study. Although some effort

58
was made to exclude correlations which were based upon performance
aspects irrelevant to this review (such as attendance, lateness,
etc.), many studies described only the general factors on which
ratings were based (e.g., quality, attitude, quantity, etc.) and did
not list the individual items which were rated. Thus, some extraneous
items may have been included, or conversely, some specific areas of
performance may have been overlooked which ideally should have been
assessed. Similar contamination or deficiency could have occurred in
the assessment of job satisfaction. As in the case of range restric
tion, this source of error variance represents a viable potential
determinant of the results obtained here. However, no specific
procedures presently exist in the Hunter et a1. (1982) repertoire which
would allow for the quantification of this effect.
Error variance due to factor structure differences (between
varying measures of the satisfaction construct) is not believed to be
of much importance in the present review. The formation of satis
faction "type" subgroups created sets of correlations which were
relatively homogeneous with respect to satisfaction measure utilized
(e.g., the JDI "pay" scale, MSQ "extrinsic"). Consequently, the popula
tion estimates derived for these subgroups would not be expected to
have been influenced much by factor structure differences (within
subgroups). However, there was not much difference between the size of
the residual variance estimates obtained for the satisfaction sub
groups (having assumedly similar within-group factor structures) and
that obtained as an overall variance estimate (potentially based upon
various factor structures). Although the comparability of some of the

59
JOI and MSQ subsca1es has been questioned (Gillet & Schwab, 1975),
this source of error variance was probably not responsible for much of
the remaining variation. Similar to the case of error due to criterion
contamination/deficiency, the potential for factor structure differences
also exists in the various performance measures used by the studies
included, and was not controlled for or assessed in any way.
The final source of error variance identified by Schmidt and
Hunter (1977) and unassessed in the present study is the existence of
computational and typographical errors in the original research. Once
again, this is a potential source of variation not to be completely
discounted. While some attempt was made to minimize the problems
caused by poor quality research (by concentrating the data collection
process on well-respected academic journals), no journal or researcher
is without an occasional typographical or computational error. Such
effects have been judged to be important (Hunter et a1., 1982), but
unfortunately cannot be directly assessed without access to original
raw data.
In all, the potential impact of these four uncorrected sources
of error variance is difficult to estimate. However, it is speculated
that it may have been substantial and thus would partially explain
the rather large population variance estimates and the small values
obtained for the population correlation. Nevertheless, the utility
of these estimates is not diminished, in that they are closer ap
proximations to the theoretical "true" relationship than have pre
viously been available. They are also of more practical utility for
the researcher/practitioner than would be estimates which repre-

60
sented an idyllic, yet unattainable state of affairs (i.e., when all
sources of error variance have been controlled for).
A Nuance of the Variance Correction Procedure
Careful inspection of the results of the Hunter et al. (1982) cor-
rections presented in Table 2 will reveal that for some of the satis
faction subgroups, the population
larger than the original observed
Intuitively, one might not expect
variance est~tes (~true) are
variances (cr ) in correlations. r ~
this to be the case, since classical
measurement theory maintains that observed variance is a result of true
variance plus that due to error. It is precisely this dictum upon
which the logic of Hunter et al.'s meta-analysis is based. Thus, the
result of these corrections, in which systematic sources of error variance
are removed from the observed variance, would be presumed to be the
"true" population variance.
In the present analysis, however, these calculations did not al-
ways result in a lower value for the true variance relative to that ob-
tained for the observed variance. This is due to the nature of the
correction formulae and the information which was available in the
studies aggregated. Specifically, the resultant cr~true is a function
of several factors such as the number of correlations, the subject
sample size, the mean observed and true correlations, and the mean and
variance of the reliability estimates for satisfaction and performance
(c.f., the of formula, p. 35). Because the estimates were Ptrue
measures
computed for satisfaction subgroups, the means and variances G[ and

61
cr2) of reliability estimates only for measures of that satisfaction a
type were utilized. In some cases, this reduced the number of satis-
faction reliability estimates to only four or five and resulted in
very low variances in reliability (cr2) . .!!
For example, computations for the third satisfaction subgroup,
"satisfaction with supervision" were based upon six estimates of
satisfaction with supervision reliability, having a high mean reliability
(.92) and a very small variance (.0003). All other values in the cor-
rection equation held constant, the effect of such a relatively low
variance in reliability estimates would be to increase the size of the
population variance (cr2
), over the value which would be obtained Ptrue
had a greater number of reliability estimates been available (and thus
likely also a greater variation).
A cursory check on the reliability means and variances utilized
for the other satisfaction subgroups revealed similar circumstances
for all of the other instances where "true" variances appeared to
increase after corrections (i. e., for "work" and "extrinsic" satis-
faction subgroups). Thus, the counterintuitive values obtained here
for some of the population variance estimates are the result of
nuances in the correction procedure rather than miscalculations in
the Hunter et a1. (1982) methodology.
The Impact of Study Characteristics
Given that the variance remaining after the Hunter et a1. (1982)
corrections was not insignificant, the search for. potential moderators

62
which might explain this variability would be judged appropriate, even
by those who believe such practices ordinarily are unnecessary (i.e.,
Hunter et al.). Yet, the results of the regression analysis were
rather disappointing in that the nine study characteristics accounted
for a statistically significant (e < .025), but not substantial, por-
tion of the variance in satisfaction-performance correlations. To-
gether, these nine characteristics of a study are only modestly related
to differences in effect sizes between studies. And when viewed singly,
these methodological/measurement aspects, many of which have been as-
surned to be important determinants of the magnitude of observed
satisfaction-performance relationships, were found to be of little
consequence (c.f. Table 6).
2 Several points need to be made regarding this modest ~ = .137)
relationship between the study characteristics and observed correla-
tions. First, eight of the nine study characteristics were not evenly
distributed in terms of the occurrence of the two coding alternatives
(e.g., for characteristic #4, 89.9% of the correlations were based
upon "other" sources of performance data and only 10% based upon the
alternative "self-report"). This skewness in the predictor variables
would be expected to create a decrease in the R2 value obtained. Had
their occurrence been more evenly distributed throughout the studies
included here, these particular study characteristics may have ac-
counted for more of the variation in observed correlations.
Secondly, when the regression results are taken at face value,
they suggest that these nine characteristics of a study have little
systematic relationship with the size of the satisfaction-performance
63
correlation that will be obtained. This conclusion may seem counter
intuitive because many of these study characteristics (such as type of
subjects utilized or the use of longitudinal designs) have been as
sumed to be important in determining satisfaction-performance cor
relations. However, it may be that the variance in satisfaction
performance correlations is mainly due to error (i.e., the other four
sources of error variance identified by Schmidt and Hunter, 1977, for
which corrections were not made) and not due much to any systematic
differences between studies in the way the two variables are measured
or the way the study is designed •
. Third, it is conceivable that there are systematic relationships
between other study characteristics, not examined here, and the ob
served satisfaction-performance correlations. As was noted earlier,
the nine coded characteristics were developed on the basis of several
criteria, one being the feasibility of coding. It is certainly possible
that variables such as the existence of technological constraints may
restrict the relationship that will be observed between job satis
faction and productivity. However, with past and current journal
reporting practices, such information is typically not available
from individual studies and, thus, the impact of these variables could
not be assessed here.
Substantive Implications
The results reported here will hopefully serve as a valuable
reference for researchers and practitioners alike. The values for the

64
population parameters, derived via the Hunter et al. (1982) procedures,
represent the best available estimates of the true relationship
between job performance and various operationalizations of job satis
faction. However, the distinction should be made between that which
is theoretically possible and that which is practically attainable.
These population estimates are theoretical in that they delineate
the relationships which would be observed if infinite sample sizes
and perfectly reliable measurement were possible. In practice, of
course, neither of these ideals can be achieved, and consequently,
the results of the Hunter et ale (1982) corrections must be viewed
with this in mind. This fact does not, however, diminish the utility
of these estimates.
The conclusion that job satisfaction and job performance are only
slightly related has grave practical implications. The ideals of high
job satisfaction and high productivity are both valued in our society,
and attempts are continually being made to design work in such a way as
to jointly achieve these goals. Indeed, both management and union
representatives generally endorse the notion that greater productivity
would result if workers were more satisfied (Katzell & Yankelovich, 1975).
Thus, the finding that these two variables are not highly correlated
calls into question the assumptions implicit in our organizational
programs and policies, our research endeavors, and even in the ex
pectations of those who review the satisfaction-performance litera-
ture.
Katzell and Yankelovich (1975) exemplify this implicit assumption
in their review of policy-related satisfaction-performance research.

65
Their intention was to determine how productivity and job satisfaction
could be increased jointly. Although they concluded that this goal
could not usually be achieved, they lamented their "failure" to find
strong satisfaction-performance linkages:
We wish we could announce that our search had been completely successful, that it had clearly disclosed the secret of motivating people so that they are both satisfied with their work and productive in it. Unfortunately •.. the facts are still too incomplete and equivocal to permit that (p. ix, emphasis added).
Clearly these researchers (as do others) espouse this tenet of
Industrial/Organizational psychology - that satisfaction and per-
formance should be related. None of the published research reviews thus
far (e.g., Herzberg et a1., 1957; Vroom, 1964; Locke, 1976) appear to
have been sufficient to dispe11 this deeply ingrained belief. The
early admonitions of Brayfield and Crockett (1955) and Vroom (1964)
that there was no strong relationship between these two variables were
apparently disregarded by subsequent researchers and practitioners,
perhaps due to their being based upon such small samples ~ __ s_~~d!e~ •... t However, the present review reaffirms these conclusions and is based
upon a more powerful sample of 74 studies with a total subject sample
of more than 12,000 - the aggregation of years of "inconclusive
results" via meta-analytic techniques.
Not only does this intuitively appealing notion that "a happy
worker is a productive worker" pervade our theoretical approaches to
such areas as worker motivation, but it is also inherent in practical
areas such as management and union attempts to increase worker satis-
faction and the quality of work life. Through such popularized

66
managerial techniques as job enrichment, participative management,
and autonomous work groups, it is presumed that worker satisfaction
will be increased and will ultimately lead to improved performance.
Managers have become more attentive to the goal of facilitating employee
satisfaction, and indeed, some researchers have hypothesized that an
organization will be more effective the stronger the relationship that
exists between satisfaction and performance, other things being equal
(Lawler & Porter, 1967).
Thus, the conclusion that satisfaction and performance are B£!
strongly related flies in the face of long-standing dogma in I/O
psychology. Yet, based upon the results obtained here, the earlier
conclusions of Brayfield and Crockett (1955) and Vroom (1964) must now
be regarded as inescapable - that contrary to our intuitive feeling
that the two variables should be strongly related, only a slight posi
tive (.17) relationship exists between job satisfaction and job
performance. Unreliable measurement and sampling error have been shown
to have created much of the variation in study results.
Although the implication that these two variables must be ad
dressed relatively independently is not new (e.g., Katze1l & Yanke1ovich,
1975), it warrants repetition, as apparently it still pervades organiza
tional policy-making. For example, managers should not assume that
highly productive employees are satisfied with the various facets of
their job. Nor can they expect interventions designed to influence one
of these variables to have much systematic effect on the other. Prac
titioners desirous of maximizing both aspects of work life must be
prepared to devote additional resources to this task in order to

67
accomplish these dual objectives. Further, union representatives must
recognize that management concessions aimed at improving the quality
of working life will EQ! necessarily guarantee increased productivity
as a by-product. To achieve this additional goal, union and manage
ment representatives will have to implement programs which have the
accepted explicit purpose of improving employee performance.
The fact that only a negligible relationship exists between job
satisfaction and job performance has wide-ranging practical implications
beyond those highlighted here. However, they will only be appropriately
addressed when Industrial/Organizational psychology as a profession
acknowledges the facts of this relationship and accepts them as
reality.
Suggestions for Future Research
It was demonstrated here that the best estimate of the population
correlation is relatively low and that much of the variability in
results obtained in previous research has been due to the use of
small samples and unreliable measurement. Furthermore, the relationship
between satisfaction and performance is only slightly moderated by
several study characteristics which were previously assumed to have
been important determinants of the magnitude of the satisfaction
performance correlation obtained. Consequently, any further research
aimed at unlocking the "secret" to obtaining a large satisfaction
performance correlation will be of limited utility, as it has been
shown that the true correlation between these variables is quite low.

68a
The logical response to this conclusion then, is the question, why
do some studies report high correlations between job satisfaction and job
performance? Based upon the data obtained here, two explanations may
be offered as to the "cause" of the eight high positive correlations
(i.e., I? .44) that were observed after averaging within some studies.
The first approach is purely statistical, in that these eight high
correlations can be said to be simply chance occurrences. Given that
the distribution of satisfaction-performance correlations was determined
to have a mean (p ) of .17 and a standard deviation (a ) of .12, true . p true
it would be expected that if the correlations approximate a normal
distribution, 95% of the observed correlations would fall between -.07
and .41 (i.e., within + 2 SD). Therefore, approximately 2.5% of
satisfaction-performance correlations would be expected to fall in the
upper tail of this distribution; that is, having observed values greater
than .41. The fact that 3.6% (8) of the observed correlations included
in the present review were greater than or equal to .44 (c.f. Table 3)
is consistent with this expectation. Thus, it is probable that unusually
high satisfaction-performance correlations occur infrequently enough to
be within expectations due to chance alone.
The second approach to "explaining" the occurrence of high
satisfaction-performance correlations involves a post-hoc examination
of the eight individual cases to delineate any substantive commonalities
which may be determinants of high correlations. The eight correlations
above .44 were obtained from Kirchner (1965), Greene (1972 and 1973a),
Kesselman, Wood and Hagen (1974), Lopez (1982), and Porac, Ferris,
and Fedor (1983), with two high correlations obtained from each of

68b
these last three studies. A case-by-case examination of these studies
revealed few commonalities in terms of the sample size, year or source
of publication, satisfaction and performance measures utilized, or the
nine study characteristics which were included in this meta-analysis.
The only notable trends which appeared were that a) seven out of the
eight correlations were based upon white collar employees/professionals
as subjects, b) seven out of the eight were based upon subjective
performance measures, and c) six of the eight were based upon combined
subjective ratings of both quality and quantity of performance (i.e.,
they had been coded as "missing values" on the quality-quantity dimension
because of the combined assessment). While these commonalities may
appear to suggest substantive explanations for the occurrence of high
satisfaction-performance correlations, the lack of significant rela
tionships between these coded study characteristics and the magnitude
of observed correlations for the overall sample of studies (Table 6)
lends little support for the viability of such explanations. Thus,
although all potential explanations have not been fully tested here,
unusually high correlations which might be obtained in an individual
study are likely due to chance.
Some of the variance in observed corr.elations, however, could not
be explained by the effects of sampling error and measurement un
reliability. This remaining variation has two potential explanations,
both of which have implications for future research.
First, this unexplained variance may be the result of error, as
discussed earlier in the context of the remaining four of Schmidt and
Hunter's (1977) seven sources of error variance. The impact of these

69a
four sources could not be assessed because the necessary correction
procedures were impossible to utilize (in the case of range restriction)
or not as yet formulated (in the case of the other three remaining
sources). Although Hunter et al. (1982) claim that in most meta
analyses, removing the effects of the first four of the sources of error
(sampling, unreliability in both variables, range restriction) will
reduce the observed variance in correlations to essentially zero (and
also therefore eliminate the need for subgroup/moderator analyses),
such was not the case in the present review, which utilized corrections
for three of these error sources. Future meta-analysts may encounter
a similar result when analyzing other subject areas. As a consequence,
it may be fruitful for future research efforts to focus on the develop
ment of new ways of quantifying any or all of these four uncorrected
effects.
Second, this unexplained variability in satisfaction-performance
correlations may be due to true variance, i.e., true differences in the
population correlation across situations. The present study attempted
to delineate these situational determinants via correlational analysis
by satisfaction subgroups and with a multiple regression analysis
utilizing study characteristics. However, this search for systematic
differences in the observed correlations was not very successful in
that a) the study characteristics accounted for only 13.7% of the
variance and b) the few (14/72) potential subgroup correlations that
achieved statistical significance are difficult to interpret
substantively because of extremely small sample sizes (c.f. Table 7).
Yet, although the conclusions are tenuous, these subgroup cor-

69b
relations do suggest that some situational differences may exist in
the strength of the satisfaction-performance relationship. For example,
correlations between satisfaction with supervision and performance
exhibited strong relationships with several study characteristics,
whereas correlations based upon satisfaction with work were not re-
lated to any of the study characteristics. The future researcher can
thus expect for instance, that "supervision" satisfaction and job per-
formance will be more highly related when composite performance measures
are utilized, or that the use of objective vs. subjective performance
measures will not influence the nature of the relationship between
"work" satisfaction and performance.
It is true that these nine study characteristics, several of
which have previously been advanced as being important (e.g., the-
use of white vs. blue collar subjects, Lawler & Porter, 1967), combined
2 to yield a statistically significant relationship ~ ) with the cor-
relation obtained in a study. Yet, the practical significance of this
relationship is open to debate. Contrary to many previous researchers'
assumptions, variables such as the type of workers studied and the use
of longitudinal vs. cross-sectional research designs have been
individually shown to have little influence on the satisfaction-
performance relationship. In combination, their effect is not
substantially greater. Thus, if a researcher's control over these nine
study variables will not have much systematic effect on the correla-
tion obtained, can it be concluded that it does not matter much how the
study is conducted - that the same correlation will result regardless,
or that factors beyond the researcher's control determine the exact

70
satisfaction-performance relationship that will be observed?
The relatively large residual standard deviations (cr ) Ptrue
may tempt some to argue that additional correlational studies are
needed to answer the questions posed here. But then at what point
does the data base become sufficient? Interest in the satisfaction-
performance area has spawned a long line of research attempting to
achieve higher correlations by manipulating various methodological!
measurement variables. Additional entries in this research tradition
appear to be unwarranted, as they will only further cloud the issue.
What are needed are continued attempts to sift through the existing
data in order to determine whether (or what) systematic differences
do exist. Perhaps extensions of the present meta-analysis are needed
to identify more potent moderators or true systematic subgroup di£-
ferences that will help account for some of the unexplained variability
in study results. This can best be achieved through additional
G1assian (i.e., multiple regression) meta-analytic studies of this
literature, and through the development and future implementation of
new meta-analytic techniques aimed at quantifying the remaining
sources of error identified by Schmidt and Hunter (1977). However,
any new techniques must be designed to accommodate, rather than be
thwarted by, current reporting practices.
One final suggestion for further research, stemming from the
process rather than the product of the present review, concerns these
limitations imposed by journal reporting practices; namely, the quality
of research reports typically published. Inaccurate or incomplete
reporting by authors constituted a major obstacle to the completion of

71
the data collection process for the present review. Studies were
rejected from inclusion for a myriad of reporting inadequacies, among
them being the fact that it was impossible to determine precisely
what constituted the "satisfaction" and "performance" measures (e.g.,
Cotham, 1968), or that only those correlations achieving statistical
significance were reported and without accompanying sample sizes
(e.g., Wood, 1974). Very few studies (mostly within the past decade)
bothered to report information on the reliability of the measures
utilized. Only with the advent of more thorough and accurate reporting
practices can we hope to distill more meaningful conclusions from the
literature through meta-analytic techniques. It is hoped that journal
editors and reviewers will realize that journal articles are often the
major source of "raw data" for meta-analytic research, and they ~il1
accordingly support and encourage extensive reporting practices.
Lest the reader mistake any of the conclusions presented here as
a condemnation of more than twenty years of psychological research, it
should be reiterated that a great many of the studies included in this
analysis represented significant theoretical and methodological advances
in the study of job satisfaction and performance. For example, the
introduction of cross-lagged research methodology (e.g., Siegel & Bowen,
1971; Greene, 1973b; Sheridan & Slocum, 1975) challenged the previously
assumed causal direction between these two variables. While this
controversy over causality still exists (Organ, 1977; Lorenzi, 1978),
the contributions of these and many other satisfaction-performance
researchers have obviously not been without a great deal of merit.
From their perspective, what we might now accuse of being redundant

72
and unnecessary replications were regarded as valuable attempts to
clarify an important issue. However, established and aspiring
satisfaction-performance researchers would do well now to focus their
efforts on the meta-analytic identification of additional sources of
variation in the existing data base, rather than continue to frantically
correlate, doubting the veracity of the early reviewers' conclusion
that these two variables are only slightly related.
Criticisms of Meta-Analysis and Limitations of this Study
The rise in popularity of meta-analytic techniques has not been
without an accompanying increase in debates over procedural and inter
pretive issues (e.g., Vecchio, 1983; Strube & Garcia, 1983). Critics,
beginning with Eysenck (1978), have taken meta-analysis to task on
several points which are relevant to the present discussion. While
the basic issues will be addressed briefly here, a more thorough
treatment will be found in Glass et a1. (1981), Hunter et a1. (1982),
and Strube and Hartmann (1982). These issues are also discussed, with
particular reference to psychotherapy outcome research, in several
contributions appearing in a special meta-analysis section of a recent
issue of the Journal of Consulting and Clinical Psychology (e.g.,
Fiske, 1983; Mintz, 1983). Major concerns relevant to this study
include: a) the combining of the results of many very different
studies, b) the use of studies of potentially unsound methodology,
and c) selection bias in the reported research studies comprising
the sample (Glass et a1., 1981).

73
Due to its very purpose, meta-analysis involves the aggregation
of the results of many different studies. Glass et ale (1981) refer
to this as the "apples and oranges" problem, in that critics claim it
is illogical to combine the results from studies that differ in some
way (e.g., the dependent variables are measured differently, or dif
ferent groups of subjects are utilized). According to Glass et al.
(1981), the claim that studies must be the "same" in order to be com
bined is self-contradictory - studies that are the same in all respects
would have the same findings (with some error). Only those studies
which are different need to be integrated.
Hunter et ale (1982) also address this question of the appropriate
scope of the literature to be reviewed. Rather than view this as a
weakness of the method, however, they suggest that the ability of
meta-analysis to help detect moderator effects over a very wide set of
studies is one of its strengths. If the meta-analysis shows only
minor true differences in the correlation over a wide range of studies,
many previously held "moderator" hypotheses can be dis spelled (Hunter
et al., 1982).
The second area of concern, the use of studies having unsound or
questionable methodology, stems from Eysenck's (1978) early criticism
of the original Smith and Glass (1977) meta-analysis. Their defense
(Glass et al., 1981) has been to point out that there was no cor
relation obtained between the subjectively judged quality of design and
the obtained effect size across all psychotherapy outcome studies they
evaluated. In addition, Glass et ale (1981) present compelling evidence
from 12 different meta-analyses which found the differences in the

74
size of average experimental effects between studies judged to be high
and low in internal validity to be surprisingly small.
Hunter et a1. (1982) are critical of those who advocate eliminating
from the meta-analysis those studies with "methodological inadequacies."
They assert that since no study can be completely defended against all
possible counterhypotheses, no study is without some inadequacy. The
highly subjective decision of which studies to include in a meta-analysis
could feasibly result in two reviewers selecting mutually exclusive sets
of studies from the same research literature, on the basis of their
personal interpretations of "methodological soundness." Hunter et al.
(1982) suggest that the reviewer could code studies on the basis of
methodological deficiencies and that if there remains a large variation
in results across studies after the corrections have been made, separate
meta-analyses on the "defective" vs. "nondefective" studies may explain
this residual variation.
The final major criticism of relevance to the present study is the
potential selection bias in reported research selected for inclusion in
the meta-analysis. The point of contention here is whether there are
systematic differences between the research reports that are published
and those that go unpublished. Critics claim that by restricting the
review to published sources, the meta-analyst eliminates sources of
potentially conflicting information and makes erroneous conclusions.
Glass et a1. (1981) agree that this criticism may be valid, but counter
that the problem of selective publication practices can only be adequately
addressed via meta-analytic (as opposed to narrative) review methods;
specifically, by collecting all of the literature and then analyzing

75
it separately by mode of publication to determine if systematic dif
ferences exist. Although they conclude that most disciplines show
evidences of selection bias in publication, the degree of this bias
may vary substantially - both between and within disciplines.
Rosenthal (1979) has suggested a procedure for the estimation
of the effects of this "file drawer" problem (Le., studies with non
significant results which are tucked away in file drawers, potentially
negating the conclusions drawn by the reviewer), which has begun to be
utilized by some meta-analysts (Strube & Garcia, 1981). However, this,
too, is not without some debate as to its appropriate use and inter
pretation (Vecchio, 1983; Strube & Garcia, 1983).
The present study attempted to respond to each of these potential
criticisms to some degree. It is true that many different types .of
satisfaction-performance studies were combined here. However, the
majority of the criterion measures utilized were supervisory ratings,
and the correlations were analyzed both for the total sample and
by satisfaction measure subgroups, in an effort to achieve a greater
degree of homogeneity in the studies being aggregated. Also, several
of the major variables on which studies varied (e.g., type of subject
sample) were controlled for by their coding and subsequent inclusion
in the mUltiple regression analysis.
Potential interpretive problems arising from the use of studies
with questionable methodology were not averted here through a hap
hazard elimination of studies judged to be unsound. Rather, this prob
lem was addressed in two ways. First, the data collection procedures
were concentrated upon well-known and respected academic journals, with

76
the vast majority of studies obtained from more recent issues (i.e.,
since 1970). It is acknowledged, though, that this does not guarantee
that the research included here was flawless.
Strube and Hartmann (1982) advocate the use of multiple regression
analysis over the differential weighting of study results by some rating
of their methodological quality. Similarly, in the present study,
some of the coding characteristics utilized in the multiple regression
analysis identified variables which would presumably be associated with
sound research methodology, such as the use of longitudinal designs,
composite performance indices, experimentally developed performance
measures, etc.
The third criticism, selection bias in studies reported, was not
judged to be as potentially serious a problem in the present review
as in other meta-analyses. Due to the riature of the subject matter
and the debate over the negative conclusions reached by early re
viewers, there appears to have been a publication atmosphere more
receptive to nonsignificant or negative findings (zero or negative cor
relations) than perhaps exists in other areas of psychological research.
Thus, it is assumed here that satisfaction-performance correlations of
any sign or magnitude have generally had equal chances of being pub
lished, other things being equal, thereby diminishing the potential
for "file drawer" studies to drastically alter the results obtained
here. However, although the sample of studies included here is assumed
to be representative of any other published studies which were not
located or were rejected due to insufficient reporting, this as-

77
sumption may not be valid and thus constitutes a potential limitation
of the conclusions drawn.

78
REFERENCES
Bartol, K. M. Vocational behavior and career development, 1980: A review. Journal of Vocational Behavior, 1981, 19, 123-162 •
. '/'~~agat, R. S. Determinants of performance in an innovative organizational setting: A longitudinal analysis. Journal of Occupational Behavior, 1981, 1, 125-138.
~hagat, R. S. Conditions under satisfaction relationships situational contingencies. 25, 772-789.
which stronger job performance-job may be observed: A closer look at two
Academy of Management Journal, 1982,
Boehm, V. R. Differential prediction: A methodological artifact? Journal of Applied Psychology, 1977, 62, 146-154 .
. /Brayfie1d, A. H., & Crockett, W. H. Employee attitudes and employee performance. Psychological Bulletin, 1955, 52, 396-424.
Cooper, H. M. Statistically combining independent studies: A metaanalysis of sex differences in conformity research. Journal of Personality and Social Psychology, 1979, 37, 131-146.
Cooper, H. M., & Rosenthal, R. Statistical versus traditional procedures for summarizing research findings. Psychological Bulletin, 1980, 87, 442-449.
/Cotham, J. C. salesmen.
Job attitudes and sales performance of major appliance Journal of Marketing Research, 1968, 2, 370-375.
Darlington, R. B. Multiple regression in psychological research and practice. Psychological Bulletin, 1968, 69, 161-182.
Eysenck, H. J. An exercise in mega-silliness. American Psychologist, 1978, 33,517.
JFisher, C. D. On the dubious wisdom of expecting job satisfaction to correlate with performance. Academy of Management Review, 1980, 2, 607-612.
Fisher, C. D., & Gitelson, R. A meta-analysis of the correlates of role conflict and ambiguity. Journal of Applied Psychology, 1983, 68, 320-333.
Fiske, D. W. The meta-analytic revolution in outcome research. Journal of Consulting and Clinical Psychology, 1983, 51, 65-70.

79
Gilet, B., & Schwab, D. P. Convergent and discriminant validities of corresponding JDI and MSQ scales. Journal of Applied Psychology, 1975, 60, 313-317.
Glass, G. V. Primary, secondary, and meta-analysis of research. Educational Researcher, 1976, 5 (10), 3-8.
Glass, G. V., McGaw, B., & Smith, M. L. Meta-analvsis in social research. Beverly Hills: Sage, 1981.
~reene, C. N. Relationships among role accuracy, compliance, performance evaluation, and satisfaction within managerial dyads. Academy of Management Journal, 1972, 15, 205-215.
~Greene, C. N. An evaluation of Bowen and Byrne's interpretations. Academy of Management Journal, 1973, 16, 159-161. (a)
/Greene, C. N. Causal connections among managers' merit pay, job satisfaction, and performance. Journal of Applied Psychology, 1973, 58,95-100. (b)
Hall, J. A. Gender effects in decoding nonverbal cues. Psychological Bulletin, 1978, 85, 845-857.
Hedges, L. V., & Olkin, I. Vote-counting methods in research synthesis. Psychological Bulletin, 1980, 88, 359-369.
~Herman, J. B. Are situational contingencies limiting job attitudejob performance relationships? Organizational Behavior and Human Performance, 1973, 10, 208-224.
~Herzberg, F., Mausner, B., Peterson, R. 0., & Capwell, D. F. Job attitudes: Review of research and opinion. Pittsburgh: Psychological Service of Pittsburgh, 1957.
Hunter, J. E., Schmidt, F. L., & Jackson, G. B. Meta-analysis: Cumulating research findings across studies. Beverly Hills: Sage, 1982.
Jackson, G. B. Methods for integrative reviews. Review of Educational Research, 1980, 50, 438-460.
~acobs, R., & Solomon, T. Strategies for enhancing the prediction of job performance from job satisfaction. Journal of Applied Psychology, 1977, 62, 417-421.
Jones, L. V., & Fiske, D. W. Models for testing the significance of combined results. Psychological Bulletin, 1953, 50, 375-382.

80
Katzell, R. A., & Yankelovich, D. Work. productivity. and job satisfaction: An evaluation of policy-related research. New York: The Psychological Corporation, 1975.
~esselman, G. A., Wood, M. T., & Hagen, E. L. Relationships between performance and satisfaction under contingent and noncontingent reward systems. Journal of Applied Psychology, 1974, 59, 374-376.
Kirchner, W. K. Relationships between general and specific attitudes toward work and objective job performance for outdoor advertising salesmen. Journal of Applied Psychology, 1965, 49, 455-457.
Kornhauser, A., & Sharp, A. Employee attitudes: Suggestions from a study in a factory. Personnel Journal, 1932, 10, 393-401.
Kunin, T. The construction of a new type of attitude measure. Personnel Psychology, 1955, ~, 65-78.
Lawler, E. E. MOtivation in work organizations. MOnterey, CA: Brooks/ Cole, 1973.
~awler, E. E., & Porter, L. W. The effect of performance on job satisfaction. Industrial Relations, 1967, 1, 20-28.
Light, R. J., & Smith, P. V. Accumulating evidence: Procedures .for resolving contradictions among different research studies. Harvard Educational Review, 1971, 41, 429-471.
Linn, R. L., Harnisch, D. L., & Dunbar, S. B. Validity generalization and situational specificity: An analysis of the prediction of first-year grades in law school. _A.p.p~l~i~e~d~P~s~y~c~h~o~l~o~g~i~c~a~l~Me~a~s~u=r~e~m;e=n~t, 1981, i, 281-289.
~ke, E. A. Dunnette chology.
The nature and causes of job satisfaction. In M. D. (Ed.), Handbook of industrial and organizational psyChicago: Rand McNally, 1976.
Lopez, E. M. A test of the self-consistency theory of the job performance-job satisfaction relationship. Academy of Management Journal, 1982, 25, 335-348.
Lorenzi, P. A comment on Organ's reappraisal of the satisfactioncauses-performance hypothesis. Academy of Management Review, 1978, 1, 380-384.
Mabe, P. A., & West, S. G. Validity of self-evaluation of ability: A review and meta-analysis. Journal of Applied Psychology, 1982, 67, 280-296.

81
Mintz, J. Integrating research evidence: A commentary on metaanalysis. Journal of Consulting and Clinical Psychology, 1983, 51, 71-75.
Nathanson, C. A., & Becker, M. H. Job satisfaction and job performance: An empirical test of some theoretical propositions. Organizational Behavior and Human Performance, 1973, ~, 267-279.
~;gan, D. W. A reappraisal and reinterpretation of the satisfactioncauses-performance hypothesis. Academy of Management Review, 1977, 1, 46-53.
Pearlman, K., Schmidt, F. L., & Hunter, J. E. Validity generalization results for tests used to predict job proficiency and training success in clerical occupations. Journal of Applied Psychology, 1980, 65, 373-406.
~orac, J. F., Ferris, G. R., & Fedor, D. B. Causal attributions, affect, and expectations for a day's work performance. Academy of Management Journal, 1983, 26, 285-296.
Ronan, W. W. Individual and situational variables relating to job satisfaction. Journal of Applied Psychology Monograph, 1970, 54 (1, Pt. 2), 1-31.
Rosenthal, R. Combining results of independent studies. Psychological Bulletin, 1978, 85, 185-193.
Rosenthal, R. The "file drawer problem" and tolerance for null results. Psychological Bulletin, 1979, 86, 638-641.
Schmidt, F. L., Gast-Rosenberg, I., & Hunter, J. E. Validity generalization results for computer programmers. Journal of Applied Psychology, 1980, 65, 643-661.
Schmidt, F. L., & Hunter, J. E. Development of a general solution to the problem of validity generalization. Journal of Applied Psychology, 1977, 62, 529-540.
Schmidt, F. L., Hunter, J. E., & Pearlman, K. Task differences as moderators of aptitude test va1idi~y in selection: A red herring. Journal of Applied Psychology, 1981, 66, 166-185.
'~chwab, D. P., & Cummings, L. L. Theories of performance and satisfaction: A review. Industrial Relations, 1970, ~, 408-430.
Y!Sheridan, J. E., & Slocum, J. W. The direction of the causal relationship between job satisfaction and work performance. Organizational Behavior and Human Performance, 1975, 14, 159-172.

82a
~iegel, J. P., & Bowen, D. Satisfaction and performance: Causal relationships and moderating effects. Journal of Vocational Behavior, 1971, 1, 263-269.
Smith, M. L., & Glass, G. V. Meta-analysis of psychotherapy outcome studies. American Psychologist, 1977, 32, 752-760.
Smith, P. C., Kendall, L. M., & Hulin, L. L. The measurement of satisfaction in work and retirement. Chicago: Rand McNally, 1969.
Srivastva, S., Salipante, P. F., Cummings, T. G., Notz, W. W., Bigelow, J. D., & Waters, J. A. Job satisfaction and productivity: An evaluation of policy related research on productivity, industrial organization and job satisfaction: Policy development and implementation. Cleveland: Department of Organizational BehaVior, Case Western Reserve University, 1975.
Strube, M. J., & Garcia, J. E. A meta-analytic investigation of Fiedler's contingency model of leadership effectiveness. Psychological Bulletin, 1981, 90, 307-321.
Strube, M. J., & Garcia, J. E. On the proper interpretation of empirical findings: Strube and Garcia (1981) revisited. Psychological Bulletin, 1983, 93, 600-603.
Strube, M. J., & Hartmann, D. P. A critical appraisal of meta-analysis. British Journal of Clinical Psychology, 1982, 21, 129-139.
Terborg, J. R., Lee, T. W., Smith, F. J., Davis, G. A., & Turbin, M. S. Extension of the Schmidt and Hunter validity generalization procedure to the prediction of absenteeism behavior from knowledge of job satisfaction and organizational commitment. Journal of Applied Psychology, 1982, 67, 440-449.
Terpstra, D. E. Relationship between methodological rigor and reported outcomes in organizational development evaluation research. Journal of Applied Psychology, 1981, 66, 541-543.
Triandis, H. C. A critique and experimental design for the study of the relationship between productivity and job satisfaction. Psychological Bulletin, 1959, 56, 309-312.
Vecchio, R. P. Assessing the validity of Fiedler's contingency model of leadership effectiveness: A closer look at Strube and Garcia. Psychological Bulletin, 1983, 93, 404-408.
Vroom, V. H. Work and motivation. New York: Wiley, 1964.

82b
Wanous, J. P. A causal-correlational analysis of the job satisfaction and performance relationship. Journal of Applied Psychology, 1974, 59, 139-144.
Weiss, D. J., Dawis, R. V., England, G. W., & Lofquist, L. H. Manual for the Minnesota Satisfaction Questionnaire. Minneapolis: University of Minnesota, Work Adjustment Project, Industrial Relations Center, 1967.
Wood, D. A. Effect of worker orientation differences on job attitude correlates. Journal of Applied Psychology, 1974, 59, 54-60.

83
STUDIES INCLUDED IN THE MEIA-ANALYSIS
Abdel-Halim, A. A. Effects of higher order need strength on the job performance-job satisfaction relationship. Personnel Psychology, 1980, 33, 335-347.
Arvey, R. D., & Gross, R. H. Satisfaction levels and correlates of satisfaction in the homemaker job. Journal of Vocational Behavior, 1977, 10, 13-24.
Bagozzi, R. P. Salesforce performance and satisfaction as a function of individual difference, interpersonal, and situational factors. Journal of Marketing Research, 1978, 12, 517-531.
Baird, L. S. Relationship of performance to satisfaction in stimulating and nonsttmulating jobs. Journal of Applied Psychology, 1976, 61, 721-727.
Bhagat, R. S. Determinants of performance in an innovative organizational setting: A longitudinal analysis. Journal of Occupational Behavior, 1981, 1, 125-138.
Bhagat, R. S. Conditions under which stronger job performance-job satisfaction relationships may be observed: A closer look at two situational contingencies. Academy of Management Journal, 1982, 25, 772-789.
Brayfield, A. H. (1944), as cited in Brayfield, A. H., & Crockett, W. H. Employee attitudes and employee performance. Psychological Bulletin, 1955, 52, 396-424.
Brayfield, A. H., & Mangelsdorf (1950), as cited in Brayfield, A. H., & Crockett, W. H. Employee attitudes and employee performance. Psychological Bulletin, 1955, 52, 396-424.
Brayfield, A. H., & Marsh, M. M. characteristics of farmers. 41, 98-103.
Aptitudes, interests, and personality Journal of Applied Psychology, 1957,
Breaugh, J. A. Relationships between recruiting sources and employee performance, absenteeism, and work attitudes. Academy of Management Journal, 1981, 24, 142-147.
Brief, A. P., & Aldag, R. J. Correlates of role indices. Journal of Applied Psychology, 1976, 61, 468-472.
Carlson, R. E. Degree of job fit as a moderator of the relationship between job performance and job satisfaction. Personnel Psychology, 1969, 22, 159-170.

84
Cherrington, D. J., Reitz, H. J., & Scott, W. E. Effects of contingent and non-contingent reward on the relationship between satisfaction and task performance. Journal of Applied Psychology, 1971, 55, 531-536.
Dipboye, R. L., Zultowski, W. H., Dewhirst, H. D., & Arvey, R. D. Self-esteem as a moderator of performance-satisfaction relationships. Journal of Vocational Behavior, 1979, 15, 193-206.
Doll, R. E., & Gunderson, E. K. E. Occupational group as a moderator of the job satisfaction-job performance relationship. Journal of Applied Psychology, 1969, 53, 359-361.
Dyer, L., & Theriault, R. The determinants of pay satisfaction. Journal of Applied Psychology, 1976, 61, 596-604.
Gadel, M. S., & Kriedt, P. H. Relationships of aptitude, interest, performance, and job satisfaction of IBM operators. Personnel Psychology, 1952, 1, 207-212.
Gavin, J. F., & Ewen, R. B. Racial differences in job attitudes and performance: Some theoretical considerations and empirical findings. Personnel Psychology, 1974, 27, 455-464.
~ou1d, S. Age, job complexity, satisfaction, and performance. Journal of Vocational-Behavior, 1979, 14, 209-223.
Green, S. G., Blank, W., & Liden, R. C. Market and organizational influences on bank employees' work attitudes and behaviors. Journal of Applied Psychology, 1983, 68, 298-306.
Greene, C. N. Relationships among role accuracy, compliance, performance evaluation, and satisfaction within managerial dyads. Academy of Management Journal, 1972, 15, 205-215.
Greene, C. N. An evaluation of Bowen and Byrne's interpretations. Academy of Management Journal, 1973, 12, 159-161. (a)
Greene, C. N. Causal connections among managers' merit pay, job satisfaction, and performance. Journal of Applied Psychology, 1973, 58, 95-100. (b)
Greenhaus, J. R., & Badin, I. J. Self-esteem, performance, and satisfaction: Some tests of a theory. Journal of Applied Psychology, 1974, 12, 722-726.
Griffin, R. W. Relationships among individual, task design, and leader behavior variables. Academy of Management Journal, 1980, 23, 665-683.

85
Hackman, J. R., & Lawler, E. E. Employee reactions to job characteristics. Journal of Applied Psychology, 1971, 55, 259-286.
Hall, D. T., Goodale, J. G., Rabinowitz, S., & MOrgan, M. A. Effects of top-down departmental and job change upon perceived employee behavior and attitudes: A natural field experiment. Journal of Applied Psychology, 1978, 63, 62-72.
Harding, F. D., & Bottenberg, R. A. Effect of personal characteristics on relationships between attitudes and job performance. Journal of Applied Psychology, 1961, 45, 428-430.
Heron, A. Satisfaction and satisfactoriness: Complementary aspects of occupational adjustment. Occupational Psychology, 1954, 28, 140-153.
Inkson, J. H. K. Self-esteem as a moderator of the relationship between job performance and job satisfaction. Journal of Applied Psychology, 1978, 63, 243-247.
Ivancevich, J. M. The performance to satisfaction relationship: A causal analysis of stimulating and nonstimu1ating jobs. Organizational Behavior and Human Performance, 1978, 22, 350-365.
Ivancevich, J. M. High and low task stimulation jobs: A causal analysis of performance-satisfaction relationships. Academy of Management Journal, 1979, 22, 206-222 ..
Ivancevich, J. M. A longitudinal study of behavioral expectation scales: Attitudes and performance. Journal of Applied Psychology, 1980, 65, 139-146.
Ivancevich, J. M., & Donnelly, J. H. Relation of organizational structure to job satisfaction, anxiety-stress, and performance. Administrative Science Quarterly, 1975, 20, 272-280.
Ivancevich, J. M., & McMahon, J. T. The effects of goal setting, external feedback, and self-generated feedback on outcome variables: A field experiment. Academy of Management Journal, 1982, 25, 359-372.
Ivancevich, J. M., & Smith, S. V. Goal setting interview skills training: Simulated and on-the-job analyses. Journal of Applied Psychology, 1981, 66, 697-705.
Jacobs, R., & Solomon, T. Strategies for enhancing the prediction of job performance from job satisfaction. Journal of Applied Psychology, 1977, 62, 417-421.

86
Joyce, W., Slocum, J. W., & Von Glinow, M. A. Person-situation interaction: Competing models of fit. Journal of Occupational Behavior, 1982, 1, 265-280.
Kesselman, G. A., Wood, M. T., & Hagen, E. L. Relationships between performance and satisfaction under contingent and noncontingent reward systems. Journal of Applied Psychology, 1974, 59, 374-376.
Kirchner, W. K. Relationships between general and specific attitudes toward work and objective job performance for outdoor advertising salesmen. Journal of Applied Psychology, 1965, 49, 455-457.
Landy, F. J. Motivational type and the satisfaction-performance relationship. Journal of Applied Psychology, 1971, 55, 406-413.
Lichtman, C. M. Some intrapersona1 response correlates of organizational rank. Journal of Applied Psychology, 1970, 54, 77-80.
Locke, E. A. The relationship of task success to task liking and satisfaction. Journal of Applied Psychology, 1965, 49, 379-385.
London, M., & Klimoski, R. J. Self-esteem and job complexity as moderators of performance and satisfaction. Journal of Vocational Behavior, 1975, £, 293-304.
Lopez, E. M. A test of the self-consistency theory of the job performance-job satisfaction relationship. Academy of Management Journal, 1982, 25, 335-348.
Mirvis, P. H., & Lawler, E. E. Measuring the financial impact of employee attitudes. Journal of Applied Psychology, 1977, 62, 1-8.
Mossin, A. C. Selling performance and contentment in relation to school background. New York: Bureau of Publications, Teachers
" College, Columbia University, 1949.
Motowid10, S. J. Relationship between self-rated performance and pay satisfaction among sales representatives. Journal of Applied Psychology, 1982, 67, 209-213.
Nathanson, C. A., & Becker, M. H. Job satisfaction and job performance: An empirical test of some theoretical propositions. Organizational Behavior and Human Performance, 1973, 2, 267-279.
Oldham, G. R., Hackman, J. R., & Pearce, J. L. Conditions under which employees respond positively to enriched work. Journal of Applied Psychology, 1976, 61, 395-403.

87
O'Reilly, C. A., & Roberts, K. H. Supervisor influence and subordinate mobility aspirations as moderators of consideration and initiating structure. Journal of Applied Psychology, 1978, 63, 96-102.
Orpen, C. The effect of reward contingencies on the job satisfactiontask performance relationship: An industrial experiment. Psychology, 1974, 11 (3), 9-14.
Orpen, C. Relationship between job satisfaction and job performance among western and tribal black employees. Journal of Applied Psychology, 1978, 63, 263-265.
Penley, L. E., & Hawkins, B. L. Organizational communication, performance, and job satisfaction as a function of ethnicity and sex. Journal of Vocational Behavior, 1980, 16, 368-384.
Pierce, J. L., Dunham, R. B., & Blackburn, R. S. Social systems structure, job design, and growth need strength: A test of a congruency model. Academy of Management Journal, 1979, 22, 223-240.
Podsakoff, P. M., Todor, W. D., & Skov, R. Effects of leader contingent and noncontingent reward and punishment behaviors on subordinate performance and satisfaction. Academy of Management Journal, 1982, 25, 810-821.
Porac, J. F., FerriS, G. R., & Fedor, D. B. Causal attributions, affect, and expectations for a day's work performance. Academy of Management Journal, 1983, 26, 285-296.
Pritchard, R. D. Effects of varying performance-pay instrumentalities on the relationship between performance and satisfaction: A test of the Lawler and Porter model. Journal of Applied Psychology, 1973, 58, 122-125.
Schriesheim, C. A., & MUrphy, C. J. Relationships between leader behavior and subordinate satisfaction and performance: A test of some situational moderators. Journal of Applied Psychology, 1976, 61, 634-641.
Schriesheim, J. F. The social context of leader-subordinate relations: An investigation of the effects of group cohesiveness. Journal of Applied Psychology, 1980, 65, 183-194.
Sheridan, J. E., & Slocum, J. W. The direction of the causal relationship between job satisfaction and work performance. Organizational Behavior and Human Performance, 1975, 14, 159-172.
Siegel, J. P., & Bowen, D. Satisfaction and performance: Causal relationships and moderating effects. Journal of Vocational Behavior, 1971, 1, 263-269. .

88
Spencer, D. G., & Steers, R. M. Performance as a moderator of the job satisfaction-turnover relationship. Journal of Applied Psychology, 1981, 66, 511-514.
Steers, R. M. Effects of need for achievement on the job performancejob attitude relationship. Journal of Applied Psychology, 1975, 60, 678-682.
Strauss, P. S. Psychology of the scientist: XIX. Job satisfaction and productivity of engineers and scientists. Perceptual and Motor Skills, 1966, 23, 471-476.
Stumpf, S. A. Career roles, psychological success, and job attitudes. Journal of Vocational Behavior, 1981, 19, 98-112.
Stumpf, S. A., & Rabinowitz, S. Career stage as a moderator of performance relationships with facets of job satisfaction and role perceptions. Journal of Vocational Behavior, 1981, 18, 202-218.
Sundstrom, E., Burt, R. E., & Kamp, D. Privacy at work: correlates of job satisfaction and job performance. Management Journal, 1980, 23, 101-117.
Architectural Academy of
Szilagyi, A. D. Causal inferences between leader reward behavior and subordinate performance, absenteeism, and work satisfaction. Journal of Occupational Psychology, 1980, 53, 195-204.
Tharenou, P., & Harker, P. Organizational correlates of employee se1festeem. Journal of Applied Psychology, 1982, ~, 797-805.
Wanous, J. P. A causal-correlational analysis of the job satisfaction and performance relationship. Journal of Applied Psychology, 1974, 59, 139-144.
Wex1ey, K. N., Alexander, R. A., Greenawalt, J. P., & Couch, M. A. Attitudinal congruence and similarity as related to interpersonal evaluations in manager-subordinate dyads. Academy of Management Journal, 1980, 23, 320-330.