Embed Size (px)
Citation preview
JK Tyre Industries BUY
- 1 - Tuesday, 22nd
March, 2016
This document is for private circulation, and must be read in conjunction with the disclaimer on the last page.
ST
OC
K P
OIN
TE
R
Target Price `153 CMP `84 FY18E P/E 3.29X
Index Details JK Tyre & Industries Ltd. (JK Tyre), a part of the JK Group of
Companies, is a leading tyre manufacturer in India. It enjoys a
leadership position in the domestic radial tyres segment with a market
share of 31% (as at end FY15). It has 9 manufacturing plants -- 6 in India
and 3 in Mexico, through its subsidiary Tornel, which it acquired in 2008.
JK Tyre is in a sweet spot with the fall in crude oil prices and vehicle
sales showing signs of a recovery. We are optimistic about the company
given that:
i) Volume kicker through capacity expansions: JK Tyre is expanding its
capacity from 20.5 mn to 23.1 mn units. The incremental capacity, 2.6
mn units at the Chennai plant, is expected to come on-stream by FY17.
While realizations are dwindling due to a partial pass through of the fall
in input prices, volumes are expected to receive a boost through the
expansion. Overall, we expect revenues to expand at a 3 year CAGR of
3.4% to Rs 8,156 crore by FY18.
ii) Margin expansion to drive earnings growth: Prices of crude oil and its
derivative, i.e. rubber (key input), have slumped in the past one year
owing to subdued demand and excess inventory. Correspondingly, JK
Tyre reported an EBITDA margin of ~16.8% in 9MFY16, a jump of 460
bps YoY. We believe that the sharp slump in crude oil prices is over-
done and a rebound is likely, given the output caps being put in place.
However, the three digit prices of crude are a distant reality given the
weak global economy. Prices could rebound to the $40 range and
accordingly margins would dip too. We have factored in an EBITDA
margin in the range of 15-15.5% over our forecast period.
iii) Increasing proportion of radialisation: The proportion of JK Tyre’s
revenue that comes from radial tyres has increased to 52% in FY15 from
35% in FY13. It plans to further increase the proportion to 65% in the
coming 2-3 years. Higher sales from value added radial tyres provide a
cushion to margins even if raw material prices reverse their downtrend.
We initiate coverage on JK Tyre as a BUY with a Price Objective of Rs
153 over a period of 18 months. The target price is arrived at by
assigning a PE of 6x to the FY18E EPS of Rs 25.5. The target price
translates to an upside of 82% from the CMP of Rs 84.
Sensex 25,285
Nifty 7,704
Industry Tyres
Scrip Details
MktCap (` cr) 1916.6
BVPS (`) 61.7
O/s Shares (Cr) 22.6
AvVol(Cr) 0.25
52 Week H/L 133/77
Div Yield (%) 1.8
FVPS (`) 2.0
Shareholding Pattern
Shareholders %
Promoters 52.3
DIIs 1.7
FIIs 10.5
Public 35.5
Total 100.0
JK Tyres vs. Sensex
60
70
80
90
100
110
120
2-F
eb
-15
23-F
eb
-15
16-M
ar-1
5
6-A
pr-1
5
27-A
pr-1
5
18-M
ay-1
5
8-J
un
-15
29-J
un
-15
20-J
ul-
15
10-A
ug
-15
31-A
ug
-15
21-S
ep
-15
12-O
ct-
15
2-N
ov-1
5
23-N
ov-1
5
14-D
ec-1
5
4-J
an
-16
25-J
an
-16
JK Tyres Sensex
Key Financials (` in Cr)
Y/E Mar Net
Sales EBITDA PAT
EPS
(`)
EPS
Growth (%)
RONW
(%)
ROCE
(%)
P/E
(x)
EV/EBITDA
(x)
2015 7384 931 329.66 14.54 -33.4 18% 18% 7.3 5.6
2016E 6948 1,081 439.22 19.36 27.1 18% 20% 4.3 4.0
2017E 7555 1,135 496.41 21.89 13.4 20% 20% 3.8 3.7
2018E 8156 1,223 579.13 25.53 35.3 20% 21% 3.3 2.7
- 2 - Tuesday, 22nd
March, 2016
This document is for private circulation, and must be read in conjunction with the disclaimer on the last page.
Company Background
JK Tyre & Industries (JK Tyre), incorporated in 1974 is engaged in the manufacture
of automotive tyres (passenger car, commercial, farm and off-the-road), tubes and
flaps. It enjoys a leadership position in the domestic radial tyres segment, with a
market share of 31% (as on FY15). It has 9 manufacturing plants -- 6 in India and 3
in Mexico (after acquisition of Tornel in 2008). It has a wide distribution network with
143 selling points and 4000+ dealers across India.
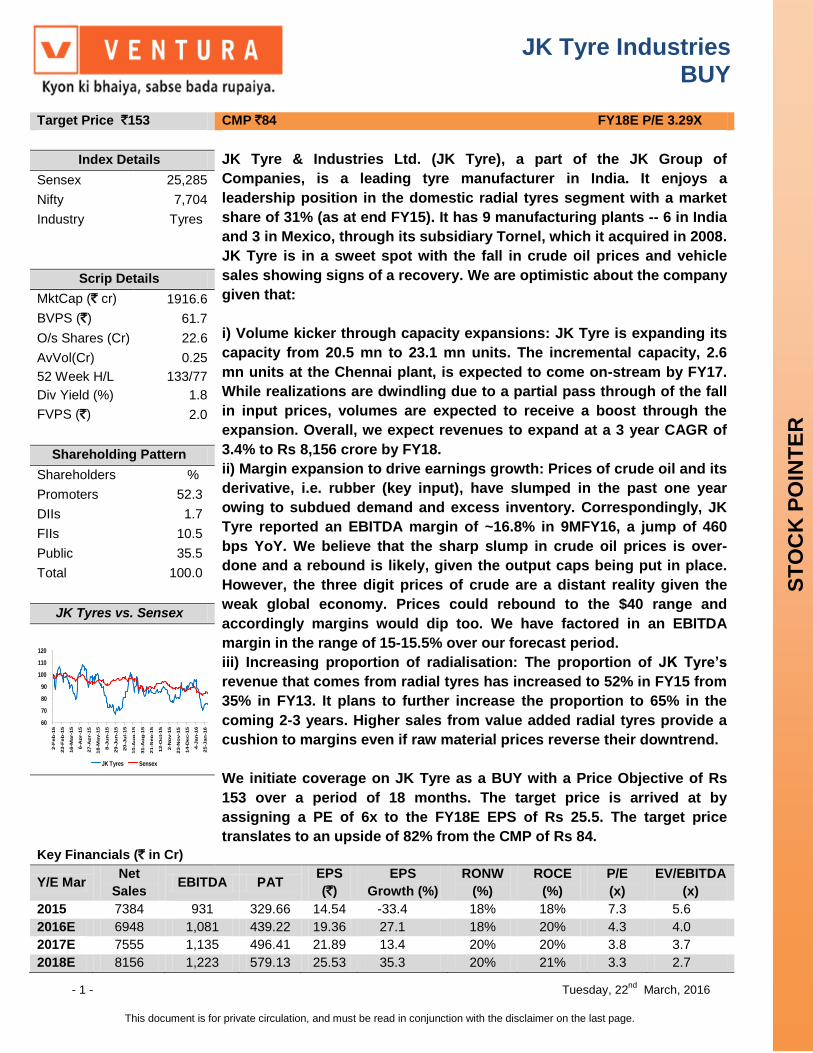
JK Tyre’s Business Structure
Mexican Operation Revenue - Rs 1258 Crore Revenue Share - 16% Net Profit -Rs 71 Crore
Indian Operation Revenue - Rs 6784 Crore Revenue Share - 84% Net Profit -Rs 253 Crore
Customer Wise Revenue
Replacement - 58%
OEMs - 23%
Exports -19%
Segment wise Revenue
Commercial - 84%
Passengers -14 %
Others - 2%
Total Revenue of JK Tyre FY 15- Rs 8042 Crore
Source: JK Tyre , Ventura Research
- 3 - Tuesday, 22nd
March, 2016
This document is for private circulation, and must be read in conjunction with the disclaimer on the last page.
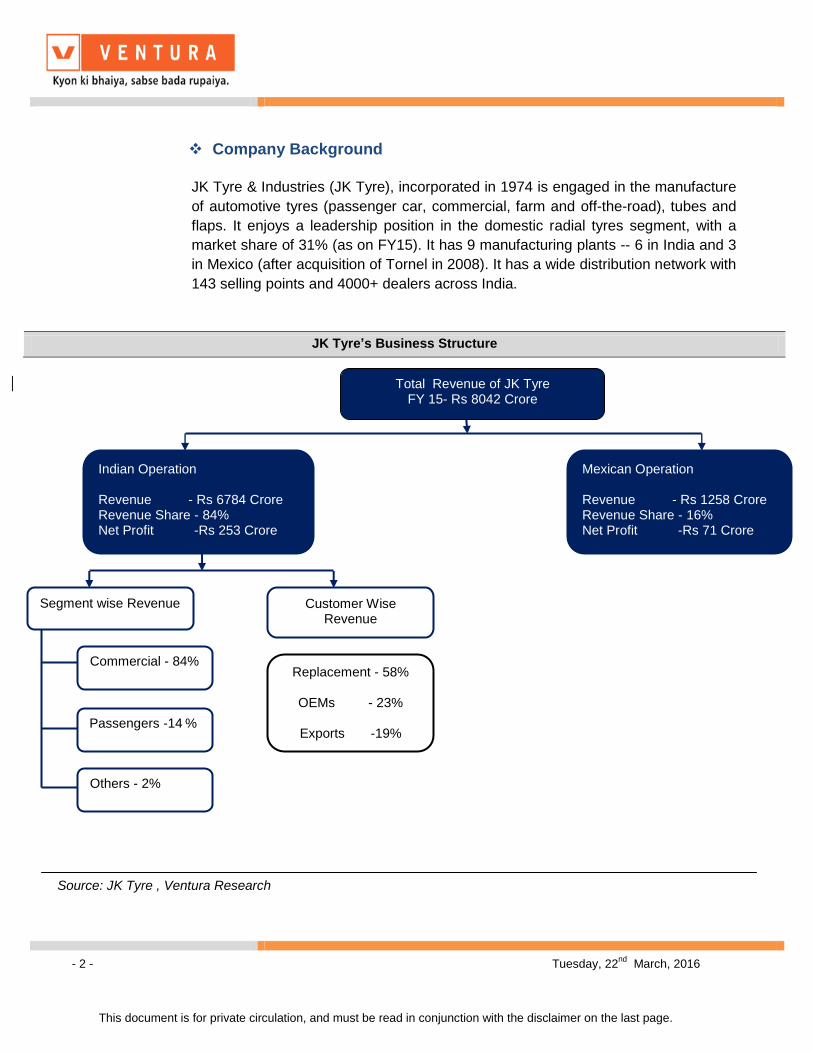
JK Tyre’s Manufacturing Location
Source: JK Tyre , Ventura Research
Banmore, Madhya
Pradesh
Chennai,
Tamil Nadu
Mysore,
Karnataka
Kakroli, Rajasthan
(3 plants)
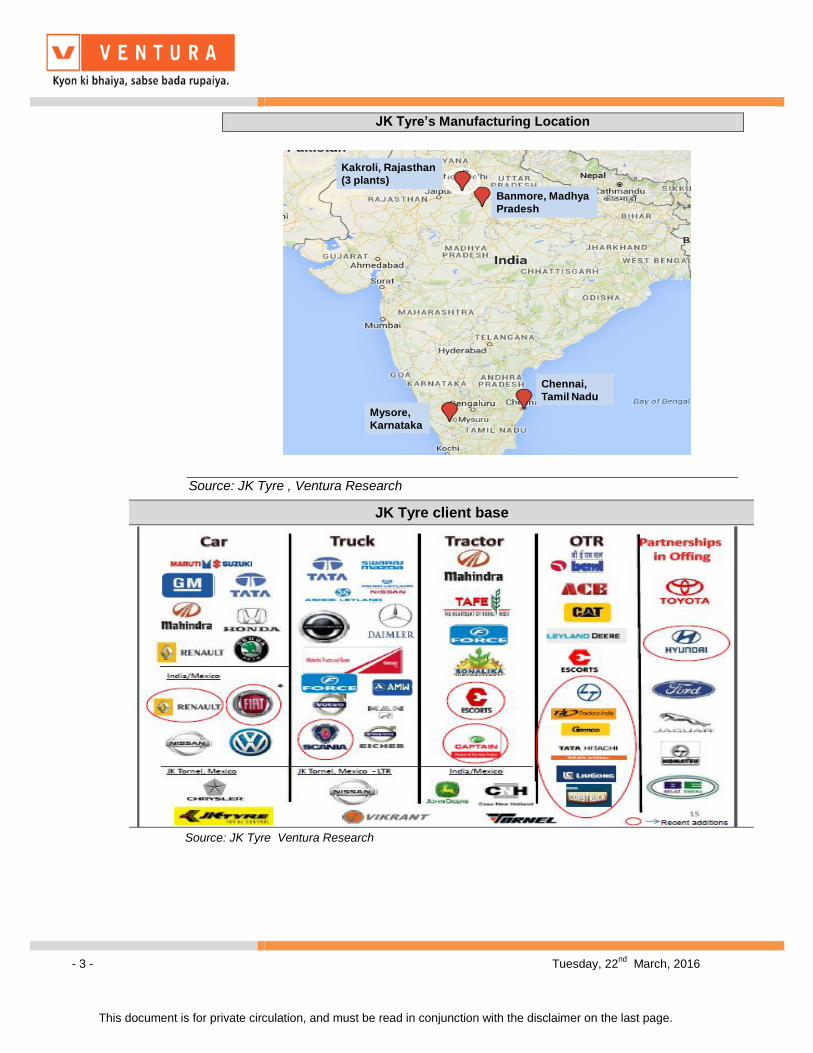
JK Tyre client base
Source: JK Tyre Ventura Research
- 4 - Tuesday, 22nd
March, 2016
This document is for private circulation, and must be read in conjunction with the disclaimer on the last page.
Key Investment Highlights
Expect modest revenue growth, robust margin expansion
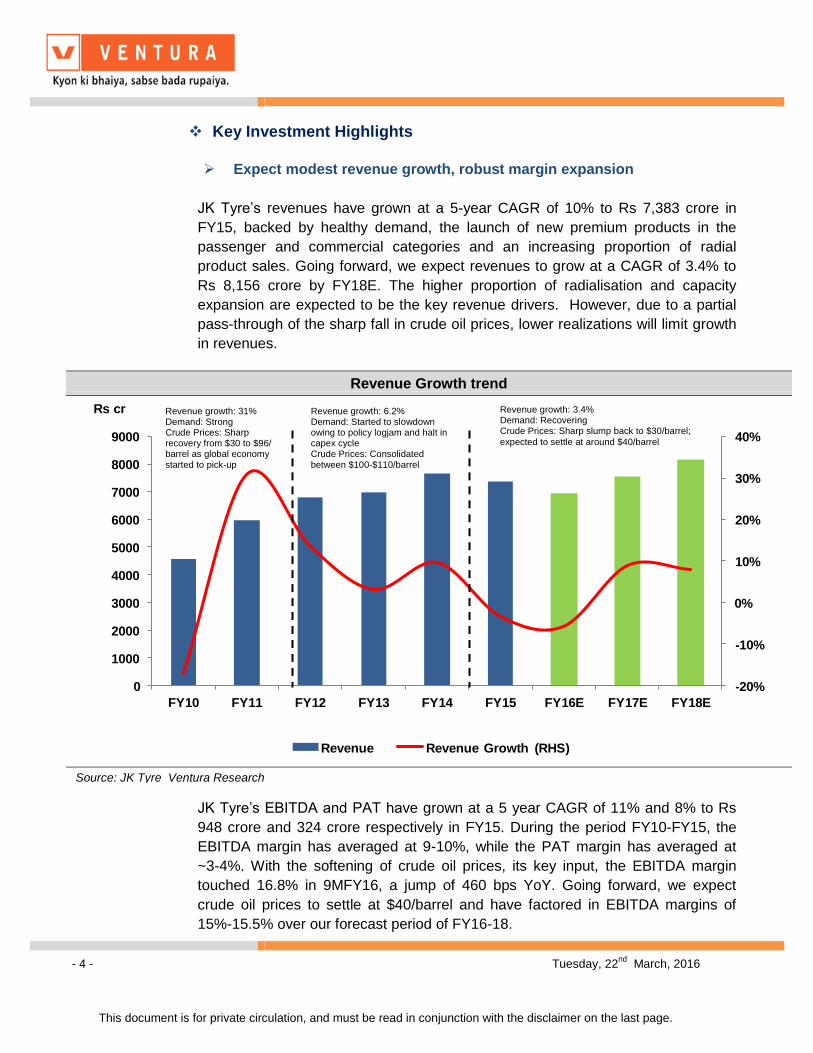
JK Tyre’s revenues have grown at a 5-year CAGR of 10% to Rs 7,383 crore in
FY15, backed by healthy demand, the launch of new premium products in the
passenger and commercial categories and an increasing proportion of radial
product sales. Going forward, we expect revenues to grow at a CAGR of 3.4% to
Rs 8,156 crore by FY18E. The higher proportion of radialisation and capacity
expansion are expected to be the key revenue drivers. However, due to a partial
pass-through of the sharp fall in crude oil prices, lower realizations will limit growth
in revenues.
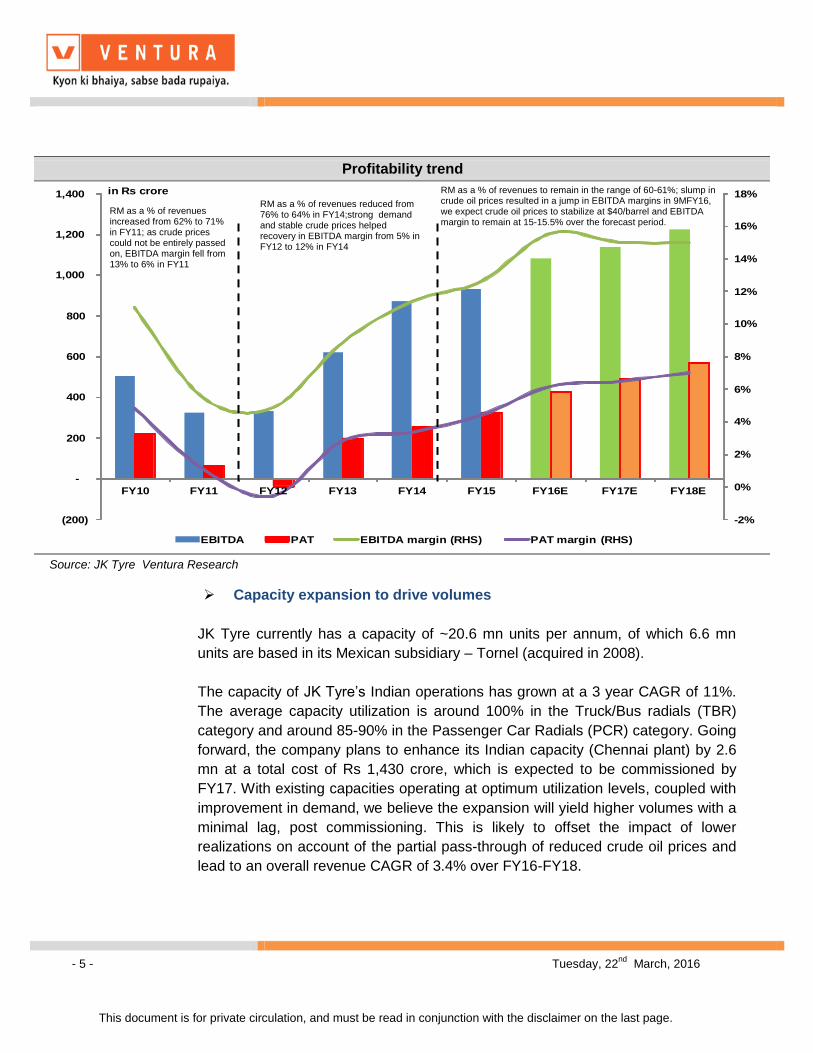
JK Tyre’s EBITDA and PAT have grown at a 5 year CAGR of 11% and 8% to Rs
948 crore and 324 crore respectively in FY15. During the period FY10-FY15, the
EBITDA margin has averaged at 9-10%, while the PAT margin has averaged at
~3-4%. With the softening of crude oil prices, its key input, the EBITDA margin
touched 16.8% in 9MFY16, a jump of 460 bps YoY. Going forward, we expect
crude oil prices to settle at $40/barrel and have factored in EBITDA margins of
15%-15.5% over our forecast period of FY16-18.
Revenue Growth trend
-20%
-10%
0%
10%
20%
30%
40%
0
1000
2000
3000
4000
5000
6000
7000
8000
9000
FY10 FY11 FY12 FY13 FY14 FY15 FY16E FY17E FY18E
Rs cr
Revenue Revenue Growth (RHS)
Source: JK Tyre Ventura Research
Revenue growth: 31% Demand: Strong Crude Prices: Sharp recovery from $30 to $96/ barrel as global economy started to pick-up
Revenue growth: 6.2% Demand: Started to slowdown owing to policy logjam and halt in capex cycle Crude Prices: Consolidated between $100-$110/barrel
Revenue growth: 3.4% Demand: Recovering Crude Prices: Sharp slump back to $30/barrel;
expected to settle at around $40/barrel
- 5 - Tuesday, 22nd
March, 2016
This document is for private circulation, and must be read in conjunction with the disclaimer on the last page.
Capacity expansion to drive volumes
JK Tyre currently has a capacity of ~20.6 mn units per annum, of which 6.6 mn
units are based in its Mexican subsidiary – Tornel (acquired in 2008).
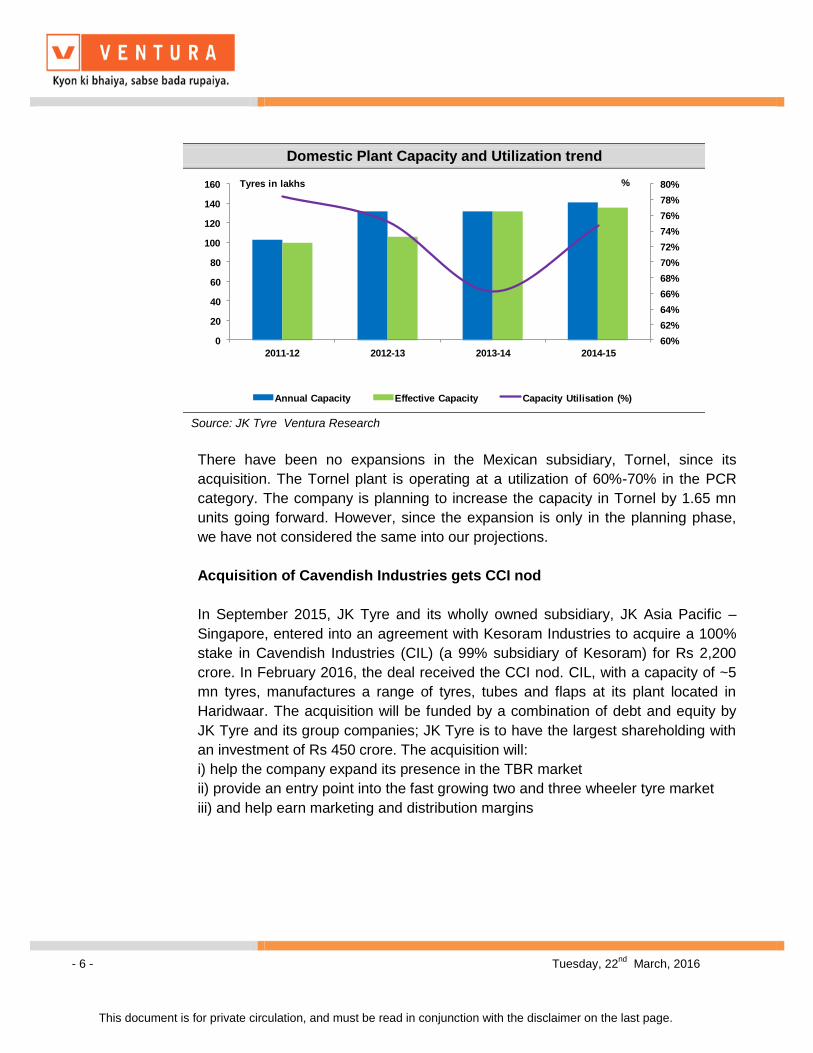
The capacity of JK Tyre’s Indian operations has grown at a 3 year CAGR of 11%.
The average capacity utilization is around 100% in the Truck/Bus radials (TBR)
category and around 85-90% in the Passenger Car Radials (PCR) category. Going
forward, the company plans to enhance its Indian capacity (Chennai plant) by 2.6
mn at a total cost of Rs 1,430 crore, which is expected to be commissioned by
FY17. With existing capacities operating at optimum utilization levels, coupled with
improvement in demand, we believe the expansion will yield higher volumes with a
minimal lag, post commissioning. This is likely to offset the impact of lower
realizations on account of the partial pass-through of reduced crude oil prices and
lead to an overall revenue CAGR of 3.4% over FY16-FY18.
Profitability trend
-2%
0%
2%
4%
6%
8%
10%
12%
14%
16%
18%
(200)
-
200
400
600
800
1,000
1,200
1,400
FY10 FY11 FY12 FY13 FY14 FY15 FY16E FY17E FY18E
in Rs crore
EBITDA PAT EBITDA margin (RHS) PAT margin (RHS)
Source: JK Tyre Ventura Research
RM as a % of revenues increased from 62% to 71% in FY11; as crude prices could not be entirely passed on, EBITDA margin fell from 13% to 6% in FY11
RM as a % of revenues reduced from 76% to 64% in FY14;strong demand and stable crude prices helped recovery in EBITDA margin from 5% in FY12 to 12% in FY14
RM as a % of revenues to remain in the range of 60-61%; slump in crude oil prices resulted in a jump in EBITDA margins in 9MFY16, we expect crude oil prices to stabilize at $40/barrel and EBITDA margin to remain at 15-15.5% over the forecast period.
- 6 - Tuesday, 22nd
March, 2016
This document is for private circulation, and must be read in conjunction with the disclaimer on the last page.
There have been no expansions in the Mexican subsidiary, Tornel, since its
acquisition. The Tornel plant is operating at a utilization of 60%-70% in the PCR
category. The company is planning to increase the capacity in Tornel by 1.65 mn
units going forward. However, since the expansion is only in the planning phase,
we have not considered the same into our projections.
Acquisition of Cavendish Industries gets CCI nod
In September 2015, JK Tyre and its wholly owned subsidiary, JK Asia Pacific –
Singapore, entered into an agreement with Kesoram Industries to acquire a 100%
stake in Cavendish Industries (CIL) (a 99% subsidiary of Kesoram) for Rs 2,200
crore. In February 2016, the deal received the CCI nod. CIL, with a capacity of ~5
mn tyres, manufactures a range of tyres, tubes and flaps at its plant located in
Haridwaar. The acquisition will be funded by a combination of debt and equity by
JK Tyre and its group companies; JK Tyre is to have the largest shareholding with
an investment of Rs 450 crore. The acquisition will:
i) help the company expand its presence in the TBR market
ii) provide an entry point into the fast growing two and three wheeler tyre market
iii) and help earn marketing and distribution margins
Domestic Plant Capacity and Utilization trend
60%
62%
64%
66%
68%
70%
72%
74%
76%
78%
80%
0
20
40
60
80
100
120
140
160
2011-12 2012-13 2013-14 2014-15
Annual Capacity Effective Capacity Capacity Utilisation (%)
Tyres in lakhs %
Source: JK Tyre Ventura Research
- 7 - Tuesday, 22nd
March, 2016
This document is for private circulation, and must be read in conjunction with the disclaimer on the last page.
Radialisation and soft commodity prices to boost margins
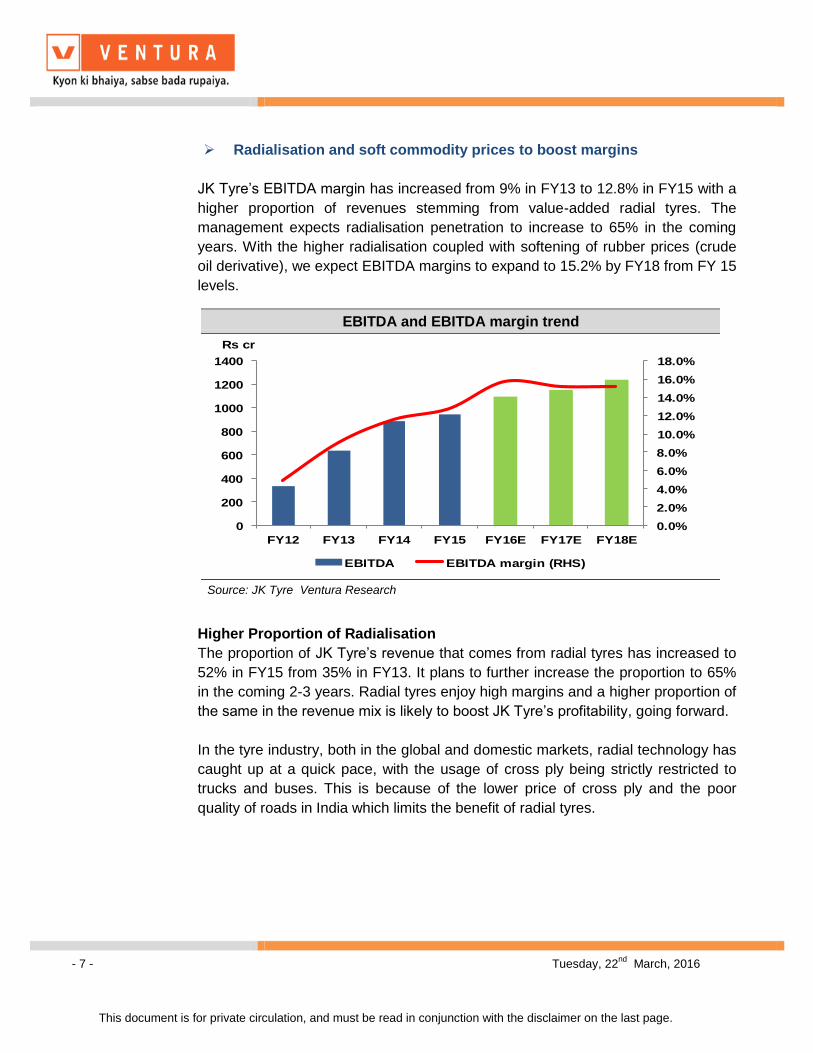
JK Tyre’s EBITDA margin has increased from 9% in FY13 to 12.8% in FY15 with a
higher proportion of revenues stemming from value-added radial tyres. The
management expects radialisation penetration to increase to 65% in the coming
years. With the higher radialisation coupled with softening of rubber prices (crude
oil derivative), we expect EBITDA margins to expand to 15.2% by FY18 from FY 15
levels.
Higher Proportion of Radialisation
The proportion of JK Tyre’s revenue that comes from radial tyres has increased to
52% in FY15 from 35% in FY13. It plans to further increase the proportion to 65%
in the coming 2-3 years. Radial tyres enjoy high margins and a higher proportion of
the same in the revenue mix is likely to boost JK Tyre’s profitability, going forward.
In the tyre industry, both in the global and domestic markets, radial technology has
caught up at a quick pace, with the usage of cross ply being strictly restricted to
trucks and buses. This is because of the lower price of cross ply and the poor
quality of roads in India which limits the benefit of radial tyres.
EBITDA and EBITDA margin trend
0.0%
2.0%
4.0%
6.0%
8.0%
10.0%
12.0%
14.0%
16.0%
18.0%
0
200
400
600
800
1000
1200
1400
FY12 FY13 FY14 FY15 FY16E FY17E FY18E
Rs cr
EBITDA EBITDA margin (RHS)
Source: JK Tyre Ventura Research
- 8 - Tuesday, 22nd
March, 2016
This document is for private circulation, and must be read in conjunction with the disclaimer on the last page.
I
In India, radialisation in the TBR (truck and bus radial) segment is ~18%, much
lower than the world average of ~68%, signifying huge growth potential. Going
forward, we expect demand for radial tyres, especially in the TBR segment, to pick
up given:
Increasing push from OEMs for new launches
Radial tyres, which offer higher life and fuel efficiency, are being pushed by
the OEMs for new launches. Radial tyres enjoy relatively higher margins
viz. 300-400 bps than cross ply tyres. JK Tyre, being the market leader in
radial tyres in India, will be the biggest beneficiary of the increasing shift of
the industry towards radial tyres.
.
Improvement in road infrastructure
The Modi government has placed high importance on upgrading the road
infrastructure in India. For instance, the government will convert eight
According to the Automotive Tyre Manufacturers’ Association (ATMA),
radialisation is touted as perhaps the ‘most important innovation in tyre
technology,’ and its future in India depends on user education, overload control,
road development, retreading infrastructure and the cost-benefit ratio. Although
India’s passenger vehicle segment has adopted radial technology, a large part of
the country continues to use cross-ply as the level of radial penetration is rather
dismal in the commercial vehicle segment. The advantages of radial tyres remains
undisputed. Radial tyres:
Are susceptible to fewer punctures,
Have a shorter braking distance and flexible sidewalls, and hence offer
better control
Save fuel and show greater resistance to wear
Despite the cost and operational benefits these tyres offer, Indian fleet operators
are hesitant to adopt this technology because of the state of Indian road
infrastructure, which is often well below standard norms.
In India, the radial tyre market is growing at the rate of 5%-6% annually due to high
demand from OEMs. Demand from OEMs stands at 70% in the TBR segment and 30% in
the aftermarket segment. According to a study conducted by Continental, the Indian truck
tyre replacement market has a volume of approximately 14 million units per year, out of
which almost 4 million units are radial tyres, whereas the other 10 million are bias tyres.
- 9 - Tuesday, 22nd
March, 2016
This document is for private circulation, and must be read in conjunction with the disclaimer on the last page.
national highways into world-class expressways; a total cost of Rs 16,800
crore has been ear-marked for construction of 1000 kms of expressways.
Revival of stalled road projects
New roads will pep-up demand for radial tyres, which offer better
performance, speed and durability.
Penalty on overloading
Radial tyres are not preferred for unscrupulous practice of over-loading of
trucks. The government has imposed stringent penalties on over-loading –
10 times the toll rates and immediate off-loading of the excess luggage.
Adequate penalties on over loading will ensure higher penetration.
Commercial Vehicle segments to recover
With the pick-up in industrial activity, growth in the MHCV (medium-heavy
commercial vehicle) space is expected to result in 8.3% growth in the CV
segment in FY16. The growth will be driven by:
i) Union Budget 2016-17 has spelled out a number of agri-oriented
measures, including higher allocations for irrigation and soil testing, thrust
to organic farming along with adequate physical and digital infrastructure
support. With higher spends on agriculture, demand for tractors and trucks
will revive.
ii) In order to curb air pollution, the Government is seeking to ban
commercial vehicles older than 15 years and will force all such trucks off-
road effective April 2016. This is likely to pep-up CV demand.
iii) Declining fuel prices and expected recovery in industrial sectors such as
coal, cement and steel will boost CV sales.
iv) Sales of buses are also expected to remain healthy, led by the
replacement of buses under the Jawaharlal Nehru National Urban Renewal
Mission (JNNURM) phase II.
- 10 - Tuesday, 22nd
March, 2016
This document is for private circulation, and must be read in conjunction with the disclaimer on the last page.
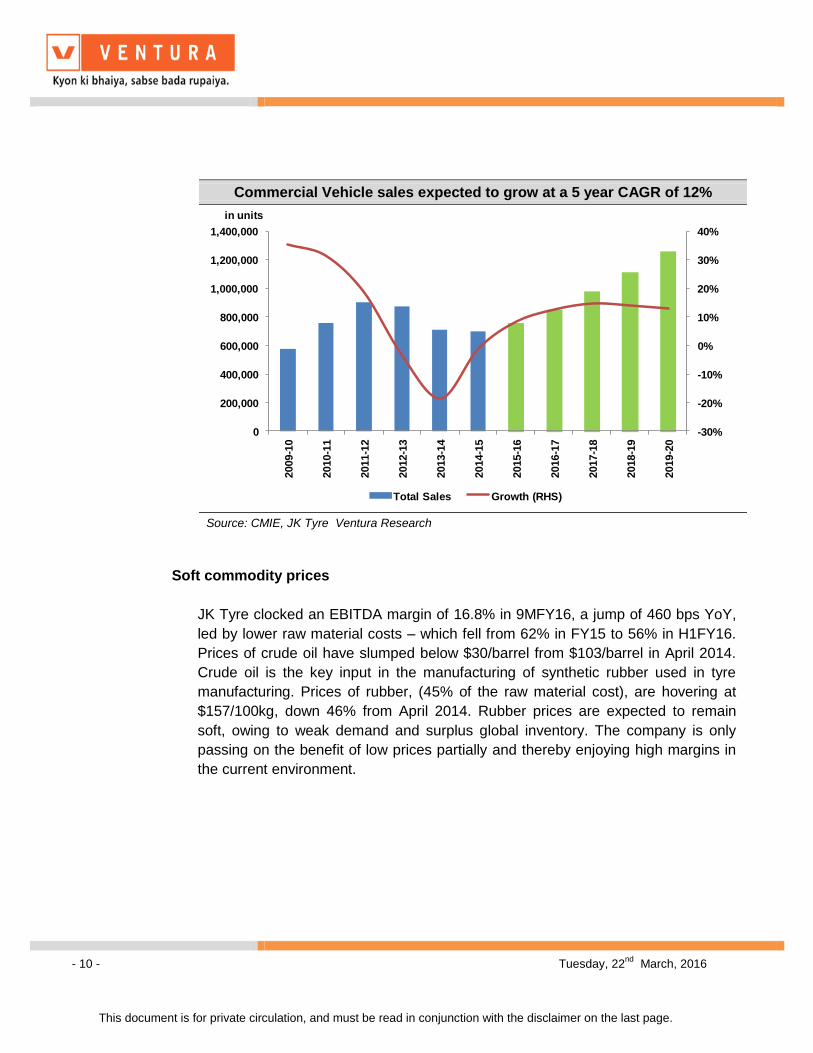
Soft commodity prices
JK Tyre clocked an EBITDA margin of 16.8% in 9MFY16, a jump of 460 bps YoY,
led by lower raw material costs – which fell from 62% in FY15 to 56% in H1FY16.
Prices of crude oil have slumped below $30/barrel from $103/barrel in April 2014.
Crude oil is the key input in the manufacturing of synthetic rubber used in tyre
manufacturing. Prices of rubber, (45% of the raw material cost), are hovering at
$157/100kg, down 46% from April 2014. Rubber prices are expected to remain
soft, owing to weak demand and surplus global inventory. The company is only
passing on the benefit of low prices partially and thereby enjoying high margins in
the current environment.
Commercial Vehicle sales expected to grow at a 5 year CAGR of 12%
-30%
-20%
-10%
0%
10%
20%
30%
40%
0
200,000
400,000
600,000
800,000
1,000,000
1,200,000
1,400,000
2009-1
0
2010-1
1
2011-1
2
2012-1
3
2013-1
4
2014-1
5
2015-1
6
2016-1
7
2017-1
8
2018-1
9
2019-2
0
in units
Total Sales Growth (RHS)
Source: CMIE, JK Tyre Ventura Research
- 11 - Tuesday, 22nd
March, 2016
This document is for private circulation, and must be read in conjunction with the disclaimer on the last page.
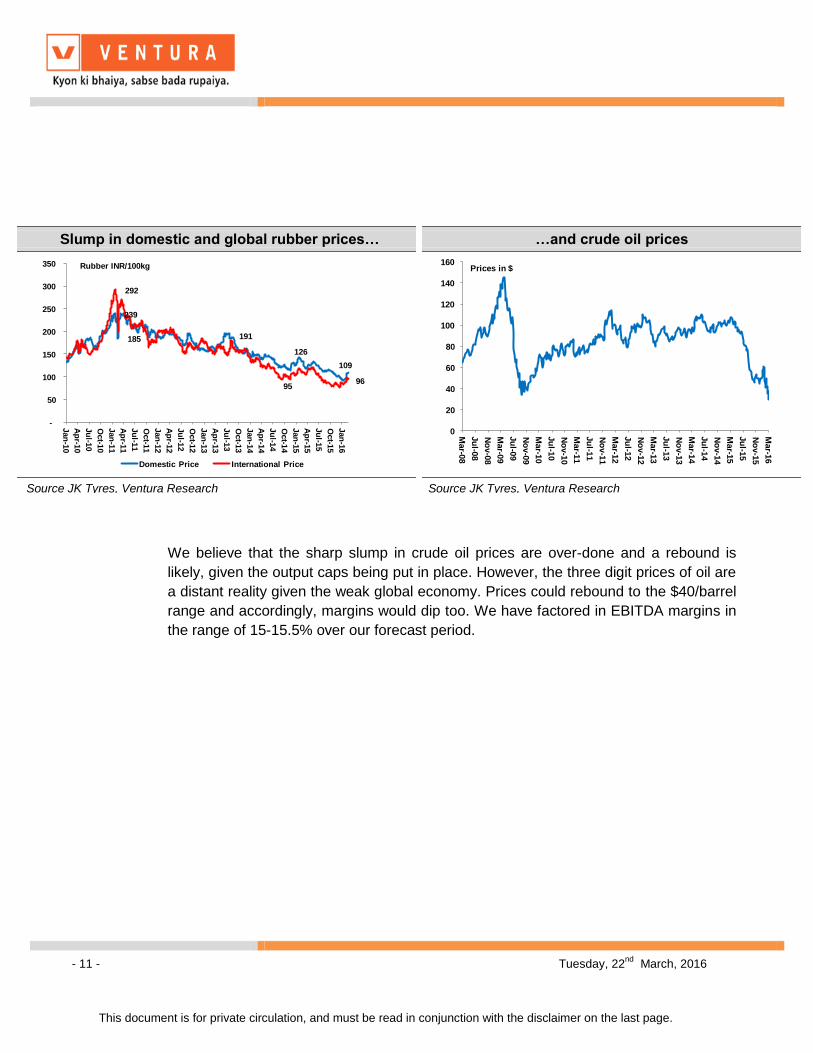
We believe that the sharp slump in crude oil prices are over-done and a rebound is
likely, given the output caps being put in place. However, the three digit prices of oil are
a distant reality given the weak global economy. Prices could rebound to the $40/barrel
range and accordingly, margins would dip too. We have factored in EBITDA margins in
the range of 15-15.5% over our forecast period.
Slump in domestic and global rubber prices…
239
185 191
126
109
292
95 96
-
50
100
150
200
250
300
350
Jan
-10
Ap
r-10
Ju
l-10
Oct-1
0
Jan
-11
Ap
r-11
Ju
l-11
Oct-1
1
Jan
-12
Ap
r-12
Ju
l-12
Oct-1
2
Jan
-13
Ap
r-13
Ju
l-13
Oct-1
3
Jan
-14
Ap
r-14
Ju
l-14
Oct-1
4
Jan
-15
Ap
r-15
Ju
l-15
Oct-1
5
Jan
-16
Domestic Price International Price
Rubber INR/100kg
Source JK Tyres, Ventura Research
…and crude oil prices
0
20
40
60
80
100
120
140
160
Mar-0
8
Ju
l-08
No
v-0
8
Mar-0
9
Ju
l-09
No
v-0
9
Mar-1
0
Ju
l-10
No
v-1
0
Mar-1
1
Ju
l-11
No
v-1
1
Mar-1
2
Ju
l-12
No
v-1
2
Mar-1
3
Ju
l-13
No
v-1
3
Mar-1
4
Ju
l-14
No
v-1
4
Mar-1
5
Ju
l-15
No
v-1
5
Mar-1
6
Prices in $
Source JK Tyres, Ventura Research
- 12 - Tuesday, 22nd
March, 2016
This document is for private circulation, and must be read in conjunction with the disclaimer on the last page.
Key Risks
Volatile crude prices
Crude prices may have already bottomed out and there is the possibility that the low
cost environment may become a thing of the past. Global oil supplies are likely to be
maintained at January levels. This deal has the support of 15 OPEC and non-OPEC
members (the notable exclusion being Iran), which together account for 73% of
international output. The deal is to be finalized in a meeting scheduled in April 2016.
Controlled supply could lead to a bounce back in crude oil to around $40/barrel and
result in a rise in raw material costs, given that 45% of raw material costs are linked to
crude.
Curbs on rubber imports to inflate costs marginally
To protect the domestic rubber plantations the import of cheap natural rubber from
China has been banned from Jan 21, 2016 to March 31, 2016. Further continuation of
this ban could lead to higher raw material costs.
- 13 - Tuesday, 22nd
March, 2016
This document is for private circulation, and must be read in conjunction with the disclaimer on the last page.
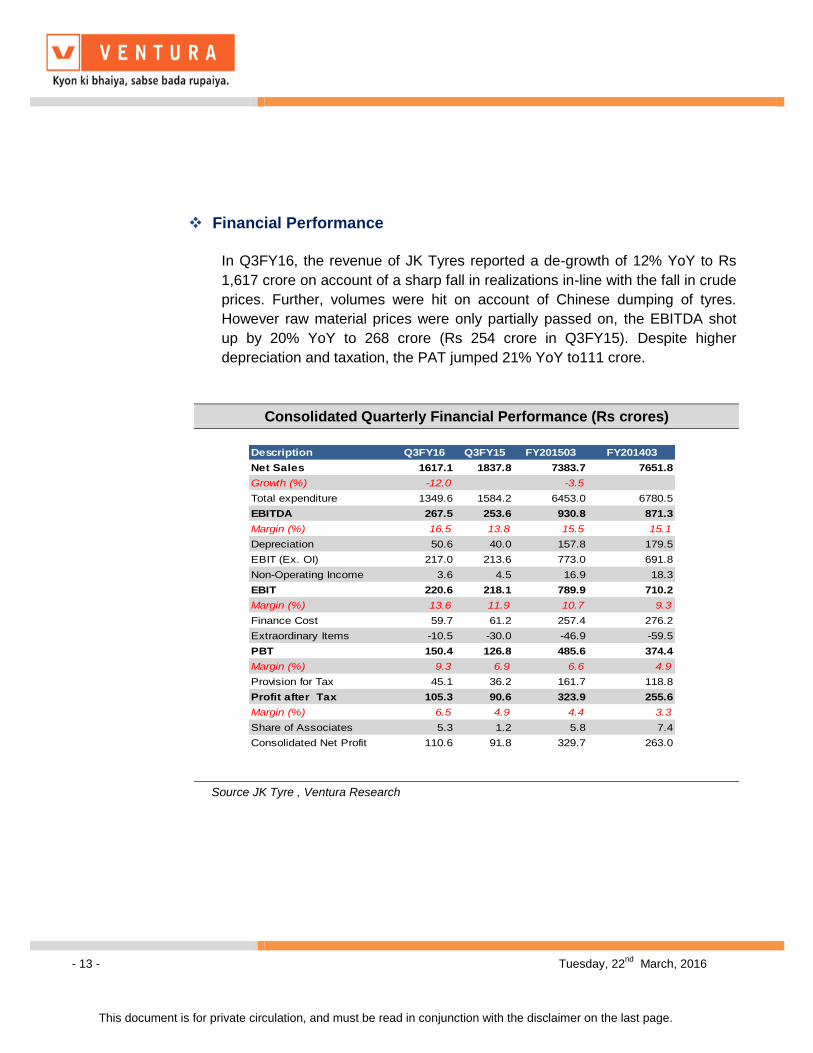
Financial Performance
In Q3FY16, the revenue of JK Tyres reported a de-growth of 12% YoY to Rs
1,617 crore on account of a sharp fall in realizations in-line with the fall in crude
prices. Further, volumes were hit on account of Chinese dumping of tyres.
However raw material prices were only partially passed on, the EBITDA shot
up by 20% YoY to 268 crore (Rs 254 crore in Q3FY15). Despite higher
depreciation and taxation, the PAT jumped 21% YoY to111 crore.
Consolidated Quarterly Financial Performance (Rs crores)
Description Q3FY16 Q3FY15 FY201503 FY201403
Net Sales 1617.1 1837.8 7383.7 7651.8
Growth (%) -12.0 -3.5
Total expenditure 1349.6 1584.2 6453.0 6780.5
EBITDA 267.5 253.6 930.8 871.3
Margin (%) 16.5 13.8 15.5 15.1
Depreciation 50.6 40.0 157.8 179.5
EBIT (Ex. OI) 217.0 213.6 773.0 691.8
Non-Operating Income 3.6 4.5 16.9 18.3
EBIT 220.6 218.1 789.9 710.2
Margin (%) 13.6 11.9 10.7 9.3
Finance Cost 59.7 61.2 257.4 276.2
Extraordinary Items -10.5 -30.0 -46.9 -59.5
PBT 150.4 126.8 485.6 374.4
Margin (%) 9.3 6.9 6.6 4.9
Provision for Tax 45.1 36.2 161.7 118.8
Profit after Tax 105.3 90.6 323.9 255.6
Margin (%) 6.5 4.9 4.4 3.3
Share of Associates 5.3 1.2 5.8 7.4
Consolidated Net Profit 110.6 91.8 329.7 263.0
Source JK Tyre , Ventura Research
- 14 - Tuesday, 22nd
March, 2016
This document is for private circulation, and must be read in conjunction with the disclaimer on the last page.
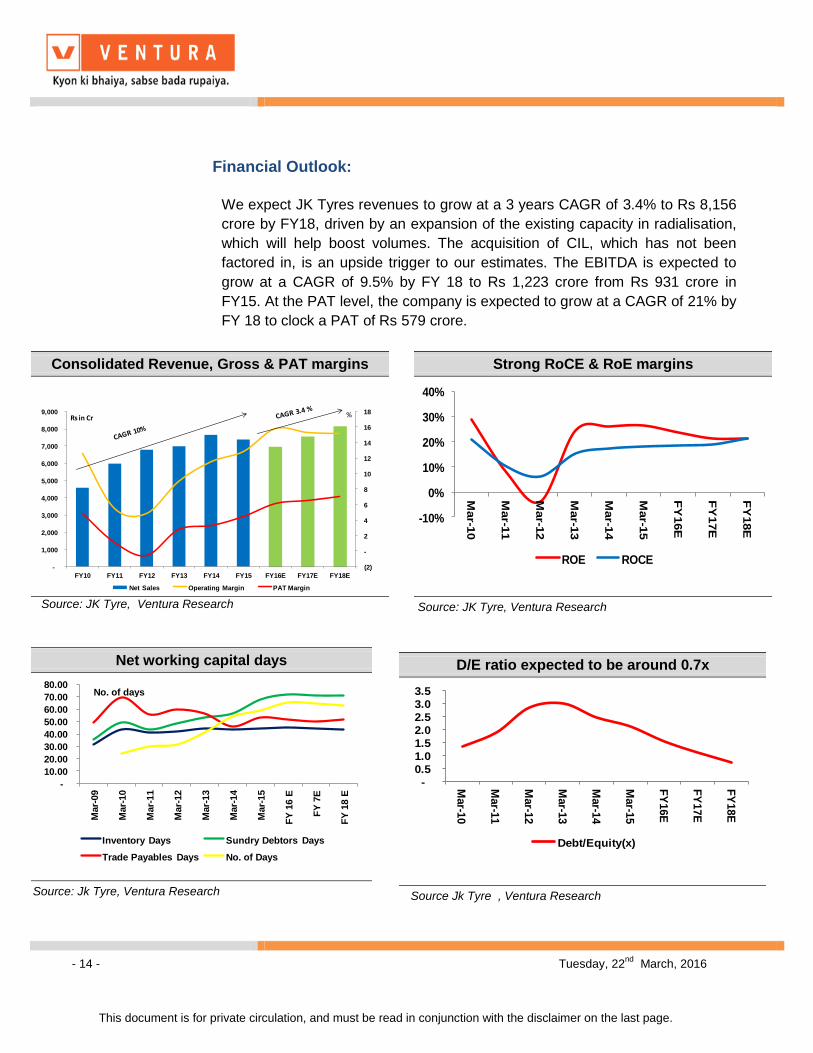
Financial Outlook:
We expect JK Tyres revenues to grow at a 3 years CAGR of 3.4% to Rs 8,156
crore by FY18, driven by an expansion of the existing capacity in radialisation,
which will help boost volumes. The acquisition of CIL, which has not been
factored in, is an upside trigger to our estimates. The EBITDA is expected to
grow at a CAGR of 9.5% by FY 18 to Rs 1,223 crore from Rs 931 crore in
FY15. At the PAT level, the company is expected to grow at a CAGR of 21% by
FY 18 to clock a PAT of Rs 579 crore.
Consolidated Revenue, Gross & PAT margins
(2)
-
2
4
6
8
10
12
14
16
18
-
1,000
2,000
3,000
4,000
5,000
6,000
7,000
8,000
9,000
FY10 FY11 FY12 FY13 FY14 FY15 FY16E FY17E FY18E
Net Sales Operating Margin PAT Margin
Rs in Cr %
Source: JK Tyre, Ventura Research
Strong RoCE & RoE margins
-10%
0%
10%
20%
30%
40%
Mar-1
0
Mar-1
1
Mar-1
2
Mar-1
3
Mar-1
4
Mar-1
5
FY
16E
FY
17E
FY
18E
ROE ROCE
Source: JK Tyre, Ventura Research
Net working capital days
-
10.00
20.00
30.00
40.00
50.00
60.00
70.00
80.00
Mar-
09
Mar-
10
Mar-
11
Mar-
12
Mar-
13
Mar-
14
Mar-
15
FY
16 E
FY
7E
FY
18 E
Inventory Days Sundry Debtors Days
Trade Payables Days No. of Days
No. of days
Source: Jk Tyre, Ventura Research
D/E ratio expected to be around 0.7x
-
0.5
1.0
1.5
2.0
2.5
3.0
3.5
Mar-1
0
Mar-1
1
Mar-1
2
Mar-1
3
Mar-1
4
Mar-1
5
FY
16E
FY
17E
FY
18E
Debt/Equity(x)
Source Jk Tyre , Ventura Research
- 15 - Tuesday, 22nd
March, 2016
This document is for private circulation, and must be read in conjunction with the disclaimer on the last page.
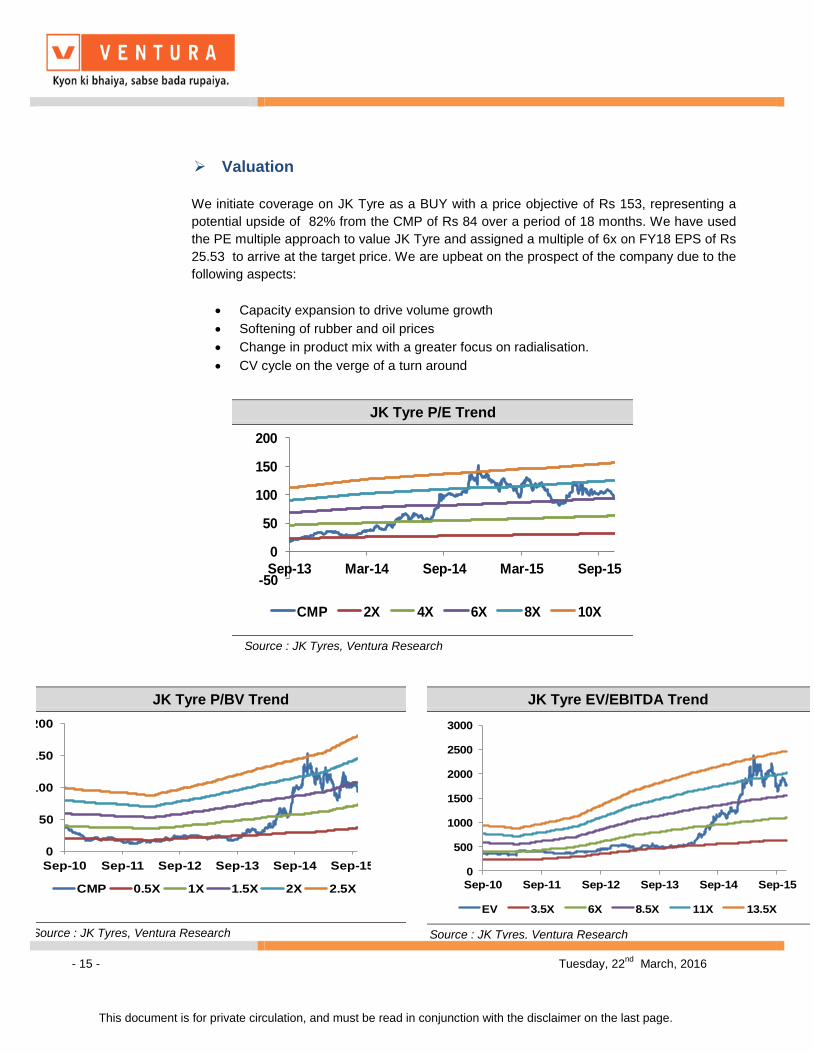
Valuation
We initiate coverage on JK Tyre as a BUY with a price objective of Rs 153, representing a
potential upside of 82% from the CMP of Rs 84 over a period of 18 months. We have used
the PE multiple approach to value JK Tyre and assigned a multiple of 6x on FY18 EPS of Rs
25.53 to arrive at the target price. We are upbeat on the prospect of the company due to the
following aspects:
Capacity expansion to drive volume growth
Softening of rubber and oil prices
Change in product mix with a greater focus on radialisation.
CV cycle on the verge of a turn around
JK Tyre P/E Trend
-50
0
50
100
150
200
Sep-13 Mar-14 Sep-14 Mar-15 Sep-15
CMP 2X 4X 6X 8X 10X
Source : JK Tyres, Ventura Research
JK Tyre P/BV Trend
0
50
100
150
200
Sep-10 Sep-11 Sep-12 Sep-13 Sep-14 Sep-15
CMP 0.5X 1X 1.5X 2X 2.5X
Source : JK Tyres, Ventura Research
JK Tyre EV/EBITDA Trend
0
500
1000
1500
2000
2500
3000
Sep-10 Sep-11 Sep-12 Sep-13 Sep-14 Sep-15
EV 3.5X 6X 8.5X 11X 13.5X
Source : JK Tyres, Ventura Research
- 16 - Tuesday, 22nd
March, 2016
This document is for private circulation, and must be read in conjunction with the disclaimer on the last page.
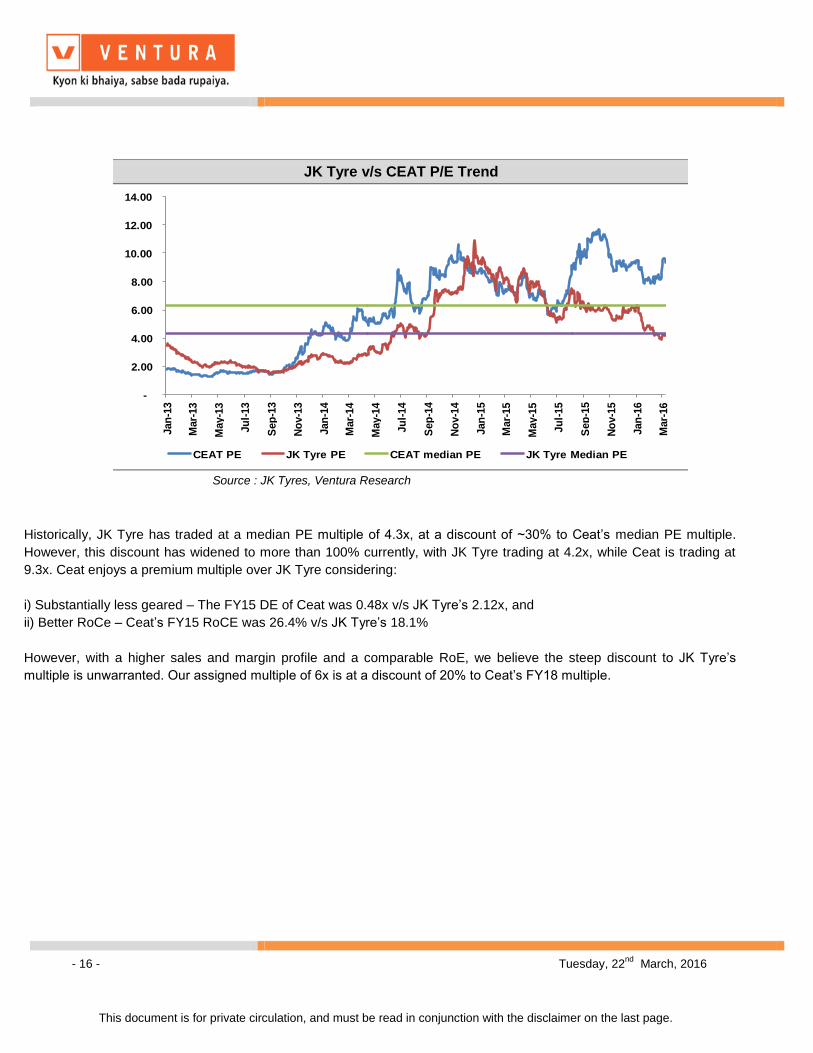
Historically, JK Tyre has traded at a median PE multiple of 4.3x, at a discount of ~30% to Ceat’s median PE multiple.
However, this discount has widened to more than 100% currently, with JK Tyre trading at 4.2x, while Ceat is trading at
9.3x. Ceat enjoys a premium multiple over JK Tyre considering:
i) Substantially less geared – The FY15 DE of Ceat was 0.48x v/s JK Tyre’s 2.12x, and
ii) Better RoCe – Ceat’s FY15 RoCE was 26.4% v/s JK Tyre’s 18.1%
However, with a higher sales and margin profile and a comparable RoE, we believe the steep discount to JK Tyre’s
multiple is unwarranted. Our assigned multiple of 6x is at a discount of 20% to Ceat’s FY18 multiple.
JK Tyre v/s CEAT P/E Trend
-
2.00
4.00
6.00
8.00
10.00
12.00
14.00
Jan
-13
Mar-
13
May-1
3
Ju
l-13
Sep
-13
No
v-1
3
Jan
-14
Mar-
14
May-1
4
Ju
l-14
Sep
-14
No
v-1
4
Jan
-15
Mar-
15
May-1
5
Ju
l-15
Sep
-15
No
v-1
5
Jan
-16
Mar-
16
CEAT PE JK Tyre PE CEAT median PE JK Tyre Median PE
Source : JK Tyres, Ventura Research
- 17 - Tuesday, 22nd
March, 2016
This document is for private circulation, and must be read in conjunction with the disclaimer on the last page.
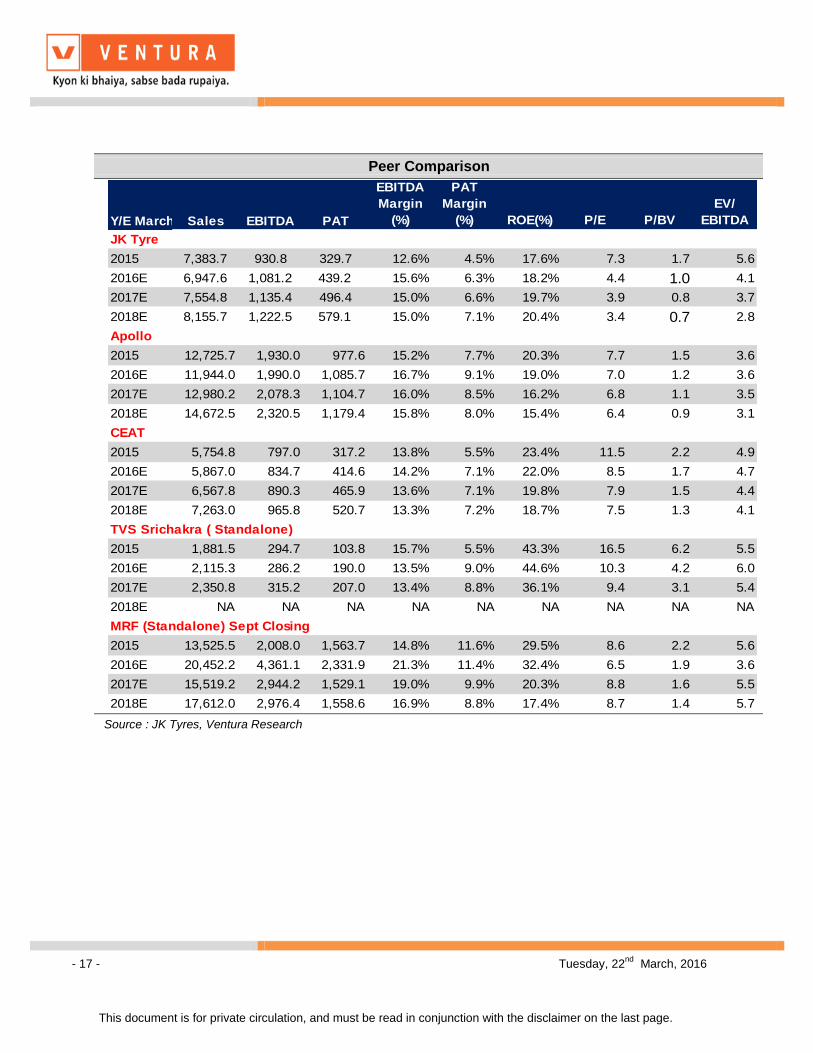
Peer Comparison
Y/E March Sales EBITDA PAT
EBITDA
Margin
(%)
PAT
Margin
(%) ROE(%) P/E P/BV
EV/
EBITDA
JK Tyre
2015 7,383.7 930.8 329.7 12.6% 4.5% 17.6% 7.3 1.7 5.6
2016E 6,947.6 1,081.2 439.2 15.6% 6.3% 18.2% 4.4 1.0 4.1
2017E 7,554.8 1,135.4 496.4 15.0% 6.6% 19.7% 3.9 0.8 3.7
2018E 8,155.7 1,222.5 579.1 15.0% 7.1% 20.4% 3.4 0.7 2.8
Apollo
2015 12,725.7 1,930.0 977.6 15.2% 7.7% 20.3% 7.7 1.5 3.6
2016E 11,944.0 1,990.0 1,085.7 16.7% 9.1% 19.0% 7.0 1.2 3.6
2017E 12,980.2 2,078.3 1,104.7 16.0% 8.5% 16.2% 6.8 1.1 3.5
2018E 14,672.5 2,320.5 1,179.4 15.8% 8.0% 15.4% 6.4 0.9 3.1
CEAT
2015 5,754.8 797.0 317.2 13.8% 5.5% 23.4% 11.5 2.2 4.9
2016E 5,867.0 834.7 414.6 14.2% 7.1% 22.0% 8.5 1.7 4.7
2017E 6,567.8 890.3 465.9 13.6% 7.1% 19.8% 7.9 1.5 4.4
2018E 7,263.0 965.8 520.7 13.3% 7.2% 18.7% 7.5 1.3 4.1
TVS Srichakra ( Standalone)
2015 1,881.5 294.7 103.8 15.7% 5.5% 43.3% 16.5 6.2 5.5
2016E 2,115.3 286.2 190.0 13.5% 9.0% 44.6% 10.3 4.2 6.0
2017E 2,350.8 315.2 207.0 13.4% 8.8% 36.1% 9.4 3.1 5.4
2018E NA NA NA NA NA NA NA NA NA
MRF (Standalone) Sept Closing
2015 13,525.5 2,008.0 1,563.7 14.8% 11.6% 29.5% 8.6 2.2 5.6
2016E 20,452.2 4,361.1 2,331.9 21.3% 11.4% 32.4% 6.5 1.9 3.6
2017E 15,519.2 2,944.2 1,529.1 19.0% 9.9% 20.3% 8.8 1.6 5.5
2018E 17,612.0 2,976.4 1,558.6 16.9% 8.8% 17.4% 8.7 1.4 5.7
Source : JK Tyres, Ventura Research
- 18 - Tuesday, 22nd
March, 2016
This document is for private circulation, and must be read in conjunction with the disclaimer on the last page.
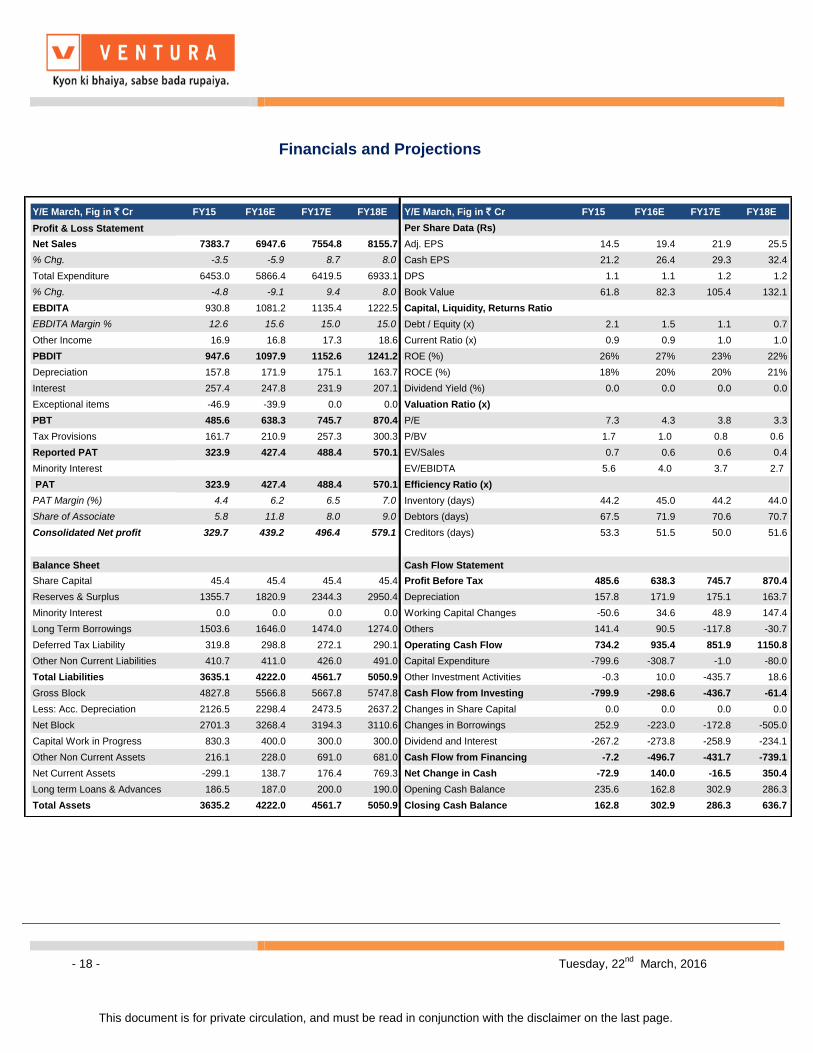
Financials and Projections
Y/E March, Fig in ` Cr FY15 FY16E FY17E FY18E Y/E March, Fig in ` Cr FY15 FY16E FY17E FY18E
Profit & Loss Statement Per Share Data (Rs)
Net Sales 7383.7 6947.6 7554.8 8155.7 Adj. EPS 14.5 19.4 21.9 25.5
% Chg. -3.5 -5.9 8.7 8.0 Cash EPS 21.2 26.4 29.3 32.4
Total Expenditure 6453.0 5866.4 6419.5 6933.1 DPS 1.1 1.1 1.2 1.2
% Chg. -4.8 -9.1 9.4 8.0 Book Value 61.8 82.3 105.4 132.1
EBDITA 930.8 1081.2 1135.4 1222.5 Capital, Liquidity, Returns Ratio
EBDITA Margin % 12.6 15.6 15.0 15.0 Debt / Equity (x) 2.1 1.5 1.1 0.7
Other Income 16.9 16.8 17.3 18.6 Current Ratio (x) 0.9 0.9 1.0 1.0
PBDIT 947.6 1097.9 1152.6 1241.2 ROE (%) 26% 27% 23% 22%
Depreciation 157.8 171.9 175.1 163.7 ROCE (%) 18% 20% 20% 21%
Interest 257.4 247.8 231.9 207.1 Dividend Yield (%) 0.0 0.0 0.0 0.0
Exceptional items -46.9 -39.9 0.0 0.0 Valuation Ratio (x)
PBT 485.6 638.3 745.7 870.4 P/E 7.3 4.3 3.8 3.3
Tax Provisions 161.7 210.9 257.3 300.3 P/BV 1.7 1.0 0.8 0.6
Reported PAT 323.9 427.4 488.4 570.1 EV/Sales 0.7 0.6 0.6 0.4
Minority Interest EV/EBIDTA 5.6 4.0 3.7 2.7
PAT 323.9 427.4 488.4 570.1 Efficiency Ratio (x)
PAT Margin (%) 4.4 6.2 6.5 7.0 Inventory (days) 44.2 45.0 44.2 44.0
Share of Associate 5.8 11.8 8.0 9.0 Debtors (days) 67.5 71.9 70.6 70.7
Consolidated Net profit 329.7 439.2 496.4 579.1 Creditors (days) 53.3 51.5 50.0 51.6
Balance Sheet Cash Flow Statement
Share Capital 45.4 45.4 45.4 45.4 Profit Before Tax 485.6 638.3 745.7 870.4
Reserves & Surplus 1355.7 1820.9 2344.3 2950.4 Depreciation 157.8 171.9 175.1 163.7
Minority Interest 0.0 0.0 0.0 0.0 Working Capital Changes -50.6 34.6 48.9 147.4
Long Term Borrowings 1503.6 1646.0 1474.0 1274.0 Others 141.4 90.5 -117.8 -30.7
Deferred Tax Liability 319.8 298.8 272.1 290.1 Operating Cash Flow 734.2 935.4 851.9 1150.8
Other Non Current Liabilities 410.7 411.0 426.0 491.0 Capital Expenditure -799.6 -308.7 -1.0 -80.0
Total Liabilities 3635.1 4222.0 4561.7 5050.9 Other Investment Activities -0.3 10.0 -435.7 18.6
Gross Block 4827.8 5566.8 5667.8 5747.8 Cash Flow from Investing -799.9 -298.6 -436.7 -61.4
Less: Acc. Depreciation 2126.5 2298.4 2473.5 2637.2 Changes in Share Capital 0.0 0.0 0.0 0.0
Net Block 2701.3 3268.4 3194.3 3110.6 Changes in Borrowings 252.9 -223.0 -172.8 -505.0
Capital Work in Progress 830.3 400.0 300.0 300.0 Dividend and Interest -267.2 -273.8 -258.9 -234.1
Other Non Current Assets 216.1 228.0 691.0 681.0 Cash Flow from Financing -7.2 -496.7 -431.7 -739.1
Net Current Assets -299.1 138.7 176.4 769.3 Net Change in Cash -72.9 140.0 -16.5 350.4
Long term Loans & Advances 186.5 187.0 200.0 190.0 Opening Cash Balance 235.6 162.8 302.9 286.3
Total Assets 3635.2 4222.0 4561.7 5050.9 Closing Cash Balance 162.8 302.9 286.3 636.7
- 19 - Tuesday, 22nd
March, 2016
This document is for private circulation, and must be read in conjunction with the disclaimer on the last page.
Disclosures and Disclaimer
Ventura Securities Limited (VSL) is a SEBI registered intermediary offering broking, depository and portfolio management services to clients. VSL is member of BSE, NSE and MCX-
SX. VSL is a depository participant of NSDL. VSL states that no disciplinary action whatsoever has been taken by SEBI against it in last five years except administrative warning
issued in connection with technical and venial lapses observed while inspection of books of accounts and records. Ventura Commodities Limited, Ventura Guaranty Limited, Ventura
Insurance Brokers Limited and Ventura Allied Services Private Limited are associates of VSL. Research Analyst (RA) involved in the preparation of this research report and VSL
disclose that neither RA nor VSL nor its associates (i) have any financial interest in the company which is the subject matter of this research report (ii) holds ownership of one percent
or more in the securities of subject company (iii) have any material conflict of interest at the time of publication of this research report (iv) have received any compensation from the
subject company in the past twelve months (v) have managed or co-managed public offering of securities for the subject company in past twelve months (vi) have received any
compensation for investment banking merchant banking or brokerage services from the subject company in the past twelve months (vii) have received any compensation for product or
services from the subject company in the past twelve months (viii) have received any compensation or other benefits from the subject company or third party in connection with the
research report. RA involved in the preparation of this research report discloses that he / she has not served as an officer, director or employee of the subject company. RA involved in
the preparation of this research report and VSL discloses that they have not been engaged in the market making activity for the subject company. Our sales people, dealers, traders
and other professionals may provide oral or written market commentary or trading strategies to our clients that reflect opinions that are contrary to the opinions expressed herein. We
may have earlier issued or may issue in future reports on the companies covered herein with recommendations/ information inconsistent or different those made in this report. In
reviewing this document, you should be aware that any or all of the foregoing, among other things, may give rise to or potential conflicts of interest. We may rely on information
barriers, such as "Chinese Walls" to control the flow of information contained in one or more areas within us, or other areas, units, groups or affiliates of VSL. This report is for
information purposes only and this document/material should not be construed as an offer to sell or the solicitation of an offer to buy, purchase or subscribe to any securities, and
neither this document nor anything contained herein shall form the basis of or be relied upon in connection with any contract or commitment whatsoever. This document does not
solicit any action based on the material contained herein. It is for the general information of the clients / prospective clients of VSL. VSL will not treat recipients as clients by virtue of
their receiving this report. It does not constitute a personal recommendation or take into account the particular investment objectives, financial situations, or needs of clients /
prospective clients. Similarly, this document does not have regard to the specific investment objectives, financial situation/circumstances and the particular needs of any specific
person who may receive this document. The securities discussed in this report may not be suitable for all investors. The appropriateness of a particular investment or strategy will
depend on an investor's individual circumstances and objectives. Persons who may receive this document should consider and independently evaluate whether it is suitable for his/
her/their particular circumstances and, if necessary, seek professional/financial advice. And such person shall be responsible for conducting his/her/their own investigation and
analysis of the information contained or referred to in this document and of evaluating the merits and risks involved in the securities forming the subject matter of this document. The
projections and forecasts described in this report were based upon a number of estimates and assumptions and are inherently subject to significant uncertainties and contingencies.
Projections and forecasts are necessarily speculative in nature, and it can be expected that one or more of the estimates on which the projections and forecasts were based will not
materialize or will vary significantly from actual results, and such variances will likely increase over time. All projections and forecasts described in this report have been prepared
solely by the authors of this report independently of the Company. These projections and forecasts were not prepared with a view toward compliance with published guidelines or
generally accepted accounting principles. No independent accountants have expressed an opinion or any other form of assurance on these projections or forecasts. You should not
regard the inclusion of the projections and forecasts described herein as a representation or warranty by VSL, its associates, the authors of this report or any other person that these
projections or forecasts or their underlying assumptions will be achieved. For these reasons, you should only consider the projections and forecasts described in this report after
carefully evaluating all of the information in this report, including the assumptions underlying such projections and forecasts. The price and value of the investments referred to in this
document/material and the income from them may go down as well as up, and investors may realize losses on any investments. Past performance is not a guide for future
performance. Future returns are not guaranteed and a loss of original capital may occur. Actual results may differ materially from those set forth in projections. Forward-looking
statements are not predictions and may be subject to change without notice. We do not provide tax advice to our clients, and all investors are strongly advised to consult regarding any
potential investment. VSL, the RA involved in the preparation of this research report and its associates accept no liabilities for any loss or damage of any kind arising out of the use of
this report. This report/document has been prepared by VSL, based upon information available to the public and sources, believed to be reliable. No representation or warranty,
express or implied is made that it is accurate or complete. VSL has reviewed the report and, in so far as it includes current or historical information, it is believed to be reliable, although
its accuracy and completeness cannot be guaranteed. The opinions expressed in this document/material are subject to change without notice and have no obligation to tell you when
opinions or information in this report change. This report or recommendations or information contained herein do/does not constitute or purport to constitute investment advice in
publicly accessible media and should not be reproduced, transmitted or published by the recipient. The report is for the use and consumption of the recipient only. This publication may
not be distributed to the public used by the public media without the express written consent of VSL. This report or any portion hereof may not be printed, sold or distributed without the
written consent of VSL. This document does not constitute an offer or invitation to subscribe for or purchase or deal in any securities and neither this document nor anything contained
herein shall form the basis of any contract or commitment whatsoever. This document is strictly confidential and is being furnished to you solely for your information, may not be
distributed to the press or other media and may not be reproduced or redistributed to any other person. The opinions and projections expressed herein are entirely those of the author
and are given as part of the normal research activity of VSL and are given as of this date and are subject to change without notice. Any opinion estimate or projection herein
constitutes a view as of the date of this report and there can be no assurance that future results or events will be consistent with any such opinions, estimate or projection. This
document has not been prepared by or in conjunction with or on behalf of or at the instigation of, or by arrangement with the company or any of its directors or any other person.
Information in this document must not be relied upon as having been authorized or approved by the company or its directors or any other person. Any opinions and projections
contained herein are entirely those of the authors. None of the company or its directors or any other person accepts any liability whatsoever for any loss arising from any use of this
document or its contents or otherwise arising in connection therewith. The information contained herein is not intended for publication or distribution or circulation in any manner
whatsoever and any unauthorized reading, dissemination, distribution or copying of this communication is prohibited unless otherwise expressly authorized. Please ensure that you
have read “Risk Disclosure Document for Capital Market and Derivatives Segments” as prescribed by Securities and Exchange Board of India before investing in Securities Market.
Ventura Securities Limited
Corporate Office: C-112/116, Bldg No. 1, Kailash Industrial Complex, Park Site, Vikhroli (W), Mumbai – 400079