Embed Size (px)
Citation preview
Copyright @ 2014 Jindal Steel & Power Limited 1 Copyright @ 2014 Jindal Steel & Power Limited 1
3QFY15 (December’ 14)
Jindal Steel and Power Ltd
Investor Presentation
Copyright @ 2014 Jindal Steel & Power Limited 2 Copyright @ 2014 Jindal Steel & Power Limited 2
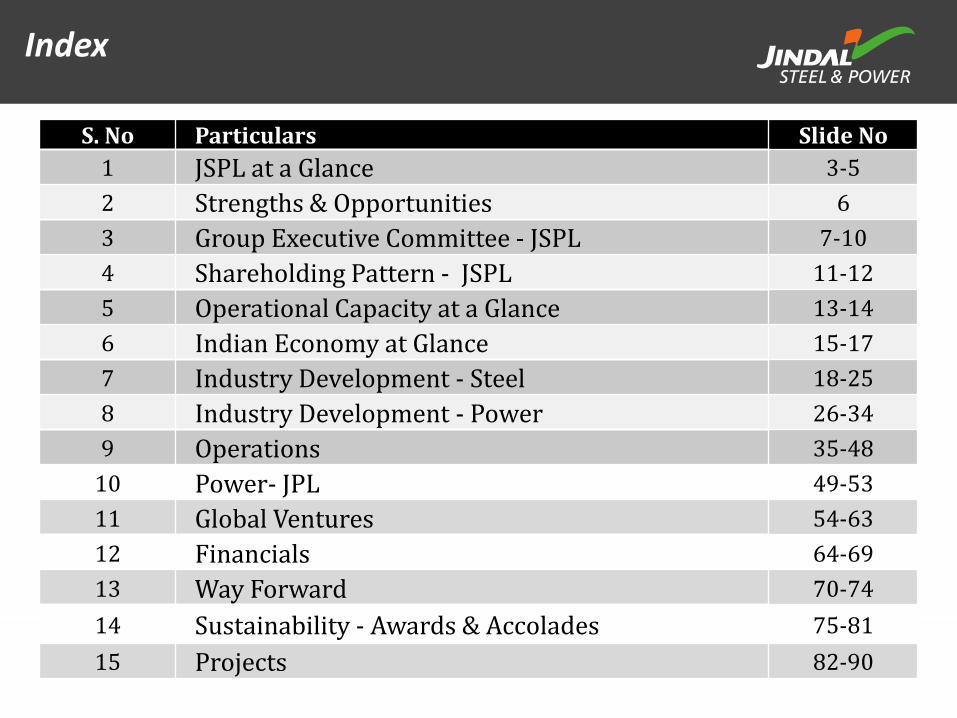
Index
S. No Particulars Slide No
1 JSPL at a Glance 3-5
2 Strengths & Opportunities 6
3 Group Executive Committee - JSPL 7-10
4 Shareholding Pattern - JSPL 11-12
5 Operational Capacity at a Glance 13-14
6 Indian Economy at Glance 15-17
7 Industry Development - Steel 18-25
8 Industry Development - Power 26-34
9 Operations 35-48
10 Power- JPL 49-53
11 Global Ventures 54-63
12 Financials 64-69
13 Way Forward 70-74
14 Sustainability - Awards & Accolades 75-81
15 Projects 82-90

Copyright @ 2014 Jindal Steel & Power Limited 3 Copyright @ 2014 Jindal Steel & Power Limited 3
Jindal Steel & Power Limited Building the Nation of Our Dreams
Aerial View of Raigarh Plant
Copyright @ 2014 Jindal Steel & Power Limited 4 Copyright @ 2014 Jindal Steel & Power Limited 4
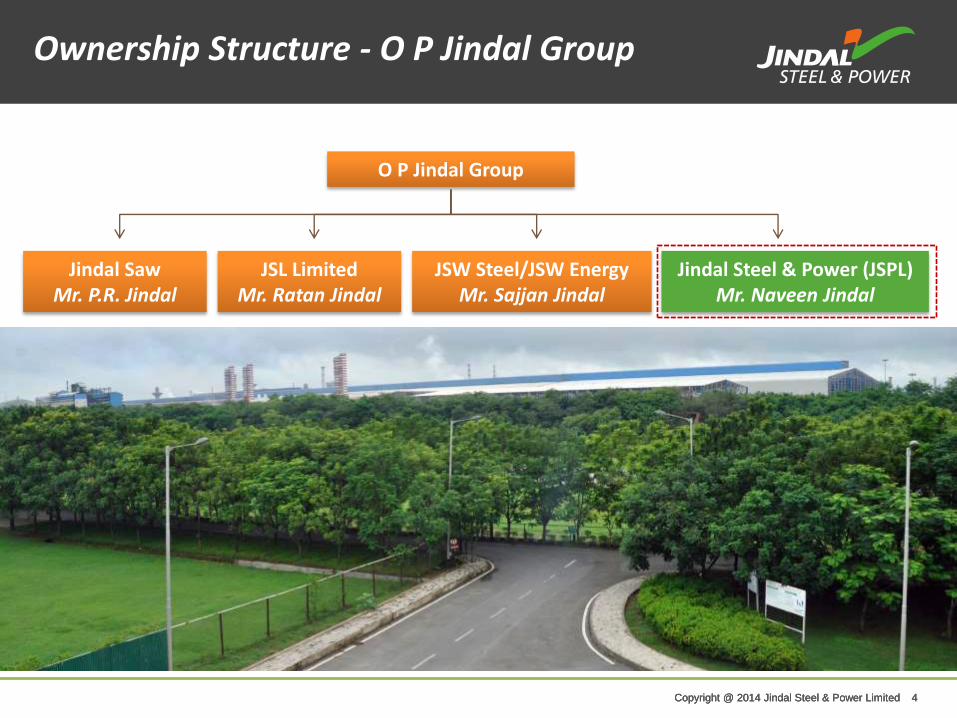
O P Jindal Group
Jindal Saw Mr. P.R. Jindal
JSL Limited Mr. Ratan Jindal
JSW Steel/JSW Energy Mr. Sajjan Jindal
Jindal Steel & Power (JSPL) Mr. Naveen Jindal
Copyright @ 2014 Jindal Steel & Power Limited 4
Ownership Structure - O P Jindal Group
Copyright @ 2014 Jindal Steel & Power Limited 5 Copyright @ 2014 Jindal Steel & Power Limited 5
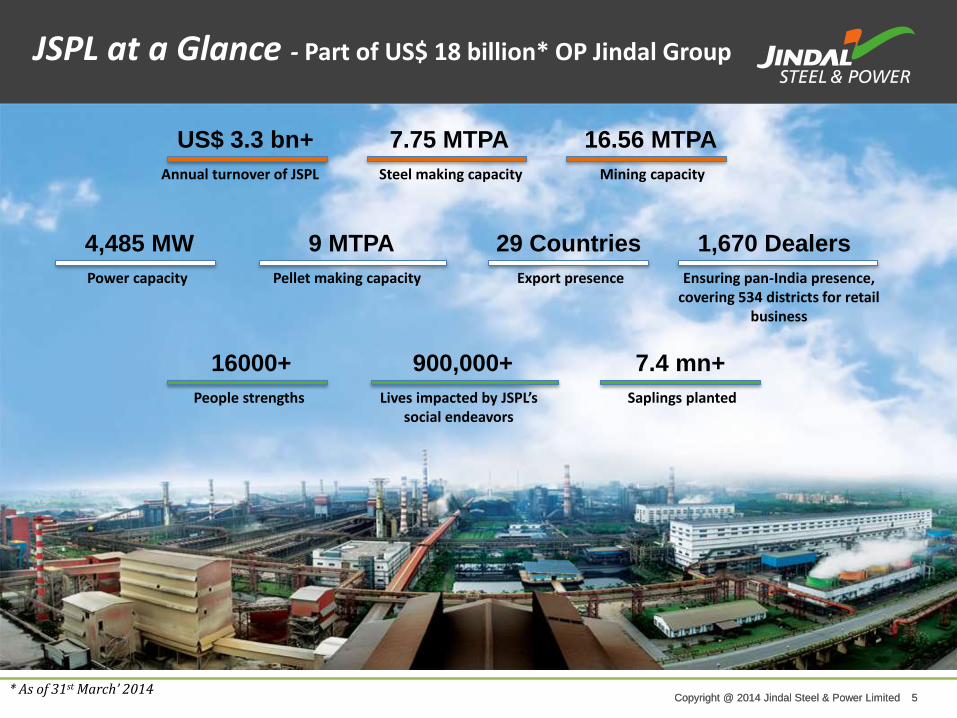
Annual turnover of JSPL
US$ 3.3 bn+
Steel making capacity Mining capacity
16.56 MTPA
Power capacity
4,485 MW
Pellet making capacity
9 MTPA 29 Countries
Ensuring pan-India presence, covering 534 districts for retail
business
People strengths
16000+
Lives impacted by JSPL’s social endeavors
900,000+
Saplings planted
7.4 mn+
7.75 MTPA
Export presence
1,670 Dealers
JSPL at a Glance - Part of US$ 18 billion* OP Jindal Group
* As of 31st March’ 2014

Copyright @ 2014 Jindal Steel & Power Limited 6 Copyright @ 2014 Jindal Steel & Power Limited 6
Strengths & Opportunities
• Successful commissioning of enhanced Steel & Power Capacities :
– Steel 3 MTPA to 7.75 MTPA
– JPL Power 1000MW to 3400 MW*
– Pellets 4.5 MTPA to 9 MTPA
• Proven track record of Highest Capacity Utilization
• Expertise in Mining operations – would help in faster ramp up of production from new coal mines
• Harness higher revenues from enhanced capacities
• Intrinsic value of the company – in Steel (45K Cr) and Power (20K Cr) is not reflected in its market cap (14K Cr**).
• Increase in demand in Steel & Power sectors will lead to higher revenue generation
• Opportunity to secure raw materials in the ensuing coal block auctions
Strengths Opportunities
• Includes 600 MW which will be commissioned in FY15 • ** As on 4th Feb’2015
Copyright @ 2014 Jindal Steel & Power Limited 7 Copyright @ 2014 Jindal Steel & Power Limited 7 Copyright @ 2014 Jindal Steel & Power Limited 7
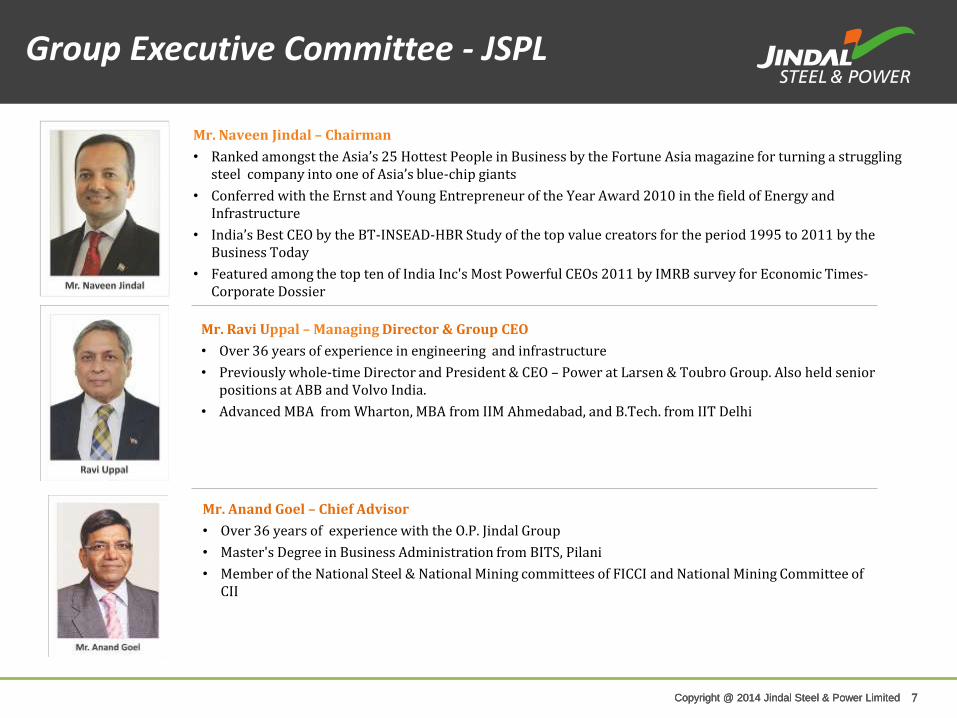
Mr. Naveen Jindal – Chairman
• Ranked amongst the Asia’s 25 Hottest People in Business by the Fortune Asia magazine for turning a struggling steel company into one of Asia’s blue-chip giants
• Conferred with the Ernst and Young Entrepreneur of the Year Award 2010 in the field of Energy and Infrastructure
• India’s Best CEO by the BT-INSEAD-HBR Study of the top value creators for the period 1995 to 2011 by the Business Today
• Featured among the top ten of India Inc's Most Powerful CEOs 2011 by IMRB survey for Economic Times-Corporate Dossier
Mr. Ravi Uppal – Managing Director & Group CEO
• Over 36 years of experience in engineering and infrastructure
• Previously whole-time Director and President & CEO – Power at Larsen & Toubro Group. Also held senior positions at ABB and Volvo India.
• Advanced MBA from Wharton, MBA from IIM Ahmedabad, and B.Tech. from IIT Delhi
Mr. Anand Goel – Chief Advisor
• Over 36 years of experience with the O.P. Jindal Group
• Master's Degree in Business Administration from BITS, Pilani
• Member of the National Steel & National Mining committees of FICCI and National Mining Committee of CII
Group Executive Committee - JSPL
Copyright @ 2014 Jindal Steel & Power Limited 8 Copyright @ 2014 Jindal Steel & Power Limited 8 Copyright @ 2014 Jindal Steel & Power Limited 8
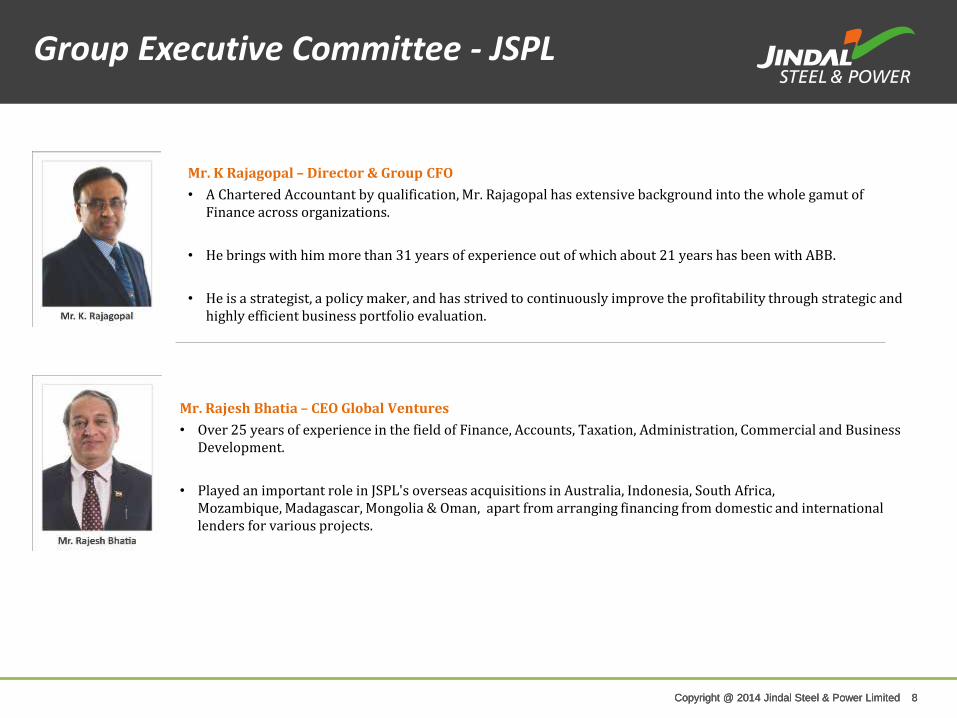
Mr. Rajesh Bhatia – CEO Global Ventures
• Over 25 years of experience in the field of Finance, Accounts, Taxation, Administration, Commercial and Business Development.
• Played an important role in JSPL's overseas acquisitions in Australia, Indonesia, South Africa, Mozambique, Madagascar, Mongolia & Oman, apart from arranging financing from domestic and international lenders for various projects.
Group Executive Committee - JSPL
Mr. K Rajagopal – Director & Group CFO
• A Chartered Accountant by qualification, Mr. Rajagopal has extensive background into the whole gamut of Finance across organizations.
• He brings with him more than 31 years of experience out of which about 21 years has been with ABB.
• He is a strategist, a policy maker, and has strived to continuously improve the profitability through strategic and highly efficient business portfolio evaluation.
Copyright @ 2014 Jindal Steel & Power Limited 9 Copyright @ 2014 Jindal Steel & Power Limited 9
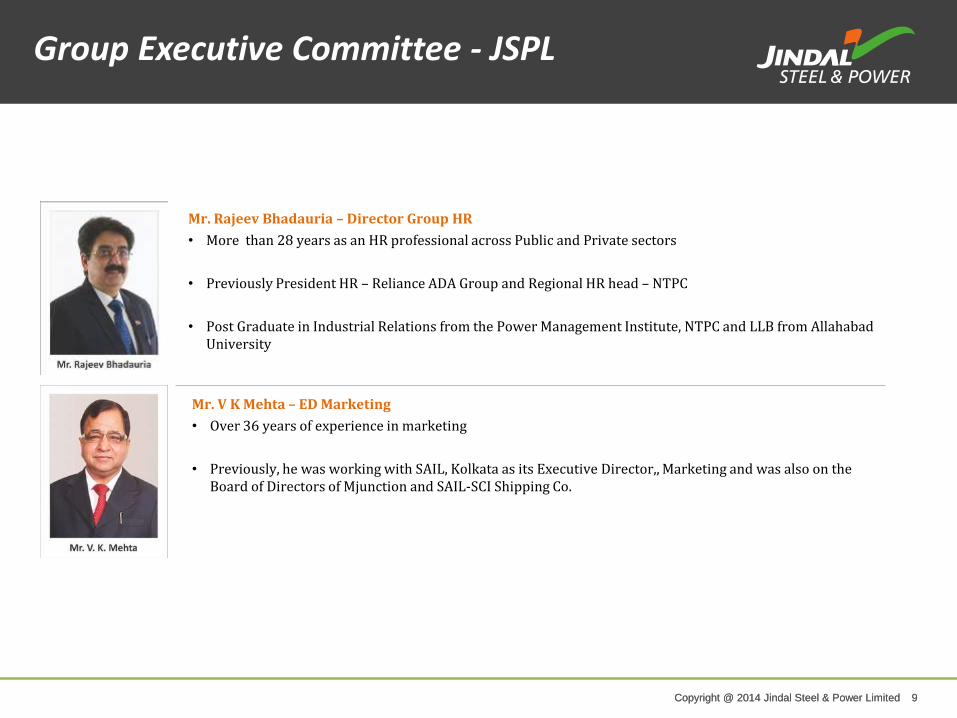
Mr. V K Mehta – ED Marketing
• Over 36 years of experience in marketing
• Previously, he was working with SAIL, Kolkata as its Executive Director,, Marketing and was also on the Board of Directors of Mjunction and SAIL-SCI Shipping Co.
Mr. Rajeev Bhadauria – Director Group HR
• More than 28 years as an HR professional across Public and Private sectors
• Previously President HR – Reliance ADA Group and Regional HR head – NTPC
• Post Graduate in Industrial Relations from the Power Management Institute, NTPC and LLB from Allahabad University
Group Executive Committee - JSPL
Copyright @ 2014 Jindal Steel & Power Limited 10 Copyright @ 2014 Jindal Steel & Power Limited 10
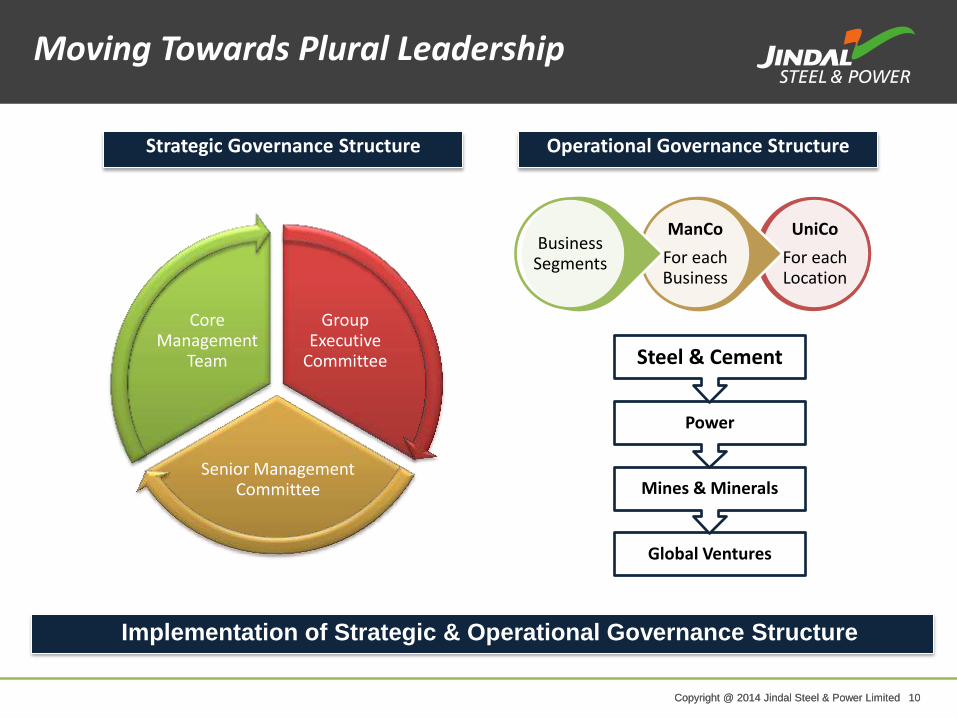
Group Executive
Committee
Senior Management Committee
Core Management
Team
UniCo
For each Location
ManCo
For each Business
Business Segments
Global Ventures
Mines & Minerals
Power
Steel & Cement
Moving Towards Plural Leadership
Strategic Governance Structure Operational Governance Structure
Implementation of Strategic & Operational Governance Structure
Copyright @ 2014 Jindal Steel & Power Limited 11 Copyright @ 2014 Jindal Steel & Power Limited 11
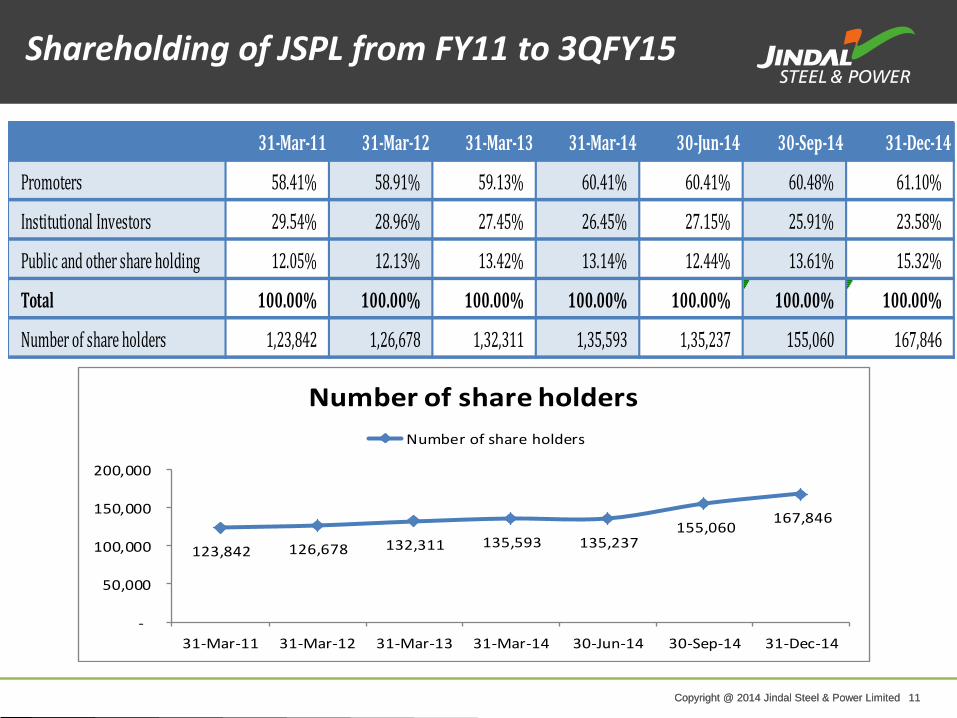
Shareholding of JSPL from FY11 to 3QFY15
Number of share holder s (Retail /HNI) increases by 15% in 2Q FY15
31-Mar-11 31-Mar-12 31-Mar-13 31-Mar-14 30-Jun-14 30-Sep-14 31-Dec-14
Promoters 58.41% 58.91% 59.13% 60.41% 60.41% 60.48% 61.10%
Institutional Investors 29.54% 28.96% 27.45% 26.45% 27.15% 25.91% 23.58%
Public and other share holding 12.05% 12.13% 13.42% 13.14% 12.44% 13.61% 15.32%
Total 100.00% 100.00% 100.00% 100.00% 100.00% 100.00% 100.00%
Number of share holders 1,23,842 1,26,678 1,32,311 1,35,593 1,35,237 155,060 167,846
123,842 126,678 132,311 135,593 135,237 155,060
167,846
-
50,000
100,000
150,000
200,000
31-Mar-11 31-Mar-12 31-Mar-13 31-Mar-14 30-Jun-14 30-Sep-14 31-Dec-14
Number of share holders
Number of share holders
Copyright @ 2014 Jindal Steel & Power Limited 12 Copyright @ 2014 Jindal Steel & Power Limited 12
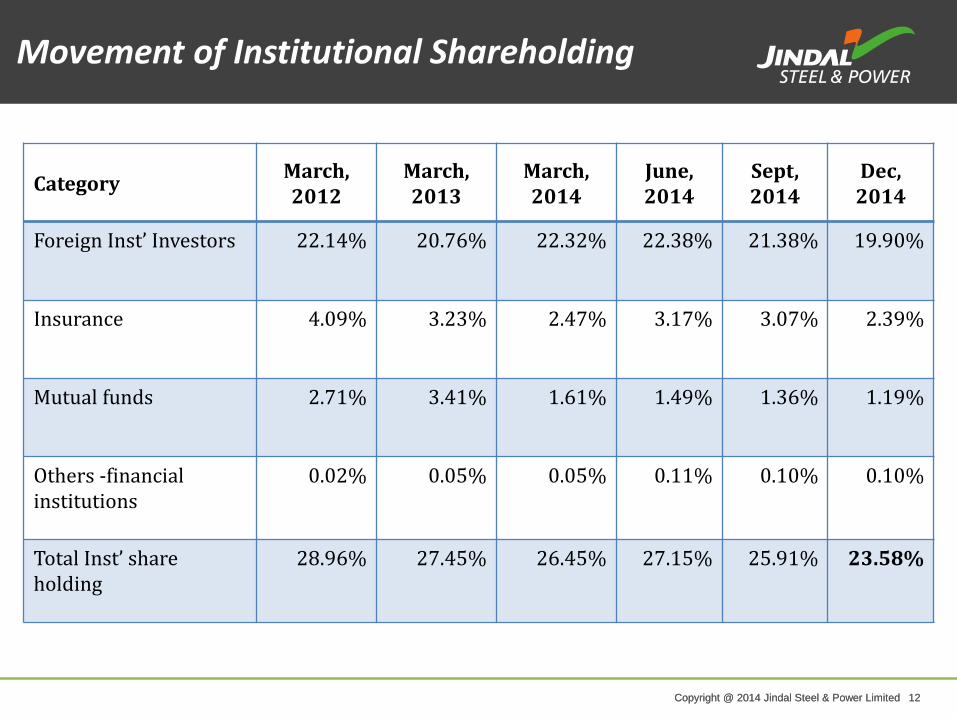
Category March, 2012
March, 2013
March, 2014
June, 2014
Sept, 2014
Dec, 2014
Foreign Inst’ Investors 22.14% 20.76% 22.32% 22.38% 21.38% 19.90%
Insurance 4.09% 3.23% 2.47% 3.17% 3.07% 2.39%
Mutual funds 2.71% 3.41% 1.61% 1.49% 1.36% 1.19%
Others -financial institutions
0.02% 0.05% 0.05% 0.11% 0.10% 0.10%
Total Inst’ share holding
28.96% 27.45% 26.45% 27.15% 25.91% 23.58%
Movement of Institutional Shareholding
Copyright @ 2014 Jindal Steel & Power Limited 13 Copyright @ 2014 Jindal Steel & Power Limited 13
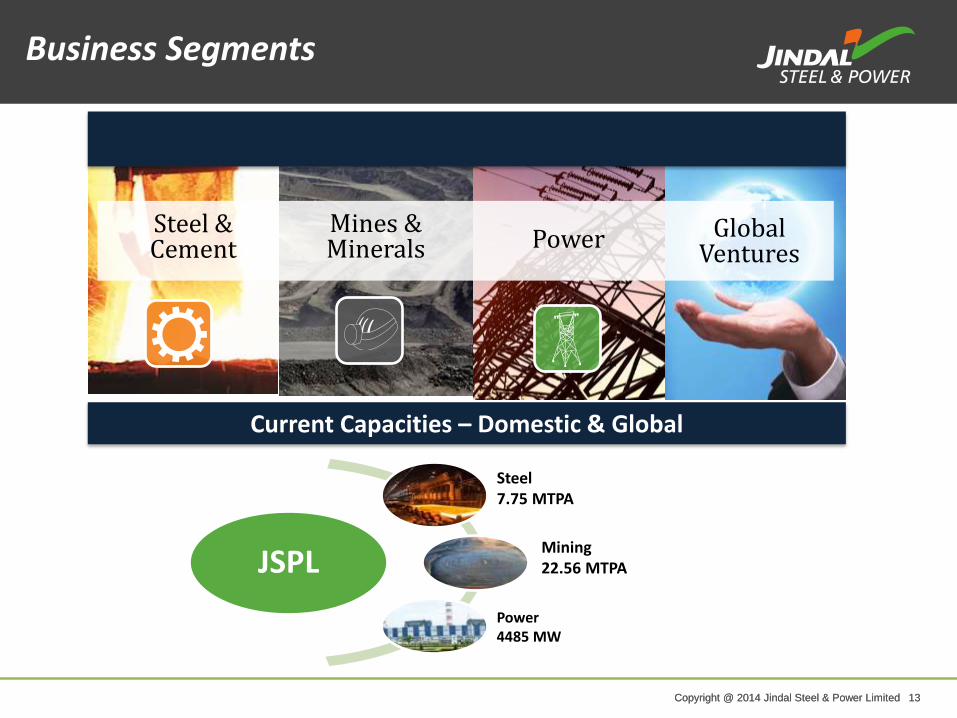
Steel & Cement Power
Mines & Minerals
Business segments
Global Ventures
JSPL
Steel 7.75 MTPA
Mining 22.56 MTPA
Power 4485 MW
Current Capacities – Domestic & Global
Business Segments
Copyright @ 2014 Jindal Steel & Power Limited 14 Copyright @ 2014 Jindal Steel & Power Limited 14
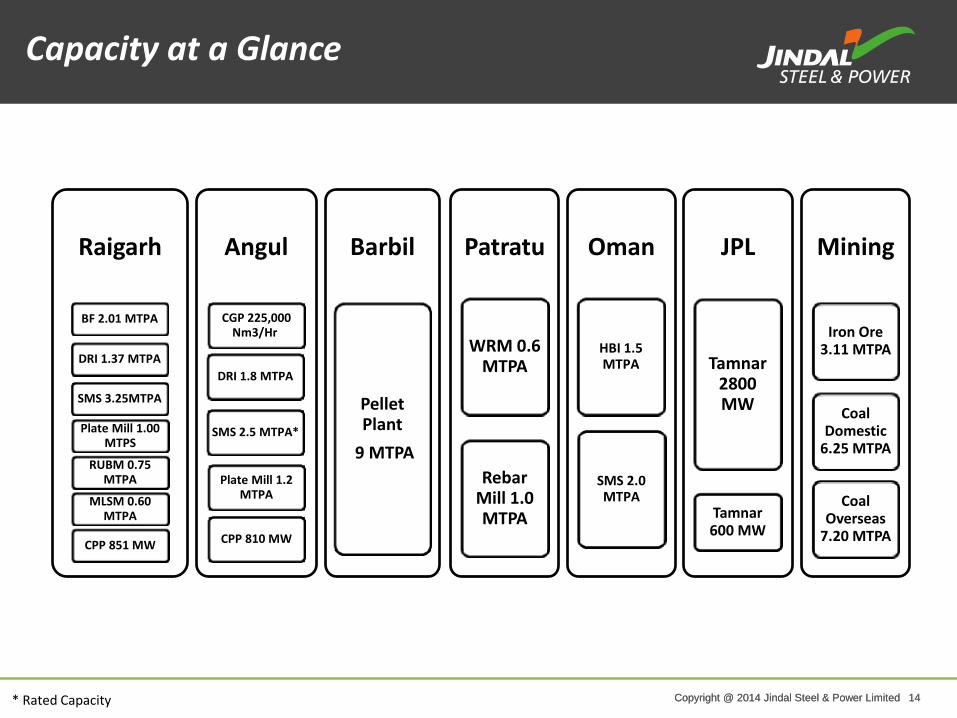
Capacity in deail
Raigarh
SMS 3.25MTPA
BF 2.01 MTPA
DRI 1.37 MTPA
Plate Mill 1.00 MTPS
RUBM 0.75 MTPA
MLSM 0.60 MTPA
CPP 851 MW
Angul
SMS 2.5 MTPA*
DRI 1.8 MTPA
CGP 225,000 Nm3/Hr
Plate Mill 1.2 MTPA
CPP 810 MW
Barbil
Pellet Plant
9 MTPA
Patratu
WRM 0.6 MTPA
Rebar Mill 1.0 MTPA
Oman
SMS 2.0 MTPA
HBI 1.5 MTPA
JPL
Tamnar 2800 MW
Tamnar 600 MW
Mining
Iron Ore 3.11 MTPA
Coal Domestic
6.25 MTPA
Coal Overseas
7.20 MTPA
Capacity at a Glance
* Rated Capacity

Copyright @ 2014 Jindal Steel & Power Limited 15 Copyright @ 2014 Jindal Steel & Power Limited 15
Copyright @ 2014 Jindal Steel & Power Limited 16 Copyright @ 2014 Jindal Steel & Power Limited 16
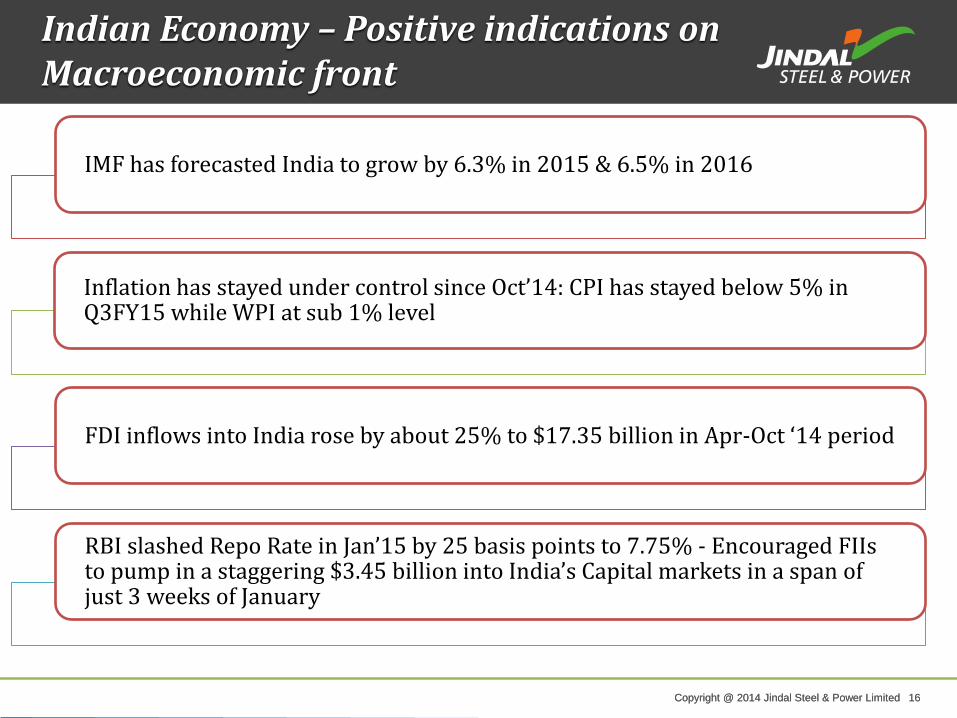
Indian Economy – Positive indications on Macroeconomic front
IMF has forecasted India to grow by 6.3% in 2015 & 6.5% in 2016
Inflation has stayed under control since Oct’14: CPI has stayed below 5% in Q3FY15 while WPI at sub 1% level
FDI inflows into India rose by about 25% to $17.35 billion in Apr-Oct ‘14 period
RBI slashed Repo Rate in Jan’15 by 25 basis points to 7.75% - Encouraged FIIs to pump in a staggering $3.45 billion into India’s Capital markets in a span of just 3 weeks of January
Copyright @ 2014 Jindal Steel & Power Limited 17 Copyright @ 2014 Jindal Steel & Power Limited 17
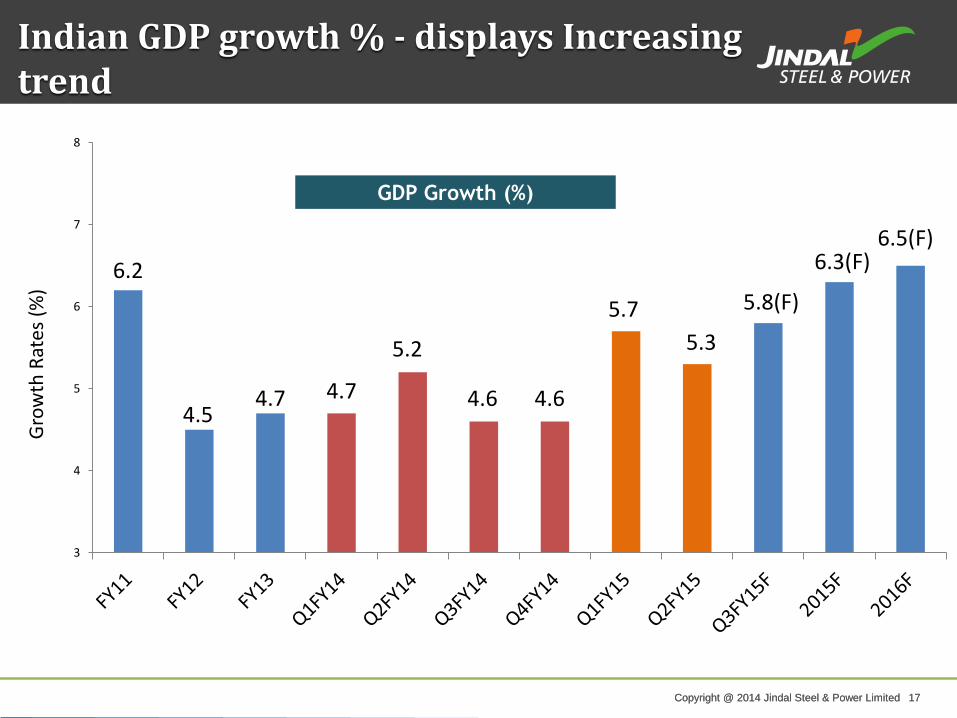
Indian GDP growth % - displays Increasing trend
6.2
4.5 4.7 4.7
5.2
4.6 4.6
5.7
5.3
5.8(F)
6.3(F) 6.5(F)
3
4
5
6
7
8
Gro
wth
Rat
es (
%)
GDP Growth (%)
Copyright @ 2014 Jindal Steel & Power Limited 18 Copyright @ 2014 Jindal Steel & Power Limited 18
Copyright @ 2014 Jindal Steel & Power Limited 19 Copyright @ 2014 Jindal Steel & Power Limited 19
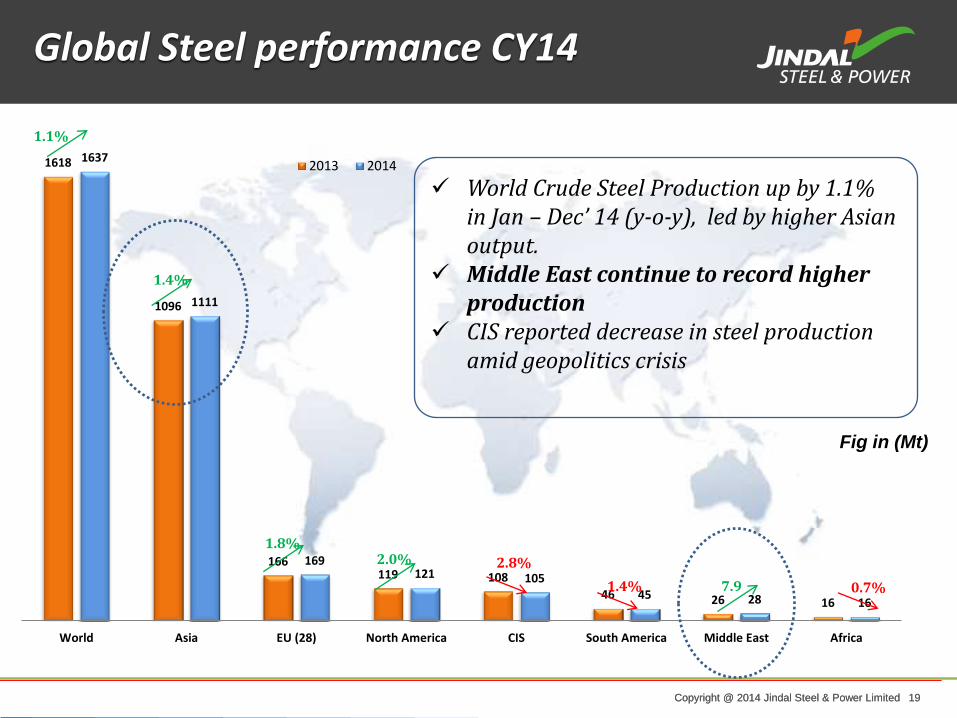
Global Steel performance CY14
1618
1096
166 119 108
46 26 16
1637
1111
169 121 105
45 28 16
World Asia EU (28) North America CIS South America Middle East Africa
2013 2014
1.1%
1.4%
1.8%
2.8%
7.9 0.7%
2.0%
1.4%
Fig in (Mt)
World Crude Steel Production up by 1.1% in Jan – Dec’ 14 (y-o-y), led by higher Asian output.
Middle East continue to record higher production
CIS reported decrease in steel production amid geopolitics crisis
Copyright @ 2014 Jindal Steel & Power Limited 20 Copyright @ 2014 Jindal Steel & Power Limited 20
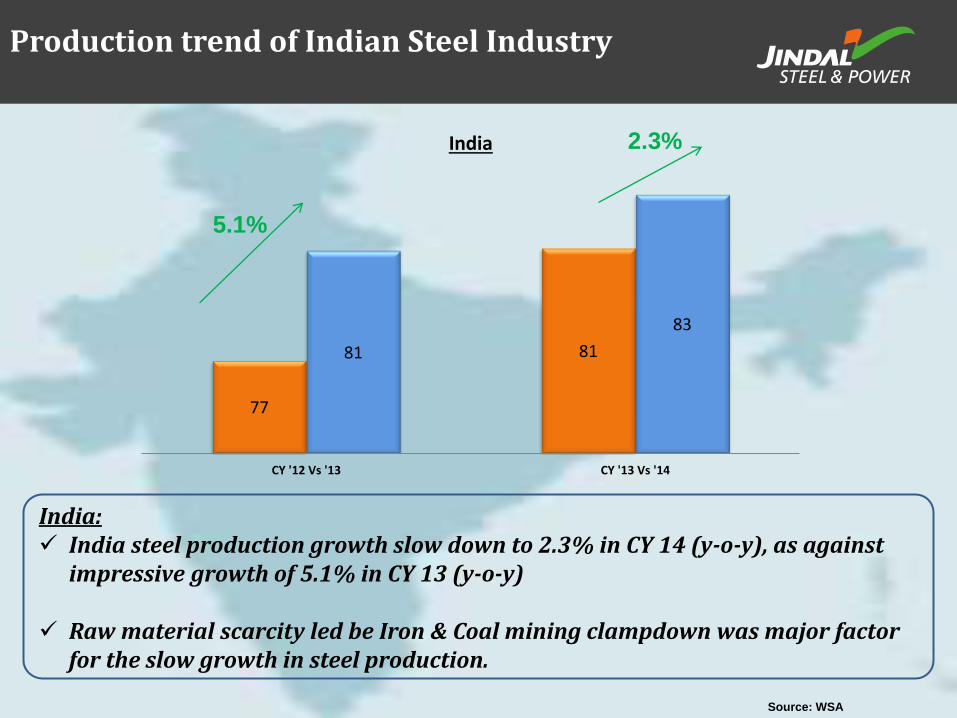
77
81 81
83
CY '12 Vs '13 CY '13 Vs '14
India 2.3%
5.1%
Production trend of Indian Steel Industry
India: India steel production growth slow down to 2.3% in CY 14 (y-o-y), as against
impressive growth of 5.1% in CY 13 (y-o-y)
Raw material scarcity led be Iron & Coal mining clampdown was major factor for the slow growth in steel production.
Source: WSA
Copyright @ 2014 Jindal Steel & Power Limited 21 Copyright @ 2014 Jindal Steel & Power Limited 21
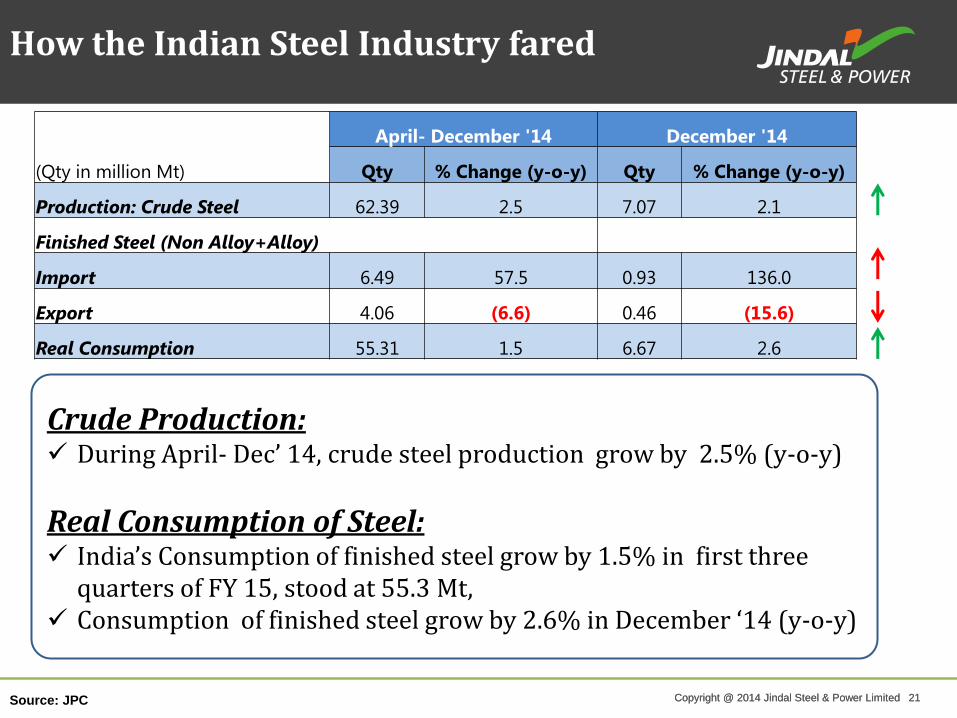
April- December '14 December '14
(Qty in million Mt) Qty % Change (y-o-y) Qty % Change (y-o-y)
Production: Crude Steel 62.39 2.5 7.07 2.1
Finished Steel (Non Alloy+Alloy)
Import 6.49 57.5 0.93 136.0
Export 4.06 (6.6) 0.46 (15.6)
Real Consumption 55.31 1.5 6.67 2.6
How the Indian Steel Industry fared
Crude Production: During April- Dec’ 14, crude steel production grow by 2.5% (y-o-y)
Real Consumption of Steel: India’s Consumption of finished steel grow by 1.5% in first three
quarters of FY 15, stood at 55.3 Mt, Consumption of finished steel grow by 2.6% in December ‘14 (y-o-y)
Source: JPC
Copyright @ 2014 Jindal Steel & Power Limited 22 Copyright @ 2014 Jindal Steel & Power Limited 22
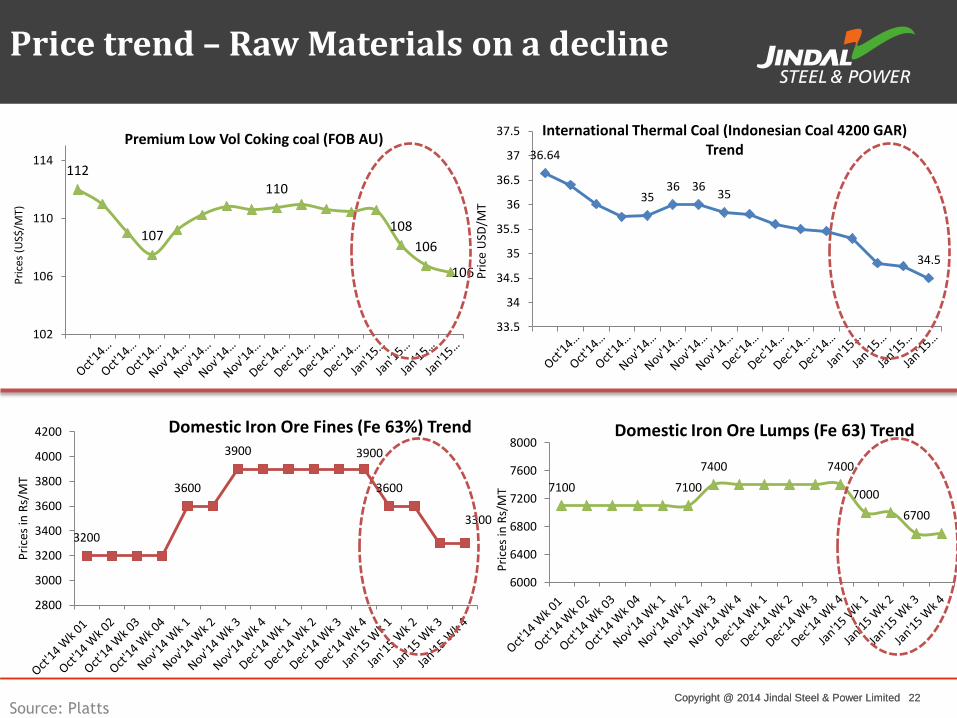
Price trend – Raw Materials on a decline
Source: Platts
112
107
110
108
106
106
102
106
110
114
Pri
ces
(US$
/MT)
Premium Low Vol Coking coal (FOB AU) 36.64
35 36 36
35
34.5
33.5
34
34.5
35
35.5
36
36.5
37
37.5
Pri
ce U
SD/M
T
International Thermal Coal (Indonesian Coal 4200 GAR) Trend
7100 7100
7400 7400
7000
6700
6000
6400
6800
7200
7600
8000
Pri
ces
in R
s/M
T
Domestic Iron Ore Lumps (Fe 63) Trend
3200
3600
3900 3900
3600
3300
2800
3000
3200
3400
3600
3800
4000
4200
Pri
ces
in R
s/M
T
Domestic Iron Ore Fines (Fe 63%) Trend
Copyright @ 2014 Jindal Steel & Power Limited 23 Copyright @ 2014 Jindal Steel & Power Limited 23
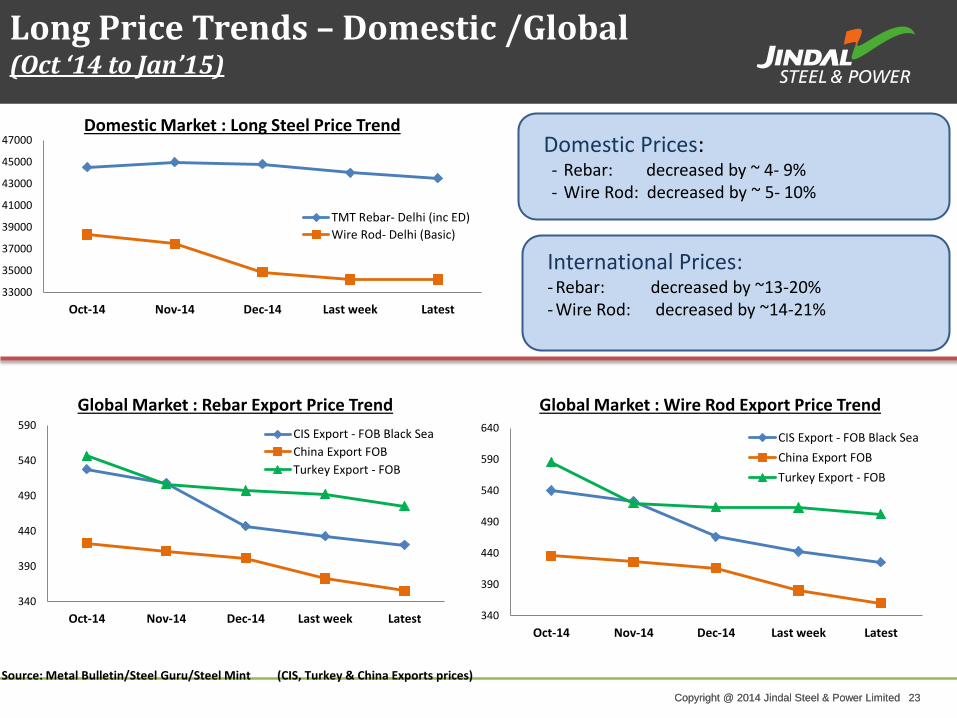
Long Price Trends – Domestic /Global (Oct ‘14 to Jan’15)
340
390
440
490
540
590
Oct-14 Nov-14 Dec-14 Last week Latest
Global Market : Rebar Export Price Trend
CIS Export - FOB Black Sea
China Export FOB
Turkey Export - FOB
340
390
440
490
540
590
640
Oct-14 Nov-14 Dec-14 Last week Latest
Global Market : Wire Rod Export Price Trend
CIS Export - FOB Black Sea
China Export FOB
Turkey Export - FOB
33000
35000
37000
39000
41000
43000
45000
47000
Oct-14 Nov-14 Dec-14 Last week Latest
Domestic Market : Long Steel Price Trend
TMT Rebar- Delhi (inc ED)
Wire Rod- Delhi (Basic)
Source: Metal Bulletin/Steel Guru/Steel Mint
International Prices: - Rebar: decreased by ~13-20% - Wire Rod: decreased by ~14-21%
Domestic Prices: - Rebar: decreased by ~ 4- 9% - Wire Rod: decreased by ~ 5- 10%
(CIS, Turkey & China Exports prices)
Copyright @ 2014 Jindal Steel & Power Limited 24 Copyright @ 2014 Jindal Steel & Power Limited 24
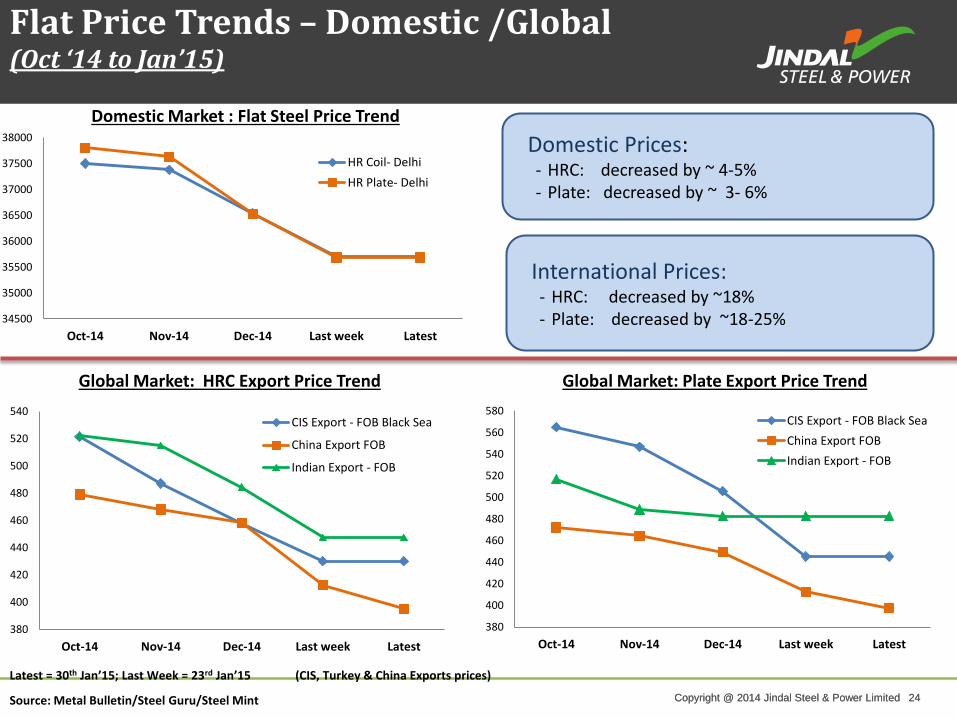
Flat Price Trends – Domestic /Global (Oct ‘14 to Jan’15)
Source: Metal Bulletin/Steel Guru/Steel Mint
International Prices: - HRC: decreased by ~18% - Plate: decreased by ~18-25%
Domestic Prices: - HRC: decreased by ~ 4-5% - Plate: decreased by ~ 3- 6%
(CIS, Turkey & China Exports prices)
380
400
420
440
460
480
500
520
540
Oct-14 Nov-14 Dec-14 Last week Latest
Global Market: HRC Export Price Trend
CIS Export - FOB Black Sea
China Export FOB
Indian Export - FOB
380
400
420
440
460
480
500
520
540
560
580
Oct-14 Nov-14 Dec-14 Last week Latest
Global Market: Plate Export Price Trend
CIS Export - FOB Black Sea
China Export FOB
Indian Export - FOB
34500
35000
35500
36000
36500
37000
37500
38000
Oct-14 Nov-14 Dec-14 Last week Latest
Domestic Market : Flat Steel Price Trend
HR Coil- Delhi
HR Plate- Delhi
Latest = 30th Jan’15; Last Week = 23rd Jan’15
Copyright @ 2014 Jindal Steel & Power Limited 25 Copyright @ 2014 Jindal Steel & Power Limited 25
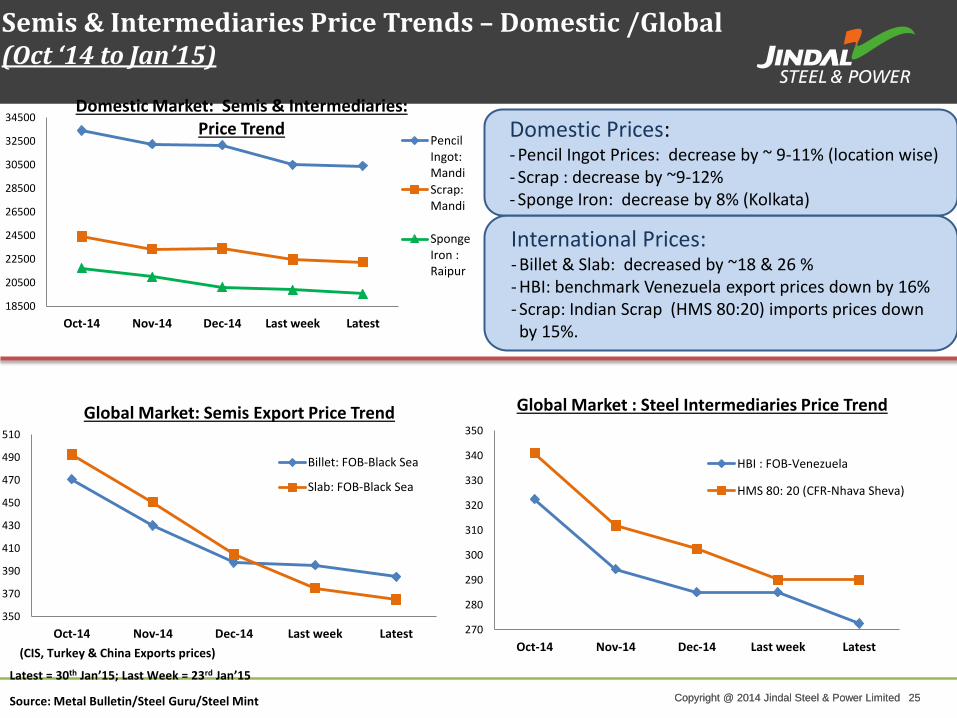
Semis & Intermediaries Price Trends – Domestic /Global (Oct ‘14 to Jan’15)
Source: Metal Bulletin/Steel Guru/Steel Mint
International Prices: - Billet & Slab: decreased by ~18 & 26 % - HBI: benchmark Venezuela export prices down by 16% - Scrap: Indian Scrap (HMS 80:20) imports prices down by 15%.
Domestic Prices: - Pencil Ingot Prices: decrease by ~ 9-11% (location wise) - Scrap : decrease by ~9-12% - Sponge Iron: decrease by 8% (Kolkata)
(CIS, Turkey & China Exports prices)
18500
20500
22500
24500
26500
28500
30500
32500
34500
Oct-14 Nov-14 Dec-14 Last week Latest
Domestic Market: Semis & Intermediaries: Price Trend
PencilIngot:Mandi
Scrap:Mandi
SpongeIron :Raipur
350
370
390
410
430
450
470
490
510
Oct-14 Nov-14 Dec-14 Last week Latest
Global Market: Semis Export Price Trend
Billet: FOB-Black Sea
Slab: FOB-Black Sea
270
280
290
300
310
320
330
340
350
Oct-14 Nov-14 Dec-14 Last week Latest
Global Market : Steel Intermediaries Price Trend
HBI : FOB-Venezuela
HMS 80: 20 (CFR-Nhava Sheva)
Latest = 30th Jan’15; Last Week = 23rd Jan’15
Copyright @ 2014 Jindal Steel & Power Limited 26 Copyright @ 2014 Jindal Steel & Power Limited 26
Copyright @ 2014 Jindal Steel & Power Limited 27 Copyright @ 2014 Jindal Steel & Power Limited 27
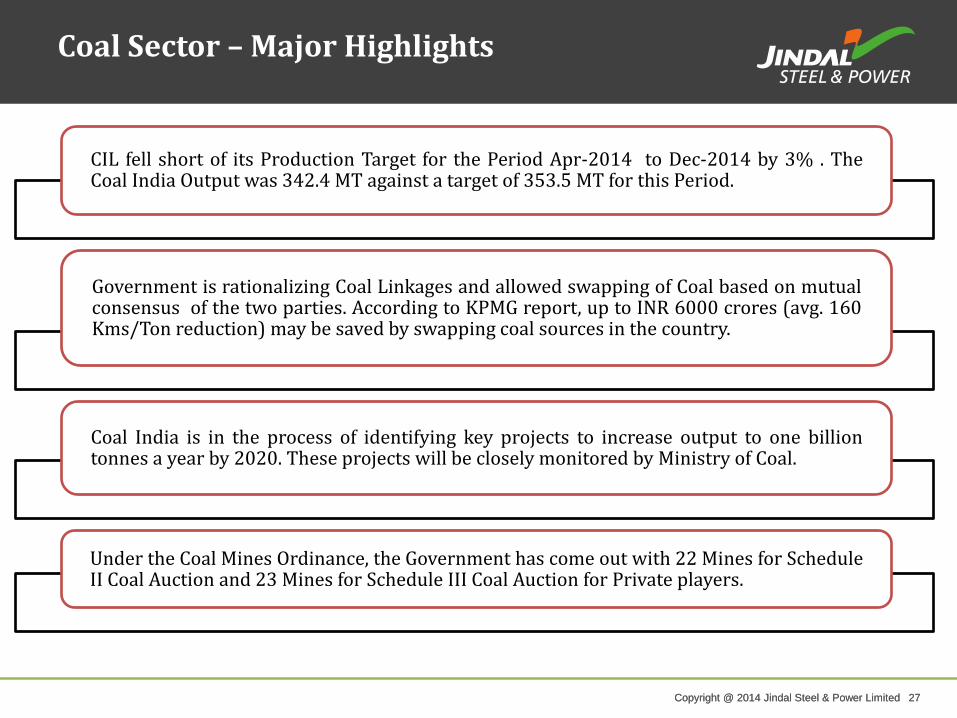
Coal Sector – Major Highlights
CIL fell short of its Production Target for the Period Apr-2014 to Dec-2014 by 3% . The Coal India Output was 342.4 MT against a target of 353.5 MT for this Period.
Government is rationalizing Coal Linkages and allowed swapping of Coal based on mutual consensus of the two parties. According to KPMG report, up to INR 6000 crores (avg. 160 Kms/Ton reduction) may be saved by swapping coal sources in the country.
Coal India is in the process of identifying key projects to increase output to one billion tonnes a year by 2020. These projects will be closely monitored by Ministry of Coal.
Under the Coal Mines Ordinance, the Government has come out with 22 Mines for Schedule II Coal Auction and 23 Mines for Schedule III Coal Auction for Private players.
Copyright @ 2014 Jindal Steel & Power Limited 28 Copyright @ 2014 Jindal Steel & Power Limited 28
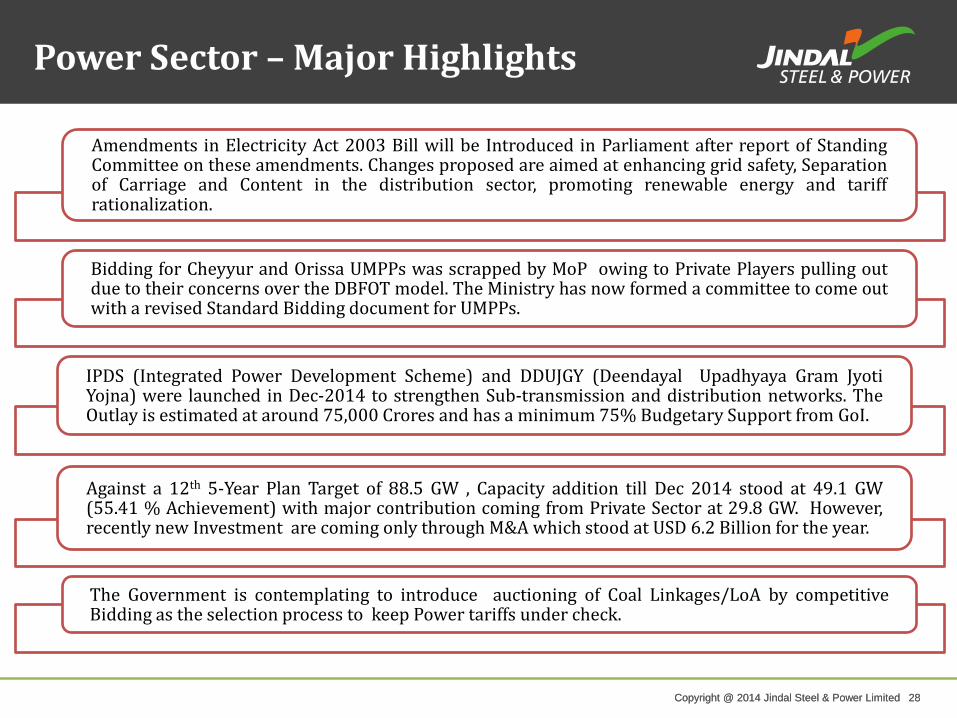
Power Sector – Major Highlights
Amendments in Electricity Act 2003 Bill will be Introduced in Parliament after report of Standing Committee on these amendments. Changes proposed are aimed at enhancing grid safety, Separation of Carriage and Content in the distribution sector, promoting renewable energy and tariff rationalization.
Bidding for Cheyyur and Orissa UMPPs was scrapped by MoP owing to Private Players pulling out due to their concerns over the DBFOT model. The Ministry has now formed a committee to come out with a revised Standard Bidding document for UMPPs.
IPDS (Integrated Power Development Scheme) and DDUJGY (Deendayal Upadhyaya Gram Jyoti Yojna) were launched in Dec-2014 to strengthen Sub-transmission and distribution networks. The Outlay is estimated at around 75,000 Crores and has a minimum 75% Budgetary Support from GoI.
Against a 12th 5-Year Plan Target of 88.5 GW , Capacity addition till Dec 2014 stood at 49.1 GW (55.41 % Achievement) with major contribution coming from Private Sector at 29.8 GW. However, recently new Investment are coming only through M&A which stood at USD 6.2 Billion for the year.
The Government is contemplating to introduce auctioning of Coal Linkages/LoA by competitive Bidding as the selection process to keep Power tariffs under check.
Copyright @ 2014 Jindal Steel & Power Limited 29 Copyright @ 2014 Jindal Steel & Power Limited 29
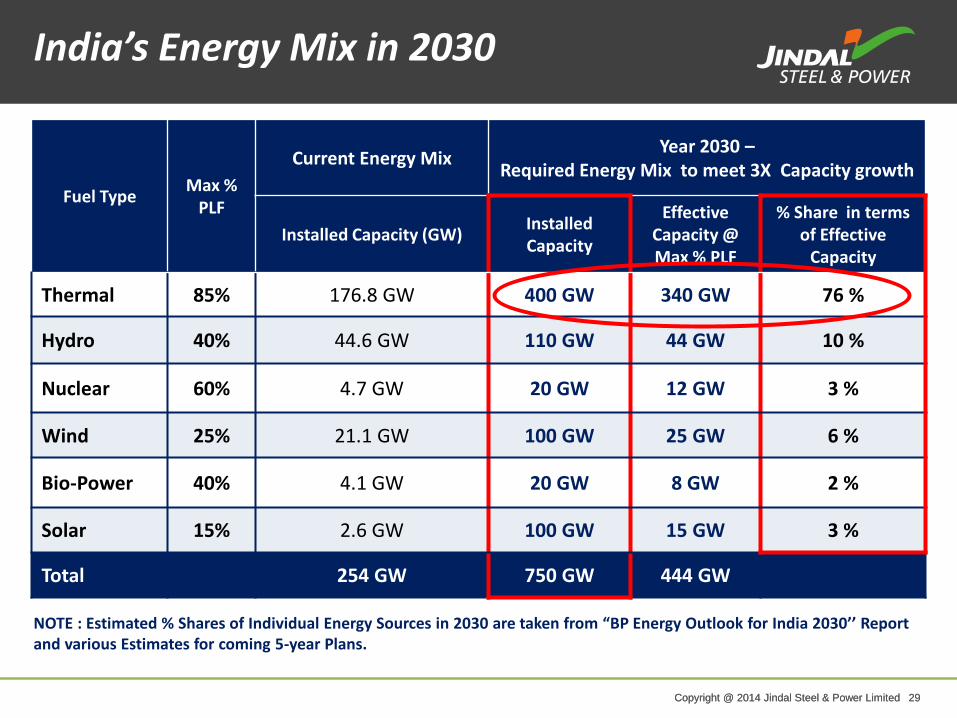
India’s Energy Mix in 2030
Fuel Type Max %
PLF
Current Energy Mix Year 2030 –
Required Energy Mix to meet 3X Capacity growth
Installed Capacity (GW) Installed Capacity
Effective Capacity @ Max % PLF
% Share in terms of Effective
Capacity
Thermal 85% 176.8 GW 400 GW 340 GW 76 %
Hydro 40% 44.6 GW 110 GW 44 GW 10 %
Nuclear 60% 4.7 GW 20 GW 12 GW 3 %
Wind 25% 21.1 GW 100 GW 25 GW 6 %
Bio-Power 40% 4.1 GW 20 GW 8 GW 2 %
Solar 15% 2.6 GW 100 GW 15 GW 3 %
Total 254 GW 750 GW 444 GW
NOTE : Estimated % Shares of Individual Energy Sources in 2030 are taken from “BP Energy Outlook for India 2030’’ Report and various Estimates for coming 5-year Plans.
Copyright @ 2014 Jindal Steel & Power Limited 30 Copyright @ 2014 Jindal Steel & Power Limited 30
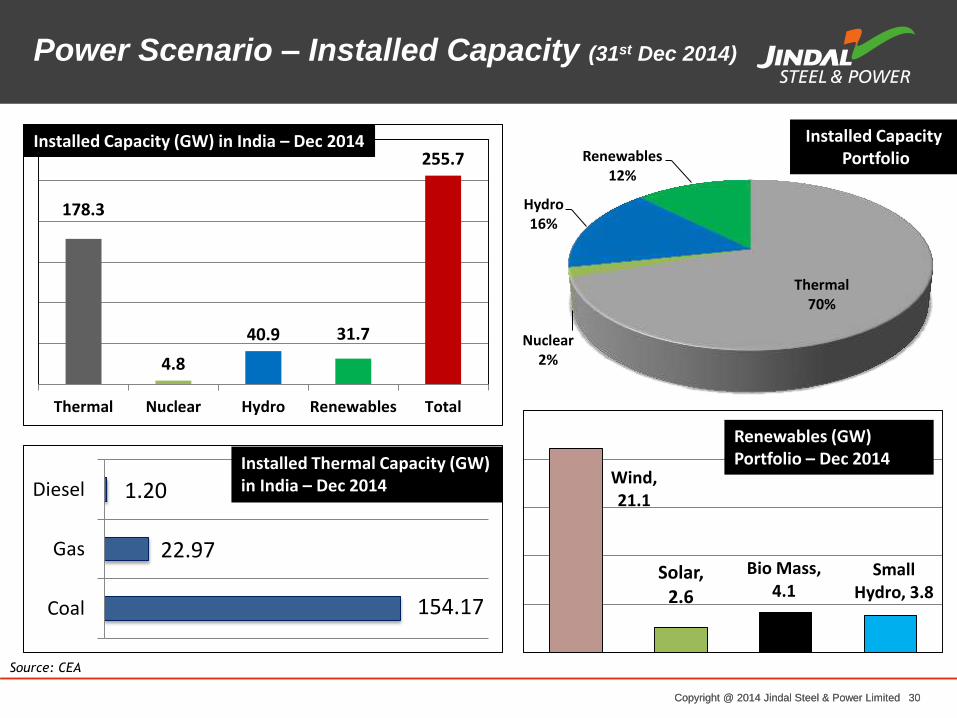
Power Scenario – Installed Capacity (31st Dec 2014)
Source: CEA
178.3
4.8
40.9 31.7
255.7
Thermal Nuclear Hydro Renewables Total
Installed Capacity (GW) in India – Dec 2014
Thermal 70%
Nuclear 2%
Hydro 16%
Renewables 12%
Wind, 21.1
Solar, 2.6
Bio Mass, 4.1
Small Hydro, 3.8
154.17
22.97
1.20
Coal
Gas
Diesel
Installed Thermal Capacity (GW) in India – Dec 2014
Renewables (GW) Portfolio – Dec 2014
Installed Capacity Portfolio
Copyright @ 2014 Jindal Steel & Power Limited 31 Copyright @ 2014 Jindal Steel & Power Limited 31
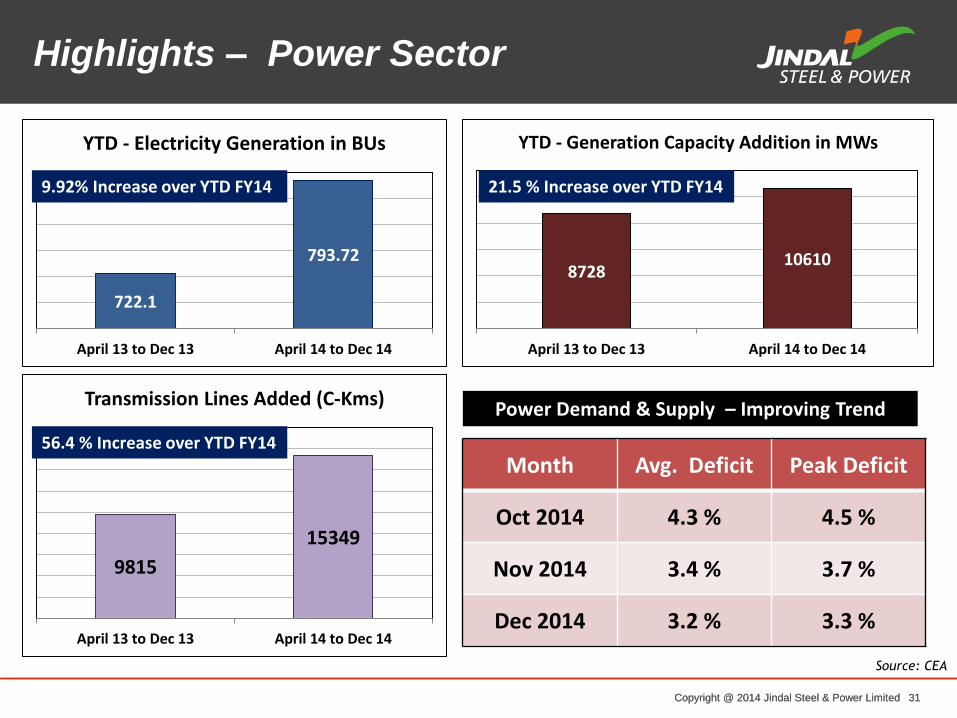
Highlights – Power Sector
Source: CEA
722.1
793.72
April 13 to Dec 13 April 14 to Dec 14
YTD - Electricity Generation in BUs
8728 10610
April 13 to Dec 13 April 14 to Dec 14
YTD - Generation Capacity Addition in MWs
9815
15349
April 13 to Dec 13 April 14 to Dec 14
Transmission Lines Added (C-Kms)
Month Avg. Deficit Peak Deficit
Oct 2014 4.3 % 4.5 %
Nov 2014 3.4 % 3.7 %
Dec 2014 3.2 % 3.3 %
Power Demand & Supply – Improving Trend
9.92% Increase over YTD FY14 21.5 % Increase over YTD FY14
56.4 % Increase over YTD FY14
Copyright @ 2014 Jindal Steel & Power Limited 32 Copyright @ 2014 Jindal Steel & Power Limited 32
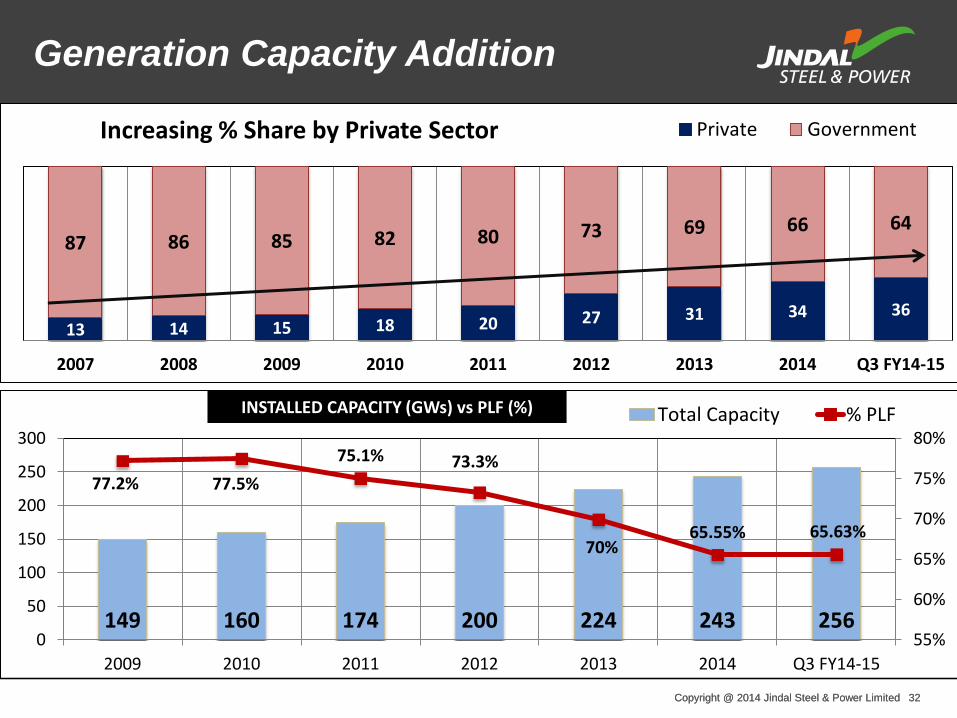
Generation Capacity Addition
13 14 15 18 20 27 31 34 36
87 86 85 82 80 73 69 66 64
2007 2008 2009 2010 2011 2012 2013 2014 Q3 FY14-15
Increasing % Share by Private Sector Private Government
149 160 174 200 224 243 256
77.2% 77.5%
75.1% 73.3%
70% 65.55% 65.63%
55%
60%
65%
70%
75%
80%
0
50
100
150
200
250
300
2009 2010 2011 2012 2013 2014 Q3 FY14-15
Total Capacity % PLFINSTALLED CAPACITY (GWs) vs PLF (%)
Copyright @ 2014 Jindal Steel & Power Limited 33 Copyright @ 2014 Jindal Steel & Power Limited 33
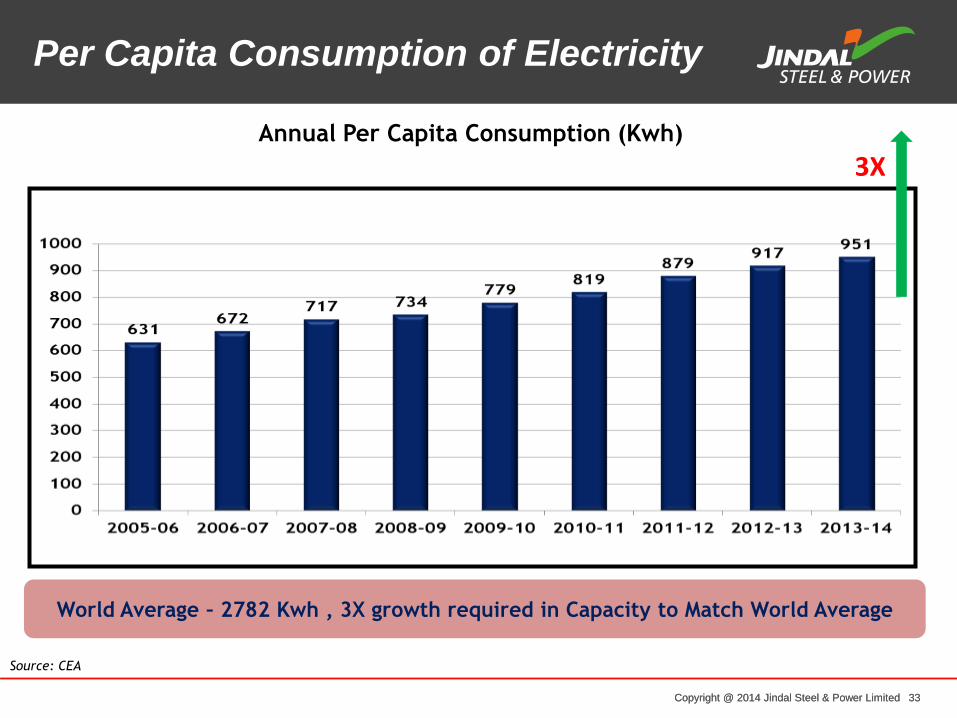
Per Capita Consumption of Electricity
Source: CEA
World Average – 2782 Kwh , 3X growth required in Capacity to Match World Average
Annual Per Capita Consumption (Kwh)
3X
Copyright @ 2014 Jindal Steel & Power Limited 34 Copyright @ 2014 Jindal Steel & Power Limited 34
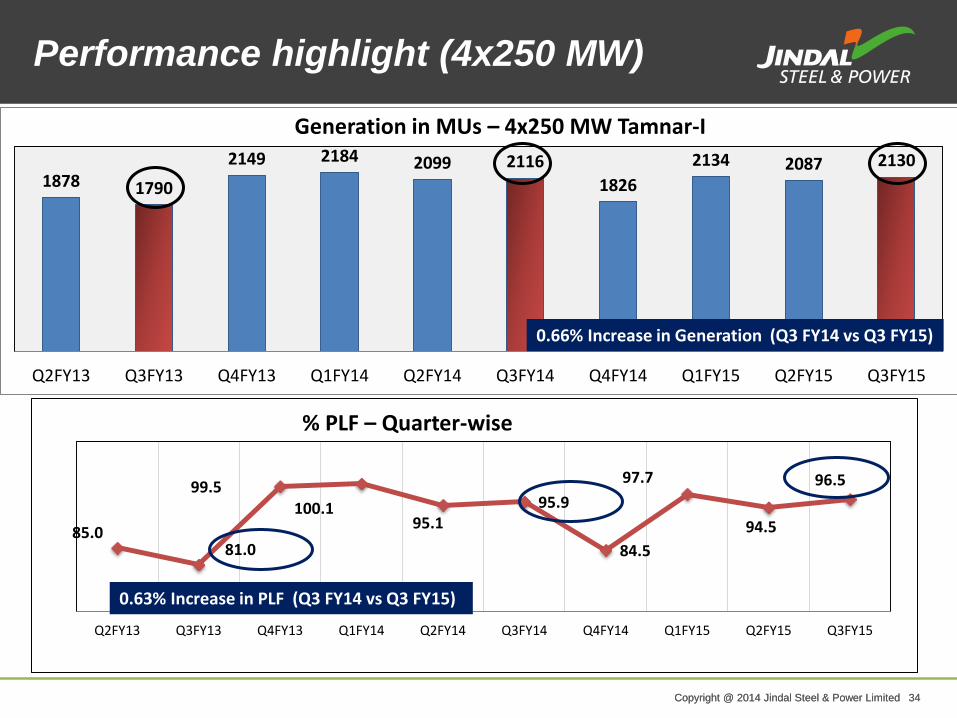
Performance highlight (4x250 MW)
85.0 81.0
99.5 100.1
95.1 95.9
84.5
97.7
94.5
96.5
Q2FY13 Q3FY13 Q4FY13 Q1FY14 Q2FY14 Q3FY14 Q4FY14 Q1FY15 Q2FY15 Q3FY15
% PLF – Quarter-wise
1878 1790
2149 2184 2099 2116
1826
2134 2087 2130
Q2FY13 Q3FY13 Q4FY13 Q1FY14 Q2FY14 Q3FY14 Q4FY14 Q1FY15 Q2FY15 Q3FY15
Generation in MUs – 4x250 MW Tamnar-I
0.66% Increase in Generation (Q3 FY14 vs Q3 FY15)
0.63% Increase in PLF (Q3 FY14 vs Q3 FY15)
Copyright @ 2014 Jindal Steel & Power Limited 35 Copyright @ 2014 Jindal Steel & Power Limited 35

Copyright @ 2014 Jindal Steel & Power Limited 36 Copyright @ 2014 Jindal Steel & Power Limited 36
12,100 Cr. 3.25 MTPA Liquid Steel 2.35 MTPA Finished Steel 851 MW 5200 Investment Capacity Steel Power Workforce
JSPL at Raigarh
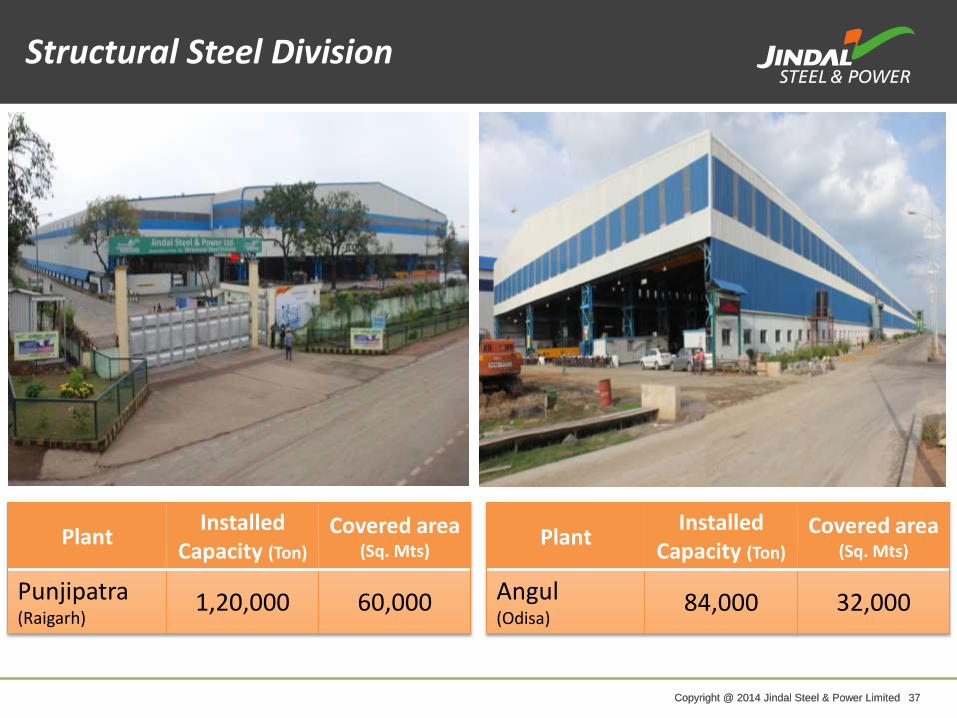
Copyright @ 2014 Jindal Steel & Power Limited 37 Copyright @ 2014 Jindal Steel & Power Limited 37
Plant Installed
Capacity (Ton)
Covered area (Sq. Mts)
Angul (Odisa)
84,000 32,000
Plant Installed
Capacity (Ton)
Covered area (Sq. Mts)
Punjipatra (Raigarh)
1,20,000 60,000
Structural Steel Division
Copyright @ 2014 Jindal Steel & Power Limited 38 Copyright @ 2014 Jindal Steel & Power Limited 38
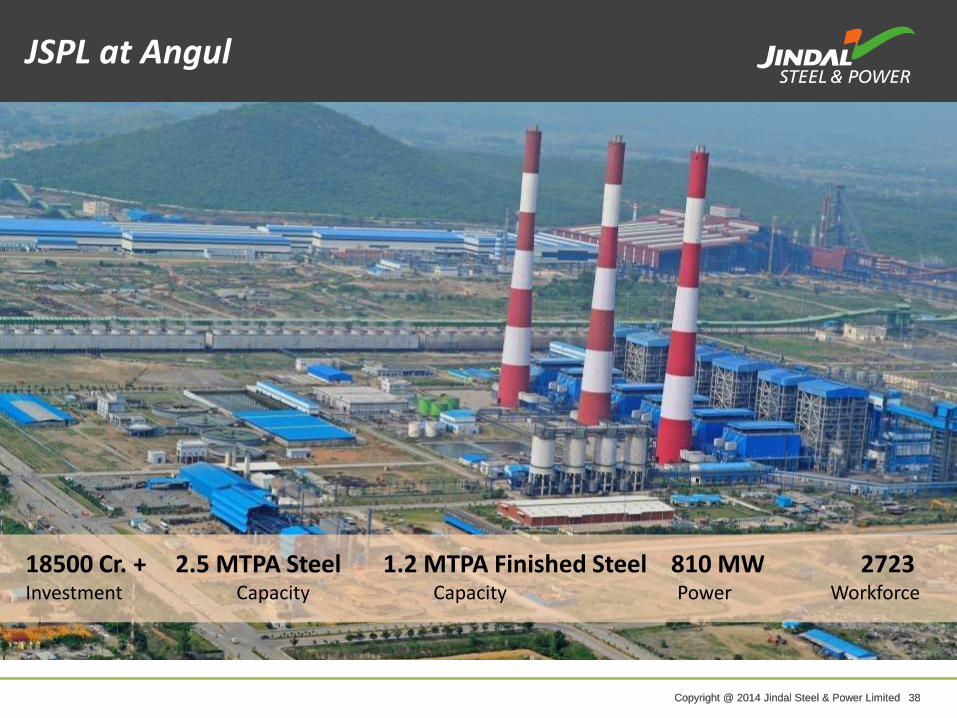
18500 Cr. + 2.5 MTPA Steel 1.2 MTPA Finished Steel 810 MW 2723 Investment Capacity Capacity Power Workforce
JSPL at Angul

Copyright @ 2014 Jindal Steel & Power Limited 39 Copyright @ 2014 Jindal Steel & Power Limited 39
Key Features of DRI & CGP at Angul
1) The DRI - Coal Gasification route is being used
for the first time in the world and has the
advantage of using high ash coal.
2) The technology of Coal Gasification Plant has
been taken from Lurgi( South Africa and Germany)
for producing syn gas from coal using a process
known as - Fixed bed dry bottom coal gasification
process.
3) The DRI plant is the first ( Technology - Midrex
USA) in the world to produce cold/hot DRI using
synthesis gas.
Copyright @ 2014 Jindal Steel & Power Limited 40 Copyright @ 2014 Jindal Steel & Power Limited 40
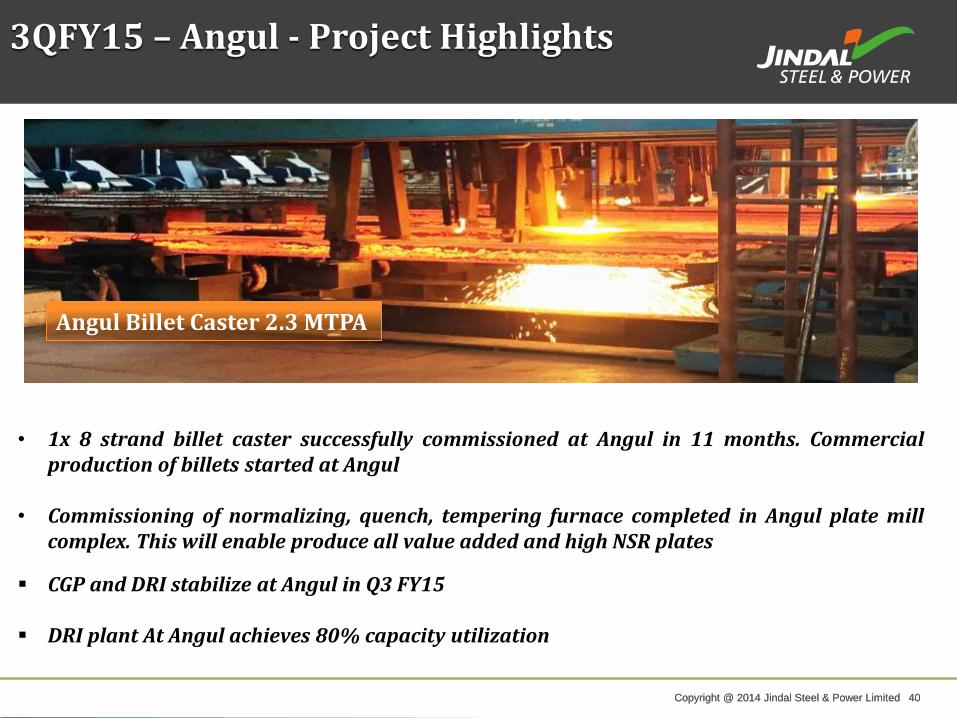
3QFY15 – Angul - Project Highlights
• 1x 8 strand billet caster successfully commissioned at Angul in 11 months. Commercial production of billets started at Angul
• Commissioning of normalizing, quench, tempering furnace completed in Angul plate mill complex. This will enable produce all value added and high NSR plates
CGP and DRI stabilize at Angul in Q3 FY15
DRI plant At Angul achieves 80% capacity utilization
Angul Billet Caster 2.3 MTPA
Copyright @ 2014 Jindal Steel & Power Limited 41 Copyright @ 2014 Jindal Steel & Power Limited 41
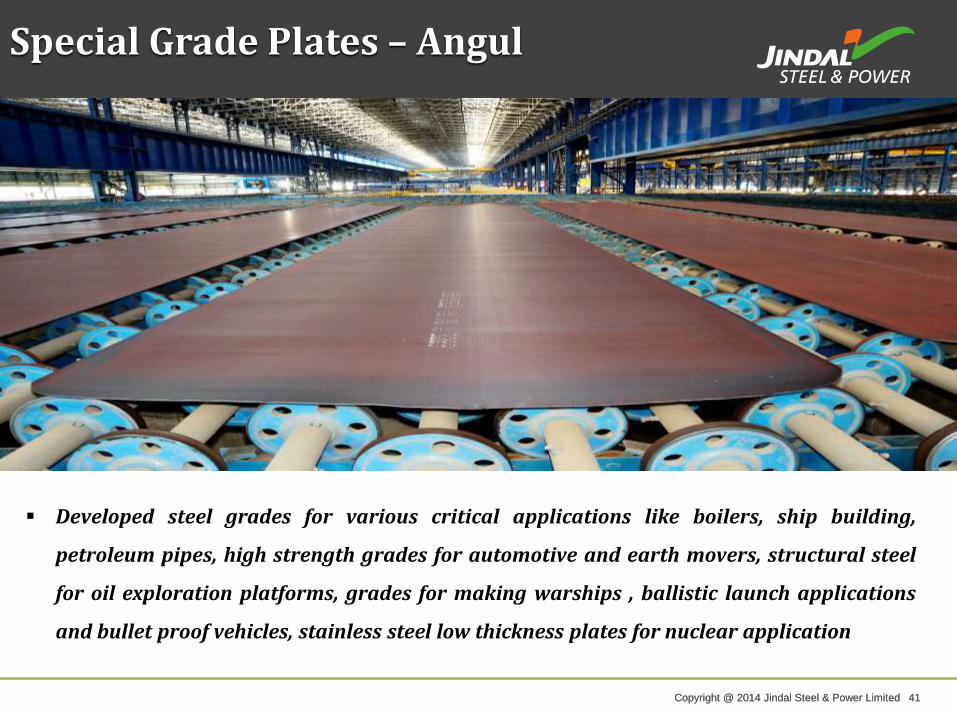
Special Grade Plates – Angul
Developed steel grades for various critical applications like boilers, ship building,
petroleum pipes, high strength grades for automotive and earth movers, structural steel
for oil exploration platforms, grades for making warships , ballistic launch applications
and bullet proof vehicles, stainless steel low thickness plates for nuclear application
Copyright @ 2014 Jindal Steel & Power Limited 42 Copyright @ 2014 Jindal Steel & Power Limited 42
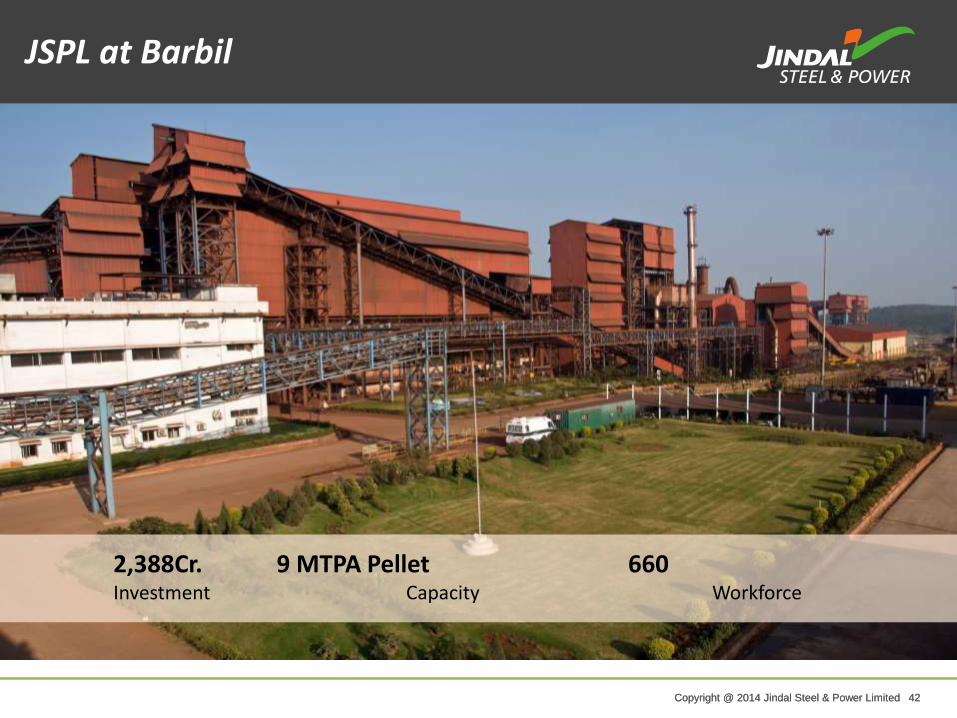
2,388Cr. 9 MTPA Pellet 660 Investment Capacity Workforce
JSPL at Barbil

Copyright @ 2014 Jindal Steel & Power Limited 43 Copyright @ 2014 Jindal Steel & Power Limited 43
1,764 Cr. 1.6 MTPA Finished Steel 1,373 Investment Capacity Workforce
JSPL at Patratu
Copyright @ 2014 Jindal Steel & Power Limited 44 Copyright @ 2014 Jindal Steel & Power Limited 44
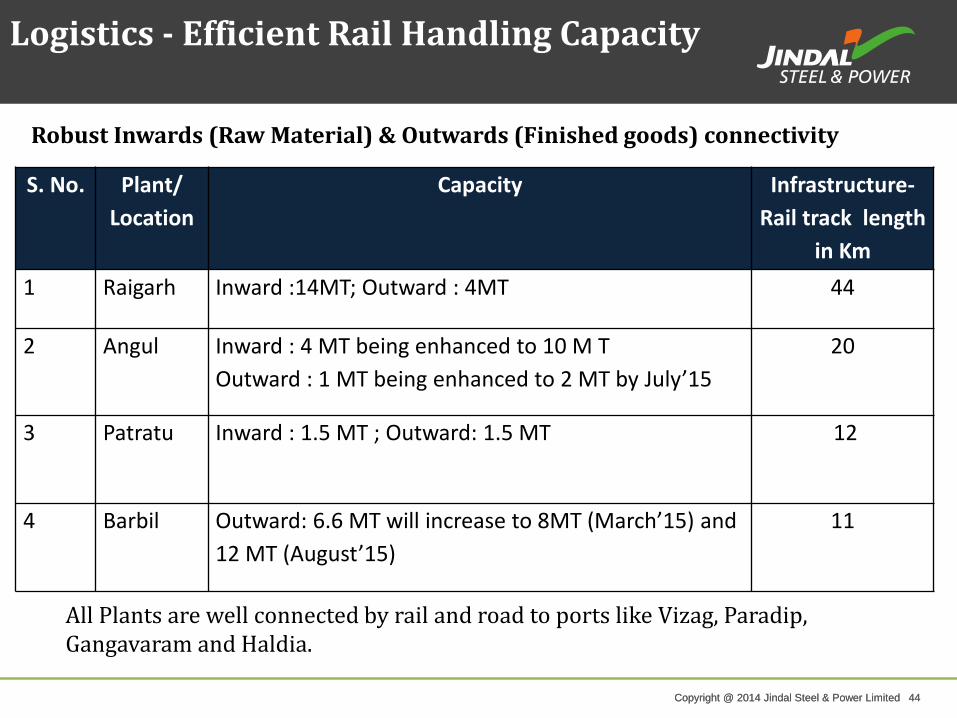
S. No. Plant/
Location
Capacity Infrastructure-
Rail track length
in Km
1 Raigarh Inward :14MT; Outward : 4MT 44
2 Angul Inward : 4 MT being enhanced to 10 M T
Outward : 1 MT being enhanced to 2 MT by July’15
20
3 Patratu Inward : 1.5 MT ; Outward: 1.5 MT 12
4 Barbil Outward: 6.6 MT will increase to 8MT (March’15) and
12 MT (August’15)
11
All Plants are well connected by rail and road to ports like Vizag, Paradip, Gangavaram and Haldia.
Logistics - Efficient Rail Handling Capacity
Robust Inwards (Raw Material) & Outwards (Finished goods) connectivity
Copyright @ 2014 Jindal Steel & Power Limited 45 Copyright @ 2014 Jindal Steel & Power Limited 45
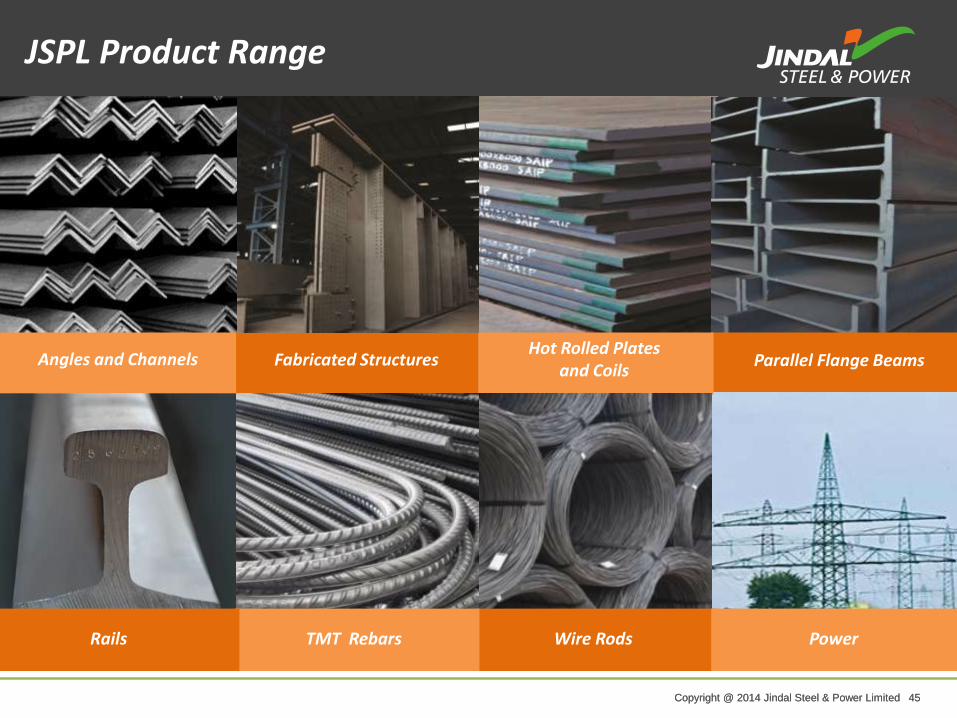
Fabricated Structures Hot Rolled Plates
and Coils Parallel Flange Beams
Wire Rods Power
Angles and Channels
TMT Rebars Rails
JSPL Product Range
Copyright @ 2014 Jindal Steel & Power Limited 46 Copyright @ 2014 Jindal Steel & Power Limited 46
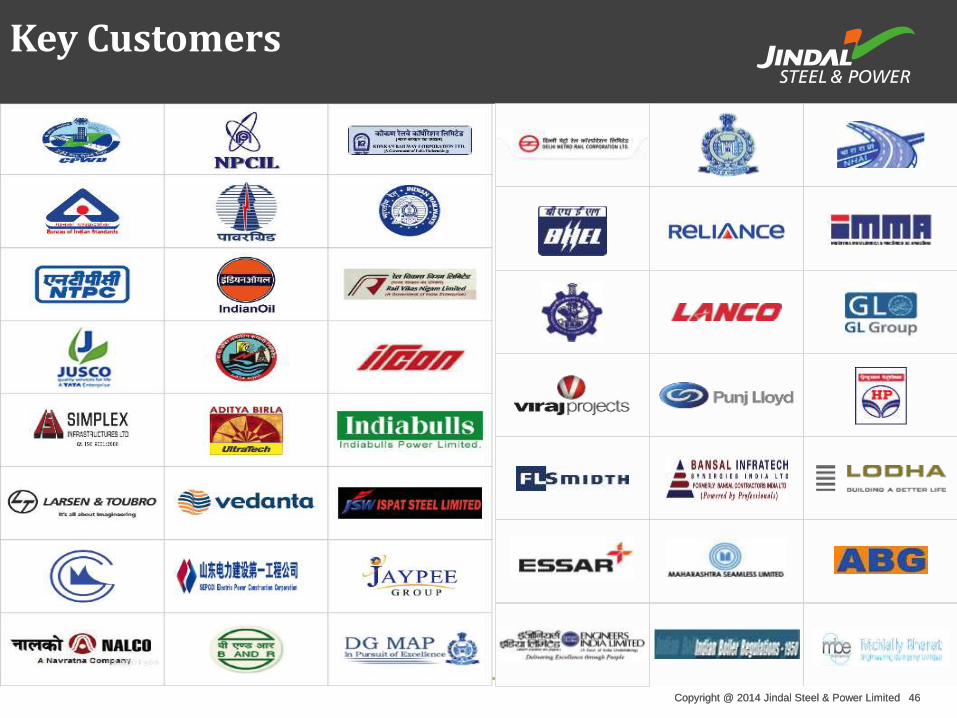
Key Customers
Copyright @ 2014 Jindal Steel & Power Limited 47 Copyright @ 2014 Jindal Steel & Power Limited 47
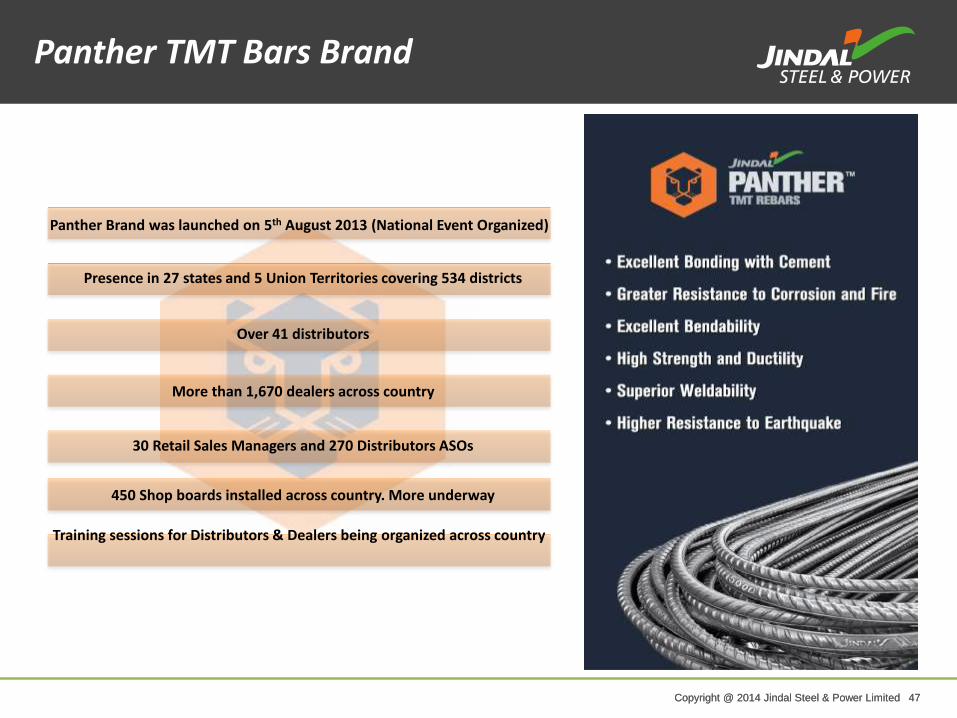
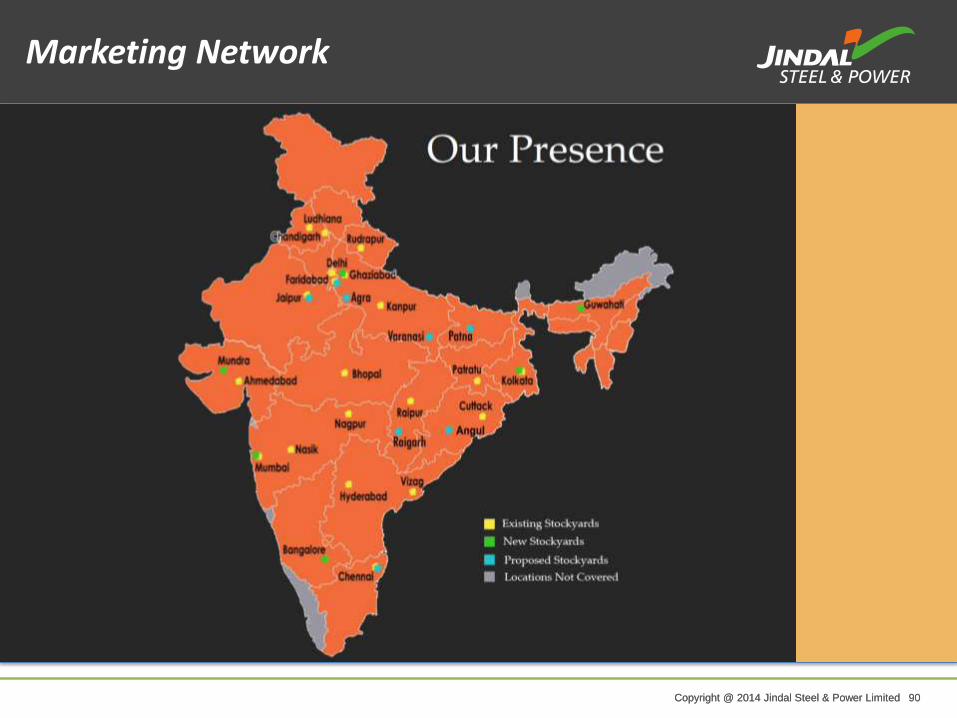
Presence in 27 states and 5 Union Territories covering 534 districts
Over 41 distributors
More than 1,670 dealers across country
30 Retail Sales Managers and 270 Distributors ASOs
450 Shop boards installed across country. More underway
Panther Brand was launched on 5th August 2013 (National Event Organized)
Training sessions for Distributors & Dealers being organized across country
Panther TMT Bars Brand
Copyright @ 2014 Jindal Steel & Power Limited 48 Copyright @ 2014 Jindal Steel & Power Limited 48
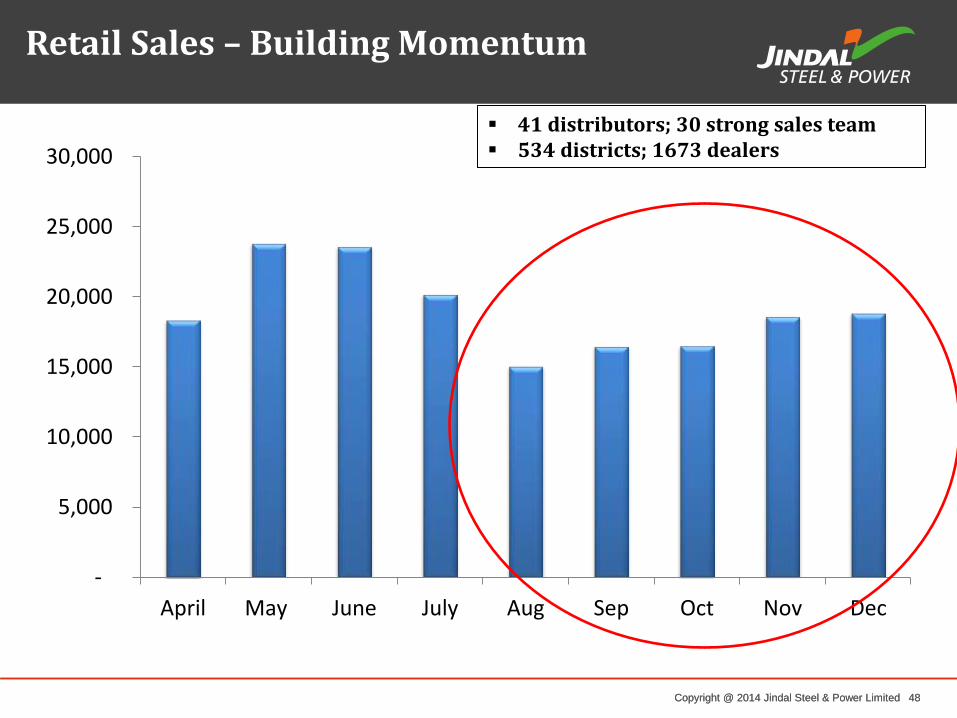
Retail Sales – Building Momentum
-
5,000
10,000
15,000
20,000
25,000
30,000
April May June July Aug Sep Oct Nov Dec
41 distributors; 30 strong sales team 534 districts; 1673 dealers
Copyright @ 2014 Jindal Steel & Power Limited 49 Copyright @ 2014 Jindal Steel & Power Limited 49 Power Plant at Tamnar
POWER
Copyright @ 2014 Jindal Steel & Power Limited 50 Copyright @ 2014 Jindal Steel & Power Limited 50
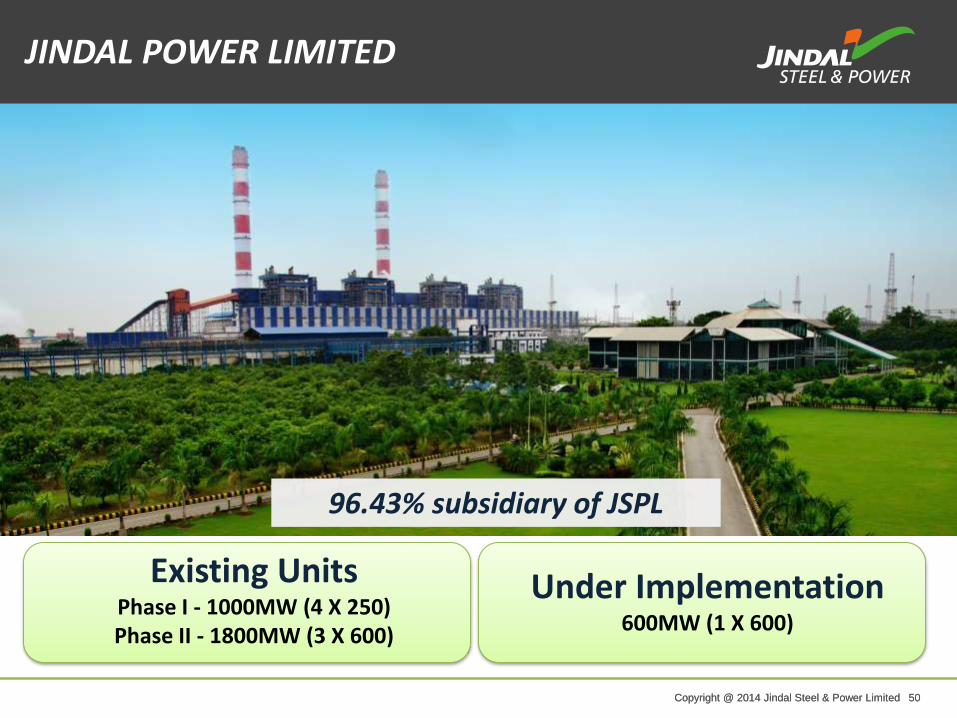
96.43% subsidiary of JSPL
Existing Units Phase I - 1000MW (4 X 250) Phase II - 1800MW (3 X 600)
Under Implementation 600MW (1 X 600)
JINDAL POWER LIMITED
Copyright @ 2014 Jindal Steel & Power Limited 51 Copyright @ 2014 Jindal Steel & Power Limited 51
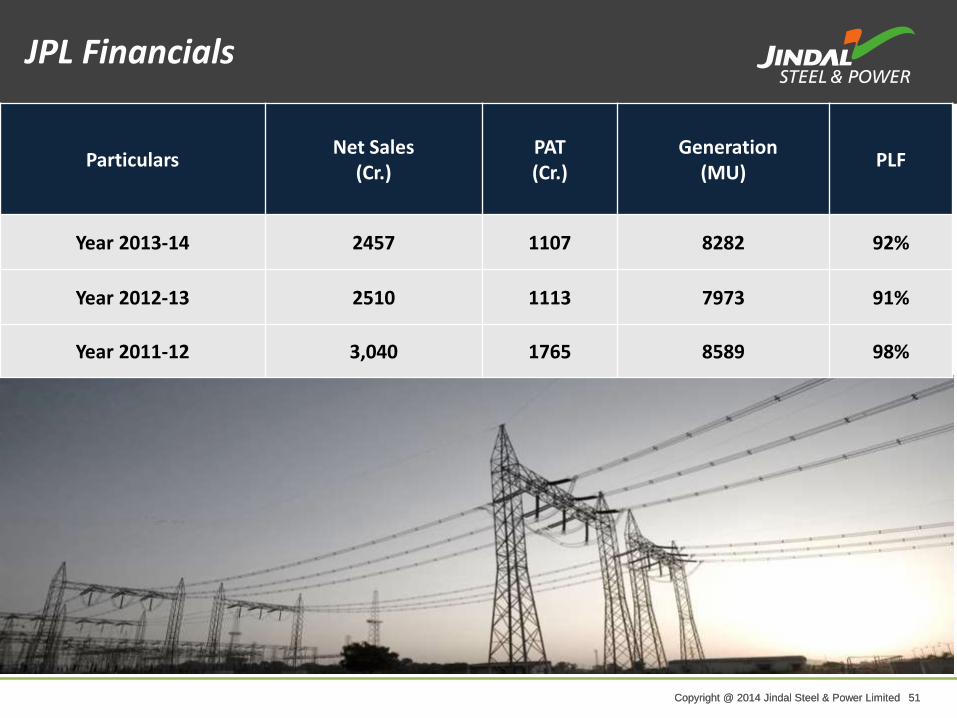
Particulars Net Sales
(Cr.) PAT (Cr.)
Generation (MU)
PLF
Year 2013-14 2457 1107 8282 92%
Year 2012-13 2510 1113 7973 91%
Year 2011-12 3,040 1765 8589 98%
JPL Financials
Copyright @ 2014 Jindal Steel & Power Limited 52 Copyright @ 2014 Jindal Steel & Power Limited 52
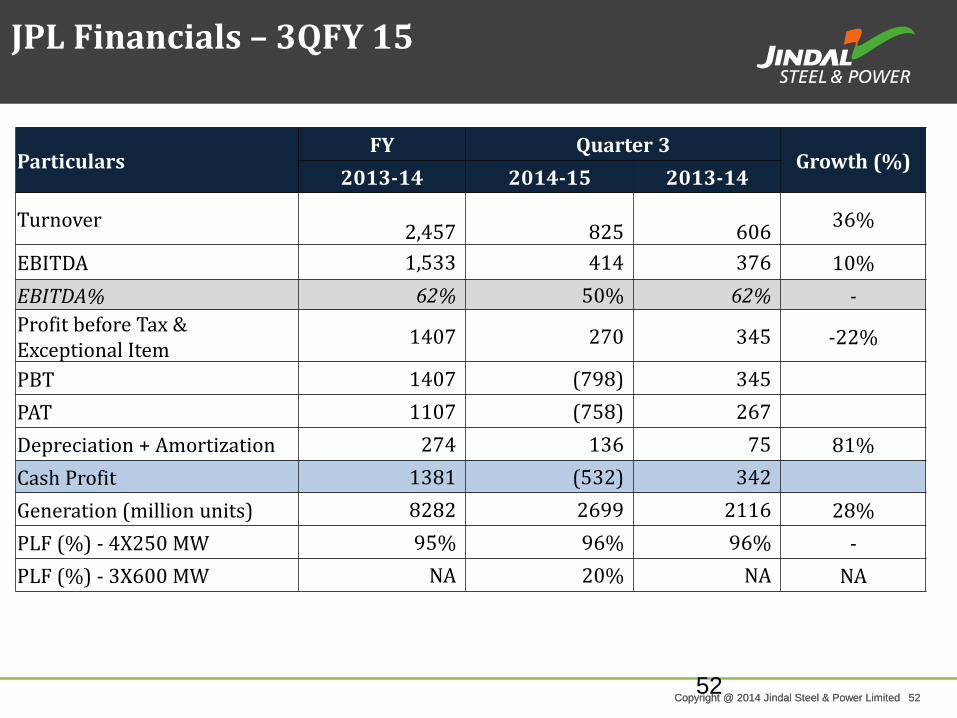
JPL Financials – 3QFY 15
Particulars FY Quarter 3
Growth (%) 2013-14 2014-15 2013-14
Turnover
2,457
825
606 36%
EBITDA 1,533 414 376 10%
EBITDA% 62% 50% 62% -
Profit before Tax & Exceptional Item
1407 270 345 -22%
PBT 1407 (798) 345
PAT 1107 (758) 267
Depreciation + Amortization 274 136 75 81%
Cash Profit 1381 (532) 342
Generation (million units) 8282 2699 2116 28%
PLF (%) - 4X250 MW 95% 96% 96% -
PLF (%) - 3X600 MW NA 20% NA NA
52
Copyright @ 2014 Jindal Steel & Power Limited 53 Copyright @ 2014 Jindal Steel & Power Limited 53
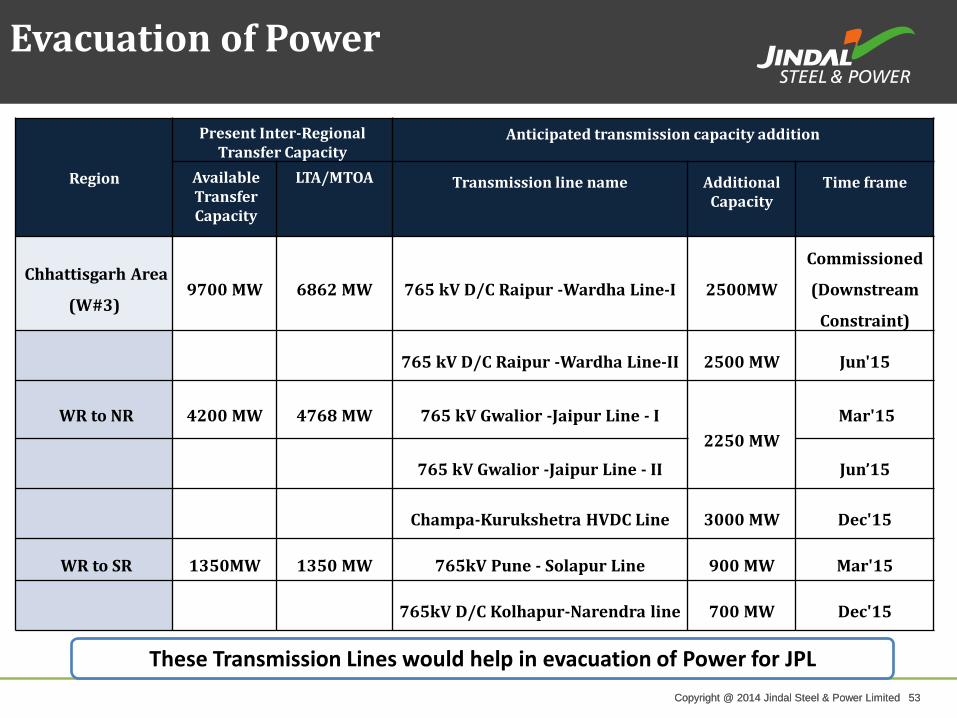
Evacuation of Power
These Transmission Lines would help in evacuation of Power for JPL
Region
Present Inter-Regional Transfer Capacity
Anticipated transmission capacity addition
Available Transfer Capacity
LTA/MTOA Transmission line name Additional Capacity
Time frame
Chhattisgarh Area
(W#3) 9700 MW 6862 MW 765 kV D/C Raipur -Wardha Line-I 2500MW
Commissioned
(Downstream
Constraint)
765 kV D/C Raipur -Wardha Line-II 2500 MW Jun'15
WR to NR 4200 MW 4768 MW 765 kV Gwalior -Jaipur Line - I
2250 MW
Mar'15
765 kV Gwalior -Jaipur Line - II Jun’15
Champa-Kurukshetra HVDC Line 3000 MW Dec'15
WR to SR 1350MW 1350 MW 765kV Pune - Solapur Line 900 MW Mar'15
765kV D/C Kolhapur-Narendra line 700 MW Dec'15
Copyright @ 2014 Jindal Steel & Power Limited 54 Copyright @ 2014 Jindal Steel & Power Limited 54 Corporate Office, Jindal Africa
Copyright @ 2014 Jindal Steel & Power Limited 55 Copyright @ 2014 Jindal Steel & Power Limited 55
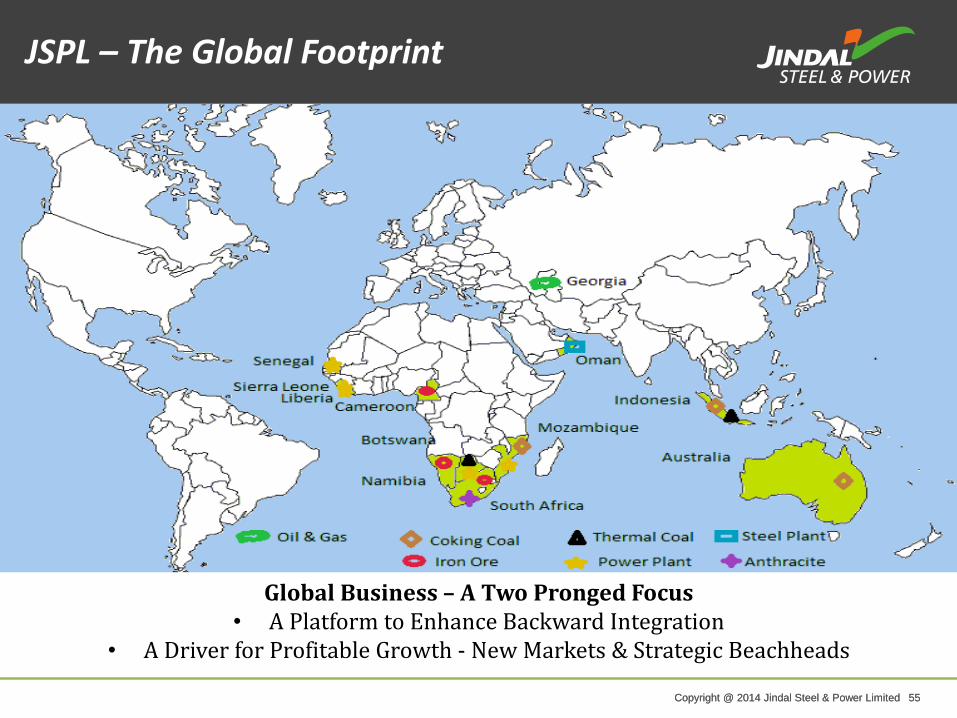
Global Business – A Two Pronged Focus • A Platform to Enhance Backward Integration
• A Driver for Profitable Growth - New Markets & Strategic Beachheads
JSPL – The Global Footprint
Copyright @ 2014 Jindal Steel & Power Limited 56 Copyright @ 2014 Jindal Steel & Power Limited 56
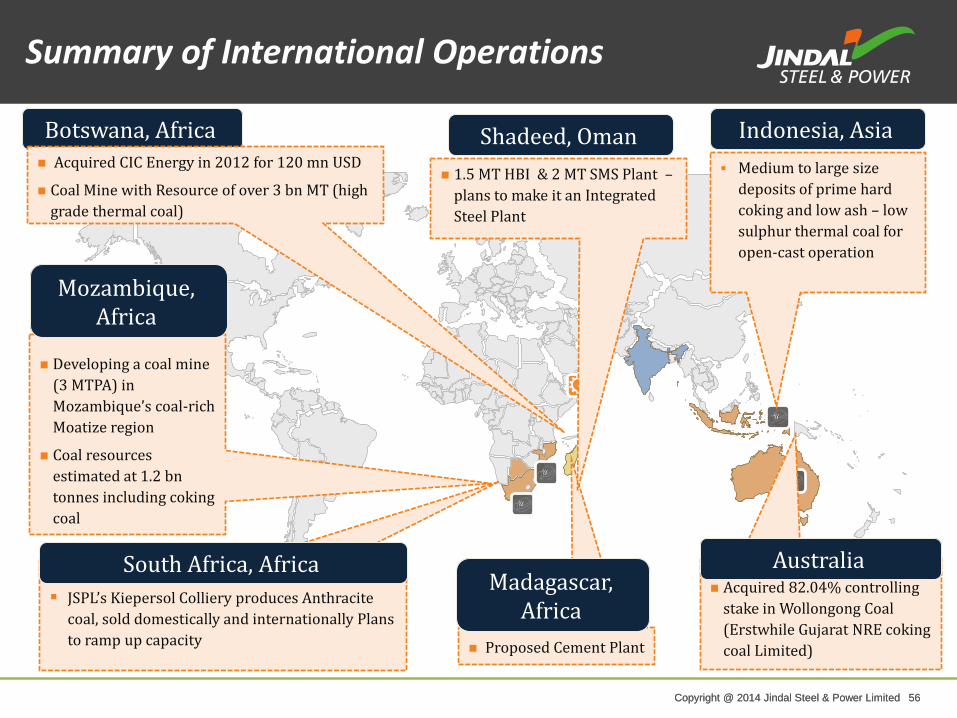
Developing a coal mine
(3 MTPA) in
Mozambique’s coal-rich
Moatize region
Coal resources
estimated at 1.2 bn
tonnes including coking
coal
Mozambique, Africa
JSPL’s Kiepersol Colliery produces Anthracite
coal, sold domestically and internationally Plans
to ramp up capacity
South Africa, Africa
Botswana, Africa Acquired CIC Energy in 2012 for 120 mn USD
Coal Mine with Resource of over 3 bn MT (high
grade thermal coal)
Proposed Cement Plant
Madagascar, Africa
Acquired 82.04% controlling
stake in Wollongong Coal
(Erstwhile Gujarat NRE coking
coal Limited)
Australia
1.5 MT HBI & 2 MT SMS Plant –
plans to make it an Integrated
Steel Plant
Shadeed, Oman Medium to large size
deposits of prime hard
coking and low ash – low
sulphur thermal coal for
open-cast operation
Indonesia, Asia
Summary of International Operations
Copyright @ 2014 Jindal Steel & Power Limited 57 Copyright @ 2014 Jindal Steel & Power Limited 57
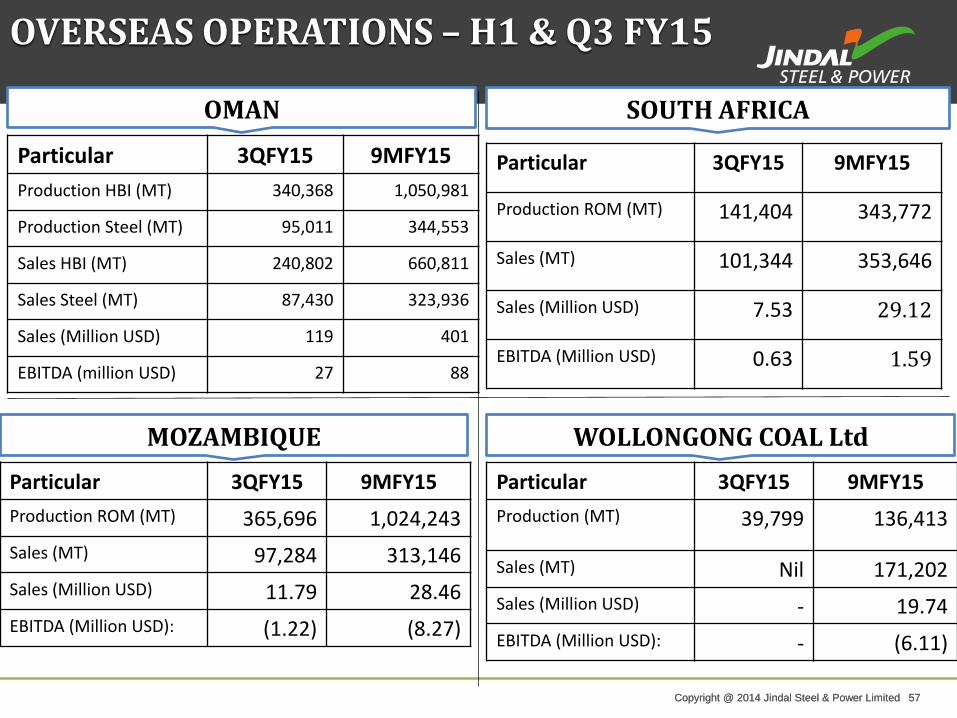
OMAN
OVERSEAS OPERATIONS – H1 & Q3 FY15
Particular 3QFY15 9MFY15
Production HBI (MT) 340,368 1,050,981
Production Steel (MT) 95,011 344,553
Sales HBI (MT) 240,802 660,811
Sales Steel (MT) 87,430 323,936
Sales (Million USD) 119 401
EBITDA (million USD) 27 88
Particular 3QFY15 9MFY15
Production ROM (MT) 141,404 343,772
Sales (MT) 101,344 353,646
Sales (Million USD) 7.53 29.12
EBITDA (Million USD) 0.63 1.59
SOUTH AFRICA
Particular 3QFY15 9MFY15
Production ROM (MT) 365,696 1,024,243
Sales (MT) 97,284 313,146
Sales (Million USD) 11.79 28.46
EBITDA (Million USD): (1.22) (8.27)
MOZAMBIQUE
Particular 3QFY15 9MFY15
Production (MT) 39,799 136,413
Sales (MT) Nil 171,202
Sales (Million USD) - 19.74
EBITDA (Million USD): - (6.11)
WOLLONGONG COAL Ltd

Copyright @ 2014 Jindal Steel & Power Limited 58 Copyright @ 2014 Jindal Steel & Power Limited 58
In July 2010, JSPL acquired Shadeed Iron & Steel Co. LLC, a company incorporated under the laws of the Sultanate of Oman
• Gas-based 1.5 MTPA HBI plant at Sohar Industrial Port commenced production in January 2011
• Commissioned steelmaking facility of 2 MTPA in CY14
Investment
Jindal Shadeed – Oman
Copyright @ 2014 Jindal Steel & Power Limited 59 Copyright @ 2014 Jindal Steel & Power Limited 59 59
• DRI Plant has achieved maximum operating hours of 8,629 in the calendar year 2014 since commissioning of the plant. Worldwide, no other DRI plant has achieved this target. The operating efficiency of 98.5% is the best for a plant of this size running on the same technology.
• EBIDTA in Q3 has increased by 3.8 % as compared to previous year Q3 (Oct13-Dec 13).
• Round Billets were cast successfully after commissioning and dispatched 2200 Tons through see route in November 2014 to JESCO, Saudi Arabia.
• Oman Chamber of Commerce & Industry (OCCI) felicitated JSIS for its contribution to the development of Small & Medium Enterprises (SMEs).
• Various management initiatives like TPM, Safe workplace activities, maintenance of quality standards have been implemented in the entire plant.
JSPL – Oman – 3QFY15 Highlights
Copyright @ 2014 Jindal Steel & Power Limited 60 Copyright @ 2014 Jindal Steel & Power Limited 60
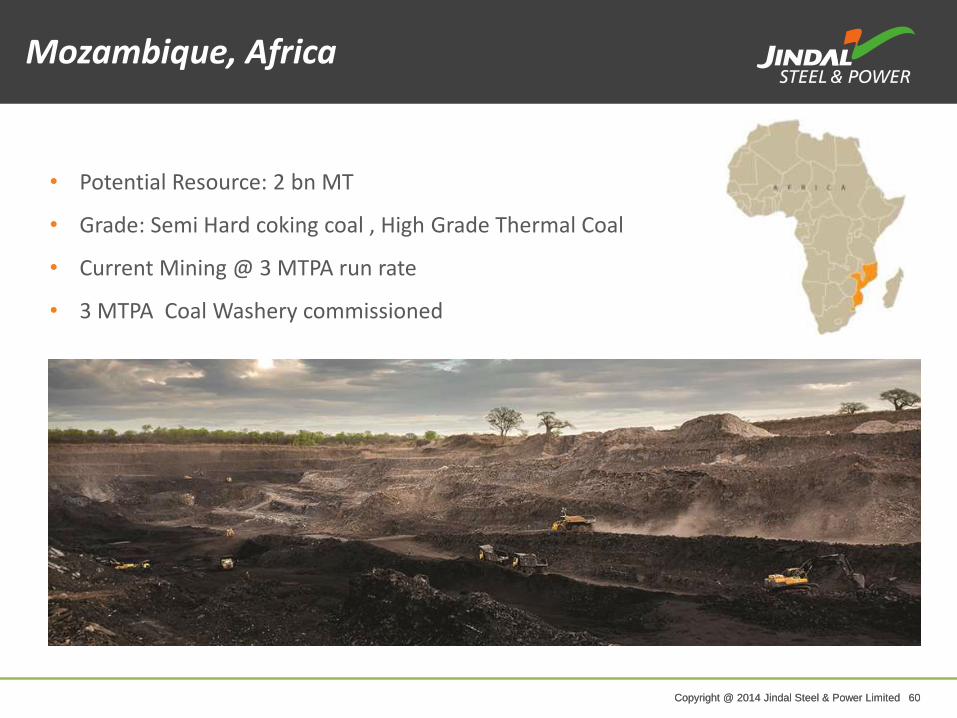
• Potential Resource: 2 bn MT
• Grade: Semi Hard coking coal , High Grade Thermal Coal
• Current Mining @ 3 MTPA run rate
• 3 MTPA Coal Washery commissioned
Mozambique, Africa
Copyright @ 2014 Jindal Steel & Power Limited 61 Copyright @ 2014 Jindal Steel & Power Limited 61
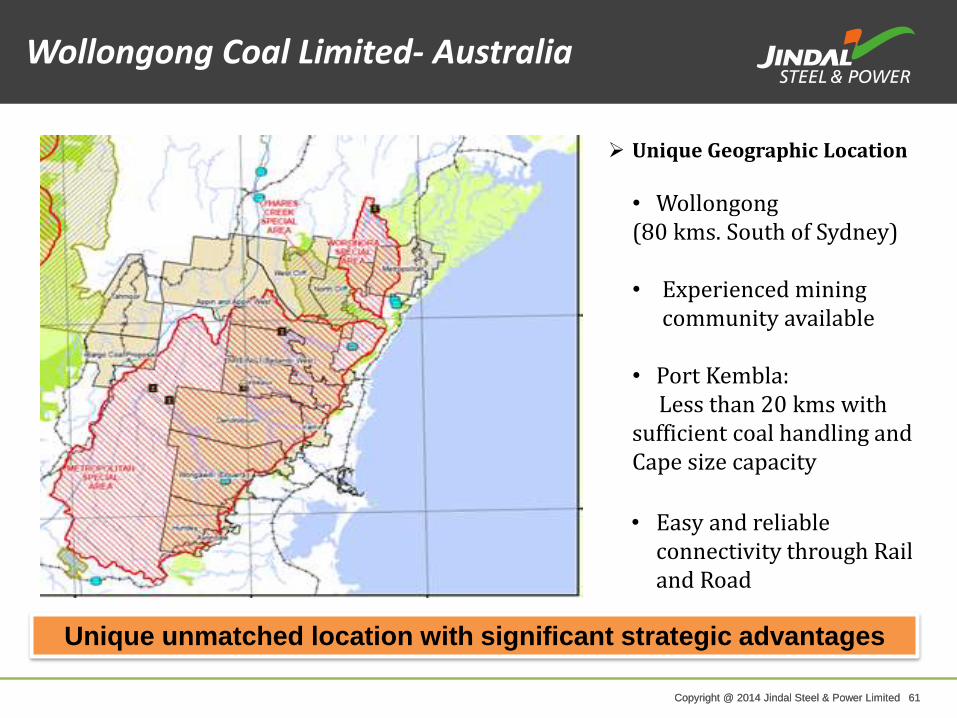
Unique unmatched location with significant strategic advantages
Unique Geographic Location
• Wollongong (80 kms. South of Sydney) • Experienced mining
community available
• Port Kembla: Less than 20 kms with sufficient coal handling and Cape size capacity
• Easy and reliable
connectivity through Rail and Road
Wollongong Coal Limited- Australia
Copyright @ 2014 Jindal Steel & Power Limited 62 Copyright @ 2014 Jindal Steel & Power Limited 62
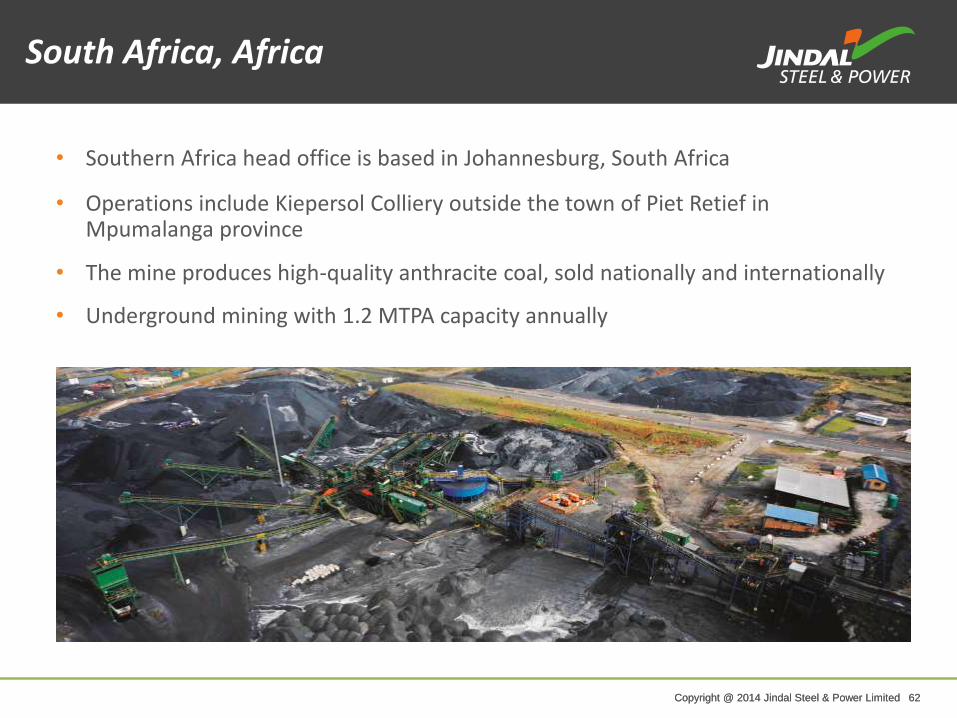
• Southern Africa head office is based in Johannesburg, South Africa
• Operations include Kiepersol Colliery outside the town of Piet Retief in Mpumalanga province
• The mine produces high-quality anthracite coal, sold nationally and internationally
• Underground mining with 1.2 MTPA capacity annually
South Africa, Africa
Copyright @ 2014 Jindal Steel & Power Limited 63 Copyright @ 2014 Jindal Steel & Power Limited 63
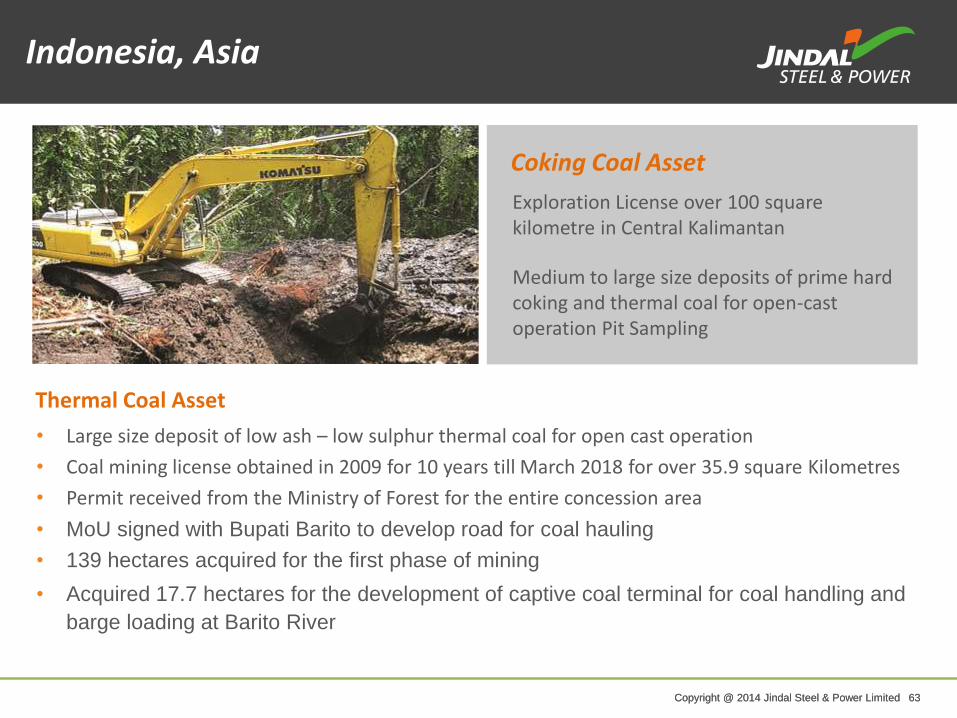
Thermal Coal Asset
• Large size deposit of low ash – low sulphur thermal coal for open cast operation
• Coal mining license obtained in 2009 for 10 years till March 2018 for over 35.9 square Kilometres
• Permit received from the Ministry of Forest for the entire concession area
• MoU signed with Bupati Barito to develop road for coal hauling
• 139 hectares acquired for the first phase of mining
• Acquired 17.7 hectares for the development of captive coal terminal for coal handling and
barge loading at Barito River
Coking Coal Asset
Exploration License over 100 square kilometre in Central Kalimantan
Medium to large size deposits of prime hard coking and thermal coal for open-cast operation Pit Sampling
Indonesia, Asia
Copyright @ 2014 Jindal Steel & Power Limited 64 Copyright @ 2014 Jindal Steel & Power Limited 64
Copyright @ 2014 Jindal Steel & Power Limited 65 Copyright @ 2014 Jindal Steel & Power Limited 65
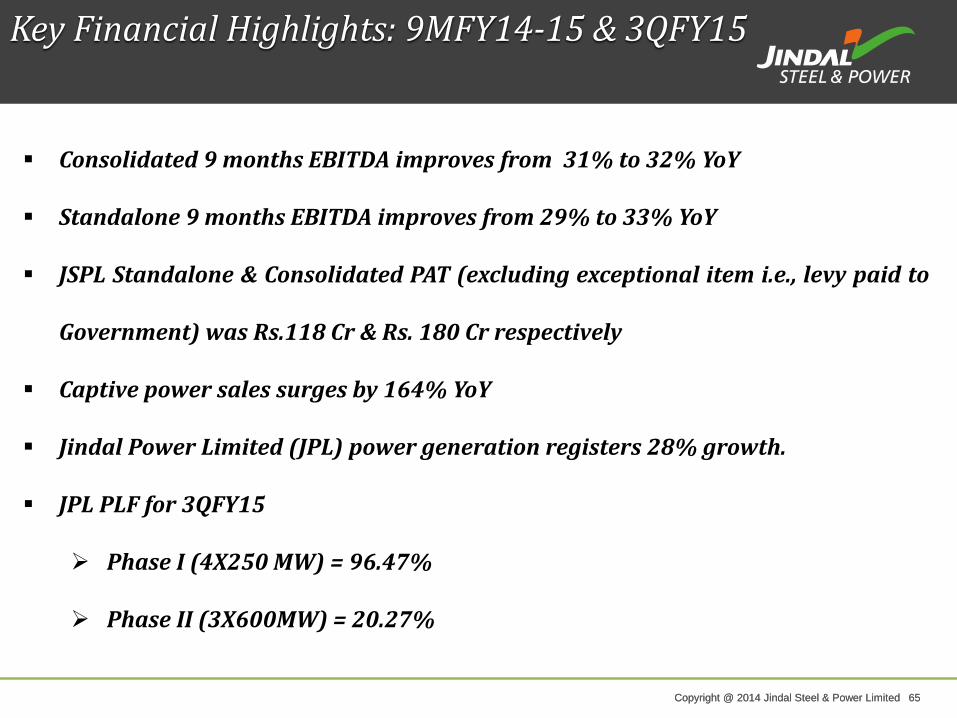
Key Financial Highlights: 9MFY14-15 & 3QFY15
Consolidated 9 months EBITDA improves from 31% to 32% YoY
Standalone 9 months EBITDA improves from 29% to 33% YoY
JSPL Standalone & Consolidated PAT (excluding exceptional item i.e., levy paid to
Government) was Rs.118 Cr & Rs. 180 Cr respectively
Captive power sales surges by 164% YoY
Jindal Power Limited (JPL) power generation registers 28% growth.
JPL PLF for 3QFY15
Phase I (4X250 MW) = 96.47%
Phase II (3X600MW) = 20.27%

Copyright @ 2014 Jindal Steel & Power Limited 66 Copyright @ 2014 Jindal Steel & Power Limited 66
Consolidated Financials at a Glance
FY08 FY09 FY10 FY11 FY12 FY13 FY14 9M FY 15
INCOME STATEMENT
Revenue 5,539 10,913 11,152 13,194 18,351 19,807 19,286 14,875
EBITDA 2,253 5,908 5,232 6,398 6,935 6,669 5,776 4,694
PAT* 1,251 3,007 3,635 3,804 4,002 2,912 1,894 982
Cash Profit* 1,810 4,194 4,760 5,115 5,575 4,593 3,876 3,403
BALANCE SHEET
Gross Block 10,680 14,928 21,109 29,317 35,802 45,912 63,056 69,262
Net Worth 3,824 7,021 10,387 14,088 17,931 21,150 21,191 20,097
Borrowings 6,996 8,113 8,605 13,987 17,058 24,618 36,368 44,222
Net Debt 6,225 7,091 8,436 12,854 15,616 24,430 35,419 41,934
SIGNIFICANT RATIOS
EBITDA Margin (%) 41 54 47 48 38 34 30 32
Net Profit to Sales (%) 23% 28% 33% 29% 22% 15% 10% 7%
Return on Net Worth (%) 34% 43% 35% 27% 22% 14% 9% 10%
Long Term Debt Equity
Ratio1.74 1.03 0.59 0.7 0.61 0.77 1.29 1.62
EPS (INR/Share) (a) (b) 13.54 32.44 39.05 40.75 42.42 31.13 20.53 11.37
* Before Exceptional Item
Copyright @ 2014 Jindal Steel & Power Limited 67 Copyright @ 2014 Jindal Steel & Power Limited 67
0
1000
2000
3000
4000
5000
6000
9MFY14 9MFY15
PBT Depreciation Interest
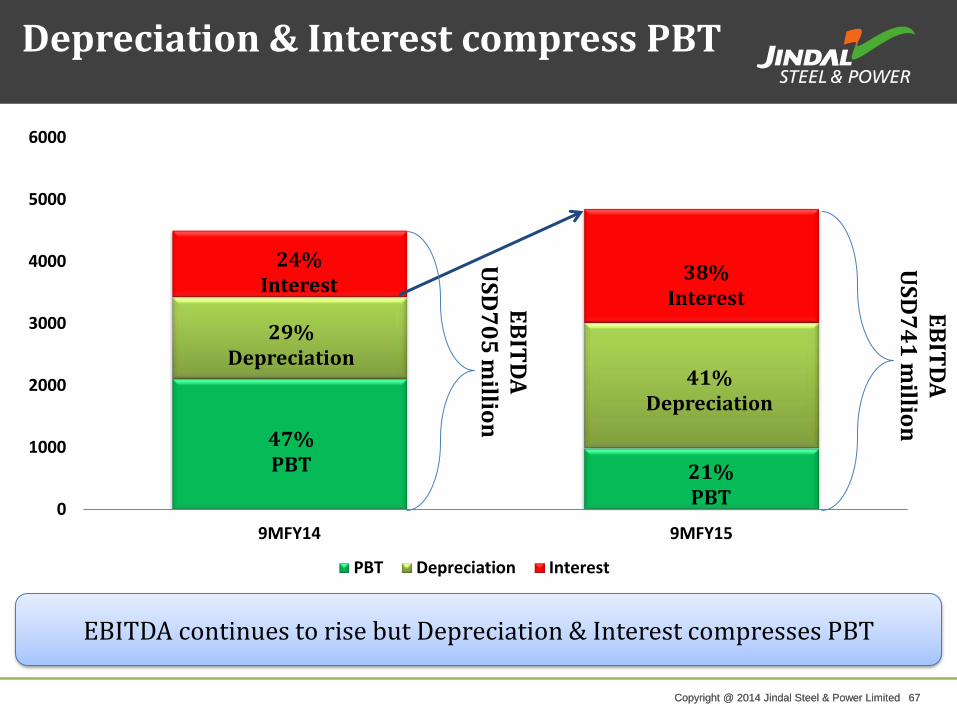
EBITDA continues to rise but Depreciation & Interest compresses PBT
38% Interest
21% PBT
Depreciation & Interest compress PBT
24% Interest
47% PBT
EB
ITD
A
US
D7
05
millio
n
29% Depreciation
41% Depreciation
EB
ITD
A
US
D7
41
millio
n

Copyright @ 2014 Jindal Steel & Power Limited 68 Copyright @ 2014 Jindal Steel & Power Limited 68
Financial Results – Standalone 9M FY15
Particulars (Rupees in Crores) For 9M ending %
31.12.2014 31.12.2013 Y ON Y
Turnover-Total 10,062 10,344 -2.7%
EBITDA 3,321 3,041
EBITDA % 33% 29%
Depreciation 1,319 906 45.6%
Finance costs 1,430 932 53.5%
Profit before tax & exceptional item 627 1,216 -48.4%
Exceptional item 787 -
Profit before Tax (160) 1,216
Profit after Tax (PAT) (76) 861
Profit after Tax (PAT) before exceptional items 711 861
Cash Profit before exceptional item 2,212 1,867
Cash Profit after exceptional item 1,425 1,867 -23.7%
CAPEX 2,442 4,413 -44.7%
Inspite of subdued steel demand, EBITDA margin grew 4% YoY
Copyright @ 2014 Jindal Steel & Power Limited 69 Copyright @ 2014 Jindal Steel & Power Limited 69
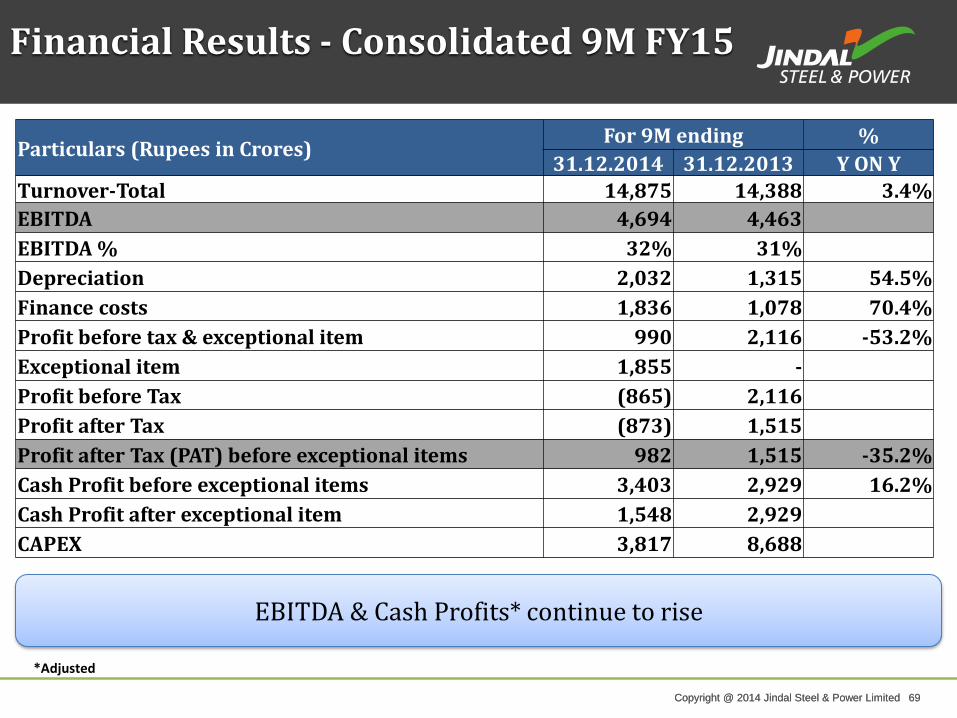
Financial Results - Consolidated 9M FY15
Particulars (Rupees in Crores) For 9M ending %
31.12.2014 31.12.2013 Y ON Y
Turnover-Total 14,875 14,388 3.4%
EBITDA 4,694 4,463
EBITDA % 32% 31%
Depreciation 2,032 1,315 54.5%
Finance costs 1,836 1,078 70.4%
Profit before tax & exceptional item 990 2,116 -53.2%
Exceptional item 1,855 -
Profit before Tax (865) 2,116
Profit after Tax (873) 1,515
Profit after Tax (PAT) before exceptional items 982 1,515 -35.2%
Cash Profit before exceptional items 3,403 2,929 16.2%
Cash Profit after exceptional item 1,548 2,929
CAPEX 3,817 8,688
EBITDA & Cash Profits* continue to rise
*Adjusted
Copyright @ 2014 Jindal Steel & Power Limited 70 Copyright @ 2014 Jindal Steel & Power Limited 70
Way Forward
Copyright @ 2014 Jindal Steel & Power Limited 71 Copyright @ 2014 Jindal Steel & Power Limited 71
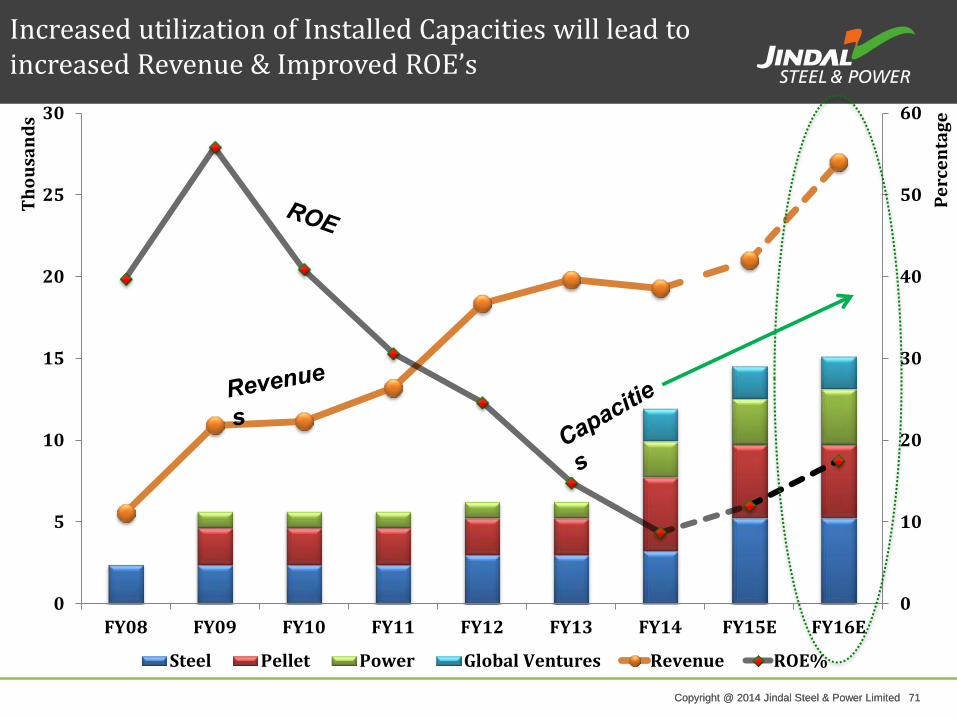
0
10
20
30
40
50
60
0
5
10
15
20
25
30
FY08 FY09 FY10 FY11 FY12 FY13 FY14 FY15E FY16E
Pe
rce
nta
ge
Th
ou
san
ds
Steel Pellet Power Global Ventures Revenue ROE%
Increased utilization of Installed Capacities will lead to increased Revenue & Improved ROE’s
Copyright @ 2014 Jindal Steel & Power Limited 72 Copyright @ 2014 Jindal Steel & Power Limited 72
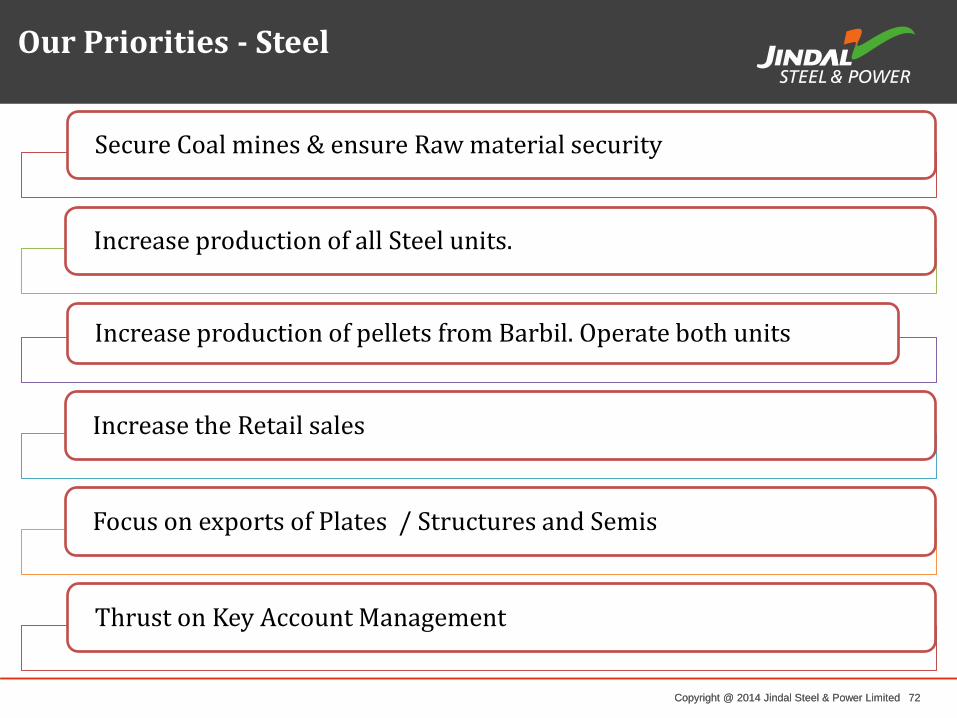
Our Priorities - Steel
Secure Coal mines & ensure Raw material security
Increase production of all Steel units.
Increase production of pellets from Barbil. Operate both units
Increase the Retail sales
Focus on exports of Plates / Structures and Semis
Thrust on Key Account Management
Copyright @ 2014 Jindal Steel & Power Limited 73 Copyright @ 2014 Jindal Steel & Power Limited 73
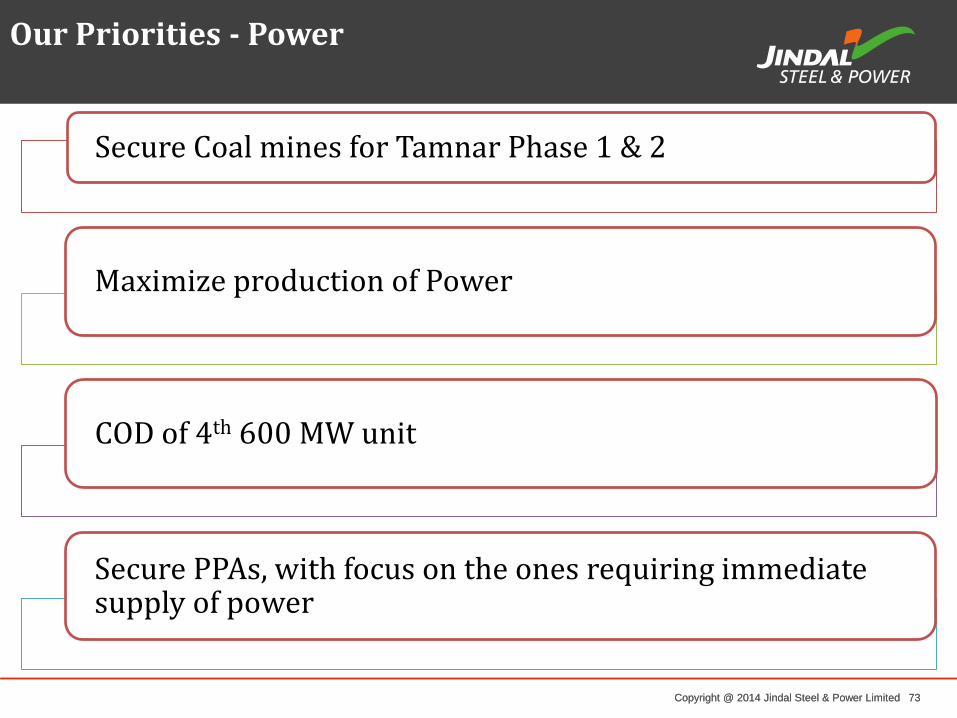
Our Priorities - Power
Secure Coal mines for Tamnar Phase 1 & 2
Maximize production of Power
COD of 4th 600 MW unit
Secure PPAs, with focus on the ones requiring immediate supply of power
Copyright @ 2014 Jindal Steel & Power Limited 74 Copyright @ 2014 Jindal Steel & Power Limited 74
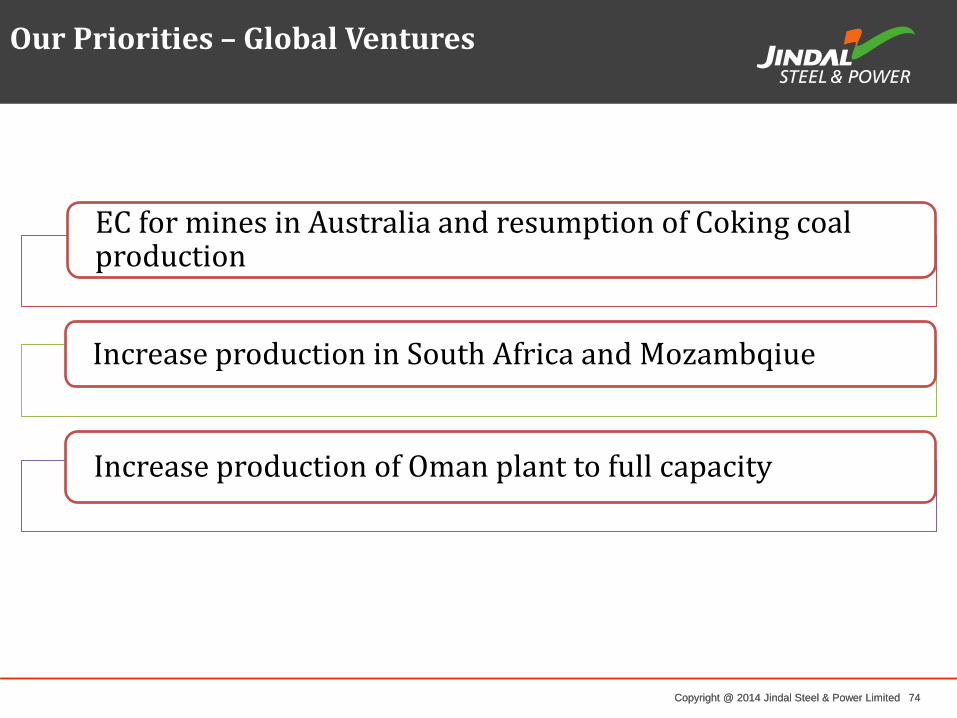
Our Priorities – Global Ventures
EC for mines in Australia and resumption of Coking coal production
Increase production in South Africa and Mozambqiue
Increase production of Oman plant to full capacity
Copyright @ 2014 Jindal Steel & Power Limited 75 Copyright @ 2014 Jindal Steel & Power Limited 75
Making Sustainability a Focus Priority
Copyright @ 2014 Jindal Steel & Power Limited 76 Copyright @ 2014 Jindal Steel & Power Limited 76
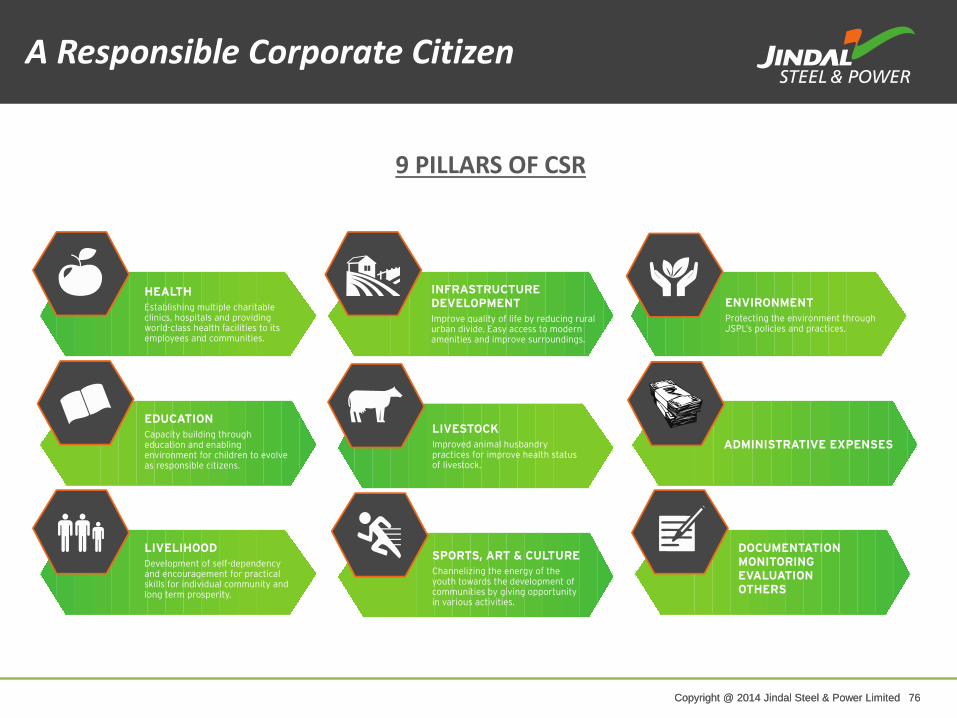
9 PILLARS OF CSR
A Responsible Corporate Citizen
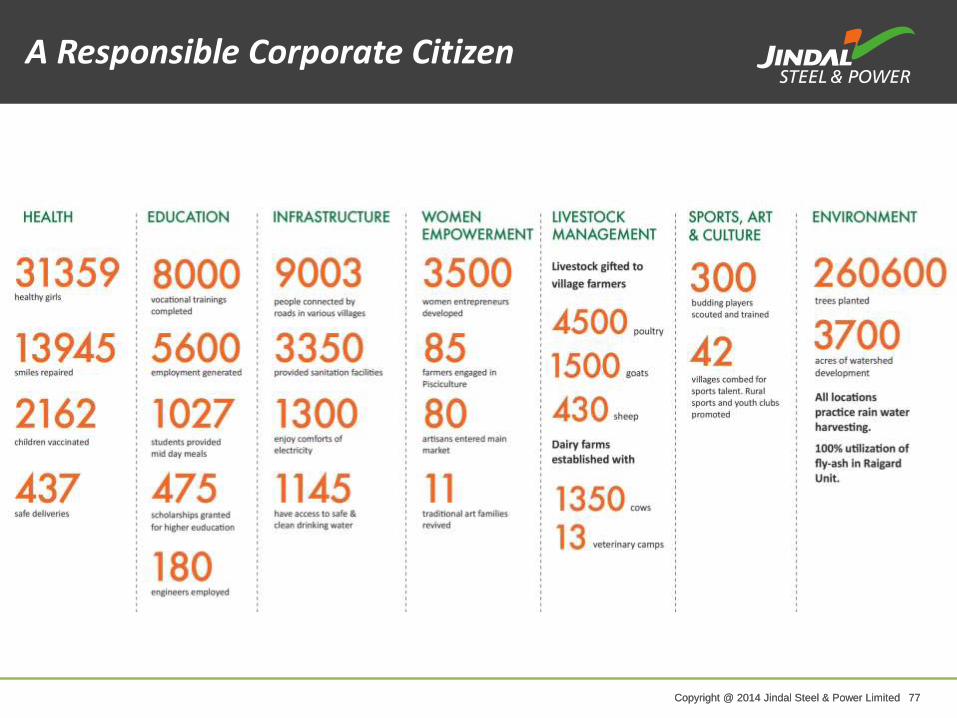
Copyright @ 2014 Jindal Steel & Power Limited 77 Copyright @ 2014 Jindal Steel & Power Limited 77
A Responsible Corporate Citizen
Copyright @ 2014 Jindal Steel & Power Limited 78 Copyright @ 2014 Jindal Steel & Power Limited 78
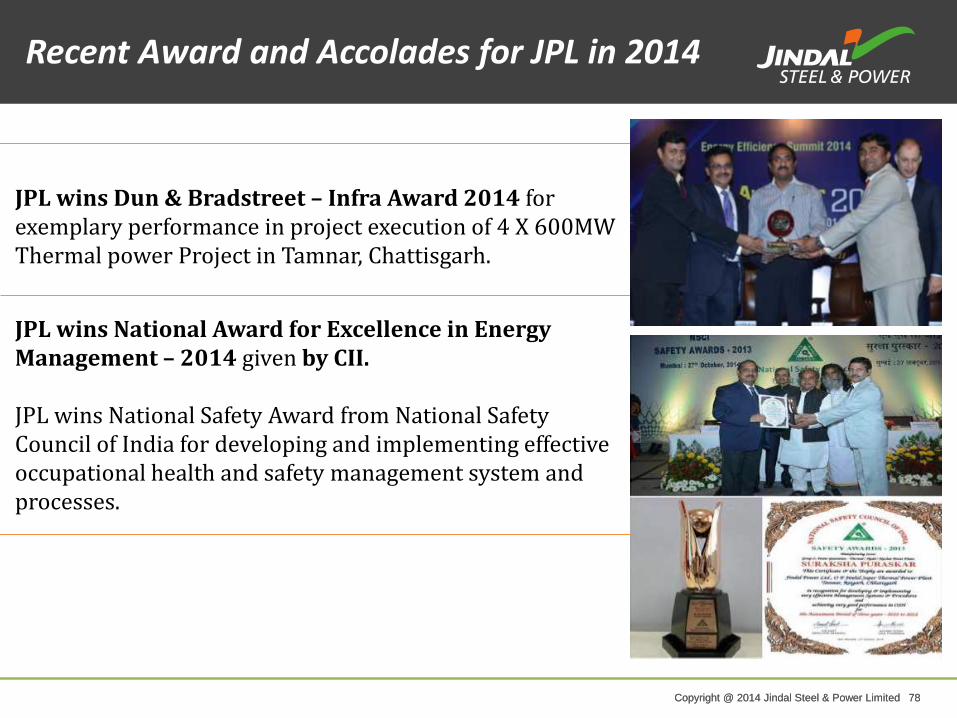
JPL wins Dun & Bradstreet – Infra Award 2014 for exemplary performance in project execution of 4 X 600MW Thermal power Project in Tamnar, Chattisgarh.
JPL wins National Award for Excellence in Energy Management – 2014 given by CII. JPL wins National Safety Award from National Safety Council of India for developing and implementing effective occupational health and safety management system and processes.
Recent Award and Accolades for JPL in 2014
Copyright @ 2014 Jindal Steel & Power Limited 79 Copyright @ 2014 Jindal Steel & Power Limited 79
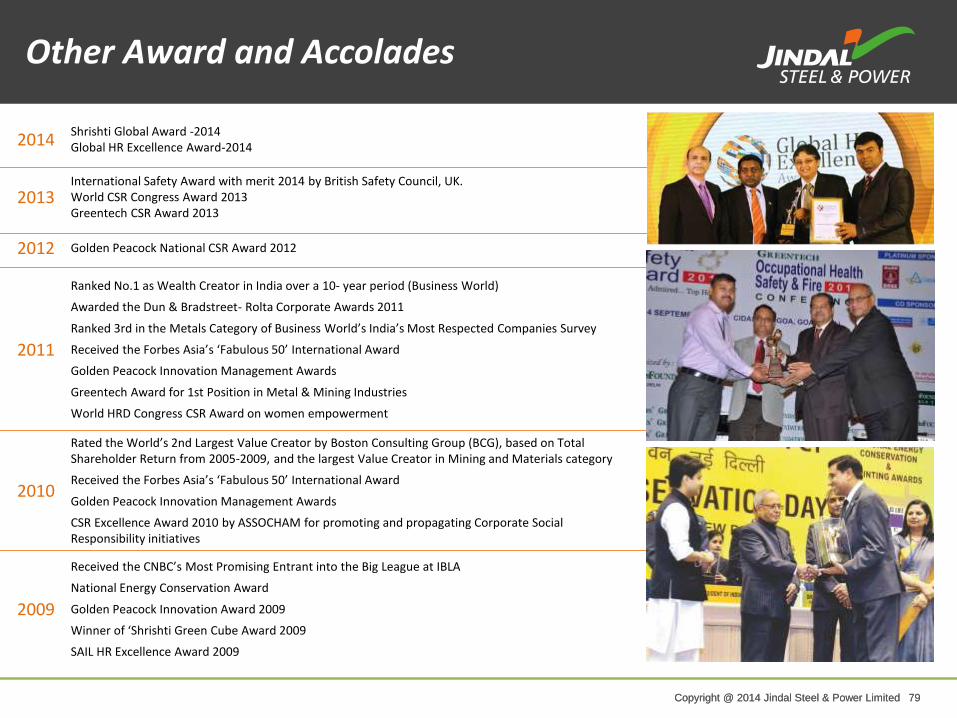
2014 Shrishti Global Award -2014 Global HR Excellence Award-2014
2013 International Safety Award with merit 2014 by British Safety Council, UK. World CSR Congress Award 2013 Greentech CSR Award 2013
2012 Golden Peacock National CSR Award 2012
2011
Ranked No.1 as Wealth Creator in India over a 10- year period (Business World)
Awarded the Dun & Bradstreet- Rolta Corporate Awards 2011
Ranked 3rd in the Metals Category of Business World’s India’s Most Respected Companies Survey
Received the Forbes Asia’s ‘Fabulous 50’ International Award
Golden Peacock Innovation Management Awards
Greentech Award for 1st Position in Metal & Mining Industries
World HRD Congress CSR Award on women empowerment
2010
Rated the World’s 2nd Largest Value Creator by Boston Consulting Group (BCG), based on Total Shareholder Return from 2005-2009, and the largest Value Creator in Mining and Materials category
Received the Forbes Asia’s ‘Fabulous 50’ International Award
Golden Peacock Innovation Management Awards
CSR Excellence Award 2010 by ASSOCHAM for promoting and propagating Corporate Social Responsibility initiatives
2009
Received the CNBC’s Most Promising Entrant into the Big League at IBLA
National Energy Conservation Award
Golden Peacock Innovation Award 2009
Winner of ‘Shrishti Green Cube Award 2009
SAIL HR Excellence Award 2009
Other Award and Accolades
Copyright @ 2014 Jindal Steel & Power Limited 80 Copyright @ 2014 Jindal Steel & Power Limited 80
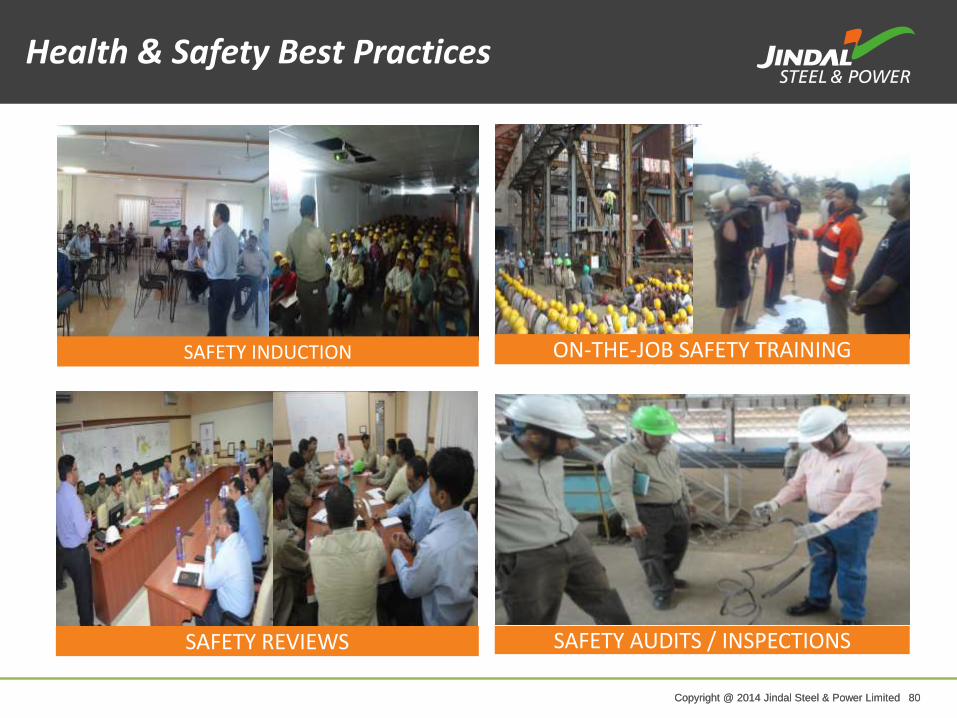
SAFETY INDUCTION ON-THE-JOB SAFETY TRAINING
SAFETY REVIEWS SAFETY AUDITS / INSPECTIONS
Health & Safety Best Practices

Copyright @ 2014 Jindal Steel & Power Limited 81 Copyright @ 2014 Jindal Steel & Power Limited 81
TOOL BOX MEETINGS SAFETY AWARDS/REWARDS
MEDICAL EXAMINATIONS/ WORLD CLASS PPEs MOCK DRILLS
Health & Safety Best Practices
Copyright @ 2014 Jindal Steel & Power Limited 82 Copyright @ 2014 Jindal Steel & Power Limited 82
Copyright @ 2014 Jindal Steel & Power Limited 83 Copyright @ 2014 Jindal Steel & Power Limited 83
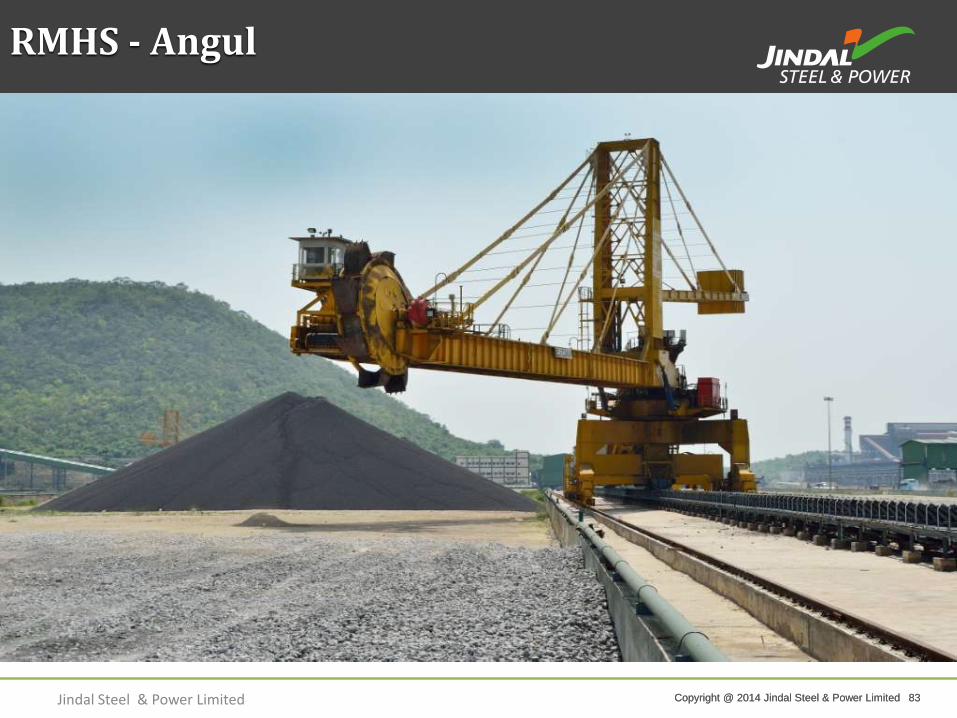
RMHS - Angul
Jindal Steel & Power Limited

Copyright @ 2014 Jindal Steel & Power Limited 84 Copyright @ 2014 Jindal Steel & Power Limited 84
Railway Siding- Angul
Copyright @ 2014 Jindal Steel & Power Limited 85 Copyright @ 2014 Jindal Steel & Power Limited 85
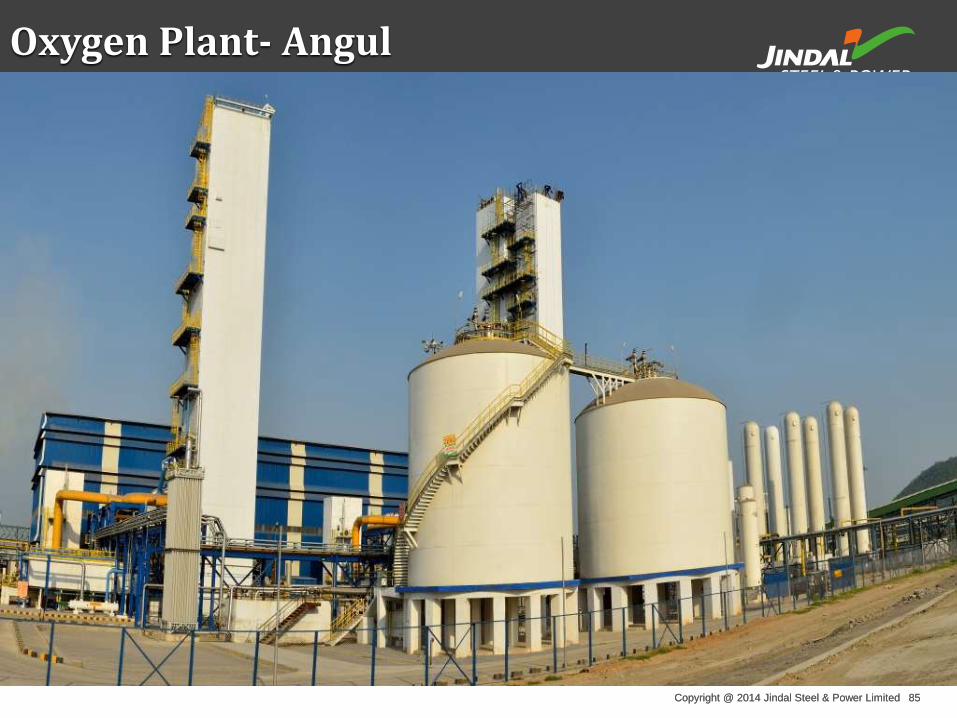
Oxygen Plant- Angul
Copyright @ 2014 Jindal Steel & Power Limited 86 Copyright @ 2014 Jindal Steel & Power Limited 86
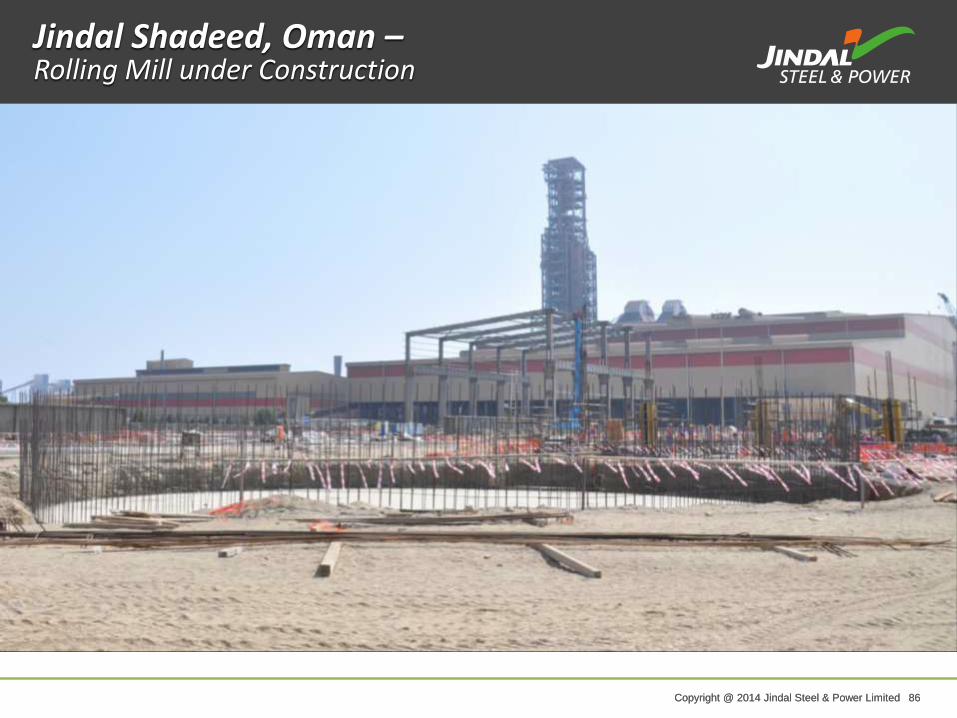
Jindal Shadeed, Oman – Rolling Mill under Construction
Copyright @ 2014 Jindal Steel & Power Limited 87 Copyright @ 2014 Jindal Steel & Power Limited 87
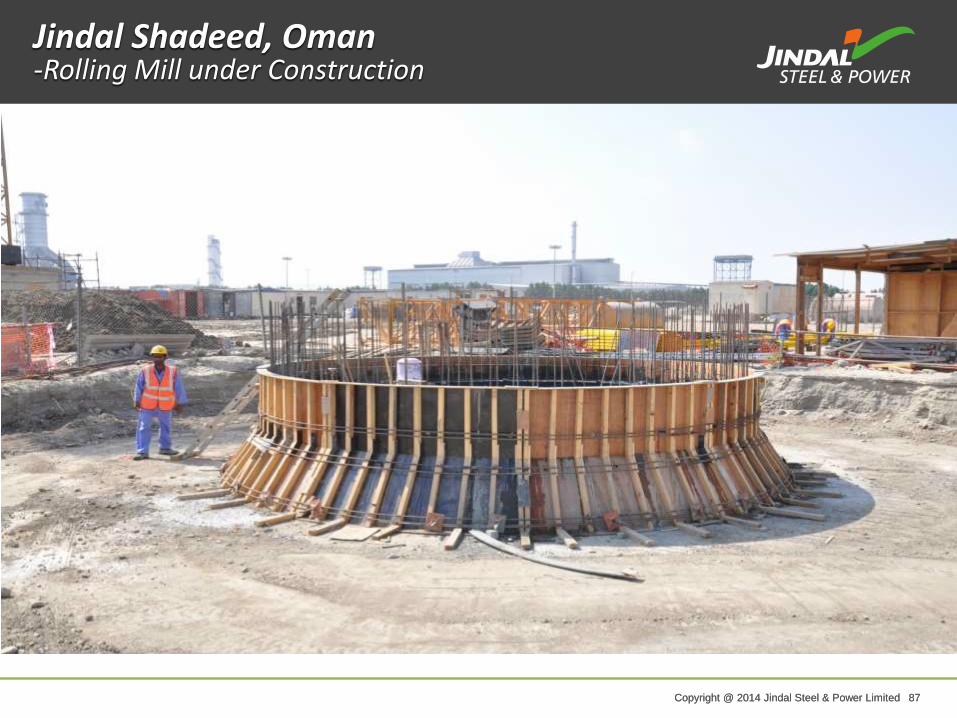
Jindal Shadeed, Oman -Rolling Mill under Construction
Copyright @ 2014 Jindal Steel & Power Limited 88 Copyright @ 2014 Jindal Steel & Power Limited 88
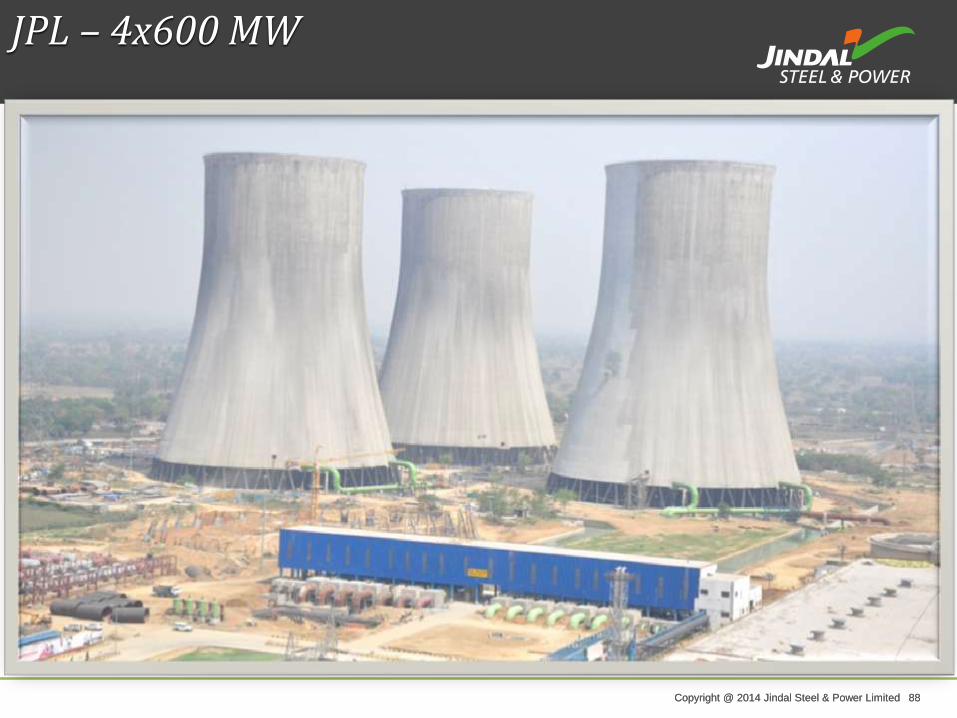
JPL – 4x600 MW
Copyright @ 2014 Jindal Steel & Power Limited 89 Copyright @ 2014 Jindal Steel & Power Limited 89
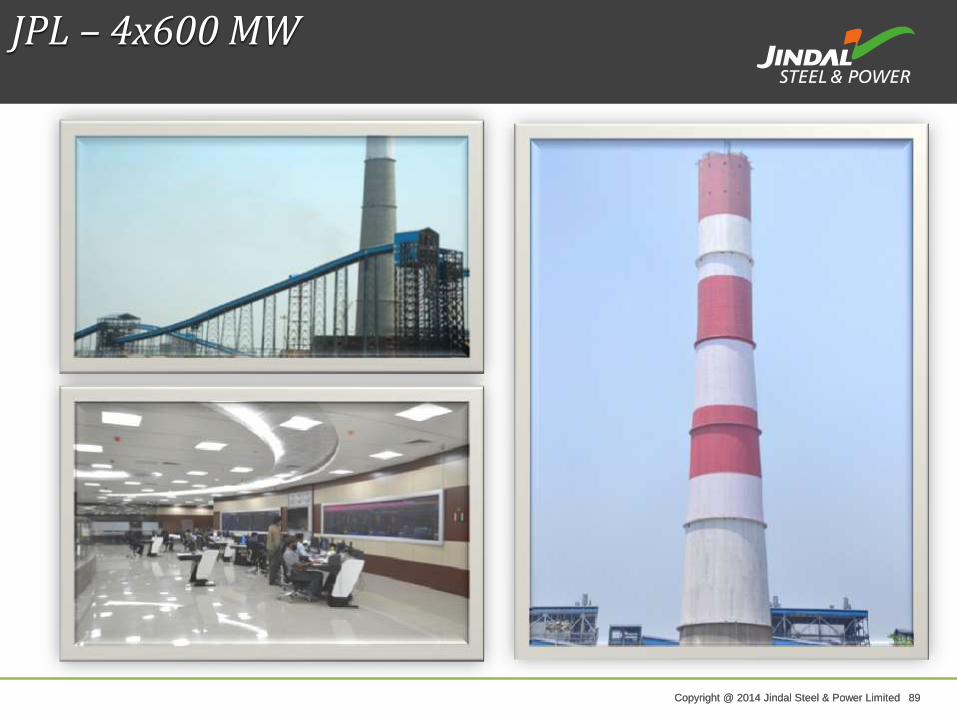
JPL – 4x600 MW
Copyright @ 2014 Jindal Steel & Power Limited 90 Copyright @ 2014 Jindal Steel & Power Limited 90
Marketing Network
Copyright @ 2014 Jindal Steel & Power Limited 91 Copyright @ 2014 Jindal Steel & Power Limited 91
Mr. D.Balasubramanyam Head of Investor Relations Tel: 011-26739109, Mobile: 8130755166 Email: [email protected]
Ms. Pallavi Kumari Investor Relations Tel: 011-26739165, Mobile: 8800094171 Email: [email protected]
For any information please contact : -
Mr. Nishant Baranwal Investor Relations Tel: 011-26739178, Mobile: 8800690255 Email: [email protected]
Copyright @ 2014 Jindal Steel & Power Limited 92 Copyright @ 2014 Jindal Steel & Power Limited 92
Thank You
Copyright @ 2014 Jindal Steel & Power Limited 93 Copyright @ 2014 Jindal Steel & Power Limited 93
Annexures
Copyright @ 2014 Jindal Steel & Power Limited 94 Copyright @ 2014 Jindal Steel & Power Limited 94
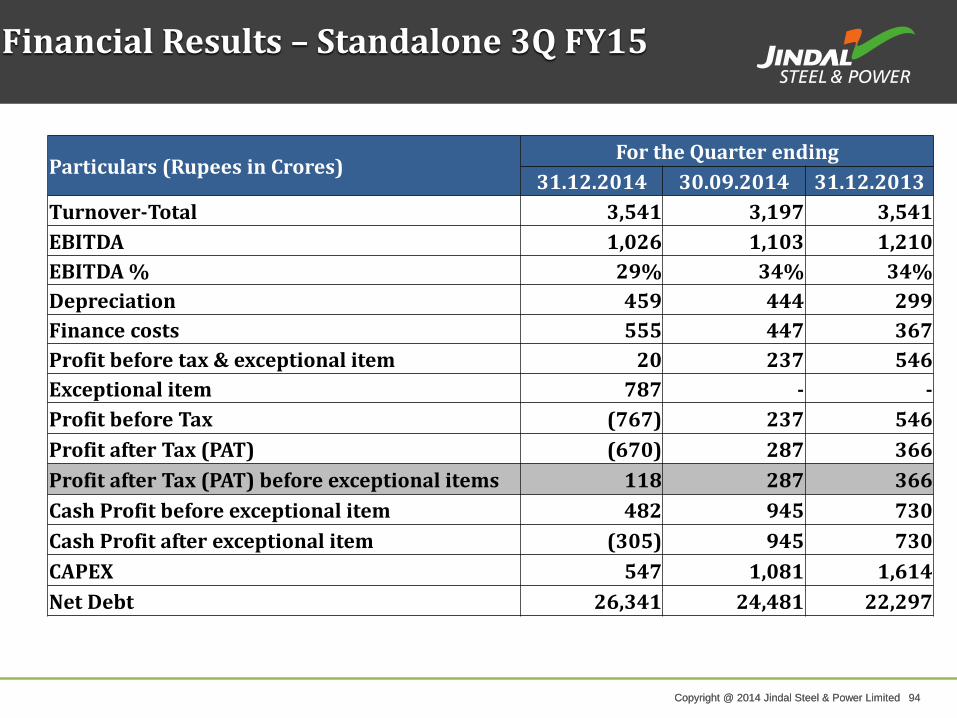
Financial Results – Standalone 3Q FY15
Particulars (Rupees in Crores) For the Quarter ending
31.12.2014 30.09.2014 31.12.2013
Turnover-Total 3,541 3,197 3,541
EBITDA 1,026 1,103 1,210
EBITDA % 29% 34% 34%
Depreciation 459 444 299
Finance costs 555 447 367
Profit before tax & exceptional item 20 237 546
Exceptional item 787 - -
Profit before Tax (767) 237 546
Profit after Tax (PAT) (670) 287 366
Profit after Tax (PAT) before exceptional items 118 287 366
Cash Profit before exceptional item 482 945 730
Cash Profit after exceptional item (305) 945 730
CAPEX 547 1,081 1,614
Net Debt 26,341 24,481 22,297

Copyright @ 2014 Jindal Steel & Power Limited 95 Copyright @ 2014 Jindal Steel & Power Limited 95
Financial Results - Consolidated Q3 FY15
Particulars (Rupees in Crores) For the Quarter ending
31.12.2014 30.09.2014 31.12.2013
Turnover-Total 5,045 5,143 5,142
EBITDA 1,425 1,640 1,701
EBITDA % 28% 32% 33%
Depreciation 715 650 460
Finance costs 702 599 430
Profit before tax & exceptional item 42 431 819
Exceptional item 1,855 - -
Profit before Tax (1,813) 431 819
Profit after Tax (1,675) 400 559
Profit after Tax (PAT) before exceptional items 180 400 559
Cash Profit before exceptional item 946 1,308 1,093
Cash Profit after exceptional item (909) 1,308 1,093
CAPEX 820 1,182 2,548
Net Debt 41,934 37,682 34,127