Embed Size (px)
Citation preview
Barley (Hordeum vulgare L.) nonhost resistance to
heterologous Puccinia rusts (Puccinia sp.)
Fine-mapping of a broad nonhost resistance QTL
Jeroen Roest
MSc. Thesis

1 | P a g e
Toome, Merje and M. Catherine Aime. 2012. Pucciniomycetes. Version 30 January 2012. in The Tree of
Life Web Project, http://tolweb.org/
I | P a g e
Wageningen UR
Barley (Hordeum vulgare L.) nonhost resistance
to heterologous Puccinia rusts (Puccinia sp.)
Fine-mapping of a broad nonhost resistance QTL
Jeroen Roest
MSc. Thesis
August 2016 - February 2017
Daily supervisor Y (Yajun) Wang PhD
2nd supervisor dr.ir. RE (Rients) Niks
Examiners: dr.ir. RE (Rients) Niks
dr.ir. AB (Guusje) Bonnema
Wageningen University
Department of Plant Breeding
Nonhost and Insect Resistance Research Group
Course: MSc. Thesis Plant Breeding
Course code: PBR-80436
Registration number 910921701040
E-mail [email protected]
gGG

II | P a g e
III | P a g e
Preface
To finalise my master programme Plant Sciences, I chose to perform a thesis at the Plant Breeding
department. Within this department, I was part of the Nonhost and Insect resistance research group. In
my time at this department I experienced a great independence and freedom to work on my own
research, while receiving help when needed. For the given help I would like to thank my supervisor
Rients Niks and my daily supervisor Yajun Wang. Rients was of greet help with setting op my research
project and with the interpretation of my data. Yajun helped me a lot with the laboratory work and with
daily struggles experienced during my thesis. For their help in the greenhouse, I would like to
acknowledge Anton Vels and Pauline Sanderson. They were of greet help for the maintenance of my
barley plants and for the cultivation of the Puccinia rusts. Anton was also the one who taught me how to
cross barley plants, which I greatly appreciated. Guusje Bonnema is acknowledged for being my second
supervisor.
Additionally I would like to thank my fellow plant breeding thesis students for their tips and tricks
regarding the writing of my thesis and for making my thesis time more pleasant in general. Lastly, I
thank Gill for reviewing my work and for being a great support.

IV | P a g e
G
V | P a g e
Abstract
Nonhost resistance confers resistance of an entire plant species to al genetic variants of a pathogen. It
may be considered to be the rule in nature, with disease being the exception. Little is still known about
the genetics and the mechanisms underlying the nonhost resistance, since by definition all plants of a
nonhost species are completely resistance to the pathogen. Nonhost resistance has been found to be
polygenic inherited and to show strong similarities with partial resistance. A deviation from the strict host
nonhost division of plant species is found in barley (Hordeum vulgare L.) which is a marginal host to
heterologous Puccinia rusts. This barleyPuccinia rust pathosystem has been used in inheritance studies
to develop mapping populations for nonhost resistance QTL. In the Cebada Capa cultivar, a nonhost
resistance QTL named Rnhq3 conferred resistance to all four tested heterologous Puccinia rusts P.
hordei-murini, P. hordei-secalini, P. persistens and P. triticina. The Rnhq3 nonhost resistance QTL was
thus hypothesised to contain a broad nonhost resistance gene, which gives a wide spectrum nonhost
resistance. A mapping population for the Rnhq3 nonhost resistance QTL has been developed, in which
the Rnhq3 QTL is the only nonhost resistance QTL present. This mapping population was used in this
research for confirmation of the presence of a single broad nonhost resistance gene in the Rnhq3 QTL
and for fine-mapping it. The broad nonhost resistance effect of the Rnhq3 QTL was not confirmed in this
research nor was the presence of a single broad nonhost resistance gene. The Rnhq3 nonhost resistance
QTL has been fine-mapped for resistance towards the heterologous Puccinia rust P. graminis f.sp. lolii to
a marker interval of <4.1cM. This marker interval possibly contains the hypothesised broad nonhost
resistance gene, but this has to be confirmed in further research. Lastly a cross has been made with the
Rnhq3 QTL mapping population, contributing to the development of Near-Isogenic Line for the Rnhq3
QTL.

VI | P a g e
G
VII | P a g e
Table of Contents
Chapter 1: Introduction ........................................................................................................1 1.1 Plant defence.............................................................................................................. 1 1.2 Host resistance ........................................................................................................... 2 1.3 Nonhost resistance ...................................................................................................... 3
1.3.1 Definition of nonhost resistance ................................................................................. 3 1.3.2 Barley - Puccinia rust model ...................................................................................... 3 1.3.3 Rnhq3 nonhost resistance QTL ................................................................................... 4 1.3.4 SNP consensus map ................................................................................................. 5
1.4 Research objectives and hypothesis ............................................................................... 5 1.4.1 Wide spectrum resistance test ................................................................................... 5 1.4.2 Fine-mapping Rnhq3 nonhost resistance QTL ............................................................... 6 1.4.3 Developing a Near-Isogenic Line for the Rnhq3 nonhost resistance QTL ........................... 6
1.5 Research questions ..................................................................................................... 7
Chapter 2: Materials and methods ........................................................................................8 2.1 Wide spectrum resistance test ....................................................................................... 8
2.1.1 Heterologous Puccinia rust fungi ................................................................................ 8 2.1.2 Phenotyping............................................................................................................ 8 2.1.3 DNA isolation .......................................................................................................... 9 2.1.4 Marker development and primer design .................................................................... 10 2.1.5 Genotyping ........................................................................................................... 12 2.1.6 Data analysis ........................................................................................................ 12
2.2 Fine-mapping the Rnhq3 nonhost resistance QTL ........................................................... 12 2.2.1 Recombinant selection ............................................................................................ 12 2.2.2 Fine-mapping ........................................................................................................ 12 2.2.3 Marker mapping .................................................................................................... 13
2.3 Further development of a Near-Isogenic Line ................................................................ 13 2.3.1 Parental selection .................................................................................................. 13 2.3.2 Crossing ............................................................................................................... 14 2.3.3 Seed development and sowing ................................................................................ 14
Chapter 3: Results .............................................................................................................. 15 3.1 Wide spectrum resistance test ..................................................................................... 15
3.1.1 Inoculation success ................................................................................................ 15 3.1.2 Wide spectrum resistance ....................................................................................... 15 3.1.3 Marker quality and accuracy check ........................................................................... 16
3.2 Fine-mapping the Rnhq3 nonhost resistance QTL ........................................................... 16 3.2.1 Recombinant based fine-mapping ............................................................................ 16 3.2.2 Recombinant progeny based fine-mapping ................................................................ 18 3 .2.3 Marker mapping .................................................................................................... 20
3.3 Development of a Near-Isogenic Line for the Rnhq3 nonhost resistance QTL .......................... 21
Chapter 4: Discussion and recommendations ...................................................................... 22 4.1 Wide spectrum resistance test ..................................................................................... 22 4.2 Fine-mapping of the Rnhq3 nonhost resistance QTL........................................................ 24 4.3 Development of a Near-Isogenic Line for the Rnhq3 nonhost resistance QTL ...................... 26
Chapter 5: Conclusions ....................................................................................................... 27 5.1 Research objectives ................................................................................................... 27
5.1.1 Confirmation of the broad nonhost resistance of a single Rnhq3 gene ............................ 27 5.1.2 fine-mapping of the Rnhq3 nonhost resistance QTL ..................................................... 27 5.1.3 Development of a Near-Isogenic Line for the Rnhq3 nonhost resistance QTL ................... 28
5.2 Hypothesis ............................................................................................................... 28
Chapter 6: References ........................................................................................................ 29
Appendices ........................................................................................................................... 31 Appendix I: Wide spectrum resistance test ............................................................................. 31 Appendix II: Marker quality check .......................................................................................... 35 Appendix III: ANOVA and Fisher’s LSD-test for recombinant based fine-mapping ........................... 36 Appendix IV: One-sided two-sample t-tests for recombinant based fine-mapping .......................... 37 Appendix V: One-sided two-sample t-tests for recombinant progeny based fine-mapping .............. 39 Appendix VI: Overview of all recombinant plants which developed seed....................................... 42

VIII | P a g e
1 | P a g e
Chapter 1: Introduction
This research focussed on fine-mapping a nonhost resistance QTL in barley (Hordeum vulgare L.) and
confirming its proposed wide spectrum resistance effect towards heterologous Puccinia rust (Puccinia
sp.).
1.1 Plant defence
Plants experience a constant threat of diseases caused by environmental conditions and pathogens.
These pathogens are infectious agents belonging to the micro-organisms or even lower complexity
classes and usually live inside plants, eliciting diseases and corresponding symptoms. Their taxa belong
to the viroid, virus, phytoplasmas, bacteria, oomycete or fungus. Many pathogens are obligatory
biotrophic pathogens, making their survival dependent on their ability to infect living plant tissue. Well-
known examples of these types of pathogens are the Puccinia rusts, which parasite on nutrients
extracted from plant cells via haustoria formation (Sharma, 1989; Niks et al., 2011). Plants have
developed a general defence which is effective to many species of potential pathogens and gives a
durable form of resistance. This general defence is partly constitutive, caused by preformed barriers such
as wax layers, rigid cell walls, anti-microbial enzymes and secondary metabolites and partly caused by
induced defence responses via PAMP-triggered immunity. PAMPs are pathogen-associated molecular
patterns which are mostly vital for the pathogen, but alien for the plant. These PAMPs are recognized by
plants via extracellular receptors, hence triggering a PAMP-Triggered Immune (PTI) response in the cell
(Nürnberger et al., 2004; Niks et al., 2011). Pathogens challenge the general defence of a plant species
via avoiding or supressing the PAMP-triggered immunity. When a pathogens is able to exploit a plant
species via negating its general defences, plant species and a pathogen are considered to be basic-
compatible and form a pathosystem together. When the general defence of a plant species does prevent
it from getting exploited by a pathogen, it is considered to be basal resistant towards that pathogen.
Basic compatible pathogens suppression the PAMP-triggered immunity in a highly specific plant-species
process, involving specialised Avr-gene effector proteins. These effectors target the PAMP recognition
pathway of plant cells and supress the PTI, which is called Effector-Triggered Susceptibility (ETS). Plants
are able to combat ETS via so-called R-gene proteins, which recognise effector activity leading to
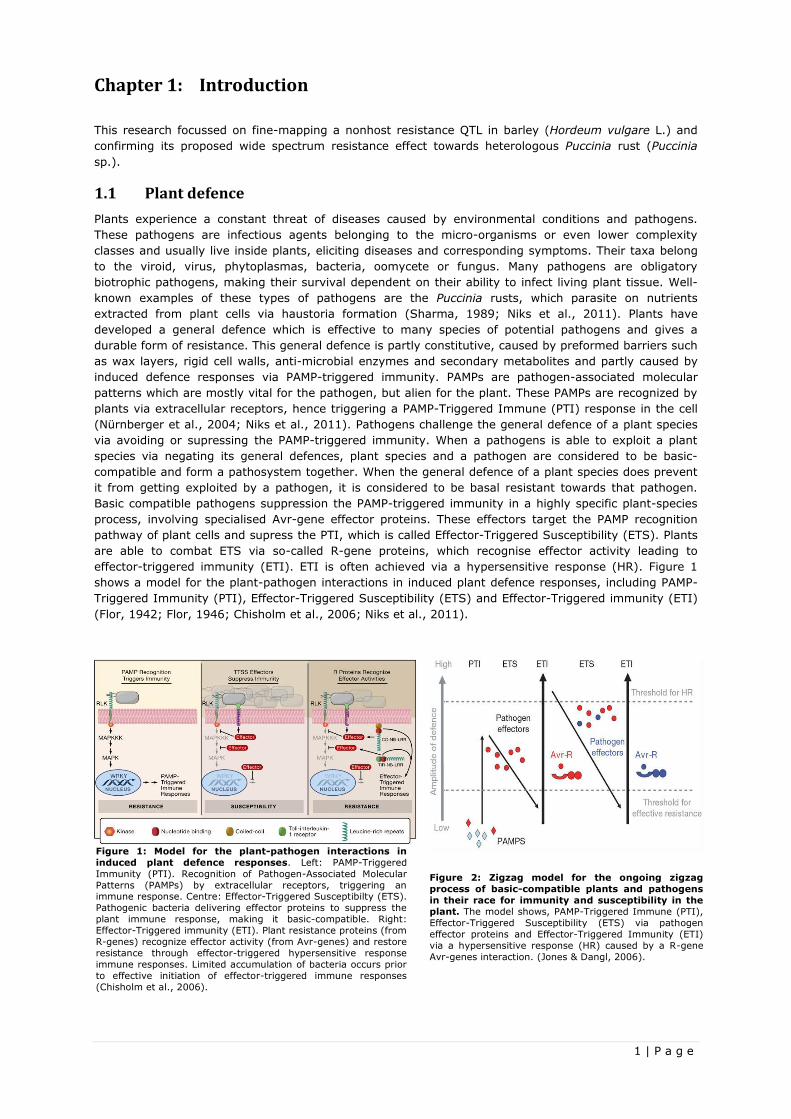
effector-triggered immunity (ETI). ETI is often achieved via a hypersensitive response (HR). Figure 1
shows a model for the plant-pathogen interactions in induced plant defence responses, including PAMP-
Triggered Immunity (PTI), Effector-Triggered Susceptibility (ETS) and Effector-Triggered immunity (ETI)
(Flor, 1942; Flor, 1946; Chisholm et al., 2006; Niks et al., 2011).
Figure 1: Model for the plant-pathogen interactions in
induced plant defence responses. Left: PAMP-Triggered
Immunity (PTI). Recognition of Pathogen-Associated Molecular
Patterns (PAMPs) by extracellular receptors, triggering an immune response. Centre: Effector-Triggered Susceptibilty (ETS).
Pathogenic bacteria delivering effector proteins to suppress the
plant immune response, making it basic-compatible. Right:
Effector-Triggered immunity (ETI). Plant resistance proteins (from
R-genes) recognize effector activity (from Avr-genes) and restore
resistance through effector-triggered hypersensitive response
immune responses. Limited accumulation of bacteria occurs prior
to effective initiation of effector-triggered immune responses
(Chisholm et al., 2006).
Figure 2: Zigzag model for the ongoing zigzag
process of basic-compatible plants and pathogens
in their race for immunity and susceptibility in the
plant. The model shows, PAMP-Triggered Immune (PTI),
Effector-Triggered Susceptibility (ETS) via pathogen
effector proteins and Effector-Triggered Immunity (ETI)
via a hypersensitive response (HR) caused by a R-gene
Avr-genes interaction. (Jones & Dangl, 2006).
2 | P a g e
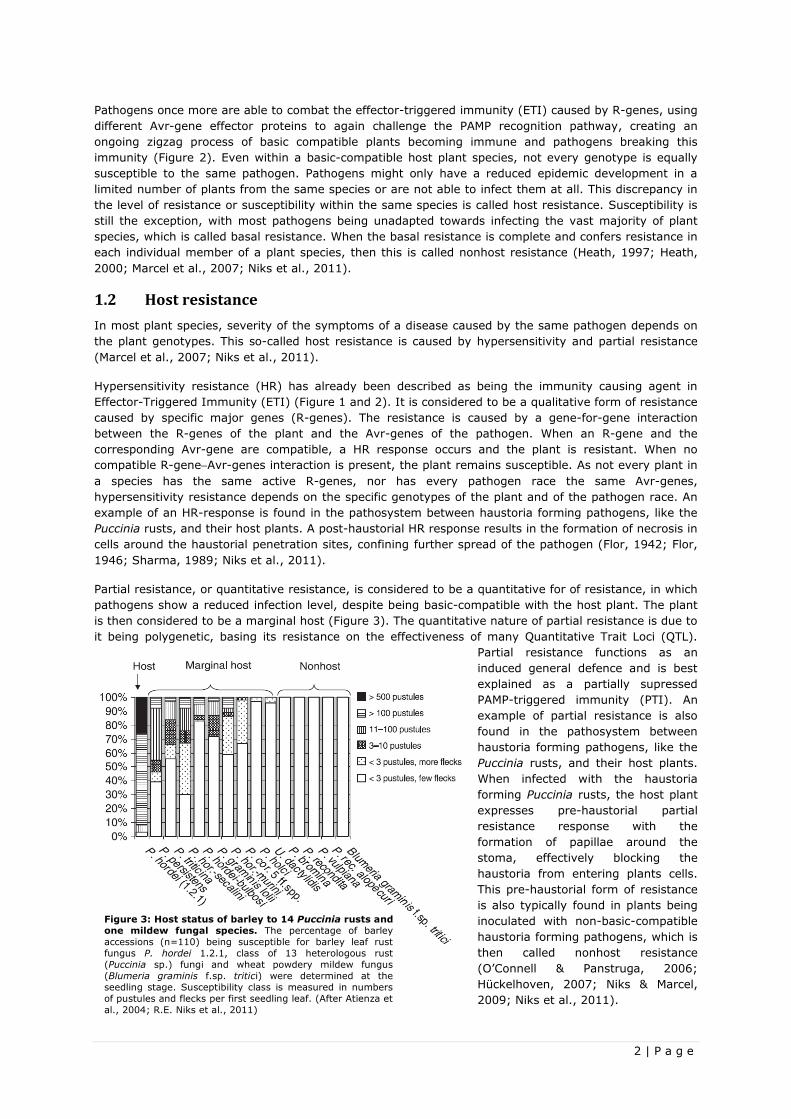
Figure 3: Host status of barley to 14 Puccinia rusts and
one mildew fungal species. The percentage of barley
accessions (n=110) being susceptible for barley leaf rust
fungus P. hordei 1.2.1, class of 13 heterologous rust
(Puccinia sp.) fungi and wheat powdery mildew fungus
(Blumeria graminis f.sp. tritici) were determined at the
seedling stage. Susceptibility class is measured in numbers
of pustules and flecks per first seedling leaf. (After Atienza et
al., 2004; R.E. Niks et al., 2011)
Pathogens once more are able to combat the effector-triggered immunity (ETI) caused by R-genes, using
different Avr-gene effector proteins to again challenge the PAMP recognition pathway, creating an
ongoing zigzag process of basic compatible plants becoming immune and pathogens breaking this
immunity (Figure 2). Even within a basic-compatible host plant species, not every genotype is equally
susceptible to the same pathogen. Pathogens might only have a reduced epidemic development in a
limited number of plants from the same species or are not able to infect them at all. This discrepancy in
the level of resistance or susceptibility within the same species is called host resistance. Susceptibility is
still the exception, with most pathogens being unadapted towards infecting the vast majority of plant
species, which is called basal resistance. When the basal resistance is complete and confers resistance in
each individual member of a plant species, then this is called nonhost resistance (Heath, 1997; Heath,
2000; Marcel et al., 2007; Niks et al., 2011).
1.2 Host resistance
In most plant species, severity of the symptoms of a disease caused by the same pathogen depends on
the plant genotypes. This so-called host resistance is caused by hypersensitivity and partial resistance
(Marcel et al., 2007; Niks et al., 2011).
Hypersensitivity resistance (HR) has already been described as being the immunity causing agent in
Effector-Triggered Immunity (ETI) (Figure 1 and 2). It is considered to be a qualitative form of resistance
caused by specific major genes (R-genes). The resistance is caused by a gene-for-gene interaction
between the R-genes of the plant and the Avr-genes of the pathogen. When an R-gene and the
corresponding Avr-gene are compatible, a HR response occurs and the plant is resistant. When no
compatible R-geneAvr-genes interaction is present, the plant remains susceptible. As not every plant in
a species has the same active R-genes, nor has every pathogen race the same Avr-genes,
hypersensitivity resistance depends on the specific genotypes of the plant and of the pathogen race. An
example of an HR-response is found in the pathosystem between haustoria forming pathogens, like the
Puccinia rusts, and their host plants. A post-haustorial HR response results in the formation of necrosis in
cells around the haustorial penetration sites, confining further spread of the pathogen (Flor, 1942; Flor,
1946; Sharma, 1989; Niks et al., 2011).
Partial resistance, or quantitative resistance, is considered to be a quantitative for of resistance, in which
pathogens show a reduced infection level, despite being basic-compatible with the host plant. The plant
is then considered to be a marginal host (Figure 3). The quantitative nature of partial resistance is due to
it being polygenetic, basing its resistance on the effectiveness of many Quantitative Trait Loci (QTL).
Partial resistance functions as an
induced general defence and is best
explained as a partially supressed
PAMP-triggered immunity (PTI). An
example of partial resistance is also
found in the pathosystem between
haustoria forming pathogens, like the
Puccinia rusts, and their host plants.
When infected with the haustoria
forming Puccinia rusts, the host plant
expresses pre-haustorial partial
resistance response with the
formation of papillae around the
stoma, effectively blocking the
haustoria from entering plants cells.
This pre-haustorial form of resistance
is also typically found in plants being
inoculated with non-basic-compatible
haustoria forming pathogens, which is
then called nonhost resistance
(O’Connell & Panstruga, 2006;
Hückelhoven, 2007; Niks & Marcel,
2009; Niks et al., 2011).
3 | P a g e
1.3 Nonhost resistance
1.3.1 Definition of nonhost resistance
Nonhost resistance is defined as the resistance shown by an entire plant species to al genetic variants of
a pathogen. The plant is then called a nonhost and the pathogen a heterologous pathogen (Heath, 1997;
Heath, 2000; Mysore & Ryu, 2004; Nürnberger & Lipka, 2005). As most plant species are resistant to the
vast majority of pathogens, nonhost resistance may be considered to be the rule in nature, with disease
being the exception. The nonhost status of a plant species might be caused by unsuitable plant nutrient
sources for the pathogen or because of the pathogen’s inability to supress the general defence of a plant
species. The general defence of a plant species is both constitutive and induced (PTI) and so is nonhost
resistance as well. The partial resistance and induced nonhost resistance show strong similarity with each
other, as they both depend on the PAMP-triggered immunity. In a resistance response towards haustoria
forming pathogens, both partial resistance and nonhost resistance plants have been found to both
depend on the formation of papillae in a pre-haustorial state, although nonhost resistance is sometimes
backed up by a post-haustoria HR resistance (Ouchi et al., 1974; Nürnberger & Lipka, 2005; Jafary et
al., 2006; Jafary 2008 et al., Niks 2009). Basic-compatible pathogens can supress this immunity using
specialised effectors, while nonhost pathogens cannot (Figure 1 and 2). Nonhost resistance is the most
effective form of basal resistance, conferring resistance to the vast majority of pathogens. The ability of
a plant species to mount a durable general defence against heterologous pathogens is considered to be a
very important and interesting phenomenon, as it gives a durable form of resistance. Unfortunately, little
is still known about the genetics and the mechanisms underlying the nonhost resistance, since by
definition all plants of a nonhost species are completely resistance to the pathogen (Hammond-Kosack &
Parker, 2003; Atienza et al., 2004; Niks & Marcel, 2009).
Studying the genetics of nonhost resistance would require difficult interspecific crosses between host and
nonhost species, followed by developing inbred lines (Jeuken & Lindhout, 2004), although using closely
related species might ease the troubles of interspecific crossing (Cotter & Roberts, 1963; Tosa et al.,
1987; Niks, 1989; Swertz, 1994). A third option has been proposed by Atienza et al., (2004) which
depends on crossing plant species showing a deviation in the host and nonhost status which makes them
called near-nonhost. Some plant species express an incomplete nonhost status to specific heterologous
pathogen, with some accessions showing a low level of symptoms, when being infected with a
heterologous pathogen (Heath M.C., 1985; Niks R.E., 1987). Such a species is then considered to be a
marginal host to these heterologous pathogens and does not require interspecific crosses (Atienza et al.,
2004; Niks et al., 2011). A good example of a near-nonhost pathosystem is barley (Hordeum vulgare L.)
and Puccinia rusts (Puccinia sp.). Barley is a host to barley leaf rust Puccinia hordei and a marginal host
or nonhost to Puccinia rusts which infect closely related plant species (Figure 3).
1.3.2 Barley - Puccinia rust model
Barley (Hordeum vulgare L.) belongs to the Poaceae family, commonly known as grasses, which also
includes the cereal crops maize, rice, wheat, millet and oat (The plant List, 2010). The cereal crop barley
has been cultivated for ten thousand years and is used as fodder and for its grains as food or malt (Badr
et al., 2000). It is a diploid with fourteen chromosomes (2n=14) and by nature, it is a strictly
autogamous self-pollinator. The Puccinia sp. represents a range of fungi which are obligatory biotrophic
pathogens, commonly known as rusts. They infect host plants via uredospores air dispersal, water or
insects after which they parasite on the plants nutrients via haustoria. In ten to fourteen days new
uredospores are formed via the asexual cycle as shown in Figure 4. Symptoms are only shown after
establishment of the Puccinia inside the plant and involve the formation of flecks, which later turn into
pustules containing new uredospores (Sharma, 1989; Niks et al., 2011). The cereal crops (Poaceae
family) and rusts species (Puccinia sp.) form a pathosystem with every crop being a host to a Puccinia
rust, while being nonhost to other Puccinia rust (Hoogkamp et al., 1998).
4 | P a g e
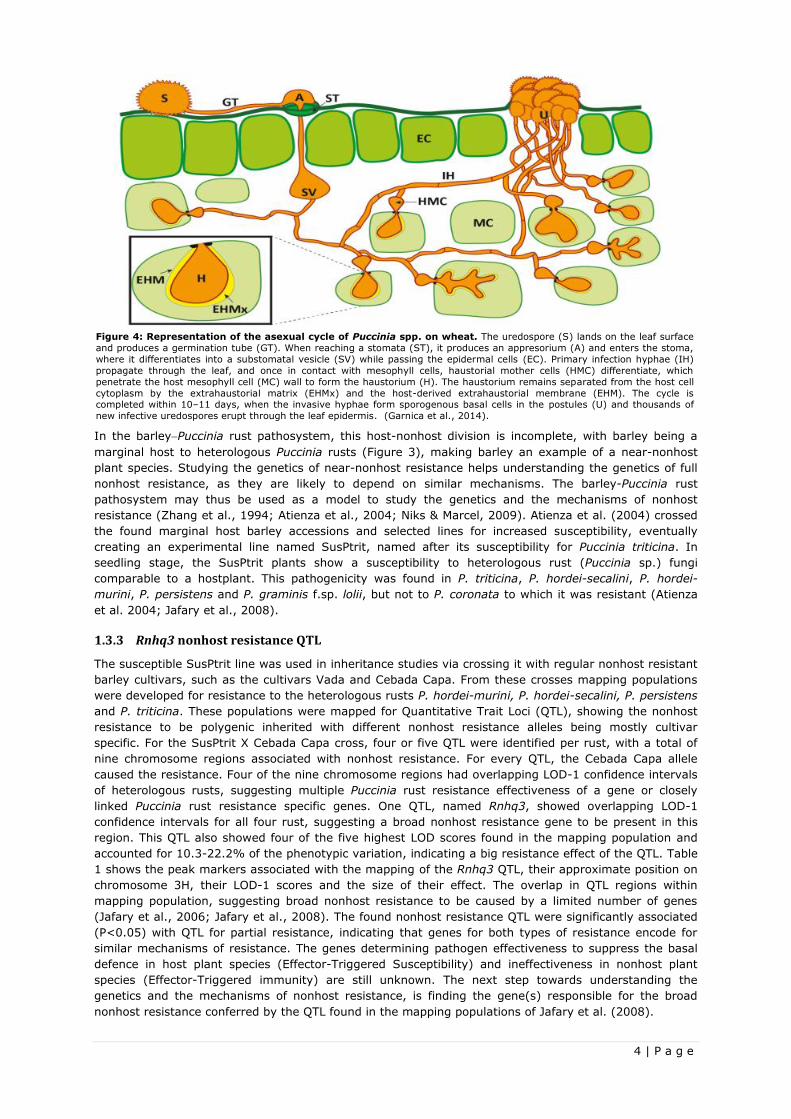
Figure 4: Representation of the asexual cycle of Puccinia spp. on wheat. The uredospore (S) lands on the leaf surface
and produces a germination tube (GT). When reaching a stomata (ST), it produces an appresorium (A) and enters the stoma,
where it differentiates into a substomatal vesicle (SV) while passing the epidermal cells (EC). Primary infection hyphae (IH)
propagate through the leaf, and once in contact with mesophyll cells, haustorial mother cells (HMC) differentiate, which
penetrate the host mesophyll cell (MC) wall to form the haustorium (H). The haustorium remains separated from the host cell
cytoplasm by the extrahaustorial matrix (EHMx) and the host-derived extrahaustorial membrane (EHM). The cycle is completed within 10–11 days, when the invasive hyphae form sporogenous basal cells in the postules (U) and thousands of
new infective uredospores erupt through the leaf epidermis. (Garnica et al., 2014).
In the barleyPuccinia rust pathosystem, this host-nonhost division is incomplete, with barley being a
marginal host to heterologous Puccinia rusts (Figure 3), making barley an example of a near-nonhost
plant species. Studying the genetics of near-nonhost resistance helps understanding the genetics of full
nonhost resistance, as they are likely to depend on similar mechanisms. The barley-Puccinia rust
pathosystem may thus be used as a model to study the genetics and the mechanisms of nonhost
resistance (Zhang et al., 1994; Atienza et al., 2004; Niks & Marcel, 2009). Atienza et al. (2004) crossed
the found marginal host barley accessions and selected lines for increased susceptibility, eventually
creating an experimental line named SusPtrit, named after its susceptibility for Puccinia triticina. In
seedling stage, the SusPtrit plants show a susceptibility to heterologous rust (Puccinia sp.) fungi
comparable to a hostplant. This pathogenicity was found in P. triticina, P. hordei-secalini, P. hordei-
murini, P. persistens and P. graminis f.sp. lolii, but not to P. coronata to which it was resistant (Atienza
et al. 2004; Jafary et al., 2008).
1.3.3 Rnhq3 nonhost resistance QTL
The susceptible SusPtrit line was used in inheritance studies via crossing it with regular nonhost resistant
barley cultivars, such as the cultivars Vada and Cebada Capa. From these crosses mapping populations
were developed for resistance to the heterologous rusts P. hordei-murini, P. hordei-secalini, P. persistens
and P. triticina. These populations were mapped for Quantitative Trait Loci (QTL), showing the nonhost
resistance to be polygenic inherited with different nonhost resistance alleles being mostly cultivar
specific. For the SusPtrit X Cebada Capa cross, four or five QTL were identified per rust, with a total of
nine chromosome regions associated with nonhost resistance. For every QTL, the Cebada Capa allele
caused the resistance. Four of the nine chromosome regions had overlapping LOD-1 confidence intervals
of heterologous rusts, suggesting multiple Puccinia rust resistance effectiveness of a gene or closely
linked Puccinia rust resistance specific genes. One QTL, named Rnhq3, showed overlapping LOD-1
confidence intervals for all four rust, suggesting a broad nonhost resistance gene to be present in this
region. This QTL also showed four of the five highest LOD scores found in the mapping population and
accounted for 10.3-22.2% of the phenotypic variation, indicating a big resistance effect of the QTL. Table
1 shows the peak markers associated with the mapping of the Rnhq3 QTL, their approximate position on
chromosome 3H, their LOD-1 scores and the size of their effect. The overlap in QTL regions within
mapping population, suggesting broad nonhost resistance to be caused by a limited number of genes
(Jafary et al., 2006; Jafary et al., 2008). The found nonhost resistance QTL were significantly associated
(P<0.05) with QTL for partial resistance, indicating that genes for both types of resistance encode for
similar mechanisms of resistance. The genes determining pathogen effectiveness to suppress the basal
defence in host plant species (Effector-Triggered Susceptibility) and ineffectiveness in nonhost plant
species (Effector-Triggered immunity) are still unknown. The next step towards understanding the
genetics and the mechanisms of nonhost resistance, is finding the gene(s) responsible for the broad
nonhost resistance conferred by the QTL found in the mapping populations of Jafary et al. (2008).
5 | P a g e
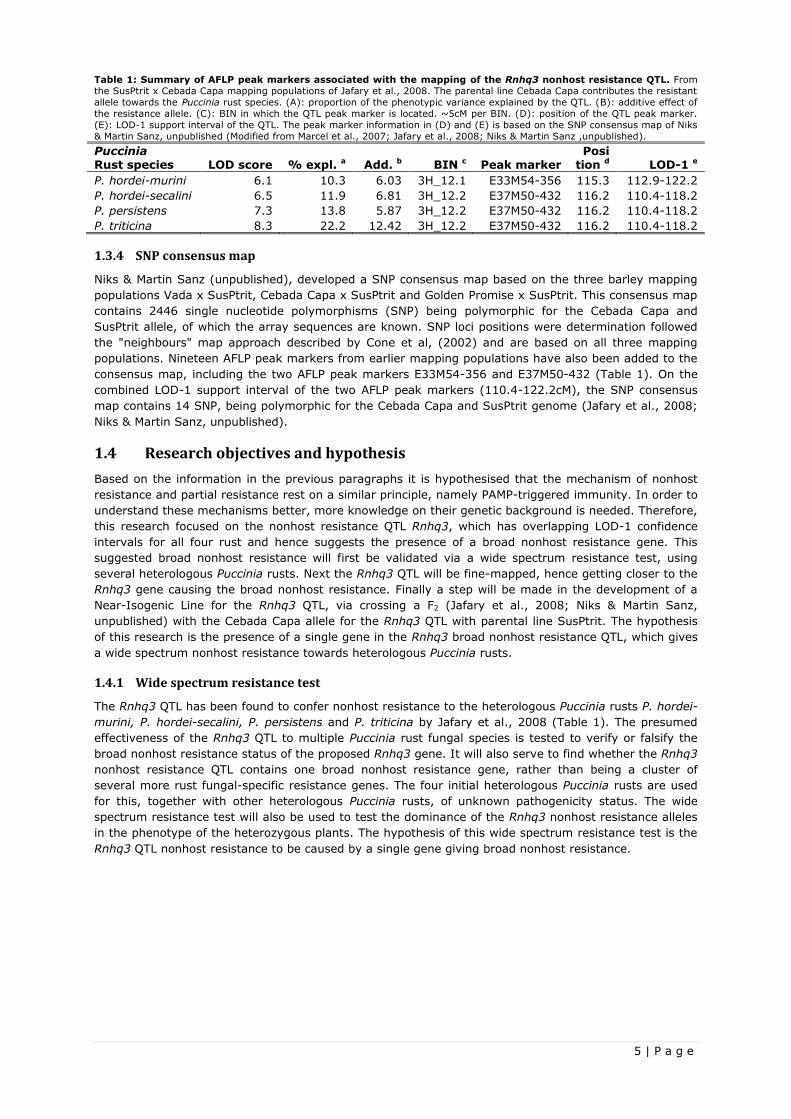
Table 1: Summary of AFLP peak markers associated with the mapping of the Rnhq3 nonhost resistance QTL. From
the SusPtrit x Cebada Capa mapping populations of Jafary et al., 2008. The parental line Cebada Capa contributes the resistant
allele towards the Puccinia rust species. (A): proportion of the phenotypic variance explained by the QTL. (B): additive effect of
the resistance allele. (C): BIN in which the QTL peak marker is located. ~5cM per BIN. (D): position of the QTL peak marker.
(E): LOD-1 support interval of the QTL. The peak marker information in (D) and (E) is based on the SNP consensus map of Niks
& Martin Sanz, unpublished (Modified from Marcel et al., 2007; Jafary et al., 2008; Niks & Martin Sanz ,unpublished).
Puccinia Rust species LOD score % expl. a Add. b BIN c Peak marker
Posi tion d LOD-1 e
P. hordei-murini 6.1 10.3 6.03 3H_12.1 E33M54-356 115.3 112.9-122.2
P. hordei-secalini 6.5 11.9 6.81 3H_12.2 E37M50-432 116.2 110.4-118.2
P. persistens 7.3 13.8 5.87 3H_12.2 E37M50-432 116.2 110.4-118.2
P. triticina 8.3 22.2 12.42 3H_12.2 E37M50-432 116.2 110.4-118.2
1.3.4 SNP consensus map
Niks & Martin Sanz (unpublished), developed a SNP consensus map based on the three barley mapping
populations Vada x SusPtrit, Cebada Capa x SusPtrit and Golden Promise x SusPtrit. This consensus map
contains 2446 single nucleotide polymorphisms (SNP) being polymorphic for the Cebada Capa and
SusPtrit allele, of which the array sequences are known. SNP loci positions were determination followed
the "neighbours" map approach described by Cone et al, (2002) and are based on all three mapping
populations. Nineteen AFLP peak markers from earlier mapping populations have also been added to the
consensus map, including the two AFLP peak markers E33M54-356 and E37M50-432 (Table 1). On the
combined LOD-1 support interval of the two AFLP peak markers (110.4-122.2cM), the SNP consensus
map contains 14 SNP, being polymorphic for the Cebada Capa and SusPtrit genome (Jafary et al., 2008;
Niks & Martin Sanz, unpublished).
1.4 Research objectives and hypothesis
Based on the information in the previous paragraphs it is hypothesised that the mechanism of nonhost
resistance and partial resistance rest on a similar principle, namely PAMP-triggered immunity. In order to
understand these mechanisms better, more knowledge on their genetic background is needed. Therefore,
this research focused on the nonhost resistance QTL Rnhq3, which has overlapping LOD-1 confidence
intervals for all four rust and hence suggests the presence of a broad nonhost resistance gene. This
suggested broad nonhost resistance will first be validated via a wide spectrum resistance test, using
several heterologous Puccinia rusts. Next the Rnhq3 QTL will be fine-mapped, hence getting closer to the
Rnhq3 gene causing the broad nonhost resistance. Finally a step will be made in the development of a
Near-Isogenic Line for the Rnhq3 QTL, via crossing a F2 (Jafary et al., 2008; Niks & Martin Sanz,
unpublished) with the Cebada Capa allele for the Rnhq3 QTL with parental line SusPtrit. The hypothesis
of this research is the presence of a single gene in the Rnhq3 broad nonhost resistance QTL, which gives
a wide spectrum nonhost resistance towards heterologous Puccinia rusts.
1.4.1 Wide spectrum resistance test
The Rnhq3 QTL has been found to confer nonhost resistance to the heterologous Puccinia rusts P. hordei-
murini, P. hordei-secalini, P. persistens and P. triticina by Jafary et al., 2008 (Table 1). The presumed
effectiveness of the Rnhq3 QTL to multiple Puccinia rust fungal species is tested to verify or falsify the
broad nonhost resistance status of the proposed Rnhq3 gene. It will also serve to find whether the Rnhq3
nonhost resistance QTL contains one broad nonhost resistance gene, rather than being a cluster of
several more rust fungal-specific resistance genes. The four initial heterologous Puccinia rusts are used
for this, together with other heterologous Puccinia rusts, of unknown pathogenicity status. The wide
spectrum resistance test will also be used to test the dominance of the Rnhq3 nonhost resistance alleles
in the phenotype of the heterozygous plants. The hypothesis of this wide spectrum resistance test is the
Rnhq3 QTL nonhost resistance to be caused by a single gene giving broad nonhost resistance.
6 | P a g e
1.4.2 Fine-mapping Rnhq3 nonhost resistance QTL
The Rnhq3 QTL is located on chromosome 3H and the resistance allele are donated by the Cebada Capa
cultivar. The combined LOD-1 support interval of the four Rnhq3 QTL peak markers of 11.8cM is still too
broad to find the nonhost resistance gene(s). Further fine-mapping the Rnhq3 QTL is thus needed.
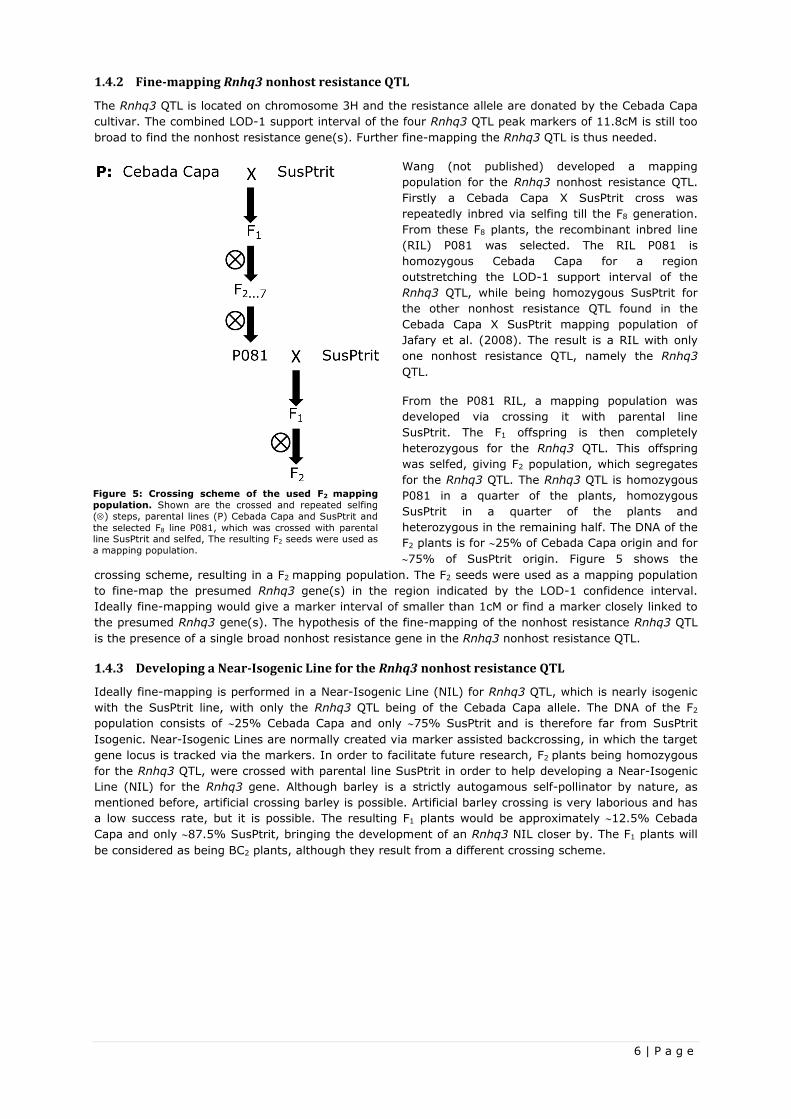
Wang (not published) developed a mapping
population for the Rnhq3 nonhost resistance QTL.
Firstly a Cebada Capa X SusPtrit cross was
repeatedly inbred via selfing till the F8 generation.
From these F8 plants, the recombinant inbred line
(RIL) P081 was selected. The RIL P081 is
homozygous Cebada Capa for a region
outstretching the LOD-1 support interval of the
Rnhq3 QTL, while being homozygous SusPtrit for
the other nonhost resistance QTL found in the
Cebada Capa X SusPtrit mapping population of
Jafary et al. (2008). The result is a RIL with only
one nonhost resistance QTL, namely the Rnhq3
QTL.
From the P081 RIL, a mapping population was
developed via crossing it with parental line
SusPtrit. The F1 offspring is then completely
heterozygous for the Rnhq3 QTL. This offspring
was selfed, giving F2 population, which segregates
for the Rnhq3 QTL. The Rnhq3 QTL is homozygous
P081 in a quarter of the plants, homozygous
SusPtrit in a quarter of the plants and
heterozygous in the remaining half. The DNA of the
F2 plants is for 25% of Cebada Capa origin and for
75% of SusPtrit origin. Figure 5 shows the
crossing scheme, resulting in a F2 mapping population. The F2 seeds were used as a mapping population
to fine-map the presumed Rnhq3 gene(s) in the region indicated by the LOD-1 confidence interval.
Ideally fine-mapping would give a marker interval of smaller than 1cM or find a marker closely linked to
the presumed Rnhq3 gene(s). The hypothesis of the fine-mapping of the nonhost resistance Rnhq3 QTL
is the presence of a single broad nonhost resistance gene in the Rnhq3 nonhost resistance QTL.
1.4.3 Developing a Near-Isogenic Line for the Rnhq3 nonhost resistance QTL
Ideally fine-mapping is performed in a Near-Isogenic Line (NIL) for Rnhq3 QTL, which is nearly isogenic
with the SusPtrit line, with only the Rnhq3 QTL being of the Cebada Capa allele. The DNA of the F2
population consists of 25% Cebada Capa and only 75% SusPtrit and is therefore far from SusPtrit
Isogenic. Near-Isogenic Lines are normally created via marker assisted backcrossing, in which the target
gene locus is tracked via the markers. In order to facilitate future research, F2 plants being homozygous
for the Rnhq3 QTL, were crossed with parental line SusPtrit in order to help developing a Near-Isogenic
Line (NIL) for the Rnhq3 gene. Although barley is a strictly autogamous self-pollinator by nature, as
mentioned before, artificial crossing barley is possible. Artificial barley crossing is very laborious and has
a low success rate, but it is possible. The resulting F1 plants would be approximately 12.5% Cebada
Capa and only 87.5% SusPtrit, bringing the development of an Rnhq3 NIL closer by. The F1 plants will
be considered as being BC2 plants, although they result from a different crossing scheme.
Figure 5: Crossing scheme of the used F2 mapping
population. Shown are the crossed and repeated selfing
() steps, parental lines (P) Cebada Capa and SusPtrit and
the selected F8 line P081, which was crossed with parental line SusPtrit and selfed, The resulting F2 seeds were used as
a mapping population.
7 | P a g e
1.5 Research questions
The hypothesis of this research is the presence of a single gene in the Rnhq3 broad nonhost resistance
QTL, which gives a wide spectrum nonhost resistance towards heterologous Puccinia rusts. For the
verification of this research questions, three research objectives are set. Per research objective, one or
multiple research questions are to be answered.
The objectives of this research are:
1) Confirmation of the broad nonhost resistance of a single Rnhq3 gene.
2) Fine-mapping the Rnhq3 nonhost resistance QTL to a marker interval smaller than 1cM.
3) Further development a Near-Isogenic Line for the Rnhq3 nonhost resistance QTL
The following questions are to be answered in the end of this research:
Research questions following the confirmation of a single Rnhq3 gene.
Q1: Does the Rnhq3 nonhost resistance QTL confer resistance towards all tested heterologous
Puccinia rusts?
Q2: Does the Rnhq3 nonhost resistance QTL come from a single gene or a cluster of several more
rust fungal-specific resistance genes?
Q3: What is the dominance of the Rnhq3 nonhost resistance gene?
Research questions following the fine-mapping of the Rnhq3 nonhost resistance QTL:
Q4: Has the proposed Rnhq3 nonhost resistance gene been fine-mapped to a marker interval smaller
then 1cM?
Q5: Has a marker been found which is closely linked with the proposed Rnhq3 nonhost resistance
gene?
Research questions following the developing a Near-Isogenic Line for the Rnhq3 nonhost
resistance QTL:
Q6: Is the development of a Near-Isogenic Line for the Rnhq3 nonhost resistance QTL one step
closer?

8 | P a g e
Chapter 2: Materials and methods
2.1 Wide spectrum resistance test
2.1.1 Heterologous Puccinia rust fungi
In the wide spectrum resistance test, the broad range effectiveness of the Rnhq3 nonhost resistance QTL
towards different heterologous Puccinia rust was tested. Table 2 shows the eight used heterologous
Puccinia rust.
Table 2: Overview of the Heterologous Puccinia rust fungi (Puccinia sp.) used in the wide spectrum resistance
test. The scientific names of the rust are shown, together with their common name. The host plants of the rust, with which
they form a pathosystem, are also added.
Heterologous Puccinia rust Common name Host plant
P. hordei-secalini Meadow barley rust Hordeum secalinum
P. hordei-murini Wall barley leaf rust Hordeum murinum
P. persistens Couch grass leaf rust Agropyron repens
P. triticina Swiss isolate Wheat leaf rust Triticum genus
P. graminis f.sp. lolii Ryegrass stem rust Lolium genus
P. graminis f.sp. avenae Oat stem rust Avena sativa
P. hordei-bulbosi – Israelian isolate Bulbous barley rust Hordeum bulbosum
P. hordei-bulbosi – Iranian isolate Bulbous barley rust Hordeum bulbosum
The rusts isolates have been collected as uredospores from nature after which they were stored at -80°C
in the freezer or long stored at -196°C in liquid nitrogen, depending on the rust. After defrosting the
uredospores, they were multiplied on susceptible host plants, before being used in the resistance testing.
From the infected hostplants, uredospores were collected from the pustules and kept for a maximum of 3
days prior to being used in the wide spectrum resistance tests.
2.1.2 Phenotyping
Per rust, 35±5 F2 seeds from the mapping population were tested for their broad range effectiveness of
the Rnhq3 QTL, together with their parental lines P081 and SusPtrit (4 plants each) and with cultivar
Vada (2 plants). The SusPtrit plants served as a susceptible reference for the infection frequency. P081
showed the nonhost resistance effect of the Rnhq3 gene and Vada was used to show full resistance. Vada
was chosen over Cebada Capa, as it is susceptible to barley leaf rust (Puccinia hordei) and Cebada Capa
is not, making Vada a detection agent to spot contamination with barley leaf rust. The plants were sown
in plant boxes of 37 by 39 cm in two rows of 20±5 seeds (1.5cm apart) along the longitudinal edge of
the box (Figure 6).
The seedlings were grown for 10±1 days in a Unifarm greenhouse compartment. Greenhouse conditions
were always set at the following conditions: natural humidity levels with 12 hours daylight at 20°C and
12 hours night-time a 14°C. After 10±1 days, the seedlings were inoculation with freshly collected
uredospores of the Puccinia rust fungal isolates. At this stage, the primary leaf ass fully grown and the
second leaf has emerged. From the ten-day-old seedlings, the second leaves were cut and the primary
leaves were pinned down towards the middle of the box, with their adaxial side upwards (Figure 6).
From all heterologous rust isolates except the P.
graminis f.sp. lolii 2.0mg of freshly collected
heterologous Puccinia rust uredospores was
diluted in 20mg lycopodium powder and used
per box. This gave a deposition of about 120
uredospores per cm2. From P. graminis f.sp. lolii
8.0mg (480 uredospores per cm2) of freshly
collected heterologous rust isolates uredospores
were used, because of its known low infection
rate on SusPtrit (Atienza et al., 2004).
Inoculations were performed using a settling
tower as described by (Niks et al. 2011). In this
settling tower, a plant box, together with an
Figure 6: Layout of the plant boxes used for
phenotyping. Boxes are 37x39cm. Sown seeds in every
box: 35±5 F2 seeds, 4 P081, 4 SusPtrit and 2 Vada. Left:
3-day old seedlings, just emerging Centre: 10-day old
seedlings Right: 10-days old seedlings, ready for
inoculation. Their second leaf has been cut and the primary
leaf is pinned down, adaxial side upwards.
9 | P a g e
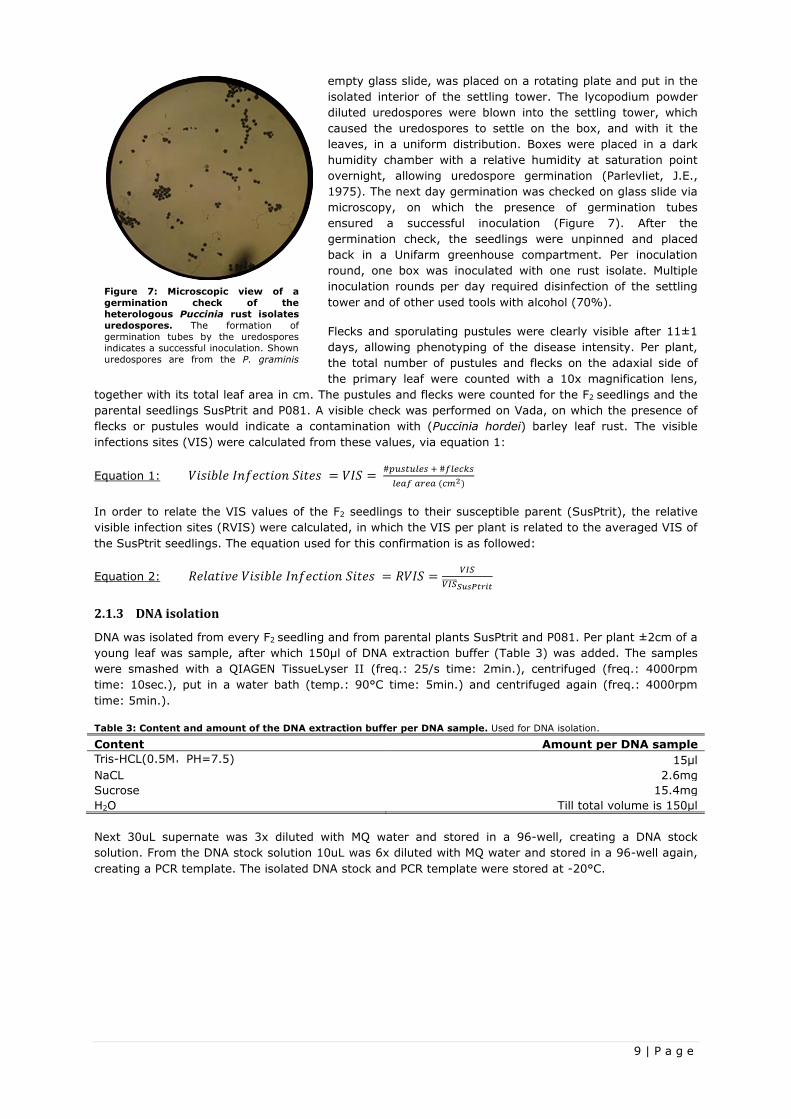
Figure 7: Microscopic view of a
germination check of the
heterologous Puccinia rust isolates
uredospores. The formation of
germination tubes by the uredospores
indicates a successful inoculation. Shown
uredospores are from the P. graminis f.sp. lolii rust.
empty glass slide, was placed on a rotating plate and put in the
isolated interior of the settling tower. The lycopodium powder
diluted uredospores were blown into the settling tower, which
caused the uredospores to settle on the box, and with it the
leaves, in a uniform distribution. Boxes were placed in a dark
humidity chamber with a relative humidity at saturation point
overnight, allowing uredospore germination (Parlevliet, J.E.,
1975). The next day germination was checked on glass slide via
microscopy, on which the presence of germination tubes
ensured a successful inoculation (Figure 7). After the
germination check, the seedlings were unpinned and placed
back in a Unifarm greenhouse compartment. Per inoculation
round, one box was inoculated with one rust isolate. Multiple
inoculation rounds per day required disinfection of the settling
tower and of other used tools with alcohol (70%).
Flecks and sporulating pustules were clearly visible after 11±1
days, allowing phenotyping of the disease intensity. Per plant,
the total number of pustules and flecks on the adaxial side of
the primary leaf were counted with a 10x magnification lens,
together with its total leaf area in cm. The pustules and flecks were counted for the F2 seedlings and the
parental seedlings SusPtrit and P081. A visible check was performed on Vada, on which the presence of
flecks or pustules would indicate a contamination with (Puccinia hordei) barley leaf rust. The visible
infections sites (VIS) were calculated from these values, via equation 1:
Equation 1: 𝑉𝑖𝑠𝑖𝑏𝑙𝑒 𝐼𝑛𝑓𝑒𝑐𝑡𝑖𝑜𝑛 𝑆𝑖𝑡𝑒𝑠 = 𝑉𝐼𝑆 = #𝑝𝑢𝑠𝑡𝑢𝑙𝑒𝑠 + #𝑓𝑙𝑒𝑐𝑘𝑠
𝑙𝑒𝑎𝑓 𝑎𝑟𝑒𝑎 (𝑐𝑚2)
In order to relate the VIS values of the F2 seedlings to their susceptible parent (SusPtrit), the relative
visible infection sites (RVIS) were calculated, in which the VIS per plant is related to the averaged VIS of
the SusPtrit seedlings. The equation used for this confirmation is as followed:
Equation 2: 𝑅𝑒𝑙𝑎𝑡𝑖𝑣𝑒 𝑉𝑖𝑠𝑖𝑏𝑙𝑒 𝐼𝑛𝑓𝑒𝑐𝑡𝑖𝑜𝑛 𝑆𝑖𝑡𝑒𝑠 = 𝑅𝑉𝐼𝑆 =𝑉𝐼𝑆
𝑉𝐼𝑆̅̅ ̅̅ ̅𝑆𝑢𝑠𝑃𝑡𝑟𝑖𝑡
2.1.3 DNA isolation
DNA was isolated from every F2 seedling and from parental plants SusPtrit and P081. Per plant ±2cm of a
young leaf was sample, after which 150μl of DNA extraction buffer (Table 3) was added. The samples
were smashed with a QIAGEN TissueLyser II (freq.: 25/s time: 2min.), centrifuged (freq.: 4000rpm
time: 10sec.), put in a water bath (temp.: 90°C time: 5min.) and centrifuged again (freq.: 4000rpm
time: 5min.).
Table 3: Content and amount of the DNA extraction buffer per DNA sample. Used for DNA isolation.
Content Amount per DNA sample
Tris-HCL(0.5M,PH=7.5) 15μl
NaCL 2.6mg
Sucrose 15.4mg
H2O Till total volume is 150μl
Next 30uL supernate was 3x diluted with MQ water and stored in a 96-well, creating a DNA stock
solution. From the DNA stock solution 10uL was 6x diluted with MQ water and stored in a 96-well again,
creating a PCR template. The isolated DNA stock and PCR template were stored at -20°C.
10 | P a g e
2.1.4 Marker development and primer design
For marker development, the SNP consensus map of Niks & Martin Sanz (unpublished) was used. The
SNP markers were found and developed based on their position on the barley genome and their
corresponding SNP array sequence. For this study, markers were needed which covered the whole Rnhq3
QTL in order to be sure of genotyping the Rnhq3 gene. The AFLP peak markers for the Rnhq3 gene had a
LOD-1 support interval from 110.4cM to 122.2cM. In order to make sure of the Rnhq3 gene being
covered, flanking markers were chosen to outflank the LOD-1 support interval with 3.5cM, hence
creating a total marker interval of 19cM. The SNP flanking markers were named SCRI_RS_236528
(105.8cM) and SCRI_RS_180027 (124.8vM). One SNP marker (BOPA2_12_31238) was also developed in
the middle in-between the flanking markers, to spot F2 plants with a double crossover in-between the
flanking markers. This SNP marker was named BOPA2_12_31238 (114.1cM). During the fine mapping
more markers were developed. The name and location of the SNP flanking markers, the middle SNP
marker and the AFLP peak markers for the Rnhq3 QTL are shown in Table 4.
Table 4: Overview of the developed SNP markers and the AFLP peak markers for the Rnhq3 QTL. The SNP markers
were developed using the SNP consensus map of Niks & Martin Sanz (unpublished) and were used for genotype determination.
The AFLP peak markers (bold) came from Jafary et al. (2008) and where not used for genotype determination. The location of
the markers in cM is also based on the SNP consensus map of Niks & Martin Sanz (unpublished).
Marker Marker type Consensus Map (cM)
SCRI_RS_236528 SNP 105.8
BOPA2_12_31238 SNP 114.1
E33M54-356 AFLP 115.3
E37M50-432 AFLP 116.2
SCRI_RS_180027 SNP 124.8
The development of the SNP markers and primers always followed these four steps:
1. Selection of the SNP marker, based on its location on the SNP consensus map locus.
Polymorphism between the Cebada Capa and SusPtrit genome was a requirement.
2. The SNP array sequence of the selected SNP marker, containing the SNP, was checked for
uniqueness on the genome. This was checked via a BLASTn of the array sequence in the databases
Morex, Barke and Bowman at the IPK Barley BLAST server of the International Barley Sequencing
Consortium (Deng et al., 2007). When all three databases gave only one clear hit at the 3H
chromosome, then the array sequence was unique for that locus and no homologous sequences are
present in barley.
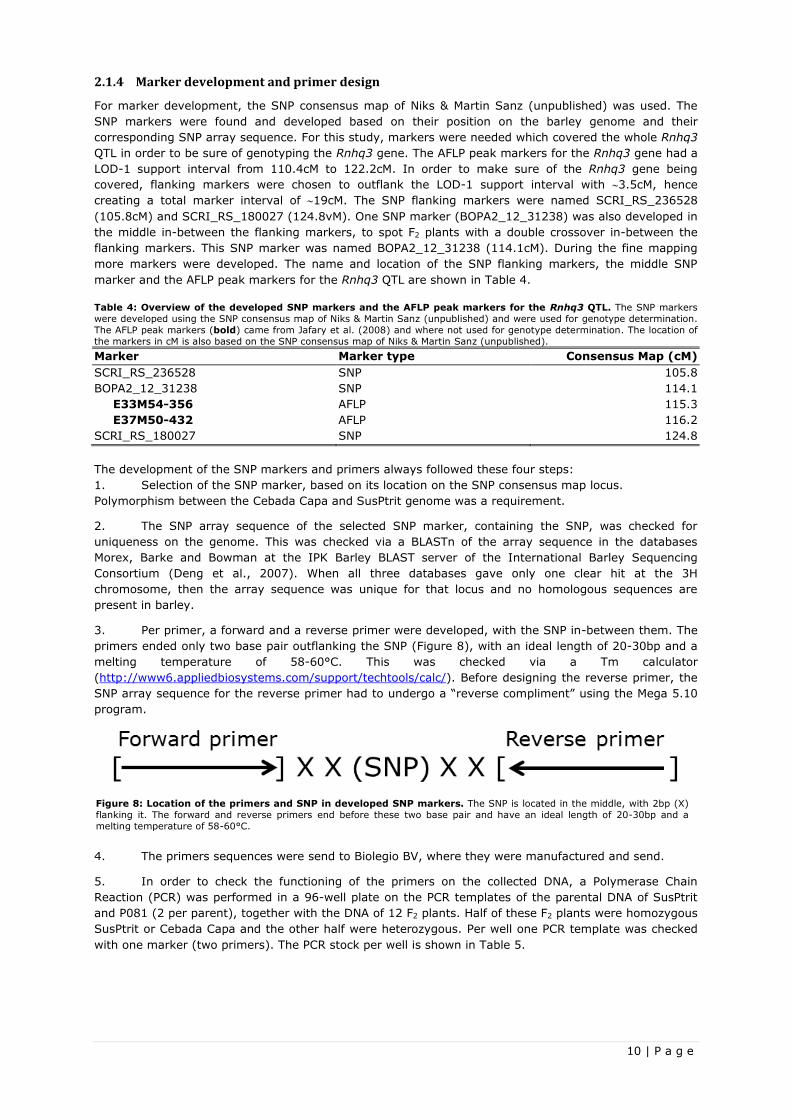
3. Per primer, a forward and a reverse primer were developed, with the SNP in-between them. The
primers ended only two base pair outflanking the SNP (Figure 8), with an ideal length of 20-30bp and a
melting temperature of 58-60°C. This was checked via a Tm calculator
(http://www6.appliedbiosystems.com/support/techtools/calc/). Before designing the reverse primer, the
SNP array sequence for the reverse primer had to undergo a “reverse compliment” using the Mega 5.10
program.
4. The primers sequences were send to Biolegio BV, where they were manufactured and send.
5. In order to check the functioning of the primers on the collected DNA, a Polymerase Chain
Reaction (PCR) was performed in a 96-well plate on the PCR templates of the parental DNA of SusPtrit
and P081 (2 per parent), together with the DNA of 12 F2 plants. Half of these F2 plants were homozygous
SusPtrit or Cebada Capa and the other half were heterozygous. Per well one PCR template was checked
with one marker (two primers). The PCR stock per well is shown in Table 5.
Figure 8: Location of the primers and SNP in developed SNP markers. The SNP is located in the middle, with 2bp (X)
flanking it. The forward and reverse primers end before these two base pair and have an ideal length of 20-30bp and a
melting temperature of 58-60°C.
11 | P a g e
Table 5: Content and amount of PCR stock per well. Used for development of DNA amplicons which enable genotyping
SNP markers with a lightscanner®.
Content Amount per well (in μl)
PCR Forward primer (10Mm) 0.25
PCR Reverse primer (10Mm) 0.25
5x Phire Buffer 2
Phire taq 0.06
dNTP, 5mM 1
LC green 1
MQ water 4.44
PCR template 1
Mineral oil 10
Total volume 20
After adding the PCR stock to every well, the 96-well plate is sealed and vortexed and centrifuged for a
short time. Next the 96-well plate was put in the PCR machine in order to produces DNA amplicons, with
the settings shown in Table 6.
Table 6: PCR settings. Used for development of DNA amplicons which enable genotyping SNP markers with a lightscanner®.
PCR step Temperature Time (minutes) Repeats
1 Climb to 98°C 2:00
2 98°C 0:10 40x
3 60°C 0:15 40x
4 72°C 0:20 40x
5
Back to step 2 (40x)
6 72°C 1:00
7 94°C 0:40
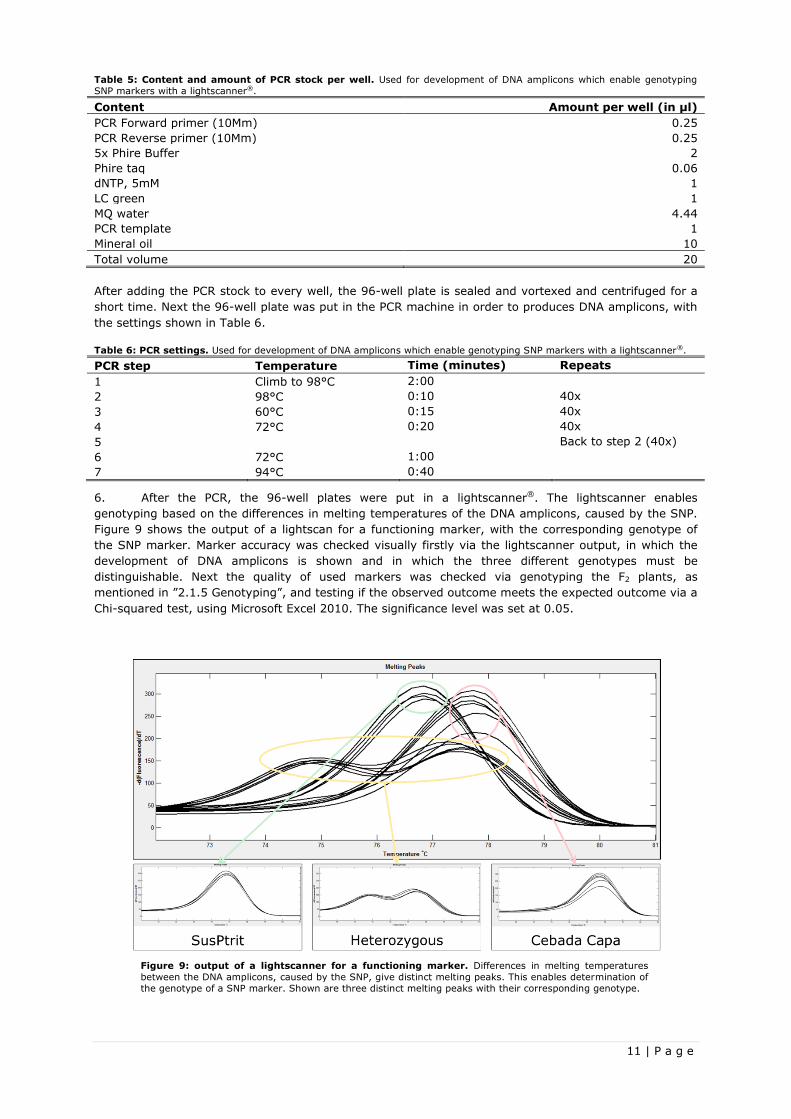
6. After the PCR, the 96-well plates were put in a lightscanner®. The lightscanner enables
genotyping based on the differences in melting temperatures of the DNA amplicons, caused by the SNP.
Figure 9 shows the output of a lightscan for a functioning marker, with the corresponding genotype of
the SNP marker. Marker accuracy was checked visually firstly via the lightscanner output, in which the
development of DNA amplicons is shown and in which the three different genotypes must be
distinguishable. Next the quality of used markers was checked via genotyping the F2 plants, as
mentioned in ”2.1.5 Genotyping”, and testing if the observed outcome meets the expected outcome via a
Chi-squared test, using Microsoft Excel 2010. The significance level was set at 0.05.
Figure 9: output of a lightscanner for a functioning marker. Differences in melting temperatures
between the DNA amplicons, caused by the SNP, give distinct melting peaks. This enables determination of
the genotype of a SNP marker. Shown are three distinct melting peaks with their corresponding genotype.
12 | P a g e
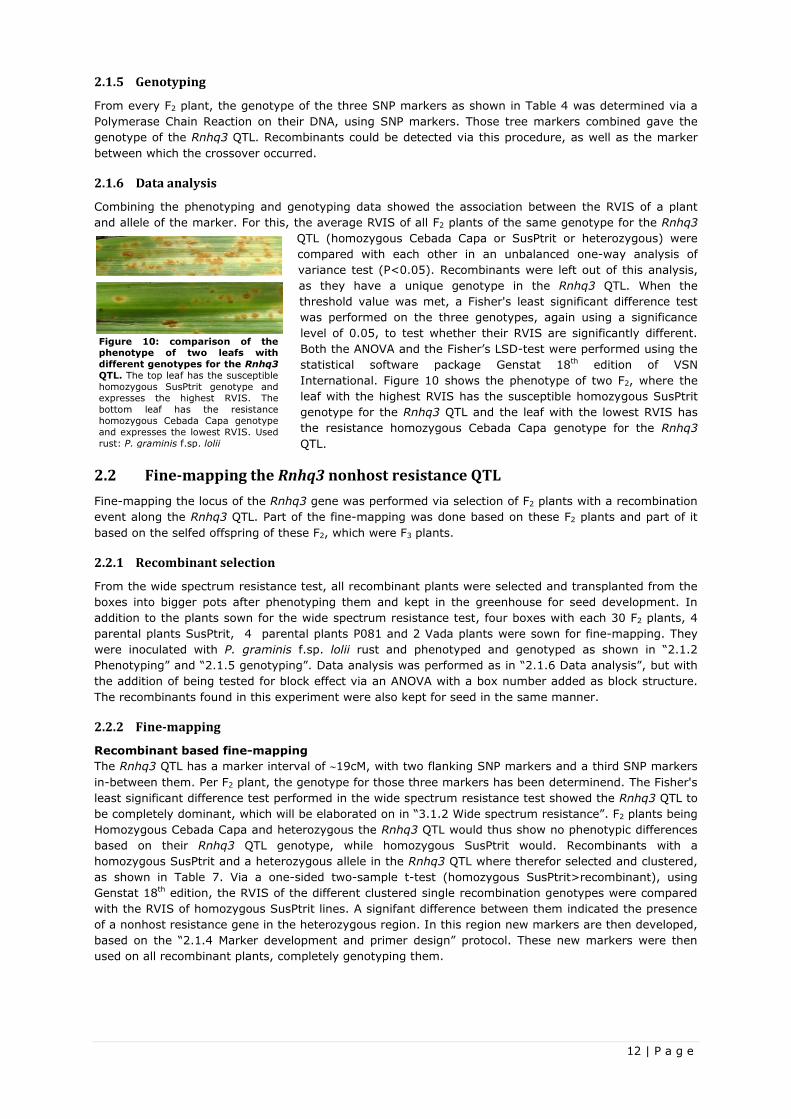
Figure 10: comparison of the phenotype of two leafs with
different genotypes for the Rnhq3
QTL. The top leaf has the susceptible
homozygous SusPtrit genotype and
expresses the highest RVIS. The
bottom leaf has the resistance
homozygous Cebada Capa genotype
and expresses the lowest RVIS. Used
rust: P. graminis f.sp. lolii
2.1.5 Genotyping
From every F2 plant, the genotype of the three SNP markers as shown in Table 4 was determined via a
Polymerase Chain Reaction on their DNA, using SNP markers. Those tree markers combined gave the
genotype of the Rnhq3 QTL. Recombinants could be detected via this procedure, as well as the marker
between which the crossover occurred.
2.1.6 Data analysis
Combining the phenotyping and genotyping data showed the association between the RVIS of a plant
and allele of the marker. For this, the average RVIS of all F2 plants of the same genotype for the Rnhq3
QTL (homozygous Cebada Capa or SusPtrit or heterozygous) were
compared with each other in an unbalanced one-way analysis of
variance test (P<0.05). Recombinants were left out of this analysis,
as they have a unique genotype in the Rnhq3 QTL. When the
threshold value was met, a Fisher's least significant difference test
was performed on the three genotypes, again using a significance
level of 0.05, to test whether their RVIS are significantly different.
Both the ANOVA and the Fisher’s LSD-test were performed using the
statistical software package Genstat 18th edition of VSN
International. Figure 10 shows the phenotype of two F2, where the
leaf with the highest RVIS has the susceptible homozygous SusPtrit
genotype for the Rnhq3 QTL and the leaf with the lowest RVIS has
the resistance homozygous Cebada Capa genotype for the Rnhq3
QTL.
2.2 Fine-mapping the Rnhq3 nonhost resistance QTL
Fine-mapping the locus of the Rnhq3 gene was performed via selection of F2 plants with a recombination
event along the Rnhq3 QTL. Part of the fine-mapping was done based on these F2 plants and part of it
based on the selfed offspring of these F2, which were F3 plants.
2.2.1 Recombinant selection
From the wide spectrum resistance test, all recombinant plants were selected and transplanted from the
boxes into bigger pots after phenotyping them and kept in the greenhouse for seed development. In
addition to the plants sown for the wide spectrum resistance test, four boxes with each 30 F2 plants, 4
parental plants SusPtrit, 4 parental plants P081 and 2 Vada plants were sown for fine-mapping. They
were inoculated with P. graminis f.sp. lolii rust and phenotyped and genotyped as shown in “2.1.2
Phenotyping” and “2.1.5 genotyping”. Data analysis was performed as in “2.1.6 Data analysis”, but with
the addition of being tested for block effect via an ANOVA with a box number added as block structure.
The recombinants found in this experiment were also kept for seed in the same manner.
2.2.2 Fine-mapping
Recombinant based fine-mapping
The Rnhq3 QTL has a marker interval of 19cM, with two flanking SNP markers and a third SNP markers
in-between them. Per F2 plant, the genotype for those three markers has been determinend. The Fisher's
least significant difference test performed in the wide spectrum resistance test showed the Rnhq3 QTL to
be completely dominant, which will be elaborated on in “3.1.2 Wide spectrum resistance”. F2 plants being
Homozygous Cebada Capa and heterozygous the Rnhq3 QTL would thus show no phenotypic differences
based on their Rnhq3 QTL genotype, while homozygous SusPtrit would. Recombinants with a
homozygous SusPtrit and a heterozygous allele in the Rnhq3 QTL where therefor selected and clustered,
as shown in Table 7. Via a one-sided two-sample t-test (homozygous SusPtrit>recombinant), using
Genstat 18th edition, the RVIS of the different clustered single recombination genotypes were compared
with the RVIS of homozygous SusPtrit lines. A signifant difference between them indicated the presence
of a nonhost resistance gene in the heterozygous region. In this region new markers are then developed,
based on the “2.1.4 Marker development and primer design” protocol. These new markers were then
used on all recombinant plants, completely genotyping them.
13 | P a g e
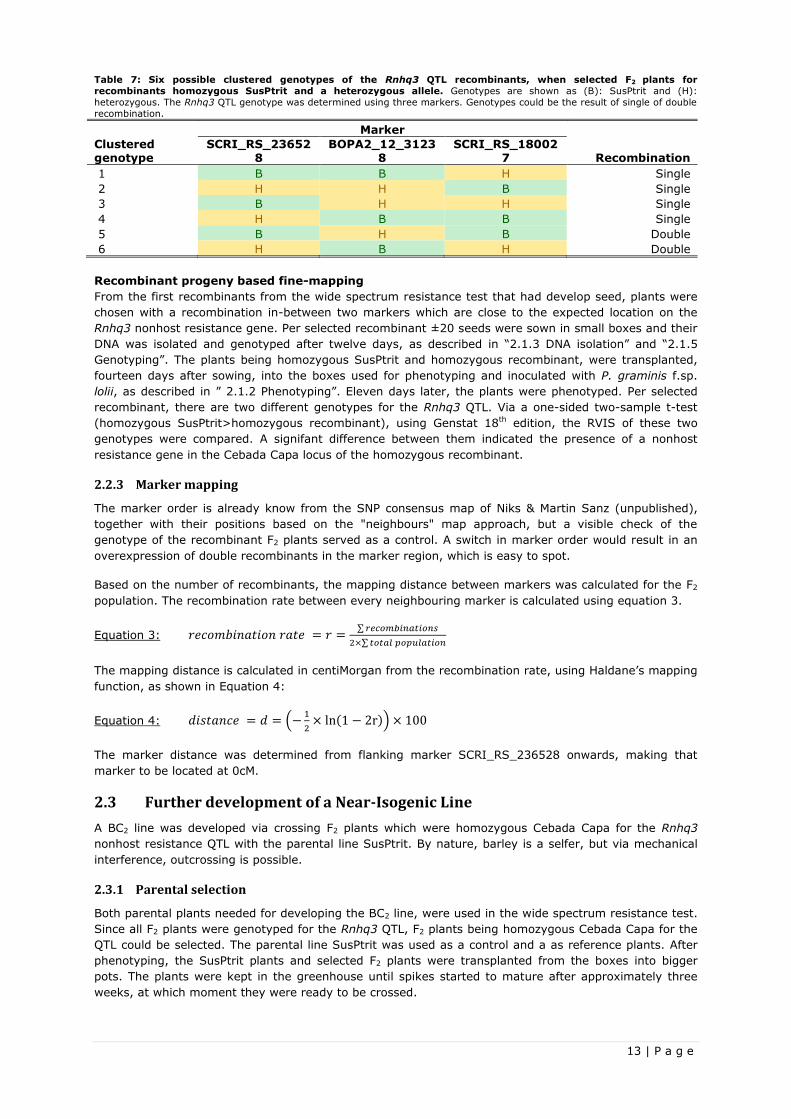
Table 7: Six possible clustered genotypes of the Rnhq3 QTL recombinants, when selected F2 plants for
recombinants homozygous SusPtrit and a heterozygous allele. Genotypes are shown as (B): SusPtrit and (H):
heterozygous. The Rnhq3 QTL genotype was determined using three markers. Genotypes could be the result of single of double
recombination.
Marker
Clustered genotype
SCRI_RS_236528
BOPA2_12_31238
SCRI_RS_180027 Recombination
1 B B H Single
2 H H B Single
3 B H H Single
4 H B B Single
5 B H B Double
6 H B H Double
Recombinant progeny based fine-mapping
From the first recombinants from the wide spectrum resistance test that had develop seed, plants were
chosen with a recombination in-between two markers which are close to the expected location on the
Rnhq3 nonhost resistance gene. Per selected recombinant ±20 seeds were sown in small boxes and their
DNA was isolated and genotyped after twelve days, as described in “2.1.3 DNA isolation” and “2.1.5
Genotyping”. The plants being homozygous SusPtrit and homozygous recombinant, were transplanted,
fourteen days after sowing, into the boxes used for phenotyping and inoculated with P. graminis f.sp.
lolii, as described in ” 2.1.2 Phenotyping”. Eleven days later, the plants were phenotyped. Per selected
recombinant, there are two different genotypes for the Rnhq3 QTL. Via a one-sided two-sample t-test
(homozygous SusPtrit>homozygous recombinant), using Genstat 18th edition, the RVIS of these two
genotypes were compared. A signifant difference between them indicated the presence of a nonhost
resistance gene in the Cebada Capa locus of the homozygous recombinant.
2.2.3 Marker mapping
The marker order is already know from the SNP consensus map of Niks & Martin Sanz (unpublished),
together with their positions based on the "neighbours" map approach, but a visible check of the
genotype of the recombinant F2 plants served as a control. A switch in marker order would result in an
overexpression of double recombinants in the marker region, which is easy to spot.
Based on the number of recombinants, the mapping distance between markers was calculated for the F2
population. The recombination rate between every neighbouring marker is calculated using equation 3.
Equation 3: 𝑟𝑒𝑐𝑜𝑚𝑏𝑖𝑛𝑎𝑡𝑖𝑜𝑛 𝑟𝑎𝑡𝑒 = 𝑟 =∑ 𝑟𝑒𝑐𝑜𝑚𝑏𝑖𝑛𝑎𝑡𝑖𝑜𝑛𝑠
2×∑ 𝑡𝑜𝑡𝑎𝑙 𝑝𝑜𝑝𝑢𝑙𝑎𝑡𝑖𝑜𝑛
The mapping distance is calculated in centiMorgan from the recombination rate, using Haldane’s mapping
function, as shown in Equation 4:
Equation 4: 𝑑𝑖𝑠𝑡𝑎𝑛𝑐𝑒 = 𝑑 = (−1
2× ln(1 − 2r)) × 100
The marker distance was determined from flanking marker SCRI_RS_236528 onwards, making that
marker to be located at 0cM.
2.3 Further development of a Near-Isogenic Line
A BC2 line was developed via crossing F2 plants which were homozygous Cebada Capa for the Rnhq3
nonhost resistance QTL with the parental line SusPtrit. By nature, barley is a selfer, but via mechanical
interference, outcrossing is possible.
2.3.1 Parental selection
Both parental plants needed for developing the BC2 line, were used in the wide spectrum resistance test.
Since all F2 plants were genotyped for the Rnhq3 QTL, F2 plants being homozygous Cebada Capa for the
QTL could be selected. The parental line SusPtrit was used as a control and a as reference plants. After
phenotyping, the SusPtrit plants and selected F2 plants were transplanted from the boxes into bigger
pots. The plants were kept in the greenhouse until spikes started to mature after approximately three
weeks, at which moment they were ready to be crossed.
14 | P a g e
2.3.2 Crossing
Per cross, a male and a female parent were chosen, in which F2 plant served as a female parent and
SusPtrit as the male. Female plants were emasculated before pollen was developed, via clipping
individual spikelets just above the anthers and removing their three anthers. Emasculated spikes were
covered in a glassine bag, preventing air pollination. One week later, the female plants were ready for
pollination. Male plants where ready for pollinating, when the anthers in their spikes where yellowed from
the pollen. The male spike was clipped and its spikelets ware clipped just above the ripe anthers. Fifteen
minutes after clipping the spikelet’s anthers move upwards, risen above the clipped spikelets. The male
spike was then ready for pollinating the emasculated female spikes. Male spikes were flipped above the
female spikes, causing pollen to flutter done into the female spikelets and pollinating them. After this,
the pollinated spikes were covered with a glassine bag again.
2.3.3 Seed development and sowing
Ten weeks after pollinating the spikes, seeds were harvested. The seeds were dried in a stove for one
week at 37°C, in order to break dormancy. After this, seeds were sown in pots and kept in the
greenhouse again. Seedlings were genotyped after one week, as described in “2.1.4 Marker development
and primer design” and “2.1.5 Genotyping”. The used markers were SCRI_RS_236528,
BOPA2_12_31238 and SCRI_RS_180027, which were also used in the Wide spectrum resistance test.
Seedlings being fully heterozygous for the Rnhq3 QTL were the result of a successful cross and were kept
for seed development.
15 | P a g e
Chapter 3: Results
3.1 Wide spectrum resistance test
3.1.1 Inoculation success
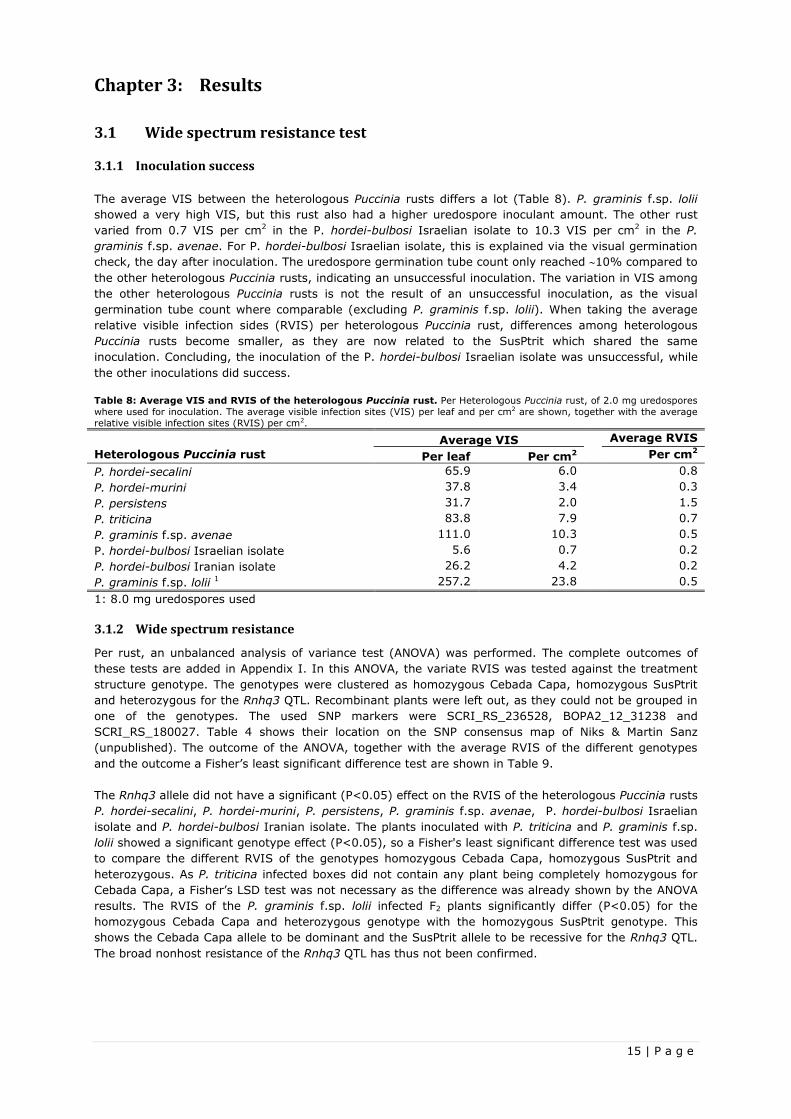
The average VIS between the heterologous Puccinia rusts differs a lot (Table 8). P. graminis f.sp. lolii
showed a very high VIS, but this rust also had a higher uredospore inoculant amount. The other rust
varied from 0.7 VIS per cm2 in the P. hordei-bulbosi Israelian isolate to 10.3 VIS per cm2 in the P.
graminis f.sp. avenae. For P. hordei-bulbosi Israelian isolate, this is explained via the visual germination
check, the day after inoculation. The uredospore germination tube count only reached 10% compared to
the other heterologous Puccinia rusts, indicating an unsuccessful inoculation. The variation in VIS among
the other heterologous Puccinia rusts is not the result of an unsuccessful inoculation, as the visual
germination tube count where comparable (excluding P. graminis f.sp. lolii). When taking the average
relative visible infection sides (RVIS) per heterologous Puccinia rust, differences among heterologous
Puccinia rusts become smaller, as they are now related to the SusPtrit which shared the same
inoculation. Concluding, the inoculation of the P. hordei-bulbosi Israelian isolate was unsuccessful, while
the other inoculations did success.
Table 8: Average VIS and RVIS of the heterologous Puccinia rust. Per Heterologous Puccinia rust, of 2.0 mg uredospores
where used for inoculation. The average visible infection sites (VIS) per leaf and per cm2 are shown, together with the average
relative visible infection sites (RVIS) per cm2.
Heterologous Puccinia rust
Average VIS Average RVIS
Per leaf Per cm2 Per cm2
P. hordei-secalini 65.9 6.0 0.8
P. hordei-murini 37.8 3.4 0.3
P. persistens 31.7 2.0 1.5
P. triticina 83.8 7.9 0.7
P. graminis f.sp. avenae 111.0 10.3 0.5
P. hordei-bulbosi Israelian isolate 5.6 0.7 0.2
P. hordei-bulbosi Iranian isolate 26.2 4.2 0.2
P. graminis f.sp. lolii 1 257.2 23.8 0.5
1: 8.0 mg uredospores used
3.1.2 Wide spectrum resistance
Per rust, an unbalanced analysis of variance test (ANOVA) was performed. The complete outcomes of
these tests are added in Appendix I. In this ANOVA, the variate RVIS was tested against the treatment
structure genotype. The genotypes were clustered as homozygous Cebada Capa, homozygous SusPtrit
and heterozygous for the Rnhq3 QTL. Recombinant plants were left out, as they could not be grouped in
one of the genotypes. The used SNP markers were SCRI_RS_236528, BOPA2_12_31238 and
SCRI_RS_180027. Table 4 shows their location on the SNP consensus map of Niks & Martin Sanz
(unpublished). The outcome of the ANOVA, together with the average RVIS of the different genotypes
and the outcome a Fisher’s least significant difference test are shown in Table 9.
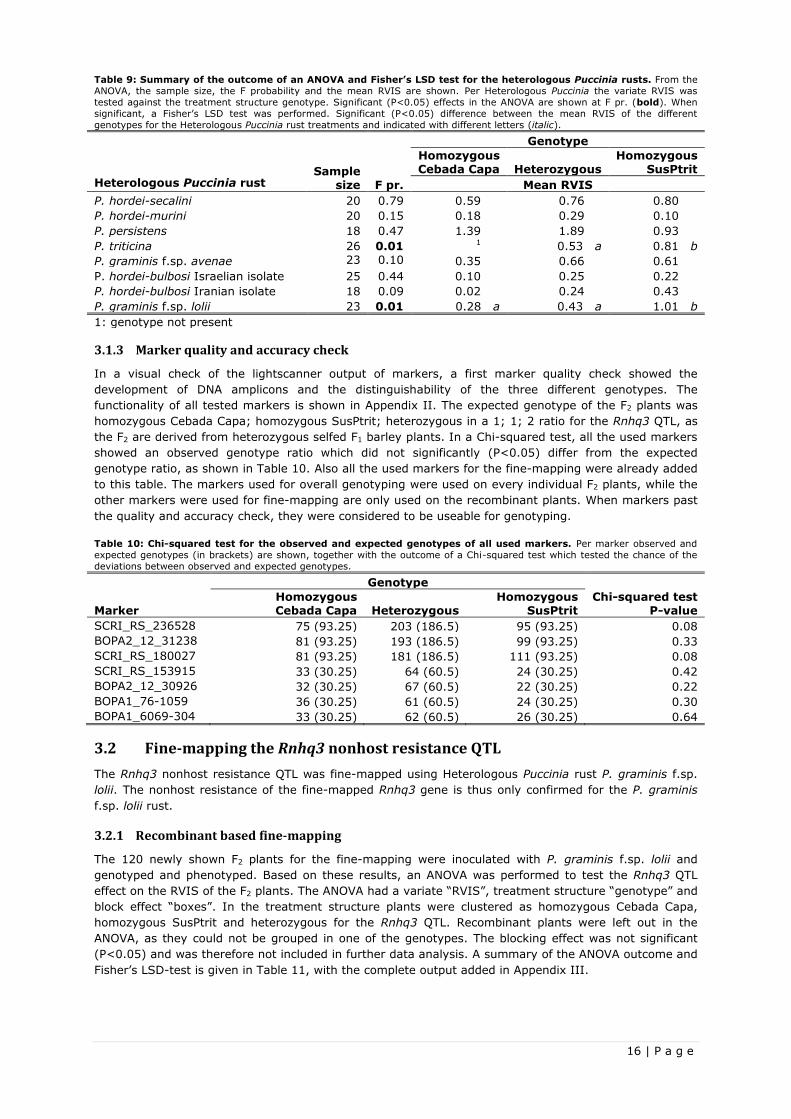
The Rnhq3 allele did not have a significant (P<0.05) effect on the RVIS of the heterologous Puccinia rusts
P. hordei-secalini, P. hordei-murini, P. persistens, P. graminis f.sp. avenae, P. hordei-bulbosi Israelian
isolate and P. hordei-bulbosi Iranian isolate. The plants inoculated with P. triticina and P. graminis f.sp.
lolii showed a significant genotype effect (P<0.05), so a Fisher's least significant difference test was used
to compare the different RVIS of the genotypes homozygous Cebada Capa, homozygous SusPtrit and
heterozygous. As P. triticina infected boxes did not contain any plant being completely homozygous for
Cebada Capa, a Fisher’s LSD test was not necessary as the difference was already shown by the ANOVA
results. The RVIS of the P. graminis f.sp. lolii infected F2 plants significantly differ (P<0.05) for the
homozygous Cebada Capa and heterozygous genotype with the homozygous SusPtrit genotype. This
shows the Cebada Capa allele to be dominant and the SusPtrit allele to be recessive for the Rnhq3 QTL.
The broad nonhost resistance of the Rnhq3 QTL has thus not been confirmed.
16 | P a g e
Table 9: Summary of the outcome of an ANOVA and Fisher’s LSD test for the heterologous Puccinia rusts. From the
ANOVA, the sample size, the F probability and the mean RVIS are shown. Per Heterologous Puccinia the variate RVIS was
tested against the treatment structure genotype. Significant (P<0.05) effects in the ANOVA are shown at F pr. (bold). When
significant, a Fisher’s LSD test was performed. Significant (P<0.05) difference between the mean RVIS of the different
genotypes for the Heterologous Puccinia rust treatments and indicated with different letters (italic).
Genotype
Heterologous Puccinia rust Sample
size F pr.
Homozygous Cebada Capa Heterozygous
Homozygous SusPtrit
Mean RVIS
P. hordei-secalini 20 0.79 0.59 0.76 0.80
P. hordei-murini 20 0.15 0.18 0.29 0.10
P. persistens 18 0.47 1.39 1.89 0.93
P. triticina 26 0.01 1 0.53 a 0.81 b
P. graminis f.sp. avenae 23 0.10 0.35 0.66 0.61
P. hordei-bulbosi Israelian isolate 25 0.44 0.10 0.25 0.22
P. hordei-bulbosi Iranian isolate 18 0.09 0.02 0.24 0.43
P. graminis f.sp. lolii 23 0.01 0.28 a 0.43 a 1.01 b
1: genotype not present
3.1.3 Marker quality and accuracy check
In a visual check of the lightscanner output of markers, a first marker quality check showed the
development of DNA amplicons and the distinguishability of the three different genotypes. The
functionality of all tested markers is shown in Appendix II. The expected genotype of the F2 plants was
homozygous Cebada Capa; homozygous SusPtrit; heterozygous in a 1; 1; 2 ratio for the Rnhq3 QTL, as
the F2 are derived from heterozygous selfed F1 barley plants. In a Chi-squared test, all the used markers
showed an observed genotype ratio which did not significantly (P<0.05) differ from the expected
genotype ratio, as shown in Table 10. Also all the used markers for the fine-mapping were already added
to this table. The markers used for overall genotyping were used on every individual F2 plants, while the
other markers were used for fine-mapping are only used on the recombinant plants. When markers past
the quality and accuracy check, they were considered to be useable for genotyping.
Table 10: Chi-squared test for the observed and expected genotypes of all used markers. Per marker observed and
expected genotypes (in brackets) are shown, together with the outcome of a Chi-squared test which tested the chance of the
deviations between observed and expected genotypes.
Genotype
Marker Homozygous Cebada Capa Heterozygous
Homozygous SusPtrit
Chi-squared test P-value
SCRI_RS_236528 75 (93.25) 203 (186.5) 95 (93.25) 0.08
BOPA2_12_31238 81 (93.25) 193 (186.5) 99 (93.25) 0.33
SCRI_RS_180027 81 (93.25) 181 (186.5) 111 (93.25) 0.08
SCRI_RS_153915 33 (30.25) 64 (60.5) 24 (30.25) 0.42
BOPA2_12_30926 32 (30.25) 67 (60.5) 22 (30.25) 0.22
BOPA1_76-1059 36 (30.25) 61 (60.5) 24 (30.25) 0.30
BOPA1_6069-304 33 (30.25) 62 (60.5) 26 (30.25) 0.64
3.2 Fine-mapping the Rnhq3 nonhost resistance QTL
The Rnhq3 nonhost resistance QTL was fine-mapped using Heterologous Puccinia rust P. graminis f.sp.
lolii. The nonhost resistance of the fine-mapped Rnhq3 gene is thus only confirmed for the P. graminis
f.sp. lolii rust.
3.2.1 Recombinant based fine-mapping
The 120 newly shown F2 plants for the fine-mapping were inoculated with P. graminis f.sp. lolii and
genotyped and phenotyped. Based on these results, an ANOVA was performed to test the Rnhq3 QTL
effect on the RVIS of the F2 plants. The ANOVA had a variate “RVIS”, treatment structure “genotype” and
block effect “boxes”. In the treatment structure plants were clustered as homozygous Cebada Capa,
homozygous SusPtrit and heterozygous for the Rnhq3 QTL. Recombinant plants were left out in the
ANOVA, as they could not be grouped in one of the genotypes. The blocking effect was not significant
(P<0.05) and was therefore not included in further data analysis. A summary of the ANOVA outcome and
Fisher’s LSD-test is given in Table 11, with the complete output added in Appendix III.
17 | P a g e
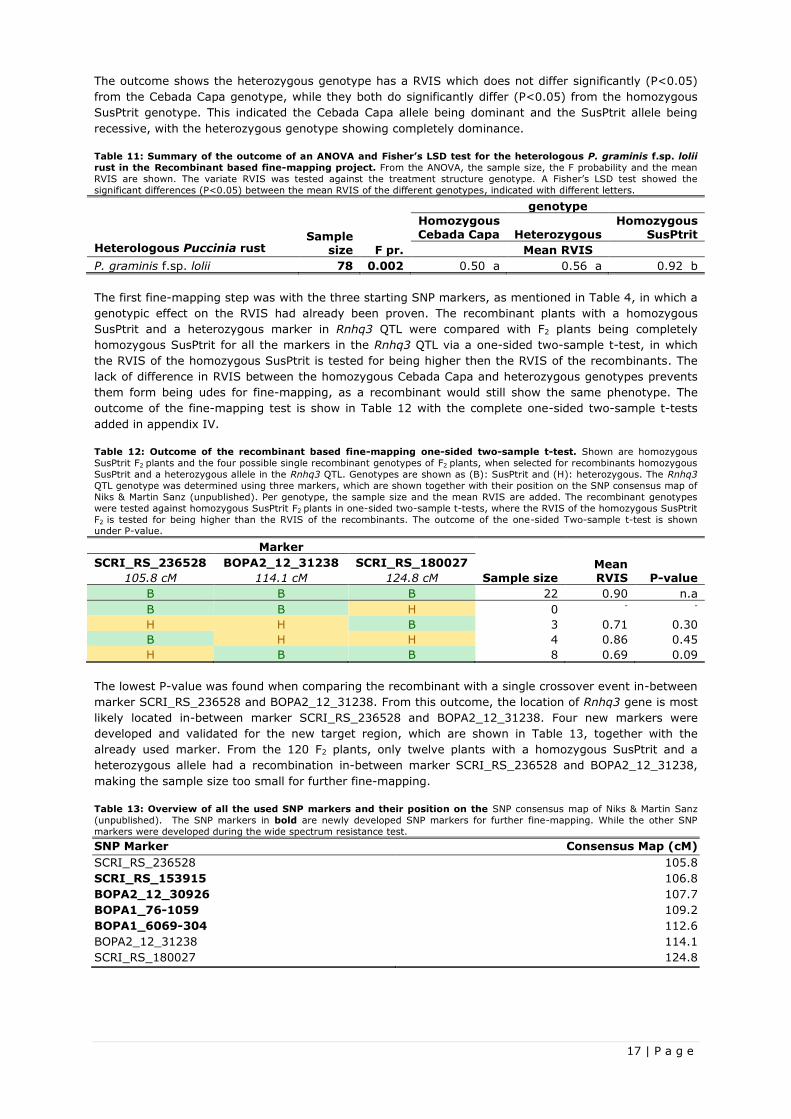
The outcome shows the heterozygous genotype has a RVIS which does not differ significantly (P<0.05)
from the Cebada Capa genotype, while they both do significantly differ (P<0.05) from the homozygous
SusPtrit genotype. This indicated the Cebada Capa allele being dominant and the SusPtrit allele being
recessive, with the heterozygous genotype showing completely dominance.
Table 11: Summary of the outcome of an ANOVA and Fisher’s LSD test for the heterologous P. graminis f.sp. lolii
rust in the Recombinant based fine-mapping project. From the ANOVA, the sample size, the F probability and the mean
RVIS are shown. The variate RVIS was tested against the treatment structure genotype. A Fisher’s LSD test showed the
significant differences (P<0.05) between the mean RVIS of the different genotypes, indicated with different letters.
Sample size
genotype
Heterologous Puccinia rust F pr.
Homozygous Cebada Capa Heterozygous
Homozygous SusPtrit
Mean RVIS
P. graminis f.sp. lolii 78 0.002 0.50 a 0.56 a 0.92 b
The first fine-mapping step was with the three starting SNP markers, as mentioned in Table 4, in which a
genotypic effect on the RVIS had already been proven. The recombinant plants with a homozygous
SusPtrit and a heterozygous marker in Rnhq3 QTL were compared with F2 plants being completely
homozygous SusPtrit for all the markers in the Rnhq3 QTL via a one-sided two-sample t-test, in which
the RVIS of the homozygous SusPtrit is tested for being higher then the RVIS of the recombinants. The
lack of difference in RVIS between the homozygous Cebada Capa and heterozygous genotypes prevents
them form being udes for fine-mapping, as a recombinant would still show the same phenotype. The
outcome of the fine-mapping test is show in Table 12 with the complete one-sided two-sample t-tests
added in appendix IV.
Table 12: Outcome of the recombinant based fine-mapping one-sided two-sample t-test. Shown are homozygous
SusPtrit F2 plants and the four possible single recombinant genotypes of F2 plants, when selected for recombinants homozygous
SusPtrit and a heterozygous allele in the Rnhq3 QTL. Genotypes are shown as (B): SusPtrit and (H): heterozygous. The Rnhq3
QTL genotype was determined using three markers, which are shown together with their position on the SNP consensus map of
Niks & Martin Sanz (unpublished). Per genotype, the sample size and the mean RVIS are added. The recombinant genotypes
were tested against homozygous SusPtrit F2 plants in one-sided two-sample t-tests, where the RVIS of the homozygous SusPtrit
F2 is tested for being higher than the RVIS of the recombinants. The outcome of the one-sided Two-sample t-test is shown under P-value.
Marker
Sample size Mean RVIS
SCRI_RS_236528 BOPA2_12_31238 SCRI_RS_180027
P-value 105.8 cM 114.1 cM 124.8 cM
B B B 22 0.90 n.a
B B H 0 - -
H H B 3 0.71 0.30
B H H 4 0.86 0.45
H B B 8 0.69 0.09
The lowest P-value was found when comparing the recombinant with a single crossover event in-between
marker SCRI_RS_236528 and BOPA2_12_31238. From this outcome, the location of Rnhq3 gene is most
likely located in-between marker SCRI_RS_236528 and BOPA2_12_31238. Four new markers were
developed and validated for the new target region, which are shown in Table 13, together with the
already used marker. From the 120 F2 plants, only twelve plants with a homozygous SusPtrit and a
heterozygous allele had a recombination in-between marker SCRI_RS_236528 and BOPA2_12_31238,
making the sample size too small for further fine-mapping.
Table 13: Overview of all the used SNP markers and their position on the SNP consensus map of Niks & Martin Sanz
(unpublished). The SNP markers in bold are newly developed SNP markers for further fine-mapping. While the other SNP
markers were developed during the wide spectrum resistance test.
SNP Marker Consensus Map (cM)
SCRI_RS_236528 105.8
SCRI_RS_153915 106.8
BOPA2_12_30926 107.7
BOPA1_76-1059 109.2
BOPA1_6069-304 112.6
BOPA2_12_31238 114.1
SCRI_RS_180027 124.8
18 | P a g e
The newly developed markers were used to completely genotype the Rnhq3 QTL of the transplanted
recombinant plants, from both the fine-mapping and the resistance testing projects. All recombinant
plants which managed to set seeds, hence creating a recombinant F3 line, were completely genotyped for
parental genotype F2 in the Rnhq3 QTL and added as an overview in Appendix VI. This overview also
contain the RVIS and the heterologous Puccinia rusts on which the RVIS was found.
Concluding, the Rnhq3 gene, confuring nonhost resistance against P. graminis f.sp. lolii, has been fine-
mapped to be located in-between marker SCRI_RS_236528 and BOPA2_12_31238. Four new markers
have been developed for this target region and recombinant F3 lines were now also available for this
target region.
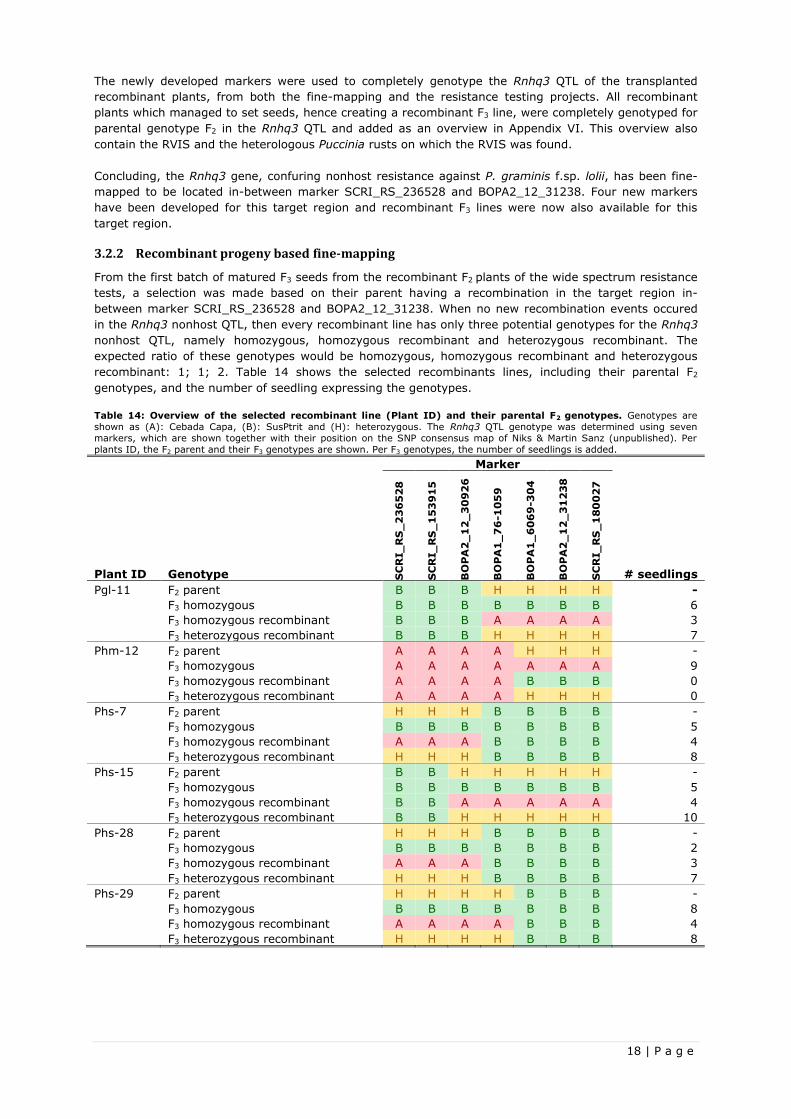
3.2.2 Recombinant progeny based fine-mapping
From the first batch of matured F3 seeds from the recombinant F2 plants of the wide spectrum resistance
tests, a selection was made based on their parent having a recombination in the target region in-
between marker SCRI_RS_236528 and BOPA2_12_31238. When no new recombination events occured
in the Rnhq3 nonhost QTL, then every recombinant line has only three potential genotypes for the Rnhq3
nonhost QTL, namely homozygous, homozygous recombinant and heterozygous recombinant. The
expected ratio of these genotypes would be homozygous, homozygous recombinant and heterozygous
recombinant: 1; 1; 2. Table 14 shows the selected recombinants lines, including their parental F2
genotypes, and the number of seedling expressing the genotypes.
Table 14: Overview of the selected recombinant line (Plant ID) and their parental F2 genotypes. Genotypes are
shown as (A): Cebada Capa, (B): SusPtrit and (H): heterozygous. The Rnhq3 QTL genotype was determined using seven
markers, which are shown together with their position on the SNP consensus map of Niks & Martin Sanz (unpublished). Per
plants ID, the F2 parent and their F3 genotypes are shown. Per F3 genotypes, the number of seedlings is added.
Marker
Plant ID Genotype SC
RI_
RS
_2
36
52
8
SC
RI_
RS
_1
53
91
5
BO
PA
2_
12
_3
09
26
BO
PA
1_
76
-10
59
BO
PA
1_
60
69
-30
4
BO
PA
2_
12
_3
12
38
SC
RI_
RS
_1
80
02
7
# seedlings
Pgl-11 F2 parent B B B H H H H -
F3 homozygous B B B B B B B 6
F3 homozygous recombinant B B B A A A A 3
F3 heterozygous recombinant B B B H H H H 7
Phm-12 F2 parent A A A A H H H -
F3 homozygous A A A A A A A 9
F3 homozygous recombinant A A A A B B B 0
F3 heterozygous recombinant A A A A H H H 0
Phs-7 F2 parent H H H B B B B -
F3 homozygous B B B B B B B 5
F3 homozygous recombinant A A A B B B B 4
F3 heterozygous recombinant H H H B B B B 8
Phs-15 F2 parent B B H H H H H -
F3 homozygous B B B B B B B 5
F3 homozygous recombinant B B A A A A A 4
F3 heterozygous recombinant B B H H H H H 10
Phs-28 F2 parent H H H B B B B -
F3 homozygous B B B B B B B 2
F3 homozygous recombinant A A A B B B B 3
F3 heterozygous recombinant H H H B B B B 7
Phs-29 F2 parent H H H H B B B -
F3 homozygous B B B B B B B 8
F3 homozygous recombinant A A A A B B B 4
F3 heterozygous recombinant H H H H B B B 8
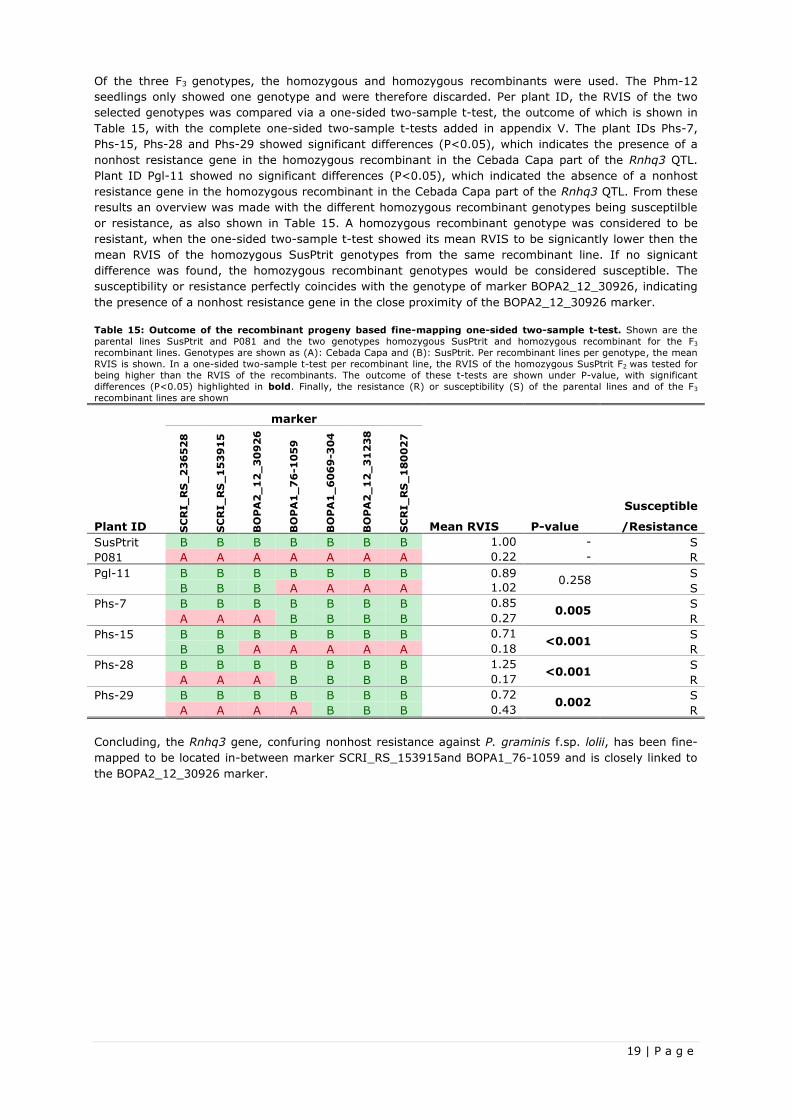
19 | P a g e
Of the three F3 genotypes, the homozygous and homozygous recombinants were used. The Phm-12
seedlings only showed one genotype and were therefore discarded. Per plant ID, the RVIS of the two
selected genotypes was compared via a one-sided two-sample t-test, the outcome of which is shown in
Table 15, with the complete one-sided two-sample t-tests added in appendix V. The plant IDs Phs-7,
Phs-15, Phs-28 and Phs-29 showed significant differences (P<0.05), which indicates the presence of a
nonhost resistance gene in the homozygous recombinant in the Cebada Capa part of the Rnhq3 QTL.
Plant ID Pgl-11 showed no significant differences (P<0.05), which indicated the absence of a nonhost
resistance gene in the homozygous recombinant in the Cebada Capa part of the Rnhq3 QTL. From these
results an overview was made with the different homozygous recombinant genotypes being susceptilble
or resistance, as also shown in Table 15. A homozygous recombinant genotype was considered to be
resistant, when the one-sided two-sample t-test showed its mean RVIS to be signicantly lower then the
mean RVIS of the homozygous SusPtrit genotypes from the same recombinant line. If no signicant
difference was found, the homozygous recombinant genotypes would be considered susceptible. The
susceptibility or resistance perfectly coincides with the genotype of marker BOPA2_12_30926, indicating
the presence of a nonhost resistance gene in the close proximity of the BOPA2_12_30926 marker.
Table 15: Outcome of the recombinant progeny based fine-mapping one-sided two-sample t-test. Shown are the
parental lines SusPtrit and P081 and the two genotypes homozygous SusPtrit and homozygous recombinant for the F3
recombinant lines. Genotypes are shown as (A): Cebada Capa and (B): SusPtrit. Per recombinant lines per genotype, the mean
RVIS is shown. In a one-sided two-sample t-test per recombinant line, the RVIS of the homozygous SusPtrit F2 was tested for being higher than the RVIS of the recombinants. The outcome of these t-tests are shown under P-value, with significant
differences (P<0.05) highlighted in bold. Finally, the resistance (R) or susceptibility (S) of the parental lines and of the F3
recombinant lines are shown
marker
Plant ID SC
RI_
RS
_2
36
52
8
SC
RI_
RS
_1
53
91
5
BO
PA
2_
12
_3
09
26
BO
PA
1_
76
-10
59
BO
PA
1_
60
69
-30
4
BO
PA
2_
12
_3
12
38
SC
RI_
RS
_1
80
02
7
Mean RVIS
Susceptible
P-value /Resistance
SusPtrit B B B B B B B 1.00 - S
P081 A A A A A A A 0.22 - R
Pgl-11 B B B B B B B 0.89 0.258
S
B B B A A A A 1.02 S
Phs-7 B B B B B B B 0.85 0.005
S
A A A B B B B 0.27 R
Phs-15 B B B B B B B 0.71 <0.001
S
B B A A A A A 0.18 R
Phs-28 B B B B B B B 1.25 <0.001
S
A A A B B B B 0.17 R
Phs-29 B B B B B B B 0.72 0.002
S
A A A A B B B 0.43 R
Concluding, the Rnhq3 gene, confuring nonhost resistance against P. graminis f.sp. lolii, has been fine-
mapped to be located in-between marker SCRI_RS_153915and BOPA1_76-1059 and is closely linked to
the BOPA2_12_30926 marker.
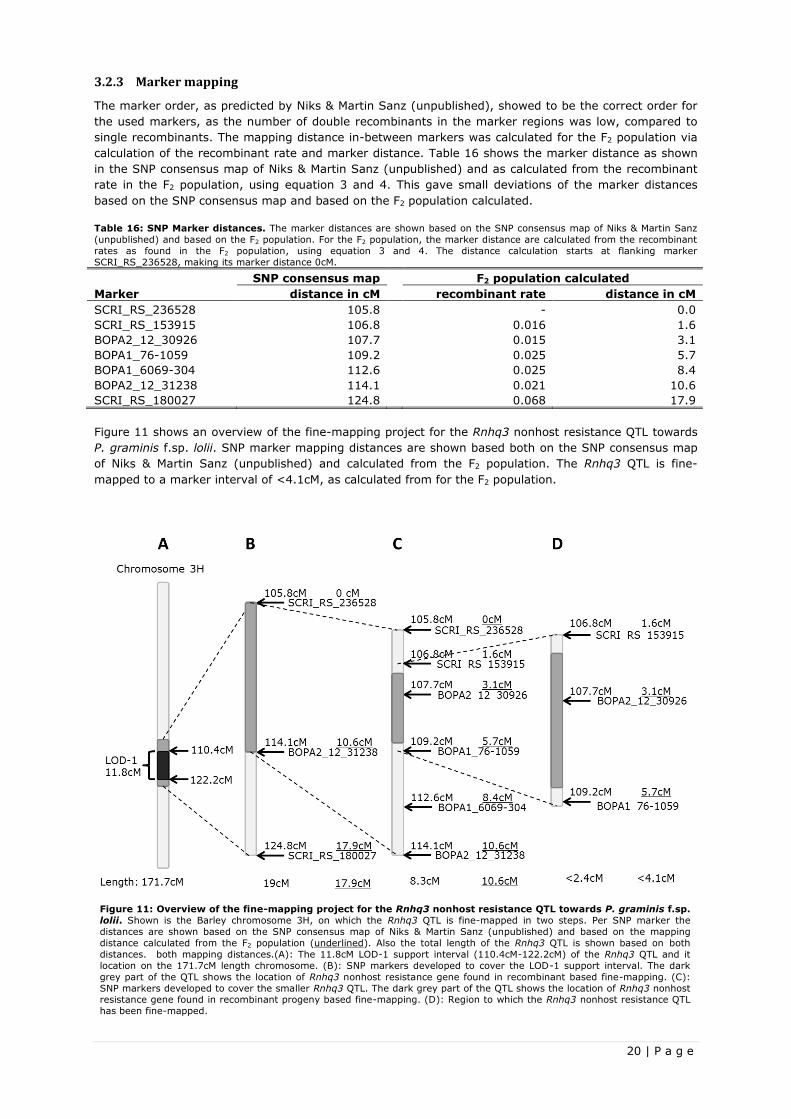
20 | P a g e
Figure 11: Overview of the fine-mapping project for the Rnhq3 nonhost resistance QTL towards P. graminis f.sp.
lolii. Shown is the Barley chromosome 3H, on which the Rnhq3 QTL is fine-mapped in two steps. Per SNP marker the
distances are shown based on the SNP consensus map of Niks & Martin Sanz (unpublished) and based on the mapping
distance calculated from the F2 population (underlined). Also the total length of the Rnhq3 QTL is shown based on both
distances. both mapping distances.(A): The 11.8cM LOD-1 support interval (110.4cM-122.2cM) of the Rnhq3 QTL and it
location on the 171.7cM length chromosome. (B): SNP markers developed to cover the LOD-1 support interval. The dark
grey part of the QTL shows the location of Rnhq3 nonhost resistance gene found in recombinant based fine-mapping. (C):
SNP markers developed to cover the smaller Rnhq3 QTL. The dark grey part of the QTL shows the location of Rnhq3 nonhost resistance gene found in recombinant progeny based fine-mapping. (D): Region to which the Rnhq3 nonhost resistance QTL
has been fine-mapped.
3.2.3 Marker mapping
The marker order, as predicted by Niks & Martin Sanz (unpublished), showed to be the correct order for
the used markers, as the number of double recombinants in the marker regions was low, compared to
single recombinants. The mapping distance in-between markers was calculated for the F2 population via
calculation of the recombinant rate and marker distance. Table 16 shows the marker distance as shown
in the SNP consensus map of Niks & Martin Sanz (unpublished) and as calculated from the recombinant
rate in the F2 population, using equation 3 and 4. This gave small deviations of the marker distances
based on the SNP consensus map and based on the F2 population calculated.
Table 16: SNP Marker distances. The marker distances are shown based on the SNP consensus map of Niks & Martin Sanz
(unpublished) and based on the F2 population. For the F2 population, the marker distance are calculated from the recombinant
rates as found in the F2 population, using equation 3 and 4. The distance calculation starts at flanking marker
SCRI_RS_236528, making its marker distance 0cM.
SNP consensus map F2 population calculated
Marker distance in cM recombinant rate distance in cM
SCRI_RS_236528 105.8 - 0.0
SCRI_RS_153915 106.8 0.016 1.6
BOPA2_12_30926 107.7 0.015 3.1
BOPA1_76-1059 109.2 0.025 5.7
BOPA1_6069-304 112.6 0.025 8.4
BOPA2_12_31238 114.1 0.021 10.6
SCRI_RS_180027 124.8 0.068 17.9
Figure 11 shows an overview of the fine-mapping project for the Rnhq3 nonhost resistance QTL towards
P. graminis f.sp. lolii. SNP marker mapping distances are shown based both on the SNP consensus map
of Niks & Martin Sanz (unpublished) and calculated from the F2 population. The Rnhq3 QTL is fine-
mapped to a marker interval of <4.1cM, as calculated from for the F2 population.
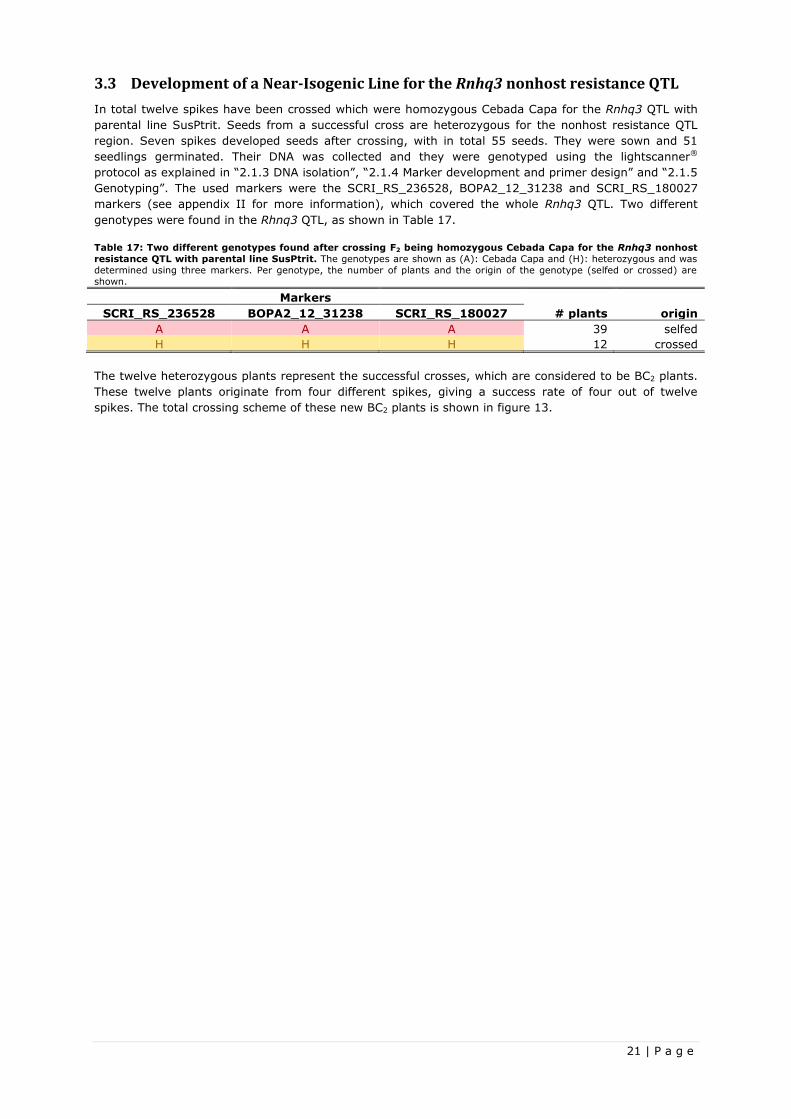
21 | P a g e
3.3 Development of a Near-Isogenic Line for the Rnhq3 nonhost resistance QTL
In total twelve spikes have been crossed which were homozygous Cebada Capa for the Rnhq3 QTL with
parental line SusPtrit. Seeds from a successful cross are heterozygous for the nonhost resistance QTL
region. Seven spikes developed seeds after crossing, with in total 55 seeds. They were sown and 51
seedlings germinated. Their DNA was collected and they were genotyped using the lightscanner®
protocol as explained in “2.1.3 DNA isolation”, “2.1.4 Marker development and primer design” and “2.1.5
Genotyping”. The used markers were the SCRI_RS_236528, BOPA2_12_31238 and SCRI_RS_180027
markers (see appendix II for more information), which covered the whole Rnhq3 QTL. Two different
genotypes were found in the Rhnq3 QTL, as shown in Table 17.
Table 17: Two different genotypes found after crossing F2 being homozygous Cebada Capa for the Rnhq3 nonhost
resistance QTL with parental line SusPtrit. The genotypes are shown as (A): Cebada Capa and (H): heterozygous and was
determined using three markers. Per genotype, the number of plants and the origin of the genotype (selfed or crossed) are
shown.
Markers
# plants origin SCRI_RS_236528 BOPA2_12_31238 SCRI_RS_180027
A A A 39 selfed
H H H 12 crossed
The twelve heterozygous plants represent the successful crosses, which are considered to be BC2 plants.
These twelve plants originate from four different spikes, giving a success rate of four out of twelve
spikes. The total crossing scheme of these new BC2 plants is shown in figure 13.
22 | P a g e
Chapter 4: Discussion and recommendations
4.1 Wide spectrum resistance test
Successful inoculation
In the wide spectrum resistance test, there are several points of discussion. The first one were the
fluctuations in visible infection sites between the heterologous Puccinia rust, with values as low as 0.7
VIS per cm2 and as high as 23.8 VIS per cm2 (Table 8). The lowest VIS was of the P. hordei-bulbosi
Israelian isolate, which might be explained via the visual germination check, the day after inoculation.
The germination tube count was very low in this rust, there for the inoculation is considered to be
unsuccessful. The highest VIS was of the P. graminis f.sp. lolii, which also had a higher amount of
uredospore inoculant. This also explained its higher germination tube count and VIS. For the remaining
rusts the VIS per cm2 still fluctuated from 2.0 to 10.3 VIS per cm2 (Table 8). Every resistance test
besides the P. graminis f.sp. lolii contained the same amount of uredospores inoculant. Also every
resistance test used F2 from the same parental offspring, giving the same expected genotype segregation
for the Rnhq3 nonhost resistance QTL, with homozygous Cebada Capa; homozygous SusPtrit and
heterozygous in a 1; 1; 2 ratio. Based on these assumptions, one might expect comparable visible
infection site values. The heterologous Puccinia rust, however do not infect the SusPtrit line equally.
Atienza et al. (2004), using the same inoculation methods, already found different levels of susceptibility
of the SusPtrit seedlings towards different heterologous Puccinia rusts, while developing the SusPtrit line.
The susceptibility to heterologous Puccinia rusts in the F2 barley seedlings is inherited from this parental
SusPtrit line. The differences in VIS between the heterologous Puccinia rusts could thus be explained by
the different levels of VIS on the SusPtrit seedlings already found by Atienza et al. (2004). Via using the
relative VIS (RVIS) for phenotype determination, the differences is SusPtrit susceptibility where limited.
Wide spectrum resistance
Looking at the outcome of the wide spectrum resistance test (Table 9), shows little significant effects
(P<0.05). The only confirmed effect of the Rnhq3 nonhost resistance QTL on the disease intensity (RVIS)
was found in the heterologous Puccinia rust P. triticina, and P. graminis f.sp. lolii. As P. triticina did not
contain any F2 plants with a homozygous Cebada Capa genotype, only the difference between the
heterozygous and the homozygous SusPtrit can be concluded.
The P. graminis f.sp. lolii showed a clear distinction among genotypes, in which the homozygous Cebada
Capa showed a significant lower (P<0.05) RVIS compared to the homozygous SusPtrit. As the resistance
found in the Rnhq3 QTL comes from the Cebada Capa cultivar, the RVIS was also to be expected lower in
genotypes expressing the Cebada Capa allele, as compared to genotypes expressing the susceptible
SusPtrit allele. The heterozygous genotype contains both the Cebada Capa allele and the SusPtrit allele,
yet expresses an RVIS which is significantly lower as the RVIS of the homozygous SusPtrit genotype and
does not significantly (P<0.05) differ from the RVIS of the Cebada Capa genotype. The Cebada Capa
allele thus delivers the dominant Rnhq3 nonhost resistance gene and shows complete dominance in
heterozygous conditions. This was also verified in the recombinant based fine-mapping, as shown in
Table 11, where the homozygous Cebada Capa also showed a significant lower (P<0.05) RVIS compared
to the homozygous SusPtrit and the heterozygous genotype expressed the same RVIS as the Cebada
Capa genotype.
In the P. triticina resistance test, the absence of the homozygous Cebada Capa genotype was
unexpected. The DNA of the P. triticina has been isolated and genotyped again, giving the same results.
P. triticina contained 26 plants which were non-recombinant for the Rnhq3 QTL. The expected genotype
of the F2 non-recombinant plants was homozygous Cebada Capa; homozygous SusPtrit; heterozygous in
a 1; 1; 2 ratio for the Rnhq3 nonhost QTL, as the F2 are derived from heterozygous selfed F1 plants. The
chance of a non-recombinant F2 being homozygous Cebada Capa is thus 1 to 4. With 26 non-recombinant
F2 plants, of which none is homozygous Cebada Capa, this gives a chance of only 0.7526*100=0.06%. No
explanation has been found to explain the absence of a homozygous Cebada Capa, besides it happening
by chance.
23 | P a g e
For the heterologous Puccinia rusts P. hordei-secalini, P. hordei-murini, P. persistens, and P. graminis
f.sp. avenae, P. hordei-bulbosi Israelian isolate and P. hordei-bulbosi Iranian isolate a nonhost resistance
effect of the Rnhq3 QTL was not confirmed. Jafary et al. (2008) found the Rnhq3 nonhost resistance QTL
using the mapping population Cebada Capa X SusPtrit and testing it for nonhost resistance using the
heterologous Puccinia rusts P. hordei-murini, P. hordei-secalini, P. persistens and P. triticina. The location
of the Rnhq3 QTL was determined, based on the overlapping LOD-1 score associated with nonhost
resistance found in these rusts. Finding a genotypic effect of the Rnhq3 QTL on the disease intensity was
there for assumed. A possible explanation of the lack of significant results might be found in the
experimental design. Increasing the sample size, increase uredospore inoculant amount or use more
isogenic lines would be recommended to verify or falsify the broad nonhost resistance status of the
proposed Rnhq3 gene.
Jafary et al. (2008) found the Rnhq3 QTL to account for 10.3-22.2% of the phenotypic variation (Table
1). Sample sizes were set 35±5 seeds. Recombinants were left out of the wide spectrum resistance, as
they could not be grouped in one of the genotypes. The total distance covered by the two flanking
markers has been calculated to be 17.9cM (Table 16). With 35 plantlets in a box, on average 12-13
plants are recombinants, leaving only 22-23 F2 plants left to determine a genotypic effect on the RVIS.
This also matches the sample size as shown in Table 9. The sample size might have been too low to find
a phenotypic effect of the Rnhq3 QTL, accounting for just 10.3-22.2% of the phenotypic variation.
Increasing the sample size would result in the necessity to use at least one extra box, creating a
potential blocking effect and doubling the work load. Another possible solution would be to increase the
uredospore inoculate amount. 2.0mg of uredospores, or 120 uredospores per cm2, were normally used,
as compared to 10.0mg, or 600 uredospores per cm2 by Atienza et al (2004) and Jafary et al (2008).
While using 8.0mg for P. graminis f.sp. lolii uredospores, an Rnhq3 nonhost resistance was found, using
2.0mg of uredospores no Rnhq3 was confirmed. An increase of the uredospore inoculant amount might
therefore also help in verifying or falsifying the broad nonhost resistance status of the proposed Rnhq3
gene. Lastly, using more isogenic lines is recommended. The used plantlets were from a F2 population
consisting of 25% Cebada Capa and 75% SusPtrit, making them not very isogenic.
Rnhq3 nonhost resistance QTL: single gene or a cluster of genes
The research question whether the resistance found in the Rnhq3 nonhost resistance QTL was caused by
a single broad nonhost resistance gene or by a cluster of several more rust fungal-specific resistance
genes could not be answered. As the nonhost resistance of the Rnhq3 QTL could only be confirmed in
two heterologous Puccinia rusts, of which one lacked a genotype, verifying whether the Rnhq3 nonhost
resistance is derived from a single broad nonhost resistance gene or from several more rust fungal-
specific resistance genes was not possible. This would be verified via fine-mapping the Rnhq3 QTL for the
different heterologous Puccinia rust. When nonhost resistance is caused by a single Rnhq3 nonhost
resistance gene, fine-mapping the Rnhq3 QTL per heterologous Puccinia rusts results in the same fine-
mapping region. Several more rust fungal-specific resistance genes would cause differences in the fine-
mapping region, as per rust the nonhost resistance is caused by a gene on a different locus in the Rnhq3
nonhost resistance QTL.
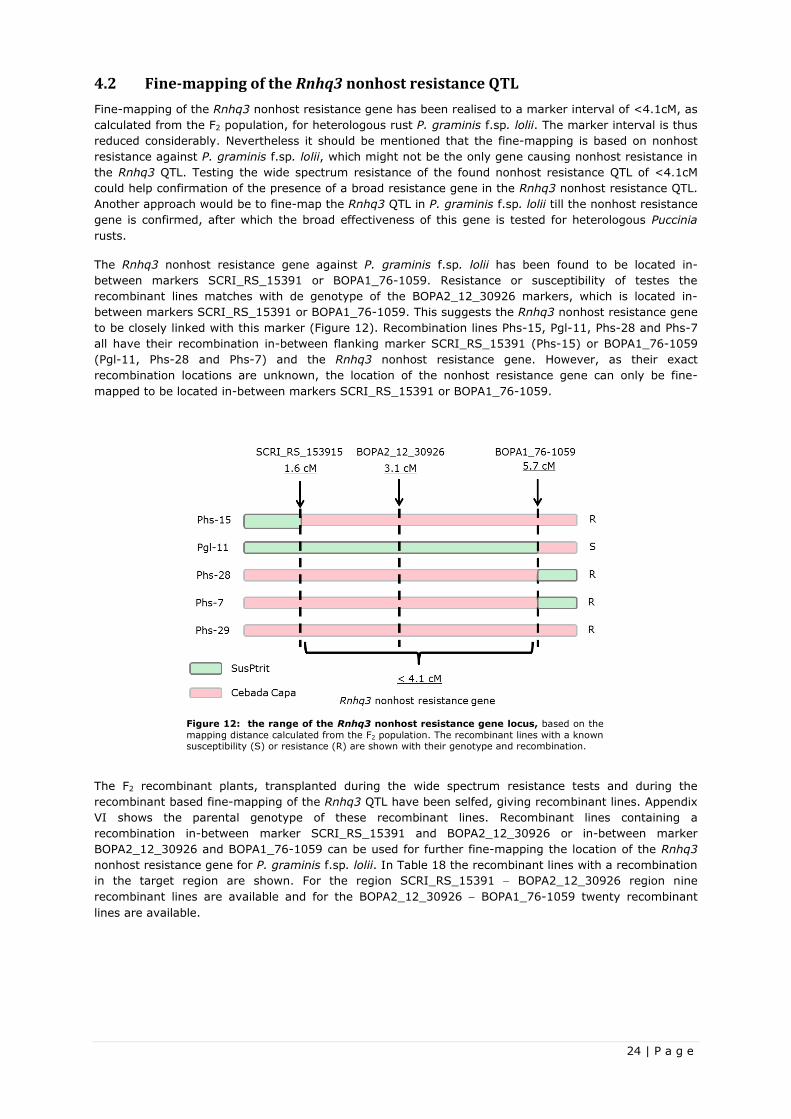
24 | P a g e
4.2 Fine-mapping of the Rnhq3 nonhost resistance QTL
Fine-mapping of the Rnhq3 nonhost resistance gene has been realised to a marker interval of <4.1cM, as
calculated from the F2 population, for heterologous rust P. graminis f.sp. lolii. The marker interval is thus
reduced considerably. Nevertheless it should be mentioned that the fine-mapping is based on nonhost
resistance against P. graminis f.sp. lolii, which might not be the only gene causing nonhost resistance in
the Rnhq3 QTL. Testing the wide spectrum resistance of the found nonhost resistance QTL of <4.1cM
could help confirmation of the presence of a broad resistance gene in the Rnhq3 nonhost resistance QTL.
Another approach would be to fine-map the Rnhq3 QTL in P. graminis f.sp. lolii till the nonhost resistance
gene is confirmed, after which the broad effectiveness of this gene is tested for heterologous Puccinia
rusts.
The Rnhq3 nonhost resistance gene against P. graminis f.sp. lolii has been found to be located in-
between markers SCRI_RS_15391 or BOPA1_76-1059. Resistance or susceptibility of testes the
recombinant lines matches with de genotype of the BOPA2_12_30926 markers, which is located in-
between markers SCRI_RS_15391 or BOPA1_76-1059. This suggests the Rnhq3 nonhost resistance gene
to be closely linked with this marker (Figure 12). Recombination lines Phs-15, Pgl-11, Phs-28 and Phs-7
all have their recombination in-between flanking marker SCRI_RS_15391 (Phs-15) or BOPA1_76-1059
(Pgl-11, Phs-28 and Phs-7) and the Rnhq3 nonhost resistance gene. However, as their exact
recombination locations are unknown, the location of the nonhost resistance gene can only be fine-
mapped to be located in-between markers SCRI_RS_15391 or BOPA1_76-1059.
The F2 recombinant plants, transplanted during the wide spectrum resistance tests and during the
recombinant based fine-mapping of the Rnhq3 QTL have been selfed, giving recombinant lines. Appendix
VI shows the parental genotype of these recombinant lines. Recombinant lines containing a
recombination in-between marker SCRI_RS_15391 and BOPA2_12_30926 or in-between marker
BOPA2_12_30926 and BOPA1_76-1059 can be used for further fine-mapping the location of the Rnhq3
nonhost resistance gene for P. graminis f.sp. lolii. In Table 18 the recombinant lines with a recombination
in the target region are shown. For the region SCRI_RS_15391 BOPA2_12_30926 region nine
recombinant lines are available and for the BOPA2_12_30926 BOPA1_76-1059 twenty recombinant
lines are available.
Figure 12: the range of the Rnhq3 nonhost resistance gene locus, based on the
mapping distance calculated from the F2 population. The recombinant lines with a known susceptibility (S) or resistance (R) are shown with their genotype and recombination.
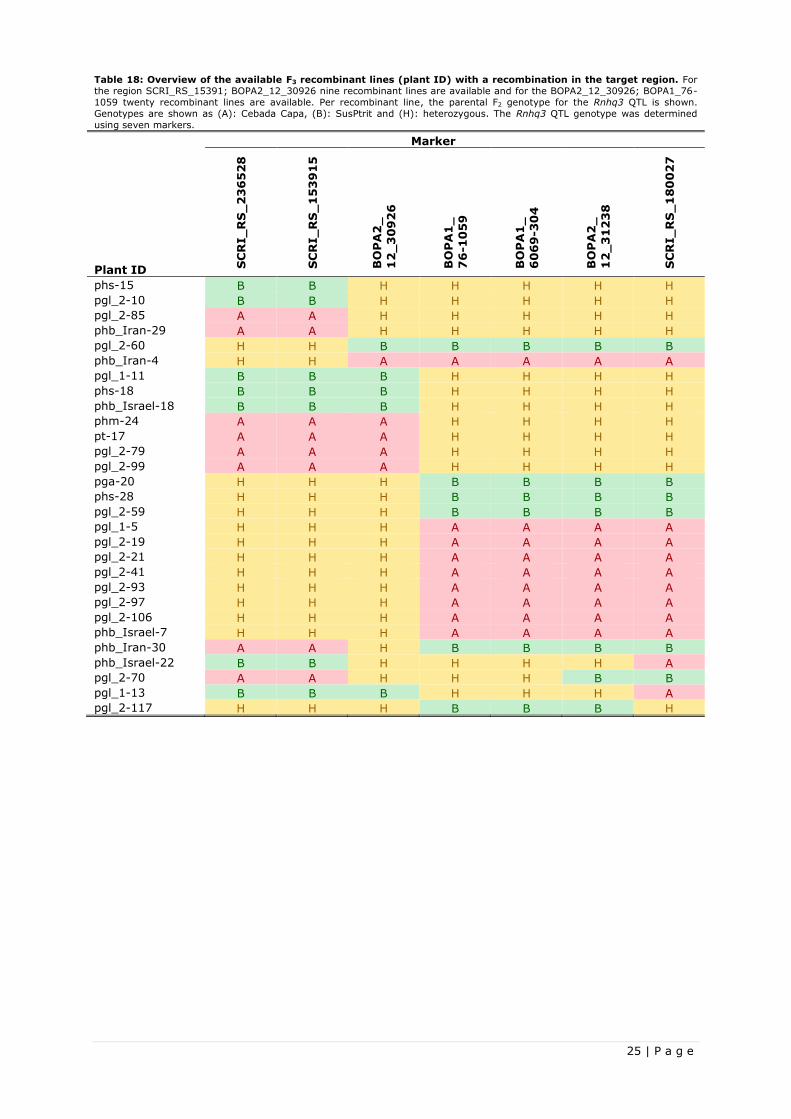
25 | P a g e
Table 18: Overview of the available F3 recombinant lines (plant ID) with a recombination in the target region. For
the region SCRI_RS_15391; BOPA2_12_30926 nine recombinant lines are available and for the BOPA2_12_30926; BOPA1_76-
1059 twenty recombinant lines are available. Per recombinant line, the parental F2 genotype for the Rnhq3 QTL is shown.
Genotypes are shown as (A): Cebada Capa, (B): SusPtrit and (H): heterozygous. The Rnhq3 QTL genotype was determined
using seven markers.
Marker
Plant ID SC
RI_
RS
_2
36
52
8
SC
RI_
RS
_1
53
91
5
BO
PA
2_
12
_3
09
26
BO
PA
1_
76
-10
59
BO
PA
1_
60
69
-30
4
BO
PA
2_
12
_3
12
38
SC
RI_
RS
_1
80
02
7
phs-15 B B H H H H H
pgl_2-10 B B H H H H H
pgl_2-85 A A H H H H H
phb_Iran-29 A A H H H H H
pgl_2-60 H H B B B B B
phb_Iran-4 H H A A A A A
pgl_1-11 B B B H H H H
phs-18 B B B H H H H
phb_Israel-18 B B B H H H H
phm-24 A A A H H H H
pt-17 A A A H H H H
pgl_2-79 A A A H H H H
pgl_2-99 A A A H H H H
pga-20 H H H B B B B
phs-28 H H H B B B B
pgl_2-59 H H H B B B B
pgl_1-5 H H H A A A A
pgl_2-19 H H H A A A A
pgl_2-21 H H H A A A A
pgl_2-41 H H H A A A A
pgl_2-93 H H H A A A A
pgl_2-97 H H H A A A A
pgl_2-106 H H H A A A A
phb_Israel-7 H H H A A A A
phb_Iran-30 A A H B B B B
phb_Israel-22 B B H H H H A
pgl_2-70 A A H H H B B
pgl_1-13 B B B H H H A
pgl_2-117 H H H B B B H
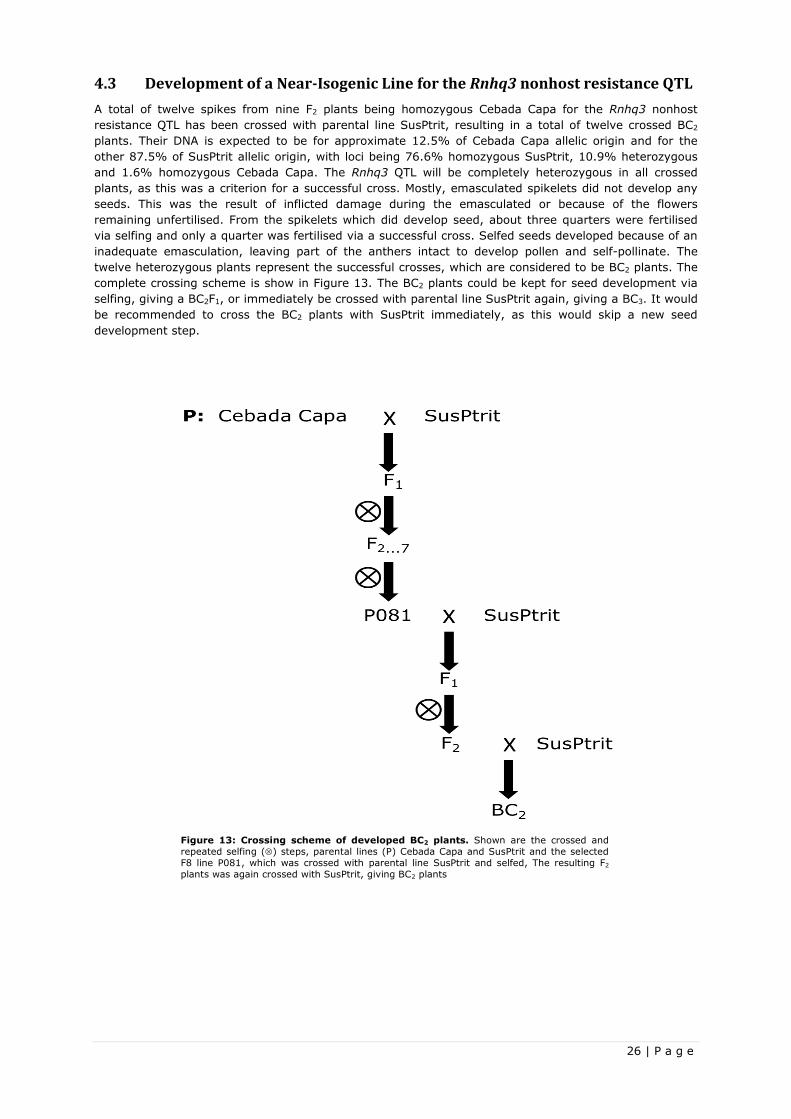
26 | P a g e
4.3 Development of a Near-Isogenic Line for the Rnhq3 nonhost resistance QTL
A total of twelve spikes from nine F2 plants being homozygous Cebada Capa for the Rnhq3 nonhost
resistance QTL has been crossed with parental line SusPtrit, resulting in a total of twelve crossed BC2
plants. Their DNA is expected to be for approximate 12.5% of Cebada Capa allelic origin and for the
other 87.5% of SusPtrit allelic origin, with loci being 76.6% homozygous SusPtrit, 10.9% heterozygous
and 1.6% homozygous Cebada Capa. The Rnhq3 QTL will be completely heterozygous in all crossed
plants, as this was a criterion for a successful cross. Mostly, emasculated spikelets did not develop any
seeds. This was the result of inflicted damage during the emasculated or because of the flowers
remaining unfertilised. From the spikelets which did develop seed, about three quarters were fertilised
via selfing and only a quarter was fertilised via a successful cross. Selfed seeds developed because of an
inadequate emasculation, leaving part of the anthers intact to develop pollen and self-pollinate. The
twelve heterozygous plants represent the successful crosses, which are considered to be BC2 plants. The
complete crossing scheme is show in Figure 13. The BC2 plants could be kept for seed development via
selfing, giving a BC2F1, or immediately be crossed with parental line SusPtrit again, giving a BC3. It would
be recommended to cross the BC2 plants with SusPtrit immediately, as this would skip a new seed
development step.
Figure 13: Crossing scheme of developed BC2 plants. Shown are the crossed and
repeated selfing () steps, parental lines (P) Cebada Capa and SusPtrit and the selected
F8 line P081, which was crossed with parental line SusPtrit and selfed, The resulting F2
plants was again crossed with SusPtrit, giving BC2 plants
27 | P a g e
Chapter 5: Conclusions
5.1 Research objectives
The objectives of this research were:
1) Confirmation of the broad nonhost resistance of a single Rnhq3 gene.
2) Fine-mapping the Rnhq3 nonhost resistance QTL to a marker interval smaller than 1cM.
3) Further development a Near-Isogenic Line for the Rnhq3 nonhost resistance QTL
Per objective, research questions were to be answered to meet the objectives.
5.1.1 Confirmation of the broad nonhost resistance of a single Rnhq3 gene
Four questions were to be answered for the confirmation of the broad nonhost resistance of the Rnhq3
nonhost resistance gene.
Q1: Does the Rnhq3 nonhost resistance QTL confer resistance towards all tested heterologous
Puccinia rusts?
The Rnhq3 nonhost resistance QTL only conferred resistance to heterologous Puccinia rust P. triticina,
commonly known as wheat leaf rust, and P. graminis f.sp. lolii, commonly known as Ryegrass stem rust.
For the heterologous Puccinia rusts P. hordei-secalini, P. hordei-murini, P. persistens, P. graminis f.sp.
avenae, P. hordei-bulbosi Israelian isolate and P. hordei-bulbosi Iranian isolate a nonhost resistance
effect of the Rnhq3 nonhost resistance QTL was not confirmed.
Q2: Does the Rnhq3 nonhost resistance QTL come from a single gene or a cluster of several more
rust fungal-specific resistance genes?
This research question could not be answered, because of the lack of broad nonhost resistance found in
the Rnhq3 nonhost resistance QTL.
Q3: What is the dominance of the Rnhq3 nonhost resistance gene?
For the nonhost resistance towards P. graminis f.sp. lolii, the Cebada Capa allele is dominant and the
SusPtrit allele is recessive. The Cebada Capa allele confers nonhost resistance, while the SusPtrit allele
confers nonhost susceptibility.
5.1.2 fine-mapping of the Rnhq3 nonhost resistance QTL
Two questions were to be answered regarding the fine-mapping of the Rnhq3 nonhost resistance QTL
Q4: Has the proposed Rnhq3 nonhost resistance gene been fine-mapped to a smaller marker
interval?
The Rnhq3 nonhost resistance gene has been fine-mapped to a marker interval of <4.1cM, as calculated
from the used F2 mapping population, for heterologous rust P. graminis f.sp. lolii.
Q5: Has a marker been found, which is closely linked with the proposed Rnhq3 nonhost resistance
gene?
The Rnhq3 nonhost resistance gene is closely linked to marker BOPA2_12_30926 for heterologous rust P.
graminis f.sp. lolii. This marker is located at 107.7cM on the SNP consensus map of Niks & Martin Sanz
(unpublished).
28 | P a g e
5.1.3 Development of a Near-Isogenic Line for the Rnhq3 nonhost resistance QTL
Only one questions was to be answered for the development of a Near-Isogenic Line for the Rnhq3
nonhost resistance QTL
Q6: Is the development of a Near-Isogenic Line for the Rnhq3 nonhost resistance QTL one step
closer?
Twelve plants have been developed from a successful cross of F2 plants being homozygous Cebada Capa
for the Rnhq3 nonhost resistance QTL with parental line SusPtrit. These plants are considered as BC2
plants and they bring the development of a Near-Isogenic Line for the Rnhq3 nonhost resistance QTL one
step closer.
5.2 Hypothesis
The overall hypothesis of this research was the presence of a single gene in the Rnhq3 broad nonhost
resistance QTL, which gives a wide spectrum nonhost resistance towards heterologous Puccinia rusts.
The presence of a broad nonhost resistance gene in the Rnhq3 QTL has not been confirmed. A nonhost
resistance gene towards P. graminis f.sp. lolii has been found. The P. graminis f.sp. lolii nonhost
resistance gene is possibly a broad nonhost resistance gene, but this is not confirmed in this research.
The P. graminis f.sp. lolii nonhost resistance gene has been fine-mapped to a marker interval of <4.1cM.
29 | P a g e
Chapter 6: References
Atienza, S. G., Jafary, H., & Niks, R. E. (2004). Accumulation of genes for susceptibility to rust
fungi for which barley is nearly a nonhost results in two barley lines with extreme multiple
susceptibility. Planta, 220: 71-79.
Badr, A., Sch, R., El Rabey, H., Effgen, S., Ibrahim, H. H., Pozzi, C., & Salamini, F. (2000).
On the origin and domestication history of barley (Hordeum vulgare). Molecular Biology and
Evolution, 17: 499-510.
Chisholm, S. T., Coaker, G., Day, B., & Staskawicz, B. J. (2006). Host-microbe interactions:
shaping the evolution of the plant immune response. Cell, 124: 803-814.
Cone, K. C., McMullen, M. D., Bi, I. V., Davis, G. L., Yim, Y. S., Gardiner, J. M., &
Havermann, S. A. (2002). Genetic, physical, and informatics resources for maize. On the
road to an integrated map. Plant Physiology, 130: 1598-1605.
Cotter, R. U., & Roberts, B. J. (1963). A synthetic hybrid of 2 varieties of puccinia graminis.
Phytopathology, 53: 344.
Deng W, Nickle DC, Learn GH, Maust B, and Mullins JI. (2007). ViroBLAST: A stand-alone
BLAST web server for flexible queries of multiple databases and user's
datasets. Bioinformatics, 23: 2334-2336.
Flor, H. H. (1942). Inheritance of pathogenicity in Melampsora lini. Phytopathology, 32: 653-669.
Flor, H. H. (1946). Genetics of pathogenicity in Melampsora lini. J Agric Res, 73: 335-357.
Garnica, D. P., Nemri, A., Upadhyaya, N. M., Rathjen, J. P., & Dodds, P. N. (2014). The ins
and outs of rust haustoria. PLoS Pathog, 10: e1004329.
Hammond-Kosack, K. E., & Parker, J. E. (2003). Deciphering plant–pathogen communication:
fresh perspectives for molecular resistance breeding. Current opinion in biotechnology, 14:
177-193.
Heath, M. C. (1985). Implications of nonhost resistance for understanding host-parasite
interactions. In: Groth JV, Nushnell WR Genetic basis of biochemical mechanisms of disease:
25-42.
Heath, M. C. (1997). Evolution of plant resistance and susceptibility to fungal parasites. In Plant
Relationships Part B, Springer Berlin Heidelberg, 257-276.
Heath, M. C. (2000). Nonhost resistance and nonspecific plant defenses. Current opinion in plant biology, 3: 315-319.
Hoogkamp, T. J. H., Chen, W. Q., & Niks, R. E. (1998). Specificity of prehaustorial resistance to Puccinia hordei and to two inappropriate rust fungi in barley. Phytopathology, 88: 856-861.
Hückelhoven, R. (2007). Cell wall–associated mechanisms of disease resistance and
susceptibility. Annu. Rev. Phytopathol., 45: 101-127.
Jafary, H., Albertazzi, G., Marcel, T. C., & Niks, R. E. (2008). High diversity of genes for nonhost resistance of barley to heterologous rust fungi. Genetics, 178: 2327-2339.
Jafary, H., Szabo, L. J., & Niks, R. E. (2006). Innate nonhost immunity in barley to different
heterologous rust fungi is controlled by sets of resistance genes with different and
overlapping specificities. Molecular plant-microbe interactions, 19: 1270-1279.

30 | P a g e
Jeuken, M. J. W., & Lindhout, P. (2004). The development of lettuce backcross inbred lines
(BILs) for exploitation of the Lactuca saligna (wild lettuce) germplasm. Theoretical and
Applied Genetics, 109: 394-401.
Jones, J. D., & Dangl, J. L. (2006). The plant immune system. Nature, 444: 323-329.
Marcel, T. C., Varshney, R. K., Barbieri, M., Jafary, H., De Kock, M. J. D., Graner, A., &
Niks, R. E. (2007). A high-density consensus map of barley to compare the distribution of
QTLs for partial resistance to Puccinia hordei and of defence gene homologues. Theoretical
and applied Genetics, 114: 487-500.
Mysore, K. S., & Ryu, C. M. (2004). Nonhost resistance: how much do we know?. Trends in
plant science, 9: 97-104.
Niks, R. E. (1987). Nonhost plant species as donors for resistance to pathogens with narrow host
range I. Determination of nonhost status. Euphytica, 36: 841-852.
Niks, R. E. (1989). Morphology of infection structures of Puccinia striiformis var. dactylidis.
European Journal of Plant Pathology, 95: 171-175.
Niks, R. E., & Marcel, T. C. (2009). Nonhost and basal resistance: how to explain specificity?. New Phytologist, 182: 817-828.
Niks, R. E., Parlevliet, J. E., Lindhout, P., & Bai, Z. (2011). Breeding crops with resistance to diseases and pests (p. 198). The Netherlands: Wageningen Academic Publishers.
Niks, R.E. & Martin Sanz (unpublished) SNP Consensus map.
Nürnberger, T., & Lipka, V. (2005). Non‐host resistance in plants: new insights into an old
phenomenon. Molecular plant pathology, 6: 335-345.
Nürnberger, T., Brunner, F., Kemmerling, B., & Piater, L. (2004). Innate immunity in plants
and animals: striking similarities and obvious differences. Immunological reviews, 198: 249-
266.
O’Connell, R. J., & Panstruga, R. (2006). Tête à tête inside a plant cell: establishing
compatibility between plants and biotrophic fungi and oomycetes. New Phytologist, 171:
699-718.
Ouchi, S., Oku, H., Hibino, C., & Akiyama, I. (1974). Induction of accessibility and resistance
in leaves of barley by some races of Erysiphe graminis. Journal of Phytopathology, 79: 24-
34.
Parlevliet, J. E. (1975). Partial resistance of barley to leafrust, Puccinia hordei. I. Effect of
cultivar and development stage on latent period. Euphytica, 24: 21-27.
Sharma, O. P. (1989). Textbook of fungi. Tata McGraw-Hill Education. P222
Swertz, C. A. (1994). Morphology of germlings of urediniospores and its value for the
identification and classification of grass rust fungi. Stud Mycol 36: 152pp.
The Plant List (2010). The Plant List. Version 1. Electronic Database Accessible at http://www.theplantlist.org/ Retrieved on 21 August 2016.
Tosa, Y., Tsujimoto, H., & Ogura, H. (1987). A gene involved in the resistance of wheat to
wheatgrass powdery mildew fungus. Genome, 29: 850-852.
Zhang, H. S., De la Rosa, R., Rubiales, D., Lubbers, H. H., Molenveld, J. W., & Niks, R. E.
(1994). Role of partial resistance to Puccinia hordei in barley in the defence of barley to
inappropriate rust fungi. Physiological and molecular plant pathology, 45: 219-228.
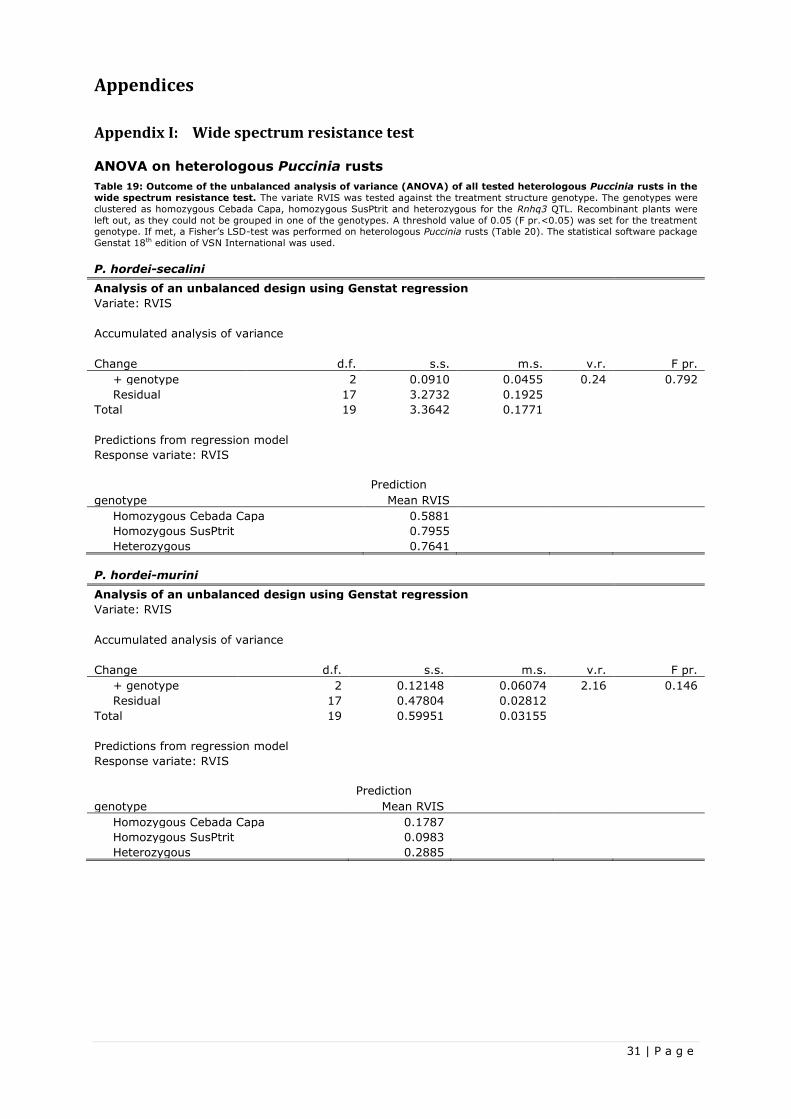
31 | P a g e
Appendices
Appendix I: Wide spectrum resistance test
ANOVA on heterologous Puccinia rusts
Table 19: Outcome of the unbalanced analysis of variance (ANOVA) of all tested heterologous Puccinia rusts in the
wide spectrum resistance test. The variate RVIS was tested against the treatment structure genotype. The genotypes were
clustered as homozygous Cebada Capa, homozygous SusPtrit and heterozygous for the Rnhq3 QTL. Recombinant plants were
left out, as they could not be grouped in one of the genotypes. A threshold value of 0.05 (F pr.<0.05) was set for the treatment genotype. If met, a Fisher’s LSD-test was performed on heterologous Puccinia rusts (Table 20). The statistical software package
Genstat 18th edition of VSN International was used.
P. hordei-secalini
Analysis of an unbalanced design using Genstat regression Variate: RVIS
Accumulated analysis of variance
Change d.f. s.s. m.s. v.r. F pr.
+ genotype 2 0.0910 0.0455 0.24 0.792
Residual 17 3.2732 0.1925
Total 19 3.3642 0.1771
Predictions from regression model
Response variate: RVIS
Prediction
genotype Mean RVIS Homozygous Cebada Capa 0.5881 Homozygous SusPtrit 0.7955 Heterozygous 0.7641
P. hordei-murini
Analysis of an unbalanced design using Genstat regression Variate: RVIS
Accumulated analysis of variance
Change d.f. s.s. m.s. v.r. F pr.
+ genotype 2 0.12148 0.06074 2.16 0.146
Residual 17 0.47804 0.02812
Total 19 0.59951 0.03155
Predictions from regression model Response variate: RVIS
Prediction
genotype Mean RVIS Homozygous Cebada Capa 0.1787 Homozygous SusPtrit 0.0983
Heterozygous 0.2885
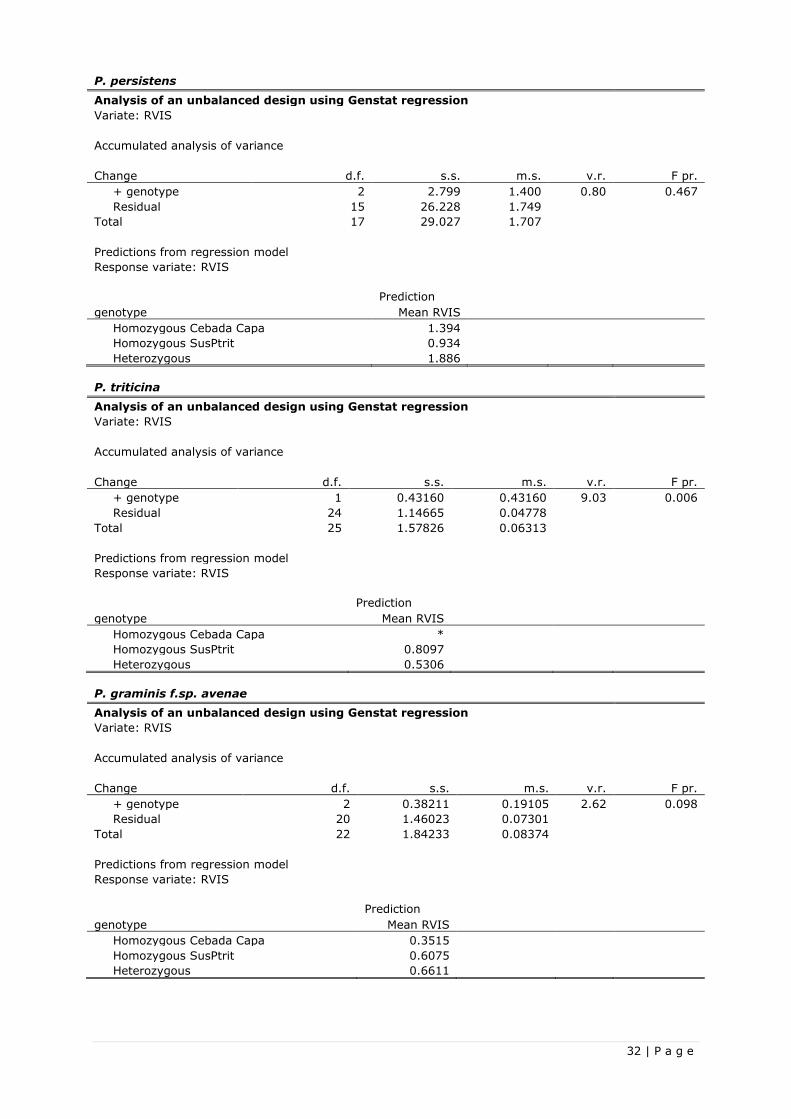
32 | P a g e
P. persistens
Analysis of an unbalanced design using Genstat regression
Variate: RVIS Accumulated analysis of variance
Change d.f. s.s. m.s. v.r. F pr.
+ genotype 2 2.799 1.400 0.80 0.467
Residual 15 26.228 1.749
Total 17 29.027 1.707
Predictions from regression model Response variate: RVIS
Prediction
genotype Mean RVIS Homozygous Cebada Capa 1.394 Homozygous SusPtrit 0.934 Heterozygous 1.886
P. triticina
Analysis of an unbalanced design using Genstat regression Variate: RVIS
Accumulated analysis of variance
Change d.f. s.s. m.s. v.r. F pr.
+ genotype 1 0.43160 0.43160 9.03 0.006
Residual 24 1.14665 0.04778
Total 25 1.57826 0.06313
Predictions from regression model Response variate: RVIS
Prediction
genotype Mean RVIS Homozygous Cebada Capa * Homozygous SusPtrit 0.8097 Heterozygous 0.5306
P. graminis f.sp. avenae
Analysis of an unbalanced design using Genstat regression Variate: RVIS
Accumulated analysis of variance
Change d.f. s.s. m.s. v.r. F pr.
+ genotype 2 0.38211 0.19105 2.62 0.098
Residual 20 1.46023 0.07301
Total 22 1.84233 0.08374
Predictions from regression model
Response variate: RVIS
Prediction
genotype Mean RVIS Homozygous Cebada Capa 0.3515 Homozygous SusPtrit 0.6075 Heterozygous 0.6611
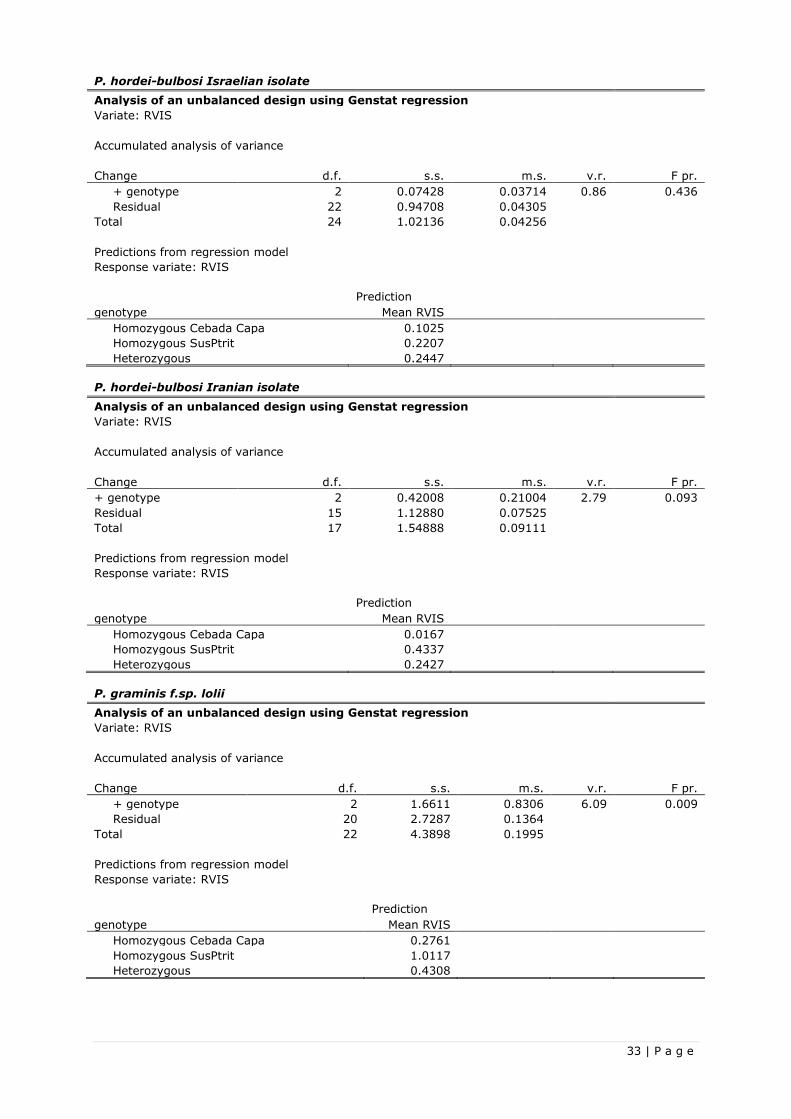
33 | P a g e
P. hordei-bulbosi Israelian isolate
Analysis of an unbalanced design using Genstat regression
Variate: RVIS Accumulated analysis of variance
Change d.f. s.s. m.s. v.r. F pr.
+ genotype 2 0.07428 0.03714 0.86 0.436
Residual 22 0.94708 0.04305
Total 24 1.02136 0.04256
Predictions from regression model Response variate: RVIS
Prediction
genotype Mean RVIS Homozygous Cebada Capa 0.1025 Homozygous SusPtrit 0.2207 Heterozygous 0.2447
P. hordei-bulbosi Iranian isolate
Analysis of an unbalanced design using Genstat regression Variate: RVIS
Accumulated analysis of variance
Change d.f. s.s. m.s. v.r. F pr.
+ genotype 2 0.42008 0.21004 2.79 0.093
Residual 15 1.12880 0.07525
Total 17 1.54888 0.09111
Predictions from regression model
Response variate: RVIS
Prediction
genotype Mean RVIS Homozygous Cebada Capa 0.0167 Homozygous SusPtrit 0.4337 Heterozygous 0.2427
P. graminis f.sp. lolii
Analysis of an unbalanced design using Genstat regression Variate: RVIS
Accumulated analysis of variance
Change d.f. s.s. m.s. v.r. F pr.
+ genotype 2 1.6611 0.8306 6.09 0.009
Residual 20 2.7287 0.1364
Total 22 4.3898 0.1995
Predictions from regression model Response variate: RVIS
Prediction
genotype Mean RVIS Homozygous Cebada Capa 0.2761 Homozygous SusPtrit 1.0117 Heterozygous 0.4308
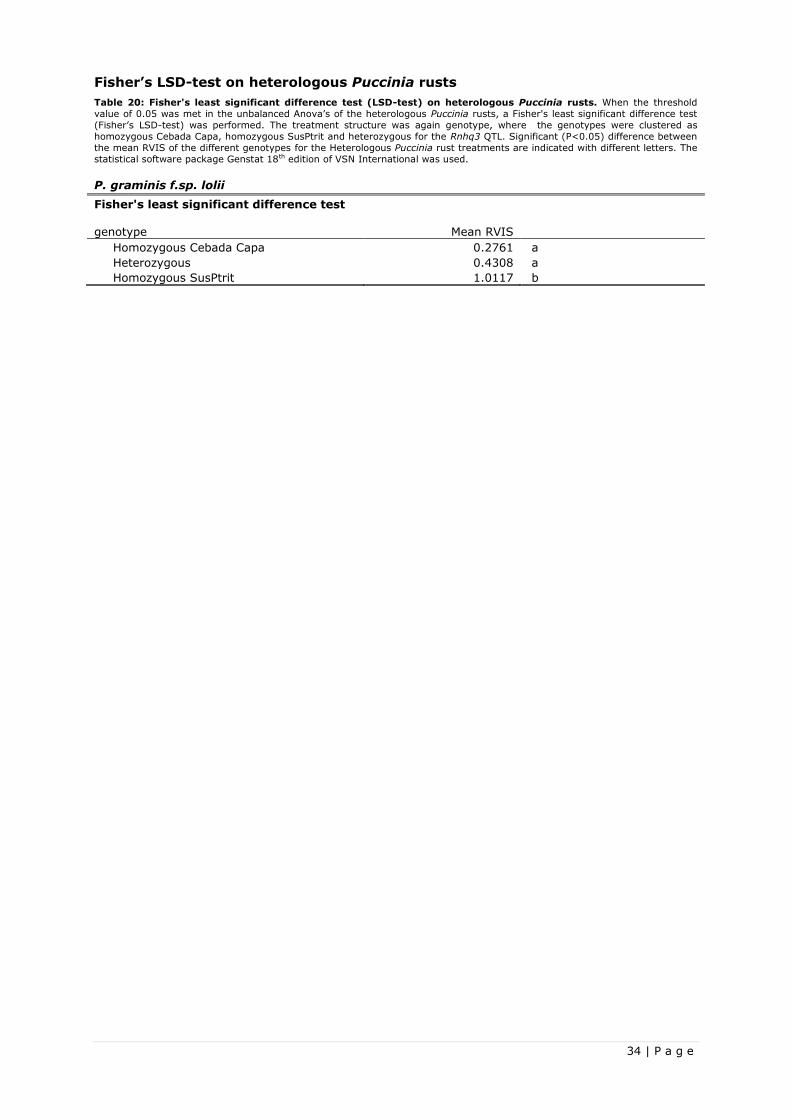
34 | P a g e
Fisher’s LSD-test on heterologous Puccinia rusts
Table 20: Fisher's least significant difference test (LSD-test) on heterologous Puccinia rusts. When the threshold
value of 0.05 was met in the unbalanced Anova’s of the heterologous Puccinia rusts, a Fisher's least significant difference test
(Fisher’s LSD-test) was performed. The treatment structure was again genotype, where the genotypes were clustered as
homozygous Cebada Capa, homozygous SusPtrit and heterozygous for the Rnhq3 QTL. Significant (P<0.05) difference between
the mean RVIS of the different genotypes for the Heterologous Puccinia rust treatments are indicated with different letters. The
statistical software package Genstat 18th edition of VSN International was used.
P. graminis f.sp. lolii
Fisher's least significant difference test genotype Mean RVIS
Homozygous Cebada Capa 0.2761 a
Heterozygous 0.4308 a
Homozygous SusPtrit 1.0117 b
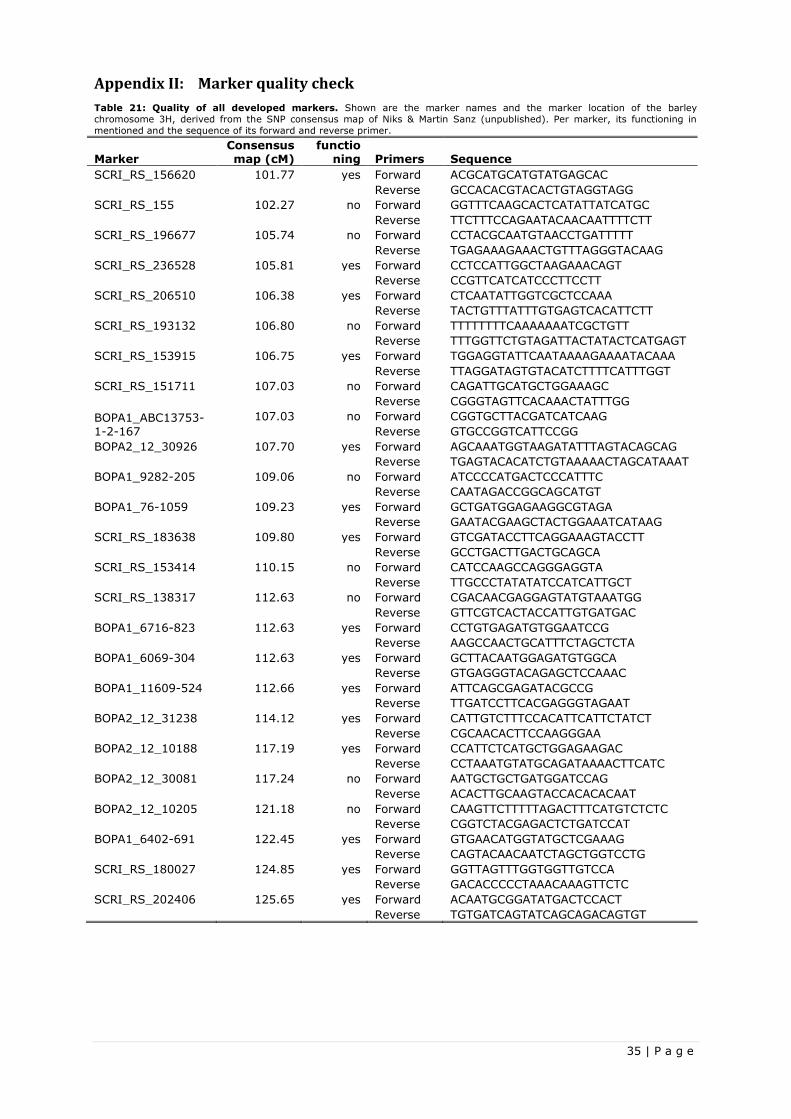
35 | P a g e
Appendix II: Marker quality check
Table 21: Quality of all developed markers. Shown are the marker names and the marker location of the barley
chromosome 3H, derived from the SNP consensus map of Niks & Martin Sanz (unpublished). Per marker, its functioning in
mentioned and the sequence of its forward and reverse primer.
Marker Consensus map (cM)
functioning Primers Sequence
SCRI_RS_156620 101.77 yes Forward ACGCATGCATGTATGAGCAC
Reverse GCCACACGTACACTGTAGGTAGG
SCRI_RS_155 102.27 no Forward GGTTTCAAGCACTCATATTATCATGC
Reverse TTCTTTCCAGAATACAACAATTTTCTT
SCRI_RS_196677 105.74 no Forward CCTACGCAATGTAACCTGATTTTT
Reverse TGAGAAAGAAACTGTTTAGGGTACAAG
SCRI_RS_236528 105.81 yes Forward CCTCCATTGGCTAAGAAACAGT
Reverse CCGTTCATCATCCCTTCCTT
SCRI_RS_206510 106.38 yes Forward CTCAATATTGGTCGCTCCAAA
Reverse TACTGTTTATTTGTGAGTCACATTCTT
SCRI_RS_193132 106.80 no Forward TTTTTTTTCAAAAAAATCGCTGTT
Reverse TTTGGTTCTGTAGATTACTATACTCATGAGT
SCRI_RS_153915 106.75 yes Forward TGGAGGTATTCAATAAAAGAAAATACAAA
Reverse TTAGGATAGTGTACATCTTTTCATTTGGT
SCRI_RS_151711 107.03 no Forward CAGATTGCATGCTGGAAAGC
Reverse CGGGTAGTTCACAAACTATTTGG
BOPA1_ABC13753-1-2-167
107.03 no Forward CGGTGCTTACGATCATCAAG
Reverse GTGCCGGTCATTCCGG
BOPA2_12_30926 107.70 yes Forward AGCAAATGGTAAGATATTTAGTACAGCAG
Reverse TGAGTACACATCTGTAAAAACTAGCATAAAT
BOPA1_9282-205 109.06 no Forward ATCCCCATGACTCCCATTTC
Reverse CAATAGACCGGCAGCATGT
BOPA1_76-1059 109.23 yes Forward GCTGATGGAGAAGGCGTAGA
Reverse GAATACGAAGCTACTGGAAATCATAAG
SCRI_RS_183638 109.80 yes Forward GTCGATACCTTCAGGAAAGTACCTT
Reverse GCCTGACTTGACTGCAGCA
SCRI_RS_153414 110.15 no Forward CATCCAAGCCAGGGAGGTA
Reverse TTGCCCTATATATCCATCATTGCT
SCRI_RS_138317 112.63 no Forward CGACAACGAGGAGTATGTAAATGG
Reverse GTTCGTCACTACCATTGTGATGAC
BOPA1_6716-823 112.63 yes Forward CCTGTGAGATGTGGAATCCG
Reverse AAGCCAACTGCATTTCTAGCTCTA
BOPA1_6069-304 112.63 yes Forward GCTTACAATGGAGATGTGGCA
Reverse GTGAGGGTACAGAGCTCCAAAC
BOPA1_11609-524 112.66 yes Forward ATTCAGCGAGATACGCCG
Reverse TTGATCCTTCACGAGGGTAGAAT
BOPA2_12_31238 114.12 yes Forward CATTGTCTTTCCACATTCATTCTATCT
Reverse CGCAACACTTCCAAGGGAA
BOPA2_12_10188 117.19 yes Forward CCATTCTCATGCTGGAGAAGAC
Reverse CCTAAATGTATGCAGATAAAACTTCATC
BOPA2_12_30081 117.24 no Forward AATGCTGCTGATGGATCCAG
Reverse ACACTTGCAAGTACCACACACAAT
BOPA2_12_10205 121.18 no Forward CAAGTTCTTTTTAGACTTTCATGTCTCTC
Reverse CGGTCTACGAGACTCTGATCCAT
BOPA1_6402-691 122.45 yes Forward GTGAACATGGTATGCTCGAAAG
Reverse CAGTACAACAATCTAGCTGGTCCTG
SCRI_RS_180027 124.85 yes Forward GGTTAGTTTGGTGGTTGTCCA
Reverse GACACCCCCTAAACAAAGTTCTC
SCRI_RS_202406 125.65 yes Forward ACAATGCGGATATGACTCCACT
Reverse TGTGATCAGTATCAGCAGACAGTGT

36 | P a g e
Appendix III: ANOVA and Fisher’s LSD-test for recombinant based fine-mapping
Table 22: Outcome of the unbalanced analysis of variance (ANOVA) and Fisher's least significant difference test
(LSD-test) of the recombinant based fine-mapping. The tested rust was P. graminis f.sp. Lolii. The variate RVIS was
tested against the treatment structure genotype. The genotypes were clustered as homozygous Cebada Capa, homozygous
SusPtrit and heterozygous for the Rnhq3 QTL. Recombinant plants were left out, as they could not be grouped in one of the
genotypes. Significant (P<0.05) difference between the mean RVIS of the different genotypes are indicated with different letters in the LSD-test. The statistical software package Genstat 18th edition of VSN International was used
P. graminis f.sp. lolii
Analysis of an unbalanced design using Genstat regression
Variate: RVIS_per_box
Accumulated analysis of variance
Change d.f. s.s. m.s. v.r. F pr.
+ box 3 1.3067 0.4356 2.68 0.053
+ genotype 2 2.1778 1.0889 6.71 0.002
Residual 72 11.6813 0.1622
Total 77 15.1659 0.1970
Predictions from regression model
Response variate: RVIS
Prediction
genotype Mean RVIS Homozygous Cebada Capa 0.4975 Homozygous SusPtrit 0.9159 Heterozygous 0.5597
Fisher's least significant difference test
genotype Mean RVIS
Homozygous Cebada Capa 0.4975 b
Heterozygous 0.5597 b
Homozygous SusPtrit 0.9159 c
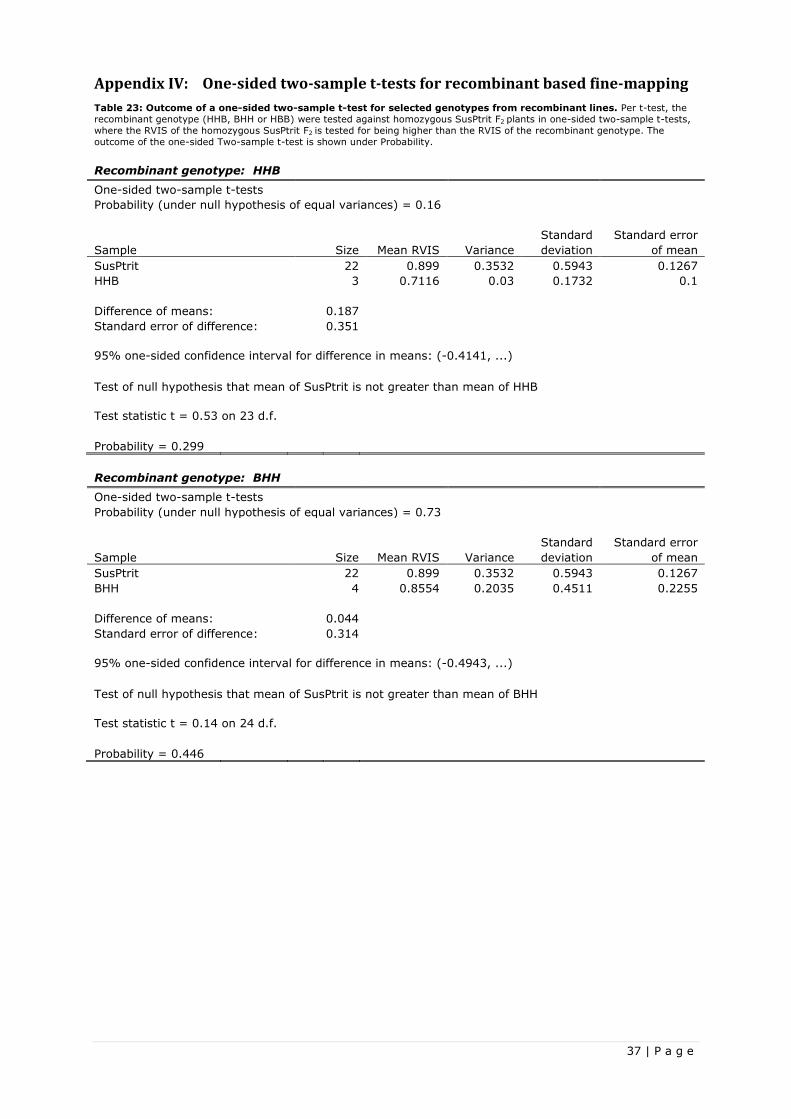
37 | P a g e
Appendix IV: One-sided two-sample t-tests for recombinant based fine-mapping
Table 23: Outcome of a one-sided two-sample t-test for selected genotypes from recombinant lines. Per t-test, the
recombinant genotype (HHB, BHH or HBB) were tested against homozygous SusPtrit F2 plants in one-sided two-sample t-tests,
where the RVIS of the homozygous SusPtrit F2 is tested for being higher than the RVIS of the recombinant genotype. The
outcome of the one-sided Two-sample t-test is shown under Probability.
Recombinant genotype: HHB
One-sided two-sample t-tests Probability (under null hypothesis of equal variances) = 0.16
Standard Standard error
Sample Size Mean RVIS Variance deviation of mean
SusPtrit 22 0.899 0.3532 0.5943 0.1267
HHB 3 0.7116 0.03 0.1732 0.1
Difference of means: 0.187
Standard error of difference: 0.351
95% one-sided confidence interval for difference in means: (-0.4141, ...)
Test of null hypothesis that mean of SusPtrit is not greater than mean of HHB
Test statistic t = 0.53 on 23 d.f.
Probability = 0.299
Recombinant genotype: BHH
One-sided two-sample t-tests Probability (under null hypothesis of equal variances) = 0.73
Standard Standard error
Sample Size Mean RVIS Variance deviation of mean
SusPtrit 22 0.899 0.3532 0.5943 0.1267
BHH 4 0.8554 0.2035 0.4511 0.2255
Difference of means: 0.044
Standard error of difference: 0.314
95% one-sided confidence interval for difference in means: (-0.4943, ...)
Test of null hypothesis that mean of SusPtrit is not greater than mean of BHH
Test statistic t = 0.14 on 24 d.f.
Probability = 0.446
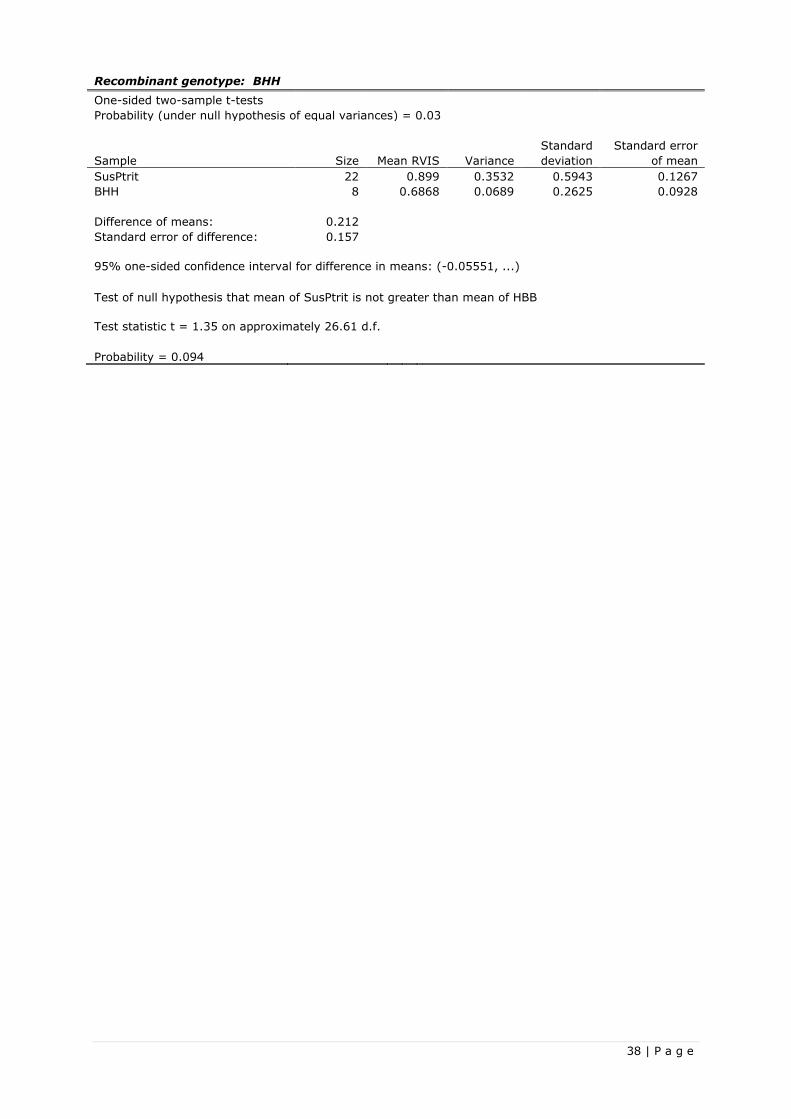
38 | P a g e
Recombinant genotype: BHH
One-sided two-sample t-tests
Probability (under null hypothesis of equal variances) = 0.03
Standard Standard error
Sample Size Mean RVIS Variance deviation of mean
SusPtrit 22 0.899 0.3532 0.5943 0.1267
BHH 8 0.6868 0.0689 0.2625 0.0928
Difference of means: 0.212
Standard error of difference: 0.157
95% one-sided confidence interval for difference in means: (-0.05551, ...)
Test of null hypothesis that mean of SusPtrit is not greater than mean of HBB
Test statistic t = 1.35 on approximately 26.61 d.f.
Probability = 0.094
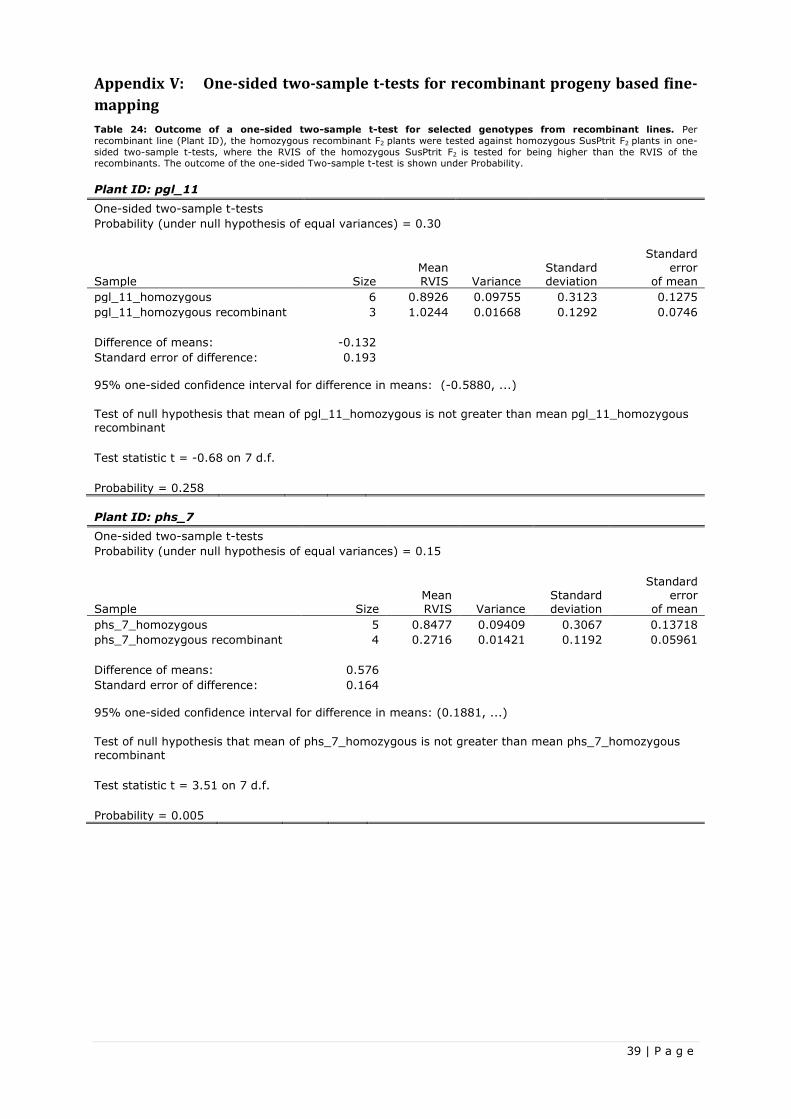
39 | P a g e
Appendix V: One-sided two-sample t-tests for recombinant progeny based fine-
mapping
Table 24: Outcome of a one-sided two-sample t-test for selected genotypes from recombinant lines. Per
recombinant line (Plant ID), the homozygous recombinant F2 plants were tested against homozygous SusPtrit F2 plants in one-
sided two-sample t-tests, where the RVIS of the homozygous SusPtrit F2 is tested for being higher than the RVIS of the recombinants. The outcome of the one-sided Two-sample t-test is shown under Probability.
Plant ID: pgl_11
One-sided two-sample t-tests Probability (under null hypothesis of equal variances) = 0.30
Standard deviation
Standard
error of mean Sample Size
Mean RVIS Variance
pgl_11_homozygous 6 0.8926 0.09755 0.3123 0.1275
pgl_11_homozygous recombinant 3 1.0244 0.01668 0.1292 0.0746
Difference of means: -0.132
Standard error of difference: 0.193
95% one-sided confidence interval for difference in means: (-0.5880, ...)
Test of null hypothesis that mean of pgl_11_homozygous is not greater than mean pgl_11_homozygous recombinant
Test statistic t = -0.68 on 7 d.f.
Probability = 0.258
Plant ID: phs_7
One-sided two-sample t-tests Probability (under null hypothesis of equal variances) = 0.15
Standard deviation
Standard error
of mean Sample Size Mean RVIS Variance
phs_7_homozygous 5 0.8477 0.09409 0.3067 0.13718
phs_7_homozygous recombinant 4 0.2716 0.01421 0.1192 0.05961
Difference of means: 0.576
Standard error of difference: 0.164
95% one-sided confidence interval for difference in means: (0.1881, ...)
Test of null hypothesis that mean of phs_7_homozygous is not greater than mean phs_7_homozygous recombinant
Test statistic t = 3.51 on 7 d.f.
Probability = 0.005
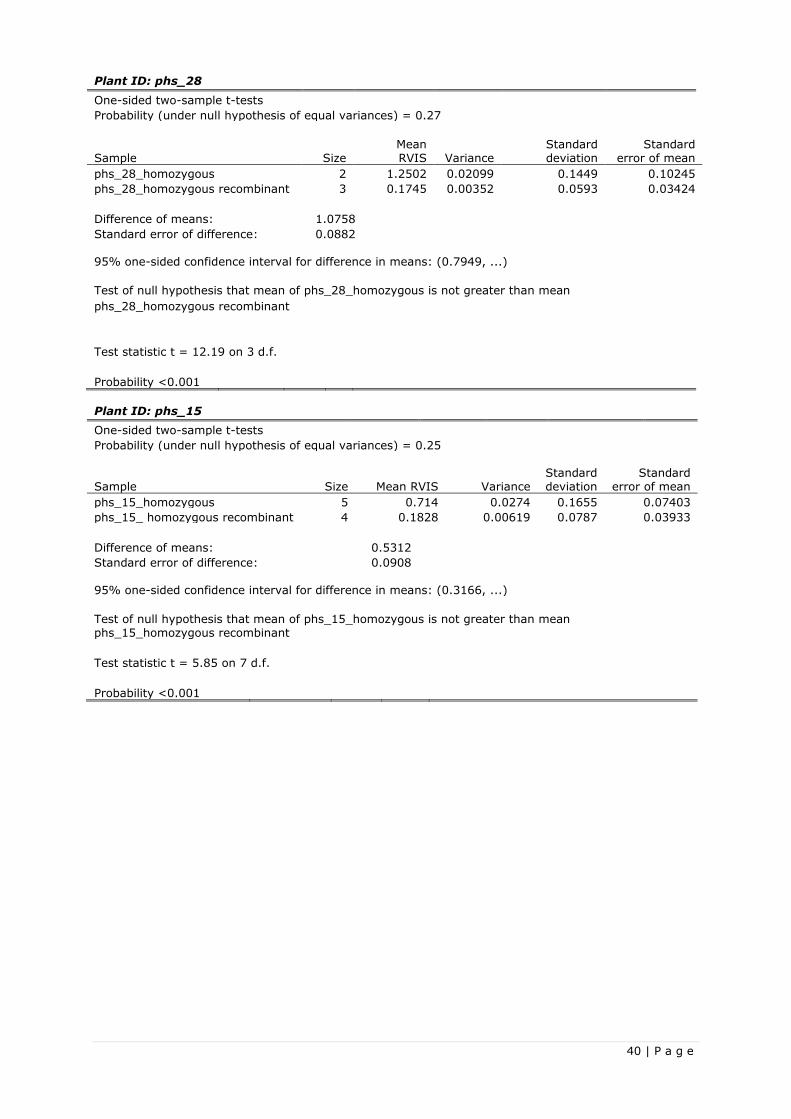
40 | P a g e
Plant ID: phs_28
One-sided two-sample t-tests
Probability (under null hypothesis of equal variances) = 0.27
Sample Size Mean RVIS
Variance
Standard deviation
Standard error of mean
phs_28_homozygous 2 1.2502 0.02099 0.1449 0.10245
phs_28_homozygous recombinant 3 0.1745 0.00352 0.0593 0.03424
Difference of means: 1.0758
Standard error of difference: 0.0882
95% one-sided confidence interval for difference in means: (0.7949, ...)
Test of null hypothesis that mean of phs_28_homozygous is not greater than mean
phs_28_homozygous recombinant
Test statistic t = 12.19 on 3 d.f.
Probability <0.001
Plant ID: phs_15
One-sided two-sample t-tests Probability (under null hypothesis of equal variances) = 0.25
Sample Size Mean RVIS Variance
Standard deviation
Standard error of mean
phs_15_homozygous 5 0.714 0.0274 0.1655 0.07403
phs_15_ homozygous recombinant 4 0.1828 0.00619 0.0787 0.03933
Difference of means: 0.5312
Standard error of difference: 0.0908
95% one-sided confidence interval for difference in means: (0.3166, ...)
Test of null hypothesis that mean of phs_15_homozygous is not greater than mean phs_15_homozygous recombinant
Test statistic t = 5.85 on 7 d.f.
Probability <0.001
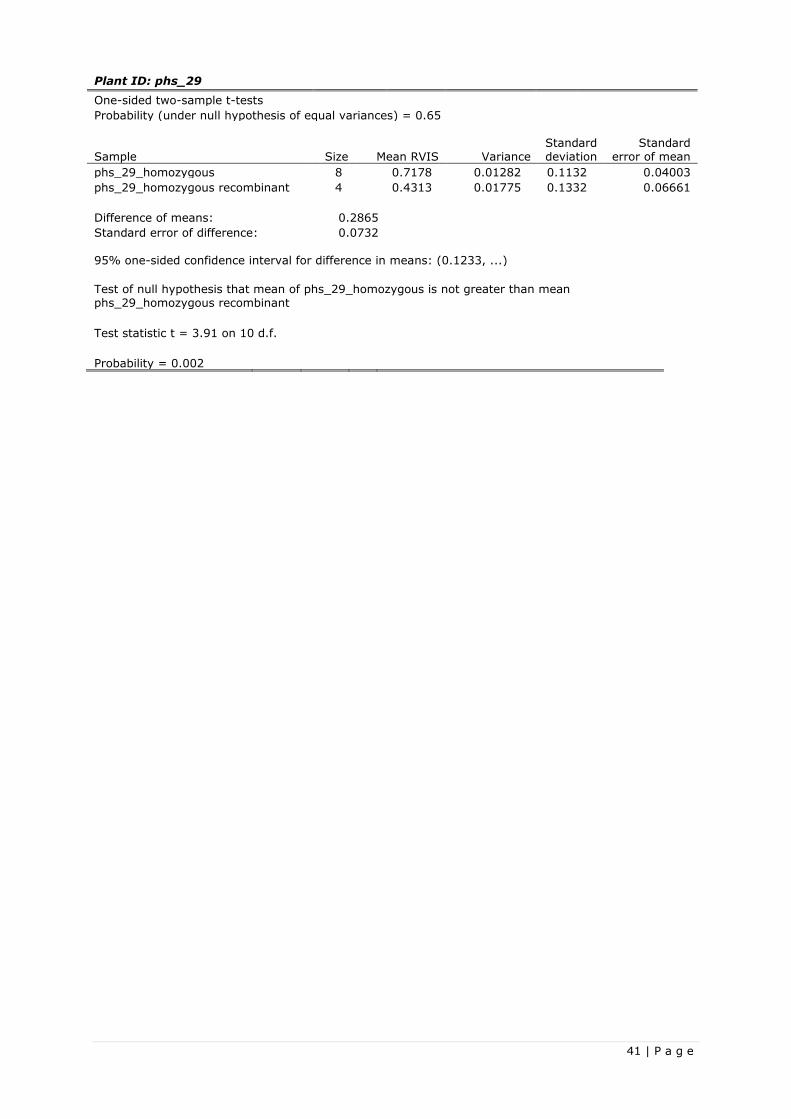
41 | P a g e
Plant ID: phs_29
One-sided two-sample t-tests
Probability (under null hypothesis of equal variances) = 0.65
Sample Size Mean RVIS Variance
Standard deviation
Standard error of mean
phs_29_homozygous 8 0.7178 0.01282 0.1132 0.04003
phs_29_homozygous recombinant 4 0.4313 0.01775 0.1332 0.06661
Difference of means: 0.2865
Standard error of difference: 0.0732
95% one-sided confidence interval for difference in means: (0.1233, ...)
Test of null hypothesis that mean of phs_29_homozygous is not greater than mean phs_29_homozygous recombinant
Test statistic t = 3.91 on 10 d.f.
Probability = 0.002
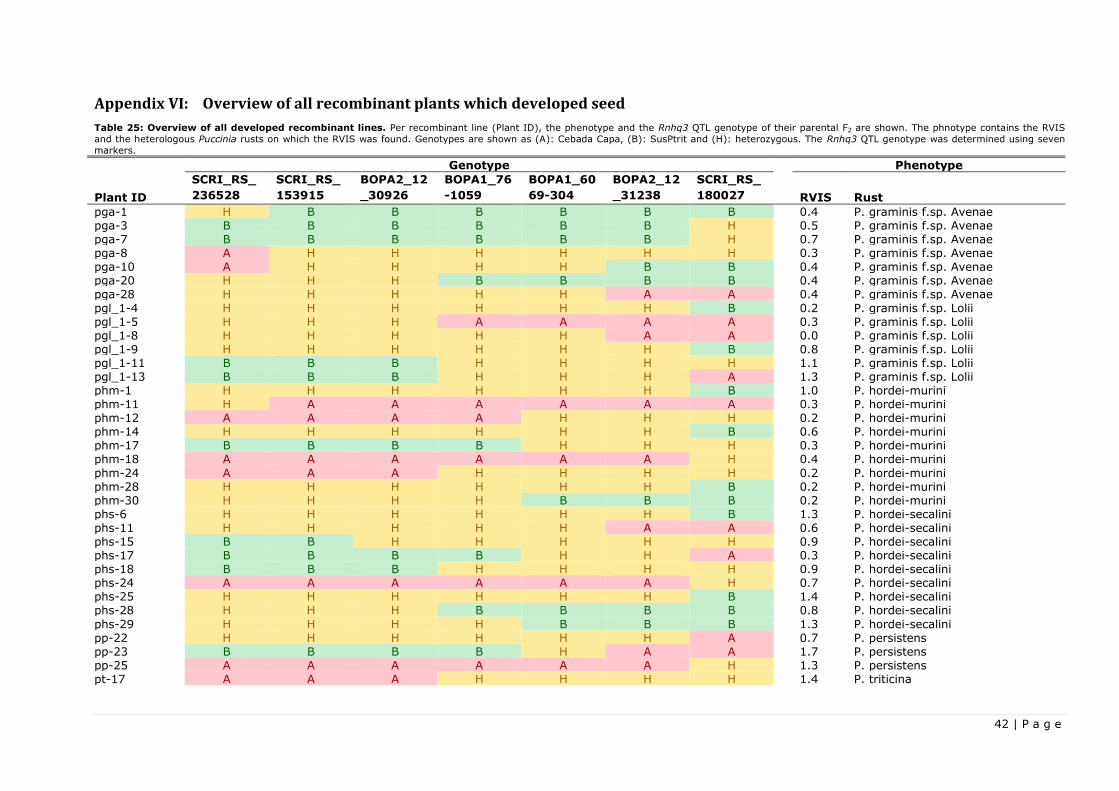
42 | P a g e
Appendix VI: Overview of all recombinant plants which developed seed
Table 25: Overview of all developed recombinant lines. Per recombinant line (Plant ID), the phenotype and the Rnhq3 QTL genotype of their parental F2 are shown. The phnotype contains the RVIS
and the heterologous Puccinia rusts on which the RVIS was found. Genotypes are shown as (A): Cebada Capa, (B): SusPtrit and (H): heterozygous. The Rnhq3 QTL genotype was determined using seven
markers.
Genotype Phenotype
Plant ID
SCRI_RS_
236528
SCRI_RS_
153915
BOPA2_12
_30926
BOPA1_76
-1059
BOPA1_60
69-304
BOPA2_12
_31238
SCRI_RS_
180027 RVIS Rust
pga-1 H B B B B B B 0.4 P. graminis f.sp. Avenae pga-3 B B B B B B H 0.5 P. graminis f.sp. Avenae pga-7 B B B B B B H 0.7 P. graminis f.sp. Avenae pga-8 A H H H H H H 0.3 P. graminis f.sp. Avenae pga-10 A H H H H B B 0.4 P. graminis f.sp. Avenae pga-20 H H H B B B B 0.4 P. graminis f.sp. Avenae pga-28 H H H H H A A 0.4 P. graminis f.sp. Avenae
pgl_1-4 H H H H H H B 0.2 P. graminis f.sp. Lolii pgl_1-5 H H H A A A A 0.3 P. graminis f.sp. Lolii pgl_1-8 H H H H H A A 0.0 P. graminis f.sp. Lolii pgl_1-9 H H H H H H B 0.8 P. graminis f.sp. Lolii pgl_1-11 B B B H H H H 1.1 P. graminis f.sp. Lolii pgl_1-13 B B B H H H A 1.3 P. graminis f.sp. Lolii phm-1 H H H H H H B 1.0 P. hordei-murini phm-11 H A A A A A A 0.3 P. hordei-murini phm-12 A A A A H H H 0.2 P. hordei-murini phm-14 H H H H H H B 0.6 P. hordei-murini phm-17 B B B B H H H 0.3 P. hordei-murini phm-18 A A A A A A H 0.4 P. hordei-murini
phm-24 A A A H H H H 0.2 P. hordei-murini phm-28 H H H H H H B 0.2 P. hordei-murini phm-30 H H H H B B B 0.2 P. hordei-murini phs-6 H H H H H H B 1.3 P. hordei-secalini phs-11 H H H H H A A 0.6 P. hordei-secalini phs-15 B B H H H H H 0.9 P. hordei-secalini phs-17 B B B B H H A 0.3 P. hordei-secalini phs-18 B B B H H H H 0.9 P. hordei-secalini phs-24 A A A A A A H 0.7 P. hordei-secalini phs-25 H H H H H H B 1.4 P. hordei-secalini phs-28 H H H B B B B 0.8 P. hordei-secalini
phs-29 H H H H B B B 1.3 P. hordei-secalini pp-22 H H H H H H A 0.7 P. persistens pp-23 B B B B H A A 1.7 P. persistens pp-25 A A A A A A H 1.3 P. persistens pt-17 A A A H H H H 1.4 P. triticina
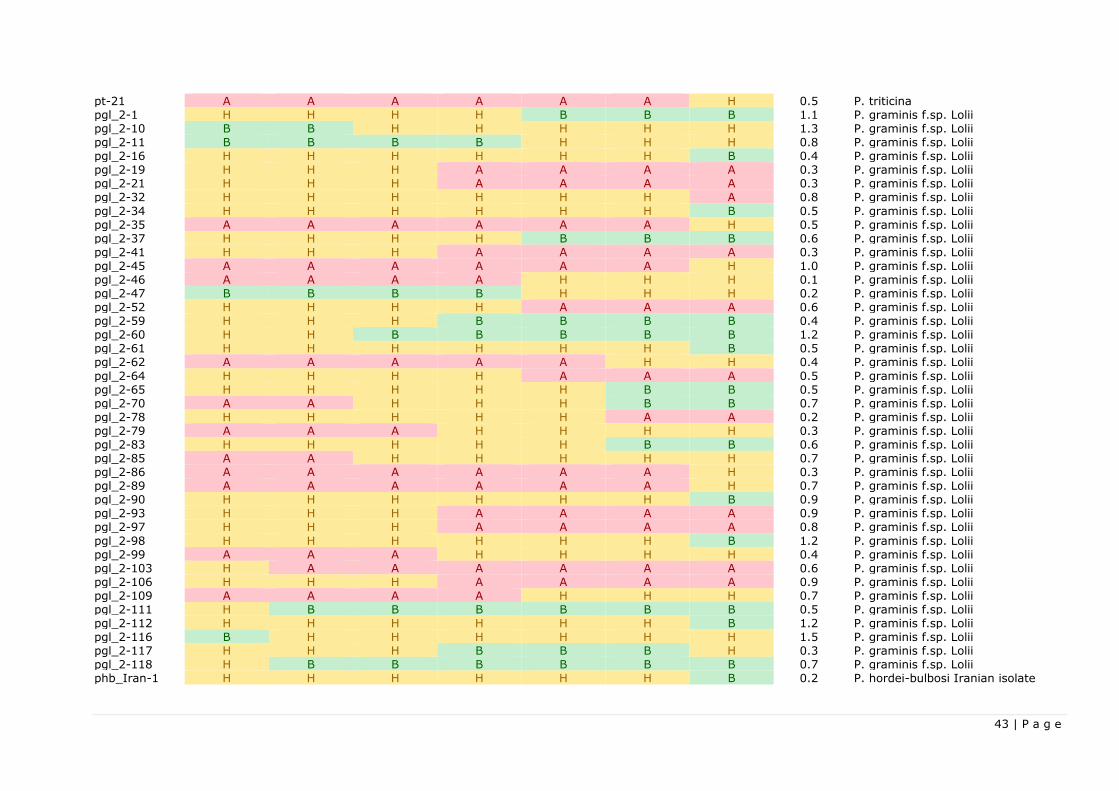
43 | P a g e
pt-21 A A A A A A H 0.5 P. triticina pgl_2-1 H H H H B B B 1.1 P. graminis f.sp. Lolii pgl_2-10 B B H H H H H 1.3 P. graminis f.sp. Lolii pgl_2-11 B B B B H H H 0.8 P. graminis f.sp. Lolii pgl_2-16 H H H H H H B 0.4 P. graminis f.sp. Lolii pgl_2-19 H H H A A A A 0.3 P. graminis f.sp. Lolii pgl_2-21 H H H A A A A 0.3 P. graminis f.sp. Lolii pgl_2-32 H H H H H H A 0.8 P. graminis f.sp. Lolii
pgl_2-34 H H H H H H B 0.5 P. graminis f.sp. Lolii pgl_2-35 A A A A A A H 0.5 P. graminis f.sp. Lolii pgl_2-37 H H H H B B B 0.6 P. graminis f.sp. Lolii pgl_2-41 H H H A A A A 0.3 P. graminis f.sp. Lolii pgl_2-45 A A A A A A H 1.0 P. graminis f.sp. Lolii pgl_2-46 A A A A H H H 0.1 P. graminis f.sp. Lolii pgl_2-47 B B B B H H H 0.2 P. graminis f.sp. Lolii pgl_2-52 H H H H A A A 0.6 P. graminis f.sp. Lolii pgl_2-59 H H H B B B B 0.4 P. graminis f.sp. Lolii pgl_2-60 H H B B B B B 1.2 P. graminis f.sp. Lolii pgl_2-61 H H H H H H B 0.5 P. graminis f.sp. Lolii pgl_2-62 A A A A A H H 0.4 P. graminis f.sp. Lolii
pgl_2-64 H H H H A A A 0.5 P. graminis f.sp. Lolii pgl_2-65 H H H H H B B 0.5 P. graminis f.sp. Lolii pgl_2-70 A A H H H B B 0.7 P. graminis f.sp. Lolii pgl_2-78 H H H H H A A 0.2 P. graminis f.sp. Lolii pgl_2-79 A A A H H H H 0.3 P. graminis f.sp. Lolii pgl_2-83 H H H H H B B 0.6 P. graminis f.sp. Lolii pgl_2-85 A A H H H H H 0.7 P. graminis f.sp. Lolii pgl_2-86 A A A A A A H 0.3 P. graminis f.sp. Lolii pgl_2-89 A A A A A A H 0.7 P. graminis f.sp. Lolii pgl_2-90 H H H H H H B 0.9 P. graminis f.sp. Lolii pgl_2-93 H H H A A A A 0.9 P. graminis f.sp. Lolii pgl_2-97 H H H A A A A 0.8 P. graminis f.sp. Lolii
pgl_2-98 H H H H H H B 1.2 P. graminis f.sp. Lolii pgl_2-99 A A A H H H H 0.4 P. graminis f.sp. Lolii pgl_2-103 H A A A A A A 0.6 P. graminis f.sp. Lolii pgl_2-106 H H H A A A A 0.9 P. graminis f.sp. Lolii pgl_2-109 A A A A H H H 0.7 P. graminis f.sp. Lolii pgl_2-111 H B B B B B B 0.5 P. graminis f.sp. Lolii pgl_2-112 H H H H H H B 1.2 P. graminis f.sp. Lolii pgl_2-116 B H H H H H H 1.5 P. graminis f.sp. Lolii pgl_2-117 H H H B B B H 0.3 P. graminis f.sp. Lolii pgl_2-118 H B B B B B B 0.7 P. graminis f.sp. Lolii phb_Iran-1 H H H H H H B 0.2 P. hordei-bulbosi Iranian isolate
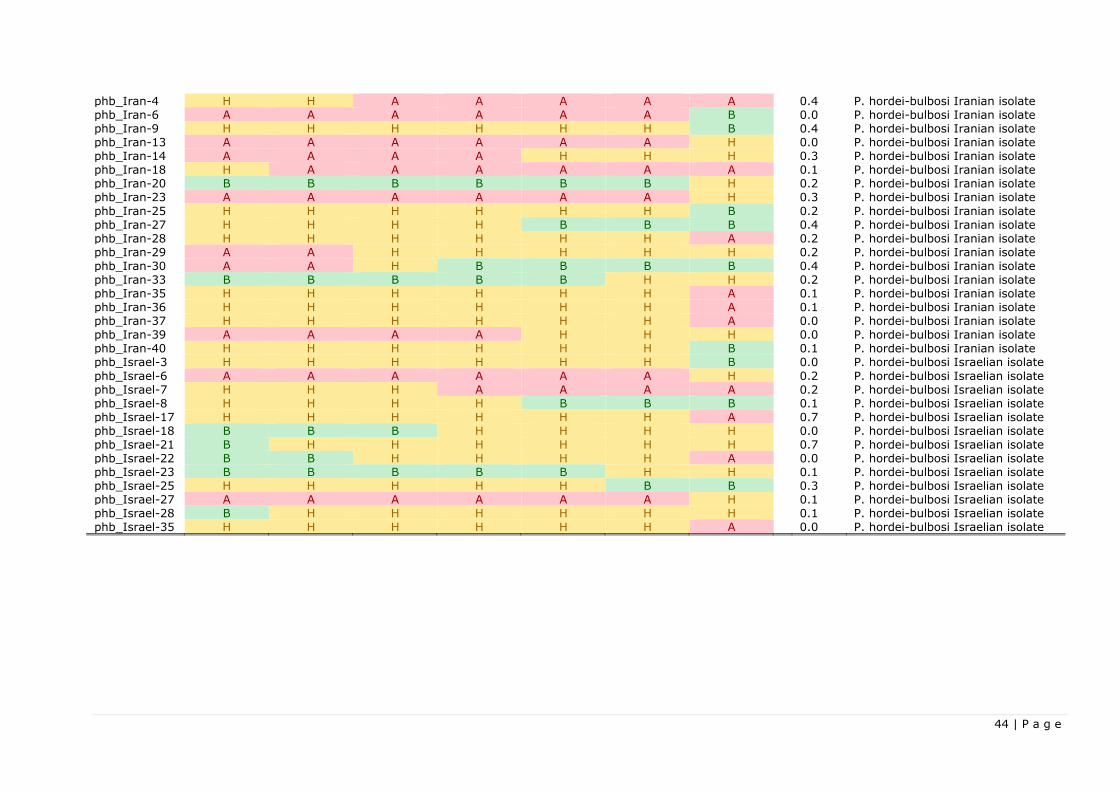
44 | P a g e
phb_Iran-4 H H A A A A A 0.4 P. hordei-bulbosi Iranian isolate phb_Iran-6 A A A A A A B 0.0 P. hordei-bulbosi Iranian isolate phb_Iran-9 H H H H H H B 0.4 P. hordei-bulbosi Iranian isolate phb_Iran-13 A A A A A A H 0.0 P. hordei-bulbosi Iranian isolate phb_Iran-14 A A A A H H H 0.3 P. hordei-bulbosi Iranian isolate phb_Iran-18 H A A A A A A 0.1 P. hordei-bulbosi Iranian isolate phb_Iran-20 B B B B B B H 0.2 P. hordei-bulbosi Iranian isolate phb_Iran-23 A A A A A A H 0.3 P. hordei-bulbosi Iranian isolate
phb_Iran-25 H H H H H H B 0.2 P. hordei-bulbosi Iranian isolate phb_Iran-27 H H H H B B B 0.4 P. hordei-bulbosi Iranian isolate phb_Iran-28 H H H H H H A 0.2 P. hordei-bulbosi Iranian isolate phb_Iran-29 A A H H H H H 0.2 P. hordei-bulbosi Iranian isolate phb_Iran-30 A A H B B B B 0.4 P. hordei-bulbosi Iranian isolate phb_Iran-33 B B B B B H H 0.2 P. hordei-bulbosi Iranian isolate phb_Iran-35 H H H H H H A 0.1 P. hordei-bulbosi Iranian isolate phb_Iran-36 H H H H H H A 0.1 P. hordei-bulbosi Iranian isolate phb_Iran-37 H H H H H H A 0.0 P. hordei-bulbosi Iranian isolate phb_Iran-39 A A A A H H H 0.0 P. hordei-bulbosi Iranian isolate phb_Iran-40 H H H H H H B 0.1 P. hordei-bulbosi Iranian isolate phb_Israel-3 H H H H H H B 0.0 P. hordei-bulbosi Israelian isolate
phb_Israel-6 A A A A A A H 0.2 P. hordei-bulbosi Israelian isolate phb_Israel-7 H H H A A A A 0.2 P. hordei-bulbosi Israelian isolate phb_Israel-8 H H H H B B B 0.1 P. hordei-bulbosi Israelian isolate phb_Israel-17 H H H H H H A 0.7 P. hordei-bulbosi Israelian isolate phb_Israel-18 B B B H H H H 0.0 P. hordei-bulbosi Israelian isolate phb_Israel-21 B H H H H H H 0.7 P. hordei-bulbosi Israelian isolate phb_Israel-22 B B H H H H A 0.0 P. hordei-bulbosi Israelian isolate phb_Israel-23 B B B B B H H 0.1 P. hordei-bulbosi Israelian isolate phb_Israel-25 H H H H H B B 0.3 P. hordei-bulbosi Israelian isolate phb_Israel-27 A A A A A A H 0.1 P. hordei-bulbosi Israelian isolate phb_Israel-28 B H H H H H H 0.1 P. hordei-bulbosi Israelian isolate phb_Israel-35 H H H H H H A 0.0 P. hordei-bulbosi Israelian isolate