Embed Size (px)
Citation preview

Acquisition with Shrinking Resources
“Giving More & Growing Less?”
Jenness B. Simler
U.S. House of Representatives
Committee on Armed Services
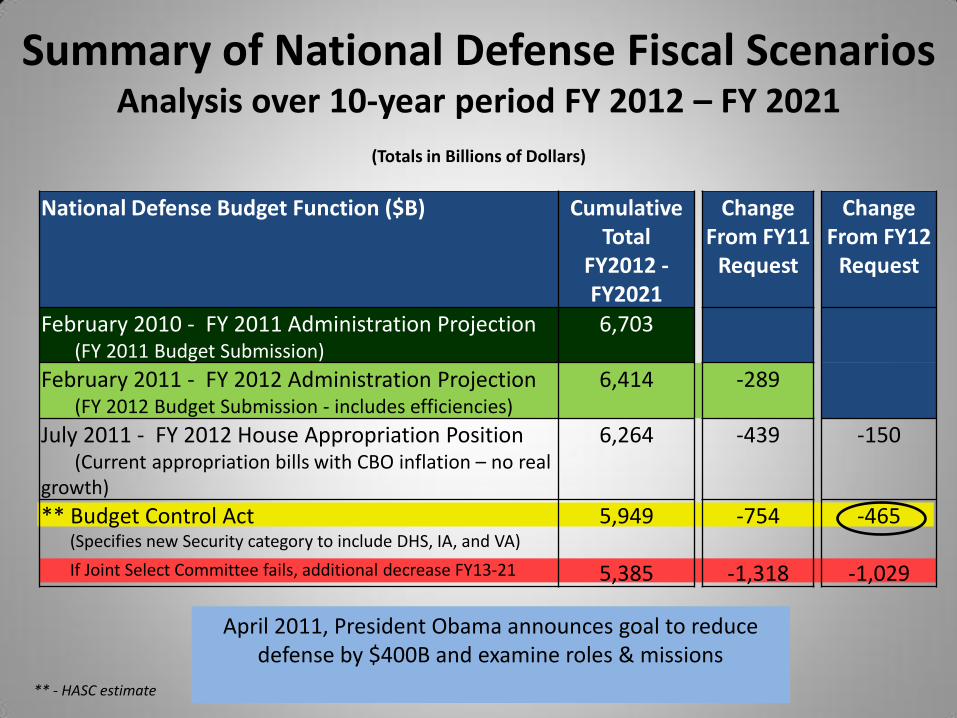
National Defense Budget Function ($B) Cumulative Total
FY2012 - FY2021
Change From FY11
Request
Change From FY12
Request
February 2010 - FY 2011 Administration Projection (FY 2011 Budget Submission)
6,703
February 2011 - FY 2012 Administration Projection (FY 2012 Budget Submission - includes efficiencies)
6,414 -289
July 2011 - FY 2012 House Appropriation Position (Current appropriation bills with CBO inflation – no real growth)
6,264 -439 -150
** Budget Control Act (Specifies new Security category to include DHS, IA, and VA) If Joint Select Committee fails, additional decrease FY13-21
5,949
5,385
-754
-1,318
-465
-1,029
Summary of National Defense Fiscal Scenarios Analysis over 10-year period FY 2012 – FY 2021
(Totals in Billions of Dollars)
** - HASC estimate
April 2011, President Obama announces goal to reduce defense by $400B and examine roles & missions

Budget Control Act - Title I
• Defines “Security Category” for first time
• Sets caps for discretionary spending for FY12 and FY13. – $684B for FY12
– $686 B for FY13
• National Defense – $596B request for FY13
– Likely to remain at FY11 levels: $553B
($B) H.R. 1
FY12 House
APPN Spread
Defense 513.0 530.0 504.4
MILCON/VA 73.3 72.5 72.1
Homeland Security 41.7 40.9 41.0
NNSA 10.6 10.6 10.4
Foreign Ops 50.2 41.6 49.4
Total Security 688.8 695.6 684.0
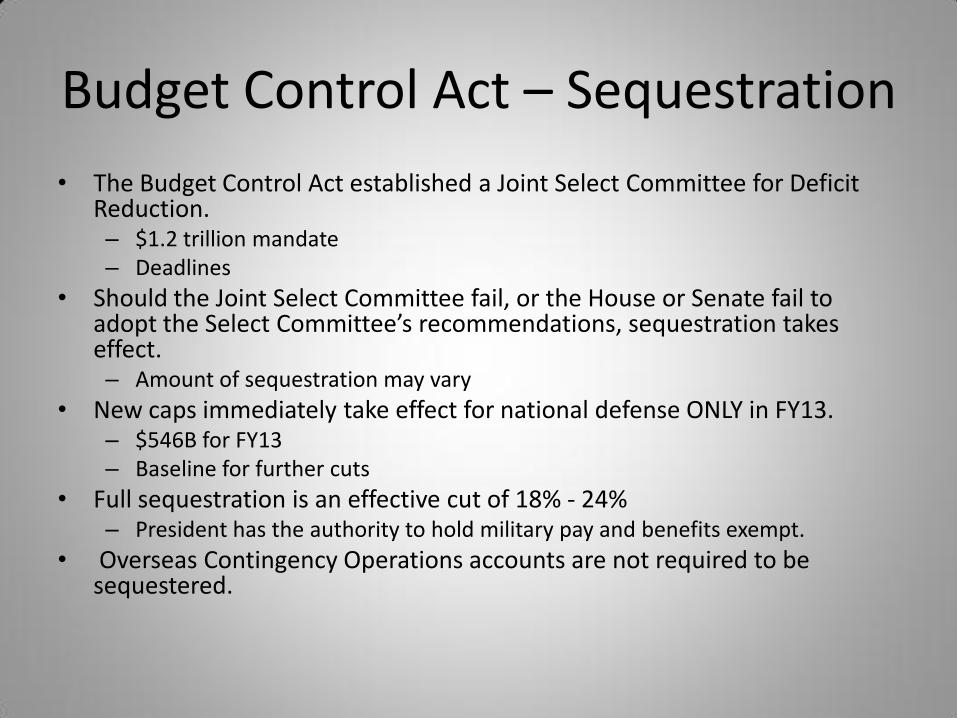
Budget Control Act – Sequestration
• The Budget Control Act established a Joint Select Committee for Deficit Reduction. – $1.2 trillion mandate – Deadlines
• Should the Joint Select Committee fail, or the House or Senate fail to adopt the Select Committee’s recommendations, sequestration takes effect. – Amount of sequestration may vary
• New caps immediately take effect for national defense ONLY in FY13. – $546B for FY13 – Baseline for further cuts
• Full sequestration is an effective cut of 18% - 24% – President has the authority to hold military pay and benefits exempt.
• Overseas Contingency Operations accounts are not required to be sequestered.

National Defense Base Budget Topline January 2012 – Implementation of Budget Control Act (BCA) Sequestration
FY 2009 – FY 2021 Constant FY 2012 Dollars
557 570 562
549
482 481 480 479 478 477 475 474 474
-54 -52 -51 -50 -49 -48 -46 -45 -44
-29 -49 -54 -55 -56 -53 -50 -48 -45 -43
$400
$450
$500
$550
$600
Base Budget (In Billions of Dollars)
Base Budget Projection
Base Budget
$0 FY09 FY10 FY11 FY12 FY13 FY14 FY15 FY16 FY17 FY18 FY19 FY20 FY21
Amount After Sequestration
BCA Base of Sequestration
BCA baseline: Reduces spending to pre-surge levels
Full sequestration: Reduces spending to pre-9/11 levels
Original Budget Request included
minimal real growth
FY12 Budget Request
Level
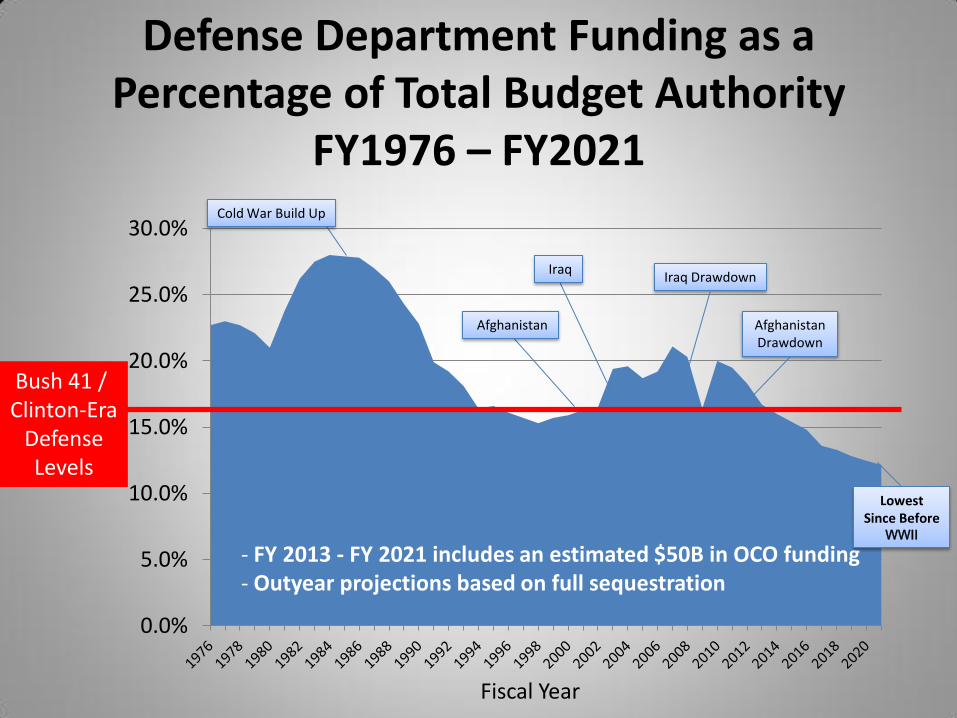
Defense Department Funding as a Percentage of Total Budget Authority
FY1976 – FY2021
0.0%
5.0%
10.0%
15.0%
20.0%
25.0%
30.0% Cold War Build Up
Afghanistan
Iraq Iraq Drawdown
Fiscal Year
Afghanistan Drawdown
- FY 2013 - FY 2021 includes an estimated $50B in OCO funding - Outyear projections based on full sequestration
Bush 41 / Clinton-Era
Defense Levels
Lowest Since Before
WWII
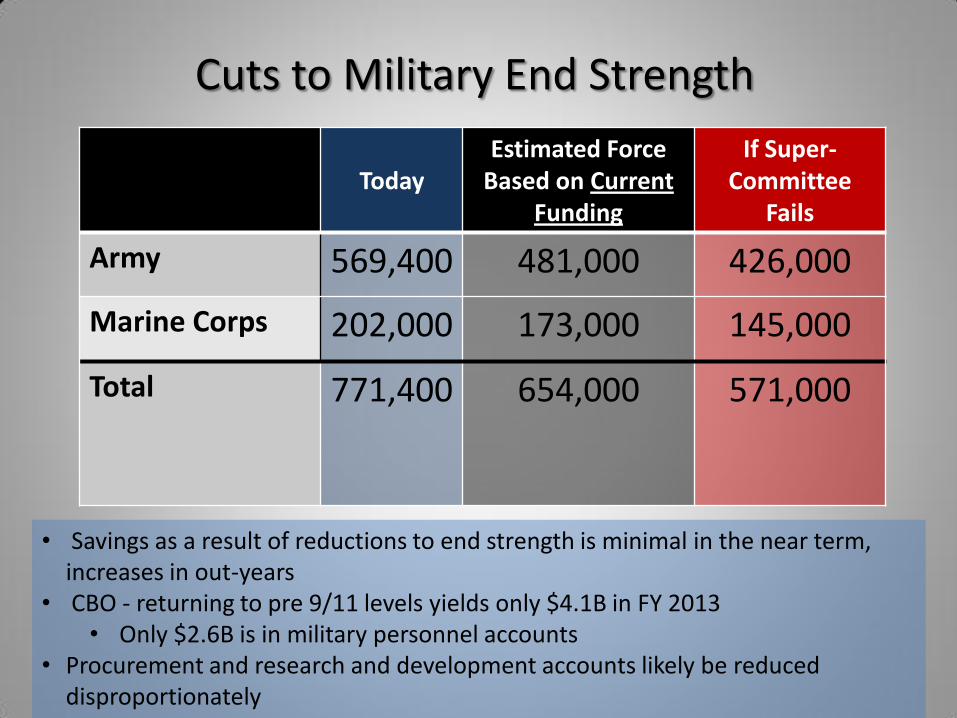
Today Estimated Force
Based on Current Funding
If Super-Committee
Fails
Army 569,400 481,000 426,000
Marine Corps 202,000 173,000 145,000
Total 771,400 654,000
571,000
Cuts to Military End Strength
• Savings as a result of reductions to end strength is minimal in the near term, increases in out-years
• CBO - returning to pre 9/11 levels yields only $4.1B in FY 2013 • Only $2.6B is in military personnel accounts
• Procurement and research and development accounts likely be reduced disproportionately
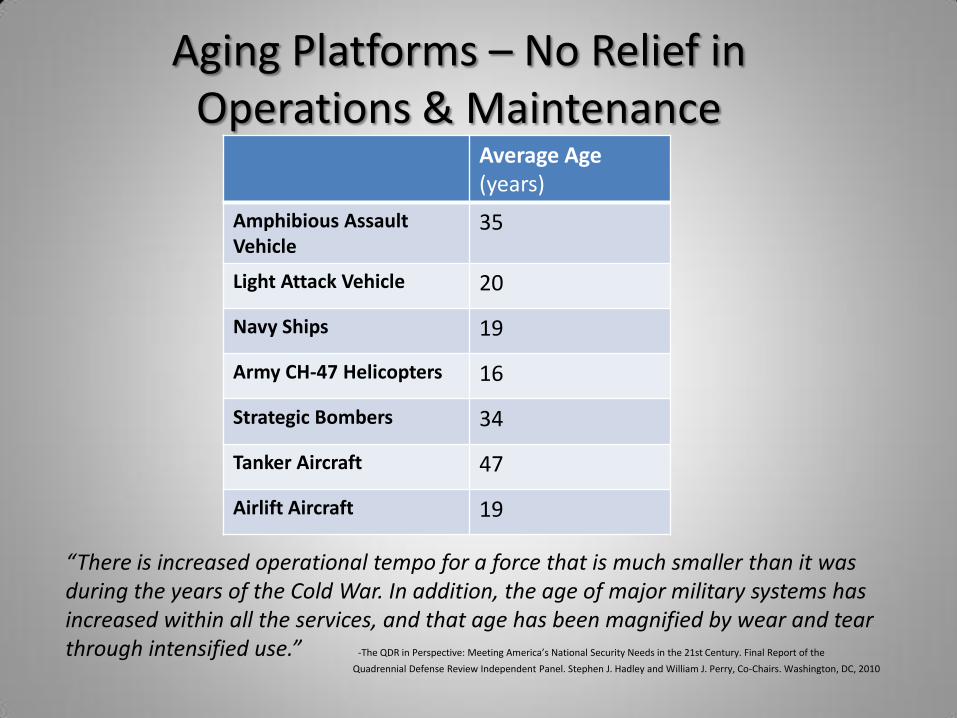
Average Age (years)
Amphibious Assault Vehicle
35
Light Attack Vehicle 20
Navy Ships 19
Army CH-47 Helicopters 16
Strategic Bombers 34
Tanker Aircraft 47
Airlift Aircraft 19
Aging Platforms – No Relief in Operations & Maintenance
“There is increased operational tempo for a force that is much smaller than it was during the years of the Cold War. In addition, the age of major military systems has increased within all the services, and that age has been magnified by wear and tear through intensified use.” -The QDR in Perspective: Meeting America’s National Security Needs in the 21st Century. Final Report of the
Quadrennial Defense Review Independent Panel. Stephen J. Hadley and William J. Perry, Co-Chairs. Washington, DC, 2010

Declining Force Structure 1990 2000 Today Estimate
Based on Current Funding
If Super-Committee
Fails
Army Maneuver Battalions
172 98 100 78 60 - 70
Navy Ships 546 316 288 263
238
USAF Fighters 4355 3602 1990 1739
1512
Strategic Bombers 282 153 135 118
101
Strategic and Tactical Air Lift
872 743 651 572 494
“The general trend has been to replace more with fewer more-capable systems. We are concerned that, beyond a certain point, quality cannot substitute for quantity.”
-The QDR in Perspective: Meeting America’s National Security Needs in the 21st Century. Final Report of the Quadrennial Defense Review Independent Panel. Stephen
J. Hadley and William J. Perry, Co-Chairs. Washington, DC, 2010
Broad Impacts
• Mission risk and force planning construct
• U.S. Marine Corps
• Deterrence
• Breaking Faith with All Volunteer Force
• Shipbuilding
Consequences for Acquisition
• Reductions to civilian workforce follow reductions in military end strength – Growth in acquisition workforce limited
– Loss of seasoned professionals
• Modernization programs at risk
• Services prioritize core capabilities
• Renewed emphasis on incremental capability versus transformational leaps
• Impacts on R&D and small business
A Few Myths
• Defense funding can be “fixed” next year
– Irrevocable changes
• Diminished forward presence can save money
– Little cost savings and opportunity cost
• Negotiated deal is better than sequestration
– Devil is in the details.
• OCO is safe

Thank you!
Questions?
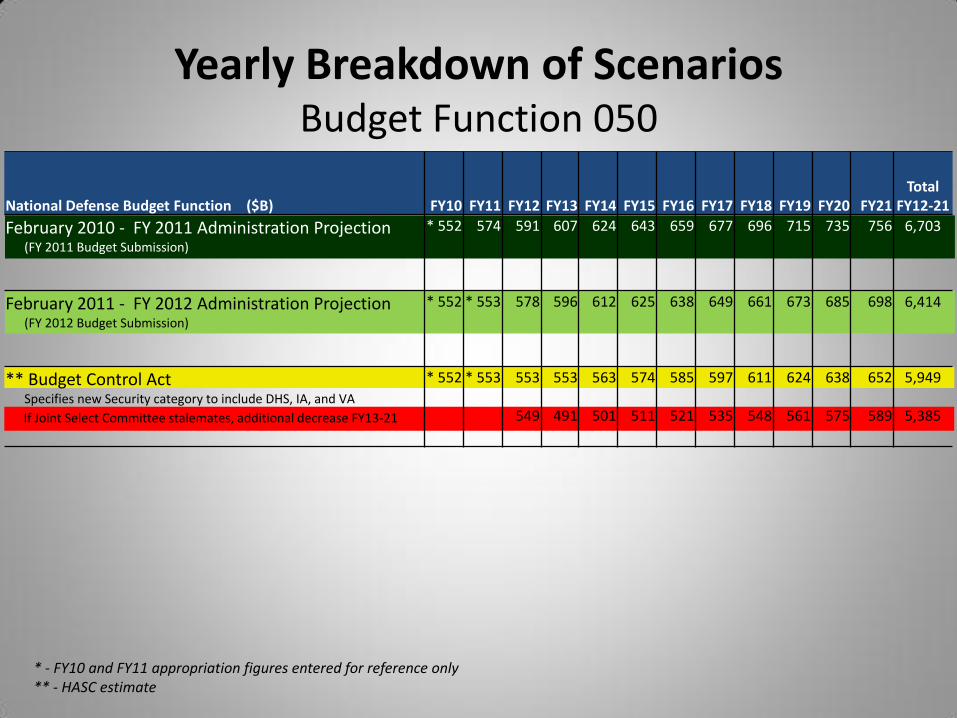
Yearly Breakdown of Scenarios Budget Function 050
* - FY10 and FY11 appropriation figures entered for reference only ** - HASC estimate
National Defense Budget Function ($B) FY10 FY11 FY12 FY13 FY14 FY15 FY16 FY17 FY18 FY19 FY20 FY21 Total
FY12-21
February 2010 - FY 2011 Administration Projection (FY 2011 Budget Submission)
* 552 574 591 607 624 643 659 677 696 715 735 756 6,703
February 2011 - FY 2012 Administration Projection (FY 2012 Budget Submission)
* 552 * 553 578 596 612 625 638 649 661 673 685 698 6,414
** Budget Control Act Specifies new Security category to include DHS, IA, and VA If Joint Select Committee stalemates, additional decrease FY13-21
* 552 * 553 553
549
553
491
563
501
574
511
585
521
597
535
611
548
624
561
638
575
652
589
5,949
5,385