Embed Size (px)
Citation preview
January – June 2015
Alf Göransson, President and CEO
August 5, 2015
Highlights January - June
• Organic sales growth 5% (2) with improvements in all business segments
• Operating margin 4.7% (4.6), driven by SSNA
• Price/wage balance on par • EPS real change 10% • Free Cash Flow to net debt ratio
0.19 (0.20) • Q2 development supports the target
of at least 28% growth of security solutions and technology in 2015
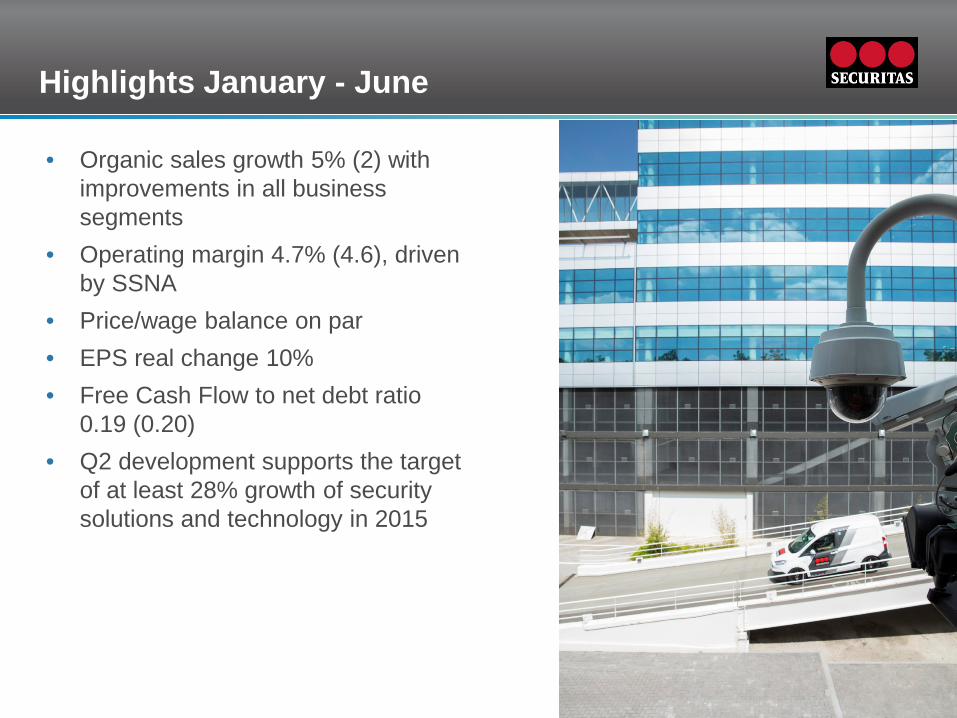
Financial Highlights
MSEK Q2
2015 Q2
2014 Total
change %
Real change
%
H1 2015
H1 2014
Total change
%
Real change
%
Sales 19 875 17 120 16 5 39 361 33 231 18 5
Organic sales growth, % 4 3 5 2 Operating income before amortization 926 788 18 6 1 835 1 526 20 6 Operating margin, % 4.7 4.6 4.7 4.6
Amortization and impairment of acquisition related assets -66 -60 -134 -121
Acquisition related costs -7 -7 -17 -11 Operating income after amortization 853 721 18 6 1 684 1 394 21 6
Financial income and expenses -76 -82 -151 -163 Income before taxes 777 639 22 8 1 533 1 231 25 9
Net income for the period 550 449 23 10 1 086 864 26 10
Earnings per share (SEK) 1.51 1.23 23 10 2.96 2.36 25 10
Security Services North America – Sales Development H1 2015
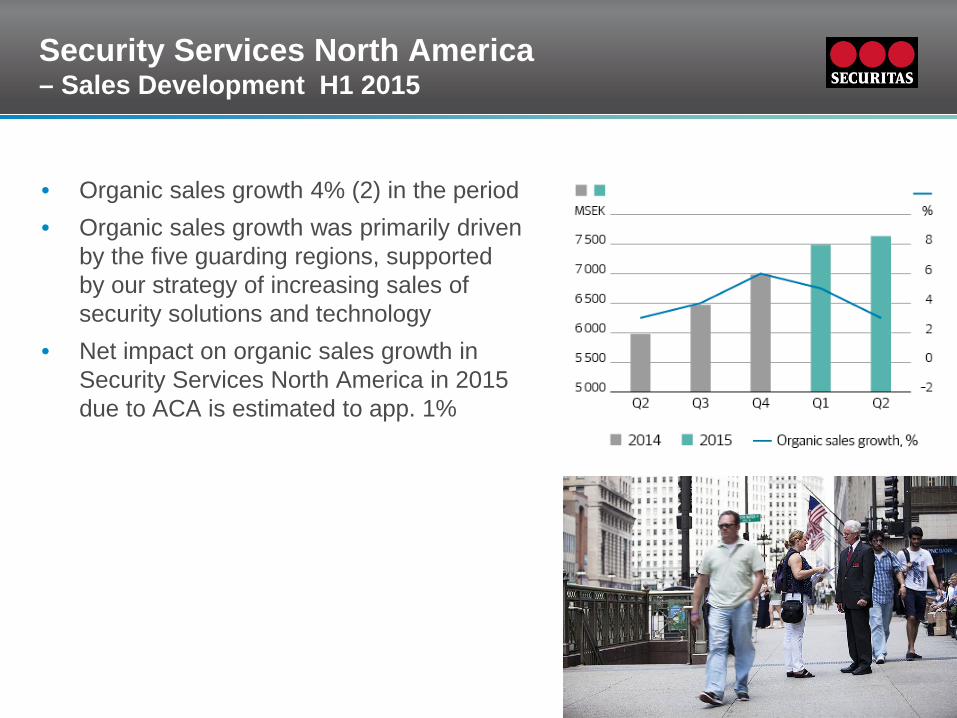
• Organic sales growth 4% (2) in the period • Organic sales growth was primarily driven
by the five guarding regions, supported by our strategy of increasing sales of security solutions and technology
• Net impact on organic sales growth in Security Services North America in 2015 due to ACA is estimated to app. 1%
4

Security Services North America – Income Development H1 2015
• The operating margin was 5.3% (5.0) in the period
• The margin improvement relates to the leverage effect from good organic sales growth and lower payroll taxes
• Our strategy of increasing sales of security solutions and technology also had positive margin impact
5
Security Services Europe – Sales Development H1 2015
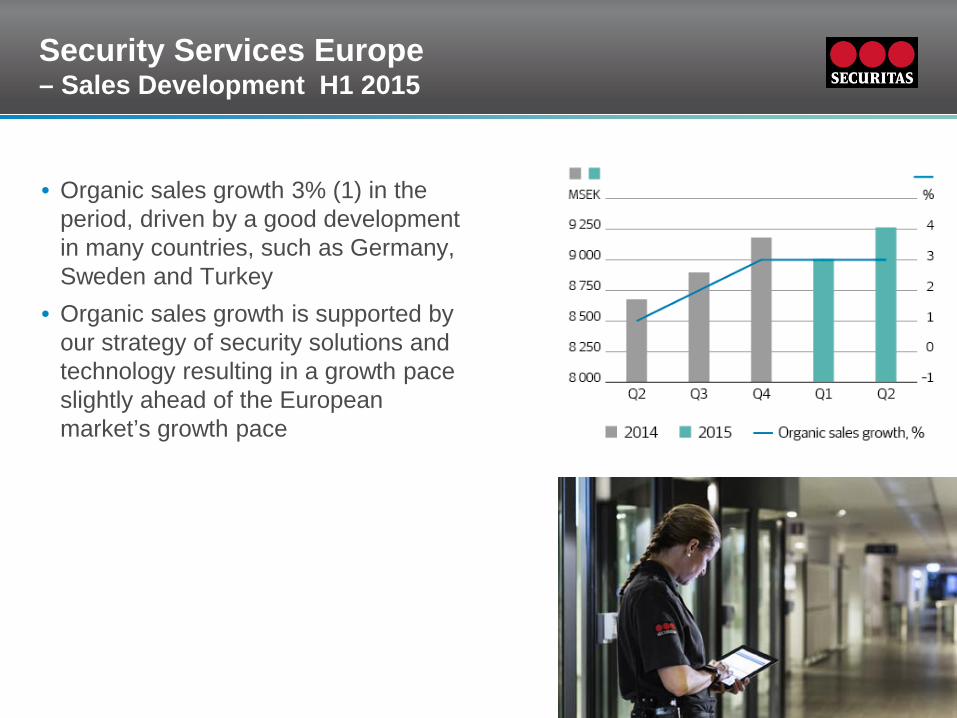
• Organic sales growth 3% (1) in the period, driven by a good development in many countries, such as Germany, Sweden and Turkey
• Organic sales growth is supported by our strategy of security solutions and technology resulting in a growth pace slightly ahead of the European market’s growth pace
6
Security Services Europe – Income Development H1 2015
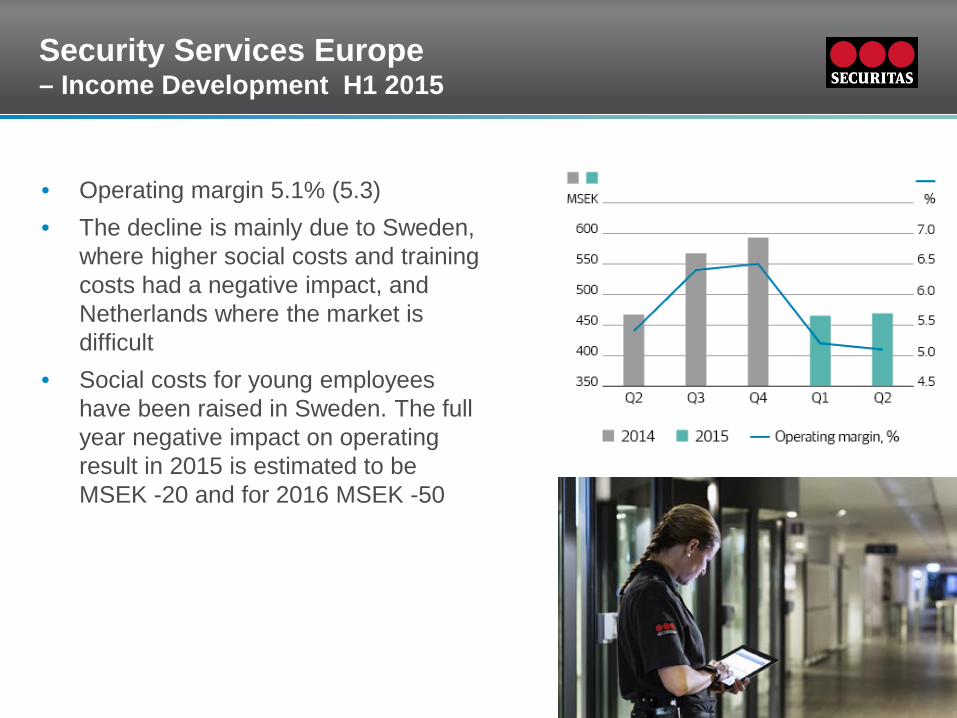
• Operating margin 5.1% (5.3) • The decline is mainly due to Sweden,
where higher social costs and training costs had a negative impact, and Netherlands where the market is difficult
• Social costs for young employees have been raised in Sweden. The full year negative impact on operating result in 2015 is estimated to be MSEK -20 and for 2016 MSEK -50
7
8
Security Services Ibero-America – Sales Development H1 2015
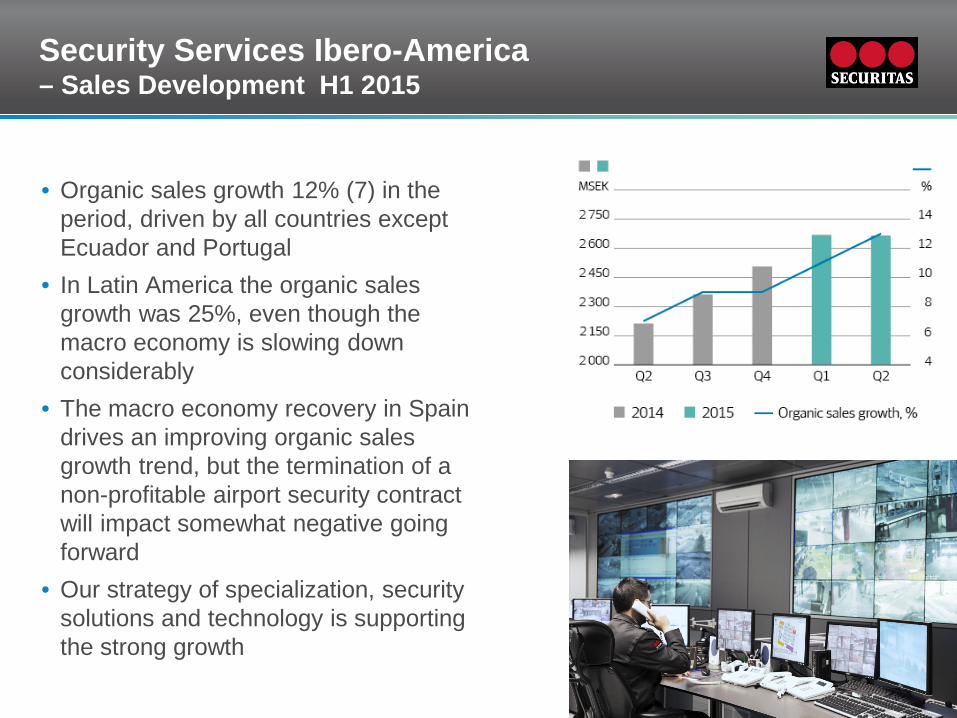
• Organic sales growth 12% (7) in the period, driven by all countries except Ecuador and Portugal
• In Latin America the organic sales growth was 25%, even though the macro economy is slowing down considerably
• The macro economy recovery in Spain drives an improving organic sales growth trend, but the termination of a non-profitable airport security contract will impact somewhat negative going forward
• Our strategy of specialization, security solutions and technology is supporting the strong growth
9 9
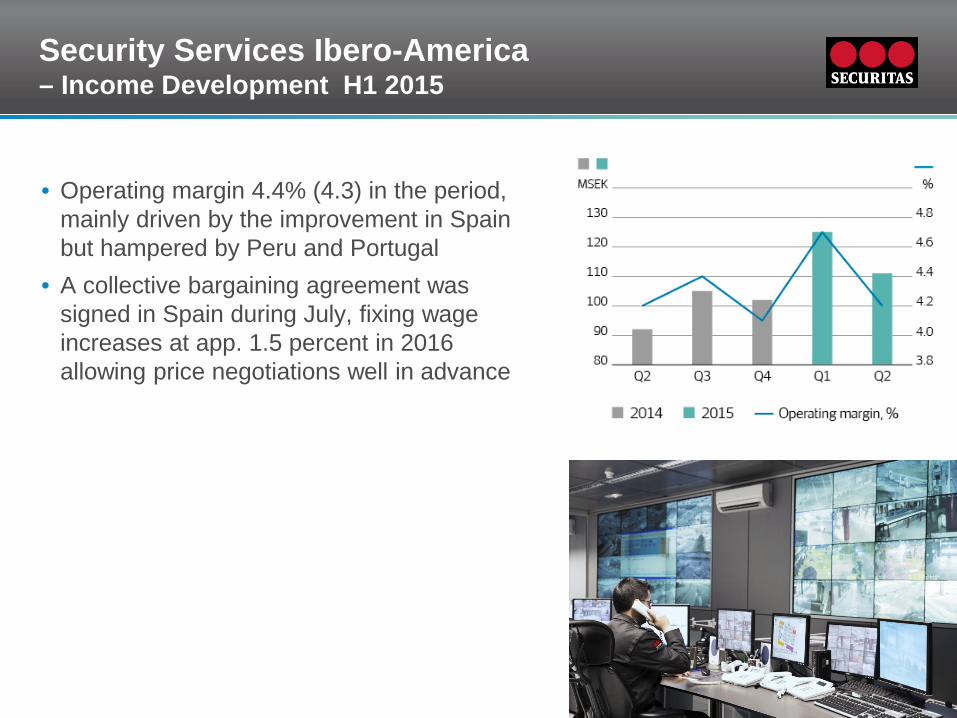
Security Services Ibero-America – Income Development H1 2015
• Operating margin 4.4% (4.3) in the period, mainly driven by the improvement in Spain but hampered by Peru and Portugal
• A collective bargaining agreement was signed in Spain during July, fixing wage increases at app. 1.5 percent in 2016 allowing price negotiations well in advance
10
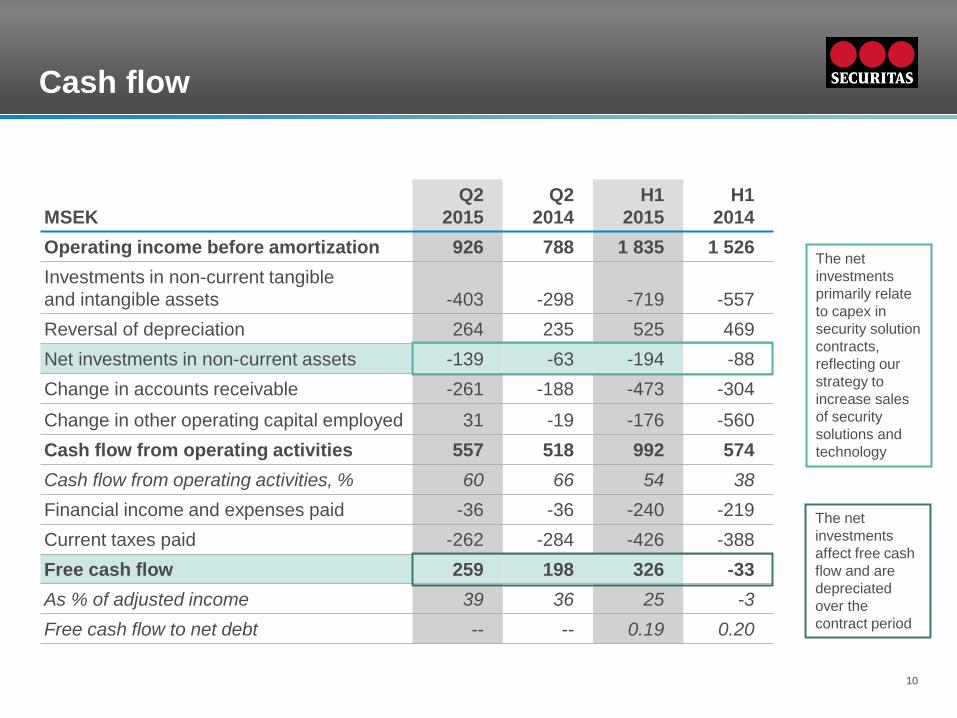
Cash flow
MSEK Q2
2015 Q2
2014 H1
2015 H1
2014 Operating income before amortization 926 788 1 835 1 526 Investments in non-current tangible and intangible assets -403 -298 -719 -557 Reversal of depreciation 264 235 525 469 Net investments in non-current assets -139 -63 -194 -88 Change in accounts receivable -261 -188 -473 -304
Change in other operating capital employed 31 -19 -176 -560 Cash flow from operating activities 557 518 992 574 Cash flow from operating activities, % 60 66 54 38 Financial income and expenses paid -36 -36 -240 -219 Current taxes paid -262 -284 -426 -388 Free cash flow 259 198 326 -33 As % of adjusted income 39 36 25 -3 Free cash flow to net debt -- -- 0.19 0.20
The net investments primarily relate to capex in security solution contracts, reflecting our strategy to increase sales of security solutions and technology
The net investments affect free cash flow and are depreciated over the contract period
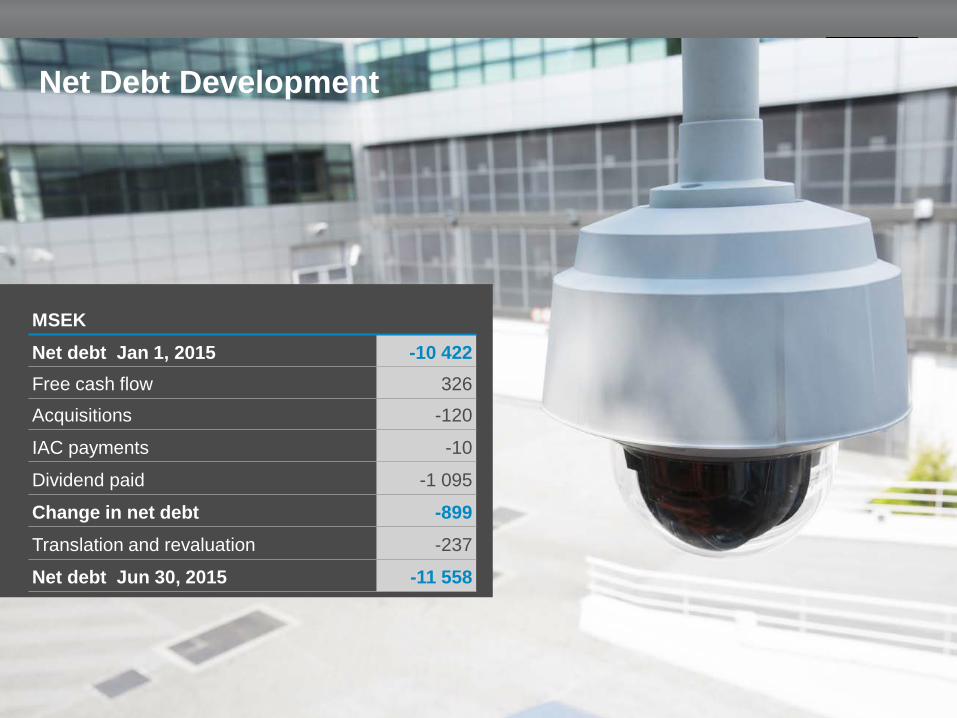
Net Debt Development
11
MSEK
Net debt Jan 1, 2015 -10 422 Free cash flow 326
Acquisitions -120
IAC payments -10
Dividend paid -1 095
Change in net debt -899 Translation and revaluation -237
Net debt Jun 30, 2015 -11 558
Questions and Answers

Interim Report January-March 2010
Integrity | Vigilance | Helpfulness
securitas.com