Embed Size (px)
Citation preview
Clin Chem Lab Med 2017; 55(3): 322–333
*Corresponding author: Jansen Seheult, MB, MSc, Department of Clinical Chemistry, Adelaide and Meath Hospital, Tallaght, Dublin 24, Ireland, Phone: +14129805667, E-mail: [email protected] Fitzpatrick: Department of Anaesthesia and Critical Care, Adelaide and Meath Hospital, Tallaght, Dublin, IrelandGerard Boran: Department of Clinical Chemistry, Adelaide and Meath Hospital, Tallaght, Dublin, Ireland
Review
Jansen Seheult*, Gerard Fitzpatrick and Gerard Boran
Lactic acidosis: an updateDOI 10.1515/cclm-2016-0438Received May 20, 2016; accepted July 10, 2016; previously published online August 15, 2016
Abstract: Lactate is one of the most crucial intermediates in carbohydrate and nonessential amino acid metabolism. The complexity of cellular interactions and metabolism means that lactate can be considered a waste product for one cell but a useful substrate for another. The pres-ence of elevated lactate levels in critically ill patients has important implications for morbidity and mortality. In this review, we provide a brief outline of the metabolism of lactate, the pathophysiology of lactic acidosis, the clinical significance of D-lactate, the role of lactate measurement in acutely ill patients, the methods used to measure lac-tate in blood or plasma and some of the methodological issues related to interferences in these assays, especially in the case of ethylene glycol poisoning.
Keywords: D-lactate; lactate dehydrogenase; lactate gap; lactate measurement; lactic acidosis.
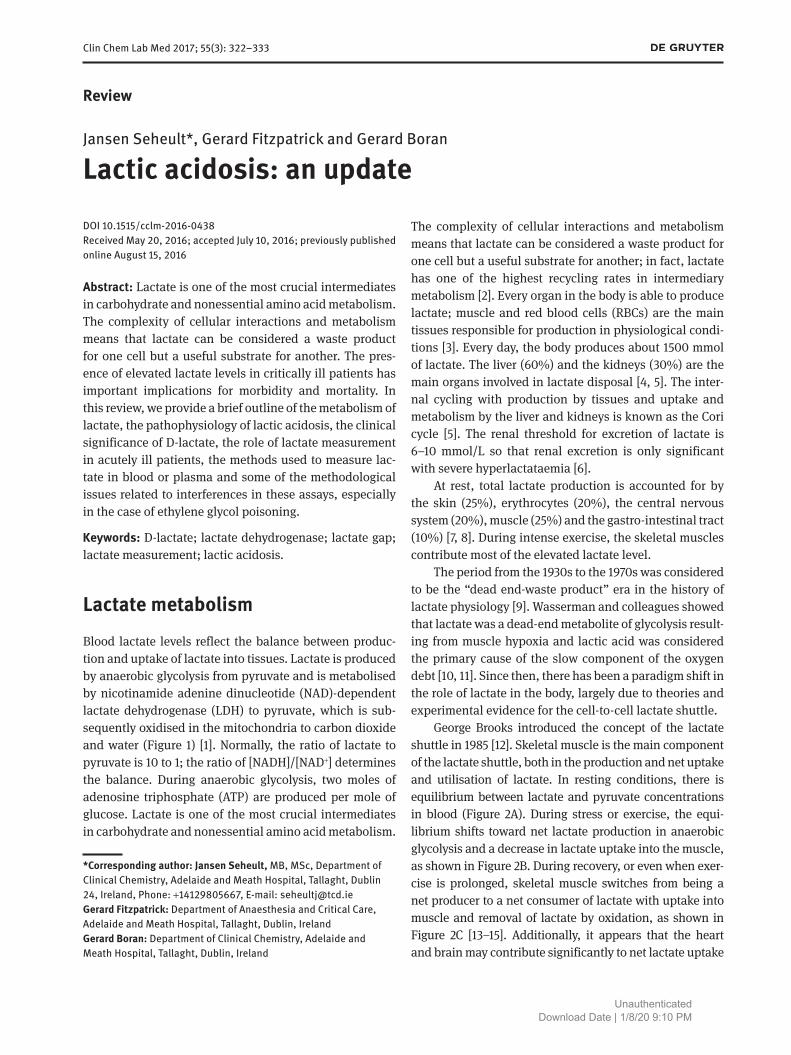
Lactate metabolismBlood lactate levels reflect the balance between produc-tion and uptake of lactate into tissues. Lactate is produced by anaerobic glycolysis from pyruvate and is metabolised by nicotinamide adenine dinucleotide (NAD)-dependent lactate dehydrogenase (LDH) to pyruvate, which is sub-sequently oxidised in the mitochondria to carbon dioxide and water (Figure 1) [1]. Normally, the ratio of lactate to pyruvate is 10 to 1; the ratio of [NADH]/[NAD+] determines the balance. During anaerobic glycolysis, two moles of adenosine triphosphate (ATP) are produced per mole of glucose. Lactate is one of the most crucial intermediates in carbohydrate and nonessential amino acid metabolism.
The complexity of cellular interactions and metabolism means that lactate can be considered a waste product for one cell but a useful substrate for another; in fact, lactate has one of the highest recycling rates in intermediary metabolism [2]. Every organ in the body is able to produce lactate; muscle and red blood cells (RBCs) are the main tissues responsible for production in physiological condi-tions [3]. Every day, the body produces about 1500 mmol of lactate. The liver (60%) and the kidneys (30%) are the main organs involved in lactate disposal [4, 5]. The inter-nal cycling with production by tissues and uptake and metabolism by the liver and kidneys is known as the Cori cycle [5]. The renal threshold for excretion of lactate is 6–10 mmol/L so that renal excretion is only significant with severe hyperlactataemia [6].
At rest, total lactate production is accounted for by the skin (25%), erythrocytes (20%), the central nervous system (20%), muscle (25%) and the gastro-intestinal tract (10%) [7, 8]. During intense exercise, the skeletal muscles contribute most of the elevated lactate level.
The period from the 1930s to the 1970s was considered to be the “dead end-waste product” era in the history of lactate physiology [9]. Wasserman and colleagues showed that lactate was a dead-end metabolite of glycolysis result-ing from muscle hypoxia and lactic acid was considered the primary cause of the slow component of the oxygen debt [10, 11]. Since then, there has been a paradigm shift in the role of lactate in the body, largely due to theories and experimental evidence for the cell-to-cell lactate shuttle.
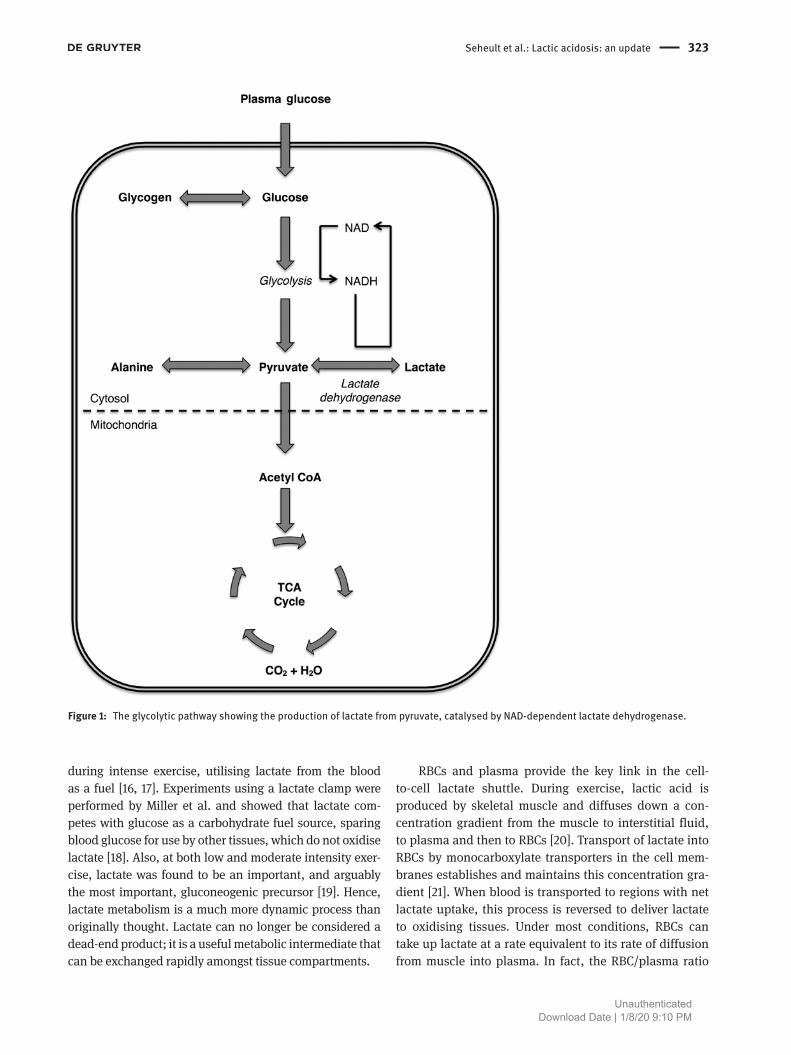
George Brooks introduced the concept of the lactate shuttle in 1985 [12]. Skeletal muscle is the main component of the lactate shuttle, both in the production and net uptake and utilisation of lactate. In resting conditions, there is equilibrium between lactate and pyruvate concentrations in blood (Figure 2A). During stress or exercise, the equi-librium shifts toward net lactate production in anaerobic glycolysis and a decrease in lactate uptake into the muscle, as shown in Figure 2B. During recovery, or even when exer-cise is prolonged, skeletal muscle switches from being a net producer to a net consumer of lactate with uptake into muscle and removal of lactate by oxidation, as shown in Figure 2C [13–15]. Additionally, it appears that the heart and brain may contribute significantly to net lactate uptake
UnauthenticatedDownload Date | 1/8/20 9:10 PM
Seheult et al.: Lactic acidosis: an update 323
during intense exercise, utilising lactate from the blood as a fuel [16, 17]. Experiments using a lactate clamp were performed by Miller et al. and showed that lactate com-petes with glucose as a carbohydrate fuel source, sparing blood glucose for use by other tissues, which do not oxidise lactate [18]. Also, at both low and moderate intensity exer-cise, lactate was found to be an important, and arguably the most important, gluconeogenic precursor [19]. Hence, lactate metabolism is a much more dynamic process than originally thought. Lactate can no longer be considered a dead-end product; it is a useful metabolic intermediate that can be exchanged rapidly amongst tissue compartments.
RBCs and plasma provide the key link in the cell-to-cell lactate shuttle. During exercise, lactic acid is produced by skeletal muscle and diffuses down a con-centration gradient from the muscle to interstitial fluid, to plasma and then to RBCs [20]. Transport of lactate into RBCs by monocarboxylate transporters in the cell mem-branes establishes and maintains this concentration gra-dient [21]. When blood is transported to regions with net lactate uptake, this process is reversed to deliver lactate to oxidising tissues. Under most conditions, RBCs can take up lactate at a rate equivalent to its rate of diffusion from muscle into plasma. In fact, the RBC/plasma ratio
Figure 1: The glycolytic pathway showing the production of lactate from pyruvate, catalysed by NAD-dependent lactate dehydrogenase.
UnauthenticatedDownload Date | 1/8/20 9:10 PM
324 Seheult et al.: Lactic acidosis: an update
is usually set at a constant value of approximately 0.5, meaning that plasma will contain 70% and RBCs 30% of the whole blood lactate content [20, 22].
Over the last 20 years, there has been a move toward an additional but supplementary theory of lactate metab-olism, revolving around intracellular transportation. Brooks proposed an intracellular shuttle in 1998 [23]. The basis for this was the fact that LDH has the highest Vmax of any enzyme in the glycolytic pathway and the equilibrium for the pyruvate to lactate reaction is in favor of lactate production. It appears that lactate is produced in the cytosol and then transported into the mitochondria where it is converted back to pyruvate by mitochondrial LDH and oxidised by pyruvate dehydrogenase to acetyl CoA, which enters the Kreb’s cycle (Figure 1) [13, 24].
Lactic acidosisLactic acid, CH3CH(OH)COOH, is a strong acid that, at physiological pH, is almost completely ionised to lactate, CH3CH(OH)COO− and H+ [20]. For decades, this has led to the misconception that it is the dissociation of lactic acid and formation of H+ that causes an acidosis related to lactic acid production [25]. The two major approaches to acid-base balance in human blood at the time were the Henderson-Hasselbach equation (1918) and the
base excess approach [26]. The Henderson-Hasselbach equation related plasma [H+] to the partial pressure of carbon dioxide, PCO2 and bicarbonate ion concentration, [HCO3
−] [27]. On the other hand, the base excess approach described acid-base balance in terms of PCO2 and base excess (base excess is the number of milliequivalents (mEq) of acid or base needed to titrate 1 L of blood to a pH of 7.40 at 37 oC at a PCO2 of 40 mmHg) [25].
In 2004, Robergs disproved the traditional conception of lactic acidosis by showing that the reaction catalysed by LDH produces lactate and not lactic acid, and that pro-duction of lactate actually consumes H+, thus mitigating any intracellular acidosis [28, 29]. This theory debunked the role of lactic acid in the causation of metabolic acido-sis related to intense exercise and tissue hypoxia.
Stewart, however, later provided an alternative view on acid-base balance that could explain the role of lactate in metabolic acidosis [30]. The interacting variables include equilibria among bicarbonate ion formation, car-bonate ion formation, water dissociation and weak acid dissociation, in addition to electrical charge balance and conservation of mass [31]. The three independent vari-ables are PCO2, total weak acid concentration and the strong ion difference or the difference between the sum of all strong base cations and the sum of all strong acid anions. In this model, lactate is a strong ion and its accu-mulation reduces the strong ion difference, which causes
Figure 2: Physiological lactate metabolism.(A) Under steady-state conditions, glucose is converted to pyruvate, which is then fully oxidised in the mitochondria to CO2, with the genera-tion of 38 ATP molecules overall. (B) Under stressful conditions, the rate of glycolysis is increased significantly and production of pyruvate saturates the capacity of the TCA cycle to metabolise it, so pyruvate is shunted into the production of lactate, with net generation of 2 ATP molecules. (C) During the recovery phase, lactate is converted back to pyruvate and shunted into the TCA cycle, producing 18 ATP molecules per molecule of lactate.
UnauthenticatedDownload Date | 1/8/20 9:10 PM
Seheult et al.: Lactic acidosis: an update 325
alterations in the dissociation of water and weak acids [31]. This theory explains a role for lactate in the causation of lactic acidosis, albeit a less clearcut role than what was previously thought since it is not the only factor acting to increase the [H+].
The physiological lactate concentration in the blood is usually between 0.5 and 1.8 mmol/L [32]. In a clinical context, lactic acidosis can occur due to either excessive production at the tissue level or impaired metabolism. Due to the large capacity of the liver to metabolise lactate, elevated lactic acid levels due to increased production usually return to normal after 1–2 h. If lactic acidosis occurs for longer than this, it signals either continuing production or a decreased ability of the liver to metabolise it. Hyperlactataemia is usually defined as a level of 2–5 mmol/L, whereas severe hyperlactataemia is defined as a level > 5 mmol/L [33].
Lactic acidosis is usually associated with an elevated serum anion gap (AG) due to a secondary consumptive loss of HCO3
− from buffering of H+ cations without a con-current increase in Cl−. The AG is the difference in the measured cations (Na+ and K+) and the measured anions (Cl− and HCO3
−) in serum; the “gap” is due to the unmeas-ured anions, which are not included in the calculation. It is, however, important to recognize that lactic acido-sis may occur with a normal AG and that an elevated AG may occur in certain conditions without a concomitant acid-base disturbance, for example, laboratory error, hyperalbuminemia with volume depletion, metabolic and respiratory alkalosis (due to induction of phosphof-ructokinase activity), increased anionic paraproteins and severe hyperphosphataemia [34]. Hyperlactataemia may also occur with a normal serum pH or with an alkalosis due to the presence of a mixed acid-base disturbance, where a concomitant respiratory or metabolic alkalosis masks the effect of the elevated lactic acid concentra-tions. Comparison of the change in anion gap (ΔAG) to the change in bicarbonate ion concentration (ΔHCO3
−) by utilising the δ ratio (ΔAG/ΔHCO3
−) may be useful in iden-tifying such mixed disturbances in acid-base equilibrium [34–36].
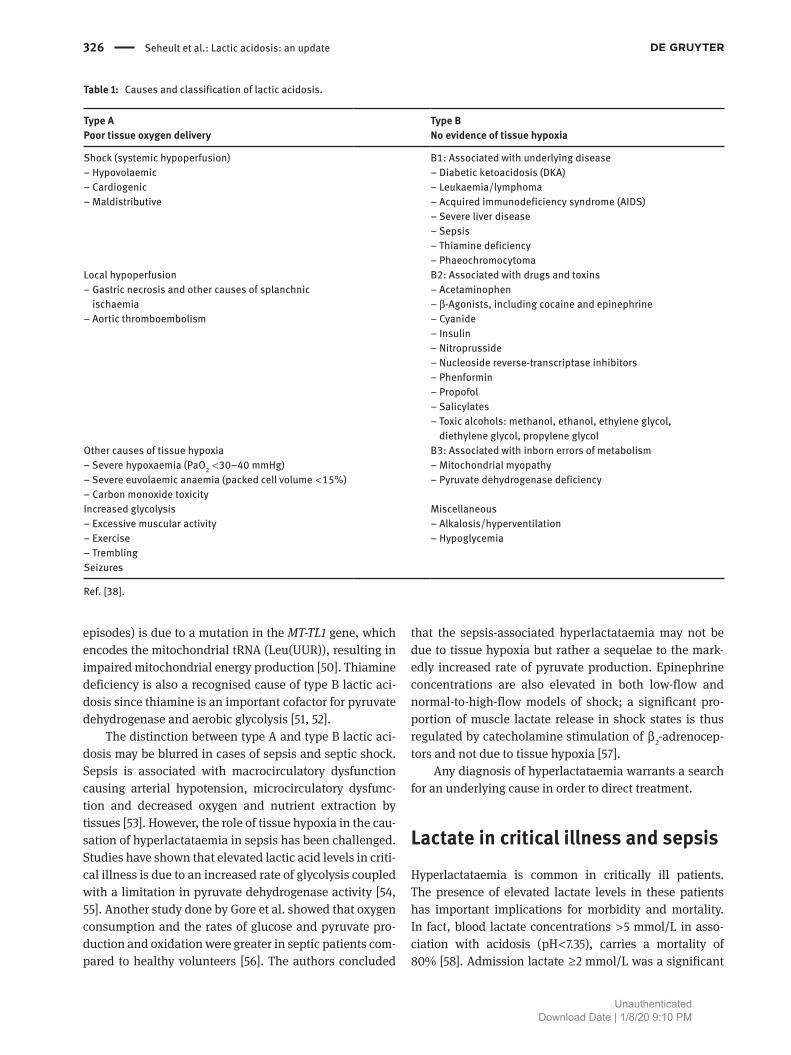
Causes and classification of lactic acidosisCohen and Woods classified lactic acidosis into type A and type B depending on the underlying mechanism, that is, the presence or absence of tissue hypoxia [37, 38]. Whilst it is important to note that the two mechanisms of lactic
acidosis can coexist and be involved in both types A and B, the original classification provides a useful approach for determining the underlying mechanism and cause of hyperlactataemia. Table 1 gives some of the common causes under each category.
Type A lactic acidosis is by far the commonest group and is usually due to tissue hypoxia caused by systemic or local hypoperfusion, increased glycolysis, reduced oxygen carrying capacity of the blood or reduced tissue oxygen delivery [38]. Apart from excessive muscle activity, other causes of type A lactic acidosis are rare. The inadequate oxygen supply slows mitochondrial metabolism and leads to increased production of lactate from pyruvate. As a byproduct, NAD+ is regenerated so that glycolysis can con-tinue. If hypoxaemia is the only factor, it must be severe to overwhelm the compensatory increase in tissue blood flow triggered by low PO2.
Type B lactic acidosis is rarer and has classically been thought of as hyperlactataemia without evidence of tissue hypoxia; however, many causes of Type B lactic acido-sis have occult hypoperfusion [39]. Common drugs and toxins, such as nucleoside reverse-transcriptase inhibitors (NRTIs), toxic alcohols, salicylates, propofol and cyanide, can interfere with oxidative phosphorylation leading to lactic acidosis [40]. Metformin inhibits complex 1 of the mitochondrial respiratory chain and also suppresses hepatic gluconeogenesis, resulting in both accelerated lactate production and reduced lactate metabolism [41, 42]. β2-agonists, including cocaine, epinephrine, inhaled salbutamol and terbutaline, stimulate aerobic glycolysis leading to a build-up of lactic acid levels.
Certain multi-system diseases can also lead to hyper-lactataemia. Lactic acidosis is a common finding in dia-betic ketoacidosis (DKA) and may be multi-factorial in origin, due to metformin use, D-lactate production in erythrocytes (discussed later) and L-lactate production due to increased anaerobic glycolysis [43]. Lactic acidosis has been described in association with hematological malig-nancies and solid tumors; proposed mechanisms include increased glycolytic activity of the tumor cells (Warburg effect), tumor tissue hypoxia and decreased clearance of lactate due to liver metastases [40, 44–46]. Lactic acido-sis may be a presenting feature of phaeochromocytoma or an intra-operative complication during adrenalectomy for this condition; this is likely due to epinephrine-induced gluconeogenesis with elevation of plasma pyruvate levels and peripheral tissue ischaemia due to catecholamine-induced vasoconstriction [47, 48]. Severe liver disease leads to a buildup of lactic acid due to decreased clear-ance [49]. The lactic acidosis associated with MELAS (mitochondrial epilepsy, lactic acidosis and stroke-like
UnauthenticatedDownload Date | 1/8/20 9:10 PM
326 Seheult et al.: Lactic acidosis: an update
episodes) is due to a mutation in the MT-TL1 gene, which encodes the mitochondrial tRNA (Leu(UUR)), resulting in impaired mitochondrial energy production [50]. Thiamine deficiency is also a recognised cause of type B lactic aci-dosis since thiamine is an important cofactor for pyruvate dehydrogenase and aerobic glycolysis [51, 52].
The distinction between type A and type B lactic aci-dosis may be blurred in cases of sepsis and septic shock. Sepsis is associated with macrocirculatory dysfunction causing arterial hypotension, microcirculatory dysfunc-tion and decreased oxygen and nutrient extraction by tissues [53]. However, the role of tissue hypoxia in the cau-sation of hyperlactataemia in sepsis has been challenged. Studies have shown that elevated lactic acid levels in criti-cal illness is due to an increased rate of glycolysis coupled with a limitation in pyruvate dehydrogenase activity [54, 55]. Another study done by Gore et al. showed that oxygen consumption and the rates of glucose and pyruvate pro-duction and oxidation were greater in septic patients com-pared to healthy volunteers [56]. The authors concluded
that the sepsis-associated hyperlactataemia may not be due to tissue hypoxia but rather a sequelae to the mark-edly increased rate of pyruvate production. Epinephrine concentrations are also elevated in both low-flow and normal-to-high-flow models of shock; a significant pro-portion of muscle lactate release in shock states is thus regulated by catecholamine stimulation of β 2-adrenocep-tors and not due to tissue hypoxia [57].
Any diagnosis of hyperlactataemia warrants a search for an underlying cause in order to direct treatment.
Lactate in critical illness and sepsisHyperlactataemia is common in critically ill patients. The presence of elevated lactate levels in these patients has important implications for morbidity and mortality. In fact, blood lactate concentrations > 5 mmol/L in asso-ciation with acidosis (pH < 7.35), carries a mortality of 80% [58]. Admission lactate ≥ 2 mmol/L was a significant
Table 1: Causes and classification of lactic acidosis.
Type APoor tissue oxygen delivery
Type BNo evidence of tissue hypoxia
Shock (systemic hypoperfusion)– Hypovolaemic– Cardiogenic– Maldistributive
B1: Associated with underlying disease– Diabetic ketoacidosis (DKA) – Leukaemia/lymphoma– Acquired immunodeficiency syndrome (AIDS) – Severe liver disease– Sepsis– Thiamine deficiency– Phaeochromocytoma
Local hypoperfusion– Gastric necrosis and other causes of splanchnic
ischaemia– Aortic thromboembolism
B2: Associated with drugs and toxins– Acetaminophen– β-Agonists, including cocaine and epinephrine– Cyanide– Insulin– Nitroprusside– Nucleoside reverse-transcriptase inhibitors– Phenformin– Propofol– Salicylates– Toxic alcohols: methanol, ethanol, ethylene glycol,
diethylene glycol, propylene glycolOther causes of tissue hypoxia– Severe hypoxaemia (PaO2 < 30–40 mmHg) – Severe euvolaemic anaemia (packed cell volume < 15%)– Carbon monoxide toxicity
B3: Associated with inborn errors of metabolism– Mitochondrial myopathy– Pyruvate dehydrogenase deficiency
Increased glycolysis– Excessive muscular activity– Exercise– Trembling
Miscellaneous– Alkalosis/hyperventilation– Hypoglycemia
Seizures
Ref. [38].
UnauthenticatedDownload Date | 1/8/20 9:10 PM
Seheult et al.: Lactic acidosis: an update 327
independent predictor of mortality in adult patients admit-ted to intensive care unit (ICU) in a large retrospective study by Khosravani et al. [59]. As such, lactate levels have a prognostic role in risk-stratification of patients in the Emergency Department and ICU. In fact, lactate levels may be more closely related to outcomes than hemodynamic measures in the early phases of resuscitation [60, 61].
Lactate-directed therapy has been shown to reduce morbidity in post-cardiac surgery patients [62]. Jansen et al. found that targeting a decrease of at least 20% in the blood lactate level over a 2-h period seemed to be associated with reduced in-hospital mortality [61]. Following on from these studies, two multi-center clinical trials were performed to investigate the effects of lactate-directed therapy in the emergency department (ED) setting and the ICU.
The first study, performed in the USA, randomised 300 patients diagnosed with severe sepsis or septic shock to either therapy directed by lactate clearance or by central venous oxygen saturation [63]. There were no differences in treatment in the first 72 h. The study found that lactate directed therapy was not inferior to therapy guided by central venous oxygen saturations. However, there were many identified limitations: the target lactate reduction of 10% or greater is lower than the reduction found in observational studies where survivors had a more than 30% reduction after 1 h [64]. Also, the differ-ences in protocol actions directly attributed to the study variables were small due to the fact that other hemody-namic measures were used to guide fluid replacement and blood transfusions.
The second landmark study was performed in a cohort of 348 patients randomised to either lactate-directed therapy or non-lactate directed therapy in the first 8 h of ICU stay [65]. Protocol patients received significantly more fluids during the intervention period and more patients in this group received vasodilators. There was an almost statistically significant (p = 0.067), 20% relative reduc-tion in mortality in addition to a strong statistically sig-nificant reduction in morbidity (duration of mechanical ventilation and ICU stay, p = 0.006). However, the trends in lactate levels were similar between groups. This sug-gests that lactate elevation may be an associated phenom-enon indicating disease severity rather than supporting a causal relationship. Elevated lactate levels may have lead to increased vigilance amongst clinicians with a lower threshold for initiating additional therapies.
It is clear that lactate-directed early resuscitation of patients in the ED and ICU has clinical benefit. Expert opinion recommends the use of lactate levels, central venous oxygen saturations and cardiac output to guide therapy. A systematic review of published trials stated
that blood lactate measurement, especially the trend, is useful for risk assessment in patients acutely admitted to hospital and that all patients with a lactate at admission above 2.5 mmol/L should be closely monitored for signs of deterioration [32]. However, the authors concluded that the relevance of lactate-guided therapy has to be sup-ported by more studies.
Whilst elevated lactate concentration in patients with sepsis is associated with disease severity, Marik et al. argue that the hyperlactataemia itself is not an indication of anaerobic metabolism but rather secondary to the stress response and endogenous and/ or exogenous catechola-mines [66]. They argue that increasing oxygen delivery to counteract the perceived oxygen debt may actually harm the patient and that ‘lactate clearance’ should not be used as the end-point of resuscitation in septic patients.
Larger randomised trials controlling for some of the limitations in recently completed trials need to be per-formed to further clarify the relationship among lactate, disease severity and response to therapy.
Measurement of lactate in the laboratoryMeasurement of lactate has become an important tool for risk stratification of patients in the ICU and ED depart-ments. Traditional methods for measurement of lactate have been limited to clinical laboratories using standard photometric techniques [67]. However, point-of-care (POC) or stat laboratory (that is, whole blood) lactate testing is increasingly common and increasingly justified based on medical benefits of reduced turnaround and 24-h per day availability. In fact, the National Academy of Clinical Bio-chemistry draft guidelines for POC testing concluded that more rapid turnaround time of lactate results in critically ill patients leads to improved clinical outcomes [68]. Over the last decade, there have been key studies performed to compare the performance of these POC methods versus traditional methods. In this paper, we will review some of the common methods in use.
There is currently no reference standard for lactate measurement [69]. Most laboratory methods utilise the reaction catalysed by LDH, which is coupled to NAD+ reduction/ NADH oxidation [70]. Lactate is oxidized to pyruvate by LDH in the presence of NAD+. NADH is formed and is measured spectrophotometrically at a wavelength of 340 nm; this correlates with plasma lactate concentra-tion. At a pH of 9.0–9.6 and an excess of NAD+, the equi-librium is shifted toward the formation of pyruvate. This
UnauthenticatedDownload Date | 1/8/20 9:10 PM
328 Seheult et al.: Lactic acidosis: an update
enzymatic reaction has high sensitivity and specificity and is currently the method of choice. The LDH method is utilised by Lactate Gen.2 performed on a Roche Cobas Integra 400 analyser (Roche Diagnostics), the Vitros LAC slide assay performed on a Vitros 250 analyser (Ortho Clinical Diagnostics), no. 735 assay (Sigma Diagnostics), TDxFLx (Abbott Laboratories) and Lactat PAP (Analyti-con), amongst others [67, 69–71].
A more recent method for measurement of plasma lactate utilises the lactate oxidase (LO) reaction. Assays for the Vitros analyser (Ortho Clinical Diagnostics) and Trinity Biotech utilise this method, in which lactate is oxi-dised to pyruvate by LO [72]. Hydrogen peroxide is gener-ated and this oxidizes a chromogen system; absorbance of the resulting dye complex is measured spectrophotometri-cally at a wavelength of 540 nm. The reaction is outlined below:
Lactate oxidase2 2 2L-lactate O Pyruvate H O+ → +
++ →
2 2Peroxidase
2H O 4-aminoantipyrine1,7-dihydronaphthalene Red dye
White et al. concluded that the LO method is a reli-able and valid technique, and its operating costs were less than the LDH methods [72].
Other laboratory methods for measurement of plasma lactate include gas chromatography and photometry. There has been a drive toward POC methods for meas-urement of whole blood lactate to reduce the turnaround time. Whole blood applications include the i-STAT (Abbott Laboratories), Radiometer ABL 725 blood gas analyser (Radiometer Medical A/S), and the Lactate Plus (Nova Bio-medical) [64]. A study by Karon et al. in 2007 compared these whole blood based assays with two plasma based assays utilising the LDH reaction and found that cor-relation between lactate methods was good with slopes between 0.87 and 1.06 and intercepts of 0.9–1.8 mg/dL (0.1–0.2 mmol/L) of lactate for all 4 methods compared with the Vitros method [69]. At high ( > 6 mmol/L) lactate values, the Radiometer and i-STAT methods reported lower lactate results compared with the Vitros and Integra. The Nova analyser reported higher lactate results than either the Vitros or Integra. The authors concluded that the nega-tive bias in i-STAT and Radiometer results might confound the interpretation of patient condition if multiple methods are used within the same institution.
There are a host of issues associated with newer POC methods and instruments that can only be addressed by standardisation and development of a reference method/reference standard for lactate and a rigorous external quality assurance scheme. These issues are becoming
more pressing as the role of lactate measurement in the acute care setting becomes more clearly defined.
A recent Welsh External Quality Assurance Scheme (WEQAS) Report from April, 2014 [WEQAS Quality Labo-ratory: Analyte Based Report, Lactate (mmol/L), Distri-bution P230. 22 April, 2014], showed that out of ~1200 labs/methods tested, more than 50% were using either the Radiometer ABL 800 series (213), Siemens RAP-IDLab 1200 series (80), Abbott i-STAT (86), enzymatic [Siemens Advia 1200/1650/1800/2400 (6), Beckman-Coulter AU2700/AU5400/AU5800 (3), Beckman-Coulter AU400/600/640/680 (4), Roche Modular (12), Abbott Architect (13), Roche Cobas C Module (21)], Instrumenta-tion Laboratory Gem 3000 / 3500 (40), Roche Omni S / b221 (174), Instrumentation Laboratory Gem Premier 4000 (286), Radiometer ABL 90 flex (109) or Siemens Rapid-point 500 (45). A pilot EQA scheme for Lactate conducted by RIQAS in June, 2014 [Randox International Quality Assessment Scheme, Randox Laboratories Limited, Clini-cal Chemistry, Cycle 50 Sample 6. 4 June, 2014] tested 202 methods and found that colorimetric – LO methods (150) were commonest followed by Ortho Vitros MicroSlide Systems (18), Enzymatic Electrode (12), UV-LDH (12) and Ion Selective Electrode (5) methodologies.
The latest POC lactate analysers include modern cartridge-based blood gas analysers like the Radiometer ABL800 FLEX series, the Radiometer ABL90 FLEX, the Instrumentation Laboratory GEM Premier 4000 and the Nova Biomedical Stat Profile pHOx Plus L. The Nova Bio-medical StatStrip Lactate and the Abbott iSTAT are the latest handheld devices.
Lactate measurement in ethylene glycol poisoningEthylene glycol poisoning is a medical emergency ini-tially characterised by mild symptoms that may gradu-ally develop to produce serious toxicity or even death [73]. It is rapidly absorbed from the GI tract after ingestion of substances like antifreeze and coolant. It poses a signifi-cant danger to children and animals that are more likely to ingest it due to a characteristic sweet taste. Ethylene glycol metabolism is a four-step process involving alcohol dehydrogenase and aldehyde dehydrogenase. Upon inges-tion, ethylene glycol is oxidised to glycolic acid, which is, in turn, oxidised to oxalic acid, a toxic metabolite [74]. Precipitates of calcium oxalate are deposited in a crystal-line form in the kidneys, leading to nephrocalcinosis and acute kidney injury [75].
UnauthenticatedDownload Date | 1/8/20 9:10 PM
Seheult et al.: Lactic acidosis: an update 329
Diagnosis of ethylene glycol poisoning can be difficult because few institutions have timely access to direct measurement of the compound in blood or the urine [76]. Hence, it is necessary to rely on other biochemical clues to the diagnosis and to have a high index of suspicion in patients presenting with suggestive symptoms and signs. These biochemical clues include a high-AG metabolic acidosis, an osmolal gap, calcium oxalate crystals in the urine, normal creatinine, urea, blood glucose and ketones and a normal blood alcohol level [77].
Interestingly, there have been an increasing number of reports on false increase of lactate in ethylene glycol poisoning [78–80]. Ethylene glycol is not involved in lactate production, and the false elevation of blood lactate is related to ethylene glycol metabolites, mainly glycolic acid but also glyoxylic acid, which have similar chemical structures with L-lactate. This analytical interference is method specific and is due to incomplete specificity of the analytical reagent L-lactate oxidase used in lactate elec-trodes in many blood gas analysers allowing cross-reac-tion with glycolic acid and glyoxylic acid [81, 82]. Hence, the discovery of a lactate gap using two different technolo-gies of lactate measurements, with only one sensitive to glycolic acid/glyoxylic acid, can help to differentiate eth-ylene glycol poisoning from lactic acidosis.
However, using the so-called false lactate gap for the diagnosis of ethylene glycol should be approached with caution. A true increase of lactate can also be observed in ethylene glycol poisoning and should not be ignored because this may add prognostic value in management [77]. Plasma lactate concentration should always be con-firmed in any patient with an elevated whole blood lactate measured on a blood gas analyzer if ethylene glycol poi-soning is being considered.
The clinical significance of D-lactateLactate exists as two optical isomers in nature: D-lactate and L-lactate [83]. L-lactate is by far the more abundant form in humans and mammals, existing at concentra-tions 100 times greater than D-lactate in blood. Both stereoisomers of lactate are produced and metabolised by the enzyme, LDH. However, LDH is isomer-specific, meaning that L-lactate is produced by L-LDH and D-lactate by D-LDH [84, 85]. L-LDH is the only form of the enzyme present in mammals; many carbohydrate-fermenting bacteria, including Lactobacillus sp. and Bifidobacterium sp., possess both forms of the enzyme and are able to produce both stereoisomers in varying proportions [86].
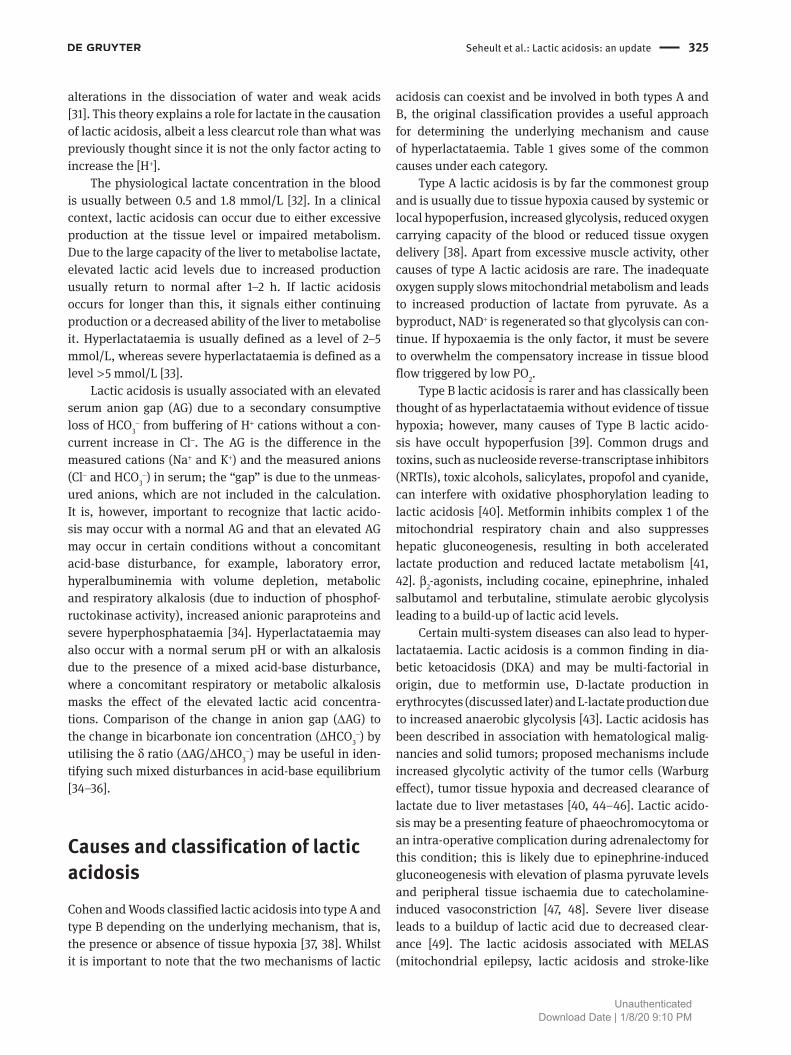
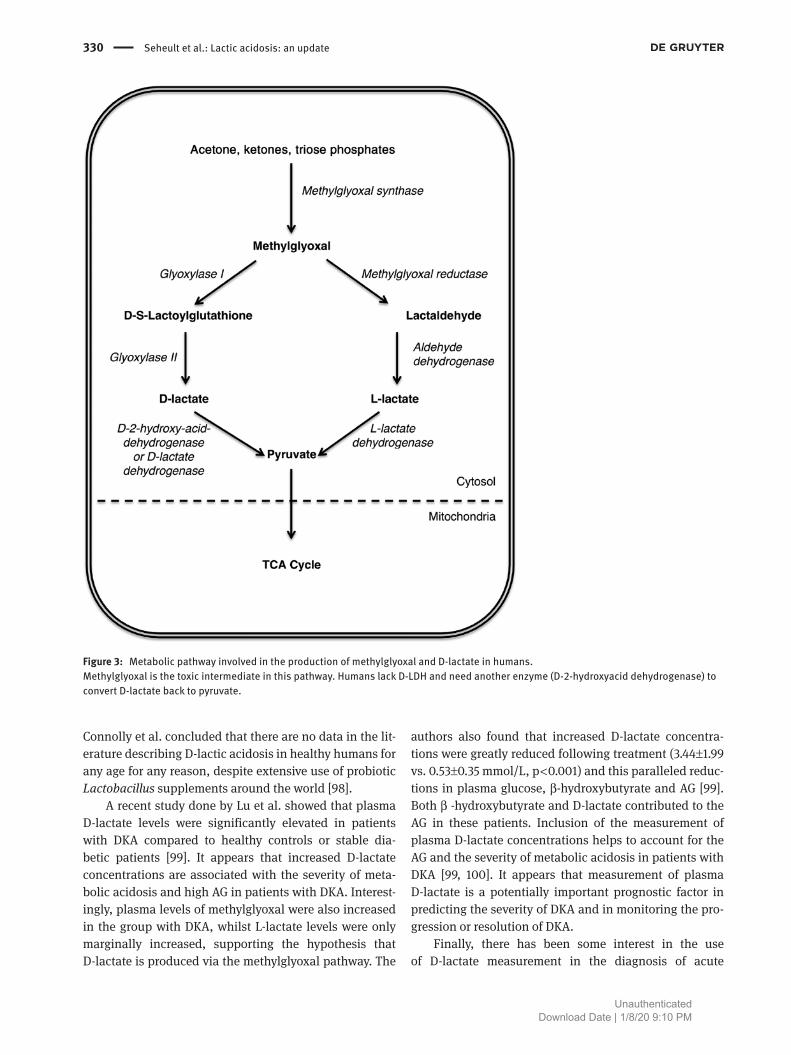
Concentrations of 5–20 μmol/L of D-lactate have been found in the blood of healthy subjects. The previously accepted explanation for this finding was that D-lactate, produced by bacteria in the GI tract, was absorbed into the bloodstream [15, 87]. However, this explanation appears to be insufficient to explain the levels present in human blood. Recently, it has become clear that D-lactate is both produced and metabolised by human cells, albeit by an alternative pathway, the methylglyoxal pathway [88]. The methylglyoxal pathway is an offshoot of glycolysis, which converts glucose into methylglyoxal and then into D-lactate. In the absence of D-LDH, D-lactate is metabo-lised by the enzyme D-2-hydroxyacid-dehydrogenase into pyruvate, which is then diverted into the tricarboxylic acid (TCA) cycle (see Figure 3) [89, 90]. The methylglyoxal pathway does not result in net production of ATP. Methyl-glyoxal is a reactive aldehyde that is very toxic to cells and has been implicated in many complications of Diabetes Mellitus since the excessive intake of glucose by a cell is the most important process for the activation of the meth-ylglyoxal pathway [91].
Current methods for measurement of plasma and whole blood lactate only detect the L-lactate isomer. However, there are a number of recognised clinical scenarios where measurement of D-lactate may be important. D-lactic aci-dosis (plasma D-lactate > 3.0 mmol/L with blood pH < 7.35) is one complication of short bowel syndrome, secondary to diffuse small bowel disease or resection [92, 93]. There is a resulting defect in carbohydrate absorption, which leads to increased substrate delivery to carbohydrate fermenting bacteria in the large bowel. Both D-lactate and L-lactate are produced by these bacteria and absorbed systemically. Whilst the L-LDH in the body can metabolise L-lactate, humans have limited capacity to metabolise D-lactate, resulting in a metabolic acidosis [94]. The levels of D-lac-tate needed to cause an acidaemia is more than a hundred times the levels seen in healthy individuals. D-lactic acido-sis presents with neurological dysfunction and encepha-lopathy [95]. Since L-lactate levels are usually normal, newer sensitive and specific methods have been developed to detect D-lactate in human plasma. These methods are based on the reaction catalysed by D-LDH [96].
Uribarri et al. concluded that a number of factors are necessary for the development of D-lactic acidosis in humans: carbohydrate malabsorption with increased nutrient delivery to the colon, colonic bacterial flora of the type that produces D-lactic acid, ingestion of large amounts of carbohydrates, diminished colonic motility with increased fermentation time, and impaired D-lac-tate metabolism [88]. Oral ingestion of D-lactic acid does not appear to be harmful in humans [97]. Furthermore,
UnauthenticatedDownload Date | 1/8/20 9:10 PM
330 Seheult et al.: Lactic acidosis: an update
Connolly et al. concluded that there are no data in the lit-erature describing D-lactic acidosis in healthy humans for any age for any reason, despite extensive use of probiotic Lactobacillus supplements around the world [98].
A recent study done by Lu et al. showed that plasma D-lactate levels were significantly elevated in patients with DKA compared to healthy controls or stable dia-betic patients [99]. It appears that increased D-lactate concentrations are associated with the severity of meta-bolic acidosis and high AG in patients with DKA. Interest-ingly, plasma levels of methylglyoxal were also increased in the group with DKA, whilst L-lactate levels were only marginally increased, supporting the hypothesis that D-lactate is produced via the methylglyoxal pathway. The
authors also found that increased D-lactate concentra-tions were greatly reduced following treatment (3.44±1.99 vs. 0.53±0.35 mmol/L, p < 0.001) and this paralleled reduc-tions in plasma glucose, β-hydroxybutyrate and AG [99]. Both β -hydroxybutyrate and D-lactate contributed to the AG in these patients. Inclusion of the measurement of plasma D-lactate concentrations helps to account for the AG and the severity of metabolic acidosis in patients with DKA [99, 100]. It appears that measurement of plasma D-lactate is a potentially important prognostic factor in predicting the severity of DKA and in monitoring the pro-gression or resolution of DKA.
Finally, there has been some interest in the use of D-lactate measurement in the diagnosis of acute
Figure 3: Metabolic pathway involved in the production of methylglyoxal and D-lactate in humans.Methylglyoxal is the toxic intermediate in this pathway. Humans lack D-LDH and need another enzyme (D-2-hydroxyacid dehydrogenase) to convert D-lactate back to pyruvate.
UnauthenticatedDownload Date | 1/8/20 9:10 PM
Seheult et al.: Lactic acidosis: an update 331
mesenteric (intestinal) ischaemia [101]. Murray et al. dem-onstrated a significant correlation between the elevation of D-lactate levels and the tissue injury seen in rat models of acute intestinal ischaemia [102]. However, whilst D-lac-tate may have increased specificity compared to L-lactate in this condition, there is still not enough data to show that it is reliable enough to be used for the diagnosis of acute mesenteric ischaemia [103].
ConclusionsLactate is an important substrate and product in interme-diary metabolism. The role of lactate in the causation of metabolic acidosis has been debated widely for the last three decades. Lactic acidosis has numerous etiologies and can be classified based on the presence or absence of tissue hypoxia. Hyperlactataemia is common in criti-cally ill patients. The presence of elevated lactate levels has important prognostic implications in these patients. Hence, there has been a push toward developing and vali-dating POC methods for the measurement of whole blood lactate levels. The finding of a false “lactate gap” may also be useful in the diagnosis of ethylene glycol poisoning due to analytical interference by glycolic and glyoxylic acid, which have similar chemical structures to L-lactate. Finally, D-lactic acidosis, due to an elevation of D-lactate- the stereoisomer of the more commonly measured L-lac-tate, is a more recently described finding in patients with short bowel syndrome and also patients with DKA.
Author contributions: All the authors have accepted responsibility for the entire content of this submitted manuscript and approved submission. J.S. wrote the first draft and contributed to all revisions of the manuscript; G.F. and G.B. highlighted important articles, reviewed the first draft and contributed to the final version.Research funding: None declared.Employment or leadership: None declared.Honorarium: None declared.Competing interests: The funding organization(s) played no role in the study design; in the collection, analysis, and interpretation of data; in the writing of the report; or in the decision to submit the report for publication.
References1. Leverve X, Mustafa I, Péronnet F. Pivotal role of lactate in aerobic
metabolism. In: Vincent J, editor. Berlin: Springer-Verlag, 1998.
2. Leverve XM. Energy metabolism in critically ill patients: lactate is a major oxidizable substrate. Curr Opin Clin Nutr Metab Care 1999;2:165–9.
3. Sekine N, Cirulli V, Regazzi R, Brown LJ, Gine E, Tamarit-Rodriguez J, et al. Low lactate dehydrogenase and high mitochondrial glyc-erol phosphate dehydrogenase in pancreatic beta-cells. Potential role in nutrient sensing. J Biol Chem 1994;269:4895–902.
4. Cano N. Bench-to-bedside review: glucose production from the kidney. Crit Care (London, England) 2002;6:317–21.
5. Tayek JA, Katz J. Glucose production, recycling, Cori cycle, and gluconeogenesis in humans: relationship to serum cortisol. Am J Physiol 1997;272(3 Pt 1):E476–84.
6. Bellomo R. Bench-to-bedside review: lactate and the kidney. Crit Care 2002;6:322–6.
7. Juel C. Lactate-proton cotransport in skeletal muscle. Physiol Rev 1997;77:321–58.
8. Juel C. Muscle pH regulation: role of training. Acta Physiol Scand 1998;162:359–66.
9. Gladden LB. Lactate metabolism: a new paradigm for the third millennium. J Physiol 2004;558:5–30.
10. Margaria R, Edwards RHT, Dill DB, J. The possible mechanisms of contracting and paying the oxygen debt and the role of lactic acid in muscular contraction. Am 1933;106:689–715.
11. Wasserman K. The anaerobic threshold measurement to evalu-ate exercise performance. Am Rev Respir Dis 1984;129(2 Pt 2):S35–40.
12. Brooks GA. Lactate: glycolytic end product and oxidative substrate during sustained exercise in mammals – the “lactate shuttle”. Circ Respir Metab Proc Life Sci . 1985:208–18.
13. Brooks GA. Intra- and extra-cellular lactate shuttles. Med Sci Sports Exerc 2000;32:790–9.
14. Gladden LB. Muscle as a consumer of lactate. Med Sci Sports Exerc 2000;32:764–71.
15. Richter EA, Kiens B, Saltin B, Christensen NJ, Savard G. Skeletal muscle glucose uptake during dynamic exercise in humans: role of muscle mass. Am J Physiol 1988;254(5 Pt 1):E555–61.
16. Ide K, Secher NH. Cerebral blood flow and metabolism during exercise. Prog Neurobiol 2000;61:397–414.
17. Stanley WC. Myocardial lactate metabolism during exercise. Med Sci Sports Exerc 1991;23:920–4.
18. Miller BF, Fattor JA, Jacobs KA, Horning MA, Navazio F, Lindinger MI, et al. Lactate and glucose interactions during rest and exercise in men: effect of exogenous lactate infusion. J Physiol 2002;544(Pt 3):963–75.
19. Miller BF, Fattor JA, Jacobs KA, Horning MA, Suh S-H, Navazio F, et al. Metabolic and cardiorespiratory responses to “the lactate clamp”. Am J Physiol Endocrinol Metab 2002;283:E889–98.
20. Brooks GA. Cell-cell and intracellular lactate shuttles. J Physiol 2009;587(Pt 23):5591–600.
21. Skelton MS, Kremer DE, Smith EW, Gladden LB. Lactate influx into red blood cells from trained and untrained human subjects. Med Sci Sports Exerc 1998;30:536–42.
22. Smith GC, Clarke DM, Handrinos D, Dunsis A. Consultation-liai-son psychiatrists management of depression. Psychosomatics 1998;39:244–52.
23. Brooks GA. Mammalian fuel utilization during sustained exer-cise. Comp Biochem Physiol Mol Biol 1998;120:89–107.
24. Brooks GA. Lactate shuttles in nature. Biochem Soc Trans 2002;30:258–64.
UnauthenticatedDownload Date | 1/8/20 9:10 PM
332 Seheult et al.: Lactic acidosis: an update
25. Gladden LB. Lactate uptake by skeletal muscle. Exerc Sport Sci Rev 1989;17:115–55.
26. Kurtz I, Kraut J, Ornekian V, J. Acid-base analysis: a critique of Stewart and bicarbonate-centered approaches. Am Renal Physiol 2008;295:F1009–31.
27. Corey HE. Stewart and beyond: new models of acid-base bal-ance. Kidney Int 2003;64:777–87.
28. Robergs RA, Ghiasvand F, Parker D. Biochemistry of exercise-induced metabolic acidosis. Am J Physiol Regul Integr Comp Physiol 2004;287:R502–16.
29. Robergs RA, Ghiasvand F, Parker D. The wandering argu-ment favoring a lactic acidosis. Am Regul Integr Comp Physiol 2006;291:R238–39.
30. Fencl V, Leith DE. Stewart’s quantitative acid-base chemistry: applications in biology and medicine. Respir Physiol 1993;91: 1–16.
31. Stewart PA. How to understand acid-base. New York, NY: Else-vier, 1981.
32. Kruse O, Grunnet N, Barfod C. Blood lactate as a predictor for in-hospital mortality in patients admitted acutely to hospi-tal: a systematic review. Scand J Trauma Resusc Emerg Med 2011;19:74.
33. Brinkman K. Editorial response: hyperlactatemia and hepatic steatosis as features of mitochondrial toxicity of nucleoside analogue reverse transcriptase inhibitors. Clin Infect Dis 2000;31:167–9.
34. Kraut JA, Madias NE. Serum anion gap: its uses and limitations in clinical medicine. Clin J Am Soc Nephrol 2007;2:162–74.
35. Wrenn K. The delta (delta) gap: an approach to mixed acid-base disorders. Ann Emerg Med 1990;19:1310–3.
36. Kim HY, Han JS, Jeon US, Joo KW, Earm JH, Ahn C, et al. Clinical significance of the fractional excretion of anions in metabolic acidosis. Clin Nephrol 2001;55:448–52.
37. Bakker J. Blood lactate levels. Curr Opin Crit Care 1999;5:234–9.38. Cohen RD, Woods HF. The clinical presentation and classi-
fication of lactic acidosis. Oxford, UK: Blackwell Scientific, 1976:1–200.
39. Fall PJ, Szerlip HM. Lactic acidosis: from sour milk to septic shock. J Intensive Care Med 2005;20:255–71.
40. Kraut JA, Madias NE. Lactic acidosis. N Engl J Med 2014;371:2309–19.
41. Wang DS, Kusuhara H, Kato Y, Jonker JW, Schinkel AH, Sugiyama Y. Involvement of organic cation transporter 1 in the lactic acido-sis caused by metformin. Mol Pharmacol 2003;63:844–8.
42. DeFronzo R, Fleming GA, Chen K, Bicsak TA. Metformin-associ-ated lactic acidosis: Current perspectives on causes and risk. Metabolism 2016;65:20–9.
43. Feenstra RA, Kiewiet MKP, Boerma EC, ter Avest E. Lactic acidosis in diabetic ketoacidosis. BMJ Case Rep. 2014;2014:bcr2014203594.
44. Swietach P, Vaughan-Jones RD, Harris AL, Hulikova A. The chem-istry, physiology and pathology of pH in cancer. Philos Trans R Soc Lond B Biol Sci 2014;369:20130099.
45. Okorie ON, Dellinger P. Lactate: biomarker and potential thera-peutic target. Crit Care Clin 2011;27:299–326.
46. Friedenberg AS, Brandoff DE, Schiffman FJ. Type B lactic acidosis as a severe metabolic complication in lymphoma and leukemia: a case series from a single institution and literature review. Medicine (Baltimore) 2007;86:225–32.
47. Suzuki K, Tanaka S, Uchida T, Nakazawa K, Makita K. Catecho-lamine release induces elevation in plasma lactate levels in
patients undergoing adrenalectomy for pheochromocytoma. J Clin Anesth 2014;26:616–22.
48. Taliercio JJ, Bravo E. An unusual presentation of pheochromocy-toma. NDT Plus 2011;4:331–4.
49. Heinig RE, Clarke EF, Waterhouse C. Lactic acidosis and liver disease. Arch Intern Med 1979;139:1229–32.
50. El-Hattab AW, Adesina AM, Jones J, Scaglia F. MELAS syndrome: Clinical manifestations, pathogenesis, and treatment options. Mol Genet Metab 2015;116:4–12.
51. Oriot D, Wood C, Gottesman R, Huault G. Severe lactic acidosis related to acute thiamine deficiency. JPEN J Parenter Enteral Nutr 1991;15:105–9.
52. Shah S, Wald E. Type B lactic acidosis secondary to thiamine deficiency in a child with malignancy. Pediatrics 2015;135: e221–4.
53. Anderson SL, Borgelt LM. Case report: risk of uterine perforation from IUDs is greatest during postpartum period. Am Fam Physi-cian 2013;88:634–6.
54. Vary TC, Siegel JH, Nakatani T, Sato T, Aoyama H. Effect of sepsis on activity of pyruvate dehydrogenase complex in skeletal mus-cle and liver. Am J Physiol 1986;250(6 Pt 1):E634–40.
55. Wolfe RR, Jahoor F, Herndon DN, Miyoshi H. Isotopic evaluation of the metabolism of pyruvate and related substrates in normal adult volunteers and severely burned children: effect of dichlo-roacetate and glucose infusion. Surgery 1991;110:54–67.
56. Gore DC, Jahoor F, Hibbert JM, DeMaria EJ. Lactic acidosis during sepsis is related to increased pyruvate production, not deficits in tissue oxygen availability. Ann Surg 1996;224:97–102.
57. Levy B, Desebbe O, Montemont C, Gibot S. Increased aerobic glycolysis through beta2 stimulation is a common mecha-nism involved in lactate formation during shock states. Shock 2008;30:417–21.
58. Stacpoole PW, Wright EC, Baumgartner TG, Bersin RM, Buchalter S, Curry SH, et al. Natural history and course of acquired lactic acidosis in adults. DCA-Lactic Acidosis Study Group. Am J Med 1994;97:47–54.
59. Khosravani H, Shahpori R, Stelfox HT, Kirkpatrick AW, Laup-land KB. Occurrence and adverse effect on outcome of hyper-lactatemia in the critically ill. Crit Care (London, England) 2009;13:R90.
60. Bakker J, Coffernils M, Leon M, Gris P, Vincent JL. Blood lactate levels are superior to oxygen-derived variables in predicting outcome in human septic shock. Chest 1991;99:956–62.
61. Jansen TC, van Bommel J, Mulder PG, Rommes JH, Schieveld SJM, Bakker J. The prognostic value of blood lactate levels relative to that of vital signs in the pre-hospital setting: a pilot study. Crit Care (London, England) 2008;12:R160.
62. Polonen P, Ruokonen E, Hippelainen M. A prospective, rand-omized study of goal-oriented hemodynamic therapy in cardiac surgical patients. Anesth Analg 2000;90:1052–9.
63. Jones AE, Shapiro NI, Trzeciak S, Arnold RC, Claremont HA, Kline JA, et al. Lactate clearance vs central venous oxygen saturation as goals of early sepsis therapy: a randomized clinical trial. J Am Med Assoc 2010;303:739–46.
64. Bakker J, Nijsten MW, Jansen TC. Clinical use of lactate monitor-ing in critically ill patients. Ann Intensive Care 2013;3:12.
65. Jansen TC, van Bommel J, Schoonderbeek FJ, Sleeswijk Visser SJ, van der Klooster JM, Lima AP, et al. Early lactate-guided therapy in intensive care unit patients: a multicenter, open-label, randomized controlled trial. Am J Respir Crit Care Med 2010;182:752–61.
UnauthenticatedDownload Date | 1/8/20 9:10 PM
Seheult et al.: Lactic acidosis: an update 333
66. Marik PE, Bellomo R. Lactate clearance as a target of therapy in sepsis: a flawed paradigm. OA Critical Care 2013;1:3–8.
67. Noordally O, Vincent JL. Evaluation of a new, rapid lactate ana-lyzer in critical care. Intensive Care Med 1999;25:508–13.
68. National Academy of Clinical Biochemistry. National Academy of Clinical Biochemistry Laboratory Medicine Practice Guidelines: Draft Guidelines: Evidence Based Practice for POCT 2004 [cited 2006 Sep 12]. Available from: http://www.aacc.org/AACC/members/nacb/LMPG/OnlineGuide/DraftGuidelines/EB_for_POCT2004.
69. Karon BS, Scott R, Burritt MF, Santrach PJ. Comparison of lactate values between point-of-care and central laboratory analyzers. Am J Clin Pathol 2007;128:168–71.
70. Hollaar L, Van der Laarse A. Interference of the measurement of lactate dehydrogenase (LDH) activity in human serum and plasma by LDH from blood cells. Clin Chim Acta 1979;99:135–42.
71. Biedler A, Schneider S, Bach F. Methodological aspects of lactate measurement-evaluation of the accuracy of photometric and biosensor methods. Open Anesthesiol J 2007;1:1–5.
72. White R, Yaeger D, Stavrianeas S. Determination of blood lactate concentration: reliability and validity of a lactate oxidase-based method. J Int Sci 2009;2:83–93.
73. Takayesu JK, Bazari H, Linshaw M. Case records of the Mas-sachusetts General Hospital. Case 7-2006. A 47-year-old man with altered mental status and acute renal failure. N Engl J Med 2006;354:1065–72.
74. Parry MF, Wallach R. Ethylene glycol poisoning. Am J Med 1974;57:143–50.
75. Jacobsen D, McMartin KE. Methanol and ethylene glycol poison-ings. Mechanism of toxicity, clinical course, diagnosis and treat-ment. Med Toxicol 1986;1:309–34.
76. Hewlett TP, McMartin KE, Lauro AJ, Ragan FA. Ethylene glycol poisoning. The value of glycolic acid determinations for diagno-sis and treatment. J Clin Toxicol 1986;24:389–402.
77. Porter WH. Ethylene glycol poisoning: quintessential clinical toxicology; analytical conundrum. Clin Chim Acta. 2012;413: 365–77.
78. Pernet P, Bénéteau-Burnat B, Vaubourdolle M, Maury E, Offen-stadt G. False elevation of blood lactate reveals ethylene glycol poisoning. Am J Emerg Med 2009;27:132.e1–2.
79. Verelst S, Vermeersch P, Desmet K. Ethylene glycol poisoning presenting with a falsely elevated lactate level. Clin Toxicol (Phila) 2009;47:236–8.
80. Woo MY, Greenway DC, Nadler SP. Artifactual elevation of lactate in ethylene glycol poisoning. J Med 2003;23:289–93.
81. Manini AF, Hoffman RS, McMartin KE, Nelson LS. Relationship between serum glycolate and falsely elevated lactate in severe ethylene glycol poisoning. J Anal Toxicol 2009;33:174–6.
82. Meng QH, Adeli K, Zello GA, Porter WH, Krahn J. Elevated lactate in ethylene glycol poisoning: true or false? Clin Chim Acta 2010;411:601–4.
83. Ewaschuk JB, Naylor JM, Zello GA. D-lactate in human and rumi-nant metabolism. J Nutr 2005;135:1619–25.
84. Drury DR. Chemistry and metabolism of L(+) and D(-0 lactic acids. Ann N Y Acad Sci 1965;119:1061–9.
85. Dunlop RH, Hammond PB. D-lactic acidosis of ruminants. Ann N Y Acad Sci 1965;119:1109–32.
86. Hove H, Mortensen PB. Colonic lactate metabolism and D-lactic acidosis. Dig Dis Sci 1995;40:320–30.
87. Smith SM, Eng RH, Buccini F. Use of D-lactic acid measure-ments in the diagnosis of bacterial infections. J Infect Dis 1986;154:658–64.
88. Uribarri J, Oh MS, Carroll HJ. D-lactic acidosis. A review of clini-cal presentation, biochemical features, and pathophysiologic mechanisms. Medicine 1998;77:73–82.
89. Cammack R. Assay, purification and properties of mammalian D-2-hydroxy acid dehydrogenase. Biochem J 1969;115:55–64.
90. Tubbs PK. The metabolism of D-alpha-hydroxy acids in animal tissues. Ann N Y Acad Sci 1965;119:920–6.
91. Rabbani N, Thornalley PJ. The critical role of methylglyoxal and glyoxalase 1 in diabetic nephropathy. Diabetes 2014;63:50–2.
92. Halperin ML, Kamel KS. D-lactic acidosis: turning sugar into acids in the gastrointestinal tract. Kidney Int 1996;49:1–8.
93. Halverson J, Gale A, Lazarus C. D-lactic acidosis and other complications of intestinal bypass surgery. Arch Intern Med 1984;144:357–60.
94. Oh MS, Uribarri J, Alveranga D, Lazar I, Bazilinski N, Carroll HJ. Metabolic utilization and renal handling of D-lactate in men. Metabolism 1985;34:621–5.
95. LaManna JC, Harrington JF, Vendel LM, Abi-Saleh K, Lust WD, Harik SI. Regional blood-brain lactate influx. Brain Res 1993;614:164–70.
96. Martí R, Varela E, Segura RM, Alegre J, Suriñach JM, Pascual C. Determination of D-lactate by enzymatic methods in biologi-cal fluids: study of interferences. Clin Chem 1997;43(6 Pt 1):1010–5.
97. De Vrese M, Barth CA. Postprandial plasma D-lactate concentrations after yoghurt ingestion. Z Ernahrungswiss 1991;30:131–7.
98. Connolly E, Lonnerdal B. D(-)-Lactic acid-producing bacteria: Safe to use in infant formulas. Nutrafoods 2004;3:37–49.
99. Lu J, Zello GA, Randell E, Adeli K, Krahn J, Meng QH. Closing the anion gap: contribution of D-lactate to diabetic ketoacidosis. Clin Chim Acta 2011;412:286–91.
100. Bo J, Li W, Chen Z, Wadden DG, Randell E, Zhou H, et al. D-lactate: a novel contributor to metabolic acidosis and high anion gap in diabetic ketoacidosis. Clin Chem 2013;59:1406–7.
101. Evennett NJ, Petrov MS, Mittal A, Windsor JA. Systematic review and pooled estimates for the diagnostic accuracy of serological markers for intestinal ischemia. World J Surg 2009;33:1374–83.
102. Murray MJ, Barbose JJ, Cobb CF. Serum D(-)-lactate levels as a predictor of acute intestinal ischemia in a rat model. J Surg Res 1993;54:507–9.
103. Demir IE, Ceyhan GO, Friess H. Beyond lactate: is there a role for serum lactate measurement in diagnosing acute mesenteric ischemia? Dig Surg 2012;29:226–35.
UnauthenticatedDownload Date | 1/8/20 9:10 PM