Embed Size (px)
Citation preview

Economics of Cover CropsJames J. Hoorman
Ohio State [email protected]
OHIO STATE UNIVERSITY EXTENSION

Cost of Tillage Operations/Acre• Chisel Plow $14/A• Disk Tandem $13/A• Field Cultivate $11/A• Plow $17/A• Soil Finishing Tools $11/A
• Subsoil $18/A
Ohio Farm Custom Rates 2010 Barry Ward, OSU Economist
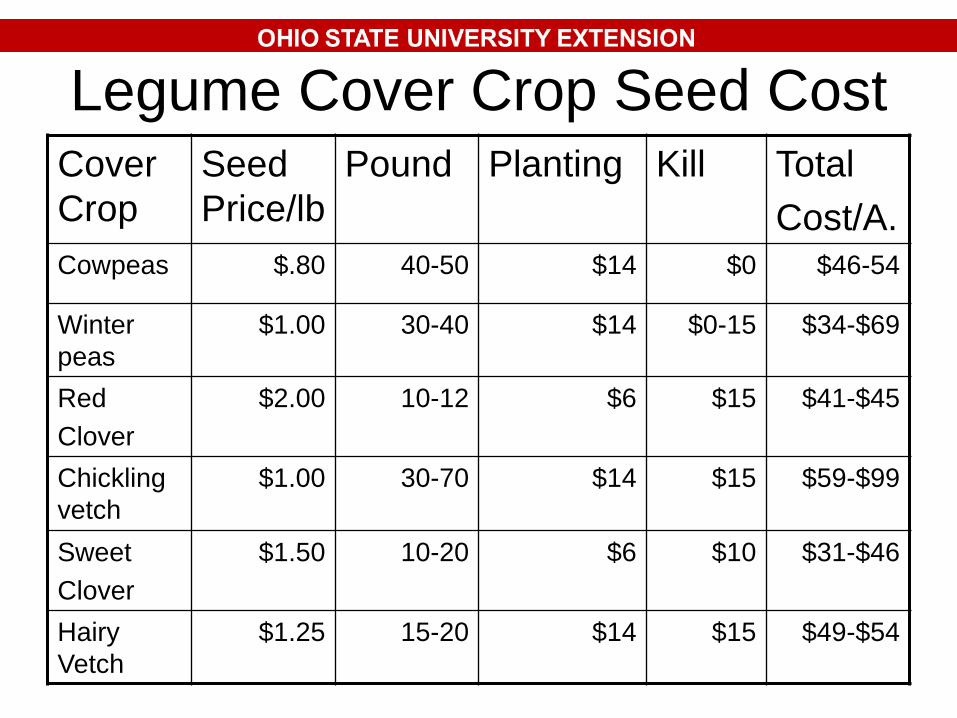
Legume Cover Crop Seed CostCover Crop
Seed Price/lb
Pound Planting Kill TotalCost/A.
Cowpeas $.80 40-50 $14 $0 $46-54
Winter peas
$1.00 30-40 $14 $0-15 $34-$69
RedClover
$2.00 10-12 $6 $15 $41-$45
Chickling vetch
$1.00 30-70 $14 $15 $59-$99
SweetClover
$1.50 10-20 $6 $10 $31-$46
Hairy Vetch
$1.25 15-20 $14 $15 $49-$54

Grass Cover Crop Seed CostCover Crop
Seed Price/lb
Pound Planting Kill TotalCost/A.
Cereal Rye
$.20$12/bu
601 bu
$14 $15 $41
Annual rye
$.80 15-25 $14 $15 $41-$49
Wheat $.10$6/bu
601 bu
$14 $15 $35
Oats $.15$6/Bu
42-631-1.5 bu
$14 $0 $20-$23
BrassicasOilseed Radish
$3.00 1-10 $14 $0 $17-$44

Value of Soil Organic Matter
Assumptions: 2,000,000 pounds soil in top 6 inches1% organic matter = 20,000#
Nutrients:Nitrogen: 1000# * $0.50/#N = $500Phosphorous: 100# * $0.70/#P = $ 70Potassium: 100# * $0.50/#K = $ 50Sulfur: 100# * $0.50/#S = $ 50Carbon: 10,000# or 5 ton * $?/Ton = $ 0
Value of 1% SOM Nutrients/Acre = $670
Original Jim Kinsella/Terry Taylor(2006)/revised Jim Hoorman (2011)

Soil Organic Matter Accumulation
• Takes 10 tons of Decomposed Organic Matter to equal 1% SOM
• If start with 40 tons Organic Matter and lose 75% to get 10 tons decomposed SOM
• Accumulate 4-6 tons and lose 75% equals 1-1.5 tons Decomposed SOM or .1-.15% SOM * $670/Acre or $67 to $100/Acre
You are Building Your Soil Fertility with SOM!
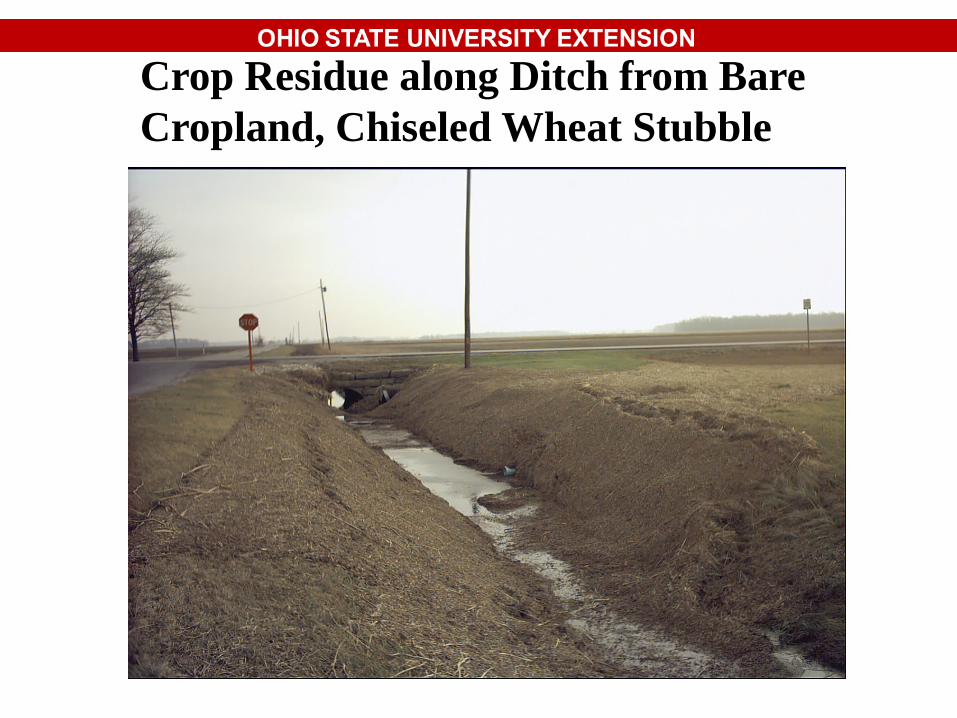
Crop Residue along Ditch from Bare Cropland, Chiseled Wheat Stubble
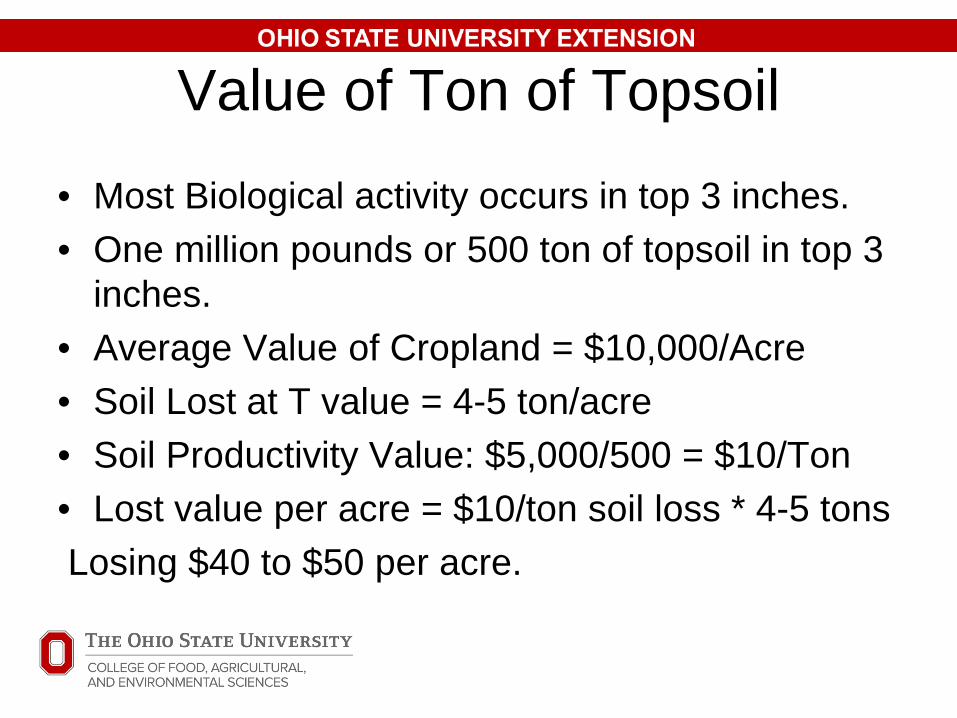
Value of Ton of Topsoil
• Most Biological activity occurs in top 3 inches. • One million pounds or 500 ton of topsoil in top 3
inches.• Average Value of Cropland = $10,000/Acre• Soil Lost at T value = 4-5 ton/acre• Soil Productivity Value: $5,000/500 = $10/Ton• Lost value per acre = $10/ton soil loss * 4-5 tonsLosing $40 to $50 per acre.

Productivity of SOM• Michigan study: Every 1% SOM =12% increase in
crop yields.• Baseline Yields: 170 bu corn, 50 bu soybeans
Starting SOM = 2.5% and add 1% SOM
Soybeans 50 bu * 12% = 6 bu * $10 = $60/A..1 to.15% SOM increase/year = $6-$9/yr.
Corn 170 bu * 12% = 20.4 bu * $4 = $81/A .1 to.15% SOM increase/year = $8.10-$12.30/yr.

Lime Costs/acre
• 1 to 2 tons of lime per acre * $15/Ton• Plus spreading cost $6/Acre• Total lime cost: $36/Acre over 3-5 years• Cost /Acre/Year: $7-$12• No-till and Cover Crops need less lime
because they keep Ca2+ circulating
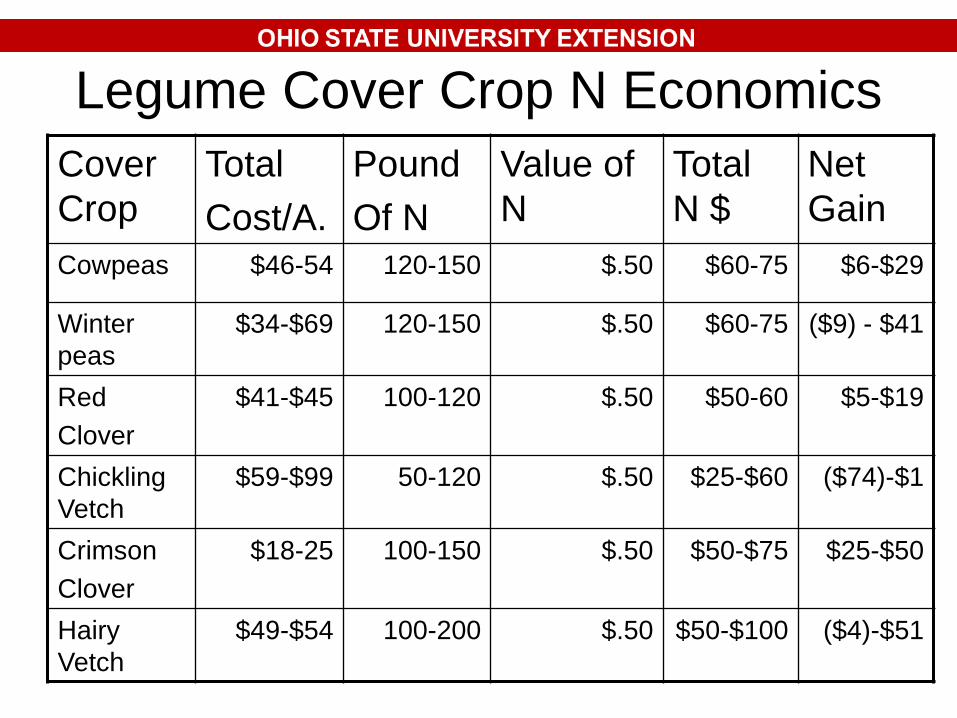
Legume Cover Crop N EconomicsCover Crop
TotalCost/A.
PoundOf N
Value of N
Total N $
Net Gain
Cowpeas $46-54 120-150 $.50 $60-75 $6-$29
Winter peas
$34-$69 120-150 $.50 $60-75 ($9) - $41
RedClover
$41-$45 100-120 $.50 $50-60 $5-$19
Chickling Vetch
$59-$99 50-120 $.50 $25-$60 ($74)-$1
CrimsonClover
$18-25 100-150 $.50 $50-$75 $25-$50
Hairy Vetch
$49-$54 100-200 $.50 $50-$100 ($4)-$51

Drainage• $800 to $1000/acre for subsurface drainage.• Farmers say you pay for drainage every 20
years whether you pay for it or not. Poor drainage costs you in reduced yields.Keep $1000 in Bank, Collect 2-3% interestSpend Interest on Cover Crops: $20-30/A.Still have principal at end of 20 years.
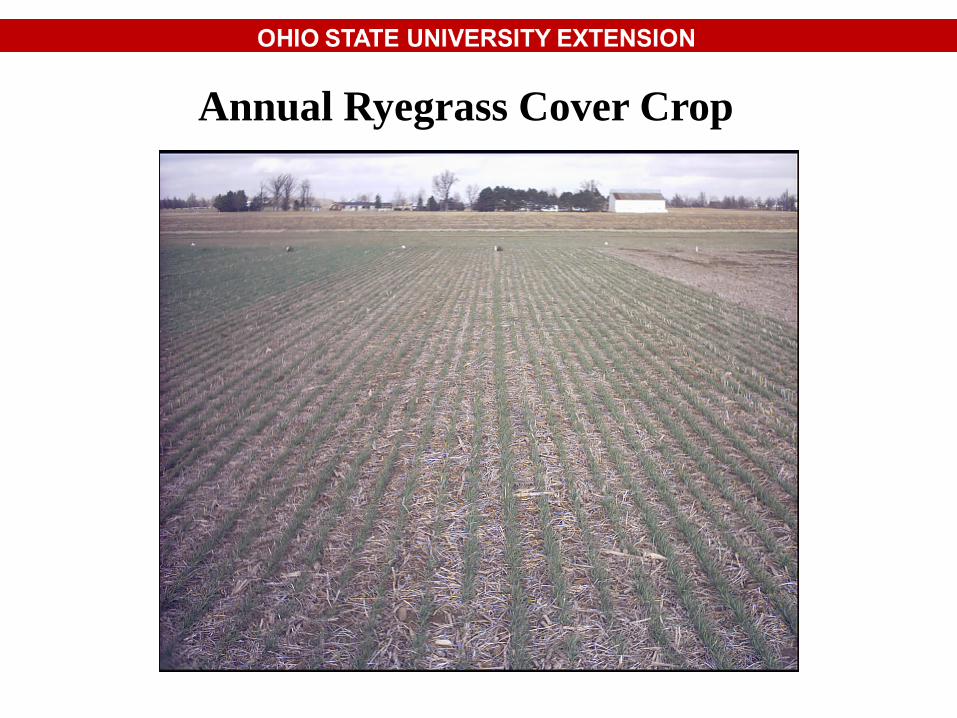
Annual Ryegrass Cover Crop
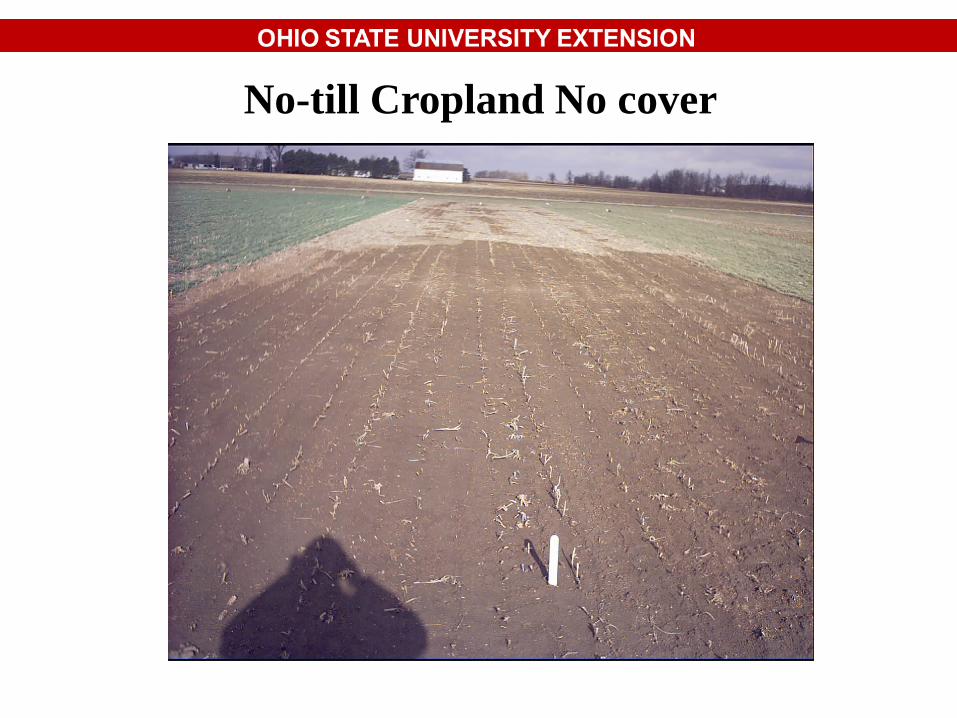
No-till Cropland No cover

Annual Ryegrass Cover Crop

Soil Temperature DifferencesConventional /No-till?? No-till + Cover Crops &
Live Plants
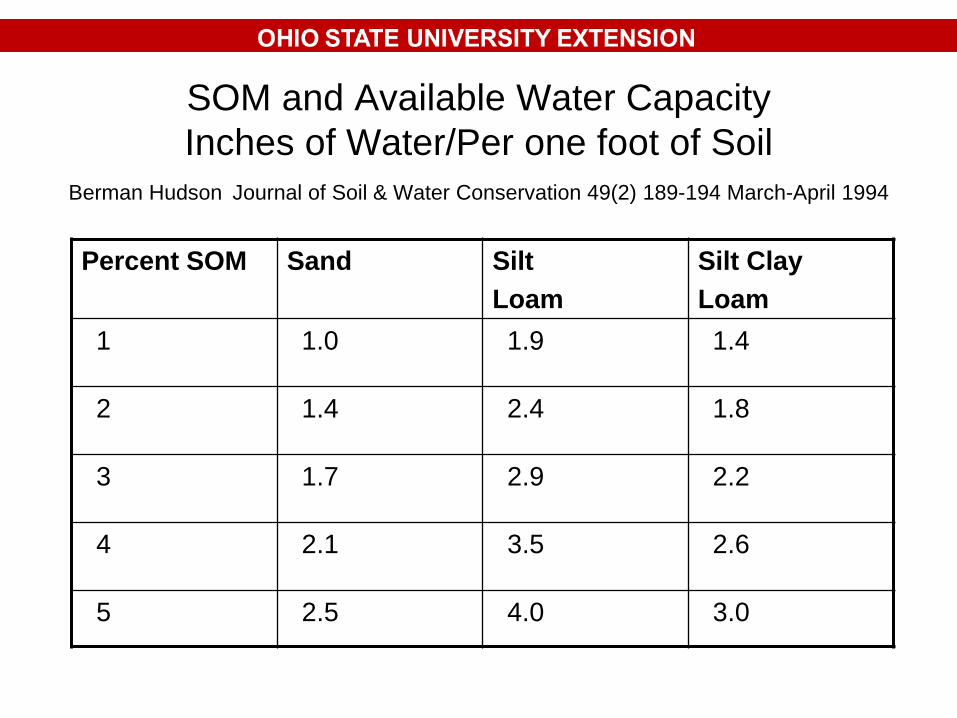
SOM and Available Water CapacityInches of Water/Per one foot of Soil
Berman Hudson Journal of Soil & Water Conservation 49(2) 189-194 March-April 1994
Percent SOM Sand SiltLoam
Silt ClayLoam
1 1.0 1.9 1.4
2 1.4 2.4 1.8
3 1.7 2.9 2.2
4 2.1 3.5 2.6
5 2.5 4.0 3.0

For Hot Dry Summers
For Corn Production:75 degrees Fahrenheit – 1 Inch water/week85 degrees Fahrenheit – 2 inch water/week95 degrees Fahrenheit – 4 inch water/week
2X Water requirements for every 10F increase1” Rain = 8 bu. corn, 22” needed for 200 bu. Corn Rain = 19-23 inch/year in growing season1” Rain fully used = 8 bu/A * $4 = $32/A
Heat and drought quickly increase yield losses!By Elwynn Taylor, Iowa Ag. Climatologist

SOM Buffers Soil Temperatures• Early frost 1/20 years• Value to replant soybeans $120/acre• Value of frost
protection over 20 years = $6/acre/year

Continuous no-tillIntensive tillage
Ontario Ministry of Ag and Food
Plow panNetwork
of biopores
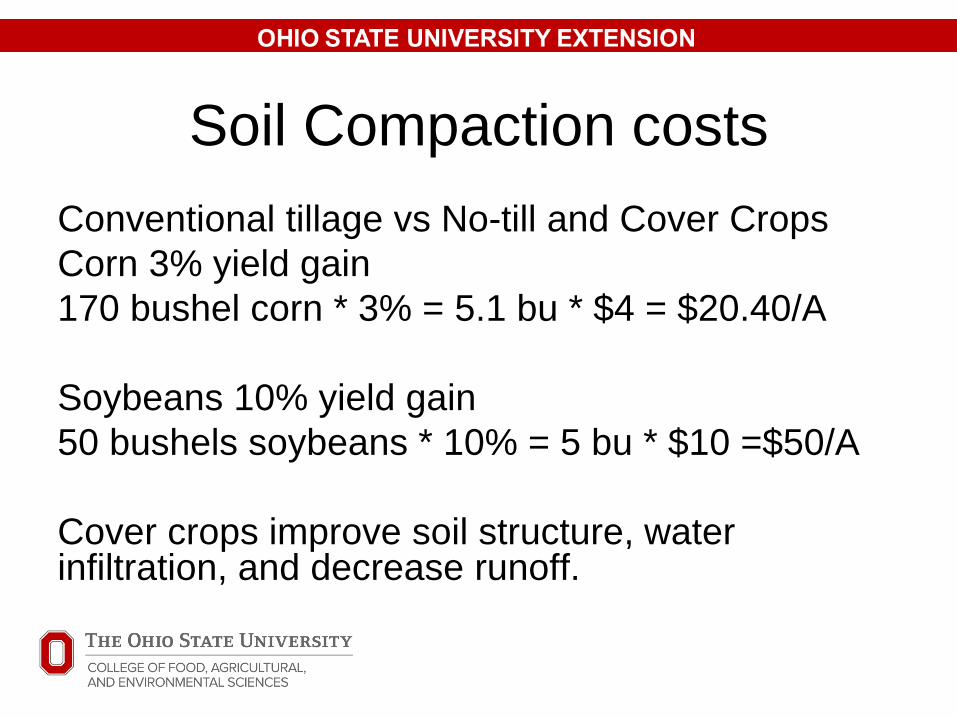
Soil Compaction costsConventional tillage vs No-till and Cover Crops Corn 3% yield gain 170 bushel corn * 3% = 5.1 bu * $4 = $20.40/A
Soybeans 10% yield gain50 bushels soybeans * 10% = 5 bu * $10 =$50/A
Cover crops improve soil structure, water infiltration, and decrease runoff.

Cover Crop Effects
No Cover Crop80+/- bu/ac
6 years CC (annual ryegrass) 160+/- bu/ac
Mike Plumer’s long-term no till with ryegrass cover crops on heavy clay soil.

2005 IllinoisDemonstration Results
Tillage/cover crop Yield bu./A.Conventional tillage 82 No cover crop no-till 124Ryegrass 1 year no-till 137Ryegrass 6 years –claypan 165Ryegrass 6 years no claypan 215
Rain fall …. May- Sept. 2.3”

Cover Crop Benefits in Drought2005 Illinois Corn Data (2.3 inches rain)Conventional tillage 82bu.No-till 124-82=42 bushels * $4.00/Bu = $168No-till + Annual Rye 137-82=55*$4.00 = $220$220/20 years = $11/Acre/Year
Negative Effects:Cover crops may excessively dry the soil through respiration in a dry spring. Solution is to kill the cover crop early if the soil is getting too dry.
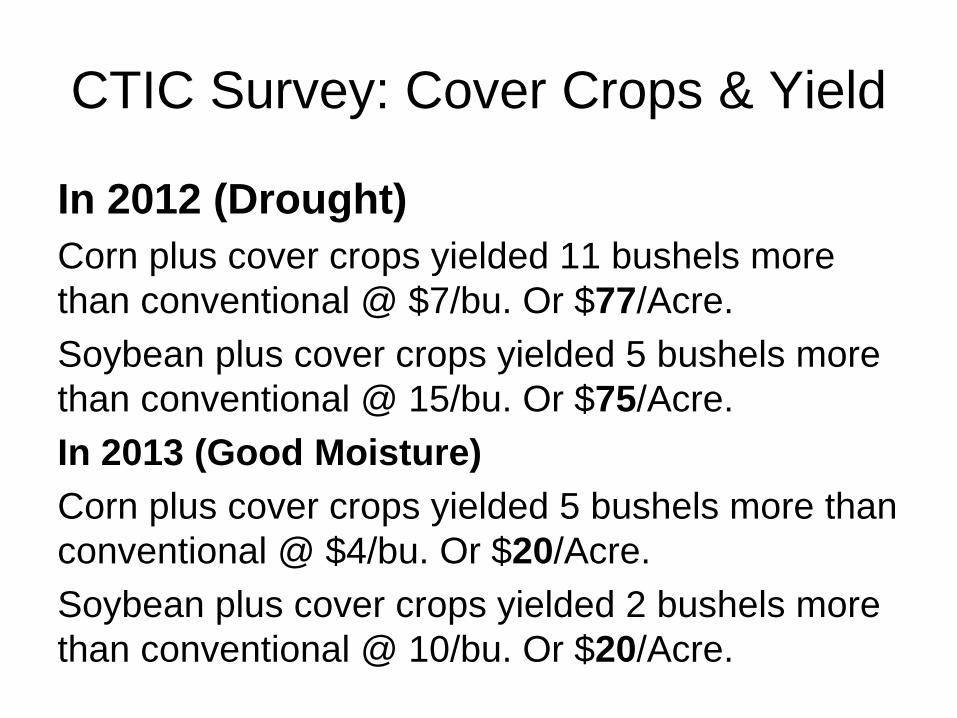
CTIC Survey: Cover Crops & Yield
In 2012 (Drought)Corn plus cover crops yielded 11 bushels more than conventional @ $7/bu. Or $77/Acre.Soybean plus cover crops yielded 5 bushels more than conventional @ 15/bu. Or $75/Acre.In 2013 (Good Moisture)Corn plus cover crops yielded 5 bushels more than conventional @ $4/bu. Or $20/Acre.Soybean plus cover crops yielded 2 bushels more than conventional @ 10/bu. Or $20/Acre.

Robison Farms Corn Yields w/woCover Crops - 2012
Plot Corn Yield
check (no cover crop on No-till, replicated 3 times) 105.24
Annual Ryegrass + Crimson Clover + Radish 120.31
Winter Cereal Rye 126.86
Oats + Radish 138.79
Annual Ryegrass Blend 134.27
Annual Ryegrass + Crimson Clover 136.41
Crimson Clover + Radish 153.99
Oats + Rye + Appin Turnips 164.37
Austrian Winter Peas + Radish 164.82
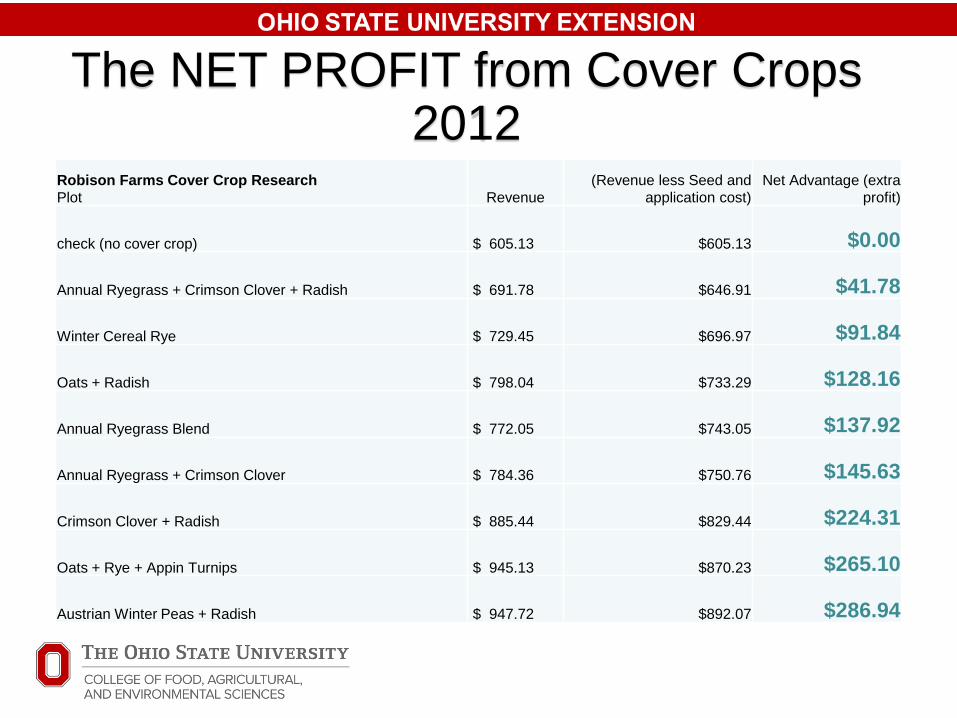
The NET PROFIT from Cover Crops 2012
Robison Farms Cover Crop ResearchPlot Revenue
(Revenue less Seed and application cost)
Net Advantage (extraprofit)
check (no cover crop) $ 605.13 $605.13 $0.00
Annual Ryegrass + Crimson Clover + Radish $ 691.78 $646.91 $41.78
Winter Cereal Rye $ 729.45 $696.97 $91.84
Oats + Radish $ 798.04 $733.29 $128.16
Annual Ryegrass Blend $ 772.05 $743.05 $137.92
Annual Ryegrass + Crimson Clover $ 784.36 $750.76 $145.63
Crimson Clover + Radish $ 885.44 $829.44 $224.31
Oats + Rye + Appin Turnips $ 945.13 $870.23 $265.10
Austrian Winter Peas + Radish $ 947.72 $892.07 $286.94
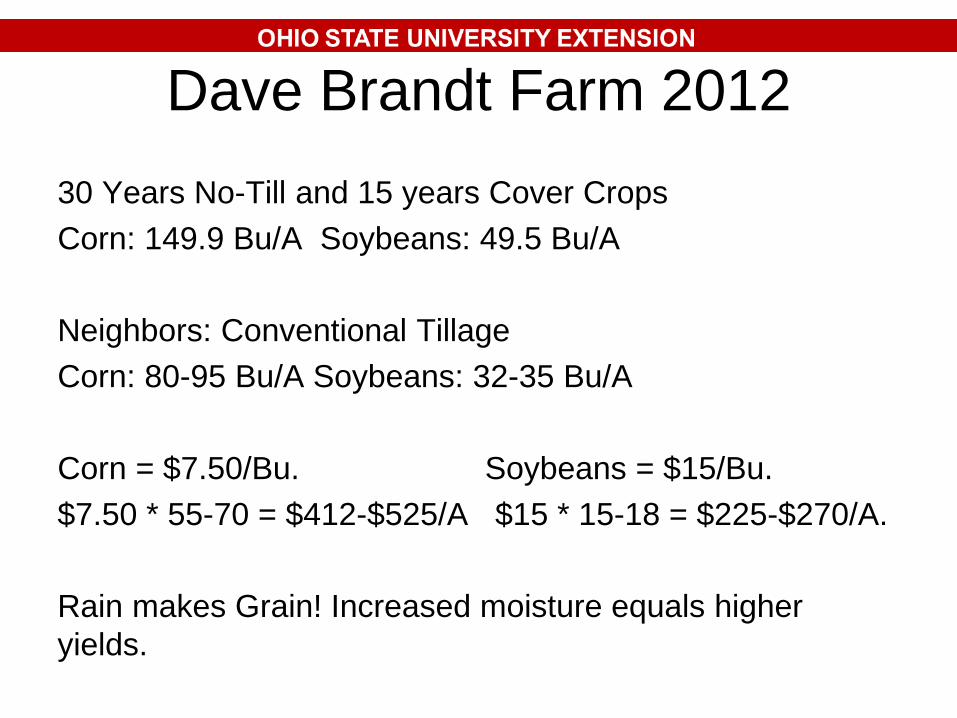
Dave Brandt Farm 201230 Years No-Till and 15 years Cover CropsCorn: 149.9 Bu/A Soybeans: 49.5 Bu/A
Neighbors: Conventional TillageCorn: 80-95 Bu/A Soybeans: 32-35 Bu/A
Corn = $7.50/Bu. Soybeans = $15/Bu.$7.50 * 55-70 = $412-$525/A $15 * 15-18 = $225-$270/A.
Rain makes Grain! Increased moisture equals higher yields.
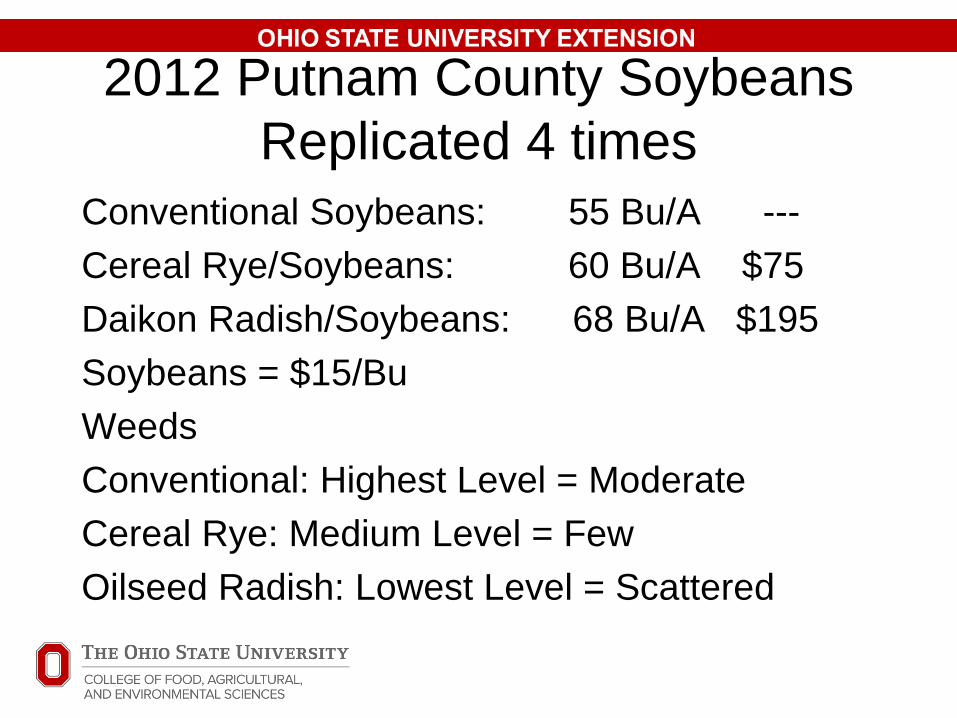
2012 Putnam County SoybeansReplicated 4 times
Conventional Soybeans: 55 Bu/A ---Cereal Rye/Soybeans: 60 Bu/A $75Daikon Radish/Soybeans: 68 Bu/A $195Soybeans = $15/BuWeedsConventional: Highest Level = ModerateCereal Rye: Medium Level = FewOilseed Radish: Lowest Level = Scattered

Ecological Concepts• Weeds, Insects and Diseases Cost Farmers 30%
of their Crop every year since 1940’s.• Native undisturbed soils have diverse species
(predators, prey, parasites). Keep pests in check.• 100% Pest Control not Achievable!• New ECO Goal: Keep pests at acceptable levels
using all Ecological strategies: Safe, durable, $$$• Keep Insecticides, Fungicides, Herbicides around
for major outbreaks.
OHIO STATE UNIVERSITY EXTENSION

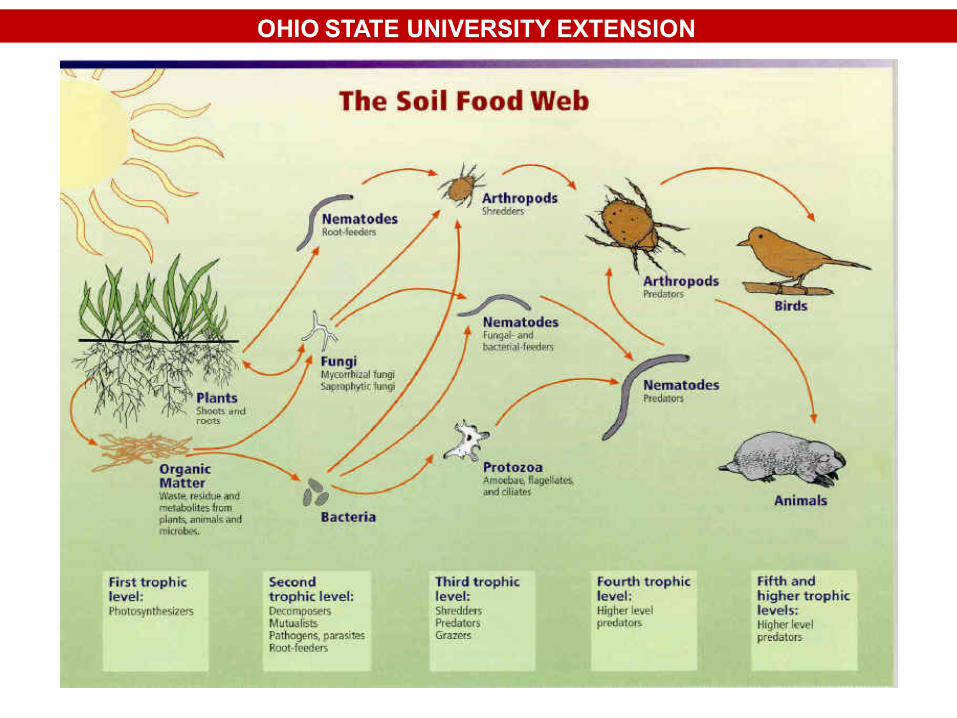
Natural Succession of Plants & Soil
Weeds

Bare Parent
Material
100% bacterial
CyanobacteriaTrue BacteriaProtozoaFungiNematodesMicroarthsF:B = 0.01
“Weeds”- high NO3- lack of oxygen
F:B = 0.1
Early GrassesBromus, Bermuda
F:B = 0.3
Mid-grasses, vegetablesF:B = 0.75
Late successionalgrasses, row crops
F:B = 1:1
Shrubs, vines,Bushes
F:B = 2:1 to 5:1Deciduous TreesF:B = 5:1 to 100:1
Conifer, old-growth forestsF:B = 100:1 to
1000:1
Soil Foodweb StructureThrough Succession,Increasing Productivity
What does your plant need?

Weeds• Farmers promote weed seed by tilling the soil.• Ways to fight weeds
1) Hoe or pull them out2) Kill with herbicides3) Compete for sunlight and nutrients by growing cover crops and reduce weed seed production.
• Farmers with No-till and Cover Crops reduce herbicide cost by 1/3 = $7-$12/A.
• Early weeds reduce crop yields 10% * 50 bu soybeans * $10/Acre = $50
• Reduced weeds: cereal rye, oilseed radish, etc.

InsectsPositive: Soybean Cysts Nematodes (SCN)1) 80-90% Reduction using cereal rye/annual rye
50 bu * 30% =15 bu * $10 =$150/A
Natural Pollinators:$5 Billion/350 million =$14/A
Negative: Slugs, Cutworm, Armyworm
1) Carabidae beetles/ground beetles and lightning bugs are natural predators of soft body insects.2) Cover crops may be an alternative food source for slugs and may protect corn from damage.

Five Steps to Fighting Insect Pests• Small Fields surrounded by natural vegetation.
These areas offer refuge and extra food.• Diverse crops with diverse flowers. Small flowers
with open flowers promote predators.• Minimize use of insecticides and fungicides.• Keep soils high in SOM (mulch) and biological
activity. Winter refuge and food for predators.• Use multiple natural tactics. Plant cover crops
and mow every other row or raise mowing height.
OHIO STATE UNIVERSITY EXTENSION

Promote Predator Friendly Plants• Promote nectar early spring, mid-summer, and
late fall.• Early spring: Dandelions, Henbit• Mid summer: Buckwheat, Sunflower, Flowering
Legumes: crimson clover, sweet clover, hairy vetch, red clover
• Late Fall: Wild carrot (Queen Ann’s Lace), Goldenrod
• Ecosystems with more diversity are more stable and Resistant to change and are more Resilient!
OHIO STATE UNIVERSITY EXTENSION

DiseasesDiseases that thrive under excess water• Phytophthora: 20% loss*50 bu=10 bu * $10= $100/A • Phythium: 5-10% *50 bu=2.5-5 bu*$10= $25-$50/A• Fusarium: 10% * 50 bu= 5 bu. * $10 = $50 • Rhizoctonia 2-5%*50 bu=1-2.5bu*$10= $10-$25/AThrive with less biological activity (tillage)• Sclertina/White Mold (Bury seed with tillage)2 to 4 bushel per acre * $10 = $20-40/A
.llllllllllllllllllllllllllllllllllllllllllll

Seed Production
Cereal rye: 30-60 bushels * $12 =$360-$720/A minus $49 seed, plant, kill it plus $30 for harvesting = $280 - $640
Cowpeas: 30-35 bushels per acre or 1500 to 1750 pounds times $.80/lb = $1200 -$1400/Aminus seed, planting, harvesting costs

Forage Value of Cover Crops
• Oats, cereal rye, annual ryegrass• 4 tons cereal rye at $100/ton =$400 Income• Costs $60 (2 bu/Acre for seed) per acre for
seed, plant, kill it.• Harvest Costs: $40 • Net Income: $300
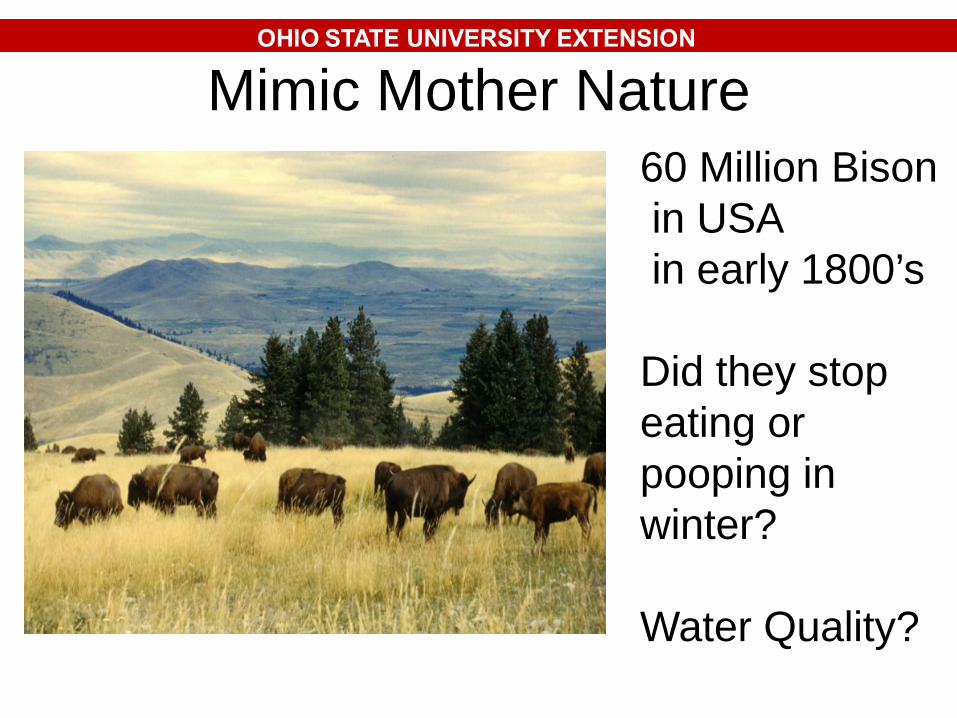
Mimic Mother Nature60 Million Bisonin USAin early 1800’s
Did they stop eating or pooping in winter?
Water Quality?
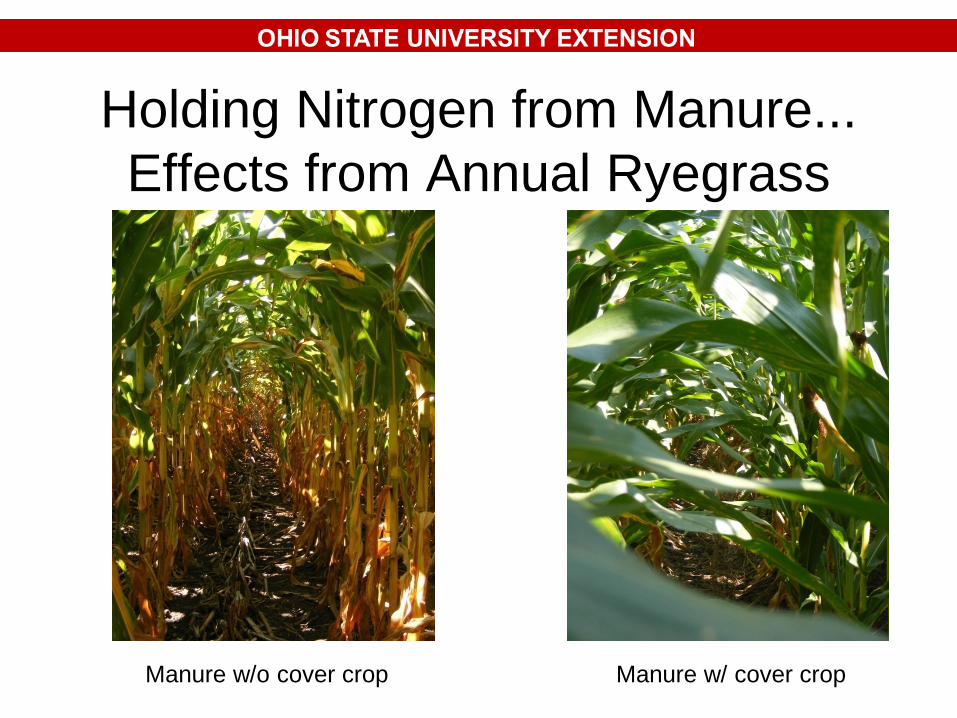
Holding Nitrogen from Manure... Effects from Annual Ryegrass
Manure w/o cover crop Manure w/ cover crop
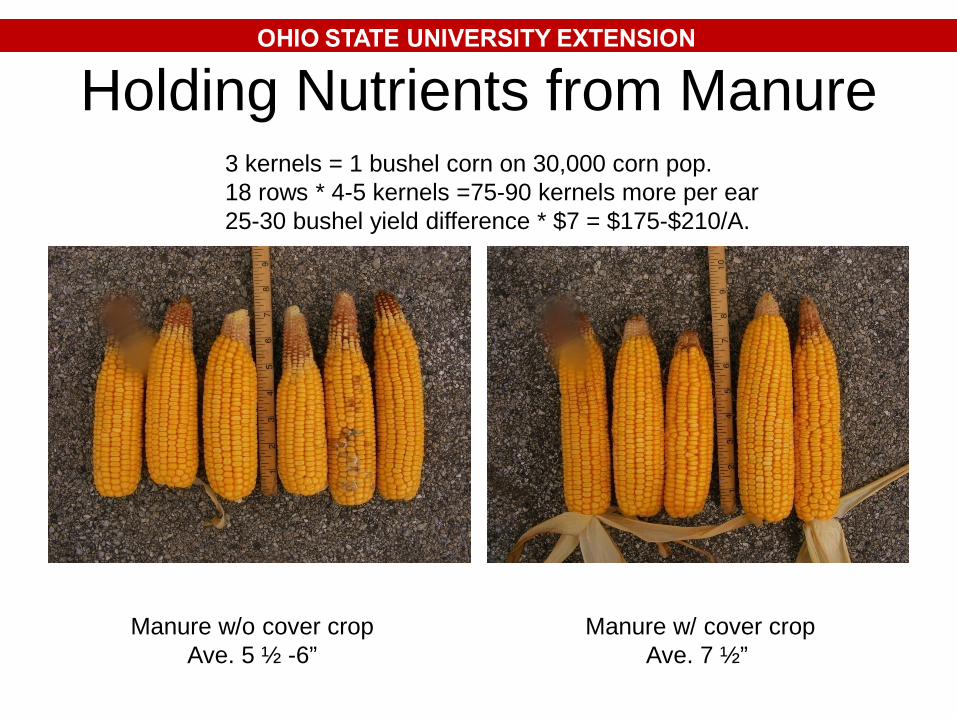
Holding Nutrients from Manure
Manure w/o cover cropAve. 5 ½ -6”
Manure w/ cover cropAve. 7 ½”
3 kernels = 1 bushel corn on 30,000 corn pop.18 rows * 4-5 kernels =75-90 kernels more per ear25-30 bushel yield difference * $7 = $175-$210/A.

Manure Value of Cover CropsSwine Manure: 95% Water 5% solidsManure Nutrient Analysis:18-16-14/1000 gallonsUptake: At 5,000 gallons/A =90-80-70 $80
At 10,000 gallons/A =180-160-140 $147
Dairy Manure: 98% water 2% solidsManure Nutrient Analysis: 20-15-15Uptake: At 5,000 gallons/A =100-75-75 $87
At 10,000 gallons/A =200-150-150 $122
*Absorb 70% N, maximum 20# PCrops absorb about 0.5% N Maximum and 0.2% P

Cost Effectiveness of BMP’SJEQ 2002 Forster & Rausch
BMP $/Ton of Sediment
BMP $/Ton of Sediment
Cover Crops $1.99 Diversions $18.10
No-till $2.99 Sediment Retention
$50.21
Permanent Cover
$6.95 Average Cost $8.71
Wind break $12.10 CRP Program
$22.95
Sod water way $13.50

Water Quality Benefits from Winter Cover Crops
• Reduces nutrient and pesticide runoff by 50% or more.
• Decreases Soil Erosion by 90%
• Reduces Sediment Loading by 75%
• Reduces Pathogen Loading by 60%
• May decrease flooding potential by increasing water infiltration

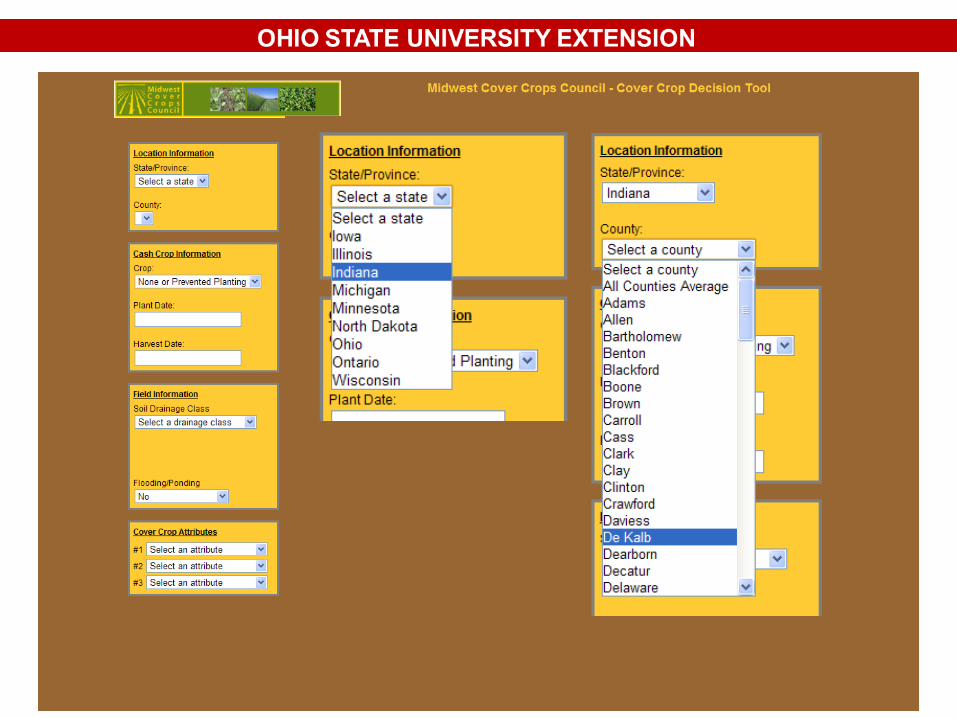
GLCCI Cover Crop Resources –MCCC Decision Tool
The MCCC Decision Tool is available on the MCCC
website
www.mccc.msu.edu

Cover Crop Resources - Websites
MCCC Website is a source for cover crop information Regional State/province


Summary• No-till is an important first step in keeping
soils healthy. Cover crops or live plants is the second step.
• Farmers can reduce their input costs by planting cover crops.
• How we manage the soil impacts soil temperature, water storage, & crop yields.
• Soil health also impacts weeds, insects, diseases, weather and climate.
OHIO STATE UNIVERSITY EXTENSION

Economics of Cover CropsJames J. Hoorman
Ohio State [email protected]
OHIO STATE UNIVERSITY EXTENSION