Embed Size (px)
Citation preview
Poised for a recovery
Jain Irrigation
Initiating Coverage | 19 May 2014Sector: Agri
Niket Shah ([email protected]); +91 22 3982 5426
Atul Mehra ([email protected])+91 22 3982 5417

Jain Irrigation
19 May 2014 2
Jain Irrigation: Poised for a recovery
Page No.
Summary .......................................................................................................... 3-4
Story in charts: Poised for a recovery ............................................................... 5
MIS - set for a recovery ................................................................................ 6-10
Huge potential for micro irrigation in India ............................................. 11-15
PVC pipes business to post steady growth ............................................... 16-21
Food processing - a promising business .................................................... 22-25
Tissue culture - a unique farming solution ............................................... 26-27
Solar water heaters, lanterns - similar to MIS model .............................. 28-29
International operations - profitability to improve ................................ 30-32
Earnings to post 48% CAGR over FY14-16E ............................................... 33-35
Initiating coverage with Buy rating ........................................................... 36-37
Risks and concerns ............................................................................................ 38
Management ..................................................................................................... 39
Company overview ..................................................................................... 40-43
Annexure ...................................................................................................... 44-46
Financials and valuations ........................................................................... 47-48
Investors are advised to refer through disclosures made at the end of the Research Report.

Jain Irrigation
19 May 2014 3
Poised for a recovery Working capital set to improve due to shift in favor of NBFC-based model
With a focus on progressive states and switch to a NBFC-based model, we expect Jain Irrigation’s (JI) working capital concerns to be allayed over FY14-16.
Hence, we expect strong free cash generation which should aid in reducing debt equity from 1.6x in FY14 to 1.0x in FY16E.
Policy impetus from the new government in the form of direct credit of subsidy or a reduced working capital model on the lines of GGRC can be potential game changer events.
We value JI at 14x FY16E EPS of INR10 and arrive at a target price of INR140, implying 40% upside. We initiate coverage with a Buy rating.
Direct credit of subsidy by Center can be a mega game changer MIS industry’s growth has been adversely impacted over the past two years due to delay in payments at the state level. Centre contributes 40% towards subsidy for MIS while states contribute another 10% towards subsidy taking the total subsidy for MIS to 50%. As majority of the subsidy contribution is from the Center, direct release of subsidy by the Center in favor of the farmer can substantially reduce the payment delays associated with the states. In our view, changing landscape at the Center and progress on initiatives like Aadhar can result in direct credit of subsidy to farmers, which can be a game changer event. Working capital to improve led by focus on progressive states… JI’s management has moved away from doing business in TN, Karnataka and AP due to substantial delays in payments. As a result, revenue contribution from these states has declined from 21% in FY12 to 8% in FY14 and is further slated to decline to 3% of total MIS revenue in FY16E. Growth over FY14-16E will be driven by higher contribution from progressive states like Maharashtra and Gujarat whose revenue contribution is expected to increase from 47% in FY14E to 53% in FY16E.
…and switch to NBFC-based model Apart from moving the business in favor of progressive states, JI is focusing on NBFC-based model wherein payment to dealers will be made instantly by the farmer and farmer’s financiers. JI-owned NBFC SAFL or banks will typically act as financiers to farmers for the subsidy portion. These actions, in our view, will collectively ease concerns on working capital for its MIS business. Thus, we expect gross debtor days in MIS business to decline from 247 days in FY14E to 180 days in FY16. Currently, 30% (INR2b out of INR6.6b) of all MIS business in Maharashtra is being carried out though the NBFC route. We expect JI to garner 80-90% MIS revenue in Maharashtra from this new model in next 2-3 years.
Initiating Coverage | Sector: Agri
Jain Irrigation CMP: INR100 TP: INR140 Buy
BSE Sensex S&P CNX
24,363 7,264
Stock Info
Bloomberg JI IN
Equity Shares (m) 443.1
52-Week Range (INR) 100/46
1, 6, 12 Rel. Per (%) 37/33/27
M.Cap. (INR b) 44.9
M.Cap. (USD b) 0.8
Financial Snapshot (INR m)
Y/E March 2014E 2015E 2016E Net Sales 60,430 70,533 82,407
EBITDA 8,326 9,718 11,354
PAT 259 2,997 4,534
EPS (INR) 4.6 6.6 10.0
Growth (%) 368.9 45.2 51.0
BV/Share (INR) 51.6 57.5 66.5
RoE (%) 9.1 12.1 16.1
RoCE (%) 11.0 13.0 15.4
P/E (x) 21.9 15.1 10.0
P/BV (x) 1.9 1.7 1.5
Shareholding pattern (%)
As on Mar-14 Dec-13 Mar-13
Promoter 28.7 27.5 27.5
Dom. Inst 2.2 1.6 1.3
Foreign 54.0 57.6 56.2 Others 15.2 13.2 15.1
Stock Performance (1-year)

Jain Irrigation
19 May 2014 4
GGRC’s role has been a strong positive for MIS players like JI JI’s experience in Gujarat has been highly favorable ever since the formation of GGRC in 2006. The state is the third largest (~10% of MIS revenues) and fastest growing market for MIS. JI’s MIS receivables in Gujarat are ~120-140 days, compared to >300 days for AP and TN, and the average of 250 days company-wide. The new government at the Center can possibly replicate GGRC model across other states which can be a game changer event for MIS players like JI.
PVC piping is a logical extension to JI’s MIS business JI is primarily present in the agri-piping segment of PVC pipes (derives more than 90% from agriculture). Agri-pipes are used for connecting the farmland with the nearest river/canal to ensure water supply. Since JI already has a strong foothold in the agriculture space through its dominance in the MIS business, agri-pipes is a complimentary business for the company. At present, only 40% of the total arable land is under irrigation, with the balance being rain fed. With the continuous depletion of water tables across the country, farmers are increasingly being forced to source water from faraway places. Thus, demand for rigid PVC pipes is expected to increase driving growth for JI in this segment.
JI is India’s largest player in food processing industry India has the second largest arable land in the world and with diverse agro-climatic zones across the country, has tremendous production advantages in agriculture. However, due to the lack of adequate storage facilities and transportation, it is in the bottom in terms of food processing. Only 2% of the total produce is processed, compared to ~60-80% in some developed countries. JI is India’s largest player in the food processing sector, with a market share of ~30% and is the third largest in the world. Its food processing business is involved in processing of onion, vegetable dehydration and fruit processing. JI’s extensive experience and high involvement with the farmers have given it an edge in the most crucial aspect of the food processing business, sourcing.
International MIS profitability set to climb on the back of new initiatives JI is increasingly sourcing more MIS products from low cost centers like India to cater to international markets, which is expected to drive profitability. Also, JI is actively working on more project business (~10% of revenue) in places like Latin America where margins are higher. Further, JI’s Greenfield capacity in Turkey is expected to ramp up revenue over the next couple of years, thus translating into better profitability from Turkish operations. Management expects overseas business profitability to improve with the current 7% margin expected to expand to 12% over the next 3-4 years.
Initiating coverage with a Buy and target price of INR140 With a focus on progressive states and switch to NBFC-based model, we expect JI’s working capital concerns to be allayed over FY14-16. Hence, we expect strong free cash generation which should help in reducing debt equity from 1.6x in FY14 to 1x in FY16E. Policy impetus from the new government in the form of direct credit of subsidy or a reduced working capital model on the lines of GGRC can be potential game changer events. We value JI at 14x FY16E EPS of INR10 and arrive at a target price of INR140, implying 40% upside. We initiate coverage with a Buy rating.
Jain Irrigation
19 May 2014 5
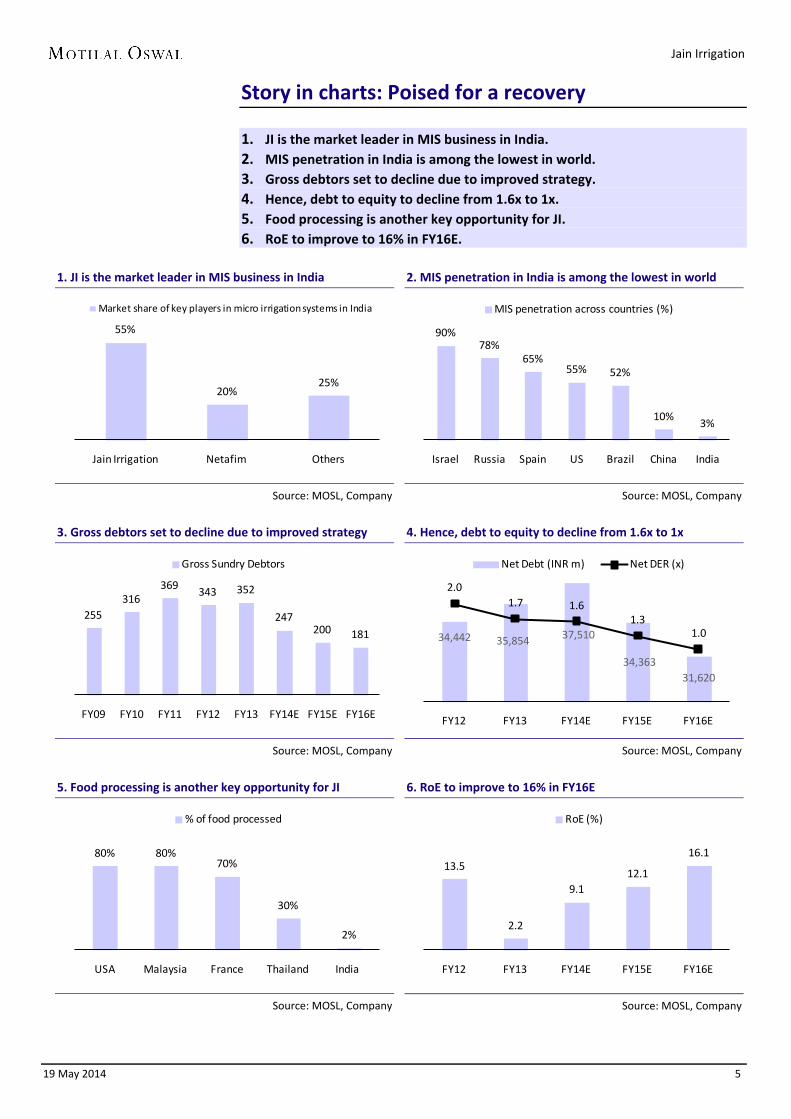
Story in charts: Poised for a recovery 1. JI is the market leader in MIS business in India. 2. MIS penetration in India is among the lowest in world. 3. Gross debtors set to decline due to improved strategy. 4. Hence, debt to equity to decline from 1.6x to 1x. 5. Food processing is another key opportunity for JI. 6. RoE to improve to 16% in FY16E.
1. JI is the market leader in MIS business in India
Source: MOSL, Company
2. MIS penetration in India is among the lowest in world
Source: MOSL, Company
3. Gross debtors set to decline due to improved strategy
Source: MOSL, Company
4. Hence, debt to equity to decline from 1.6x to 1x
Source: MOSL, Company
5. Food processing is another key opportunity for JI
Source: MOSL, Company
6. RoE to improve to 16% in FY16E
Source: MOSL, Company
55%
20%25%
Jain Irrigation Netafim Others
Market share of key players in micro irrigation systems in India
90%78%
65%55% 52%
10%3%
Israel Russia Spain US Brazil China India
MIS penetration across countries (%)
255316
369 343 352
247200 181
FY09 FY10 FY11 FY12 FY13 FY14E FY15E FY16E
Gross Sundry Debtors
34,442 35,854 37,510
34,36331,620
2.01.7 1.6
1.31.0
FY12 FY13 FY14E FY15E FY16E
Net Debt (INR m) Net DER (x)
80% 80%70%
30%
2%
USA Malaysia France Thailand India
% of food processed
13.5
2.2
9.112.1
16.1
FY12 FY13 FY14E FY15E FY16E
RoE (%)
Jain Irrigation
19 May 2014 6
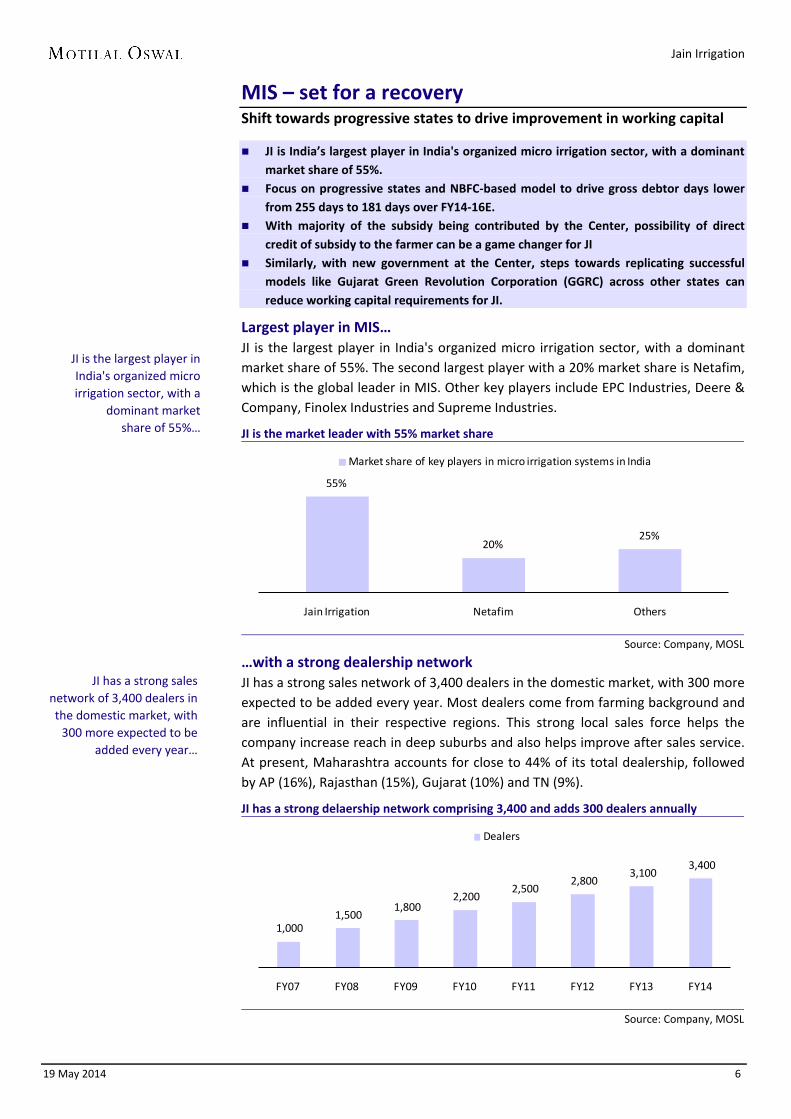
MIS – set for a recovery Shift towards progressive states to drive improvement in working capital
JI is India’s largest player in India's organized micro irrigation sector, with a dominant market share of 55%.
Focus on progressive states and NBFC-based model to drive gross debtor days lower from 255 days to 181 days over FY14-16E.
With majority of the subsidy being contributed by the Center, possibility of direct credit of subsidy to the farmer can be a game changer for JI
Similarly, with new government at the Center, steps towards replicating successful models like Gujarat Green Revolution Corporation (GGRC) across other states can reduce working capital requirements for JI.
Largest player in MIS… JI is the largest player in India's organized micro irrigation sector, with a dominant market share of 55%. The second largest player with a 20% market share is Netafim, which is the global leader in MIS. Other key players include EPC Industries, Deere & Company, Finolex Industries and Supreme Industries.
JI is the market leader with 55% market share
Source: Company, MOSL
…with a strong dealership network JI has a strong sales network of 3,400 dealers in the domestic market, with 300 more expected to be added every year. Most dealers come from farming background and are influential in their respective regions. This strong local sales force helps the company increase reach in deep suburbs and also helps improve after sales service. At present, Maharashtra accounts for close to 44% of its total dealership, followed by AP (16%), Rajasthan (15%), Gujarat (10%) and TN (9%).
JI has a strong delaership network comprising 3,400 and adds 300 dealers annually
Source: Company, MOSL
55%
20%25%
Jain Irrigation Netafim Others
Market share of key players in micro irrigation systems in India
1,000 1,500
1,800 2,200
2,500 2,800
3,100 3,400
FY07 FY08 FY09 FY10 FY11 FY12 FY13 FY14
Dealers
JI is the largest player in India's organized micro irrigation sector, with a
dominant market share of 55%…
JI has a strong sales network of 3,400 dealers in the domestic market, with
300 more expected to be added every year…
Jain Irrigation
19 May 2014 7
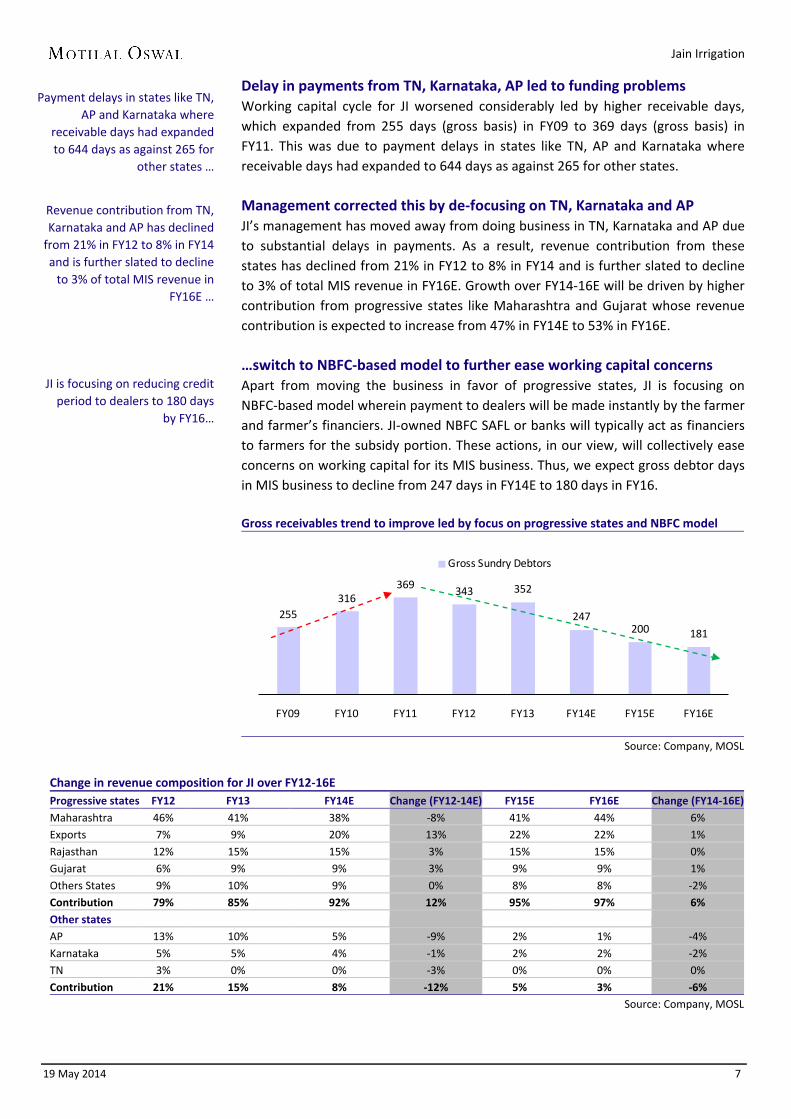
Delay in payments from TN, Karnataka, AP led to funding problems Working capital cycle for JI worsened considerably led by higher receivable days, which expanded from 255 days (gross basis) in FY09 to 369 days (gross basis) in FY11. This was due to payment delays in states like TN, AP and Karnataka where receivable days had expanded to 644 days as against 265 for other states. Management corrected this by de-focusing on TN, Karnataka and AP JI’s management has moved away from doing business in TN, Karnataka and AP due to substantial delays in payments. As a result, revenue contribution from these states has declined from 21% in FY12 to 8% in FY14 and is further slated to decline to 3% of total MIS revenue in FY16E. Growth over FY14-16E will be driven by higher contribution from progressive states like Maharashtra and Gujarat whose revenue contribution is expected to increase from 47% in FY14E to 53% in FY16E. …switch to NBFC-based model to further ease working capital concerns Apart from moving the business in favor of progressive states, JI is focusing on NBFC-based model wherein payment to dealers will be made instantly by the farmer and farmer’s financiers. JI-owned NBFC SAFL or banks will typically act as financiers to farmers for the subsidy portion. These actions, in our view, will collectively ease concerns on working capital for its MIS business. Thus, we expect gross debtor days in MIS business to decline from 247 days in FY14E to 180 days in FY16. Gross receivables trend to improve led by focus on progressive states and NBFC model
Source: Company, MOSL
Change in revenue composition for JI over FY12-16E Progressive states FY12 FY13 FY14E Change (FY12-14E) FY15E FY16E Change (FY14-16E) Maharashtra 46% 41% 38% -8% 41% 44% 6% Exports 7% 9% 20% 13% 22% 22% 1% Rajasthan 12% 15% 15% 3% 15% 15% 0% Gujarat 6% 9% 9% 3% 9% 9% 1% Others States 9% 10% 9% 0% 8% 8% -2% Contribution 79% 85% 92% 12% 95% 97% 6% Other states
AP 13% 10% 5% -9% 2% 1% -4% Karnataka 5% 5% 4% -1% 2% 2% -2% TN 3% 0% 0% -3% 0% 0% 0% Contribution 21% 15% 8% -12% 5% 3% -6%
Source: Company, MOSL
255316
369 343 352
247200 181
FY09 FY10 FY11 FY12 FY13 FY14E FY15E FY16E
Gross Sundry Debtors
Payment delays in states like TN, AP and Karnataka where
receivable days had expanded to 644 days as against 265 for
other states …
Revenue contribution from TN, Karnataka and AP has declined
from 21% in FY12 to 8% in FY14 and is further slated to decline
to 3% of total MIS revenue in FY16E …
JI is focusing on reducing credit period to dealers to 180 days
by FY16…
Jain Irrigation
19 May 2014 8
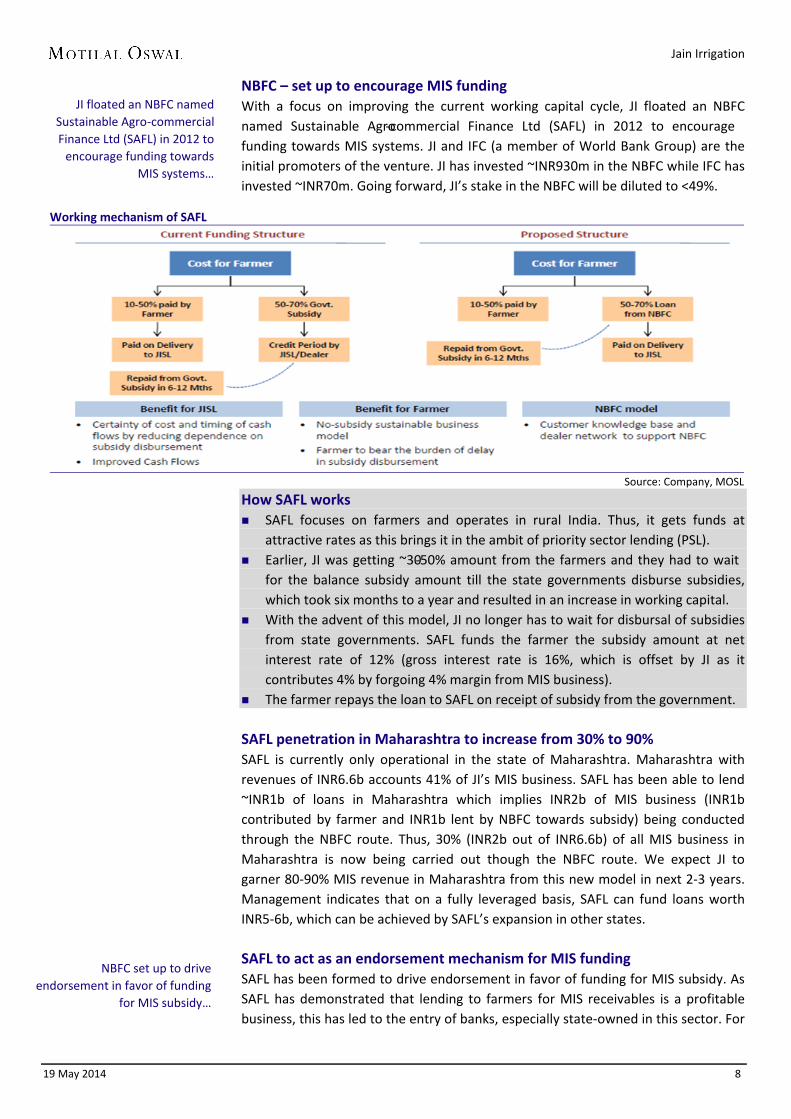
NBFC – set up to encourage MIS funding With a focus on improving the current working capital cycle, JI floated an NBFC named Sustainable Agro-commercial Finance Ltd (SAFL) in 2012 to encourage funding towards MIS systems. JI and IFC (a member of World Bank Group) are the initial promoters of the venture. JI has invested ~INR930m in the NBFC while IFC has invested ~INR70m. Going forward, JI’s stake in the NBFC will be diluted to <49%.
Working mechanism of SAFL
Source: Company, MOSL
How SAFL works SAFL focuses on farmers and operates in rural India. Thus, it gets funds at
attractive rates as this brings it in the ambit of priority sector lending (PSL). Earlier, JI was getting ~30-50% amount from the farmers and they had to wait
for the balance subsidy amount till the state governments disburse subsidies, which took six months to a year and resulted in an increase in working capital.
With the advent of this model, JI no longer has to wait for disbursal of subsidies from state governments. SAFL funds the farmer the subsidy amount at net interest rate of 12% (gross interest rate is 16%, which is offset by JI as it contributes 4% by forgoing 4% margin from MIS business).
The farmer repays the loan to SAFL on receipt of subsidy from the government. SAFL penetration in Maharashtra to increase from 30% to 90% SAFL is currently only operational in the state of Maharashtra. Maharashtra with revenues of INR6.6b accounts 41% of JI’s MIS business. SAFL has been able to lend ~INR1b of loans in Maharashtra which implies INR2b of MIS business (INR1b contributed by farmer and INR1b lent by NBFC towards subsidy) being conducted through the NBFC route. Thus, 30% (INR2b out of INR6.6b) of all MIS business in Maharashtra is now being carried out though the NBFC route. We expect JI to garner 80-90% MIS revenue in Maharashtra from this new model in next 2-3 years. Management indicates that on a fully leveraged basis, SAFL can fund loans worth INR5-6b, which can be achieved by SAFL’s expansion in other states. SAFL to act as an endorsement mechanism for MIS funding SAFL has been formed to drive endorsement in favor of funding for MIS subsidy. As SAFL has demonstrated that lending to farmers for MIS receivables is a profitable business, this has led to the entry of banks, especially state-owned in this sector. For
JI floated an NBFC named Sustainable Agro-commercial Finance Ltd (SAFL) in 2012 to
encourage funding towards MIS systems…
NBFC set up to drive endorsement in favor of funding
for MIS subsidy…

Jain Irrigation
19 May 2014 9
instance, JI in March, 2014 entered into a national level tie-up with Dena Bank to fund farmers for MIS purchase. JI has a similar arrangement with State Bank of India. Possibility of direct credit of subsidy by Center can be a mega game changer MIS industry’s growth has been adversely impacted over the past two years due to delay in payments at the state level. Centre contributes 40% towards subsidy for MIS while states contribute another 10% towards subsidy taking the total subsidy for MIS to 50%. As majority of the subsidy contribution is from the Center, direct release of subsidy by the Center in favor of the farmer can substantially reduce the payment delays associated with the states. In our view, changing landscape at the Center and progress on initiatives like Aadhar can result in implementation of mechanisms like direct credit of subsidy to farmers. Gujarat – a differentiated model led by GGRC acting as an intermediary… In sharp contrast to rest of India, Gujarat and AP are the only states in the country which have designated a specific body to ensure effective implementation of micro irrigation. Gujarat Green Revolution Company Ltd (GGRC) is the implementing agency for Micro Irrigation Scheme on behalf of the Government of India and Government of Gujarat in the state. GGRC employs reputed and authorized micro irrigation system suppliers, who provide and install the micro irrigation system and also agro services pertaining to MIS to farmers. Although Andhra Pradesh has a similar body in the form of Andhra Pradesh Micro Irrigation Project (APMIP), the body has not been functioning effectively due to unrest caused by Telangana issue. …GGRC’s intermediation has been a strong positive for MIS players like JI JI’s experience in Gujarat has been highly favorable ever since the formation of GGRC in 2006. The state is the third largest (~10% of MIS revenues) and fastest growing market for MIS. GGRC conducts education and training programs for farmers with help from the suppliers. GGRC is also responsible for subsidy follow-ups and collection from both the central and state governments. Thus, JI’s MIS receivables in Gujarat are ~120-140 days, compared to >300 days for AP and TN, and the average of 250 days company-wide. The new government at the Center can possibly replicate GGRC model across other states which can be a game changer event for MIS players like JI. How GGRC works Companies such as JI, Netafim, Finolex, Supreme etc are registered with GGRC
to implement MIS in states. Pricing is regulated by GGRC and is fixed on an annual basis. Companies such as JI through dealers source business and register each farmer’s
application with GGRC. Once approved by GGRC, farmer pays 100% of dues to GGRC GGRC releases 25% of total amount upfront to suppliers like JI. Post implementation, suppliers like JI will receive the balance 75% from GGRC. Final funds will be released in 120 days by GGRC.
JI in March 2014 entered into a national level tie-up with Dena
Bank to fund farmers for MIS purchase…
Gujarat and AP are the only states in the country which have designated a specific
body to ensure effective implementation of micro
irrigation…
JI’s MIS receivables in Gujarat are ~120-140 days, compared to >300 days for
AP and TN…
GGRC functions in an effective manner with final funds released to suppliers
within 120 days…
Jain Irrigation
19 May 2014 10
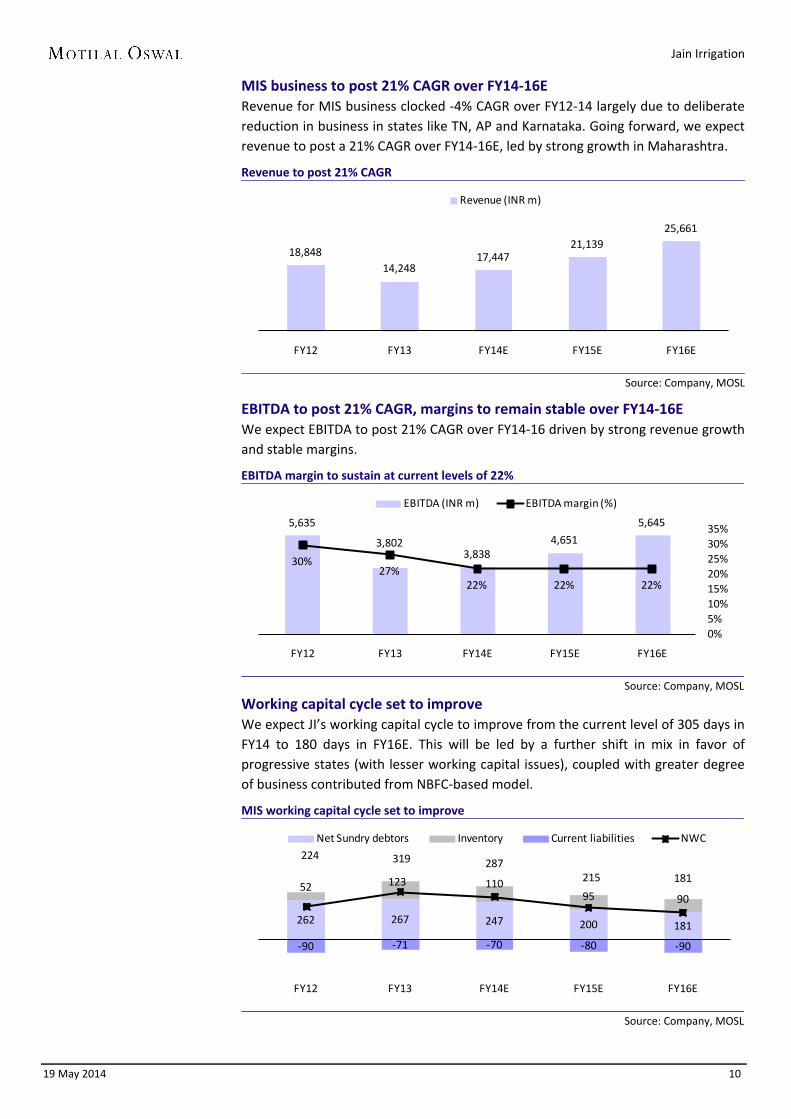
MIS business to post 21% CAGR over FY14-16E Revenue for MIS business clocked -4% CAGR over FY12-14 largely due to deliberate reduction in business in states like TN, AP and Karnataka. Going forward, we expect revenue to post a 21% CAGR over FY14-16E, led by strong growth in Maharashtra.
Revenue to post 21% CAGR
Source: Company, MOSL
EBITDA to post 21% CAGR, margins to remain stable over FY14-16E We expect EBITDA to post 21% CAGR over FY14-16 driven by strong revenue growth and stable margins.
EBITDA margin to sustain at current levels of 22%
Source: Company, MOSL
Working capital cycle set to improve We expect JI’s working capital cycle to improve from the current level of 305 days in FY14 to 180 days in FY16E. This will be led by a further shift in mix in favor of progressive states (with lesser working capital issues), coupled with greater degree of business contributed from NBFC-based model.
MIS working capital cycle set to improve
Source: Company, MOSL
18,84814,248
17,44721,139
25,661
FY12 FY13 FY14E FY15E FY16E
Revenue (INR m)
5,635
3,8023,838
4,651
5,645
30%27%
22% 22% 22%
0%5%10%15%20%25%30%35%
FY12 FY13 FY14E FY15E FY16E
EBITDA (INR m) EBITDA margin (%)
262 267 247 200 181
52 123 11095 90
-90 -71 -70 -80 -90
224 319 287215 181
FY12 FY13 FY14E FY15E FY16E
Net Sundry debtors Inventory Current liabilities NWC
Jain Irrigation
19 May 2014 11
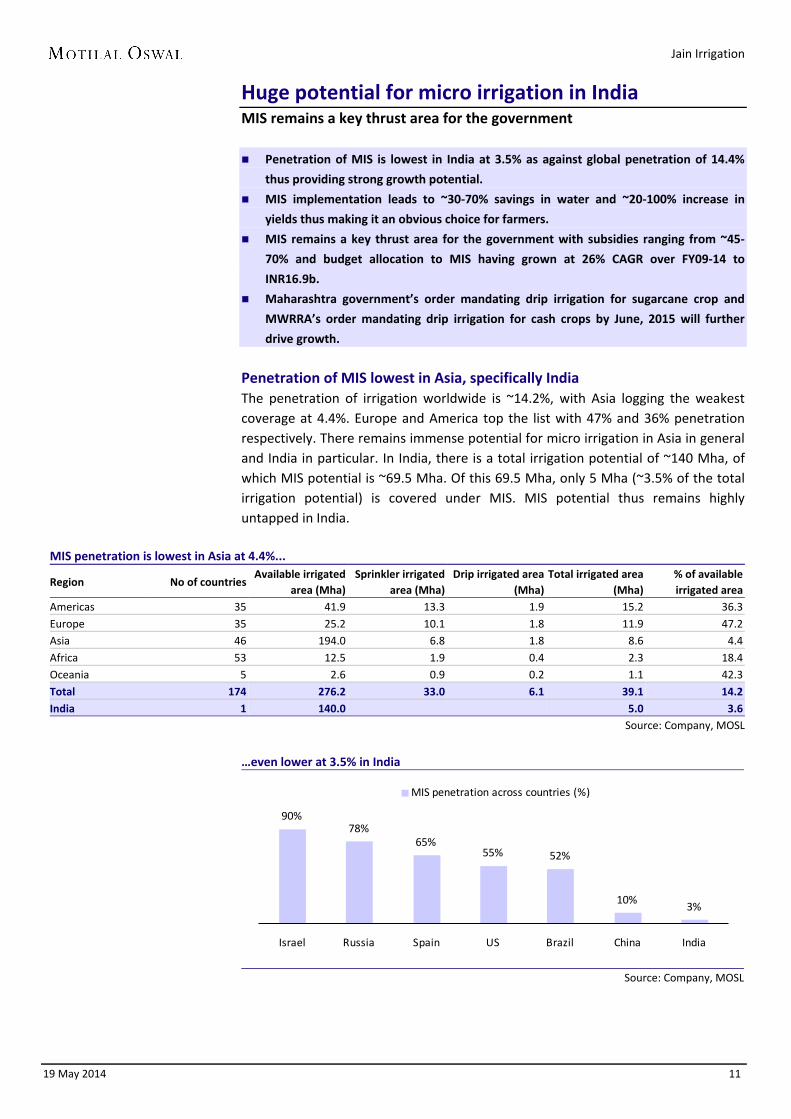
Huge potential for micro irrigation in India MIS remains a key thrust area for the government Penetration of MIS is lowest in India at 3.5% as against global penetration of 14.4%
thus providing strong growth potential.
MIS implementation leads to ~30-70% savings in water and ~20-100% increase in
yields thus making it an obvious choice for farmers.
MIS remains a key thrust area for the government with subsidies ranging from ~45-
70% and budget allocation to MIS having grown at 26% CAGR over FY09-14 to
INR16.9b.
Maharashtra government’s order mandating drip irrigation for sugarcane crop and
MWRRA’s order mandating drip irrigation for cash crops by June, 2015 will further
drive growth.
Penetration of MIS lowest in Asia, specifically India The penetration of irrigation worldwide is ~14.2%, with Asia logging the weakest coverage at 4.4%. Europe and America top the list with 47% and 36% penetration respectively. There remains immense potential for micro irrigation in Asia in general and India in particular. In India, there is a total irrigation potential of ~140 Mha, of which MIS potential is ~69.5 Mha. Of this 69.5 Mha, only 5 Mha (~3.5% of the total irrigation potential) is covered under MIS. MIS potential thus remains highly untapped in India.
MIS penetration is lowest in Asia at 4.4%...
Region No of countries Available irrigated
area (Mha) Sprinkler irrigated
area (Mha) Drip irrigated area
(Mha) Total irrigated area
(Mha) % of available irrigated area
Americas 35 41.9 13.3 1.9 15.2 36.3 Europe 35 25.2 10.1 1.8 11.9 47.2 Asia 46 194.0 6.8 1.8 8.6 4.4 Africa 53 12.5 1.9 0.4 2.3 18.4 Oceania 5 2.6 0.9 0.2 1.1 42.3 Total 174 276.2 33.0 6.1 39.1 14.2 India 1 140.0 5.0 3.6
Source: Company, MOSL
…even lower at 3.5% in India
Source: Company, MOSL
90%78%
65%55% 52%
10%3%
Israel Russia Spain US Brazil China India
MIS penetration across countries (%)

Jain Irrigation
19 May 2014 12
MIS - an edge over traditional irrigation MIS has started gaining popularity with a number of states starting to adopt the system on account of the following reasons 1) thrust on water saving and 2) substantially higher crop yield. 1) Thrust on water saving MIS is commonly used in developed countries in areas with water paucity. These systems aid the judicious use of water and improve productivity, raise incomes through good crop yields and enhance food security of households. A number of states have thus started encouraging MIS with a key objective to save water. In India, water scarcity due to ground water depletion is a major concern. The country's rainfall has been estimated at 4,000 cubic kms annually, of which only 690 cubic kms is harnessed for useful purposes. Against this backdrop, micro irrigation practices such as drip and sprinkler irrigation can help ease the problems of water scarcity. In both drip and sprinkler irrigation, savings in water range from ~30-70% post implementation. Crop-wise water savings post implementation of drip irrigation
Water supplied (cm) Conventional Drip % Saving in water
Banana 176 97 45
Grapes 53 28 48
Sugarcane 215 94 65
Tomato 30 18 39
Watermelon 33 21 36
Cotton 90 42 53
Chillies 110 42 62
Papaya 228 73 68
Source: Company, MOSL
2) Substantially higher crop yield
In both drip and sprinkler irrigation, the yield per acre for all crops increases substantially by ~20-100%, post implementation. This ensures that the payback period for farmers is less than one season. Crop-wise yield enhancements post implementation of drip irrigation
Yield(Quintal/Ha) Conventional Drip % Increase in yields
Banana 575 875 52
Grapes 264 325 23
Sugarcane 1,280 1,700 33
Tomato 320 480 50
Watermelon 240 450 88
Cotton 23 30 27
Chillies 42 61 44
Papaya 13 23 75
Wheat 46 54 17
Source: Company, MOSL
In both drip and sprinkler irrigation, savings in water range
from ~30-70% post implementation…
In both drip and sprinkler irrigation, the yield per acre for all crops increases substantially
by ~20-100%, post implementation…
Jain Irrigation
19 May 2014 13
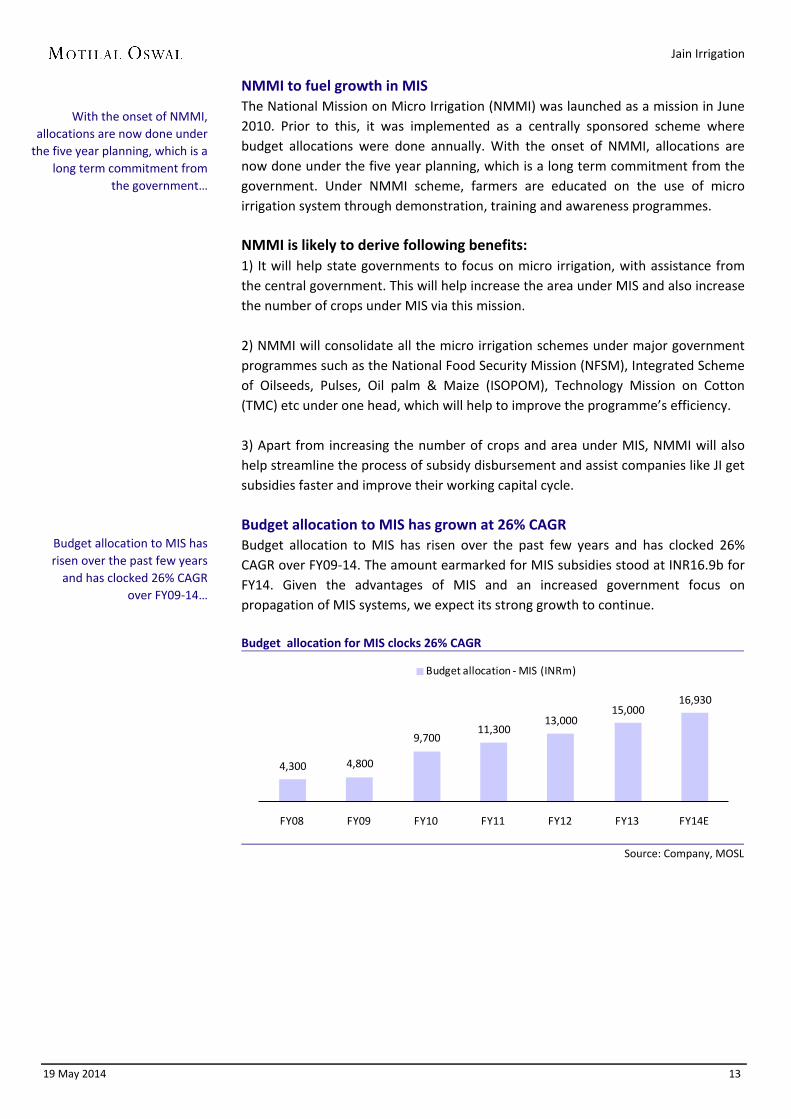
NMMI to fuel growth in MIS The National Mission on Micro Irrigation (NMMI) was launched as a mission in June 2010. Prior to this, it was implemented as a centrally sponsored scheme where budget allocations were done annually. With the onset of NMMI, allocations are now done under the five year planning, which is a long term commitment from the government. Under NMMI scheme, farmers are educated on the use of micro irrigation system through demonstration, training and awareness programmes. NMMI is likely to derive following benefits: 1) It will help state governments to focus on micro irrigation, with assistance from the central government. This will help increase the area under MIS and also increase the number of crops under MIS via this mission. 2) NMMI will consolidate all the micro irrigation schemes under major government programmes such as the National Food Security Mission (NFSM), Integrated Scheme of Oilseeds, Pulses, Oil palm & Maize (ISOPOM), Technology Mission on Cotton (TMC) etc under one head, which will help to improve the programme’s efficiency. 3) Apart from increasing the number of crops and area under MIS, NMMI will also help streamline the process of subsidy disbursement and assist companies like JI get subsidies faster and improve their working capital cycle. Budget allocation to MIS has grown at 26% CAGR Budget allocation to MIS has risen over the past few years and has clocked 26% CAGR over FY09-14. The amount earmarked for MIS subsidies stood at INR16.9b for FY14. Given the advantages of MIS and an increased government focus on propagation of MIS systems, we expect its strong growth to continue. Budget allocation for MIS clocks 26% CAGR
Source: Company, MOSL
4,300 4,800
9,700 11,300
13,000 15,000
16,930
FY08 FY09 FY10 FY11 FY12 FY13 FY14E
Budget allocation - MIS (INRm)
With the onset of NMMI, allocations are now done under
the five year planning, which is a long term commitment from
the government…
Budget allocation to MIS has risen over the past few years
and has clocked 26% CAGR over FY09-14…
Jain Irrigation
19 May 2014 14
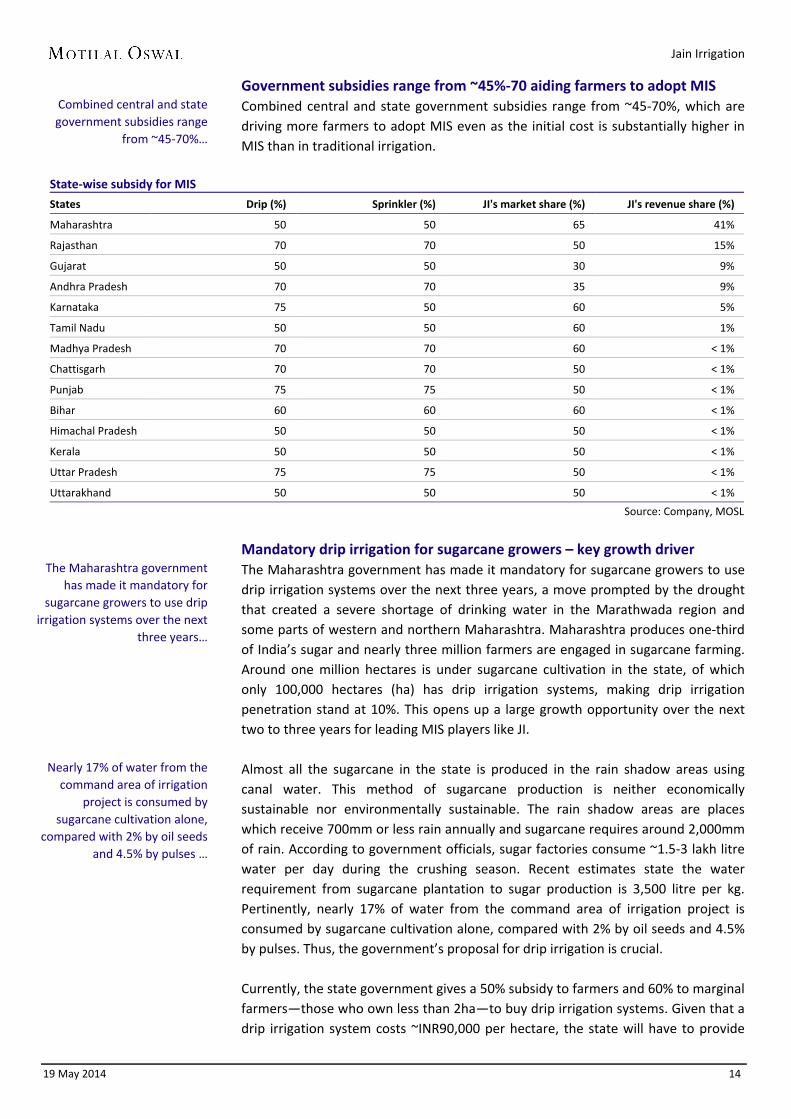
Government subsidies range from ~45%-70 aiding farmers to adopt MIS Combined central and state government subsidies range from ~45-70%, which are driving more farmers to adopt MIS even as the initial cost is substantially higher in MIS than in traditional irrigation.
State-wise subsidy for MIS
States Drip (%) Sprinkler (%) JI's market share (%) JI's revenue share (%)
Maharashtra 50 50 65 41%
Rajasthan 70 70 50 15%
Gujarat 50 50 30 9%
Andhra Pradesh 70 70 35 9%
Karnataka 75 50 60 5%
Tamil Nadu 50 50 60 1%
Madhya Pradesh 70 70 60 < 1%
Chattisgarh 70 70 50 < 1%
Punjab 75 75 50 < 1%
Bihar 60 60 60 < 1%
Himachal Pradesh 50 50 50 < 1%
Kerala 50 50 50 < 1%
Uttar Pradesh 75 75 50 < 1%
Uttarakhand 50 50 50 < 1%
Source: Company, MOSL
Mandatory drip irrigation for sugarcane growers – key growth driver The Maharashtra government has made it mandatory for sugarcane growers to use drip irrigation systems over the next three years, a move prompted by the drought that created a severe shortage of drinking water in the Marathwada region and some parts of western and northern Maharashtra. Maharashtra produces one-third of India’s sugar and nearly three million farmers are engaged in sugarcane farming. Around one million hectares is under sugarcane cultivation in the state, of which only 100,000 hectares (ha) has drip irrigation systems, making drip irrigation penetration stand at 10%. This opens up a large growth opportunity over the next two to three years for leading MIS players like JI. Almost all the sugarcane in the state is produced in the rain shadow areas using canal water. This method of sugarcane production is neither economically sustainable nor environmentally sustainable. The rain shadow areas are places which receive 700mm or less rain annually and sugarcane requires around 2,000mm of rain. According to government officials, sugar factories consume ~1.5-3 lakh litre water per day during the crushing season. Recent estimates state the water requirement from sugarcane plantation to sugar production is 3,500 litre per kg. Pertinently, nearly 17% of water from the command area of irrigation project is consumed by sugarcane cultivation alone, compared with 2% by oil seeds and 4.5% by pulses. Thus, the government’s proposal for drip irrigation is crucial. Currently, the state government gives a 50% subsidy to farmers and 60% to marginal farmers—those who own less than 2ha—to buy drip irrigation systems. Given that a drip irrigation system costs ~INR90,000 per hectare, the state will have to provide
Combined central and state government subsidies range
from ~45-70%…
The Maharashtra government has made it mandatory for
sugarcane growers to use drip irrigation systems over the next
three years…
Nearly 17% of water from the command area of irrigation
project is consumed by sugarcane cultivation alone,
compared with 2% by oil seeds and 4.5% by pulses …
Jain Irrigation
19 May 2014 15
~INR40b by way of subsidies to implement drip irrigation on the remaining 900,000ha of land. Sugar factories in the state will be given the responsibility to implement the scheme in their command area, failing which the state may suspend or revoke their licenses. MWRRA directive on drip irrigation for cash crops to further drive growth MIS demand is expected to surge in Maharashtra due to recent initiatives by the Maharashtra Water Resources Regulatory Authority (MWRRA). In its bid to prevent wastage of irrigated water and make irrigation system effective, MWRRA has decided to make drip irrigation mandatory for farmers growing cash crops with effect from July 1, 2015, giving a one-year timeframe to farmers. More than 75% of the irrigated water is utilized by agriculture consumers, 15% water goes to domestic use, while the remaining 10% is for industrial use. The proposal is to charge only 75% of tariff from farmers growing cash crops like cotton, soyabean, sugarcane and horticulture. Farmers will get 25% extra rebate if they adopt drip irrigation. But they will have to pay 150% tariff on failure to set up drip irrigation in the prescribed time limit.
This move by MWRRA is a strong positive for JI as Maharashtra contributes ~40% to its domestic MIS revenue. Earlier, Maharashtra made it mandatory for the use of MIS in sugarcane crops. With these dual initiatives, we expect strong growth in Maharashtra over the next 2-3 years. Micro irrigation sector in India on steady growth path According to experts, for India to manage its water resources efficiently, the focus has to be on agriculture. According to the Indian Agricultural Research Institute (IARI), the country’s farm sector alone accounts for 83% of all water use. Whether it is in the use of rain water or water from traditional irrigation system, the wastage is colossal and the blame is to be shared by government agencies and farmers. This creates a strong need for techniques aimed at water safeguard and the prime among these being MIS. The estimated size of MIS industry is INR30b and is growing at more than 20% annually. Although MIS adoption by farmers is growing at a fast pace, the penetration is still very low (only 3.5%). Due to the advantages of MIS (improved yield, low water consumption) over conventional irrigation, it remains a key thrust area for the government.
Jain Irrigation
19 May 2014 16
PVC pipes business to post steady growth Logical extension of JI’s MIS business
JI, with a 15% market share, is the second largest player in the organized market,
offering pipes in 20mm to 560mm diameter range.
Center's allocation of INR2.3t (USD38b) on water management and INR5t (USD83b) in
the 12th Five Year Plan is expected to provide significant growth opportunities for
rigid PVC pipes manufacturers in India.
JI has a domestic market share of 35% in polyethylene pipes (PE) business, with a
sheer domination in gas distribution business.
Post the implementation of GST, we believe that the pricing difference between
organized and unorganized players will not be significantly different, which will allure
customers to choose quality over price.
Plastic sheet has its major application in the housing sector. This sector was affected
due to a slowdown in the US housing segment post subprime crisis. We believe that
with the recovery of housing sector, JI will be the major beneficiary.
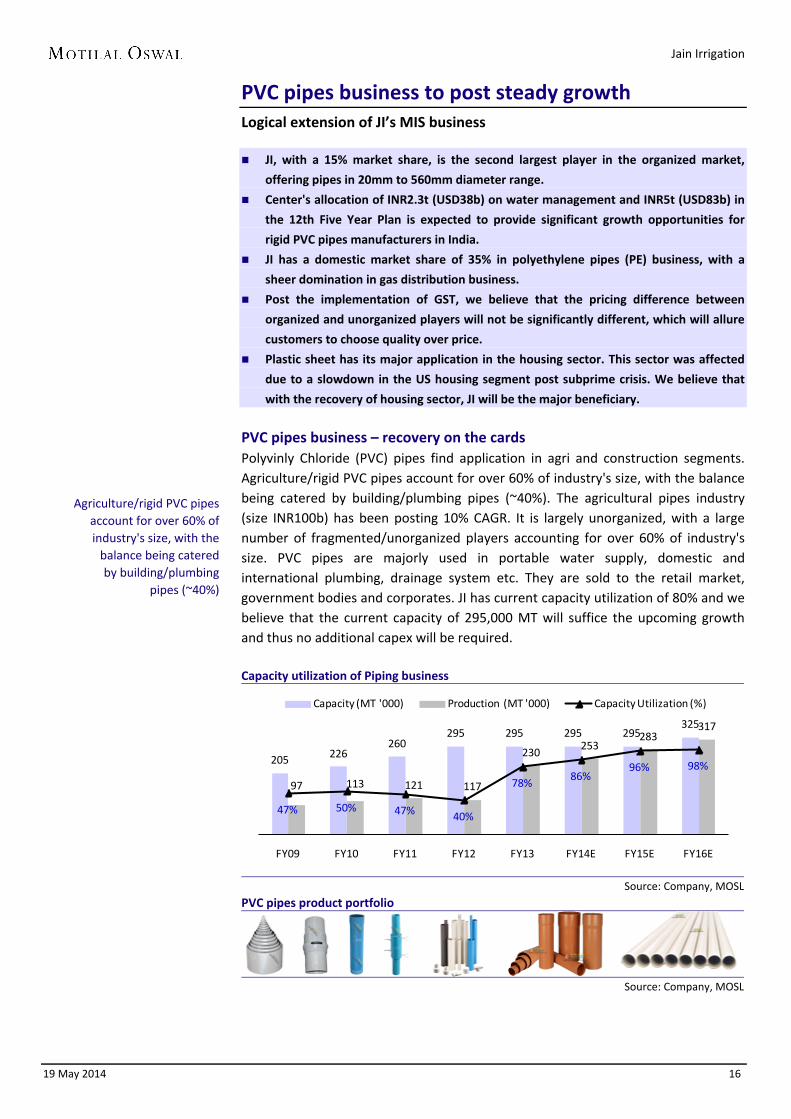
PVC pipes business – recovery on the cards Polyvinly Chloride (PVC) pipes find application in agri and construction segments. Agriculture/rigid PVC pipes account for over 60% of industry's size, with the balance being catered by building/plumbing pipes (~40%). The agricultural pipes industry (size INR100b) has been posting 10% CAGR. It is largely unorganized, with a large number of fragmented/unorganized players accounting for over 60% of industry's size. PVC pipes are majorly used in portable water supply, domestic and international plumbing, drainage system etc. They are sold to the retail market, government bodies and corporates. JI has current capacity utilization of 80% and we believe that the current capacity of 295,000 MT will suffice the upcoming growth and thus no additional capex will be required. Capacity utilization of Piping business
Source: Company, MOSL
PVC pipes product portfolio
Source: Company, MOSL
205 226260
295 295 295 295325
97 113 121 117
230253
283317
47% 50% 47% 40%
78% 86%96% 98%
FY09 FY10 FY11 FY12 FY13 FY14E FY15E FY16E
Capacity (MT '000) Production (MT '000) Capacity Utilization (%)
Agriculture/rigid PVC pipes account for over 60% of industry's size, with the
balance being catered by building/plumbing
pipes (~40%)

Jain Irrigation
19 May 2014 17
PE pipes to recover with telecom sector’s recovery Polyethylene pipes (PE) have major applications in telecom ducts, gas distribution, water pipelines and dust suppression. JI has a domestic market share of 35% in the PE business, with a sheer domination in the gas distribution business. It has 60% market share in gas distribution business due to its ability to execute large and complex government projects. This segment has shown a slowdown due to a slump in infrastructure projects. Hence, revenue de-grew by 10% from INR1.7b in FY09 to INR1.5b in FY13. Growth is likely to pick up with acceleration in telecom infrastructure projects to connect rural India. PE pipes product portfolio
Source: Company, MOSL
Logical extension to JI’s MIS business JI is primarily present in the agri-piping segment of PVC pipes (derives more than 90% from agri). Agri-pipes are used for connecting the farmland with the nearest river/canal to ensure water supply. Since JI already has a strong foothold in the agriculture space through its dominance in the MIS business, agri-pipes is a complimentary business for the company. The PVC pipe industry is comprised of a small number of players in the organized sector. JI, with a 15% market share, is the second largest player in the organized market, offering pipes in the 20mm to 560mm diameter range. While Finolex Industries is the largest player, other key players include Supreme Industries, Prince Pipes & Fittings and Kisan Mouldings. Even as plastic piping is a low margin business (~6% in FY13), it makes strategic sense for JI to be present in this segment due to low capex and working capital requirements and high scale of operations. Low irrigation penetration provides strong growth visibility At present, only 40% of the total arable land is under irrigation, with the balance being rain fed. With the continuous depletion of water tables across the country, farmers are increasingly being forced to source water from faraway places. Thus, demand for rigid PVC pipes is expected to increase. Center's allocation of INR2.3t (USD38b) on water management and INR5t (USD83b) in the 12th Five Year Plan is expected to provide significant growth opportunities for rigid PVC pipes manufacturers in India. GST implementation can shift the demand from unorganized to organized The unorganized market has gained advantage on price due to tax evasion. JI’s products sell at a premium of 12% due to the impact of excise duty, which unorganized players do not pay due to tax evasion. However, GST’s implementation can reduce the pricing difference between organized and unorganized players. Thus, all organized players, including JI, will be significantly benefitted from this shift.
JI has a domestic market share of 35% in the PE business, with a sheer domination in the gas distribution business
JI, with a 15% market share, is the second largest player
in the organized market, offering pipes in the 20mm to 560mm diameter range
With the continuous depletion of water tables
across the country, farmers are increasingly being
forced to source water from faraway places
GST’s implementation can reduce the pricing
difference between organized and unorganized
players
Jain Irrigation
19 May 2014 18
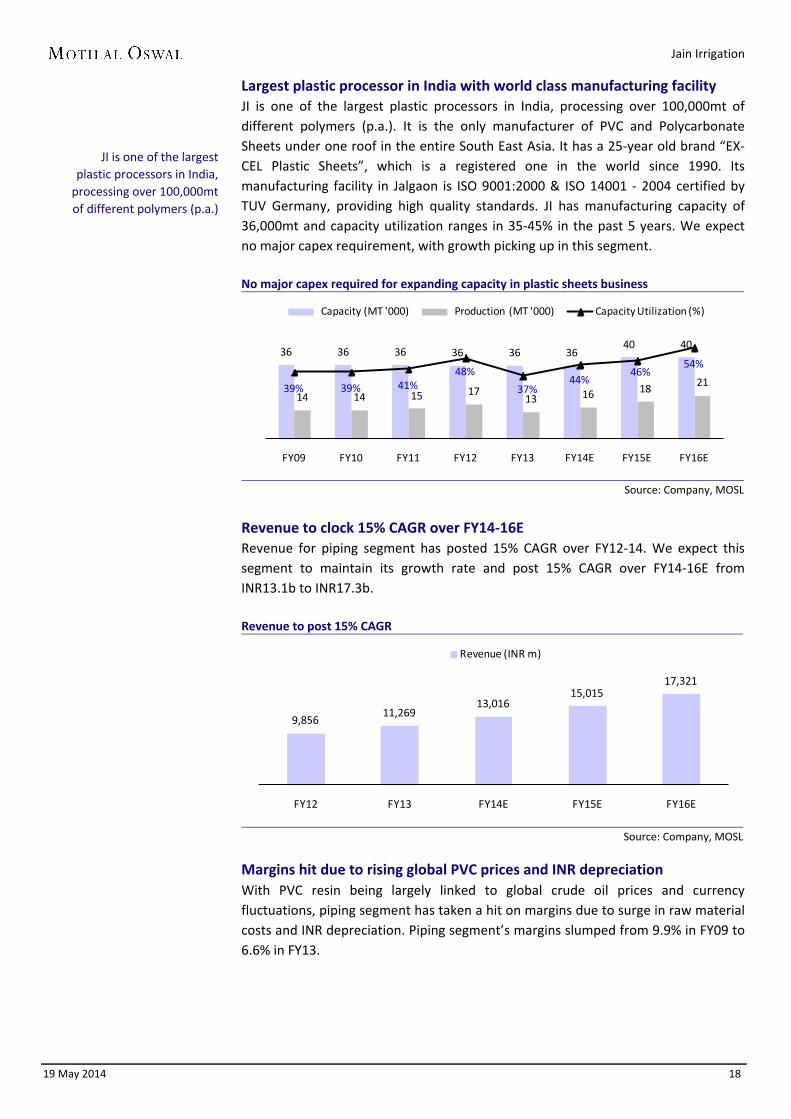
Largest plastic processor in India with world class manufacturing facility JI is one of the largest plastic processors in India, processing over 100,000mt of different polymers (p.a.). It is the only manufacturer of PVC and Polycarbonate Sheets under one roof in the entire South East Asia. It has a 25-year old brand “EX-CEL Plastic Sheets”, which is a registered one in the world since 1990. Its manufacturing facility in Jalgaon is ISO 9001:2000 & ISO 14001 - 2004 certified by TUV Germany, providing high quality standards. JI has manufacturing capacity of 36,000mt and capacity utilization ranges in 35-45% in the past 5 years. We expect no major capex requirement, with growth picking up in this segment. No major capex required for expanding capacity in plastic sheets business
Source: Company, MOSL
Revenue to clock 15% CAGR over FY14-16E Revenue for piping segment has posted 15% CAGR over FY12-14. We expect this segment to maintain its growth rate and post 15% CAGR over FY14-16E from INR13.1b to INR17.3b. Revenue to post 15% CAGR
Source: Company, MOSL
Margins hit due to rising global PVC prices and INR depreciation With PVC resin being largely linked to global crude oil prices and currency fluctuations, piping segment has taken a hit on margins due to surge in raw material costs and INR depreciation. Piping segment’s margins slumped from 9.9% in FY09 to 6.6% in FY13.
36 36 36 36 36 3640 40
14 14 15 1713 16 18 2139% 39% 41%
48%
37%44%
46%54%
FY09 FY10 FY11 FY12 FY13 FY14E FY15E FY16E
Capacity (MT '000) Production (MT '000) Capacity Utilization (%)
9,85611,269
13,01615,015
17,321
FY12 FY13 FY14E FY15E FY16E
Revenue (INR m)
JI is one of the largest plastic processors in India,
processing over 100,000mt of different polymers (p.a.)
Jain Irrigation
19 May 2014 19
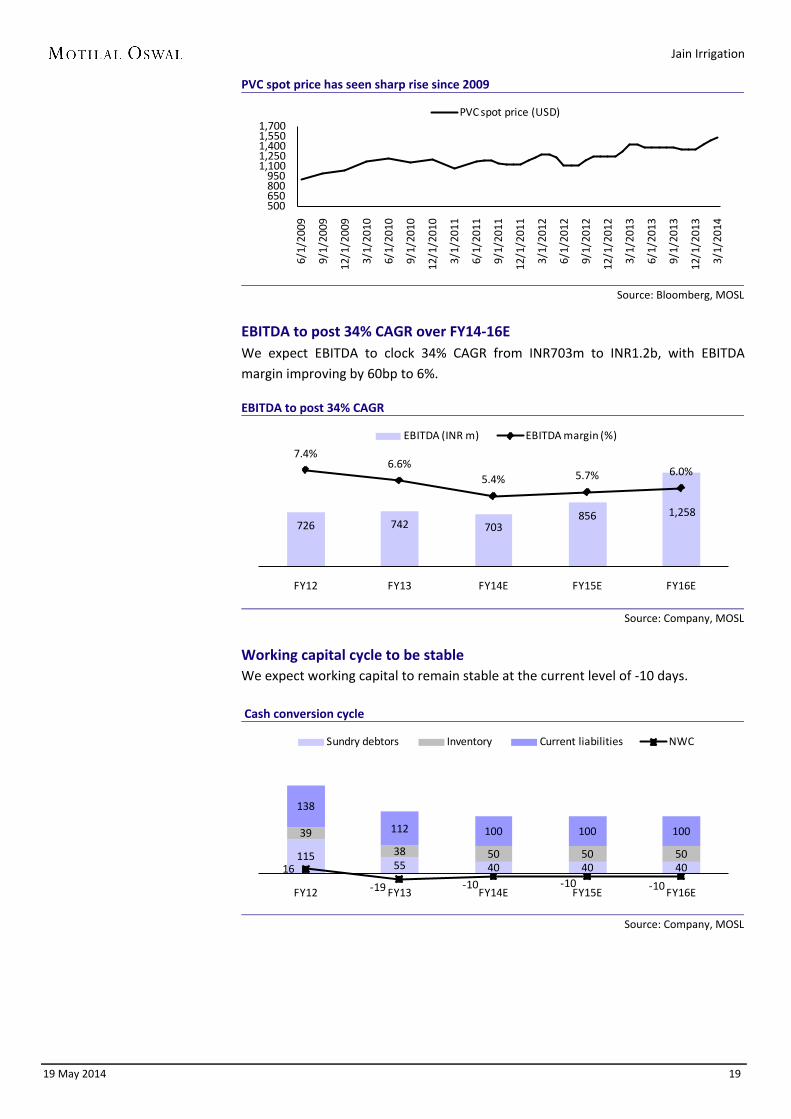
PVC spot price has seen sharp rise since 2009
Source: Bloomberg, MOSL
EBITDA to post 34% CAGR over FY14-16E We expect EBITDA to clock 34% CAGR from INR703m to INR1.2b, with EBITDA margin improving by 60bp to 6%.
EBITDA to post 34% CAGR
Source: Company, MOSL
Working capital cycle to be stable We expect working capital to remain stable at the current level of -10 days. Cash conversion cycle
Source: Company, MOSL
500650800950
1,1001,2501,4001,5501,700
6/1/
2009
9/1/
2009
12/1
/200
9
3/1/
2010
6/1/
2010
9/1/
2010
12/1
/201
0
3/1/
2011
6/1/
2011
9/1/
2011
12/1
/201
1
3/1/
2012
6/1/
2012
9/1/
2012
12/1
/201
2
3/1/
2013
6/1/
2013
9/1/
2013
12/1
/201
3
3/1/
2014
PVC spot price (USD)
726 742 703856 1,258
7.4%6.6%
5.4% 5.7% 6.0%
FY12 FY13 FY14E FY15E FY16E
EBITDA (INR m) EBITDA margin (%)
11555 40 40 40
39
38 50 50 50
138
112 100 100 100
16
-19 -10 -10 -10FY12 FY13 FY14E FY15E FY16E
Sundry debtors Inventory Current liabilities NWC
Jain Irrigation
19 May 2014 20
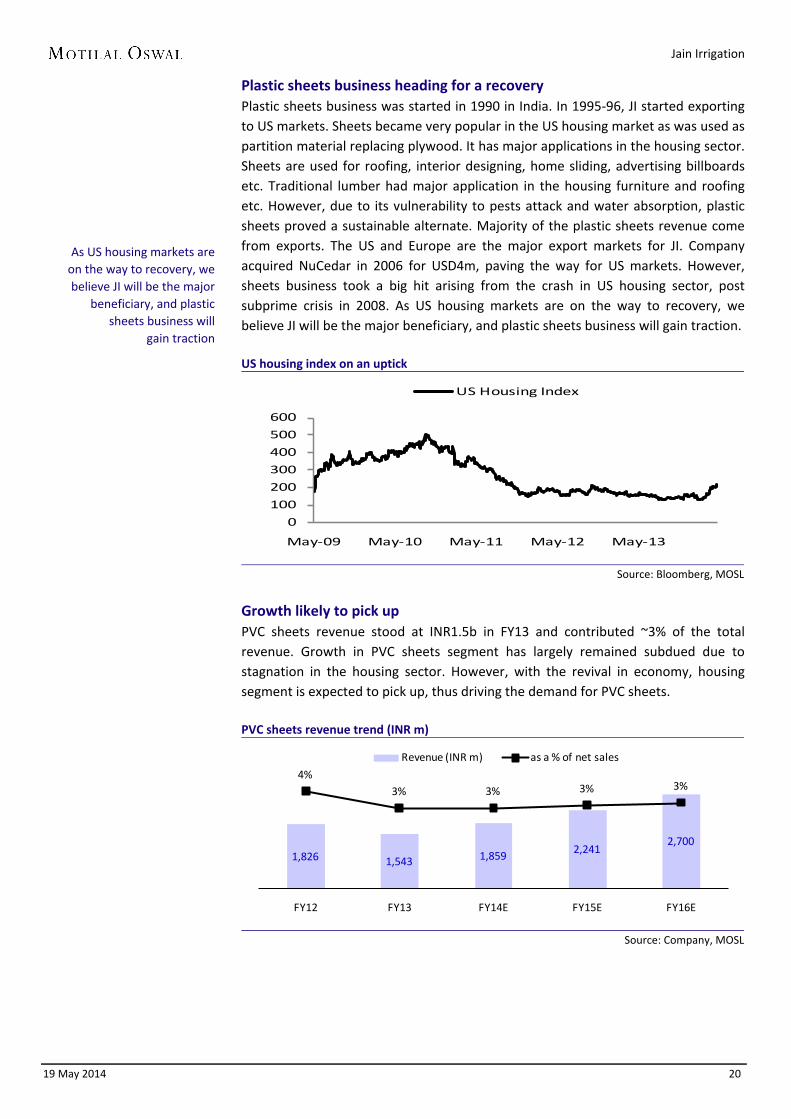
Plastic sheets business heading for a recovery Plastic sheets business was started in 1990 in India. In 1995-96, JI started exporting to US markets. Sheets became very popular in the US housing market as was used as partition material replacing plywood. It has major applications in the housing sector. Sheets are used for roofing, interior designing, home sliding, advertising billboards etc. Traditional lumber had major application in the housing furniture and roofing etc. However, due to its vulnerability to pests attack and water absorption, plastic sheets proved a sustainable alternate. Majority of the plastic sheets revenue come from exports. The US and Europe are the major export markets for JI. Company acquired NuCedar in 2006 for USD4m, paving the way for US markets. However, sheets business took a big hit arising from the crash in US housing sector, post subprime crisis in 2008. As US housing markets are on the way to recovery, we believe JI will be the major beneficiary, and plastic sheets business will gain traction. US housing index on an uptick
Source: Bloomberg, MOSL
Growth likely to pick up PVC sheets revenue stood at INR1.5b in FY13 and contributed ~3% of the total revenue. Growth in PVC sheets segment has largely remained subdued due to stagnation in the housing sector. However, with the revival in economy, housing segment is expected to pick up, thus driving the demand for PVC sheets. PVC sheets revenue trend (INR m)
Source: Company, MOSL
0
100
200
300
400
500
600
May-09 May-10 May-11 May-12 May-13
US Housing Index
1,826 1,543 1,859 2,2412,700
4%3% 3% 3% 3%
FY12 FY13 FY14E FY15E FY16E
Revenue (INR m) as a % of net sales
As US housing markets are on the way to recovery, we believe JI will be the major
beneficiary, and plastic sheets business will
gain traction
Jain Irrigation
19 May 2014 21
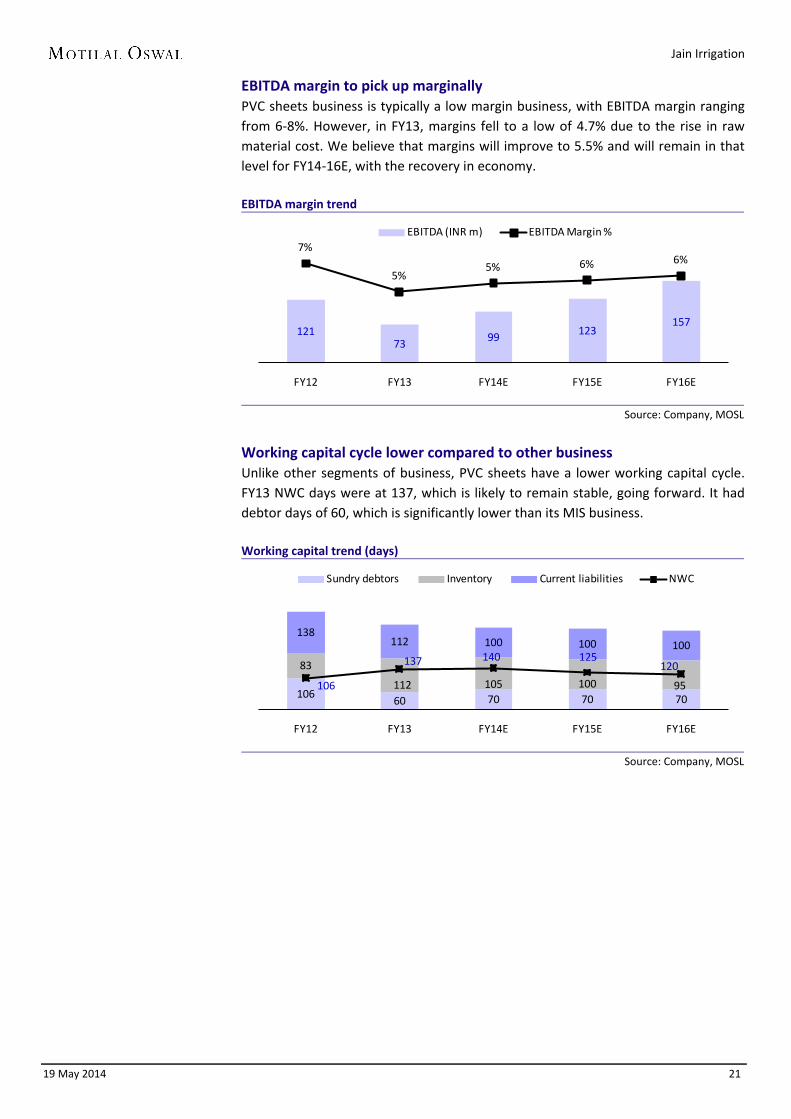
EBITDA margin to pick up marginally PVC sheets business is typically a low margin business, with EBITDA margin ranging from 6-8%. However, in FY13, margins fell to a low of 4.7% due to the rise in raw material cost. We believe that margins will improve to 5.5% and will remain in that level for FY14-16E, with the recovery in economy. EBITDA margin trend
Source: Company, MOSL
Working capital cycle lower compared to other business Unlike other segments of business, PVC sheets have a lower working capital cycle. FY13 NWC days were at 137, which is likely to remain stable, going forward. It had debtor days of 60, which is significantly lower than its MIS business. Working capital trend (days)
Source: Company, MOSL
12173 99 123
157
7%
5%5% 6% 6%
FY12 FY13 FY14E FY15E FY16E
EBITDA (INR m) EBITDA Margin %
10660 70 70 70
83
112 105 100 95
138112 100 100 100
106
137 140 125120
FY12 FY13 FY14E FY15E FY16E
Sundry debtors Inventory Current liabilities NWC
Jain Irrigation
19 May 2014 22
Food processing - a promising business JI is India’s largest food processing company with ~30% market share JI is India’s largest player in the food processing sector with a market share of ~30%
and is third largest in the world.
The world DHO market is ~180,000MTPA growing at ~4-5%. JI is India largest and
world’s 3th largest player in onion dehydration space. It has 7% of world market share
in dehydrated onions market.
JI produces high quality seeds at its in-house facilities which it supplies to the contract
farmers.
JI accounts for ~50% of India have dehydrated vegetable exports and ~40% of
dehydrated onion exports. With acquisition of Cascade Specialities Inc, Jain has
established its manufacturing presence in the US.
JI is involved in the processing of fruits like Mango (80%), Guava, Papaya and Tomato.
India is the largest producer of Mangoes with a 60% share of the world market. JI is
the largest producer of mango pulp, puree and concentrate in the world with 35% of
the world production.
Only 2% of the total produce is processed as compared to ~60-80% in some developed
countries.
JI has procurement contracts with over 6000 farmers which helps it source over 70% of
its requirements. The balance 30% is sourced from open markets.
India’s largest player in food processing industry JI is India’s largest player in the food processing sector, with a market share of ~30% and is the third largest in the world. Its food business is involved in the processing of onion, vegetable dehydration and fruits. JI has 6 processing facilities, 4 in India and 1 in the US and UK each. In India, it has fruit processing units in Jalgaon, Maharashtra and in Chittor and Hyderabad in AP. Dehydrated onion – largely an export product The world DHO market is ~180,000mtpa and growing at ~4-5%. The US is the largest producer of DHO, while India is the other major producer. Of the total onion production, only 2% is dehydrated. Thus, it provides immense opportunity for players like JI to capture on the global presence. JI is India largest and world’s 3th largest player in onion dehydration space. It has 7% of the world market share in dehydrated onions market. Due to ease of use and relatively long shelf life, its popularity is expected to increase. JI has a capacity of 28,000mt, of which it recorded a sale of 19,000mt as in FY13. Company’s DHOs are exported under the brand 'Farm Fresh'. JI employs contract farming in Maharashtra to procure its white onion supply. It produces high quality seeds at its in-house facilities, which it supplies to the contract farmers. The onions produced from these seeds have a 17-18% TSS (total soluble solids), as compared to a normal 12-13% TSS. These seeds have better germination rate and give good yields with lower bacteria count. This helps JI get better yields while processing onions. JI also provides MIS support to its contract farmers, ensuring high quality onion produce. Company’s ability to ensure a good quality white onion supply via contract
JI is India’s largest player in the food processing sector,
with a market share of ~30% and is the third
largest in the world
JI is India largest and world’s 3th largest player in
onion dehydration space

Jain Irrigation
19 May 2014 23
farming and high quality DHO manufacturing procedures make it a preferred supplier. JI is the world’s only producer with manufacturing facilities in two different countries, enabling it to produce dehydrated onions throughout the year (December-March in India and April-July in the US). Company has also expanded its business by increasing the usage of dehydrated onion in the custom made dry ingredients blends for food industry through its subsidiary in the UK for European market. JI is also planning to increase production of value-added products like fried onion, frozen onions, dry vegetable ingredients, industrial blends and other vegetables in the coming years. JI procures 60-70% of its onion requirements through contract farming with >2,000 farmers and 5,000 acres of land under coverage and the rest through open market purchases. Onion prices in India have historically been volatile, thereby leading to uncertainties in margins for dehydration industry. However, to reduce uncertainty, JI contracts part of its onion requirements at fixed prices during middle of the season (thus having a greater control on input costs, compared to entering into contracts at the beginning of season), with the rest being negotiated depending on realizations for dehydrated onions. On the revenue side, JI sells finished products at contracted rates, which get determined a year in advance. Vegetable dehydration – extending expertise in onions to other vegetables JI has also made good inroads in offering related vegetables like garlic, capsicum, dehydrated leeks etc, the results of that will be visible in the coming years. The major application for company’s dehydrated products is in pizzas, chips, burgers, noodles etc. Globally, demand for dehydrated vegetables has increased due to their longer shelf life. JI accounts for ~50% of India’s dehydrated vegetable exports and ~40% of dehydrated onion exports. With the acquisition of Cascade Specialities Inc, JI has established its manufacturing presence in the US. The US market is protected by tariff barriers and hence this acquisition becomes even more significant as it allows JI access to the US as a local producer and opens up the global customer base for JI’s products. Fruit processing - dominant presence by JI in mango processing JI is involved in the processing of fruits like mango (80%), guava, papaya and tomato. India is the largest producer of mangoes, with a 60% share of the world market. JI is the largest producer of mango pulp, puree and concentrate in the world, with 35% of the world production. Processed mango is used in beverages, fruit juices and as a base in jams. JI processes both Totapuri and Alphonso mangoes. Around 70% of the mango pulp produced goes to 'Coca-Cola India' for its famous mango drink 'Maaza'. Coca-Cola expects to triple its mango pulp sourcing for Maaza over the next 5 years, which gives strong visibility for this segment’s revenue over medium term. JI also supplies banana pulp to HUL for its fruit jam products etc. It exports the rest to Middle East, China and the US. Recently, company entered into a JV with 'Coca-Cola India' to implement UHDP (ultra high density plantations) for mango. This initiative will help improve the productivity of farmers and help JI source better and larger mango produce.
JI procures 60-70% of its onion requirements
through contract farming with >2,000 farmers and
5,000 acres of land under coverage and the rest through open market
purchases
JI accounts for ~50% of India’s dehydrated
vegetable exports and ~40% of dehydrated onion
exports
JI is the largest producer of mango pulp, puree and
concentrate in the world, with 35% of the world
production
Jain Irrigation
19 May 2014 24
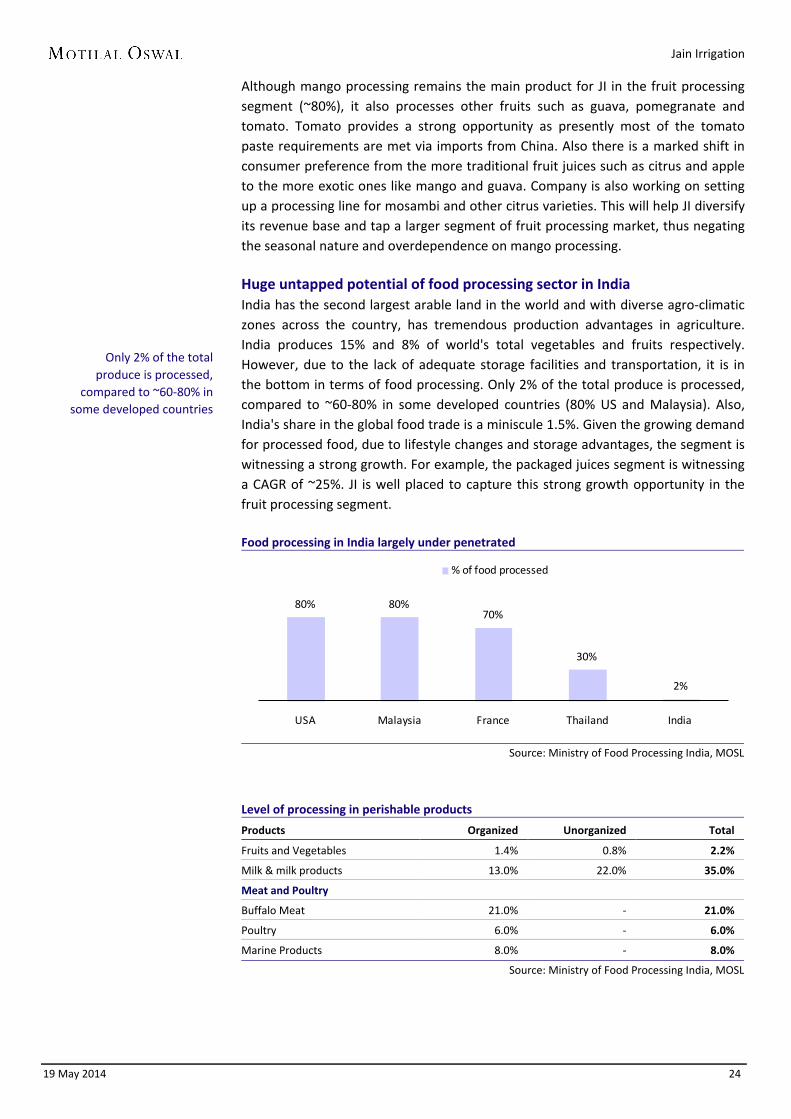
Although mango processing remains the main product for JI in the fruit processing segment (~80%), it also processes other fruits such as guava, pomegranate and tomato. Tomato provides a strong opportunity as presently most of the tomato paste requirements are met via imports from China. Also there is a marked shift in consumer preference from the more traditional fruit juices such as citrus and apple to the more exotic ones like mango and guava. Company is also working on setting up a processing line for mosambi and other citrus varieties. This will help JI diversify its revenue base and tap a larger segment of fruit processing market, thus negating the seasonal nature and overdependence on mango processing. Huge untapped potential of food processing sector in India India has the second largest arable land in the world and with diverse agro-climatic zones across the country, has tremendous production advantages in agriculture. India produces 15% and 8% of world's total vegetables and fruits respectively. However, due to the lack of adequate storage facilities and transportation, it is in the bottom in terms of food processing. Only 2% of the total produce is processed, compared to ~60-80% in some developed countries (80% US and Malaysia). Also, India's share in the global food trade is a miniscule 1.5%. Given the growing demand for processed food, due to lifestyle changes and storage advantages, the segment is witnessing a strong growth. For example, the packaged juices segment is witnessing a CAGR of ~25%. JI is well placed to capture this strong growth opportunity in the fruit processing segment. Food processing in India largely under penetrated
Source: Ministry of Food Processing India, MOSL
Level of processing in perishable products
Products Organized Unorganized Total
Fruits and Vegetables 1.4% 0.8% 2.2%
Milk & milk products 13.0% 22.0% 35.0%
Meat and Poultry
Buffalo Meat 21.0% - 21.0%
Poultry 6.0% - 6.0%
Marine Products 8.0% - 8.0%
Source: Ministry of Food Processing India, MOSL
80% 80%70%
30%
2%
USA Malaysia France Thailand India
% of food processed
Only 2% of the total produce is processed,
compared to ~60-80% in some developed countries
Jain Irrigation
19 May 2014 25
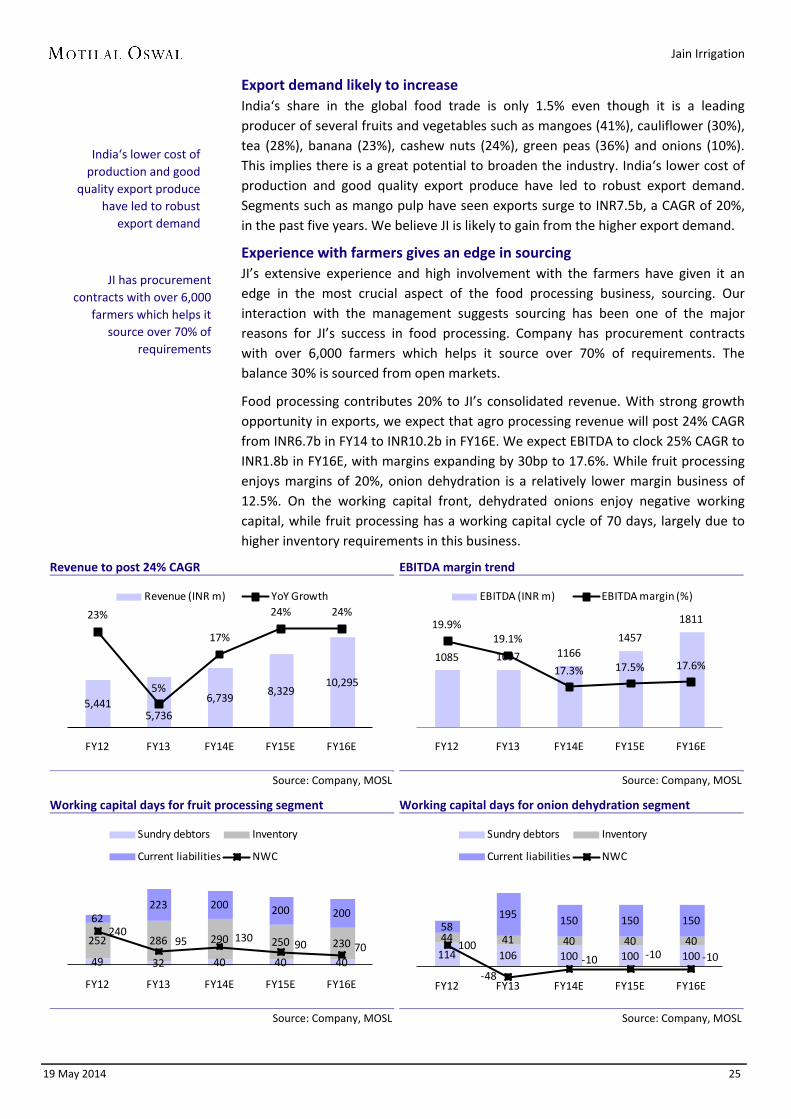
Export demand likely to increase India‘s share in the global food trade is only 1.5% even though it is a leading producer of several fruits and vegetables such as mangoes (41%), cauliflower (30%), tea (28%), banana (23%), cashew nuts (24%), green peas (36%) and onions (10%). This implies there is a great potential to broaden the industry. India‘s lower cost of production and good quality export produce have led to robust export demand. Segments such as mango pulp have seen exports surge to INR7.5b, a CAGR of 20%, in the past five years. We believe JI is likely to gain from the higher export demand.
Experience with farmers gives an edge in sourcing JI’s extensive experience and high involvement with the farmers have given it an edge in the most crucial aspect of the food processing business, sourcing. Our interaction with the management suggests sourcing has been one of the major reasons for JI’s success in food processing. Company has procurement contracts with over 6,000 farmers which helps it source over 70% of requirements. The balance 30% is sourced from open markets.
Food processing contributes 20% to JI’s consolidated revenue. With strong growth opportunity in exports, we expect that agro processing revenue will post 24% CAGR from INR6.7b in FY14 to INR10.2b in FY16E. We expect EBITDA to clock 25% CAGR to INR1.8b in FY16E, with margins expanding by 30bp to 17.6%. While fruit processing enjoys margins of 20%, onion dehydration is a relatively lower margin business of 12.5%. On the working capital front, dehydrated onions enjoy negative working capital, while fruit processing has a working capital cycle of 70 days, largely due to higher inventory requirements in this business.
Revenue to post 24% CAGR
Source: Company, MOSL
EBITDA margin trend
Source: Company, MOSL
Working capital days for fruit processing segment
Source: Company, MOSL
Working capital days for onion dehydration segment
Source: Company, MOSL
5,4415,736
6,7398,329
10,295
23%
5%
17%
24% 24%
FY12 FY13 FY14E FY15E FY16E
Revenue (INR m) YoY Growth
1085 1097 11661457
181119.9%19.1%
17.3% 17.5% 17.6%
FY12 FY13 FY14E FY15E FY16E
EBITDA (INR m) EBITDA margin (%)
49 32 40 40 40
252 286 290 250 230
62223 200 200 200
24095 130
90 70
FY12 FY13 FY14E FY15E FY16E
Sundry debtors Inventory
Current liabilities NWC
114 106 100 100 100
44 41 40 40 4058
195 150 150 150
100
-48-10 -10 -10
FY12 FY13 FY14E FY15E FY16E
Sundry debtors Inventory
Current liabilities NWC
India‘s lower cost of production and good
quality export produce have led to robust
export demand
JI has procurement contracts with over 6,000
farmers which helps it source over 70% of
requirements

Jain Irrigation
19 May 2014 26
Tissue culture – a unique farming solution Unique proposition to improve yields
JI provides a complete farming solution to farmer which is a INR ~0.9-1b business.
JI Green house protection solution ensures that the plants do not suffer from stress or
strain of less and over watering, different climatic conditions.
The system installed at the farmer’s field is commissioned and training imparted to
the farmer, followed by regular after sales services.
It has resulted in increase in yield up to 5x to 8x. While for mangoes yield has
improved by 4x. JI Greenhouse improves the yield significantly.
Protected cultivation – unique farming solution Protected farming is ~INR900-1,000m business for JI. It is involved in providing a complete solution to farmers under protected cultivation. Four solutions are offered under protected cultivation: 1. Green House: Green Houses are climate controlled. Jain Green Houses have a
variety of applications, the majority being off-season growing of vegetables, floriculture, planting material acclimatization, fruit crop growing for export market and plant breeding and varietals improvement.
2. Poly House: Poly houses are naturally ventilated and climate controlled. Jain Poly houses have a variety of applications, the majority being growing of vegetables, floriculture, planting material acclimatization, fruit crop growing for export market.
3. Poly Tunnels: Poly Tunnels are naturally ventilated and climate controlled. Jain Poly Tunnels have a variety of applications, the majority being growing of vegetables, floriculture, planting material acclimatization, fruit crop growing for export market.
4. Net House: Net houses are naturally ventilated and climate controlled. JI net houses have a variety of applications, the majority being growing of vegetables, floriculture and fruit crop growing for export market.
The above solutions protect the crop from high intensity of light, high rainfall, winds, insects through structure, polyethylene film/polycarbonate sheet, shading nets/ thermal nets, insect net, cooling pad, exhaust fan, foggers and drip systems, fertigation equipment etc. The above structure controls light, temperature, humidity and irrigation with fertigation and other required growth substances directly into the root zone of the plant. Water and nutrients enter the soil from emitters, moving into the root zone of the plants through the combined forces of gravity and capillary. In this way, the plant’s withdrawal of moisture and nutrients are replenished almost immediately, ensuring that the plant never suffers from water stress, thus enhancing quality, its ability to achieve optimum growth and high yield. JI has been exporting various components of Green House/Poly House/Poly Tunnels/Net House to Asia, Africa and Far East Asia and also is supplying within India.
Protected cultivation controls light, temperature, humidity and irrigation with
fertigation and other required growth substances
directly into the root zone of the plant
Jain Irrigation
19 May 2014 27
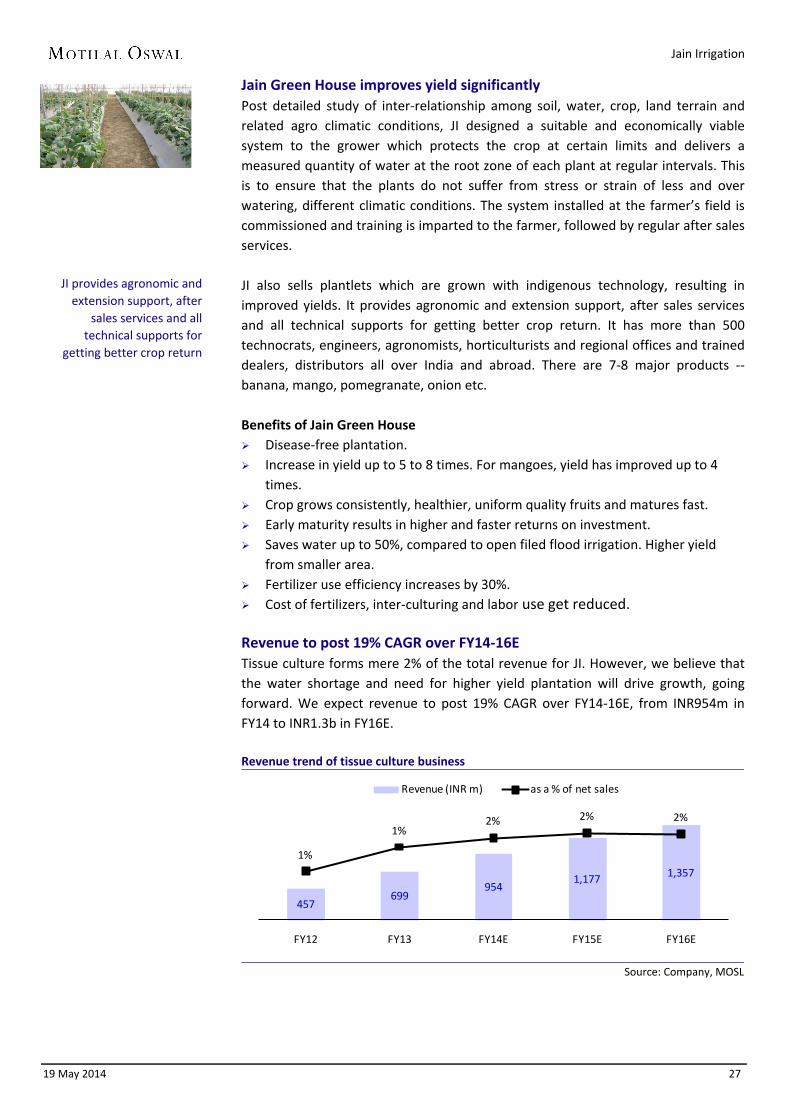
Jain Green House improves yield significantly Post detailed study of inter-relationship among soil, water, crop, land terrain and related agro climatic conditions, JI designed a suitable and economically viable system to the grower which protects the crop at certain limits and delivers a measured quantity of water at the root zone of each plant at regular intervals. This is to ensure that the plants do not suffer from stress or strain of less and over watering, different climatic conditions. The system installed at the farmer’s field is commissioned and training is imparted to the farmer, followed by regular after sales services. JI also sells plantlets which are grown with indigenous technology, resulting in improved yields. It provides agronomic and extension support, after sales services and all technical supports for getting better crop return. It has more than 500 technocrats, engineers, agronomists, horticulturists and regional offices and trained dealers, distributors all over India and abroad. There are 7-8 major products -- banana, mango, pomegranate, onion etc. Benefits of Jain Green House Disease-free plantation. Increase in yield up to 5 to 8 times. For mangoes, yield has improved up to 4
times. Crop grows consistently, healthier, uniform quality fruits and matures fast. Early maturity results in higher and faster returns on investment. Saves water up to 50%, compared to open filed flood irrigation. Higher yield
from smaller area. Fertilizer use efficiency increases by 30%. Cost of fertilizers, inter-culturing and labor use get reduced. Revenue to post 19% CAGR over FY14-16E Tissue culture forms mere 2% of the total revenue for JI. However, we believe that the water shortage and need for higher yield plantation will drive growth, going forward. We expect revenue to post 19% CAGR over FY14-16E, from INR954m in FY14 to INR1.3b in FY16E. Revenue trend of tissue culture business
Source: Company, MOSL
457699
9541,177 1,357
1%
1%2% 2% 2%
FY12 FY13 FY14E FY15E FY16E
Revenue (INR m) as a % of net sales
JI provides agronomic and extension support, after
sales services and all technical supports for
getting better crop return

Jain Irrigation
19 May 2014 28
Solar water heaters, lanterns – similar to MIS model Small but potential business opportunity
With energy prices climbing in India, and supply not keeping up pace with steep demand, solar power is becoming a huge opportunity
Ministry of New and Renewable Energy (MNRE) launched “The Jawaharlal Nehru National Solar Mission” on the 11th January, 2010. The Mission has set the target of deploying 20,000 MW of grid connected solar power by 2022
Solar energy business of Jain Irrigation is similar to its MIS business which is largely subsidy driven.
Revenue and working capital model are similar to MIS business. It has long working capital cycle. For FY13 net working capital stood at 406 days which is expected to improve to 370 days going forward.
Solar power holds strong promise With energy prices increasing in India and supply not keeping up pace with steep demand, solar power is becoming a huge opportunity. India’s solar potential is huge. It is estimated that over the decade, market for solar equipments will be USD6-7b and annual revenue for grid connected solar generators will be USD4b. We believe that JI is poised to capture this growth. Company’s renewable energy division is working with Solar thermal, Solar photovoltaic, Wind, Solar + Wind hybrid systems and bio-energy related manufacturing and application development. The current range includes domestic, commercial and industrial solar powered pumping systems, CFL/LED based home lighting, CFL/LED based street lighting, blinkers, advertising boards, power packs (inverters), traffic signals, wind + solar hybrid systems, biogas plants and turnkey projects based on all the above technologies. Largely subsidy driven business Solar system’s demand comes from both farmers and government projects. However, majority of the business is through government projects which is subsidy driven. Government announces various welfare schemes under which budget is allocated for solar system. The lack of focus by Government resulted in slow growth in this business. However, management believes that once the new government is in office, fresh budget will be allocated to this segment, which will be a huge boost to JI’s revenue. Government’s Solar Mission to boost segment The Ministry of New and Renewable Energy (MNRE) launched “The Jawaharlal Nehru National Solar Mission” on January 11, 2010. The mission has set the target of deploying 20,000mw of grid connected solar power by 2022. It is aimed at reducing the cost of solar power generation in the country through (i) long term policy, (ii) large scale deployment goals, (iii) aggressive R&D and (iv) domestic production of critical raw materials, components and products, to achieve grid tariff parity by 2022. Objective of the mission is to make India a global leader in solar energy. Jain Solar Powered Pumping systems are empanelled with MNRE. This initiative, we believe, will create enough demand for JI's solar products.
It is estimated that over the decade, market for solar
equipments will be USD6-7b and annual revenue for grid connected solar generators
will be USD4b
Management believes that once the new government
is in office, fresh budget will be allocated to this
segment, which will be a huge boost to JI’s revenue
“The Jawaharlal Nehru National Solar Mission” to
boost growth

Jain Irrigation
19 May 2014 29
Working capital model similar to MIS JI’s solar energy business is similar to its MIS business, which is largely subsidy driven. Subsidy is received by the dealer and farmer buys products at a subsidized rate. Dealer passes the subsidy back to JI and thus transaction is completed. However, the time taken to monetize receivables from the Government is very long, which makes this segment less attractive. Similar to its MIS business, renewable energy business has long working capital cycle. For FY13, net working capital stood at 406 days, which is expected to improve to 370 days, going forward. Solar business revenue has grown 8x from a mere INR288m in FY09 to INR2.5b in FY14. We expect revenue to post 13% CAGR to INR3.2b by FY16E primarily driven by Government’s objective to boost renewable energy resource.
Revenue rose over past 5 years
Source: Company, MOSL
Working capital days to improve
Source: Company, MOSL
288 358 785
1,8042,259 2,519 2,863 3,221
1% 1%2%
4%4% 4% 4%
4%
FY09 FY10 FY11 FY12 FY13 FY14E FY15E FY16E
Revenue (INR m) as a % of net sales
210322 300 300 300
110
219 200 200 200116
135 130 130 130
204
406 370 370370
FY12 FY13 FY14E FY15E FY16E
Sundry debtors Inventory
Current liabilities NWC
JI’s solar energy business is similar to its MIS business

Jain Irrigation
19 May 2014 30
International operations – profitability to improve Higher sourcing from India, focus on project business to drive profitability Led by acquisitions, JI is now the second largest MIS player globally with a market
share of 20% as against 30% market share held by Netafim. We expect improvement in profitability of international MIS business on the back of
greater degree of sourcing from low-cost countries like India and focus on higher margin project business.
On the back of 10% revenue CAGR, we expect EBITDA for the international operations to post 28% CAGR over FY14-16.
MIS acquisitions integrated to form Jain Irrigation Inc JI’s MIS acquisitions over the years have enabled it to gain market share on a global basis. Globally, JI is now the second largest MIS player with a market share of 20% as against 30% market share held by Netafim. JI has acquired companies globally to gain distribution reach and access new technologies. In MIS in the US, JI has conducted two major acquisitions during FY07-09, with total cost of USD29m. Aquarius was acquired by JI in FY07 for USD7m and Chapin Watermatics was acquired for USD22m.
Aquarius is a leading manufacturer of micro irrigation systems for agriculture, landscape and nursery applications. Chapin is a pioneer and leading manufacturer of drip tape and is known as a complete source for field crop, nursery and green house drip irrigation systems. Both these acquisitions have given JI a technology advantage (especially Chaplin’s subsoil irrigation technology which is the best in case of sugarcane crop) and helped it introduce new product categories in Indian markets and bring more crops under MIS. Aquarius and Chapin have been integrated to form Jain Irrigation Inc. JII primarily caters to the US MIS market, and for FY13 reported revenues of USD61m posting 10% growth. NaanDan Jain Irrigation - JI’s global entity to implement MIS JI acquired NaanDan (Israel) (NJI) in May 2007 for USD22m. Company is engaged in implementing drip/sprinkler irrigation in over 100 countries worldwide. Apart from Israel (10% of revenue), NJI also has manufacturing facilities in Chile, Brazil and Spain. NJI’s product range includes comprehensive irrigation and climate-control technologies for green houses and nurseries, open fields, orchards and plantations, residential and landscape areas. NJI’s acquisition by JI has been fruitful with respect to technology, new crops and extending its network reach. International MIS profitability set to climb on the back of new initiatives MIS export growth for JI has been strong led by Africa and increase in contribution from projects. JI is increasingly sourcing more MIS products from low cost centers like India to cater to international markets, which is expected to drive profitability for overseas subsidiaries. Also, JI is actively working on more project business (~10% of revenue) in places like Latin America where margins are higher, compared to selling tubing or tape products through dealers, which are comparatively lower margin. Further, JI’s Greenfield capacity in Turkey is expected to ramp up revenue over the next couple of years, thus translating into better profitability from Turkish operations. Management expects overseas business profitability to improve with the current 7% margin expected to expand to 12% over the next 3-4 years.
Globally, JI is now the second largest MIS player
with a market share of 20% as against 30% market
share held by Netafim…
Management expects overseas business
profitability to improve with the current 7% margin
expected to expand to 12% over the next 3-4 years…

Jain Irrigation
19 May 2014 31
Acquisitions in food processing give JI direct access to overseas clients JI has also done acquisitions in agro processing (Onion Dehydration-Cascade Specialities) and food business (Sleaford Quality Foods Ltd - SQFL) to give it access to international food processing markets. Cascade Specialties Cascade Specialties (USA) was acquired in 2006 for USD4.75m for strengthening JI's dehydrated onion business. It is engaged in onion, garlic dehydration and frozen foods business, with specialization in natural low bacteria and organic dehydrated products. We believe Cascade’s acquisition offers perfect synergies as it gives JI an opportunity to market Indian onion basket to Cascade’s ready clientele (like Tesco) and use the marketing network of the company effectively. Sleaford Quality Foods Ltd (SQFL) SQFL (UK) was a client of JI for white onions before its acquisition. SQFL is UK’s leading supplier of dried, dehydrated and canned foods. Post acquisition, JI has been able to market its product to SQFL's clients directly and further enhance its marketing network. Moreover, it will also help JI expand its food basket. JI is in advanced stages of supplying spices procured from Nashik to SQFL to derive advantage of its wide distribution network.
Performance of operating subsidiaries (USD m) Sr. Name of the unit Turnover PAT Net worth PAT margin (% RoE (%) 1 Naandan Jain Irrigation Ltd 130 1 11 1% 12% 2 SQF 2009 Ltd, UK 62 1 5 1% 14% 3 Jain Irrigation INC, California 61 -1 14 -1% -6% 4 Jain Europe Limited, UK 51 0 -4 0% -3% 5 Cascade Specialities Inc, Oregaon 33 0 7 0% 2% 6 Jain (Americas) INC, Ohio 24 -4 39 -17% -11% 7 The Machine SA, Switzerland 19 1 7 4% 11% 8 Jain Sulama Sistemleri, Turkey 16 -2 7 -14% -33% 9 Pro Tool AG, Switzerland 2 0 -1 -2% 6% Total 398 -4 86 -1% -5%
Source: Company, MOSL
Overseas acquisition history Subsidiary name Segment Current Stake Subsidiary Country Date of acquisition Acquisition Price Nucedar Mills Inc. MIS 100.00% USA Feb-06 USD 2.1 mn Eurodrip MIS 7.40% Greece Feb-06 NA Chapin MIS 100.00% USA Apr-06 USD 7 mn Cascade Specialties Inc. Food 100.00% USA Nov-06 USD 4.75 mn Aquarius MIS 100.00% USA Feb-07 USD 22 mn NaanDan MIS 50.00% Israel May-07 USD 22 mn Thomas Machines S A Plastics 69.80% Switzerland Mar-08 N.A Sleaford Quality Foods Ltd. Food 85.00% UK Nov-10 N.A
Source: Company, MOSL

Jain Irrigation
19 May 2014 32
Revenue to post 10% CAGR, EBITDA 28% CAGR over FY14-16E We expect revenue for the international business to clock 10% CAGR over FY14-16E from INR17.6b to INR21.6b. We expect profitability to improve substantially with EBITDA expected to post 28% CAGR. On the overseas business front, international MIS is a lower working capital intensive business compared to international food processing, with a net working capital cycle of ~120 days versus 170. Working capital cycle is likely to improve from 155 days in FY14 to 140 in FY16E. Revenue to post moderate 10% CAGR
Source: Company, MOSL
EBITDA to clock 28% CAGR on the back of new initiatives to improve margins
Source: Company, MOSL
Working capital to witness improvement led by lower debtor days
Source: Company, MOSL
9,605
14,29117,695
19,56821,651
FY12 FY13 FY14E FY15E FY16E
Revenue (INR m)
831 9931,192
1,7791,957
7%6% 7%
10% 10%
0%
2%
4%
6%
8%
10%
FY12 FY13 FY14E FY15E FY16E
EBITDA (INR m) EBITDA margin (%)
76 84 80 75 70
207 133 140 140 140
89
60 65 70 70
194157 155 145
140
FY12 FY13 FY14E FY15E FY16E
Sundry debtors Inventory Current liabilities NWC

Jain Irrigation
19 May 2014 33
Earnings to post 48% CAGR over FY14-16E Balance sheet stress to ease on the back of improvement in profitability Revenues to grow at 16.8% CAGR over FY14-16E led by improvement in growth
outlook for domestic MIS business. EBITDA to grow in line with revenue growth; margins to be maintained. Adjusted PAT to post 48% CAGR over FY14-16E. Working capital to improve from 213 days in FY14 to 160 days in FY16E. Debt to equity to decline from 1.6x to 1.0x Return ratios to improve; RoCE/RoE to improve from 11% / 9.1% in FY14 to 15.4% /
16.1% in FY16E.
Expect revenue CAGR of 16.8% over FY14-16E We expect consolidated revenue to post a CAGR of 16.8% led by strong growth in food processing and MIS businesses, which are expected to clock 23% CAGR and 21% CAGR respectively over FY14-16E. We expect overseas business to post a moderate 10% CAGR over FY14-16E. Revenue to post 16.8% CAGR
Source: Company, MOSL
EBITDA to grow in line with revenue growth; margins to be maintained We expect EBITDA to grow in line with revenue at 16% CAGR over FY14-16E. We expect margins to be maintained at current levels of 13.8%. EBITDA to clock 16% CAGR
Source: Company, MOSL
49,206 50,21760,430
70,53382,407
FY12 FY13 FY14E FY15E FY16E
Revenues (INR m)
8,155 7,4198,326 9,718 11,354
16.6%14.8% 13.8% 13.8%
13.8%
FY12 FY13 FY14E FY15E FY16E
EBITDA (INR m) Margins (%)

Jain Irrigation
19 May 2014 34
Adjusted PAT to post 48% CAGR over FY14-16E We expect adjusted PAT to post 48% CAGR over FY14-16E, from INR2.0b to INR4.5b. PAT (INR m)
Source: MOSL
Working capital cycle set to improve We expect the consolidated working capital days to improve from 234 days in FY13 to 160 in FY16E, largely led by MIS business.
Cash conversion cycle (days)
Source: MOSL
Operating and free cash flows to improve led by improving working capital; capex to be limited to maintenance related over FY14-16E Operating cash flows are expected to improve significantly to INR8.9b, while free cash is expected to improve to INR6.8b over FY14-16E led by an improvement in working capital in MIS business. We expect capex to be limited to maintenance related and be capped at INR2b for FY14-16E.
Operating cash flow to improve led by working capital
Source: Company, MOSL
Free cash generation to be robust led by limited capex
Source: Company, MOSL
2,286
442
2,074
3,012
4,549
FY12 FY13 FY14E FY15E FY16E
PAT (INR m)
108 125 121 113 109
168 142 127 110 101
-121 -116 -108 -113 -117
211 234 213 179 160
FY12 FY13 FY14E FY15E FY16E
Inventory Days Debtor Days Creditor Days Cash Conversion Cycle
781
3,2175,156
9,639 8,986
FY12 FY13 FY14E FY15E FY16E
Operating Cash Flow (INR m)
-4,420
518
3,006
7,491 6,812
FY12 FY13 FY14E FY15E FY16E
Free Cash Flow (INR m)

Jain Irrigation
19 May 2014 35
Debt-equity to decline to 1x on the back of robust cash generation We expect net debt to equity to decline from 1.6x to 1.0x as cash generated from improved working capital is utilized towards retiring of debt. 3QFY14 saw JI’s long term debt upgraded to investment grade rating BBB minus. Short term debt however has a rating of A3, which management expects to go to A1 in 1QFY15. Improvement in credit ratings resulted in lower domestic cost of debt which declined from 13.7% to 12.2% in 3QFY14. Net debt to equity to decline to 1.0
Source: Company, MOSL
Return ratios to witness improvement With 16.8% revenue CAGR, stable margins and improvement in working capital, we expect JI’s return ratios to improve over FY14-16E. We expect RoCE to improve from 11.0% in FY14 to 15.4% in FY16E, similarly we expect RoE to improve from 9.1% in FY14 to 16.1% in FY16E.
RoCE (%)
Source: Company, MOSL
RoE (%)
Source: Company, MOSL
34,442 35,854 37,510
34,36331,620
2.01.7 1.6
1.31.0
FY12 FY13 FY14E FY15E FY16E
Net Debt (INR m) Net DER (x)
14.011.1 11.0
13.015.4
FY12 FY13 FY14E FY15E FY16E
RoCE (%)
13.5
2.2
9.112.1
16.1
FY12 FY13 FY14E FY15E FY16E
RoE (%)

Jain Irrigation
19 May 2014 36
Initiating coverage with Buy rating Target price of INR140 implies 40% upside With a focus on progressive states and switch to cash-based model, we expect JI’s
working capital concerns to be allayed over FY14-16E. Hence, we expect strong free cash generation which should help in reducing debt to
equity from 1.6x in FY14 to 1x in FY16E. Policy impetus from the new Government in the form of direct credit of subsidy or a
reduced working capital model on the lines of GGRC can be potential game changer events.
We value JI at 14x FY16E EPS of INR10 and arrive at a target price of INR140, implying 40% upside. We initiate coverage with a Buy rating.
Price to Earnings
Source: Company, MOSL
Price to Book
Source: Company, MOSL
EV/EBITDA
Source: Company, MOSL
13.917.1
20.9
19.0
0
10
20
30
40
Oct
-01
Dec
-02
Feb-
04
Mar
-05
May
-06
Jun-
07
Aug
-08
Sep-
09
Nov
-10
Jan-
12
Feb-
13
Apr
-14
P/E (x) 12 Yrs Avg(x)5 Yrs Avg(x) 10 Yrs Avg(x)
Negative Earnings
Cycle 1.42.32.8
2.9
0.0
1.5
3.0
4.5
6.0
Apr
-00
Jun-
01
Aug
-02
Oct
-03
Dec
-04
Feb-
06
Apr
-07
Jun-
08
Aug
-09
Oct
-10
Nov
-11
Jan-
13
Mar
-14
P/B (x) 12 Yrs Avg(x)5 Yrs Avg(x) 10 Yrs Avg(x)
7.2
34.8
13.7
11.36.3
1
9
17
25
33
41
Apr
-00
Jun-
01
Aug
-02
Oct
-03
Dec
-04
Feb-
06
Apr
-07
Jun-
08
Aug
-09
Oct
-10
Dec
-11
Feb-
13
Apr
-14
EV/EBDITA(x) Peak(x) Avg(x) Median(x) Min(x)
Attractively valued at 10x FY16E earnings…
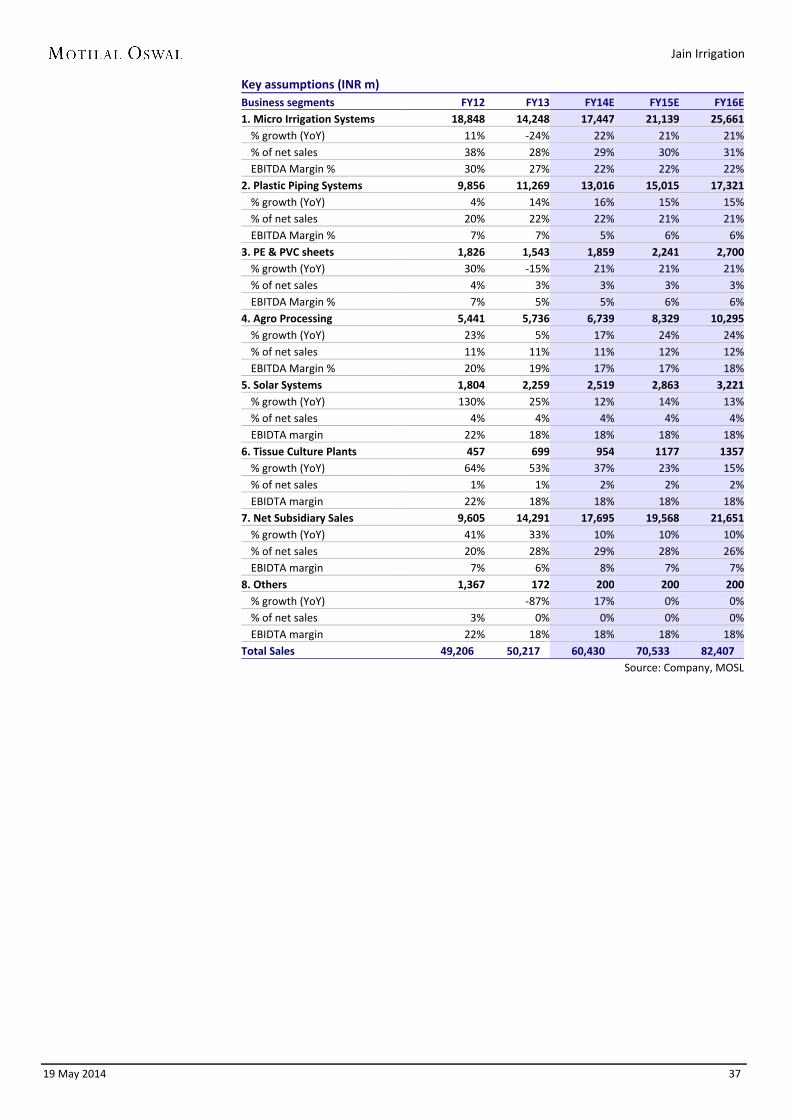
Jain Irrigation
19 May 2014 37
Key assumptions (INR m) Business segments FY12 FY13 FY14E FY15E FY16E 1. Micro Irrigation Systems 18,848 14,248 17,447 21,139 25,661
% growth (YoY) 11% -24% 22% 21% 21% % of net sales 38% 28% 29% 30% 31% EBITDA Margin % 30% 27% 22% 22% 22%
2. Plastic Piping Systems 9,856 11,269 13,016 15,015 17,321 % growth (YoY) 4% 14% 16% 15% 15% % of net sales 20% 22% 22% 21% 21% EBITDA Margin % 7% 7% 5% 6% 6%
3. PE & PVC sheets 1,826 1,543 1,859 2,241 2,700 % growth (YoY) 30% -15% 21% 21% 21% % of net sales 4% 3% 3% 3% 3% EBITDA Margin % 7% 5% 5% 6% 6%
4. Agro Processing 5,441 5,736 6,739 8,329 10,295 % growth (YoY) 23% 5% 17% 24% 24% % of net sales 11% 11% 11% 12% 12% EBITDA Margin % 20% 19% 17% 17% 18%
5. Solar Systems 1,804 2,259 2,519 2,863 3,221 % growth (YoY) 130% 25% 12% 14% 13% % of net sales 4% 4% 4% 4% 4% EBIDTA margin 22% 18% 18% 18% 18%
6. Tissue Culture Plants 457 699 954 1177 1357 % growth (YoY) 64% 53% 37% 23% 15% % of net sales 1% 1% 2% 2% 2% EBIDTA margin 22% 18% 18% 18% 18%
7. Net Subsidiary Sales 9,605 14,291 17,695 19,568 21,651 % growth (YoY) 41% 33% 10% 10% 10% % of net sales 20% 28% 29% 28% 26% EBIDTA margin 7% 6% 8% 7% 7%
8. Others 1,367 172 200 200 200 % growth (YoY) -87% 17% 0% 0% % of net sales 3% 0% 0% 0% 0% EBIDTA margin 22% 18% 18% 18% 18%
Total Sales 49,206 50,217 60,430 70,533 82,407
Source: Company, MOSL
Jain Irrigation
19 May 2014 38
Risks and concerns High receivables JI has large receivables equivalent to 247 days of sales. This is a drag on the company's balance sheet. Most of these receivables are subsidies pending from the respective state government. We believe that with the formation of NBFC, company will be able to improve its receivable scenario. However, if the receivables burden deteriorates, JI's balance sheet could pose a risk.
Raw material price risk Resins form ~64% of the total raw material cost. Any fluctuations in resin prices in the short term will impact margins negatively. However, as most of the raw material price rise is pass-on, we believe such price fluctuations should not have any significant impact on margins in the long run. JI procures white onions from farmers at market price. Any price rise in onions will negatively impact margins in DHO business as the price rise cannot be passed on easily in the export market where prices are determined based on global white onion availability. Subsidy removal Subsidy is a huge incentive for farmers to buy MIS equipments. Any reduction/removal of subsidy provided for micro irrigation equipments will have a negative impact on demand for MIS systems. However, we believe that given Government’s high focus on MIS, subsidies on equipments will stay intact.

Jain Irrigation
19 May 2014 39
Management
Mr Bhavarlal H Jain, Chairman Mr Bhavarlal H Jain is the founder of the Jain group of companies and Chairman of the company. He began his business in 1963 by trading in agricultural inputs and equipments. In 1978, he acquired a sick unit which he used to manufacture Papain. In 1980, he commenced PVC pipe manufacturing operations. Post 1986, he pioneered the concept of micro irrigation in India. He has received many awards and accolades for outstanding work in agriculture, including the prestigious Crawford Reid Memorial Award instituted by Irrigation Association, U.S.A. for “Significant Contribution to the Irrigation Industry outside the United States”. Three honorary doctorates have been conferred on him from different universities acknowledging path breaking work he has done for improvement of agriculture in India. Mr Ashok B Jain, Vice Chairman Mr Ashok B Jain is the Vice Chairman of the company. He holds a graduate degree in commerce from Pune University, India. He joined the management team in 1982 and was in charge of marketing and extension services in Maharashtra and other states. In 1993, he became Director and was responsible for Corporate Administration, Corporate Image and Relationships, Events Management, Personnel/Human Resource Development, Communication, Public Relations, Art and Publicity. At present, he also acts as Director in charge of the Food Processing Division. Mr Anil B Jain, Managing Director Mr Anil B Jain has been the Managing Director of the company since 1993. He has a commerce degree from Pune University and Law Degree from Mumbai University. He joined the management team in 1984 and was in charge of the US-based marketing operations. Mr Anil Jain has an extensive background and experience in Finance, Banking, Mergers & Acquisitions, Strategic Planning, Restructuring Operations, Export Marketing, International Business Relations, Joint Ventures. Mr Ajit B Jain, Joint Managing Director Mr Ajit B Jain has been the Joint Managing Director of the company since 1994. He is a engineering graduate from Dnyaneshwar University. He is a Director in charge of drip irrigation division, including guidance for extension service and development of new applications and products. He joined management of the company in 1984 and started his training in production and maintenance in the pipe division. In 1991, he was appointed Director with the overall responsibility of the pipe manufacturing plant at Jalgaon, including production, maintenance and marketing. Mr Atul B Jain, Director of Marketing Mr Atul B Jain is Director of Marketing. He holds a graduate degree in commerce from Pune University, India. He joined the management team in 1992. From 1994–2000, he was in charge of Europe-based marketing operations and was responsible for developing and maintaining the market for PVC sheets, dehydrated onion, fruit pulp etc. Presently, he focuses on marketing products on a global basis in addition to being Director in charge of piping division.

Jain Irrigation
19 May 2014 40
Company overview Corporate structure Established in 1986, JI is a transnational organization headquartered at Jalgaon, Maharashtra, India. JI employs over 5,000 associates and manufactures a number of products, including drip and sprinkler irrigation systems, PVC & PE piping systems, plastic sheets, green houses, bio-fertilizers, solar products including water-heating systems, photovoltaic appliances and solar pumps. JI processes fruits and vegetables into aseptic concentrates, frozen fruits and dehydrated vegetables, respectively. It has 21 manufacturing plants spread over 5 continents and its products are supplied to 110 countries through 3,000 dealers and distributors worldwide.
Product-wise revenue contribution
Source: Company, MOSL
Geography-wise revenue contribution
Source: Company, MOSL
Revenue composition by business verticals (INR m)
Business verticals FY09 FY10 FY11 FY12 FY13 Mix (2013) CAGR
Micro Irrigation 15,084 18,722 23,311 26,798 22,903 45.5% 11.0%
Piping Products 7,425 8,418 9,464 9,855 11,154 22.2% 10.7%
Food Products 3,701 5,015 5,875 8,352 10,260 20.4% 29.0%
Solar Products 276 352 744 1,691 2,203 4.4% 68.1%
Other Products 2,682 2,072 2,240 2,704 3,766 7.5% 8.9%
Total 29,167 34,579 41,634 49,400 50,286 100.0% 14.6%
Source: Company, MOSL
Revenue composition by geographies (INR m)
Geographies FY09 FY10 FY11 FY12 FY13 Mix (2013) CAGR
India 17,484 22,567 28,263 31,280 31,280 57.2% 13.2%
Europe 3,258 4,110 4,243 7,222 7,222 17.0% 27.3%
North America 2,715 3,934 4,389 4,590 4,590 11.1% 19.7%
Rest of World 5710 3968 4739 6,308 6,308 14.7% 6.7%
Total 29,167 34,579 41634 49,400 49,400 100.0% 14.6%
Source: Company, MOSL
Micro Irrigation,
45.5%
Piping Products,
22.2%
Food Products,
20.4%
Solar Products,
4.4%
Other Products,
7.5%
India, 57.2%
Europe, 17.0%
North America,
11.1%
Rest of World, 14.7%
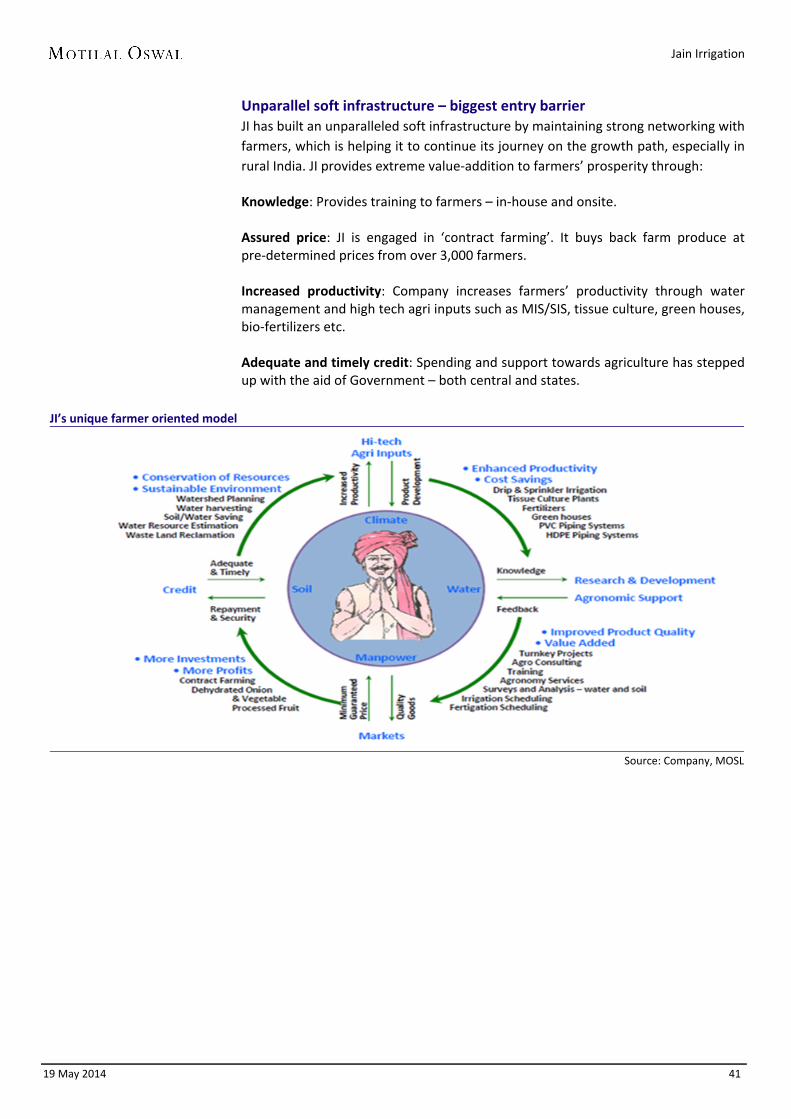
Jain Irrigation
19 May 2014 41
Unparallel soft infrastructure – biggest entry barrier JI has built an unparalleled soft infrastructure by maintaining strong networking with farmers, which is helping it to continue its journey on the growth path, especially in rural India. JI provides extreme value-addition to farmers’ prosperity through: Knowledge: Provides training to farmers – in-house and onsite. Assured price: JI is engaged in ‘contract farming’. It buys back farm produce at pre-determined prices from over 3,000 farmers. Increased productivity: Company increases farmers’ productivity through water management and high tech agri inputs such as MIS/SIS, tissue culture, green houses, bio-fertilizers etc. Adequate and timely credit: Spending and support towards agriculture has stepped up with the aid of Government – both central and states.
JI’s unique farmer oriented model
Source: Company, MOSL

Jain Irrigation
19 May 2014 42
Geographical reach JI has a strong supply chain within and outside India. It has a strong dealership network of over 2,700 pan-India, 81 offices and 40 depots and 12 manufacturing facilities. Similarly, JI has a strong global network aggregating over 900 distributors, 23 warehouses and sales offices and 15 manufacturing facilities.
JI’s Indian network
Source: Company, MOSL
JI’s global network
Source: Company, MOSL
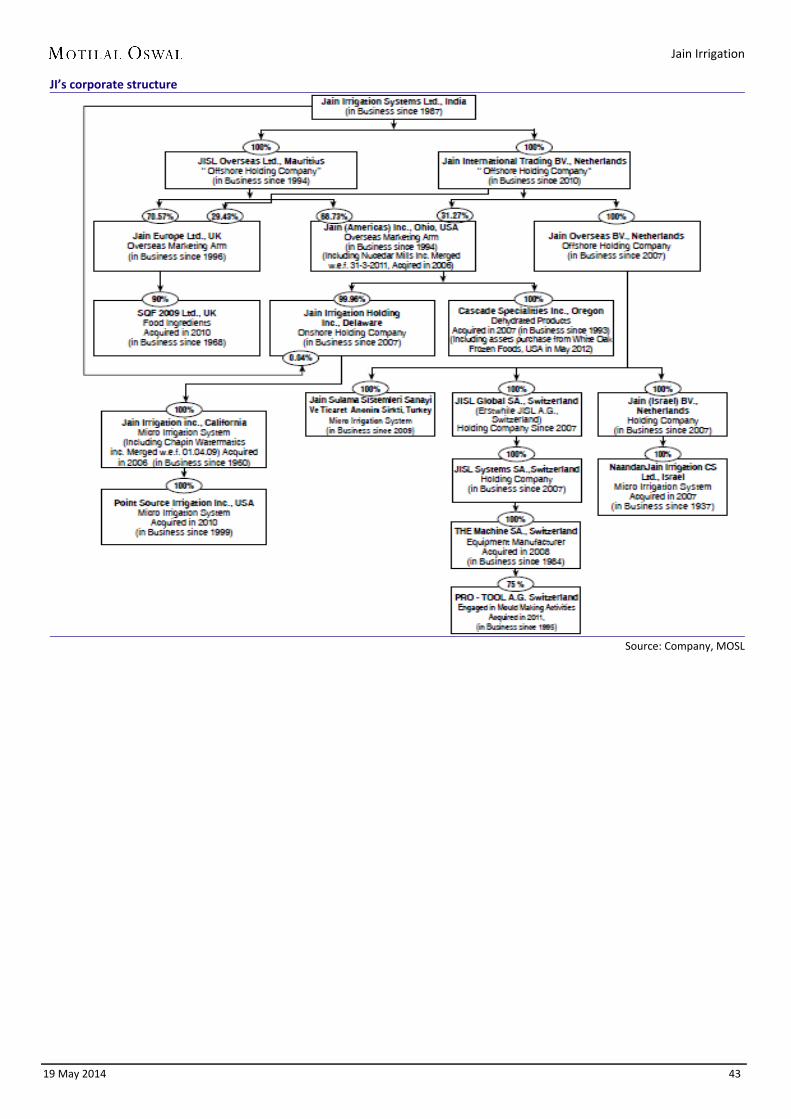
Jain Irrigation
19 May 2014 43
JI’s corporate structure
Source: Company, MOSL

Jain Irrigation
19 May 2014 44
Annexure Drip irrigation Drip irrigation is a method of micro irrigation, which saves water and fertilizers by allowing water to drip slowly and directly to the roots of plants through a network of pipes, valves, tubing and emitters/drippers. The dripping of water can happen either onto the soil surface (normal drip irrigation) or directly onto the root zone (subsurface drip irrigation – where the laterals and drippers are buried under the surface). The emitters/drippers allow for a uniform and controlled supply of water directly into the root zone of the plant. This helps the plant to absorb only the required amount of water, thus resulting in saving the plants from water stress, saving of water and increased yield of plants. Drip irrigation also provides the option of having a fertigation unit, which helps supplying growth nutrients like fertilizers to plants in a controlled fashion, helping the yield of plants and also in saving the wastage of fertilizer. We shall briefly see how the drip irrigation mechanism functions. First, the pump is connected to the water source which pumps water into the water filters. These water filters help in increasing the yield by providing cleaner water to plants as well as in protecting the tubing from clogging, thus decreasing the maintenance cost. The water then enters into the fertigation system to take up the plant nutrients fed into this unit and then enters into the main lines. From the main line, the water would travel into sub-main lines and then further into polytubes/laterals. These polytubes run along the rows of plants and have emission points where drippers are arranged for the purpose of dripping of water. From these drippers, water drips directly near the root area of individual plants.
Drip irrigation system
Source: Company, MOSL
Key components • Pump • Water filter (sand separator like
hydro-cyclone, screen filter, media filters)
• Fertigation systems and chemigation equipment
• Backwash controller (backflow preventer)
• Main line (larger diameter pipe and pipe fittings)
• Control valves and safety valves (hand-operated, electronic, or hydraulic)
• Laterals (smaller diameter polytube)
• Poly fittings and accessories (to make connections)
• Emitter/ Drippers
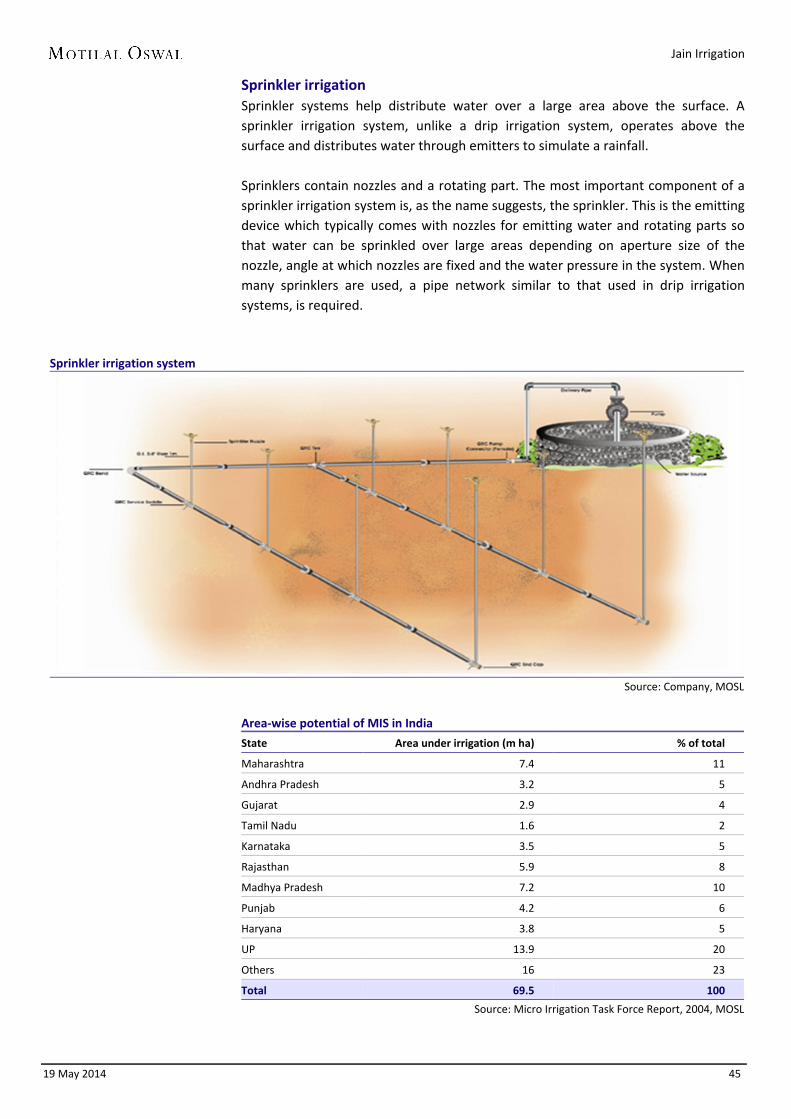
Jain Irrigation
19 May 2014 45
Sprinkler irrigation Sprinkler systems help distribute water over a large area above the surface. A sprinkler irrigation system, unlike a drip irrigation system, operates above the surface and distributes water through emitters to simulate a rainfall. Sprinklers contain nozzles and a rotating part. The most important component of a sprinkler irrigation system is, as the name suggests, the sprinkler. This is the emitting device which typically comes with nozzles for emitting water and rotating parts so that water can be sprinkled over large areas depending on aperture size of the nozzle, angle at which nozzles are fixed and the water pressure in the system. When many sprinklers are used, a pipe network similar to that used in drip irrigation systems, is required.
Sprinkler irrigation system
Source: Company, MOSL
Area-wise potential of MIS in India
State Area under irrigation (m ha) % of total
Maharashtra 7.4 11
Andhra Pradesh 3.2 5
Gujarat 2.9 4
Tamil Nadu 1.6 2
Karnataka 3.5 5
Rajasthan 5.9 8
Madhya Pradesh 7.2 10
Punjab 4.2 6
Haryana 3.8 5
UP 13.9 20
Others 16 23
Total 69.5 100
Source: Micro Irrigation Task Force Report, 2004, MOSL

Jain Irrigation
19 May 2014 46
Crop-wise potential for implementation of drip and sprinkler (m ha)
Crop Drip (m ha) Sprinkler (m ha) Total (m ha)
Cereals - 27.6 27.6
Pulses - 7.6 7.6
Oil seeds 3.8 1.1 4.9
Cotton 7.0 1.8 8.8
Vegetables 3.6 2.4 6.0
Spices & Condiments 1.4 1.0 2.4
Flowers - 1.0 1.0
Sugarcane 4.3 - 4.3
Fruits 3.9 - 3.9
Coconut & plantation crops (Oil Palm) 3.0 - 3.0
Total 27.0 42.5 69.5
Source: Micro Irrigation Task Force Report, 2004, MOSL
Crop-wise potential for implementation of drip and sprinkler (% of area)
Crop Drip (% area) Sprinkler (% area) Total (% area)
Cereals - 65 40
Pulses - 18 11
Oil seeds 14 3 7
Cotton 26 4 13
Vegetables 13 6 9
Spices & Condiments 5 2 3
Flowers - 2 1
Sugarcane 16 - 6
Fruits 14 - 6
Coconut & plantation crops (Oil Palm) 11 - 4
Total 100 100 100
Source: Micro Irrigation Task Force Report, 2004, MOSL
State-wise MIS market share
States Jain Irrigation Netafim
Maharashtra 65 n.a.
Andhra Pradesh 35 12
Gujarat 30 35+
Tamil Nadu 60 n.a.
Karnataka 60 n.a.
Madhya Pradesh 60 n.a.
Others 50 10
India 50 15
Source: Industry sources, MOSL
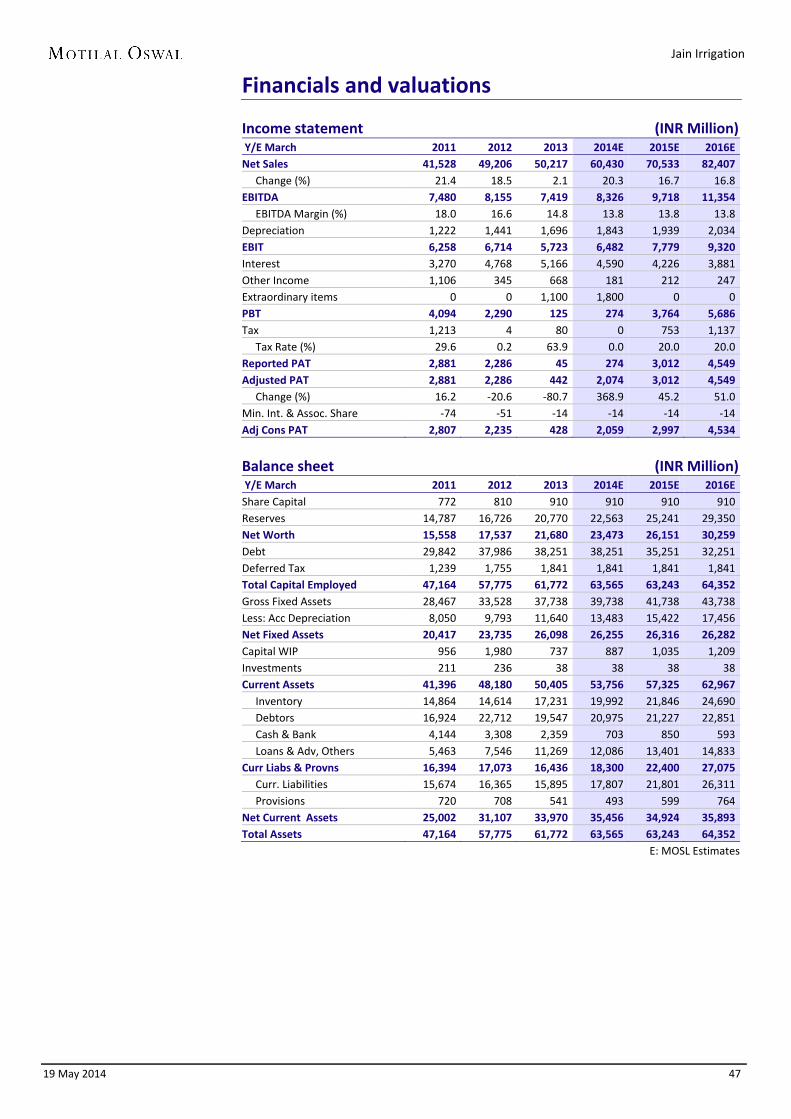
Jain Irrigation
19 May 2014 47
Financials and valuations Income statement (INR Million) Y/E March 2011 2012 2013 2014E 2015E 2016E Net Sales 41,528 49,206 50,217 60,430 70,533 82,407 Change (%) 21.4 18.5 2.1 20.3 16.7 16.8 EBITDA 7,480 8,155 7,419 8,326 9,718 11,354 EBITDA Margin (%) 18.0 16.6 14.8 13.8 13.8 13.8 Depreciation 1,222 1,441 1,696 1,843 1,939 2,034 EBIT 6,258 6,714 5,723 6,482 7,779 9,320 Interest 3,270 4,768 5,166 4,590 4,226 3,881 Other Income 1,106 345 668 181 212 247 Extraordinary items 0 0 1,100 1,800 0 0 PBT 4,094 2,290 125 274 3,764 5,686 Tax 1,213 4 80 0 753 1,137 Tax Rate (%) 29.6 0.2 63.9 0.0 20.0 20.0 Reported PAT 2,881 2,286 45 274 3,012 4,549 Adjusted PAT 2,881 2,286 442 2,074 3,012 4,549 Change (%) 16.2 -20.6 -80.7 368.9 45.2 51.0 Min. Int. & Assoc. Share -74 -51 -14 -14 -14 -14 Adj Cons PAT 2,807 2,235 428 2,059 2,997 4,534
Balance sheet (INR Million) Y/E March 2011 2012 2013 2014E 2015E 2016E Share Capital 772 810 910 910 910 910 Reserves 14,787 16,726 20,770 22,563 25,241 29,350 Net Worth 15,558 17,537 21,680 23,473 26,151 30,259 Debt 29,842 37,986 38,251 38,251 35,251 32,251 Deferred Tax 1,239 1,755 1,841 1,841 1,841 1,841 Total Capital Employed 47,164 57,775 61,772 63,565 63,243 64,352 Gross Fixed Assets 28,467 33,528 37,738 39,738 41,738 43,738 Less: Acc Depreciation 8,050 9,793 11,640 13,483 15,422 17,456 Net Fixed Assets 20,417 23,735 26,098 26,255 26,316 26,282 Capital WIP 956 1,980 737 887 1,035 1,209 Investments 211 236 38 38 38 38 Current Assets 41,396 48,180 50,405 53,756 57,325 62,967 Inventory 14,864 14,614 17,231 19,992 21,846 24,690 Debtors 16,924 22,712 19,547 20,975 21,227 22,851 Cash & Bank 4,144 3,308 2,359 703 850 593 Loans & Adv, Others 5,463 7,546 11,269 12,086 13,401 14,833 Curr Liabs & Provns 16,394 17,073 16,436 18,300 22,400 27,075 Curr. Liabilities 15,674 16,365 15,895 17,807 21,801 26,311 Provisions 720 708 541 493 599 764 Net Current Assets 25,002 31,107 33,970 35,456 34,924 35,893 Total Assets 47,164 57,775 61,772 63,565 63,243 64,352
E: MOSL Estimates
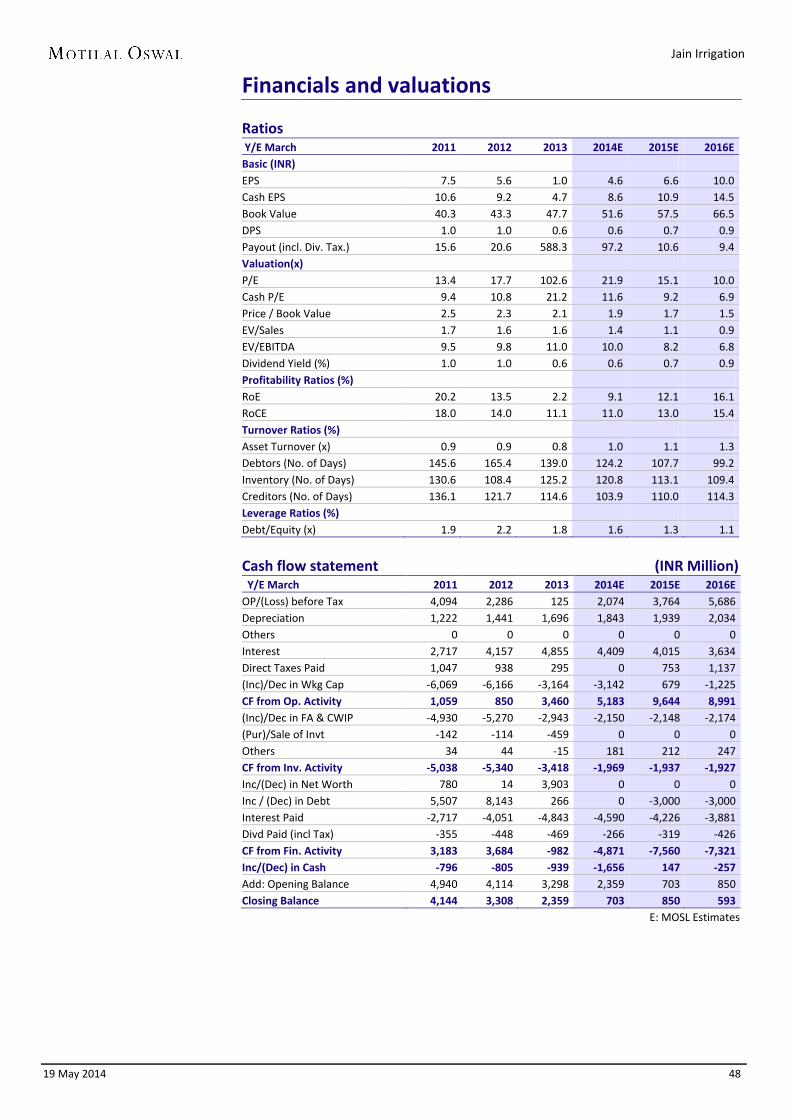
Jain Irrigation
19 May 2014 48
Financials and valuations Ratios Y/E March 2011 2012 2013 2014E 2015E 2016E Basic (INR) EPS 7.5 5.6 1.0 4.6 6.6 10.0 Cash EPS 10.6 9.2 4.7 8.6 10.9 14.5 Book Value 40.3 43.3 47.7 51.6 57.5 66.5 DPS 1.0 1.0 0.6 0.6 0.7 0.9 Payout (incl. Div. Tax.) 15.6 20.6 588.3 97.2 10.6 9.4 Valuation(x) P/E 13.4 17.7 102.6 21.9 15.1 10.0 Cash P/E 9.4 10.8 21.2 11.6 9.2 6.9 Price / Book Value 2.5 2.3 2.1 1.9 1.7 1.5 EV/Sales 1.7 1.6 1.6 1.4 1.1 0.9 EV/EBITDA 9.5 9.8 11.0 10.0 8.2 6.8 Dividend Yield (%) 1.0 1.0 0.6 0.6 0.7 0.9 Profitability Ratios (%) RoE 20.2 13.5 2.2 9.1 12.1 16.1 RoCE 18.0 14.0 11.1 11.0 13.0 15.4 Turnover Ratios (%) Asset Turnover (x) 0.9 0.9 0.8 1.0 1.1 1.3 Debtors (No. of Days) 145.6 165.4 139.0 124.2 107.7 99.2 Inventory (No. of Days) 130.6 108.4 125.2 120.8 113.1 109.4 Creditors (No. of Days) 136.1 121.7 114.6 103.9 110.0 114.3 Leverage Ratios (%) Debt/Equity (x) 1.9 2.2 1.8 1.6 1.3 1.1
Cash flow statement (INR Million) Y/E March 2011 2012 2013 2014E 2015E 2016E OP/(Loss) before Tax 4,094 2,286 125 2,074 3,764 5,686 Depreciation 1,222 1,441 1,696 1,843 1,939 2,034 Others 0 0 0 0 0 0 Interest 2,717 4,157 4,855 4,409 4,015 3,634 Direct Taxes Paid 1,047 938 295 0 753 1,137 (Inc)/Dec in Wkg Cap -6,069 -6,166 -3,164 -3,142 679 -1,225 CF from Op. Activity 1,059 850 3,460 5,183 9,644 8,991 (Inc)/Dec in FA & CWIP -4,930 -5,270 -2,943 -2,150 -2,148 -2,174 (Pur)/Sale of Invt -142 -114 -459 0 0 0 Others 34 44 -15 181 212 247 CF from Inv. Activity -5,038 -5,340 -3,418 -1,969 -1,937 -1,927 Inc/(Dec) in Net Worth 780 14 3,903 0 0 0 Inc / (Dec) in Debt 5,507 8,143 266 0 -3,000 -3,000 Interest Paid -2,717 -4,051 -4,843 -4,590 -4,226 -3,881 Divd Paid (incl Tax) -355 -448 -469 -266 -319 -426 CF from Fin. Activity 3,183 3,684 -982 -4,871 -7,560 -7,321 Inc/(Dec) in Cash -796 -805 -939 -1,656 147 -257 Add: Opening Balance 4,940 4,114 3,298 2,359 703 850 Closing Balance 4,144 3,308 2,359 703 850 593
E: MOSL Estimates

Jain Irrigation
19 May 2014 49
N O T E S

Jain Irrigation
19 May 2014 50
Disclosures This report is for personal information of the authorized recipient and does not construe to be any investment, legal or taxation advice to you. This research report does not constitute an offer, invitation or inducement to invest in securities or other investments and Motilal Oswal Securities Limited (hereinafter referred as MOSt) is not soliciting any action based upon it. This report is not for public distribution and has been furnished to you solely for your information and should not be reproduced or redistributed to any other person in any form. Unauthorized disclosure, use, dissemination or copying (either whole or partial) of this information, is prohibited. The person accessing this information specifically agrees to exempt MOSt or any of its affiliates or employees from, any and all responsibility/liability arising from such misuse and agrees not to hold MOSt or any of its affiliates or employees responsible for any such misuse and further agrees to hold MOSt or any of its affiliates or employees free and harmless from all losses, costs, damages, expenses that may be suffered by the person accessing this information due to any errors and delays. The information contained herein is based on publicly available data or other sources believed to be reliable. While we would endeavour to update the information herein on reasonable basis, MOSt and/or its affiliates are under no obligation to update the information. Also there may be regulatory, compliance, or other reasons that may prevent MOSt and/or its affiliates from doing so. MOSt or any of its affiliates or employees shall not be in any way responsible and liable for any loss or damage that may arise to any person from any inadvertent error in the information contained in this report. MOSt or any of its affiliates or employees do not provide, at any time, any express or implied warranty of any kind, regarding any matter pertaining to this report, including without limitation the implied warranties of merchantability, fitness for a particular purpose, and non-infringement. The recipients of this report should rely on their own investigations. This report is intended for distribution to institutional investors. Recipients who are not institutional investors should seek advice of their independent financial advisor prior to taking any investment decision based on this report or for any necessary explanation of its contents. MOSt and/or its affiliates and/or employees may have interests/positions, financial or otherwise in the securities mentioned in this report. To enhance transparency, MOSt has incorporated a Disclosure of Interest Statement in this document. This should, however, not be treated as endorsement of the views expressed in the report.
Disclosure of Interest Statement JAIN IRRIGATION SYSTEMS LTD 1. Analyst ownership of the stock No 2. Group/Directors ownership of the stock No 3. Broking relationship with company covered No 4. Investment Banking relationship with company covered No
Analyst Certification The views expressed in this research report accurately reflect the personal views of the analyst(s) about the subject securities or issues, and no part of the compensation of the research analyst(s) was, is, or will be directly or indirectly related to the specific recommendations and views expressed by research analyst(s) in this report. The research analysts, strategists, or research associates principally responsible for preparation of MOSt research receive compensation based upon various factors, including quality of research, investor client feedback, stock picking, competitive factors and firm revenues. Regional Disclosures (outside India) This report is not directed or intended for distribution to or use by any person or entity resident in a state, country or any jurisdiction, where such distribution, publication, availability or use would be contrary to law, regulation or which would subject MOSt & its group companies to registration or licensing requirements within such jurisdictions. For U.K. This report is intended for distribution only to persons having professional experience in matters relating to investments as described in Article 19 of the Financial Services and Markets Act 2000 (Financial Promotion) Order 2005 (referred to as "investment professionals"). This document must not be acted on or relied on by persons who are not investment professionals. Any investment or investment activity to which this document relates is only available to investment professionals and will be engaged in only with such persons. For U.S. Motilal Oswal Securities Limited (MOSL) is not a registered broker - dealer under the U.S. Securities Exchange Act of 1934, as amended (the"1934 act") and under applicable state laws in the United States. In addition MOSL is not a registered investment adviser under the U.S. Investment Advisers Act of 1940, as amended (the "Advisers Act" and together with the 1934 Act, the "Acts), and under applicable state laws in the United States. Accordingly, in the absence of specific exemption under the Acts, any brokerage and investment services provided by MOSL, including the products and services described herein are not available to or intended for U.S. persons. This report is intended for distribution only to "Major Institutional Investors" as defined by Rule 15a-6(b)(4) of the Exchange Act and interpretations thereof by SEC (henceforth referred to as "major institutional investors"). This document must not be acted on or relied on by persons who are not major institutional investors. Any investment or investment activity to which this document relates is only available to major institutional investors and will be engaged in only with major institutional investors. In reliance on the exemption from registration provided by Rule 15a-6 of the U.S. Securities Exchange Act of 1934, as amended (the "Exchange Act") and interpretations thereof by the U.S. Securities and Exchange Commission ("SEC") in order to conduct business with Institutional Investors based in the U.S., MOSL has entered into a chaperoning agreement with a U.S. registered broker-dealer, Motilal Oswal Securities International Private Limited. ("MOSIPL"). Any business interaction pursuant to this report will have to be executed within the provisions of this chaperoning agreement. The Research Analysts contributing to the report may not be registered /qualified as research analyst with FINRA. Such research analyst may not be associated persons of the U.S. registered broker-dealer, MOSIPL, and therefore, may not be subject to NASD rule 2711 and NYSE Rule 472 restrictions on communication with a subject company, public appearances and trading securities held by a research analyst account. For Singapore Motilal Oswal Capital Markets Singapore Pte Limited is acting as an exempt financial advisor under section 23(1)(f) of the Financial Advisers Act(FAA) read with regulation 17(1)(d) of the Financial Advisors Regulations and is a subsidiary of Motilal Oswal Securities Limited in India. This research is distributed in Singapore by Motilal Oswal Capital Markets Singapore Pte Limited and it is only directed in Singapore to accredited investors, as defined in the Financial Advisers Regulations and the Securities and Futures Act (Chapter 289), as amended from time to time. In respect of any matter arising from or in connection with the research you could contact the following representatives of Motilal Oswal Capital Markets Singapore Pte Limited: Anosh Koppikar Kadambari Balachandran Email:[email protected] Email : [email protected] Contact(+65)68189232 Contact: (+65) 68189233 / 65249115 Office Address:21 (Suite 31),16 Collyer Quay,Singapore 04931
Motilal Oswal Securities Ltd
Motilal Oswal Tower, Level 9, Sayani Road, Prabhadevi, Mumbai 400 025 Phone: +91 22 3982 5500 E-mail: [email protected]


![MUDJHI. SHOW]?U'D. - Business Standardbsmedia.business-standard.com/_media/bs/data/... · Deloitte Haskins &Sells LLP 4. The previously issued financial information ofthe Company](https://img.dokumen.tips/doc/110x75/5e8a3690e3d76a643114b90a/mudjhi-showud-business-deloitte-haskins-sells-llp-4-the-previously.jpg)