Embed Size (px)
Citation preview

J. Barrie Shineton President & CEO
January 28, 2011
To our Shareholders, I am pleased to report our first positive earnings since 2006. Norbord generated earnings of $0.39 per share on EBITDA of $105 million in 2010, a meaningful improvement on the breakeven result of the prior year. This reflects much stronger performance from our European business, better OSB prices in North America and higher capacity utilization across all of the Company’s operations. After a slower start in the first quarter, 2010 turned out to be a much better year for Norbord. North American OSB prices improved, particularly in the second quarter when they peaked at almost $400. Panel demand was stronger allowing our North American mills to operate more of their capacity and our European mills to run flat out. Our European operations had an excellent year, generating more than double the cash flow of last year. And we continued to tightly manage working capital, finishing the year at our lowest-ever level. I believe the worst is behind us. Today, we have a strong balance sheet, we are cash flow positive and have successfully managed through the toughest downturn in our industry’s history. Our share price has recovered significantly over the last two years, but it still values Norbord’s assets well below their replacement cost. We have put in place a normal course issuer bid that allows us to buy back up to 5% of our outstanding common shares, a sound investment should our cash flow support it. Norbord’s House is in Order Our balance sheet is solid. Our efforts over the past three years to stabilize our finances are largely complete. We extended our bank lines, added a seventh lender and put in place a more flexible accounts receivable securitization program. Today, we have unutilized bank lines and cash on hand totalling $348 million, which is sufficient liquidity to support our operating initiatives and fund our capital allocation priorities. Our focus as a low-cost OSB producer is sharper. We have continued to streamline our North American operations by exiting non-core businesses. We sold our Deposit MDF mill late in 2009 and we wrote down our investment in the Cochrane hardwood plywood joint venture at year-end. Today, our North American operations consist solely of high-quality, well-located OSB facilities. Continuous improvement drives productivity and margin gains. In 2010, we implemented new resin technology across all of our North American OSB operations. We expect the full benefit of this margin improvement initiative to flow through to our 2011 results through faster line operating speeds, higher sales margins and a richer value-
1

added product mix. Initial feedback from customers suggests that these changes have been well received in the market. Diversified sales minimize exposure to cyclical new home construction. Today, almost two-thirds of Norbord’s North American OSB is directed to home improvement centres and industrial customers and away from the new home construction sector. This diversification strategy has served us well through the downturn, allowing Norbord to operate 70% of its OSB capacity in 2010, compared to the industry-wide operating rate of about 60%. The time is right to re-invest. We appropriately constrained capital investments to minimal levels for the last three years. Now, our improving cash flows and more positive near-term outlook support a modest ramp up in capital spending. A significant project to upgrade our European particleboard assets will be complete by mid-2011, enabling Norbord to reposition its product offering and compete on an equal footing with the newest generation of particleboard capacity. We are closer to our goal of world-class safety performance. Last year, Norbord achieved a best-ever safety incident rate of 0.96. This year, our days lost due to injury - an important injury severity measure - decreased by 80% to just 82 days across the entire company, another best-ever result. Our Guntown, Cordele and Nacogdoches mills achieved Safety Star certifications, a program based on OSHA’s Voluntary Protection Program (VPP). Four more of our facilities will meet this rigorous safety standard in 2011. And both our Cordele and Nacogdoches mills completed their second calendar year without a single recordable injury, an exceptional, industry-leading achievement. Proactive succession planning further strengthens our management team. In September, we promoted Peter Wijnbergen to the newly-created position of Chief Operating Officer with responsibility for our North American operations. As well, Nigel Banks joined our team in November as a successor to Bob Kinnear who will retire from his role as Senior Vice President, Corporate Services this year. Both these appointments ensure organizational continuity as we execute on our strategic priorities. Outlook for 2011 The housing market in North America is improving, but slowly. Experts are not yet predicting a sharp rebound in housing starts and more recently have adjusted their forecasts down, closer to 2010 levels. We expect that overall OSB demand in 2011 will look very similar to last year. Good working capital practices are keeping inventories low across the supply chain. Small changes in either supply or demand are likely to result in ongoing price volatility. It’s my view that the general economic news will improve and unemployment levels will fall throughout this year, leading to better new home construction activity and improving OSB demand and prices in the second half.
2
In Europe, the bull market for OSB peaked late in 2010. However, prices are holding and we expect this positive panel market dynamic to continue well into this year. A favourable exchange rate continues to support our UK-based manufacturing by limiting competing imports and providing a unique opportunity to export our panels to the Continent. We expect to run our European mills at capacity in 2011. There are some industry developments that we are watching closely. In North America, the broader economic recovery could drive higher raw material prices that may be difficult to pass on should the housing recovery lag. In Europe, government biomass energy incentive programs could put further pressure on wood fibre prices. We will continue to ‘push the envelope’ on controllable costs to mitigate this potential input cost risk. Norbord is Well-Positioned The recovery phase of this housing cycle is approaching and Norbord will enter it a stronger company. We have high-quality, low-cost facilities that are running at relatively higher operating rates. We have strong customer partnerships. We have continued to grow our sales with key customers throughout the cyclical downturn. Our European operations are providing meaningful and stable earnings. The long-term fundamentals supporting housing demand are favourable. Norbord is well-positioned to generate superior returns once the recovery takes hold. On behalf of everyone at Norbord, I thank you for your continued support. I look forward to reporting on our progress throughout the year.
This letter includes forward-looking statements, as defined by applicable securities legislation including statements related to our strategy, projects, plans, future financial or operating performance and other statements that express management’s expectations or estimates of future performance. Often, but not always, forward-looking statements can be identified by the use of words such as “believe,” “should,” “expect,” “suggest,” “likely,” “would,” or variations of such words and phrases or statements that certain actions “may,” “could,” “must,” “would,” “might,” or “will” be undertaken, occur or be achieved. Forward-looking statements involve known and unknown risks, uncertainties and other factors that may cause the actual results, performance or achievements of Norbord to be materially different from any future results, performance or achievement expressed or implied by the forward-looking statements. See the cautionary language in the Forward-Looking Statements section of the 2010 Management’s Discussion and Analysis dated January 28, 2011.
3
4
News Release NORBORD REPORTS STRONGER 2010 RESULTS; GENERATES POSITIVE EARNINGS ON IMPROVED EBITDA
Note: Financial references in US dollars unless otherwise indicated HIGHLIGHTS
• Achieved positive EBITDA of $105 million vs. break-even in 2009 • European EBITDA more than doubled from $17 million in 2009 to $36 million • Ramped up North American OSB production in improved pricing environment • North Central benchmark OSB price increased 34% vs. the prior year to levels not seen since
2006 • Indicative European OSB price increased 25% from 2009 • Employee days lost due to injury down 80%, a best-ever result TORONTO, ON (January 28, 2011) – Norbord Inc. (TSX: NBD, NBD.WT) today reported positive EBITDA of $105 million versus break-even EBITDA in 2009. The year-over-year improvement is due largely to higher North American OSB and European panel prices and higher shipment volumes. North American OSB generated a year-over-year EBITDA improvement of $90 million driven by strong second quarter results, while Norbord’s European panel operations generated a $19 million year-over-year EBITDA improvement. In the fourth quarter, Norbord recorded positive EBITDA of $13 million versus $12 million in the previous quarter and $6 million in the fourth quarter of 2009. Norbord recorded earnings of $17 million or $0.39 per share (basic) for the full year versus a loss of $58 million or $1.35 per share in 2009. The Company recorded a loss of $2 million or $0.05 per share in the fourth quarter, excluding the impact of a $6 million after-tax or $0.14 per share non-cash write-down of its investment in a non-core business. In the fourth quarter of 2009, the Company incurred a loss of $11 million or $0.25 per share. “Our 2010 results exceeded our expectations,” said Barrie Shineton, President and CEO. “In North America, our customer and product strategy enabled us to run more capacity and to benefit from a stronger pricing environment throughout the year. In Europe, our EBITDA more than doubled on the back of particularly robust OSB markets. While I’m pleased that Norbord generated positive annual earnings for our shareholders this year, we recognize that we still have a long way to go before our financial performance is back to acceptable levels.” “We expect the overall business environment in 2011 to generally mirror Norbord’s experience in the past year. We are seeing the beginnings of a slow recovery for the US housing market, which should start taking hold in the second half of the year. Norbord will be well-positioned to generate stronger results once that occurs.” Market Conditions US housing starts were 0.59 million in 2010, up modestly from 0.55 million in 2009, but significantly below the long-term annual average of 1.5 million. For the full year, the North Central benchmark OSB price averaged $219 per Msf (7⁄16-inch basis) compared to $163 per Msf in 2009. In the South East region, where approximately 55% of Norbord’s

5
North American OSB capacity is located, prices were somewhat lower than in the North Central region, averaging $198 per Msf, compared to $148 per Msf last year. In the fourth quarter, North Central benchmark OSB prices averaged $191, up $11 from the third quarter and up $19 from the fourth quarter of 2009. South East prices averaged $165 in the quarter, up $9 from the third quarter and up $11 from the fourth quarter of 2009. In 2010, the US housing market remained challenging while OSB demand and prices continued to be volatile. The first half of the year saw surging North Central benchmark OSB prices that peaked at $395 per Msf in May before retreating to more sustainable levels in the second half of the year. The first-half price run-up was largely influenced by several unique factors that resulted in overall demand outstripping the ability of both producers and distributors to respond in a timely manner. Second-half housing activity was softer as the May expiry of the US first-time home buyer tax credit pulled home buying demand forward into the first half of the year. In the UK, where the majority of Norbord’s European assets are located, housing starts increased by 30% over 2009 as house builders replenished their inventories of new homes. The European OSB market was particularly robust in 2010, building on the recovery that began at the end of 2009. The 25% year-over-year increase in average indicative OSB prices was driven by firmer end-use demand, inventory re-stocking and substitution for plywood. Particleboard and MDF prices also strengthened during the year, increasing a more modest 5% and 6%, respectively, reflecting the recovery of higher input costs. MDF exports to Continental Europe increased by 46%. Although the Euro weakened somewhat during the year versus the Pound Sterling, the currency remained in a range that continued to benefit Norbord’s UK-based operations. Performance Norbord’s operating North American OSB mills ran at approximately 90% of their capacity in 2010 compared to 80% in 2009. Including the indefinitely closed mills, North American operations ran at 70% of capacity in 2010, compared to 60% in 2009. In Europe, mills operated at approximately 95% of capacity in 2010, up 15% from the previous year. For the full year, Norbord’s North American per unit OSB cash production costs increased 8% over the prior year. The benefit of higher production volume was offset by higher resin and fibre prices, higher supplies and maintenance costs as a result of running more production in 2010, employee profit share payouts, and the foreign exchange impact of the strengthening Canadian dollar. In the fourth quarter, North American per unit OSB cash production costs decreased by 1% over the third quarter of 2010 due to higher production volume and lower key input prices and usages. OSB cash production costs increased by 3% over the fourth quarter of 2009 as improved key input usages and higher production volume were offset by higher resin and fibre prices, supplies and maintenance costs. Resin, fibre and energy, which account for approximately 65% of Norbord’s cash production costs, increased sharply over the five-year period preceding 2009. Margin Improvement Program gains of $16 million in 2010 limited the impact that higher raw material prices had on earnings. At year-end, Norbord had unutilized liquidity of $348 million, comprising $235 million in undrawn revolving bank lines and $113 million in cash and cash equivalents. The Company’s tangible net worth was $352 million and net debt to total capitalization on a book basis was 49%.

6
Capital investments were constrained to essential capital projects totaling $16 million in 2010. Norbord’s 2011 capital investments are planned at $25 million, which includes an infrastructure investment at the Cowie, Scotland particleboard mill that is expected to increase production capacity and reduce manufacturing costs. Developments In January 2011, True North Hardwood Plywood Inc. announced the winding-down of its hardwood plywood operation in Cochrane, Ontario. In the fourth quarter, Norbord recorded a $6 million after-tax ($0.14 per share) non-cash provision for its 50% investment in this business. Additional Information Norbord’s year-end 2010 letter to shareholders, news release, management’s discussion & analysis, annual consolidated audited financial statements and notes to the financial statements have been filed on SEDAR (www.sedar.com) and are available in the investor section of the Company’s website at www.norbord.com. Shareholders are encouraged to read this material. Conference Call Norbord will hold a conference call for analysts and institutional investors on Friday, January 28, 2011 at 11:00 a.m. ET. The call will be broadcast live over the Internet via www.norbord.com and www.newswire.ca. A replay number will be available approximately one hour after completion of the call and will be accessible until February 28, 2011 by dialing 1-888-203-1112 or 647-436-0148. The passcode is 6532094. Audio playback and a written transcript will be available on the Norbord website. Norbord Profile Norbord Inc. is an international producer of wood-based panels with assets of $1.0 billion, employing approximately 2,030 people at 13 plant locations in the United States, Europe and Canada. Norbord is one of the world’s largest producers of oriented strand board (OSB). In addition to OSB, Norbord manufactures particleboard, medium density fibreboard (MDF) and related value-added products. Norbord is a publicly traded company listed on the Toronto Stock Exchange under the symbols NBD and NBD.WT.
-end- Contact: Robin Lampard Senior Vice President & Chief Financial Officer Tel. (416) 365-0705 [email protected]
This news release contains forward-looking statements, as defined in applicable legislation, including statements related to our strategy, projects, plans, future financial or operating performance and other statements that express management’s expectations or estimates of future performance. Often, but not always, words such as “expect,” “should,” “will,” “will not,” “forecasts,” “suggest,” “expects,” “may,” and other expressions which are predictions of or indicate future events, trends or prospects and which do not relate to historical matters identify forward-looking statements. Forward-looking statements involve known and unknown risks, uncertainties and other factors which may cause the actual results, performance or achievements of Norbord to be materially different from any future results, performance or achievements expressed or implied by the forward-looking statements. Although Norbord believes it has a reasonable basis for making these forward-looking statements, readers are cautioned not to place undue reliance on such forward-looking information. By its nature, forward-looking information involves numerous assumptions, inherent risks and uncertainties, both general and specific, which contribute to the possibility that the predictions, forecasts and other forward-looking statements will not occur. Factors that could cause actual results to differ materially from those contemplated or implied by forward-looking statements include: general economic conditions; risks inherent with product concentration; effects of competition and product pricing pressures; risks inherent with customer dependence; effects of variations in the price and availability of manufacturing inputs; risks inherent with a capital intensive industry; and other risks and factors described from time to time in filings with Canadian securities regulatory authorities.

7
Except as required by applicable laws, Norbord does not undertake to update any forward-looking statements, whether as a result of new information, future events or otherwise, or to publicly update or revise the above list of factors affecting this information. See the “Caution Regarding Forward-Looking Information” statement in the March 1, 2010 Annual Information Form and the cautionary statement contained in the “Forward-Looking Statements” section of the 2010 Management’s Discussion and Analysis dated January 28, 2011.
Some of the statements included in this MD&A constitute forward-looking statements that are based on various assumptions and are subject to various risks. See the cautionary statement contained in the Forward-Looking Statements section.
8
JANUARY 28, 2011
Management’s Discussion and Analysis
INTRODUCTION This Management’s Discussion and Analysis (MD&A) provides a review of the significant developments that impacted Norbord’s performance during 2010 relative to 2009. The information in this section should be read in conjunction with the audited financial statements, which follow this MD&A.
In this MD&A, “Norbord” means Norbord Inc. and all of its consolidated subsidiaries and affiliates, and “Company” means Norbord Inc. as a separate corporation, unless the context implies otherwise. “Brookfield” means Brookfield Asset Management Inc. or any of its consolidated subsidiaries and affiliates, a related party, by virtue of a controlling equity interest in the Company.
Additional information on Norbord, including documents publicly filed by the Company, is available on the Company’s web site at www.norbord.com or the System for Electronic Document Analysis and Retrieval (SEDAR) at www.sedar.com.
Some of the statements included or incorporated by reference in this MD&A constitute forward-looking statements within the meaning of applicable securities legislation. Forward-looking statements are based on various assumptions and are subject to various risks. See the cautionary statement contained in the Forward-Looking Statements section.
To enhance shareholders’ understanding, certain five-year historical financial and statistical information is presented. Norbord’s significant accounting policies and other financial disclosures are contained in the audited financial statements and accompanying notes, which follow this MD&A. All financial references in the MD&A are stated in US dollars unless otherwise noted.
Earnings before interest, taxes, depreciation and amortization (EBITDA), EBITDA margin, operating working capital, total working capital, capital employed, return on capital employed (ROCE), return on common equity (ROE), net debt, net debt to capitalization on a book basis, and net debt to capitalization on a market basis are non-GAAP financial measures described in the Non-GAAP Financial Measures section. Non-GAAP financial measures do not have any standardized meaning prescribed by Canadian generally accepted accounting principles (GAAP) and are therefore unlikely to be comparable to similar measures presented by other companies. Where appropriate, a quantitative reconciliation of the non-GAAP financial measure to the most directly comparable GAAP measure is also provided.
Some of the statements included in this MD&A constitute forward-looking statements that are based on various assumptions and are subject to various risks. See the cautionary statement contained in the Forward-Looking Statements section.
9
BUSINESS OVERVIEW Norbord is an international producer of wood-based panels with 13 plant locations in North America and Europe.
Norbord is one of the world’s largest producers of oriented strand board (OSB) with an annual capacity of 5 billion square feet (Bsf) (3⁄8-inch basis). The majority of Norbord’s OSB business is located in the South East region of the US. The Company is also a significant producer of wood-based panels in the UK. Norbord does not own any timberlands. Wood fibre is purchased from third parties that include private landowners and government-owned and -managed timberlands. Norbord employed approximately 2,030 people at December 31, 2010.
Operations include 11 OSB mills, 2 particleboard mills, 1 medium density fibreboard (MDF) mill and 1 furniture plant. The Company reports all operations as a single operating segment – wood-based panels.
STRATEGY Norbord’s business strategy is focused entirely on the wood panels sector – in particular OSB – in North America and Europe. Pricing and demand for Norbord’s principal product – OSB – continued to be significantly affected by challenging housing markets. This environment, while not altering the long-term strategy of the business, required management to focus on certain short-term objectives starting in 2008.
In this regard, Norbord accomplished the following in 2010:
Short-Term Strategic Priority
2010 Performance
1. Generate cash. • Achieved EBITDA of $105 million versus break-even EBITDA in 2009.
• Returned North American operations to positive EBITDA of $82 million versus a loss of $8 million in 2009.
• Generated positive EBITDA of $36 million at European operations versus $17 million in 2009.
• Ramped up the Company’s North American and European production capacity by 10% and 15%, respectively, benefitting from higher prices during the year.
• Ongoing minimal investment in operating working capital, achieving lowest-ever year-end levels.
2. Strengthen the balance sheet.
• Added a seventh lender to revolving bank group, increasing committed bank lines to $245 million, and extended term to May 2013.
• Improved bank covenant headroom through generation of $130 million in operating cash flow.
• Replaced existing accounts receivable securitization program with new $85 million evergreen program, containing no financial covenants and subject to a minimum credit-rating requirement of single B(mid).

Some of the statements included in this MD&A constitute forward-looking statements that are based on various assumptions and are subject to various risks. See the cautionary statement contained in the Forward-Looking Statements section.
10
The actions taken by Norbord over the past three years to recapitalize, increase liquidity, reduce losses and conserve cash have stabilized the Company’s balance sheet, which is an important element of Norbord’s ongoing financial strategy.
At the end of the year, the Company had unutilized liquidity of $348 million, net debt to capitalization on a book basis of 49%, and tangible net worth of $352 million. Management believes that its record of superior operational performance and prudent balance sheet management should enable it to access public and private capital markets, subject to financial market conditions. Norbord’s long-term strategic priorities remain unchanged from prior years, and the following table provides updates on the Company’s 2010 achievements in each area:
Long-Term Strategic Priority
2010 Performance
1. Develop a world class safety culture.
• Maintained an industry-leading safety performance with an Occupational Safety and Health Administration (OSHA) recordable rate of 1.43 and a lowest-ever lost-time injury rate of 82 days.
• Completed second OSHA recordable injury-free year at the Cordele, Georgia, and Nacogdoches, Texas, mills.
• Achieved Norbord Safety Star certification at the Cordele, Nacogdoches and Guntown mills.
2. Pursue growth in OSB. • Monitored opportunities to grow OSB business through acquisition.
• Improved operating efficiency at the Genk, Belgium, mill, lowering manufacturing costs and increasing production volume by almost 40%.
3. Own high-quality assets with low-cost positions.
• Implemented new resin technology across North American OSB mills.
• Exited joint venture investment in non-core hardwood plywood business in Cochrane, Ontario.
4. Maintain a margin-focused operating culture.
• Generated margin improvements of $16 million in spite of limited production volume increases.
• Appointed Chief Operating Officer with the mandate to advance the implementation of cost-reduction technologies.
5. Focus on growth customers.
• Increased sales volume to key North American pro-dealer customers by 30%.
• Increased North American value-added product sales volume by 40%.
• Increased UK MDF exports by over 45%.
• Limited exposure to new home construction segment through end-use diversity.
6. Allocate capital with discipline.
• Limited capital investments to essential projects totalling $16 million.
• Put normal course issuer bid in place, enabling Norbord to purchase up to 5% of its outstanding Common Shares.

Some of the statements included in this MD&A constitute forward-looking statements that are based on various assumptions and are subject to various risks. See the cautionary statement contained in the Forward-Looking Statements section.
11
SUMMARY
(US $ millions, except per share information, unless otherwise noted) 2010 2009 2008 2007 2006
KEY PERFORMANCE METRICS
Return on capital employed (ROCE) 13% 0% (6)% 4% 25% Return on equity (ROE) 5% (19)% (37)% (11)% 20% Cash provided by (used for) operating activities 130 (35) (13) 15 191 Cash provided by (used for) operating activities per share 3.00 (0.82) (0.86) 1.03 13.36
NET SALES AND EARNINGS Net sales 892 718 943 1,104 1,252 EBITDA 105 0 (60) 42 247 Earnings 17 (58) (115) (45) 97
PER COMMON SHARE EARNINGS
Basic 0.39 (1.35) (7.62) (3.10) 6.76 Diluted 0.38 (1.35) (7.62) (3.10) 6.74 Common dividends 0 0 3.68 3.80 12.47
Total assets 1,062 1,043 1,044 1,404 1,299 Long-term debt 443 471 542 480 480 Net debt 337 454 477 547 460 Net debt to capitalization, market basis 35% 48% 32% 30% 27%Net debt to capitalization, book basis 49% 58% 61% 60% 51%
Shipments (MMsf–3⁄8") North America 2,989 2,780 3,624 3,947 3,932 Europe(1) 1,298 1,158 1,348 1,712 1,603 Indicative OSB pricing Average OSB price
North Central ($/Msf–7⁄16") 219 163 172 161 217 South East ($/Msf–7⁄16") 198 148 143 143 219
Europe (€/m3) 210 168 203 240 208 (1) Excludes product consumed internally (108 MMsf, 127 MMsf, 114 MMsf, 138 MMsf, 178 MMsf for each period, respectively).
Markets remained challenging as high unemployment and limited mortgage availability continued to delay a meaningful recovery in both US and UK housing demand in 2010. Notwithstanding this environment of continued low demand, prices for the Company’s products were firmer in both North America and Europe, and Norbord generated significantly improved financial results this year.
Fluctuation in North American structural panel demand and OSB prices are significant variables affecting Norbord’s results. North American OSB prices were very volatile during the year, ranging from $160 to $395 per thousand square feet (Msf) (North Central 7⁄16-inch basis), averaging $219 per Msf compared to $163 per Msf in the prior year. Norbord benefited from these higher prices by running more of its capacity during the year, operating at 70% of capacity compared to 60% in 2009.
Norbord achieved EBITDA of $105 million in 2010 versus break-even EBITDA in 2009. EBITDA margins for 2010 were 12%, compared to 0% for the prior year. 2010 earnings were $17 million or $0.39 per share (basic) versus a loss of $58 million or $1.35 per share in 2009. Pre-tax ROCE averaged 13% compared to 0% in the prior year. ROCE is a measurement of financial performance, focusing on cash generation and the efficient use of

Some of the statements included in this MD&A constitute forward-looking statements that are based on various assumptions and are subject to various risks. See the cautionary statement contained in the Forward-Looking Statements section.
12
capital. As Norbord operates in a cyclical commodity business, it interprets ROCE over the cycle as a useful means of comparing businesses in terms of efficiency of management and viability of products. Through this five-year cyclical trough, Norbord has generated an average annual ROCE of 7%.
Higher product prices and sales volume in both North America and Europe were the key drivers of the EBITDA improvement in 2010. Norbord’s North American OSB operations achieved six consecutive quarters of positive EBITDA, with the second quarter posting the strongest result since 2006. Norbord’s European operations generated more than double the prior year’s EBITDA, which resulted from particularly robust OSB prices this year.
Over the past five years, $288 million in cash has been generated from operating activities and $200 million in cash has been generated from recapitalization activities. This cash has been used to reshape the Company from its historic role as a diversified Canadian forest products company into an internationally recognized leader in the structural panel industry. During this time, Norbord invested $253 million in capital expenditures primarily focused on growing the business, and paid out approximately $232 million in cash dividends, including special dividends, to shareholders.
Markets are expected to remain volatile in 2011 as global economies reposition for recovery. The past three years have seen the worst housing downturn in several generations, and the Company focused on preserving cash and stabilizing its balance sheet. This year, Norbord generated significant positive operating cash flow and strengthened its balance sheet. The Company is well positioned to benefit from recovering housing markets. Over the long term, the underlying demographics will continue to support robust demand for new homes. Further, management believes that Norbord’s North American and European operations provide meaningful market and geographic diversification over the cycle, while capitalizing on Norbord’s strength as a panel producer.
OUTLOOK FOR 2011 Norbord operates in extremely volatile markets and expects the overall business environment in 2011 to generally mirror that of 2010. Housing markets are expected to begin showing meaningful signs of improvement in the second half of 2011 as the structural impediments to recovery are worked through.
High unemployment and competition from foreclosures remain the biggest structural hurdles to a recovery in the US housing market. While the market works through these issues, significant OSB industry supply remains curtailed through indefinite mill closures. Norbord’s two indefinitely closed mills, in Texas and Alabama, will not operate until signs of a sustainable recovery in housing starts are visible. Industry experts are forecasting 2011 US housing starts of around 0.68 million. On the positive side, new home inventories remain very low, and affordability is at generational highs. Norbord is of the view that, once the economy finds its footing and the foreclosure overhang subsides, new household formation trends will ultimately support a return to the long-term annual average of 1.5 million housing starts.
In the UK, the government is implementing the most significant public sector spending cuts since the World War II. While the impact on European panel markets is not yet clear, Norbord believes its European business outlook remains relatively buoyant. Pent-up demand for new homes continues to grow, and Norbord expects the Pound Sterling, relative to the Euro, to remain in a range that is supportive of its UK-based manufacturing. This currency advantage limits UK imports and provides further export opportunities on the Continent.
On the input cost side, global commodity prices that troughed in 2009 recovered in 2010. Unlike previous economic cycles, the overall economy appears likely to lead a housing sector recovery in this cycle. Improving demand for global commodities could put upward pressure on resin and wax prices that panel producers may not be able to pass on to customers. In addition, western European government incentives for biomass energy expansion are putting upward pressure on European fibre prices. Norbord continues to pursue Margin Improvement Program (MIP) initiatives to mitigate potentially higher uncontrollable costs.

Some of the statements included in this MD&A constitute forward-looking statements that are based on various assumptions and are subject to various risks. See the cautionary statement contained in the Forward-Looking Statements section.
13
After constraining capital expenditures at minimal levels for the past three years, Norbord expects to modestly increase capital investments to $25 million in 2011. Projects that improve Norbord’s product offerings and cost position will be prioritized. Norbord has strong financial liquidity, and no debt maturities in 2011. Combined with the Company’s solid customer partnerships and favourable European market dynamics, Norbord is well positioned for the recovery in housing markets and will benefit from stronger OSB demand in the years ahead.
RESULTS OF OPERATIONS
(US $ millions) 2010 2009 2008 2007 2006
Net sales $892 $718 $943 $1,104 $1,252 EBITDA 105 0 (60) 42 247 EBITDA margin 12% 0% (6)% 4% 20% Depreciation 45 48 68 88 94 Investment in property, plant and equipment 16 14 27 36 160
Shipments (MMsf–3⁄8")(1) 4,287 3,938 4,972 5,659 5,535 Indicative OSB pricing Average OSB price
North Central ($/Msf–7⁄16") 219 163 172 161 217 South East ($/Msf–7⁄16") 198 148 143 143 219 Europe (€/m3) 210 168 203 240 208
(1) Excludes product consumed internally (108 MMsf, 127 MMsf, 114 MMsf, 138 MMsf, 178 MMsf for each period, respectively).
Markets North America is the principal market destination for Norbord’s products. North American OSB comprises 70% of Norbord’s panel shipments by volume. Therefore, results of operations are most affected by volatility in North American OSB prices. European panel prices are less volatile than North American prices, and Europe comprises just 30% of Norbord’s shipments by volume, affecting Norbord’s results to a lesser degree.
Shipments (MMsf–3⁄8") 2010 2009 2008 2007 2006
North America 2,989 2,780 3,624 3,947 3,932 Europe(1) 1,298 1,158 1,348 1,712 1,603 Total 4,287 3,938 4,972 5,659 5,535
(1) Excludes product consumed internally (108 MMsf, 127 MMsf, 114 MMsf, 138 MMsf, 178 MMsf for each period, respectively).
North America The US housing market remained challenging, with periods of price volatility during 2010. The first half of the year saw surging North Central benchmark OSB prices that peaked at $395 per Msf (7⁄16-inch basis) in May before retreating to more sustainable levels in the second half of the year. The first-half price run-up was largely influenced by several unique factors that resulted in overall demand outstripping the ability of both producers and distributors to increase supply. Second-half housing markets were softer as the expiry of the US first-time home buyer tax credit in May pulled home buying demand forward into the early part of the year.
The North Central benchmark OSB price averaged $219 per Msf (7⁄16-inch basis) in 2010 compared to $163 per Msf in 2009. In the South East region, where approximately 55% of Norbord’s North American OSB capacity is located, prices were somewhat lower than in the North Central region, averaging $198 per Msf, compared to $148 per Msf last year.
Some of the statements included in this MD&A constitute forward-looking statements that are based on various assumptions and are subject to various risks. See the cautionary statement contained in the Forward-Looking Statements section.
14
New home construction is still the primary end use for OSB in North America, accounting for approximately 50% of OSB demand in 2010. US housing starts were 0.59 million in 2010, up modestly from 0.55 million in 2009, but still significantly below the long-term annual average of 1.5 million. To put the decline into context, 100,000 housing starts represent approximately 1 Bsf (⅜-inch basis) of OSB demand. It is important to note that approximately 40% of Norbord’s OSB sales volume goes directly into the new home construction sector, while the other 60% goes into repair and remodelling, light commercial construction and industrial applications. Management believes that this limits the Company’s relative exposure to the new home construction segment and provides meaningful distribution channel benefits.
According to APA – The Engineered Wood Association, North American OSB demand was modestly higher in 2010, at approximately 15.3 Bsf (⅜-inch basis) versus 14.1 Bsf in 2009, representing almost 60% of total North American structural panel demand and 57% of industry OSB production capacity. Against this backdrop of modestly improved demand, Norbord’s North American OSB mills operated at approximately 70% of capacity in 2010, compared to 60% in 2009.
Europe European panel markets showed increasing strength throughout 2010 as housing construction activity picked up and repair and remodelling demand remained robust. In the UK, where the majority of Norbord’s European assets are located, housing starts increased by 30% over 2009 despite eroding consumer confidence throughout the year. In Germany, Norbord’s largest Continental market, housing starts were up a more modest 8% over 2009, while consumer confidence rose to its highest level in a decade. In this firmer-demand environment, Norbord’s European mills operated at 95% of capacity throughout the year, compared to 80% in 2009, with the two OSB mills running at full capacity.
The European OSB market was particularly robust in 2010, building on the recovery started at the end of 2009 and supporting a 25% year-over-year increase in indicative OSB prices (denominated in Euros). OSB market strength was driven by firmer end-use demand, inventory re-stocking and substitution for plywood. Particleboard and MDF prices also recovered during the year, increasing a more modest 5% and 6%, respectively, reflecting the recovery of higher input costs.
Although the Euro weakened somewhat during the year versus the Pound Sterling, the currency remained in a range that continued to benefit Norbord’s primarily UK-based operations. Particularly noteworthy was a 46% increase in MDF exports to the Continent.
Net Sales
(US $ millions) 2010 2009 2008 2007 2006
North America $541 $406 $538 $593 $823 Europe 351 312 405 511 429 Total $892 $718 $943 $1,104 $1,252
Consolidated net sales rose by $174 million or 24% in 2010 compared to 2009. North American sales increased by 33%, and European panel sales increased by 13%. In North America, the sales increase was driven by higher OSB prices in the first and second quarters of 2010 combined with a 12% increase in OSB shipment volume. Average North Central and South East OSB benchmark prices per Msf (7⁄16-inch basis) increased by $56 and $50, respectively, in 2010, which is an increase of 34% compared to 2009. In Europe, the sales increase was driven by higher panel prices and shipment volumes across all products. European panel shipment volumes increased by 13% for OSB, 7% for particleboard and 8% for MDF.

Some of the statements included in this MD&A constitute forward-looking statements that are based on various assumptions and are subject to various risks. See the cautionary statement contained in the Forward-Looking Statements section.
15
Production
(MMsf–3⁄8") 2010 2009 2008 2007 2006
North America 2,993 2,785 3,645 4,268 3,987 Europe 1,437 1,266 1,332 1,704 1,738 Total 4,430 4,051 4,977 5,972 5,725
Norbord continued to curtail production in 2010 to maximize earnings and manage inventory levels. Notwithstanding, total production volume increased by 9% or 379 MMsf (⅜-inch basis). North America North American production volume increased by 7% or 208 MMsf (⅜-inch basis) in 2010, driven by an 11% increase in OSB production volume compared to 2009. Norbord’s newest OSB line in Cordele, constructed in 2006, established a company-wide production record in the year, with volume exceeding design expectations.
In 2009, OSB production volume decreased by approximately 25% in North America compared to 2008. In January 2009, Norbord announced that indefinite shutdowns would take place at its OSB mills in Huguley, Alabama, and Jefferson, Texas. These two mills represent approximately 20% of Norbord’s annual OSB production capacity in North America. Subject to market conditions, Norbord does not expect to restart these two mills in the near term. In June 2009, Norbord reduced production schedules at the original line in Cordele and at Guntown. In total, approximately 270 employees were affected by these decisions. In March 2010, Norbord returned the Guntown mill to a full production schedule. From March to August 2010, Norbord returned the Cordele line to a full production schedule and then ran the mill at a reduced work week for the rest of the year. Weak market conditions and reduced demand were the primary drivers for these decisions, which were made out of a necessity to contain costs and manage operating working capital.
Norbord’s operating North American OSB mills ran at approximately 90% of their capacity in 2010, compared to 80% in 2009. Including the indefinitely closed mills, Norbord’s North American OSB mills operated at approximately 70% of capacity in 2010, compared to 60% in 2009.
In 2010, production at the hardwood plywood joint-venture operation in Cochrane ceased, and in 2009, the Company sold its MDF mill in Deposit, New York (see Investments and Divestitures). Together, these two non-core North American operations represented, on average, less than 5% of Norbord’s North American production volume in each respective year prior.
In 2007, North American OSB production included the ramp-up of the new OSB line in Cordele. Europe European panel production volume increased by 14% or 171 MMsf (⅜-inch basis) in 2010. Production volume increased by 24% for OSB, 13% for MDF and 1% for particleboard. Norbord’s OSB mill in Genk ran on a full production schedule in 2010, which, when combined with significantly improved production efficiency, increased production volume by approximately 40% year-over-year.
In 2009, European panel production volume decreased by 5% or 66 MMsf (⅜-inch basis) compared to 2008. Production volume decreased by 3% for OSB, 12% for MDF and 5% for particleboard. In March 2008, a particleboard line at Genk was closed permanently. The particleboard line was considered non-core as the Genk site was acquired to expand Norbord’s OSB presence in Europe.
In Europe, mills operated at approximately 95% of capacity in 2010, compared to 80% in 2009.

Some of the statements included in this MD&A constitute forward-looking statements that are based on various assumptions and are subject to various risks. See the cautionary statement contained in the Forward-Looking Statements section.
16
Operating Results
EBITDA (US $ millions) 2010 2009
North America $82 $(8)Europe 36 17Unallocated (13) (9)Total $105 $0
Norbord achieved EBITDA of $105 million in 2010, compared to break-even EBITDA in 2009. North American OSB generated EBITDA of $84 million, compared to negative $6 million in the prior year, marking a year-over-year improvement of $90 million. Other North American products generated EBITDA of negative $2 million in 2010 and 2009. Norbord’s European panel operations generated EBITDA of $36 million, which is a year-over-year improvement of $19 million. Unallocated costs were $13 million in 2010 compared to $9 million in 2009, an increase of $4 million primarily due to the foreign exchange impact of the strengthening Canadian dollar. North America Norbord’s North American OSB operations delivered positive EBITDA results in each quarter of 2010. The EBITDA improvement of $90 million in 2010 was driven by strong second quarter results. EBITDA generated in the second quarter of 2010 was $64 million compared to negative $6 million in the second quarter of 2009, which represents a year-over-year improvement of $70 million that can be attributed primarily to higher prices. North Central OSB benchmark prices peaked at $395 per Msf (7⁄16-inch basis) in the second quarter, a price level not experienced since 2005. The upward momentum commenced in the first quarter of 2010. Prices rose against the backdrop of cold and wet weather conditions in the Southern US, which affected log availability and impacted operating schedules. Demand was seasonally firmer in the second quarter, and the expiry of the US first-time home buyer tax credit in May generated a pull-forward effect on demand earlier in 2010. During the year, OSB price volatility was extreme as prices climbed quickly in the second quarter and then declined dramatically during the remainder of 2010. On the cost side, higher raw material prices impacted operating costs. Resin and fibre prices, which were at cycle-bottom levels in 2009, climbed in the first half of 2010 and then leveled off for the remainder of the year. Europe Norbord’s European operations experienced stronger results in each quarter of 2010 compared to 2009. EBITDA results more than doubled from $17 million in 2009 to $36 million in 2010. Higher European panel prices and higher shipment volumes contributed to the improved year-over-year results, despite the continuing input cost pressures, particularly related to fibre. In Europe, the average indicative OSB price (denominated in Euros) increased by 25%, and particleboard and MDF prices increased by 5% and 6%, respectively. European panel shipment volumes increased by 13% for OSB, 7% for particleboard and 8% for MDF. European OSB markets continued to show increasing strength throughout the year in response to some short-term recovery in new home construction, resilient repair and remodelling demand, substitution for scarce plywood and inventory re-stocking. In addition, OSB supply was constrained by curtailments early in the year as a result of weather-related wood shortages, particularly in Continental Europe. The weak Pound Sterling relative to the Euro continued to be advantageous for Norbord, as it improved sales opportunities within the UK and slowed the flow of Continental European imports. This currency trend also supported Norbord’s export program to the Continent.

Some of the statements included in this MD&A constitute forward-looking statements that are based on various assumptions and are subject to various risks. See the cautionary statement contained in the Forward-Looking Statements section.
17
The components of the EBITDA change are summarized in the variance table below.
EBITDA Variance (US $ millions) 2010 vs. 2009
EBITDA – current period $105EBITDA – comparative period 0
Variance $105
Mill nets(1) $151Volume(2) 19 Key input prices(3) (34) Key input usage(3) (2) Other(4) (35) Production curtailment, net(5) 6 Total $105
(1) The mill nets variance represents the change in realized pricing across all products. Mill nets are calculated as net sales divided by shipment volume.
(2) The volume variance represents the impact of shipment volume changes across all products. (3) The key inputs include fibre, resin and energy. (4) The other category covers all remaining variances including labour and benefits, supplies and maintenance, and the impact of foreign exchange. (5) The production curtailment, net, represents the net EBITDA variance impact related to the indefinite curtailment of North American OSB mills in
Jefferson and Huguley.
Higher North American OSB and European panel prices improved Norbord’s results by $151 million in 2010. In addition, higher shipment volumes in both North America and Europe added $19 million to EBITDA in 2010. Housing market activity, particularly in the US, influences OSB demand and pricing. Fluctuation in North American OSB demand and prices significantly affects Norbord’s results. US housing starts modestly improved by 7% year-over-year, from 0.55 million starts in 2009 to 0.59 million in 2010. Higher mill nets in 2010 reflected the benefits of diversified distribution channels, low inventories in the supply chain, slightly firmer demand as a result of the US stimulus tax incentive which ended in May, and extremely wet weather conditions in the Southern US at the beginning of the year. In the UK, government stimulus programs generated an improvement in construction activity that supported stronger panel pricing, particularly for OSB. Overall, Norbord’s European operations benefited from underlying robust demand dynamics resulting from the weak Pound Sterling and limited imports.
On the cost side, the benefit of lower global commodity prices was experienced for most of 2009, resulting in cycle-bottom prices. Resin and energy prices increased in the first half of 2010 and then leveled off for the remainder of the year. The direct impact on operating costs of rising energy prices continues to be limited since all of Norbord’s heat energy for OSB operations is generated from biomass. Norbord’s reduced reliance on fossil fuels has generated significant energy-cost savings in both North America and Europe. Further, the ability of Norbord’s European mills to comply with Kyoto Protocol energy-efficiency targets has resulted in a surplus of carbon credits, which have been monetized on environmental exchanges.
Fibre prices in both North America and Europe increased in 2010 compared to 2009. In the first quarter of 2010, extremely cold and wet weather conditions affected fibre availability and prices. North American fibre prices moderated slowly throughout the rest of the year. European fibre prices remained under pressure due to the impact of government biomass energy incentives. Norbord does not own any timberlands; therefore, it purchases timber, wood chips and fibre as well as other wood recycled materials on the open market, in competition with other users of such resources, where prices are influenced by factors beyond Norbord’s control.
Resin, fibre and energy, which account for approximately 65% of Norbord’s cash production costs, increased sharply over the five-year period preceding 2009. MIP gains of $16 million in 2010, measured relative to 2009 at
Some of the statements included in this MD&A constitute forward-looking statements that are based on various assumptions and are subject to various risks. See the cautionary statement contained in the Forward-Looking Statements section.
18
constant prices and exchange rates, limited the impact that higher raw material prices had on earnings in 2010. Contributions to MIP included an added-value product mix, improved production efficiencies and key input usage reduction initiatives. In addition, cost-reduction initiatives undertaken on controllable and discretionary expenses resulted in lower overhead costs over the past two years, despite running more production capacity in 2010.
In 2010, Norbord’s North American per unit OSB production costs increased 8% over the prior year. The benefit of higher production volume was offset by the negative impact of higher resin and fibre prices (which were at cycle-bottom lows in 2009), higher supplies and maintenance costs as a result of running more production in 2010, higher employee profit share costs, and the foreign exchange impact of the strengthening Canadian dollar. Norbord’s European operations are disproportionately impacted by rising resin and global energy prices because the products are more resin and energy intensive. A number of initiatives have been undertaken to address these cost pressures, including the permanent closure of a particleboard line at the Genk site in 2008, and the installation of biomass heat energy systems at Genk OSB and Cowie, Scotland, MDF in 2007.
INTEREST, DEPRECIATION AND INCOME TAX
(US $ millions) 2010 2009 2008 2007 2006
Interest and other income $– $– $3 $5 $3 Interest expense (34) (36) (49) (49) (29) Depreciation (45) (48) (68) (88) (94) Income tax recovery (expense) (3) 33 95 45 (17)
Interest In 2007, the Company had higher average cash balances arising principally from the $200 million issue of senior notes completed in 2007 to pre-fund the 2008 debenture maturity.
Interest expense was $2 million lower in 2010 compared to 2009 due to lower average drawings on revolving bank lines. Interest expense was $13 million lower in 2009 compared to 2008 due to three main factors. First, Norbord paid down borrowings under the Company’s committed revolving bank lines and Brookfield debt facility with proceeds from the Rights Offering completed in the first quarter of 2009. Second, average interest rates in 2009 were lower than 2008 due to low US Federal Reserve rates. And third, interest was higher in 2008 due to the 8⅛% debentures repurchased in the first quarter of 2008.
The effective interest rate on Norbord’s debt-related obligations, including the impact of interest rate swaps, was 6.2% as at December 31, 2010, compared to 6.1% as at prior year-end. Approximately 1% of Norbord’s net debt was subject to floating interest rates during the year, compared to 32% in the prior year, because of the significant cash balances accumulated during 2010.
From time to time, the Company can recoupon its portfolio of interest rate swaps to more efficiently manage cash flow and credit exposure. Any gains or losses realized are deferred and amortized over the remaining term of the debt against which the swaps were designated as hedges. As at December 31, 2010, $3 million in gains were deferred and included in the carrying value of long-term debt in the consolidated balance sheet. Amortization of $3 million in 2010, and $2 million in 2009, was included in interest expense.
Depreciation Depreciation expense in 2010 was lower than 2009 due to the prospective change in estimate in the depreciation of production equipment from the straight-line to units of production methodology, effective March 29, 2009 (see Significant Accounting Policies and Estimates). The units of production depreciation methodology provides a more rational and systematic cost allocation, as the fluctuation in depreciation expense reflects changes in mill production levels. The impact of this change in estimate resulted in a reduction in depreciation expense of $12

Some of the statements included in this MD&A constitute forward-looking statements that are based on various assumptions and are subject to various risks. See the cautionary statement contained in the Forward-Looking Statements section.
19
million in 2009. Continued fluctuating production volumes and the indefinite closure of the Jefferson and Huguley OSB mills triggered this change.
Income Tax A tax expense of $3 million was recorded in 2010 on pre-tax income of $20 million. The effective tax rate of 15% is lower than the statutory rate due principally to rate differences on foreign activities and fluctuations in relative currency values. In 2009, the Company recorded an income tax recovery of $8 million ($0.19 per share) related to the recognition of a future income tax asset previously charged to retained earnings in the fourth quarter of 2008, due to Brookfield’s acquisition of control.
From 2004 to 2006, Norbord paid $234 million in income and income-related taxes, principally in North America. In 2010, 2009, 2008 and 2007, the Company received tax refunds of $52 million, $10 million, $85 million and $33 million, respectively, related to losses carried back and over installments.
At December 31, 2010, the Company had tax operating loss carryforwards of approximately £6 million and €44 million from operations in the UK and Belgium, respectively. These losses can be carried forward indefinitely to offset future taxable income. The Company has tax operating losses of CAD $57 million and US $133 million from operations in Canada and the US, respectively, which expire between 2028 and 2029. The Company also has approximately CAD $6 million worth of Investment Tax Credits (ITCs) available to reduce future Canadian tax liabilities. The ITCs expire between 2021 and 2029. The loss carryforwards and credits may be utilized over the next several years to eliminate cash taxes otherwise payable, and will enhance future cash flows. Certain future tax benefits have been included in future income taxes in the consolidated financial statements. A valuation allowance was recorded related to future income tax assets that, in the judgement of management, are not likely to be realized.
LIQUIDITY AND CAPITAL RESOURCES
(US $ millions, except per share information, unless otherwise noted) 2010 2009 2008 2007 2006
Cash provided by (used for) operating activities $130 $(35) $(13) $15 $191Cash provided by (used for) operating activities per share 3.00 (0.82) (0.86) 1.03 13.36
Operating working capital (57) (42) (53) 23 –Total working capital 62 36 (20) 240 53 Investment in property, plant and equipment 16 14 27 36 160Net debt to capitalization, market basis 35% 48% 32% 30% 27%Net debt to capitalization, book basis 49% 58% 61% 60% 51%
At year-end, the Company had unutilized liquidity of $348 million, comprising $235 million in revolving bank lines and $113 million in cash and cash equivalents. Norbord has no investments in, or other direct exposure to, US sub-prime mortgages, US auction rate securities or Canadian asset-backed commercial paper.
The Company’s outstanding long-term debt has a weighted average term of 3.6 years. Norbord’s net debt for financial covenant purposes stood at $337 million at December 31, 2010, which includes long-term debt of $440 million less cash and cash equivalents of $113 million plus letters of credit of $10 million.
Revolving Bank Lines In July 2010, the Company completed amendments to its committed revolving bank lines. Under the amended terms, the aggregate commitment was increased from $205 million to $245 million, and the maturity was extended from May 2011 to May 2013. The bank lines bear interest at money market rates plus a margin that varies with the Company’s credit rating. The bank lines are secured by a first lien on the Company’s North
Some of the statements included in this MD&A constitute forward-looking statements that are based on various assumptions and are subject to various risks. See the cautionary statement contained in the Forward-Looking Statements section.
20
American OSB inventory and property, plant and equipment. This lien is shared pari passu with holders of the 2012 debentures and 2017 senior notes.
The bank lines contain two quarterly financial covenants: minimum tangible net worth of $250 million and maximum net debt to total capitalization on a book basis of 65%. Effective January 1, 2011, the maximum net debt to total capitalization on a book basis covenant was reduced to 60%. Net debt includes total debt less cash and cash equivalents plus letters of credit issued. As at December 31, 2010, the Company’s tangible net worth was $352 million and net debt for financial covenant purposes was $337 million. Net debt to total capitalization on a book basis was 49%.
As at December 31, 2010, none of the revolving bank lines was drawn as cash, $10 million was utilized for letters of credit and $235 million was available to support short-term liquidity requirements.
Brookfield Debt Facility Concurrent with the amendments made to the revolving bank lines described above, the Company cancelled the $50 million Brookfield debt facility, which was undrawn. The facility bore interest equal to the greater of 8% or US base rate plus ½%, and was subordinated to the revolving bank lines. Any drawings under the facility were treated as tangible net worth for financial covenant purposes. The standby fee on the facility was less than $1 million in 2010 (2009 – less than $1 million).
Other Liquidity and Capital Resources Operating working capital, consisting of accounts receivable and inventory less accounts payable and accrued liabilities, decreased by $15 million during the year to negative $57 million at year-end, compared to negative $42 million at December 31, 2009. Operating working capital decreased due to higher accounts payable, partially offset by higher inventory and accounts receivable. The overall decrease is attributed to fewer production curtailments taken towards the end of 2010 compared to the prior year. The Company aims to minimize the amount of capital held as operating working capital and continued to manage it at minimal levels throughout the year.
The 2010 and 2009 accounts receivable balances are net of $60 million and $62 million, respectively, of accounts receivable sold under a securitization facility (see Off Balance Sheet Arrangements). The $85 million facility, with a third-party trust sponsored by a highly rated Canadian financial institution, commenced in June 2010 and replaced an existing program. Despite the challenging economic environment, Norbord’s accounts receivable performance metrics remain in line with prior periods.
Total working capital, which includes operating working capital plus cash and cash equivalents and income tax receivable, was $62 million as at December 31, 2010, compared to $36 million in the prior year. The increase is attributed to a higher cash balance generated from operations and the collection of $52 million in cash tax refunds, partially offset by lower operating working capital.
Operating activities provided $130 million in cash or $3.00 per share in 2010, compared to the consumption of $35 million or $0.82 per share in 2009. In 2010, positive EBITDA from operations, the reduction of operating working capital and the receipt of $52 million in cash tax refunds more than offset the interest paid on debt. In 2009, interest expense and an increase in operating working capital were partially offset by $10 million in cash tax refunds.
On November 10, 2008, the Company announced the suspension of quarterly dividend payments on its common shares until further notice. No dividends were paid in 2009 or 2010.
The Company realized a gain of $6 million on its matured net investment hedges in 2010, compared to a loss of $2 million in 2009. The realized gain and loss were offset by an unrealized loss and gain on the net investments being hedged.

Some of the statements included in this MD&A constitute forward-looking statements that are based on various assumptions and are subject to various risks. See the cautionary statement contained in the Forward-Looking Statements section.
21
The following table summarizes the aggregate amount of future cash outflows for contractual obligations:
Payments Due by Period
Contractual Obligations (US $ millions) Total Less than One Year
One to Three Years
Four to Five Years
After Five Years
Long-term debt, including interest $576 $32 $288 $32 $224 Purchase obligations 147 58 66 10 13 Operating leases 10 3 4 2 1 Total $733 $93 $358 $44 $238
Note: The above table does not include pension and post-retirement benefits plan obligations, which are discussed in the Significant Accounting Policies and Estimates – Defined Benefit Pension Plans section.
INVESTMENTS AND DIVESTITURES Investment in Property, Plant and Equipment
(US $ millions) 2010 2009 2008 2007 2006
Increased productivity $7 $4 $3 $20 $32Environmental 4 6 13 2 6Maintenance of business 5 4 11 11 18Greenfield and major expansion – – – – 97Capitalized interest – – – 3 7Total $16 $14 $27 $36 $160
Investment in property, plant and equipment in 2010 was constrained to $16 million, representing approximately 35% of depreciation. In the fourth quarter, Norbord commenced an infrastructure investment program at its particleboard mill in Cowie. The investment is expected to increase production capacity and reduce manufacturing costs.
Due to market conditions, investment in property, plant and equipment was limited in the past few years to essential projects. In 2006, investment in property, plant and equipment was high as the Company took advantage of strong earnings to expand capacity at the Cordele mill, to accelerate higher-return capital projects focused primarily on energy reduction and production enhancement, and to meet Maximum Achievable Control Technology (MACT) requirements. The second OSB line at Cordele, which was completed on time and on budget in December 2006, is one of the largest and most efficient OSB manufacturing facilities in the world. The expansion added approximately 550 Msf (3⁄8-inch basis) of production capacity at a capital cost of $135 million and increased Norbord’s North American OSB production capacity by 15%.
Norbord’s 2011 investment in property, plant and equipment is expected to be constrained to $25 million for essential capital projects and will be funded with cash on hand, cash generated from operations and, if necessary, drawings under the Company’s committed revolving bank lines.
Divestitures In January 2011, True North Hardwood Plywood Inc. announced the winding down of its hardwood plywood operation in Cochrane. Norbord held a 50% joint-venture interest in this non-core business, which represented less than 1% of total assets. Approximately 200 employees were affected by this decision. In 2010, the Company recorded a $6 million non-cash provision for the write-down of its investment in the joint venture.

Some of the statements included in this MD&A constitute forward-looking statements that are based on various assumptions and are subject to various risks. See the cautionary statement contained in the Forward-Looking Statements section.
22
In November 2009, Norbord sold its non-core MDF mill in Deposit to a third party for proceeds of $2 million. Approximately 90 employees were affected by this decision. In 2009, the Company recorded a $4 million provision, primarily for the write-down of certain property, plant and equipment and inventory to net realizable value.
CAPITALIZATION
Common Share Information as at December 31 2010 2009 2008 2007 2006
Shares outstanding (millions) 43.5 43.2 26.9 14.7 14.4 Dividends (US $ millions) $ 0 $ 0 $ 56 $ 55 $ 178Market price at year-end (CAD $) $ 14.64 $ 14.66 $ 7.00 $ 79.60 $ 89.10
At January 28, 2011, there were 43.5 million common shares outstanding. In 2010, the total return on Norbord shares was negative 1%, compared to 109% in 2009. The average daily volume traded during 2010 was approximately 170,000 shares, compared to approximately 55,000 shares in 2009.
In 2010, Norbord applied to the Toronto Stock Exchange (TSX) and received approval to conduct a normal course issuer bid in accordance with TSX rules. Under the bid, the Company may purchase up to 2,176,198 of its common shares, representing approximately 5% of the 43.5 million issued and outstanding common shares as at January 28, 2011. Purchases under the bid will terminate on the earlier of September 16, 2011, the date Norbord completes its purchases pursuant to the notice of intention to make a normal course issuer bid filed with the TSX, or the date Norbord provides notice of termination of the bid.
Secondary Offering In March 2010, Brookfield and the Company entered into an agreement with a syndicate of investment dealers to complete a secondary offering of Norbord’s common shares. Under the agreement, the syndicate purchased 9 million common shares at a price of CAD $16.70 per common share, for gross proceeds of CAD $150 million, on March 30, 2010. Brookfield offered 8.7 million shares and the Company’s senior management offered 0.3 million shares. Upon completion of the secondary offering, Brookfield’s ownership decreased from approximately 73% to 52% of common shares outstanding. Norbord did not receive any proceeds from the offering.
Warrants As at December 31, 2010, there were 136.3 million warrants outstanding, entitling the holders to purchase 13.6 million common shares. Ten whole warrants entitle the holder to purchase one common share at a price of CAD $13.60 at any time prior to December 24, 2013.
Stock Options As at December 31, 2010, options on 1.5 million common shares were outstanding, with 17% vested. The exercise prices for the outstanding options range from CAD $0.10 to CAD $111.30, with expiry on various dates up to 2020. In 2010, approximately 0.3 million common shares were issued under the Company’s stock option plan, generating proceeds of $2 million.

Some of the statements included in this MD&A constitute forward-looking statements that are based on various assumptions and are subject to various risks. See the cautionary statement contained in the Forward-Looking Statements section.
23
SELECTED QUARTERLY INFORMATION
2010 2009
(US $ millions, except per share information, unless otherwise noted) 4th Qtr 3rd Qtr 2nd Qtr 1st Qtr 4th Qtr 3rd Qtr 2nd Qtr 1st Qtr
KEY PERFORMANCE METRICS
Return on capital employed (ROCE) 7% 6% 33% 4% 3% 5% (1)% (7)%Return on equity (ROE) (8)% (8)% 44% (6)% (12)% (8)% (19)% (29)%
Cash provided by (used for) operating activities 50 3 75 2 16 15 39 (105)
Cash provided by (used for) operating activities per share 1.16 0.07 1.72 0.05 0.37 0.35 0.90 (2.49)
NET SALES AND EARNINGS Net sales 219 211 278 184 196 192 174 156 EBITDA 13 12 71 9 6 10 (2) (14) Earnings (8) (7) 37 (5) (11) (7) (18) (22)
PER COMMON SHARE
Earnings Basic (0.18) (0.16) 0.85 (0.12) (0.25) (0.16) (0.42) (0.52) Diluted (0.18) (0.16) 0.81 (0.12) (0.25) (0.16) (0.42) (0.52)
KEY STATISTICS
Shipments (MMsf–3⁄8") North America 768 757 834 630 726 750 717 587 Europe(1) 326 335 345 292 302 291 277 288 Indicative OSB pricing Average OSB price
North Central ($/Msf–7⁄16") 191 180 295 212 172 178 146 154 South East ($/Msf–7⁄16") 165 156 277 197 154 157 140 139 Europe (€/m3) 229 224 206 180 168 163 163 183
(1) Excludes product consumed internally (29 MMsf, 24 MMsf, 26 MMsf, 29 MMsf, 37 MMsf, 28 MMsf, 31 MMsf, 31 MMsf for each period, respectively).
Quarterly results are impacted by seasonal factors such as weather and building activity. Market demand varies seasonally, as homebuilding activity and repair and renovation work – the principal end uses of Norbord’s products – are generally stronger in the spring and summer months. Adverse weather can also limit access to logging areas, which can affect the supply of fibre to Norbord’s operations. Shipment volumes and commodity prices are affected by these factors as well as by global supply and demand conditions.
Operating working capital is typically built up in the first quarter of the year due primarily to log inventory purchases in the Northern regions of North America and Europe. Logs are generally consumed in the spring and summer months. Operating working capital also fluctuates based on the timing of bond coupon payments in the first and third quarters.
The price of and demand for OSB in North America are significant variables affecting the comparability of Norbord’s results over the past eight quarters. Fluctuations in earnings during that time mirror fluctuations in the price of and demand for OSB in North America. The Company estimates that the annualized impact of a $10 per

Some of the statements included in this MD&A constitute forward-looking statements that are based on various assumptions and are subject to various risks. See the cautionary statement contained in the Forward-Looking Statements section.
24
Msf (7⁄16-inch basis) change in the North American OSB price on EBITDA, when operating at capacity, is approximately $36 million or $0.83 per share. Regional pricing variations, particularly in the Southern US, make the North Central benchmark price a useful, albeit imperfect, proxy for overall North American OSB pricing. Further, competition premiums obtained on value-added products, the pricing lag effect of maintaining an order file, and volume and trade discounts cause realized prices to differ from the benchmark.
High global commodity prices caused upward pressure on the prices of key input costs, primarily resin, wax, energy and fibre, for most of 2008. Downward trends in global energy prices provided significant input cost relief in the first half of 2009, with prices on the bottom during the second half of 2009. In 2010, commodity prices increased in the first half of the year and then leveled off for the remainder of the year. Management believes that commodity prices may trend up moderately in 2011, although they are not expected to return to the peak levels experienced at the end of 2008.
Norbord has relatively low exposure to the Canadian dollar due to a comparatively small manufacturing base in Canada, which comprises 13% of its panel production capacity. The Company estimates that the unfavourable impact of a one-cent (US) increase in the value of the Canadian dollar would negatively impact annual EBITDA by approximately $1 million, when Norbord’s Canadian OSB mills operate at capacity.
Items not related to ongoing business operations that had a significant impact on quarterly results include:
Provision for non-core operation − In the fourth quarter of 2010, the Company recorded a provision of $6 million pre-tax ($0.14 per share) related to its 50% interest in a non-core hardwood plywood joint-venture operation. In the third and fourth quarters of 2009, the Company recorded a provision of $3 million pre-tax ($0.04 per share) and $1 million pre-tax ($0.02 per share), respectively, related to the sale of its non-core MDF mill in Deposit (see Investments and Divestitures).
Depreciation expense − In the second quarter of 2009, the Company changed to the units of production depreciation method for its production assets, resulting in a $4 million pre-tax ($0.06 per share) reduction in depreciation expense for the second, third and fourth quarters of 2009 (see Significant Accounting Policies and Estimates).
Income tax recovery − In the first quarter of 2009, the Company recorded an income tax recovery of $8 million ($0.19 per share) related to the recognition of a future income tax asset previously charged to retained earnings in the fourth quarter of 2008, due to Brookfield’s acquisition of control (see Interest, Depreciation and Income Tax).
Foreign exchange loss − In the first quarter of 2009, the Company incurred a foreign exchange loss of $3 million pre-tax ($0.05 per share) from the locked-in foreign exchange rate for Canadian proceeds received upon completion of Brookfield’s standby commitment in January 2009, related to a Rights Offering.
FOURTH QUARTER RESULTS Norbord achieved a sixth consecutive quarter of positive EBITDA results and positive operating cash flow from both its North American and European operations. Under normal market conditions, a seasonal slowdown is experienced in the fourth quarter in North America. The seasonal slowdown was less evident in 2010 as prices held up due to wet weather conditions in the Southern US (which affected log availability and supply), low OSB inventories and firmer OSB demand. In the UK, extreme cold and snowy weather conditions were experienced in the latter part of the year. Nevertheless, European panel prices and shipment volumes continued to move in a positive direction as improved do-it-yourself and housing activity continued during the quarter.
In the quarter, North Central benchmark OSB prices averaged $191 per Msf (7⁄16-inch basis), up $11 per Msf from the third quarter and $19 from the fourth quarter of 2009. In the South East region, where approximately 55% of Norbord’s North American OSB capacity is located, prices averaged $165 in the quarter, up $9 from the third quarter and $11 from the fourth quarter of 2009. Indicative European OSB prices (denominated in Euros) and MDF prices increased by 2% and 3%, respectively, relative to the third quarter of 2010, while particleboard
Some of the statements included in this MD&A constitute forward-looking statements that are based on various assumptions and are subject to various risks. See the cautionary statement contained in the Forward-Looking Statements section.
25
prices retreated by 1%. Year-over-year, European OSB, MDF and particleboard prices increased by 36%, 10% and 8%, respectively.
Net sales in the quarter were $219 million, compared to $211 million and $196 million in the third quarter of 2010 and fourth quarter of 2009, respectively. Quarter-over-quarter, sales increased by $8 million due to the benefit of higher North American OSB shipment volumes and higher European panel shipment volumes and prices. This increase was partially offset by the impact of lower mill nets in North America, which are attributable to the price-lag effect of maintaining an order file. Year-over-year, sales increased by $23 million due to higher North American and European OSB prices.
In the fourth quarter of 2010, Norbord’s North American OSB mills operated at 65% of capacity and its European mills operated at 90% of capacity, compared to 60% and 80%, respectively, in the fourth quarter of 2009. In the third quarter of 2010, North American OSB mills operated at 70% of capacity and European mills operated at 100% of capacity.
Norbord recorded a loss of $2 million ($0.05 per share) in the fourth quarter of 2010, excluding the impact of a $6 million after-tax ($0.14 per share) write-down of its 50% interest in a non-core hardwood plywood joint-venture operation (see Investments and Divestitures). The Company recorded a loss of $7 million ($0.16 per share) in the third quarter of 2010 and $11 million ($0.25 per share) in the fourth quarter of 2009. Quarter-over-quarter, higher earnings are attributed to a higher income tax recovery. Year-over-year, the earnings improvement was primarily driven by higher North American and European EBITDA results.
In the quarter, Norbord recorded EBITDA of $13 million, versus $12 million in the previous quarter and $6 million in the fourth quarter of 2009. EBITDA changes are summarized in the variance table below.
EBITDA Variance (US $ millions)
4th Qtr 2010 vs.
3rd Qtr 2010
4th Qtr 2010 vs.
4th Qtr 2009
EBITDA – current period $13 $13EBITDA – comparative period 12 6
Variance $1 $7
Mill nets(1) $(3) $18Volume(2) 4 6 Key input prices(3) (2) (9)Key input usage(3) – 2 Other(4) 2 (10) Total $1 $7
(1) The mill nets variance represents the change in realized pricing across all products. Mill nets are calculated as net sales divided by shipment volume.
(2) The volume variance represents the impact of shipment volume changes across all products. (3) The key inputs include fibre, resin and energy. (4) The other category covers all remaining variances including labour and benefits, supplies and maintenance, and the impact of foreign exchange.
Some of the statements included in this MD&A constitute forward-looking statements that are based on various assumptions and are subject to various risks. See the cautionary statement contained in the Forward-Looking Statements section.
26
EBITDA (US $ millions) 4th Qtr 2010 3rd Qtr 2010 4th Qtr 2009
North America $7 $4 $1Europe 11 10 7Unallocated (5) (2) (2)Total $13 $12 $6
Norbord’s North American operations generated EBITDA of $7 million in the fourth quarter of 2010, versus $1 million in the fourth quarter of 2009 and $4 million in the third quarter of 2010. The year-over-year improvement of $6 million was generated from higher OSB prices and shipment volume, partially offset by higher labour and supplies and maintenance costs. Quarter-over-quarter, the increase in EBITDA of $3 million was attributed to higher OSB shipment volume, partially offset by lower mill nets, which are attributable to the price-lag effect of maintaining an order file.
In the fourth quarter, Norbord’s North American per unit OSB cash production costs decreased by 1% over the third quarter of 2010. The benefit of higher production volume, lower resin and energy prices and lower fibre and resin usages was partially offset by higher employee profit share costs and the foreign exchange impact of the strengthening Canadian dollar. Year-over-year, OSB cash production costs increased by 3% over the fourth quarter of 2009. The benefit of improved key input usages and higher production volume was offset by higher resin and fibre prices, supplies and maintenance costs and employee profit share.
Norbord’s European operations generated EBITDA of $11 million in the fourth quarter of 2010 and $10 million in the third quarter of 2010, versus $7 million in the fourth quarter of 2009. The increase in EBITDA in the comparative quarters is attributed to higher European panel prices and shipment volume, partially offset by higher fibre and resin prices and higher labour costs.
Unallocated costs include higher corporate costs and the impact of foreign exchange, which is attributed to a stronger Canadian dollar in all comparable periods.
Overall, improved fourth quarter results in 2010 are encouraging indicators of market conditions.
OFF BALANCE SHEET ARRANGEMENTS In June 2010, the Company entered into an $85 million accounts receivable securitization program to sell its receivables to a third-party trust, sponsored by a highly rated Canadian financial institution, to replace the preceding program. The program has an evergreen commitment that is subject to termination on 12 months’ notice. Under the program, Norbord has transferred substantially all of its present and future trade accounts receivable to the trust, on a fully serviced basis, for proceeds consisting of cash and deferred purchase price. At December 31, 2010, Norbord recorded cash proceeds of $60 million relating to this program.
The securitization program contains no financial covenants; however, the program is subject to minimum credit-rating requirements. The Company must maintain a long-term issuer credit rating of at least single B(mid) or the equivalent. As at January 28, 2011, Norbord’s ratings were BB(low) (Dominion Bond Rating Service), BB- (Standard & Poor’s Ratings Services) and Ba3 (Moody’s Investors Service).
TRANSACTIONS WITH RELATED PARTIES In the normal course of operations, the Company enters into various transactions on market terms with related parties which have been measured at exchange value and are recognized in the consolidated financial statements. The following transactions have occurred between the Company and Brookfield during the normal course of business.

Some of the statements included in this MD&A constitute forward-looking statements that are based on various assumptions and are subject to various risks. See the cautionary statement contained in the Forward-Looking Statements section.
27
Secondary Offering In March 2010, upon completion of the secondary offering (see Capitalization), Brookfield’s ownership decreased from approximately 73% to 52% of common shares outstanding.
Indemnity Commitment As at December 31, 2010, total future costs related to a 1999 asset purchase agreement between the Company and Brookfield, for which Norbord provided an indemnity, are estimated at less than $1 million and are included in other liabilities in the consolidated balance sheet.
Other The Company provides certain administrative services to Brookfield and its affiliates which are charged on a cost recovery basis. In addition, the Company periodically engages the services of Brookfield and its affiliates for various financial, real estate and other business advisory services. In 2010, the fees for these services were less than $1 million (2009 – less than $1 million) and were charged at market rates.
FINANCIAL POLICIES Capital Allocation Norbord considers effective capital allocation to be critical to its success. Capital is invested only when Norbord expects returns to exceed pre-determined thresholds, taking into consideration both the degree and magnitude of the relative risks and rewards and, if appropriate, strategic considerations in the establishment of new business activities or maintenance of existing business activities. Post-investment reviews are conducted on capital investment decisions to assess the results against planned project returns.
Liquidity Norbord strives to maintain sufficient financial liquidity at all times in order to participate in attractive investment opportunities as they arise, and to withstand sudden adverse changes in economic circumstances. Management forecasts cash flows for its current and subsequent fiscal years to identify financing requirements. These requirements are then addressed through a combination of committed credit facilities and access to capital markets.
At year-end, the Company had unutilized liquidity of $348 million, comprising $113 million in cash and cash equivalents and $235 million in unutilized committed revolving bank lines with seven international financial institutions, available to support its liquidity requirements.
Credit Ratings Maintaining a stable balance sheet is an important element of Norbord’s financing strategy. Norbord believes that its record of superior operational performance and prudent balance sheet management should enable it to access public and private capital markets, subject to financial market conditions.
At January 28, 2011, Norbord’s long-term issuer credit ratings were:
Dominion Bond Rating Service
Standard & Poor’s Ratings Services
Moody’s Investors Service
Rating BB(low) BB- Ba3 Outlook Stable Negative Negative
In November 2010, Dominion Bond Rating Service (DBRS) downgraded Norbord’s credit ratings from BB(mid) (negative outlook) to BB(low) (stable outlook), in line with Standard & Poor’s Ratings Services and Moody’s Investors Services, citing the weaker-than-expected US housing market.

Some of the statements included in this MD&A constitute forward-looking statements that are based on various assumptions and are subject to various risks. See the cautionary statement contained in the Forward-Looking Statements section.
28
Credit ratings are intended to provide investors with an independent measure of the credit quality of any securities issue. The credit ratings accorded to debt securities by the rating agencies are not recommendations to purchase, hold or sell the debt securities, as such ratings do not comment as to market price or suitability for a particular investor. There is no assurance that any rating will remain in effect for any given period of time or that any rating will not be revised or withdrawn entirely by a rating agency in the future if, in its judgement, circumstances so warrant.
Use of Financial Instruments Norbord uses derivative financial instruments solely for the purpose of managing its interest rate, foreign exchange and commodity price exposures, as further detailed in the Risks and Uncertainties section. These activities are governed by Board-approved financial policies that cover risk identification, tolerance, measurement and reporting. Derivative transactions are executed only with approved, high-quality counterparties under master netting agreements. Derivative contracts that are deemed to be highly effective in offsetting changes in the fair value, net investment or cash flows of hedged items are designated as hedges of specific exposures and, accordingly, all gains and losses on these instruments are recognized in the same manner as the item being hedged.
FUTURE CHANGES IN ACCOUNTING POLICIES Business Combinations In January 2009, the Canadian Institute of Chartered Accountants (CICA) issued Handbook Section 1582, Business Combinations, which requires that all assets and liabilities of an acquired business be recorded at fair value at the acquisition date. Obligations for contingent considerations and contingencies will also be recorded at fair value at the acquisition date. The standard also states that acquisition-related costs will be expensed as incurred and that restructuring charges will be expensed in periods following the acquisition date. The new standard applies prospectively to business combinations for which the acquisition date is on or after the beginning of the first annual reporting period on or after January 1, 2011. After adoption, the Company will apply this new standard at the time of any applicable acquisitions.
Consolidations and Non-Controlling Interests In January 2009, the CICA issued Handbook Section 1601, Consolidations, and Section 1602, Non-Controlling Interests. Section 1601 establishes standards for the preparation of consolidated financial statements. Section 1602 establishes standards for accounting for a non-controlling interest in a subsidiary in consolidated financial statements, subsequent to a business combination. These standards apply to interim and annual consolidated financial statements relating to fiscal years beginning on or after January 1, 2011. The Company does not expect these new standards to have any impact on its financial statements.
Some of the statements included in this MD&A constitute forward-looking statements that are based on various assumptions and are subject to various risks. See the cautionary statement contained in the Forward-Looking Statements section.
29
INTERNATIONAL FINANCIAL REPORTING STANDARDS The Accounting Standards Board (AcSB) confirmed in February 2008 that International Financial Reporting Standards (IFRS) will replace Canadian GAAP for publicly accountable enterprises for financial periods beginning on or after January 1, 2011. Accordingly, the conversion from Canadian GAAP to IFRS will be applicable to the Company’s reporting for the first quarter of 2011, for which current and comparative information will be prepared under IFRS.
The following chart summarizes the progress made to-date in achieving the milestones contained in the key elements of Norbord’s IFRS transition plan:
Key Activity
Milestones and Target
Dates Progress to January 28, 2011
Project Governance Q1 2009 Steering committee formation • Steering and working committees formed Project resourcing • Resources across organization allocated and
additional consulting support deployed Project management practices • Project status reporting developed and
implemented Financial Statement Preparation Q1 2011 Identification of differences in policies and choices • Significant Canadian GAAP and IFRS
differences identified Selection of entity’s IFRS policies • Criteria for accounting policy established
and policy selections for significant areas completed
Selection of IFRS 1 accounting policy choices • IFRS 1 policy selections for significant areas completed
Quantification of IFRS 1 adjustments for 2010 • Quantification for all significant areas completed
Financial statement format • In progress Changes in note disclosure • In progress IFRS Expertise Retraining key finance and operational staff Q2 2010 • Resource requirements identified and initial
and in-depth training completed Education of management and Audit Committee Q2 2010 • Initial training and in-depth learning
sessions completed Education of external stakeholders Q3 2010 • External education completed Audit Committee
Assessment of IFRS transition readiness Q2 2010 • Audit Committee’s assessment of IFRS transition readiness completed
Information Technology Systems changes to support IFRS requirements Q3 2010 • System impact assessed and required
changes planned, designed, tested and implemented
Some of the statements included in this MD&A constitute forward-looking statements that are based on various assumptions and are subject to various risks. See the cautionary statement contained in the Forward-Looking Statements section.
30
Key Activity
Milestones and Target
Dates Progress to January 28, 2011
Business Implications Assessment Business contract review Q2 2010 • GAAP-based clauses to be renegotiated
with counterparties identified and process to review contracts completed
Renegotiation of contracts Q3 2010 • Negotiation of bank lines financial covenants to address IFRS transitional impact completed
Control Environment Internal control over financial reporting (ICFR) Q4 2010 • Updated and tested certain entity level,
information technology, disclosure and business process controls to reflect the changes arising from the conversion to IFRS.
• Assessed the impact of all changes required in transitioning to IFRS and concluded there are no changes that have materially affected, or are reasonably likely to materially affect, internal control over financial reporting.
FIRST-TIME ADOPTION OF INTERNATIONAL FINANCIAL REPORTING STANDARDS Norbord’s adoption of IFRS requires the application of IFRS 1, First-Time Adoption of International Financial Reporting Standards, which provides guidance for an entity’s initial adoption of IFRS. IFRS 1 generally requires that an entity apply all IFRS effective at the end of its first IFRS reporting period, retrospectively. However, IFRS 1 does require certain mandatory exemptions and limited optional exemptions in specified areas of certain standards from this general requirement. The following are the optional exemptions available under IFRS 1, significant to Norbord, that the Company will apply in preparing its first financial statements under IFRS.
Measurement of Assets and Liabilities Norbord’s majority shareholder, Brookfield, was granted exemptive relief by the Canadian Securities Administrators to prepare its financial statements in accordance with IFRS one year earlier than required for Canadian publicly accountable enterprises, which is effectively one year earlier than Norbord’s transition date. IFRS 1 provides an exemption that permits a subsidiary to measure its assets and liabilities at the carrying amounts included in its parent company’s financial statements. The Company has elected this exemption. Therefore, the Company will use the measurement of its assets and liabilities as of January 1, 2009 – that was included in Brookfield’s financial statements for Brookfield’s transition – as the basis for the measurement of the Company’s assets and liabilities upon its transition to IFRS. As a result, the Company has applied the same exemptions and elections as Brookfield.
Fair Value as Deemed Cost IFRS 1 allows an entity to initially measure an item of property, plant and equipment upon transition to IFRS at fair value, as opposed to recreating depreciated cost under IFRS. The Company will use fair value as deemed cost for property, plant and equipment, which will result in carrying values under IFRS that are different than those
Some of the statements included in this MD&A constitute forward-looking statements that are based on various assumptions and are subject to various risks. See the cautionary statement contained in the Forward-Looking Statements section.
31
under Canadian GAAP. This change in carrying value is the result of the change in value of such assets in aggregate since acquisition.
Cumulative Translation Differences International Accounting Standard (IAS) 21, The Effects of Changes in Foreign Exchange Rates, requires a company to determine the translation differences in accordance with IFRS from the date on which a subsidiary was formed or acquired. IFRS 1 allows cumulative translation differences for all foreign operations to be deemed zero at the date of transition to IFRS, with future gains or losses on subsequent disposal of any foreign operations to exclude translation differences arising prior to the date of transition to IFRS. The Company will reset all cumulative translation differences to zero as at January 1, 2009.
Employee Benefits IAS 19, Employee Benefits, allows certain actuarial gains and losses to be either deferred and amortized or recognized immediately through shareholders’ equity. On adoption of IFRS, the Company has elected to record all deferred actuarial gains and losses through shareholders’ equity.
Share-Based Payments On adoption of IFRS, under IFRS 2, Share-Based Payments, an entity is not required to recognize share-based payments settled before the entity’s IFRS transition date. IFRS 1 encourages, but does not require, application of its provisions to equity instruments granted on or before November 7, 2002. Norbord will recognize, under IFRS 2, all share-based awards that were recognized under Canadian GAAP.
IFRS 1 allows for certain other optional exemptions; however, such exemptions will not be significant to the Company’s adoption of IFRS.
IMPACT OF ADOPTION – RECONCILIATION FROM CANADIAN GAAP TO IFRS IFRS are premised on a conceptual framework similar to Canadian GAAP. However, significant differences exist in certain matters of recognition, measurement and disclosure. The foregoing discussion describes the significant differences between Canadian GAAP and IFRS that are relevant to Norbord. This includes standards and interpretations currently issued and expected to be effective at the end of the Company’s first annual IFRS reporting period, which will be the year ending December 31, 2011.
The following table provides a summary of the Canadian GAAP to IFRS transitional impact to opening shareholders’ equity as at January 1, 2010 (one year before the IFRS conversion date of January 1, 2011) and December 31, 2010. For additional disclosure, Canadian GAAP to IFRS adjustments to shareholders’ equity on Brookfield’s transition date (January 1, 2009) are also presented, as the Company has elected to measure assets and liabilities as of that date. The amounts presented were prepared using the procedures and assumptions that the Company is following to prepare its opening balance sheet upon adoption of IFRS. The ultimate opening shareholders’ equity impact, as presented in the financial statements for the year ending December 31, 2011, may differ from the figures presented in the foregoing tables if there are any changes to the underlying IFRS.

Consolidated Statements of Shareholders’ Equity – January 1, 2010, and December 31, 2010
Shareholders’ Equity (US $ millions) Share
Capital Contributed
Surplus Retained Earnings
Accumulated Other
Comprehensive Income
Total
Canadian GAAP – Jan. 1, 2010 $ 335 $ 39 $ (32) $ (8) $ 334 IFRS adjustments at measurement date – Jan. 1, 2009
(i) Employee benefits – – (14) – (14) (ii) Property, plant and equipment – deemed cost adjustment – – – – –
(iii) Consistency in accounting policies – – 4 – 4 (iv) Share-based compensation – 1 (1) – – (v) Deferred income tax – – (7) – (7) (vi) Cumulative translation account – – (13) 13 –
– 1 (31) 13 (17) IFRS adjustments – year ended Dec. 31, 2009
(i) Employee benefits – – (1) (3) (4) (ii) Property, plant and equipment – depreciation on deemed cost adjustment – – (4) – (4)
(iii) Consistency in accounting policies – – – 1 1 (v) Deferred income tax – – 11 – 11
– – 6 (2) 4 Total IFRS adjustments – Jan. 1, 2010 $ – $ 1 $ (25) $ 11 $ (13) IFRS – Jan. 1, 2010 $ 335 $ 40 $ (57) $ 3 $ 321 Canadian GAAP – movement for year ended Dec. 31, 2010 5 1 17 (5) 18
IFRS adjustments – year ended Dec. 31, 2010
(i) Employee benefits – – – (10) (10) (ii) Property, plant and equipment – depreciation on deemed cost adjustment – – (6) – (6)
(ii) Property, plant and equipment – foreign exchange on deemed cost adjustment – – – 3 3
(v) Deferred income tax – – 2 3 5 Total IFRS adjustments – year ended Dec. 31, 2010 $ – $ – $ (4) $ (4) $ (8) IFRS – Dec. 31, 2010 $ 340 $ 41 $ (44) $ (6) $ 331
Some of the statements included in this MD&A constitute forward-looking statements that are based on various assumptions and are subject to various risks. See the cautionary statement contained in the Forward-Looking Statements section.
32

Earnings
Years Ended December 31 (US $ millions, except per share information) 2010 2009
Canadian GAAP $ 17 $ (58) Total IFRS adjustments (4) 6 IFRS $ 13 $ (52)
Earnings per common share – basic
Canadian GAAP $ 0.39 $ (1.35) IFRS 0.30 (1.21)
Earnings per common share – diluted Canadian GAAP $ 0.38 $ (1.35) IFRS 0.29 (1.21)
Consolidated Balance Sheets – January 1, 2010, and December 31, 2010
January 1, 2010 (US $ millions) Total
Assets Total
Liabilities Shareholders’
Equity
Canadian GAAP $ 1,043 $ 709 $ 334 IFRS adjustments
(i) Employee benefits – 18 (18) (ii) Property, plant and equipment (4) – (4) (iii) Consistency in accounting policies 5 – 5 (v) Deferred income tax – (4) 4 (vii) Accounts receivable securitization 62 62 – (viii) Investment in joint venture (1) (1) –
Total IFRS adjustments $ 62 $ 75 $ (13) IFRS $ 1,105 $ 784 $ 321
December 31, 2010 (US $ millions) Total
Assets Total
Liabilities Shareholders’
Equity
Canadian GAAP $ 1,062 $ 710 $ 352 IFRS adjustments
(i) Employee benefits – 28 (28) (ii) Property, plant and equipment (7) – (7) (iii) Consistency in accounting policies 5 – 5 (v) Deferred income tax – (9) 9 (vii) Accounts receivable securitization 60 60 – (viii) Investment in joint venture (2) (2) –
Total IFRS adjustments $ 56 $ 77 $ (21) IFRS $ 1,118 $ 787 $ 331
Some of the statements included in this MD&A constitute forward-looking statements that are based on various assumptions and are subject to various risks. See the cautionary statement contained in the Forward-Looking Statements section.
33
Some of the statements included in this MD&A constitute forward-looking statements that are based on various assumptions and are subject to various risks. See the cautionary statement contained in the Forward-Looking Statements section.
34
(i) Employee Benefits
Unfunded Pension Obligation Under Canadian GAAP, accrued pension benefit obligation in excess of plan assets for defined benefit pension plans was only required to be disclosed in the notes to the consolidated financial statements. Under IAS 19, the obligation in excess of plan assets is required to be recorded as a liability on the balance sheet.
Actuarial Gains and Losses Under Canadian GAAP, actuarial gains and losses were recognized on a systematic and consistent basis, subject to a minimum required amortization based on a “corridor” approach. Unrecognized actuarial gains and losses below the “corridor” were deferred. Under IFRS, in accordance with the Company’s IFRS 1 election, any deferred actuarial gains and losses are immediately recognized in shareholders’ equity. Post-adoption, the Company elected to immediately recognize all actuarial gains and losses in shareholders’ equity.
(ii) Plant, Property and Equipment
Deemed Cost Upon transition to IFRS, the Company elected to measure its property, plant and equipment at fair value as its deemed cost. Certain items of property, plant and equipment in the North American operations had a fair value of $30 million above their book value under Canadian GAAP, and certain items of property, plant and equipment in the European operations had a fair value of $30 million below their book value under Canadian GAAP. The net effect of these fair value measurements was nil on a consolidated basis on January 1, 2009. The measurement was based on fair value as at January 1, 2009, Brookfield’s IFRS transition date. The Company determined the fair value of certain items of property, plant and equipment using an income approach. Fair value measurements were prepared internally using a discounted cash flow model, taking into consideration forecasts and assumptions concerning future cash flows and a discount rate based on the Company’s weighted average cost of capital as at the measurement date. All subsequent depreciation under IFRS will be based on the new deemed cost.
Component Accounting Both IFRS and Canadian GAAP require property, plant and equipment to be disaggregated into components and depreciated separately. Under Canadian GAAP, component accounting was interpreted and applied more generally. The Company has applied the guidance under IAS 16, Property, Plant and Equipment, and disaggregated its property, plant and equipment into components and reviewed the useful life of each separate component. For certain components of property, plant and equipment, useful lives were reassessed, and the effect of these changes in estimates will accelerate the expected depreciation expense under IFRS.
Impairments Under both Canadian GAAP and IFRS, an asset or group of assets is tested for impairment only when there is an indication of impairment. Under Canadian GAAP, impairment testing of an asset or group of assets is a two-step approach. First, the carrying value of an asset or group of assets is compared to the undiscounted future cash flows to determine whether impairment exists. If impairment exists, then the second step is to measure the impairment by comparing the carrying value of the asset or group of assets to its fair value, as calculated using the present value of future cash flows. Under IAS 36, Impairment of Assets, impairment testing is a one-step approach for both testing and measurement, with the carrying value of the asset or group of assets compared directly to the higher of fair value less costs to sell, and value in use. Fair value is measured at the sales price of the asset or group of assets in an arm’s length transaction. Value in use is based on the discounted future cash flows of the asset or group of assets. This approach could potentially result in write-downs where the carrying value of an asset or group of assets was previously supported under Canadian GAAP on an undiscounted cash flow basis. Furthermore, while Canadian GAAP prohibits
Some of the statements included in this MD&A constitute forward-looking statements that are based on various assumptions and are subject to various risks. See the cautionary statement contained in the Forward-Looking Statements section.
35
the reversals of impairment losses recognized in prior periods, IFRS requires such reversals to be recognized for assets other than goodwill if certain criteria are met.
Under IFRS, the Company assessed impairment for property, plant and equipment as at December 31, 2010, and December 31, 2009 (one year following the Company’s IFRS measurement date of January 1, 2009), and concluded that no impairment existed.
(iii) Consistency in Accounting Policies
IFRS requires consistency in accounting policies across subsidiaries. The Company aligned the accounting policies of all of its subsidiaries under IFRS, resulting in an adjustment on the Company’s IFRS measurement date of January 1, 2009.
(iv) Share-Based Payments
The Company issues share-based awards in the form of stock options that vest evenly over a five-year period. Under Canadian GAAP, the Company recognized the fair value of the award, determined at the time of the grants, on a straight-line basis over the five-year vesting period. Under IFRS 2, Share-Based Payments, the fair value of each tranche of the award is considered to be a separate grant based on its vesting period. The fair value of each tranche is determined separately and recognized as compensation expense over the term of its respective vesting period. Accordingly, compensation expense under IFRS will be recognized at an accelerated rate compared to Canadian GAAP.
(v) Income Taxes
Tax Effect of IFRS Accounting Adjustments Deferred income tax is adjusted to reflect the change in temporary differences resulting from the IFRS adjustments described above.
Translation of Non-Monetary Balances The Company has certain non-monetary assets and liabilities for which the tax-reporting currency is different than its functional currency. Under Canadian GAAP, any translation gains or losses arising due to the remeasurement of these items, at current exchange rates versus historic exchange rates, do not give rise to a deferred income tax asset or liability. Under IAS 12, Income Taxes, such translation gains or losses do give rise to a temporary difference that is recorded as a deferred tax asset or liability.
(vi) Cumulative Translation Account
Upon transition to IFRS, Norbord elected to reset all cumulative translation differences to zero.
(vii) Accounts Receivable Securitization
Under Canadian GAAP, the Company’s accounts receivable securitization program was treated as a true sale of accounts receivable, as the Company transferred substantially all of its present and future trade accounts receivable to a third-party trust, sponsored by a highly rated Canadian financial institution, on a fully serviced basis, for proceeds consisting of cash and deferred purchase price. Under IAS 39, Financial Instruments: Recognition and Measurement, the securitization program does not meet the criteria for a sale transaction and is treated as a financing arrangement. Accordingly, an adjustment to the balance sheet, to gross-up accounts receivable and long-term debt, is required.
(viii) Investment in a Joint Venture
In 2009 and 2010, the Company held a 50% interest in a joint-venture hardwood plywood business. This operation was non-core and represented less than 1% of total assets. Under Canadian GAAP, the Company
Some of the statements included in this MD&A constitute forward-looking statements that are based on various assumptions and are subject to various risks. See the cautionary statement contained in the Forward-Looking Statements section.
36
proportionately consolidated its 50% interest in the joint venture in the consolidated financial statements. Under IAS 31, Interests in Joint Ventures, the Company elected to account for its investment under the equity method. In the fourth quarter of 2010, the Company recorded a provision for the write-down of its 50% investment in the joint venture.
IMPACT ON FINANCIAL COVENANTS – IFRS TRANSITION The Company has committed revolving bank lines that contain two quarterly financial covenants – minimum tangible net worth of $250 million, and maximum net debt to total capitalization on a book basis of 65%. Effective January 1, 2011, the maximum net debt to total capitalization on a book basis covenant was reduced to 60%. Net debt includes total debt less cash and cash equivalents plus letters of credit issued. The Company has negotiated the following adjustments to its covenant calculations as a result of its changeover to IFRS on January 1, 2011: (i) the add-back of IFRS transitional adjustments to shareholders’ equity, as at January 1, 2011 (to a maximum of $30 million), for the purposes of the tangible net worth calculation; (ii) the deduction of accounts receivable securitization proceeds from the net debt calculation; and (iii) the exclusion of accumulated other comprehensive income (AOCI) from the tangible net worth calculation, subsequent to January 1, 2011. The Company does not expect financial covenants to be materially impacted upon the adoption of IFRS as at January 1, 2011.
SIGNIFICANT ACCOUNTING POLICIES AND ESTIMATES The Company’s significant accounting policies and estimates under Canadian GAAP are discussed below. Revenue Recognition Net sales are recognized when the risks and rewards of ownership pass to the purchaser. This is generally when goods are shipped. Sales are recorded net of third-party transportation and discounts.
Sales are governed by contract or by standard industry terms. Revenue is not recognized prior to the completion of those terms. The majority of product is shipped via third-party transport on a freight-on-board shipping point basis. In all cases, product is subject to quality testing by the Company to ensure that it meets applicable standards prior to shipment.
Inventories Inventories of raw materials and operating and maintenance supplies are valued at the lower of cost and net realizable value, with cost determined on an average cost basis.
Inventories of finished goods are valued at the lower of cost and net realizable value, with cost determined on an average cost basis. Cost includes direct material, direct labour and an allocation of overhead.
Property, Plant and Equipment Property, plant and equipment are recorded at cost, including capitalized interest. Government capital grants and investment tax credits received reduce the cost of related assets. Property and plant items include land and buildings. Buildings are depreciated on a straight-line basis over 20 to 40 years. Production equipment is depreciated using the units of production basis, effective March 29, 2009. This method amortizes the cost of equipment over the estimated units that will be produced during its estimated useful life, which ranges from 10 to 25 years. The rates of depreciation are intended to fully depreciate assets over their useful lives. These periods are assessed from time to time to ensure that they continue to approximate the useful lives of the related assets. Property, plant and equipment are tested for recoverability whenever events or changes in circumstances indicate that the carrying amount may not be recoverable. The recoverability assessment is based on the Company’s estimates and assumptions. If these estimates change in the future, the Company could be required to reduce the carrying value of property, plant and equipment, resulting in an impairment charge.
Some of the statements included in this MD&A constitute forward-looking statements that are based on various assumptions and are subject to various risks. See the cautionary statement contained in the Forward-Looking Statements section.
37
Future Income Taxes Future income tax assets and liabilities are determined based on temporary differences between the carrying amount and tax basis of assets and liabilities, as well as certain carryforward items. Future income tax assets are recognized only to the extent that, in the Company’s opinion, it is more likely than not that the future income tax assets will be realized. This opinion is based on certain estimates and assumptions. If these estimates or assumptions change in the future, the Company could be required to reduce or increase the value of the future income tax assets, resulting in income tax expense or recovery. The Company assesses recoverability of future income tax assets based on the Company’s estimates and assumptions. Future income tax assets are recorded at an amount that the Company assessed is more likely than not to be realized.
Defined Benefit Pension Plans Norbord’s defined benefit pension plans are funded in accordance with all applicable regulatory requirements. Norbord’s obligations under its defined benefit pension plans are determined periodically through actuarial valuations, which are the basis for calculating pension expense. The weighted average assumed return on assets is 7.7% and is based on management’s best estimate of the long-term expected rate of return on plan assets, including consideration of asset mix, equity risk premium and active investment management premium. The weighted average discount rate used to value year-end 2010 accrued benefit obligations is 5.1% and is based on the market yield of high-quality corporate bonds of similar duration to the pension plan liabilities.
At December 31, 2010, defined benefit pension plan assets were $59 million (2009 – $52 million) while the accrued benefit obligations were $84 million (2009 – $69 million), yielding an unfunded liability of $25 million (2009 – $17 million). Defined benefit pension expense for the year was $2 million (2009 – $2 million) and defined benefit employer contributions were $4 million (2009 – $3 million). Norbord anticipates that the 2011 net pension expense and employer contributions will not be materially different from 2010 levels.
Significant changes in assumptions, driven by changes in financial markets, asset performance different from the assumed rate of return, significant new plan enhancements, acquisitions, divestitures, changes in the regulatory environment, and the measurement uncertainty incorporated into the actuarial valuation process, could materially affect Norbord’s future plan assets, accrued benefit obligations, pension expense and pension contributions.
Stock-Based Compensation The Company accounts for stock options using the fair value method. Under this method, compensation expense for options is measured at the grant date using the Black-Scholes option pricing model, based on certain estimates and assumptions, and is recognized on a straight-line basis over the vesting period. In 2010, the Company recognized $1 million in compensation expense related to stock options (2009 – $1 million). If estimates or assumptions change in the future, the Company could be required to reduce or increase contributed surplus, resulting in compensation expense or recovery.
RISKS AND UNCERTAINTIES Norbord is exposed to a number of risks and uncertainties in the normal course of its business that could have a material adverse effect on the Company’s business, financial position, operating results and cash flows. A discussion of some of the major risks and uncertainties follows.
Product Price Sensitivities OSB accounts for almost 85% of Norbord’s panel production capacity. The price of OSB is one of the most volatile in the wood-based panels industry. Norbord’s concentration on OSB increases its sensitivity to product pricing and may result in a high degree of sales and earnings volatility.
Norbord’s financial performance is principally dependent on the selling price of its products. Most of Norbord’s products are globally traded commodities for which no liquid futures markets exist. The markets for most of
Some of the statements included in this MD&A constitute forward-looking statements that are based on various assumptions and are subject to various risks. See the cautionary statement contained in the Forward-Looking Statements section.
38
Norbord’s products are highly cyclical and characterized by periods of supply and demand imbalance, during which its product prices have tended to fluctuate significantly. In addition, since many of Norbord’s products are used for new home construction, seasonal and annual weather changes can affect demand and sales volumes. These imbalances, which may affect different areas of Norbord’s business at different times, are influenced by numerous factors that are beyond Norbord’s control and include: changes in global and regional production capacity for a particular product or group of products; changes in the end use of those products, or the increased use of substitute products; and the overall level of economic activity in the regions in which Norbord conducts business. In the past, Norbord has been negatively affected by declines in product pricing and has taken production downtime to manage working capital and minimize cash losses.
Based on operating at full capacity, the following table shows the approximate annualized impact of changes in product prices on EBITDA:
Sensitivity Factor Impact on EBITDA
(US $ millions)
OSB – North America $10 per Msf–7⁄16" 36 OSB – Europe €10 per m3 7
Competition The wood-based panels industry is a highly competitive business environment in which companies compete, to a large degree, on the basis of price. Norbord’s principal market is the US, where it competes with North American and, in some instances, foreign producers. Norbord’s European operations compete primarily with other European producers. Certain competitors may have lower cost facilities than Norbord. Norbord’s ability to compete in these and other markets is dependent on a variety of factors, such as manufacturing costs, availability of key production inputs, continued free access to markets, customer service, product quality, financial resources and currency exchange rates. In addition, competitors could develop new cost-effective substitutes for Norbord’s wood-based panels, or building codes could be changed to make the use of Norbord’s products less attractive for certain applications.
Customer Dependence Norbord sells its products primarily to major retail chains, contractor supply yards and industrial manufacturers, and faces strong competition for the business of significant customers. In 2010, Norbord had one customer whose purchases represented greater than 10% of total net sales. Norbord generally does not have contractual assurances of future sales. As a result, any significant customer order cancellations could negatively affect Norbord’s sales and earnings. Continued consolidation in the retail industry could expose Norbord to increased concentration of customer dependence and increase customers’ abilities to exert pricing pressure on Norbord.
Manufacturing Inputs Norbord is exposed to commodity price risk on most of its manufacturing inputs, which are principally comprised of wood fibre, resin and energy. These manufacturing inputs are purchased primarily on the open market in competition with other users of such resources, and prices are influenced by factors beyond Norbord’s control. Norbord may not be able to hedge the purchase price of manufacturing inputs or pass increased costs on to its customers.
Fibre Resource As Norbord does not own any timberlands, it purchases timber, wood chips and fibre as well as other wood recycled materials on the open market, in competition with other users of such resources, where prices are influenced by factors beyond Norbord’s control. Adverse weather can also limit access to logging areas, which can affect the supply of fibre to Norbord’s operations.
Some of the statements included in this MD&A constitute forward-looking statements that are based on various assumptions and are subject to various risks. See the cautionary statement contained in the Forward-Looking Statements section.
39
Norbord’s wood fibre supply comes from several different sources. In the US, roundwood logs are primarily sourced from private and industry-owned woodlands. In Europe, wood fibre is purchased from the government and private landowners. Fibre for OSB comes from roundwood logs while the MDF and particleboard mills source fibre in the form of roundwood logs, wood chips, sawdust and recycled wood. Norbord’s Canadian mills hold forestry licences and agreements to source poplar and birch from Crown timberlands in Ontario and Quebec. Most of this volume is harvested and delivered by third parties that also hold licences to operate in these areas.
The Crown licences require the payment of stumpage fees for the timber harvested, and compliance with specified rehabilitation and silvicultural management practices. The licences cover periods ranging from 20 to 25 years and are renewed or extended every five years. They can be revoked or cancelled for non-performance and contain terms and conditions that could, under certain circumstances, result in a reduction of annual allowable timber that may be harvested by Norbord without any compensation.
Labour Relations Norbord’s US employees are non-unionized while its UK and Belgian and most of its Canadian employees are unionized – representing just under one-half of the workforce. All of Norbord’s UK and Belgian union contracts are evergreen. Canadian union contracts typically cover a three- to five-year term.
In 2009, a new seven-year agreement, expiring June 30, 2016, was negotiated with the Communications, Energy and Paperworkers Union representing members at the La Sarre, Quebec, OSB mill. In 2008, a new five-year agreement, expiring December 31, 2012, was negotiated with the Teamsters Union representing members at the Val-d’Or, Quebec, OSB mill. Strikes or work stoppages could result in lost production and sales, higher costs or supply constraints if Norbord is unable to negotiate acceptable contracts with its various trade unions upon expiry.
Environmental Matters Norbord’s operations are subject to a range of general and industry-specific environmental laws and regulations relating to air emissions, wastewater discharges, solid and hazardous waste management, plant and wildlife protection and site remediation. Failure to comply with applicable environmental laws and regulations could result in fines, penalties or other enforcement actions that could impact Norbord’s production capacity or increase Norbord’s production costs. Norbord has incurred, and expects to continue to incur, capital expenditures and operating costs to comply with applicable environmental laws and regulations. In addition, environmental laws and regulations could become more stringent in the future.
Product Liability Norbord produces a variety of wood-based panels that are used in new home construction, repair and remodelling of existing homes, furniture and fixtures and industrial applications. In the normal course of business, the end users of Norbord’s products have in the past made, and could in the future make, claims with respect to the fitness for use of its products, or related to product quality or performance issues. Norbord could face increased costs if any future claims exceed purchased insurance coverage.
Natural Events Norbord’s business is exposed to numerous natural events, such as forest fires, adverse weather conditions, insect infestation, disease, prolonged drought and other natural disasters, that are not insurable events. If such an event occurs, Norbord may need to curtail production or incur increased fibre or other costs.
Capital Intensity The production of wood-based panels is capital intensive. There can be no assurance that key pieces of equipment will not need to be repaired or replaced. In certain circumstances, the costs of repairing or replacing equipment, and the associated downtime of the affected production line, may not be insurable.

Some of the statements included in this MD&A constitute forward-looking statements that are based on various assumptions and are subject to various risks. See the cautionary statement contained in the Forward-Looking Statements section.
40
Tax Exposures Norbord takes various tax-filing positions in the normal course of business, and there can be no assurance that tax authorities will not challenge such filing positions. In addition, Norbord is subject to further uncertainties concerning the interpretation and application of tax laws in various operating jurisdictions. Norbord maintains reserves for known estimated tax exposures in all jurisdictions. These exposures are settled primarily through the closure of audits with the jurisdictional taxing authorities. However, future settlements could differ materially from the Company’s reserves.
Currency Exposures Norbord reports its financial results in US dollars. A portion of Norbord’s product prices and costs are influenced by relative currency values (particularly the Canadian dollar, Pound Sterling and Euro). Significant fluctuations in relative currency values could negatively affect the cost competitiveness of Norbord’s facilities, the value of its foreign investments, the results of its operations and its financial position.
Norbord’s foreign exchange exposure arises from the following sources: • Net investments in self-sustaining foreign operations, limited to Norbord’s investment in its
European operations • Net Canadian dollar-denominated monetary assets and liabilities • Committed or anticipated foreign currency denominated transactions, primarily Canadian dollar costs in
Norbord’s Canadian operations and Euro revenues in Norbord’s UK operations
ASSESSMENT AND CHANGES IN INTERNAL CONTROLS AND DISCLOSURE CONTROLS OVER FINANCIAL REPORTING In accordance with the requirements of National Instrument 52-109 Certification of Disclosure in Issuers’ Annual and Interim Filings, the Company’s management, including the Chief Executive Officer (CEO) and Chief Financial Officer (CFO), has evaluated the operating effectiveness of the Company’s internal control over financial reporting. Management of Norbord is responsible for establishing and maintaining adequate internal control over financial reporting. Internal control over financial reporting is a process designed by, or under the supervision of, the CEO and CFO, and it is effected by management and other personnel to provide reasonable assurance regarding the reliability of financial reporting and the preparation of financial statements for external purposes in accordance with GAAP. Management assessed the effectiveness of the Company’s internal control over financial reporting as of December 31, 2010. Based on this assessment, management believes that, as of December 31, 2010, the Company’s internal control over financial reporting is operating effectively. Management determined that there were no material weaknesses in the Company’s internal control over financial reporting as of December 31, 2010. There have been no changes in Norbord’s internal control over financial reporting during the year ended December 31, 2010, that have materially affected, or are reasonably likely to materially affect, its internal control over financial reporting.
Disclosure controls and procedures are designed to provide reasonable assurance that all relevant information is gathered and reported to senior management, including the CEO and CFO, on a timely basis so that appropriate decisions can be made regarding annual and interim financial statement disclosure. An evaluation of the effectiveness of the design and operation of disclosure controls and procedures was conducted as of December 31, 2010 by Norbord’s management, including the CEO and CFO. Based on this evaluation, the CEO and CFO have concluded that Norbord’s disclosure controls and procedures, as defined in National Instrument 52-109 Certification of Disclosure in Issuers’ Annual and Interim Filings, are effective
NON-GAAP FINANCIAL MEASURES The following non-GAAP financial measures have been used in this MD&A. Non-GAAP financial measures do not have any standardized meaning prescribed by GAAP and are, therefore, unlikely to be comparable to similar measures presented by other companies. Each non-GAAP financial measure is defined below. Where

Some of the statements included in this MD&A constitute forward-looking statements that are based on various assumptions and are subject to various risks. See the cautionary statement contained in the Forward-Looking Statements section.
41
appropriate, a quantitative reconciliation of the non-GAAP financial measure to the most directly comparable GAAP measure is provided.
EBITDA is earnings determined in accordance with GAAP from continuing operations before interest, provision for non-core operation, foreign exchange loss, litigation settlement, income tax, depreciation and amortization. As Norbord operates in a cyclical commodity business, it interprets EBITDA over the cycle as a useful indicator of the Company’s ability to incur and service debt and meet capital expenditure requirements. In addition, Norbord views EBITDA as a measure of gross profit and interprets EBITDA trends as indicators of relative operating performance.
The following table reconciles EBITDA to the most directly comparable GAAP measure:
(US $ millions) 2010 2009 2008 2007 2006
Earnings $17 $(58) $(115) $(45) $97Add: Interest expense 34 36 49 49 29 Less: Interest and other income – – (3) (5) (3) Add: Provision for non-core operation 6 4 4 – 13 Add: Foreign exchange loss – 3 – – –Add: Litigation settlement – – 32 – – Add: Depreciation 45 48 68 88 94Add: Income tax expense (recovery) 3 (33) (95) (45) 17EBITDA $105 $– $(60) $42 $247
EBITDA margin (%) is EBITDA as a percentage of net sales. When compared with industry statistics and prior periods, EBITDA margin can be a useful indicator of operating efficiency and a company’s ability to compete successfully with its peers. Norbord interprets EBITDA margin trends as indicators of relative operating performance.
Operating working capital is accounts receivable plus inventory less accounts payable and accrued liabilities. Operating working capital is a measure of the investment in accounts receivable, inventory, accounts payable and accrued liabilities required to support operations. The Company aims to minimize its investment in operating working capital; however, the amount will vary with seasonality and sales expansions and contractions.
(US $ millions) 2010 2009 2008 2007 2006
Accounts receivable $30 $27 $12 $83 $130Inventory 79 71 81 131 98Accounts payable and accrued liabilities (166) (140) (146) (191) (228)Operating working capital $(57) $(42) $(53) $23 $–
Total working capital is operating working capital plus cash and cash equivalents and tax receivable.
(US $ millions) 2010 2009 2008 2007 2006
Operating working capital $(57) $(42) $(53) $23 $–Cash and cash equivalents 113 21 20 128 20Tax receivable 6 57 13 89 33Total working capital $62 $36 $(20) $240 $53

Some of the statements included in this MD&A constitute forward-looking statements that are based on various assumptions and are subject to various risks. See the cautionary statement contained in the Forward-Looking Statements section.
42
Capital employed is the sum of property, plant and equipment; operating working capital; tax receivable and other assets less any unrealized balance sheet losses included in other liabilities. Capital employed is a measure of the total investment in a business in terms of property, plant, equipment; operating working capital; tax receivable and other assets.
(US $ millions) 2010 2009 2008 2007 2006
Property, plant and equipment $821 $860 $885 $968 $1,008Accounts receivable 30 27 12 83 130Tax receivable 6 57 13 89 33Inventory 79 71 81 131 98Accounts payable and accrued liabilities (166) (140) (146) (191) (228)Other assets 13 7 33 5 7Unrealized net investment hedge losses(1) – – (8) (8) (25)Capital employed $783 $882 $870 $1,077 $1,023
(1) Included in other liabilities.
ROCE (return on capital employed) is EBITDA divided by average capital employed. ROCE is a measurement of financial performance that focuses on cash generation and the efficient use of capital. As Norbord operates in a cyclical commodity business, it interprets ROCE over the cycle as a useful means of comparing businesses in terms of efficiency of management and viability of products. Norbord targets top-quartile ROCE among North American forest products companies over the cycle.
ROE (return on common equity) is earnings available to common shareholders divided by common shareholders’ equity. ROE is a measure that allows common shareholders to determine how effectively their invested capital is being employed. As Norbord operates in a cyclical commodity business, it looks at ROE over the cycle and targets top-quartile performance among North American forest products companies.
Total shareholder return is a useful measure of the return on an investment in Norbord common shares, including share-price appreciation and dividends. The calculation assumes the reinvestment of all dividends in shares of Norbord.
Net debt is the principal value of long-term debt, including the current portion less drawings under the Brookfield debt facility and cash and cash equivalents. Net debt is a useful indicator of a company’s debt position. Net debt comprises:
(US $ millions) 2010 2009 2008 2007 2006
Long-term debt $440 $467 $532 $478 $480Cash and cash equivalents (113) (21) (20) (128) (20) Drawings under Brookfield debt facility(1) – – (35) – –Current portion of long-term debt – – – 197 –Net debt 327 446 477 547 460 Add: Letters of credit 10 8 – – – Net debt for financial covenant purposes $337 $454 $477 $547 $460
(1) Facility was cancelled in July 2010.

Some of the statements included in this MD&A constitute forward-looking statements that are based on various assumptions and are subject to various risks. See the cautionary statement contained in the Forward-Looking Statements section.
43
Tangible net worth consists of shareholders’ equity and drawings under the Brookfield debt facility. A minimum tangible net worth is one of two financial covenants contained in the Company’s committed bank lines.
(US $ millions) 2010 2009 2008 2007 2006
Shareholders’ equity $352 $334 $268 $360 $434 Add: Drawings under Brookfield debt facility(1) – – 35 – – Tangible net worth $352 $334 $303 $360 $434
(1) Facility was cancelled in July 2010.
Net debt to capitalization, book basis is net debt divided by the sum of net debt and tangible net worth. Net debt to capitalization on a book basis is a measure of a company’s relative debt position. Norbord interprets this measure as an indicator of the relative strength and flexibility of its balance sheet. In addition, a maximum net debt to capitalization on a book basis is one of two financial covenants contained in the Company’s committed bank lines.
Net debt to capitalization, market basis is net debt divided by the sum of net debt and market capitalization. Market capitalization is the number of common shares outstanding at period end multiplied by the trailing 12-month average per share market price. Market basis capitalization is intended to correct for the low historical book value of Norbord’s asset base relative to its fair value. Net debt to capitalization on a market basis is a key measure of a company’s relative debt position, and Norbord interprets this measure as an indicator of the relative strength and flexibility of its balance sheet. While the Company considers both book and market basis metrics, it believes the market basis to be superior to the book basis in measuring the true strength and flexibility of its balance sheet.

Some of the statements included in this MD&A constitute forward-looking statements that are based on various assumptions and are subject to various risks. See the cautionary statement contained in the Forward-Looking Statements section.
44
FORWARD-LOOKING STATEMENTS This document includes forward-looking statements, as defined by applicable securities legislation. Often, but not always, forward-looking statements can be identified by the use of words such as “believes,” “expects,” “does not expect,” “is expected,” “targets,” “outlook,” “plans,” “scheduled,” “estimates,” “forecasts,” “intends,” “anticipates” or “does not anticipate” or variations of such words and phrases or statements that certain actions, events or results “may,” “could,” “would,” “might” or “will” be taken, occur or be achieved. Forward-looking statements involve known and unknown risks, uncertainties and other factors which may cause the actual results, performance or achievements of Norbord to be materially different from any future results, performance or achievements expressed or implied by the forward-looking statements.
Examples of such statements include, but are not limited to, comments with respect to: (1) outlook for the markets for products; (2) expectations regarding future product pricing; (3) outlook for operations; (4) expectations regarding mill capacity; (5) objectives; (6) strategies to achieve those objectives; (7) expected financial results; (8) sensitivity to changes in product prices, such as the price of OSB; (9) sensitivity to key input prices, such as the price of natural gas; (10) sensitivity to changes in foreign exchange rates; (11) expectations regarding income tax rates; (12) expectations regarding compliance with environmental regulations; (13) expectations regarding contingent liabilities and guarantees, including the outcome of pending litigation; and (14) expectations regarding the amount, timing and benefits of capital investments.
Although Norbord believes it has a reasonable basis for making these forward-looking statements, readers are cautioned not to place undue reliance on such forward-looking information. By its nature, forward-looking information involves numerous assumptions, inherent risks and uncertainties, both general and specific, which contribute to the possibility that the predictions, forecasts and other forward-looking statements will not occur. These factors include, but are not limited to: (1) assumptions in connection with the economic and financial conditions in the US, Europe, Canada and globally; (2) risks inherent to product concentration; (3) effects of competition and product pricing pressures; (4) risks inherent to customer dependence; (5) effects of variations in the price and availability of manufacturing inputs, including continued access to fibre resources at competitive prices; (6) various events which could disrupt operations, including natural events and ongoing relations with employees; (7) impact of changes to, or non-compliance with, environmental regulations; (8) impact of any product liability claims in excess of insurance coverage; (9) risks inherent to a capital intensive industry; (10) impact of future outcome of certain tax exposures; and (11) effects of currency exposures and exchange rate fluctuations.
The above list of important factors affecting forward-looking information is not exhaustive. Additional factors are noted elsewhere, and reference should be made to the other risks discussed in filings with Canadian securities regulatory authorities. Except as required by applicable law, Norbord does not undertake to update any forward-looking statements, whether written or oral, that may be made from time to time by, or on behalf of, the Company, whether as a result of new information, future events or otherwise, or to publicly update or revise the above list of factors affecting this information.

JANUARY 28, 2011
Management’s Responsibility for the Financial Statements
The accompanying consolidated financial statements and all information in this annual report are the responsibility of management and have been approved by the Board of Directors.
The consolidated financial statements have been prepared by management in accordance with Canadian generally accepted accounting principles. Financial statements are not precise since they include certain amounts based upon estimates and judgements. When alternative methods exist, management has chosen those it deems to be the most appropriate in the circumstances in order to ensure that the consolidated financial statements are presented fairly, in all material respects, in accordance with Canadian generally accepted accounting principles.
The Company maintains systems of internal controls, which are designed to provide reasonable assurance that accounting records are reliable and to safeguard the Company’s assets.
The Board of Directors is responsible for ensuring that management fulfills its responsibilities for financial reporting and is ultimately responsible for reviewing and approving the financial statements. The Board carries out this responsibility principally through its Audit Committee.
The Audit Committee is appointed by the Board and reviews the consolidated financial statements and Management’s Discussion and Analysis, considers the report of the external auditors, assesses the adequacy of the internal controls of the Company, approves the services provided by the external auditors, examines the fees and expenses for audit services, and recommends to the Board the independent auditors for appointment by the shareholders. The Committee reports its findings to the Board of Directors for consideration when approving the consolidated financial statements for issuance to the shareholders.
January 28, 2011
J. BARRIE SHINETON ROBIN E. LAMPARD President and Chief Executive Officer Senior Vice President and Chief Financial Officer
45

Independent Auditors’ Report
To the Shareholders of Norbord Inc. We have audited the accompanying consolidated financial statements of Norbord Inc., which comprise the consolidated balance sheets as at December 31, 2010 and December 31, 2009, the consolidated statements of earnings, changes in shareholders’ equity and comprehensive income, and cash flows for the years then ended, and notes, comprising a summary of significant accounting policies and other explanatory information. Management’s Responsibility for the Consolidated Financial Statements Management is responsible for the preparation and fair presentation of these consolidated financial statements in accordance with Canadian generally accepted accounting principles, and for such internal control as management determines is necessary to enable the preparation of consolidated financial statements that are free from material misstatement, whether due to fraud or error. Auditors’ Responsibility Our responsibility is to express an opinion on these consolidated financial statements based on our audits. We conducted our audits in accordance with Canadian generally accepted auditing standards. Those standards require that we comply with ethical requirements and plan and perform the audit to obtain reasonable assurance about whether the consolidated financial statements are free from material misstatement. An audit involves performing procedures to obtain audit evidence about the amounts and disclosures in the consolidated financial statements. The procedures selected depend on our judgment, including the assessment of the risks of material misstatement of the consolidated financial statements, whether due to fraud or error. In making those risk assessments, we consider internal control relevant to the entity’s preparation and fair presentation of the consolidated financial statements in order to design audit procedures that are appropriate in the circumstances, but not for the purpose of expressing an opinion on the effectiveness of the entity’s internal control. An audit also includes evaluating the appropriateness of accounting policies used and the reasonableness of accounting estimates made by management, as well as evaluating the overall presentation of the consolidated financial statements. We believe that the audit evidence we have obtained in our audits is sufficient and appropriate to provide a basis for our audit opinions. Opinion In our opinion, the consolidated financial statements present fairly, in all material respects, the financial position of Norbord Inc. as at December 31, 2010 and December 31, 2009, and the results of its operations and its cash flows for the years then ended in accordance with Canadian generally accepted accounting principles.
KPMG LLP Chartered Accountants, Licensed Public Accountants January 27, 2011 Toronto, Ontario
46

Consolidated Statements of Earnings
Years Ended December 31 (US $ millions, except per share information) 2010 2009
Net sales $892 $718Earnings before interest, income tax, depreciation, provision for non-core
operation, and foreign exchange loss
105
–Interest expense (notes 3 and 7) (34) (36)Provision for non-core operation (note 11) (6) (4)Foreign exchange loss – (3) Earnings before income tax and depreciation 65 (43) Depreciation (45) (48)Income tax (note 12) (3) 33Earnings $17 $(58)
Earnings per common share (note 10) Basic $0.39 $(1.35) Diluted 0.38 (1.35)
(See accompanying notes)
47
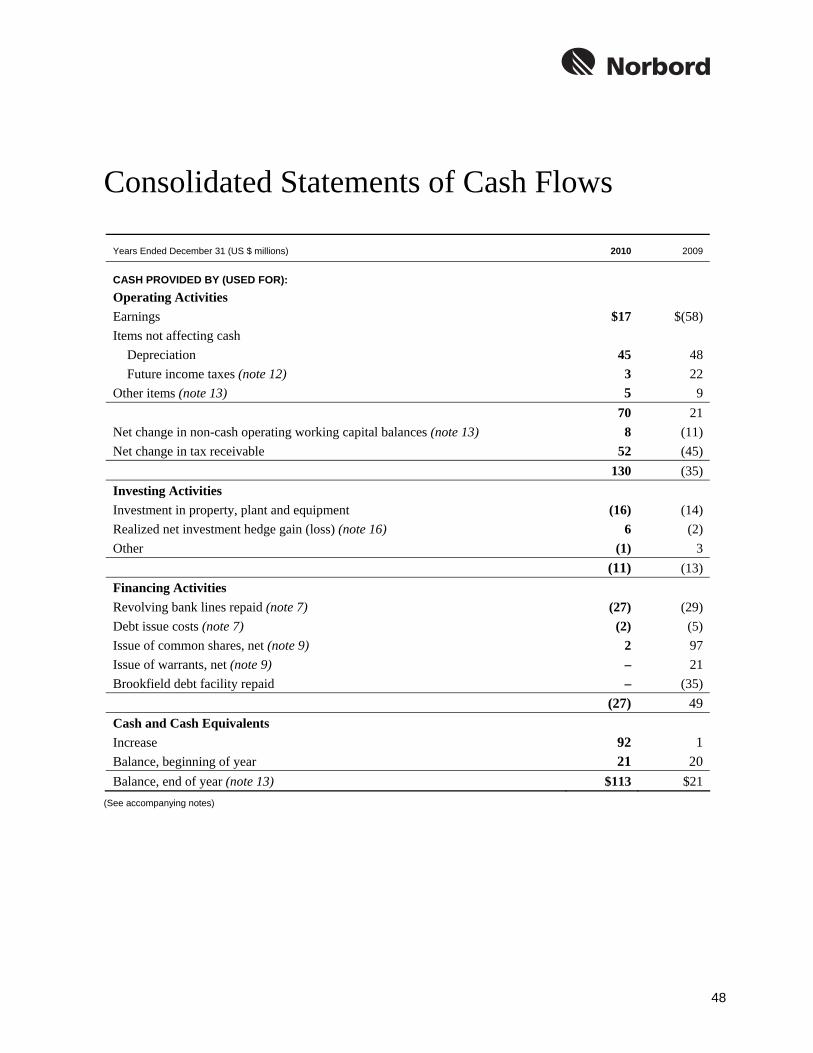
Consolidated Statements of Cash Flows
Years Ended December 31 (US $ millions) 2010 2009
CASH PROVIDED BY (USED FOR):
Operating Activities Earnings $17 $(58)Items not affecting cash
Depreciation 45 48 Future income taxes (note 12) 3 22
Other items (note 13) 5 9 70 21Net change in non-cash operating working capital balances (note 13) 8 (11)Net change in tax receivable 52 (45) 130 (35)Investing Activities Investment in property, plant and equipment (16) (14)Realized net investment hedge gain (loss) (note 16) 6 (2)Other (1) 3 (11) (13) Financing Activities Revolving bank lines repaid (note 7) (27) (29) Debt issue costs (note 7) (2) (5) Issue of common shares, net (note 9) 2 97 Issue of warrants, net (note 9) – 21 Brookfield debt facility repaid – (35) (27) 49 Cash and Cash Equivalents Increase 92 1Balance, beginning of year 21 20 Balance, end of year (note 13) $113 $21
(See accompanying notes)
48

Consolidated Balance Sheets
As at December 31 (US $ millions) 2010 2009
Assets Current assets
Cash and cash equivalents (note 13) $113 $21 Accounts receivable (note 3) 30 27 Tax receivable (note 12) 6 57 Inventory (note 4) 79 71
228 176
Property, plant and equipment (note 5) 821 860 Other assets (note 6) 13 7 $1,062 $1,043
Liabilities and Shareholders’ Equity Current liabilities
Accounts payable and accrued liabilities $166 $140 Long-term debt (note 7) 443 471 Other liabilities (note 8) 7 9 Future income taxes (note 12) 94 89 Shareholders’ equity (note 9) 352 334 $1,062 $1,043
(See accompanying notes)
On behalf of the Board:
ROBERT J. HARDING J. BARRIE SHINETON Chair President and Chief Executive Officer
49

Consolidated Statements of Changes in Shareholders’ Equity and Comprehensive Income (Loss)
Years Ended December 31 (US $ millions) 2010 2009
CONSOLIDATED STATEMENTS OF CHANGES IN SHAREHOLDERS’ EQUITY
Share Capital Balance, beginning of year $335 $238Issue of common shares, net (note 9) 5 97Balance, end of year 340 335
Contributed Surplus Balance, beginning of year 39 17Issue of warrants, net (note 9) – 21Stock-based compensation (note 9) 1 1 Balance, end of year 40 39
Retained Earnings Balance, beginning of year (32) 26Earnings 17 (58)Balance, end of year (15) (32)
Accumulated Other Comprehensive Income (Loss) Balance, beginning of year (8) (13) Other comprehensive income (loss) (5) 5Balance, end of year (13) (8)
Shareholders’ equity $352 $334
CONSOLIDATED STATEMENTS OF COMPREHENSIVE INCOME (LOSS) Earnings $17 $(58)Other comprehensive income (loss)
Foreign currency translation (3) –Future income taxes (2) 5
Comprehensive income (loss) $12 $(53)(See accompanying notes)
50

Notes to the Consolidated Financial Statements (In US $, unless otherwise noted)
In these notes, “Norbord” means Norbord Inc. and all of its consolidated subsidiaries and affiliates, and “Company” means Norbord Inc. as a separate corporation, unless the context implies otherwise. “Brookfield” means Brookfield Asset Management Inc. or any of its consolidated subsidiaries and affiliates, a related party, by virtue of a controlling equity interest in the Company.
NOTE 1. ACCOUNTING POLICIES Basis of Presentation The consolidated financial statements include the accounts of the Company and all of its subsidiaries.
Use of Estimates The preparation of financial statements in conformity with Canadian generally accepted accounting principles (GAAP) requires management to make estimates and assumptions that affect the reported amounts of assets and liabilities and the disclosure of contingent assets and liabilities at the date of the financial statements and the reported amounts of revenues and expenses during the reporting period. Actual results could differ from those estimates. Significant estimates are required in assessing net recoverable amounts and net realizable values, depreciation, tax and other provisions, hedge effectiveness and fair value.
Cash and Cash Equivalents Cash and cash equivalents consist of demand deposits and investment grade money market securities and bank term deposits with maturities of 90 days or less from the date of purchase. Cash and cash equivalents are recorded at cost, which approximates market value.
Inventories Inventories of raw materials and operating and maintenance supplies are valued at the lower of cost and net realizable value, with cost determined on an average cost basis.
Inventories of finished goods are valued at the lower of cost and net realizable value, with cost determined on an average cost basis. Cost includes direct material, direct labour, an allocation of overhead and depreciation.
Property, Plant and Equipment Property, plant and equipment are recorded at cost. Property and plant includes land and buildings. Buildings are depreciated on a straight-line basis over 20 to 40 years. Production equipment is depreciated using the units of production basis, effective March 29, 2009. This method amortizes the cost of equipment over the estimated units that will be produced during its estimated useful life, which ranges from 10 to 25 years. The rates of depreciation are intended to fully depreciate these assets over their useful lives. These periods are assessed from time to time to ensure that they continue to approximate the useful lives of the related assets. Property, plant and equipment are tested for recoverability whenever events or changes in circumstances indicate that the carrying amount may not be recoverable. The recoverability assessment is based on the Company’s estimates and assumptions. If these estimates change in the future, the Company could be required to reduce the carrying value of property, plant and equipment, resulting in an impairment charge.
Employee Future Benefits Norbord sponsors various defined benefit and defined contribution pension plans, which cover substantially all employees and are funded in accordance with applicable plan and regulatory requirements. The benefits under
51

Norbord’s defined benefit pension plans are generally based on an employee’s length of service and the final five years’ average salary, and the plans do not provide for indexation of benefit payments.
The measurement date for all defined benefit pension plans is December 31. The obligations associated with Norbord’s defined benefit pension plans are actuarially valued using the projected unit credit method, pro-rated on services, management’s best estimate assumptions for long-term expected rate of return on plan assets, salary escalation, life expectancy and a current market discount rate. For the purpose of calculating the expected return on plan assets, those assets are measured at fair value. Prior service costs related to plan amendments and transitional assets are amortized on a straight-line basis over the estimated average remaining service lives (EARSL) of the employee groups. The net actuarial gains or losses in excess of 10% of the greater of the accrued benefit obligation and the fair value of plan assets are amortized on a straight-line basis over EARSL, which is known as the “corridor” method.
Financial Instruments The Company utilizes derivative financial instruments solely to manage its foreign currency, interest rate and commodity price exposures in the ordinary course of business. Derivatives are not used for trading or speculative purposes. All hedging relationships, risk management objectives and hedging strategies are formally documented and periodically assessed to ensure that the changes in the value of these derivatives are highly effective in offsetting changes in the fair values, net investments or cash flows of the hedged exposures. Accordingly, all gains and losses (realized and unrealized, as applicable) on such derivatives are recognized in the same manner as gains and losses on the underlying exposure being hedged. Any resulting carrying amounts are included in other assets if there is an unrealized gain on the derivative, or in other liabilities if there is an unrealized loss on the derivative.
The fair values of the Company’s derivative financial instruments are determined by using quoted prices in active markets for identical assets and liabilities. These fair values reflect the estimated amount that the Company would have paid or received if required to settle all outstanding contracts at year-end. This fair value represents a point-in-time estimate that may not be relevant in predicting the Company’s future earnings or cash flows.
The Company is exposed to credit risk in the event of non-performance by its derivative counterparties. However, the Company’s Board-approved financial policies require that derivative transactions be executed only with approved, highly rated counterparties under master netting agreements, therefore, the Company does not anticipate any non-performance. The fair value measurements of the Company’s derivative financial instruments are classified as Level 2 of a three-level hierarchy as fair value of these derivative instruments is based on observable market inputs.
The carrying value of the Company’s non-derivative financial instruments approximates fair value, except where disclosed in these notes. Fair values disclosed are determined using actual quoted market prices or, if not available, indicative prices based on similar publicly-traded instruments.
Debt Issue Costs The Company accounts for transaction costs that are directly attributable to the issuance of long-term debt by deducting such costs from the carrying value of the long-term debt. The capitalized transaction costs are amortized to earnings on a straight-line basis over the term of the related long-term debt.
Income Taxes The Company uses the asset and liability method of accounting for income taxes. Accordingly, future tax assets and liabilities are recognized for the future tax consequences attributable to differences between the financial statement carrying amounts of existing assets and liabilities, and their respective tax bases. Future tax assets and liabilities are measured using enacted or substantively enacted tax rates expected to apply to taxable income in the years in which those temporary differences are expected to be recovered or settled. In addition, the effect on
52

future tax assets and liabilities of a change in tax rates is recognized in income in the year that includes the enactment or substantive enactment date. The Company assesses recoverability of future income tax assets based on the Company’s estimates and assumptions. Future income tax assets are recorded at an amount that the Company considers is more likely than not to be realized.
Stock Options The Company accounts for stock options using the fair value method. Under the fair value method, compensation expense for options is measured at the grant date using the Black-Scholes option pricing model and recognized in earnings on a straight-line basis over the vesting period.
Warrants The Company accounts for warrants using the fair value method. Under the fair value method, the value of warrants is measured at the issue date using the Black-Scholes option pricing model, reduced by any related-issue costs.
Revenue Recognition Net sales are recognized when the risks and rewards of ownership pass to the purchaser. This is generally when goods are shipped. Sales are recorded net of third-party transportation and discounts.
Sales are governed by contract or by standard industry terms. Revenue is not recognized prior to the completion of those terms. The majority of product is shipped via third-party transport on a freight-on-board shipping point basis. In all cases, product is subject to quality testing by the Company to ensure it meets applicable standards prior to shipment.
Translation of Foreign Currencies These consolidated financial statements are presented in US dollars, which is the Company’s functional currency. The accounts of self-sustaining subsidiaries that have a functional currency other than the US dollar are translated using the current rate method. Gains or losses on translation are deferred and included in accumulated other comprehensive income. Gains or losses on foreign currency-denominated balances and transactions that are designated as hedges of net investments in these subsidiaries are reported in the same manner as translation adjustments.
Monetary assets and liabilities of integrated operations denominated in currencies other than an entity’s functional currency are translated at the rate of exchange prevailing at year-end. Gains or losses on translation of these items are included in the consolidated statements of earnings. Gains or losses on transactions that hedge these items are also included in the consolidated statements of earnings.
Gains or losses on transactions that serve to hedge future foreign currency-denominated cash flows are recognized and reported in the same manner as the cash flows being hedged.
53
NOTE 2. FUTURE CHANGES IN ACCOUNTING POLICIES
International Financial Reporting Standards In February 2008, the Accounting Standards Board (AcSB) confirmed that International Financial Reporting Standards (IFRS) will replace Canadian GAAP for publicly accountable enterprises for financial periods beginning on or after January 1, 2011. The Company will adopt IFRS for the year ending December 31, 2011.
Business Combinations In January 2009, the Canadian Institute of Chartered Accountants (CICA) issued Handbook Section 1582, Business Combinations, which requires that all assets and liabilities of an acquired business be recorded at fair value at the acquisition date. Obligations for contingent consideration and contingencies will also be recorded at fair value at the acquisition date. The standard also states that acquisition-related costs will be expensed as incurred and that restructuring charges will be expensed in periods after the acquisition date. The new standard applies prospectively to business combinations for which the acquisition date is on or after the beginning of the first annual reporting period on or after January 1, 2011. The Company will apply this new standard at the time of any applicable acquisitions.
Consolidations and Non-Controlling Interests In January 2009, the CICA issued Handbook Section 1601, Consolidations, and Section 1602, Non-Controlling Interests. Section 1601 establishes standards for the preparation of consolidated financial statements. Section 1602 establishes standards for accounting for a non-controlling interest in a subsidiary in the consolidated financial statements, subsequent to a business combination. These standards apply to interim and annual consolidated financial statements relating to fiscal years beginning on or after January 1, 2011. The Company does not expect these new standards to have any impact on the financial statements.
NOTE 3. ACCOUNTS RECEIVABLE In June 2010, the Company entered into an $85 million accounts receivable securitization program to sell its receivables to a third-party trust, sponsored by a highly rated Canadian financial institution, to replace the preceding program. The program has an evergreen commitment that is subject to termination on 12 months’ notice. Under the program, Norbord has transferred substantially all of its present and future trade accounts receivable to the trust, on a fully serviced basis, for proceeds consisting of cash and deferred purchase price. At December 31, 2010, Norbord recorded cash proceeds of $60 million (2009 – $62 million) relating to this program. The utilization charge, which is based on money market rates plus a margin, and other program fees are recorded as interest expense. In 2010, the utilization charge and program fees included in interest expense totalled $1 million (2009 – $2 million).
The securitization program contains no financial covenants; however, the program is subject to minimum credit-rating requirements. The Company must maintain a long-term issuer credit rating of at least single B(mid) or the equivalent. As at January 28, 2011, Norbord’s ratings were BB(low) (Dominion Bond Rating Service), BB- (Standard & Poor’s Ratings Services) and Ba3 (Moody’s Investors Service).
54

NOTE 4. INVENTORY
(US $ millions) 2010 2009
Raw materials $18 $13 Finished goods 38 33 Operating and maintenance supplies 23 25 $79 $71
As at December 31, 2010, the provision to reflect inventories at the lower of cost and net realizable value was less than $1 million (2009 – $1 million).
The amount of inventory recognized as an expense during the year was:
(US $ millions) 2010 2009
Cost of inventories $743 $680 Depreciation on property, plant and equipment 45 47 $788 $727
NOTE 5. PROPERTY, PLANT AND EQUIPMENT
(US $ millions) 2010 2009
CostAccumulated Depreciation
Net Book Value Cost
Accumulated Depreciation
Net Book Value
Land $11 $ – $11 $12 $ – $12Buildings 232 121 111 236 116 120 Production equipment 1,460 761 699 1,495 767 728 $1,703 $882 $821 $1,743 $883 $860
NOTE 6. OTHER ASSETS
(US $ millions) 2010 2009
Unrealized interest rate swap gains (note 16) $5 $4Unrealized net investment hedge gains (note 16) 3 2 Unrealized monetary hedge gains (note 16) 2 – Other 3 1 $13 $7
The unrealized interest rate swap gains, unrealized net investment hedge gains and unrealized monetary hedge gains are offset by unrealized losses on the underlying exposures being hedged.
55
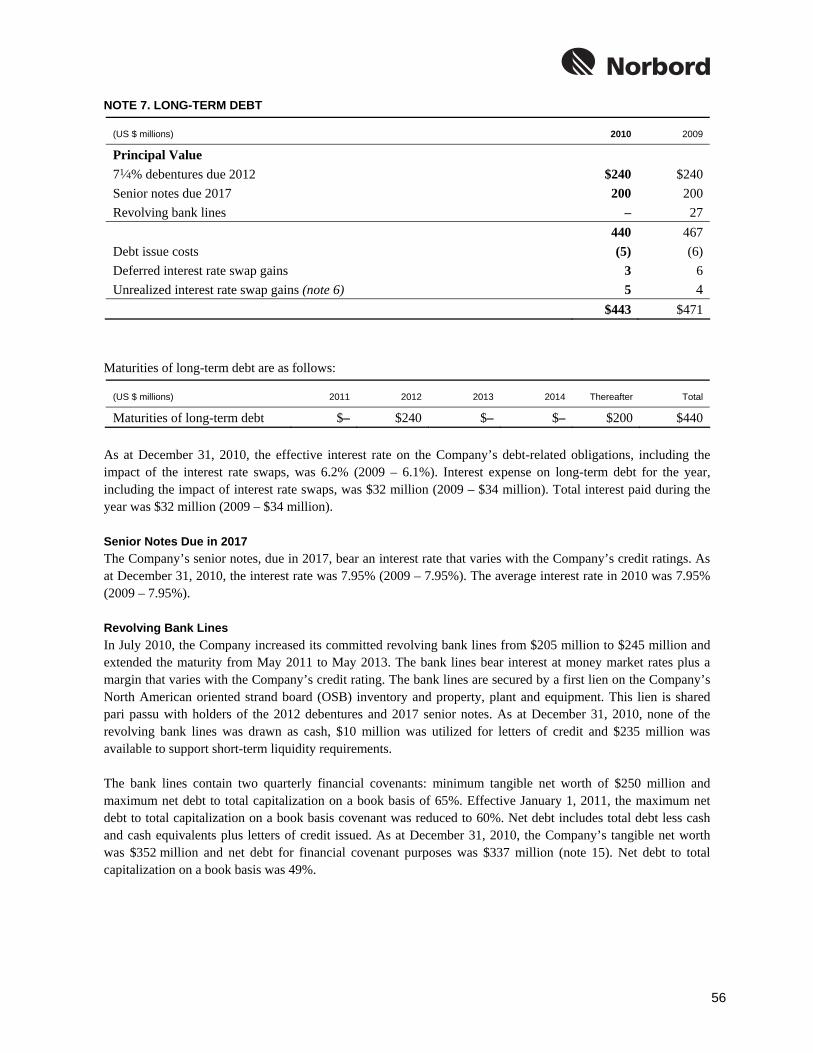
NOTE 7. LONG-TERM DEBT
(US $ millions) 2010 2009
Principal Value 71⁄4% debentures due 2012 $240 $240Senior notes due 2017 200 200Revolving bank lines – 27 440 467 Debt issue costs (5) (6)Deferred interest rate swap gains 3 6 Unrealized interest rate swap gains (note 6) 5 4 $443 $471
Maturities of long-term debt are as follows:
(US $ millions) 2011 2012 2013 2014 Thereafter Total
Maturities of long-term debt $– $240 $– $– $200 $440 As at December 31, 2010, the effective interest rate on the Company’s debt-related obligations, including the impact of the interest rate swaps, was 6.2% (2009 – 6.1%). Interest expense on long-term debt for the year, including the impact of interest rate swaps, was $32 million (2009 – $34 million). Total interest paid during the year was $32 million (2009 – $34 million).
Senior Notes Due in 2017 The Company’s senior notes, due in 2017, bear an interest rate that varies with the Company’s credit ratings. As at December 31, 2010, the interest rate was 7.95% (2009 – 7.95%). The average interest rate in 2010 was 7.95% (2009 – 7.95%).
Revolving Bank Lines In July 2010, the Company increased its committed revolving bank lines from $205 million to $245 million and extended the maturity from May 2011 to May 2013. The bank lines bear interest at money market rates plus a margin that varies with the Company’s credit rating. The bank lines are secured by a first lien on the Company’s North American oriented strand board (OSB) inventory and property, plant and equipment. This lien is shared pari passu with holders of the 2012 debentures and 2017 senior notes. As at December 31, 2010, none of the revolving bank lines was drawn as cash, $10 million was utilized for letters of credit and $235 million was available to support short-term liquidity requirements. The bank lines contain two quarterly financial covenants: minimum tangible net worth of $250 million and maximum net debt to total capitalization on a book basis of 65%. Effective January 1, 2011, the maximum net debt to total capitalization on a book basis covenant was reduced to 60%. Net debt includes total debt less cash and cash equivalents plus letters of credit issued. As at December 31, 2010, the Company’s tangible net worth was $352 million and net debt for financial covenant purposes was $337 million (note 15). Net debt to total capitalization on a book basis was 49%.
56
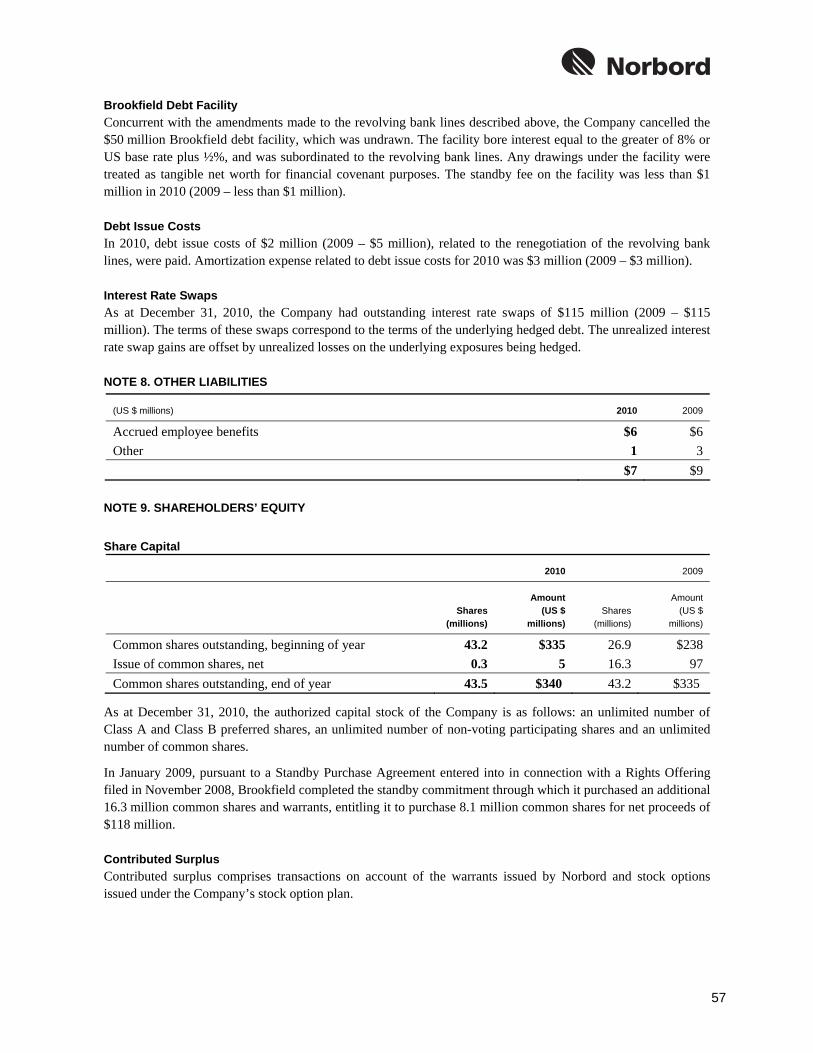
Brookfield Debt Facility Concurrent with the amendments made to the revolving bank lines described above, the Company cancelled the $50 million Brookfield debt facility, which was undrawn. The facility bore interest equal to the greater of 8% or US base rate plus ½%, and was subordinated to the revolving bank lines. Any drawings under the facility were treated as tangible net worth for financial covenant purposes. The standby fee on the facility was less than $1 million in 2010 (2009 – less than $1 million).
Debt Issue Costs In 2010, debt issue costs of $2 million (2009 – $5 million), related to the renegotiation of the revolving bank lines, were paid. Amortization expense related to debt issue costs for 2010 was $3 million (2009 – $3 million).
Interest Rate Swaps As at December 31, 2010, the Company had outstanding interest rate swaps of $115 million (2009 – $115 million). The terms of these swaps correspond to the terms of the underlying hedged debt. The unrealized interest rate swap gains are offset by unrealized losses on the underlying exposures being hedged.
NOTE 8. OTHER LIABILITIES
(US $ millions) 2010 2009
Accrued employee benefits $6 $6 Other 1 3 $7 $9
NOTE 9. SHAREHOLDERS’ EQUITY
Share Capital
2010 2009
Shares
(millions)
Amount (US $
millions)Shares
(millions)
Amount (US $
millions)
Common shares outstanding, beginning of year 43.2 $335 26.9 $238Issue of common shares, net 0.3 5 16.3 97Common shares outstanding, end of year 43.5 $340 43.2 $335
As at December 31, 2010, the authorized capital stock of the Company is as follows: an unlimited number of Class A and Class B preferred shares, an unlimited number of non-voting participating shares and an unlimited number of common shares.
In January 2009, pursuant to a Standby Purchase Agreement entered into in connection with a Rights Offering filed in November 2008, Brookfield completed the standby commitment through which it purchased an additional 16.3 million common shares and warrants, entitling it to purchase 8.1 million common shares for net proceeds of $118 million.
Contributed Surplus Contributed surplus comprises transactions on account of the warrants issued by Norbord and stock options issued under the Company’s stock option plan.
57
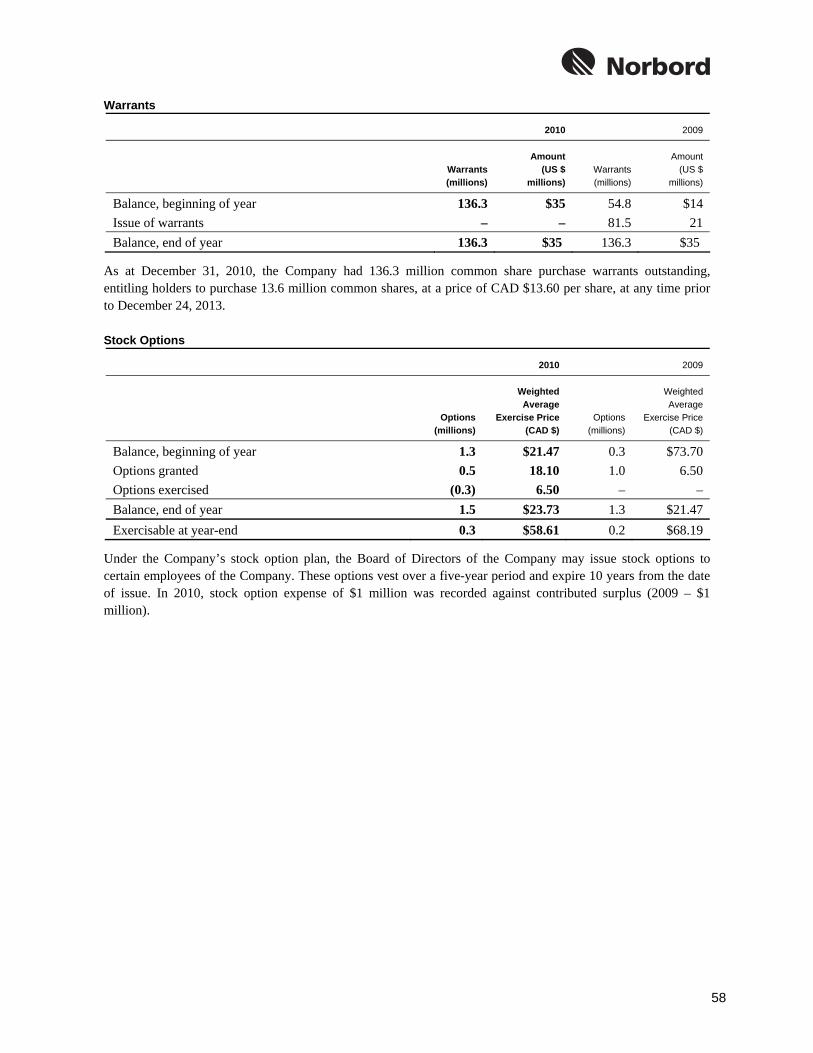
Warrants
2010 2009
Warrants (millions)
Amount (US $
millions)Warrants (millions)
Amount (US $
millions)
Balance, beginning of year 136.3 $35 54.8 $14Issue of warrants – – 81.5 21 Balance, end of year 136.3 $35 136.3 $35
As at December 31, 2010, the Company had 136.3 million common share purchase warrants outstanding, entitling holders to purchase 13.6 million common shares, at a price of CAD $13.60 per share, at any time prior to December 24, 2013.
Stock Options
2010 2009
Options
(millions)
Weighted Average
Exercise Price (CAD $)
Options (millions)
Weighted Average
Exercise Price (CAD $)
Balance, beginning of year 1.3 $21.47 0.3 $73.70Options granted 0.5 18.10 1.0 6.50 Options exercised (0.3) 6.50 – – Balance, end of year 1.5 $23.73 1.3 $21.47Exercisable at year-end 0.3 $58.61 0.2 $68.19
Under the Company’s stock option plan, the Board of Directors of the Company may issue stock options to certain employees of the Company. These options vest over a five-year period and expire 10 years from the date of issue. In 2010, stock option expense of $1 million was recorded against contributed surplus (2009 – $1 million).
58

The following table summarizes the weighted average exercise prices and the weighted average remaining contractual life of the balances of stock options outstanding at December 31, 2010:
Options Outstanding Options Exercisable
Range of Exercise Prices (CAD $) Options
Weighted Average
Remaining Contractual Life (years)
Weighted Average Exercise
Price (CAD $) Options
Weighted Average Exercise
Price (CAD $)
$0.10 5,130 0.08 $0.10 5,130 $0.10$5.40–$6.50 667,518 8.00 6.49 67,518 6.36$8.40–$12.05 17,500 6.49 10.52 7,500 8.49$18.21 540,000 9.09 18.21 – – $38.30 22,450 3.07 38.30 22,450 38.30$60.90 90,630 7.10 60.90 36,252 60.90$87.30–$111.30 151,810 5.21 97.13 117,144 97.68 1,495,038 7.94 $23.73 255,994 $58.61
NOTE 10. EARNINGS PER COMMON SHARE
(US $ millions, except per share information, unless otherwise noted) 2010 2009
Earnings available to common shareholders $17 $(58)
Common shares (millions) Weighted average number of common shares outstanding 43.4 42.9 Stock options(1) 0.4 – Warrants(1) 0.6 –
Diluted number of common shares 44.4 42.9
Earnings per common share Basic $0.39 $(1.35)Diluted 0.38 (1.35)
(1) Applicable when there are positive earnings available to shareholders and when the weighted average share price for the year was greater than the exercise price for vested stock options and warrants.
NOTE 11. PROVISION FOR NON-CORE OPERATION In 2010, the Company recorded a $6 million provision relating to its 50% investment in a hardwood plywood joint venture operation – True North Hardwood Plywood Inc. This operation was non-core and represented less than 1% of total assets. In 2009, the Company recorded a $4 million provision, primarily for the write-down of certain property, plant and equipment and inventory to net realizable value, relating to the sale of a non-core medium density fibreboard (MDF) mill in Deposit, New York, for proceeds of $2 million.
59
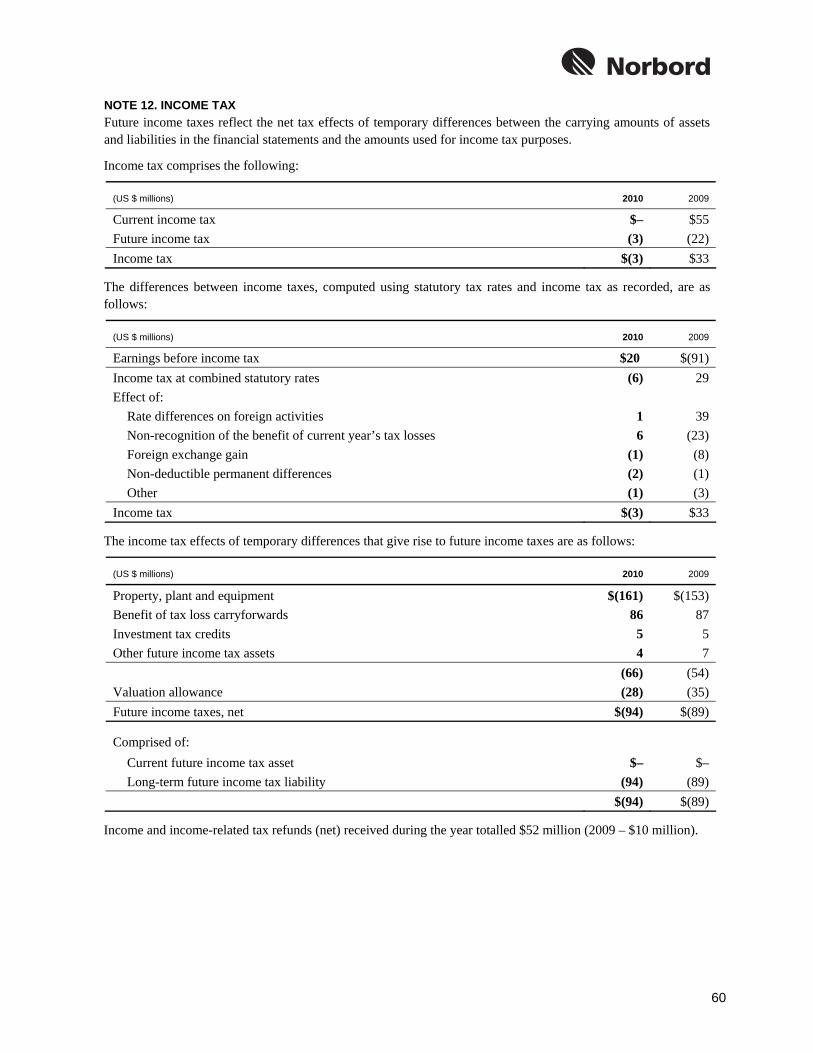
NOTE 12. INCOME TAX Future income taxes reflect the net tax effects of temporary differences between the carrying amounts of assets and liabilities in the financial statements and the amounts used for income tax purposes.
Income tax comprises the following:
(US $ millions) 2010 2009
Current income tax $– $55Future income tax (3) (22)Income tax $(3) $33
The differences between income taxes, computed using statutory tax rates and income tax as recorded, are as follows:
(US $ millions) 2010 2009
Earnings before income tax $20 $(91)Income tax at combined statutory rates (6) 29Effect of:
Rate differences on foreign activities 1 39 Non-recognition of the benefit of current year’s tax losses 6 (23) Foreign exchange gain (1) (8) Non-deductible permanent differences (2) (1) Other (1) (3)
Income tax $(3) $33
The income tax effects of temporary differences that give rise to future income taxes are as follows:
(US $ millions) 2010 2009
Property, plant and equipment $(161) $(153)Benefit of tax loss carryforwards 86 87Investment tax credits 5 5Other future income tax assets 4 7 (66) (54) Valuation allowance (28) (35)Future income taxes, net $(94) $(89)
Comprised of: Current future income tax asset $– $– Long-term future income tax liability (94) (89)
$(94) $(89)
Income and income-related tax refunds (net) received during the year totalled $52 million (2009 – $10 million).
60
As at December 31, 2010, the Company had the following approximate tax attributes available to carry forward:
Amount Latest Expiry Year
Tax loss carryforwards United Kingdom £6 IndefiniteBelgium €44 IndefiniteCanada CAD $57 2028 United States US $133 2029
Investment Tax Credits Canada CAD $6 2029
The loss carryforwards and credits may be utilized over the next several years to eliminate cash taxes otherwise payable, and they will enhance future cash flows. Certain future tax benefits have been included in future income taxes in the consolidated financial statements. A valuation allowance was recorded related to future income tax assets that, in the judgement of management, are not likely to be realized.
NOTE 13. SUPPLEMENTAL CASH FLOW INFORMATION Other items under operating activities comprise:
(US $ millions) 2010 2009
Cash provided by (used for): Amortization of deferred interest rate swap gains (note 7) $(3) $(2) Pension funding greater than pension expense (note 14) (2) (1) Provision for non-core operation (note 11) 6 4 Other 4 8
$5 $9
The net change in non-cash operating working capital balance comprises:
(US $ millions) 2010 2009
Cash provided by (used for): Accounts receivable $(7) $(8) Inventory (11) 9 Accounts payable and accrued liabilities 26 (12)
$8 $(11)
Cash and cash equivalents comprise:
(US $ millions) 2010 2009
Cash $91 $8Cash equivalents 22 13 $113 $21
61

NOTE 14. EMPLOYEE BENEFIT PLANS Pension Plans Norbord has a number of pension plans in which participation is available to substantially all employees. Norbord’s obligations under its defined benefit pension plans are determined periodically through the preparation of actuarial valuations. The most recent actuarial valuation was conducted as of December 31, 2009.
Information about Norbord’s defined benefit pension plans is as follows:
(US $ millions) 2010 2009
Change in Accrued Benefit Obligation During the Year Accrued benefit obligation, beginning of year $69 $54
Current service cost 1 1 Interest on accrued benefit obligation 4 4 Benefits paid (4) (4) Net actuarial loss 10 6 Foreign currency exchange rate impact 4 8
Accrued benefit obligation, end of year(1) $84 $69Change in Plan Assets During the Year Plan assets, beginning of year $52 $40
Actual return on plan assets 4 7 Employer contributions 4 3 Benefits paid (4) (4) Foreign currency exchange rate impact 3 6
Plan assets, end of year(1) $59 $52Reconciliation of Funded Status Accrued benefit obligation $84 $69Plan assets 59 52 Accrued benefit obligation in excess of plan assets (25) (17)
Unamortized net actuarial loss 32 22 Unamortized net transitional asset (4) (4)
Accrued benefit asset $3 $1(1) All plans have accrued benefit obligations in excess of plan assets.
62

(US $ millions) 2010 2009
Components of Net Periodic Pension Expense Current service cost $1 $1Interest on accrued benefit obligation 4 4 Actual return on plan assets (4) (7) Net actuarial loss 10 6Difference between actual and expected return on plan assets – 2Difference between actual and recognized net actuarial loss (9) (4) Net periodic pension expense $2 $2Significant Weighted Average Actuarial Assumptions Used in calculation of net periodic pension expense for the year
Discount rate 5.9% 6.4% Expected long-term rate of return on plan assets 7.7% 7.7% Rate of compensation increase 3.6% 3.6%
Used in calculation of accrued benefit obligation, end of year Discount rate 5.1% 5.9% Rate of compensation increase 3.6% 3.6%
The weighted average asset allocation of Norbord’s defined benefit pension plan assets is as follows:
(US $ millions) 2010 2009
Asset category Equity investments 61% 62% Fixed income investments 37% 38% Cash 2% 0%
Total assets 100% 100%
Operating costs include $5 million (2009 – $4 million) related to contributions to Norbord’s defined contribution pension plans.
NOTE 15. CAPITAL MANAGEMENT Norbord’s capital management objective is to achieve top-quartile return on equity (ROE) and cash return on capital employed (ROCE) over the business cycle, among North American forest products companies, to enable it to retain access to public and private capital markets, subject to financial market conditions. This objective is unchanged from the prior year.
Norbord monitors its capital structure using two key measures of its relative debt position. While the Company considers both book and market basis metrics, it believes the market basis to be superior to the book basis in measuring the true strength and flexibility of its balance sheet.
Net debt to capitalization, book basis, is net debt divided by the sum of net debt and tangible net worth. Net debt consists of the principal value of long-term debt, including the current portion and bank advances less cash and cash equivalents. Consistent with the treatment under the Company’s financial covenants, letters of credit are included in net debt. Tangible net worth consists of shareholders’ equity.
Net debt to capitalization, market basis, is net debt divided by the sum of net debt and market capitalization. Net debt is calculated, as outlined above, under net debt to capitalization, book basis. Market capitalization is the
63
number of common shares outstanding at period end multiplied by the trailing 12-month average per share market price. Market basis capitalization is intended to correct for the low historical book value of Norbord’s asset base relative to its fair value.
Norbord’s capital structure at period end consisted of the following:
(US $ millions) 2010 2009
Long-term debt, principal value $440 $467Less: Cash and cash equivalents (113) (21)Net debt 327 446 Add: Letters of credit 10 8 Net debt for financial covenant purposes 337 454
Shareholders’ equity 352 334 Tangible net worth 352 334
Total capitalization $689 $788Net debt to capitalization, book basis 49% 58%Net debt to capitalization, market basis 35% 48%
The Company’s committed revolving bank lines of $245 million contain the following financial covenants related to capital management that the Company must comply with on a quarterly basis: minimum tangible net worth of $250 million and maximum net debt to total capitalization on a book basis of 65%. Effective January 1, 2011, the maximum net debt to total capitalization on a book basis covenant was reduced to 60%. At year-end, the Company’s tangible net worth was $352 million and net debt to total capitalization on a book basis was 49%.
NOTE 16. FINANCIAL INSTRUMENTS Norbord has exposure to market, commodity price, interest rate, currency, counterparty credit and liquidity risk. Norbord’s primary risk management objective is to protect the Company’s balance sheet, earnings and cash flow in support of achieving top-quartile return on equity (ROE) and cash return on capital employed (ROCE) among North American forest products companies.
Norbord’s financial risk management activities are governed by Board-approved financial policies that cover risk identification, tolerance, measurement, hedging limits, hedging products, authorization levels and reporting. Derivative contracts that are deemed to be highly effective in offsetting changes in the fair value, net investment or cash flows of hedged items are designated as hedges of specific exposures. Gains and losses on these instruments are recognized in the same manner as the item being hedged. Hedge ineffectiveness, if any, is measured and included in current period earnings.
Market Risk Norbord purchases commodity inputs, issues debt at fixed and floating interest rates, invests surplus cash, sells product and purchases inputs in foreign currencies and invests in foreign operations. These activities expose the Company to market risk, from changes in commodity prices, interest rates and foreign exchange rates, which affects the Company’s balance sheet, earnings and cash flows. The Company uses derivatives as part of its overall financial risk management policy to manage certain exposures to market risk that result from these activities.
64
Commodity Price Risk Norbord is exposed to commodity price risk on most of its manufacturing inputs, which are principally comprised of wood fibre, resin and energy. These manufacturing inputs are purchased primarily on the open market in competition with other users of such resources, and prices are influenced by factors beyond Norbord’s control.
Norbord monitors market developments in all commodity prices to which it is materially exposed. No liquid futures markets exist for the majority of Norbord’s commodity inputs, but, where possible, Norbord will hedge a portion of its commodity price exposure up to Board-approved limits in order to reduce the potential negative impact of rising commodity input prices. Should Norbord decide to hedge any of this exposure, it will lock-in prices directly with its suppliers and, if unfeasible, purchase financial hedges where liquid markets exist.
At December 31, 2010, Norbord has hedged approximately 40% of its 2011 expected natural gas consumption by locking-in the price directly with its suppliers. Approximately 70% of Norbord’s electricity is purchased in regulated markets, and Norbord has hedged approximately 10% of its 2011 deregulated electricity consumption. While these contracts are derivatives, they are exempt from being accounted for as financial instruments as they were normal purchases for the purpose of receipt.
Interest Rate Risk Norbord’s financing strategy is to access public and private capital markets to raise long-term core financing, and utilize the banking market to provide committed standby credit facilities to support its short-term cash flow needs. The Company has fixed-rate debt, which subjects it to interest rate price risk, and has floating-rate debt, which subjects it to interest rate cash flow risk. In addition, the Company invests surplus cash in bank deposits and short-term money market securities.
The Company enters into interest rate swaps to convert a portion of its debt from fixed to floating rates. At period end, $115 million in interest rate swaps were outstanding (note 7). The terms of these swaps correspond to the terms of the underlying hedged debt.
From time to time, the Company can recoupon its portfolio of interest rate swaps to more efficiently manage cash flow and credit exposure. Any gains or losses realized are deferred and amortized over the remaining term of the debt against which the swaps were designated as hedges. At period end, $3 million in interest rate swap gains were deferred and included in the carrying value of long-term debt in the consolidated balance sheets (note 7). In 2010, amortization of $3 million (2009 – $2 million) was included in interest expense (note 13).
Currency Risk Norbord’s foreign exchange exposure arises from the following sources: • Net investments in self-sustaining foreign operations, limited to Norbord’s investment in its European
operations • Net Canadian dollar-denominated monetary assets and liabilities • Committed or anticipated foreign currency-denominated transactions, primarily Canadian dollar costs in
Norbord’s Canadian operations and Euro revenues in Norbord’s UK operations
The Company’s policy is to manage all significant balance sheet foreign exchange exposures by entering into cross-currency swaps and forward foreign exchange contracts. The Company may hedge a portion of future foreign currency-denominated cash flows, using forward foreign exchange contracts or options for periods of up to three years, in order to reduce the potential negative effect of a strengthening Canadian dollar versus the US dollar, or a weakening Euro versus the Pound Sterling.
65

Counterparty Credit Risk Norbord invests surplus cash in bank deposits and short-term money market securities, sells its product to customers on standard market credit terms and uses derivatives to manage its market risk exposures. These activities expose the Company to counterparty credit risk that would result if the counterparty failed to meet its obligations in accordance with the terms and conditions of its contracts with the Company.
Norbord operates in a cyclical commodity business. Accounts receivable credit risk is mitigated through established credit management techniques, including conducting financial and other assessments to establish and monitor a customer’s creditworthiness, setting customer limits, monitoring exposures against these limits and, in some instances, purchasing credit insurance or obtaining trade letters of credit. At period end, the key performance metrics on the Company’s accounts receivable are in line with prior periods. As at December 31, 2010, the provision for doubtful accounts was less than $1 million (2009 – $1 million). In 2010, Norbord had one customer whose purchases represented greater than 10% of total net sales.
Under an accounts receivable securitization program, Norbord has transferred substantially all of its present and future trade accounts receivable to a third party trust, sponsored by a highly rated Canadian financial institution, on a fully serviced basis, for proceeds consisting of cash and deferred purchase price. At December 31, 2010, Norbord recorded cash proceeds of $60 million (2009 – $62 million) relating to this program. The fair value of the deferred purchase price approximates its carrying value as a result of the short accounts receivable collection cycle and negligible historical credit losses.
Surplus cash is only invested with counterparties meeting minimum credit quality requirements and issuer and concentration limits. Derivative transactions are executed only with approved, high-quality counterparties under master netting agreements. The Company monitors and manages its concentration of counterparty credit risk on an ongoing basis.
The Company’s maximum counterparty credit exposure at period end consists of the carrying amount of cash and cash equivalents and accounts receivable, which approximate fair value, and the fair value of derivative financial assets.
Liquidity Risk Norbord strives to maintain sufficient financial liquidity at all times in order to participate in investment opportunities as they arise, as well as to withstand sudden adverse changes in economic circumstances. Management forecasts cash flows for its current and subsequent fiscal years to identify financing requirements. These requirements are then addressed through a combination of committed credit facilities and access to capital markets.
At period end, Norbord had $113 million in cash and cash equivalents and $235 million in unutilized committed revolving bank lines.
Financial Liabilities The following table summarizes the aggregate amount of contractual future cash outflows for the Company’s financial liabilities:
Payments Due by Period
(US $ millions) 2011 2012 2013 2014 Thereafter Total
Principal $ – $240 $ – $ – $200 $440Interest 32 32 16 16 40 136 Long-term debt, including interest $32 $272 $16 $16 $240 $576
66

Non-Derivative Financial Instruments The net book values and fair values of non-derivative financial instruments at year-end were as follows:
2010 2009
(US $ millions) Financial Instrument
Classification Net Book
ValueFair
ValueNet Book
Value Fair
Value
Financial assets Cash and cash equivalents Held-for-trading $113 $113 $21 $21 Accounts receivable Loans and receivables 30 30 27 27
$143 $143 $48 $48
Financial liabilities Accounts payable and accrued liabilities Other liabilities $166 $166 $140 $140 Long-term debt Other liabilities 443 447 471 474
$609 $613 $611 $614
Derivative Financial Instruments Information about derivative financial instruments at year-end is as follows:
2010
(US $ millions, unless otherwise noted) Notional
Value
Unrealized Gain at Period End(1)
Realized Gain for the
Year
Sensitivity to 1%
Change
Currency hedges Net investment
UK £47 $2 $2 $1 Belgium €40 1 4 1
Monetary position Canadian dollar CAD $78 2 1 1
Interest rate hedges Interest rate swaps $115 5 – 1
67

2009
(US $ millions, unless otherwise noted) Notional
Value
Unrealized Gain at Period End(1)
Realized Gain (Loss) for the Year
Sensitivity to 1%
Change
Currency hedges Net investment
UK £56 $1 $8 $1 Belgium €40 1 (10) 1
Monetary position Canadian dollar CAD $9 – 2 –
Interest rate hedges Interest rate swaps $115 4 – 1
(1) The carrying values of the derivative financial instruments are equivalent to the unrealized gain (loss) at period end.
Realized and unrealized gains and losses on derivative financial instruments are offset by realized and unrealized losses and gains on the underlying exposures being hedged.
NOTE 17. COMMITMENTS AND CONTINGENCIES Tax Exposures In the normal course of operations, the Company is subject to various uncertainties concerning the interpretation and application of tax laws, in the filing of its tax returns in operating jurisdictions, that could materially affect the Company’s cash flows. There can be no assurance that the tax authorities will not challenge the Company’s filing positions.
In 2010, the Company concluded its discussions with tax authorities, regarding its transfer pricing methodology, with no material effect on the Company’s results of operations or cash flows.
Other The Company has provided certain commitments and indemnifications, including those related to former businesses. The maximum amounts from many of these items cannot be reasonably estimated at this time. However, in certain circumstances, the Company has recourse against other parties to mitigate the risk of loss.
The Company has entered into various commitments as follows:
Payments Due by Period
(US $ millions) 2011 2012 2013 2014 Thereafter Total
Purchase obligations $58 $46 $20 $5 $18 $147 Operating leases 3 2 2 1 2 10 $61 $48 $22 $6 $20 $157
NOTE 18. RELATED PARTY TRANSACTIONS In the normal course of operations, the Company enters into various transactions on market terms with related parties, which have been measured at exchange value and recognized in the consolidated financial statements. The following transactions have occurred between the Company and Brookfield during the normal course of business.
68

Secondary Offering On March 10, 2010, Brookfield and the Company entered into an agreement with a syndicate of investment dealers to complete a secondary offering of Norbord’s common shares. Under the agreement, the syndicate purchased 9 million common shares at a price of CAD $16.70 per common share, for gross proceeds of CAD $150 million, on March 30, 2010. Brookfield offered 8.7 million shares and the Company’s senior management offered 0.3 million shares. Upon completion of the secondary offering, Brookfield’s ownership decreased to approximately 52% of common shares outstanding. Norbord did not receive any proceeds from the offering.
Brookfield Debt Facility Concurrent with the amendments to the revolving bank lines (note 7), the Company cancelled the $50 million Brookfield debt facility, which was undrawn.
Indemnity Commitment As at December 31, 2010, total future costs related to a 1999 asset purchase agreement between the Company and Brookfield, for which Norbord provided an indemnity, are estimated at less than $1 million and are included in other liabilities in the consolidated balance sheets.
Other The Company provides certain administrative services to Brookfield and its affiliates which are charged on a cost recovery basis. In addition, the Company periodically engages the services of Brookfield and its affiliates for various financial, real estate and other business advisory services. In 2010, the fees for these services were less than $1 million (2009 – less than $1 million) and were charged at market rates.
NOTE 19. GEOGRAPHIC SEGMENTS The Company has a single reportable segment. The Company operates principally in North America and Europe. Net sales by geographic segment are determined based on the origin of shipment.
2010
(US $ millions) North America Europe Unallocated Total
Net sales $541 $351 $– $892EBITDA(1) 82 36 (13) 105 Depreciation 27 18 – 45 Property, plant and equipment 647 173 1 821 Investment in property, plant and equipment 9 7 – 16
2009
(US $ millions) North America Europe Unallocated Total
Net sales $406 $312 $– $718EBITDA(1) (8) 17 (9) –Depreciation 29 18 1 48 Property, plant and equipment 665 193 2 860 Investment in property, plant and equipment 12 2 – 14
(1) EBITDA is earnings before interest, income tax, depreciation, provision for non-core operation and foreign exchange loss.
69