Embed Size (px)
Citation preview
15 (3) 2016
Acta Scientiarum Polonorum – ogólnopolskie czasopismo naukowe polskich uczelni rolniczych, publikuje oryginalne prace w następujących seriach tematycznych:
Agricultura – AgronomiaWydawnictwa Uczelniane Uniwersytetu Technologiczno-Przyrodniczego w Bydgoszczyul. Ks. A. Kordeckiego 20, 85-225 Bydgoszcz, tel. 52 374 94 36, fax 52 374 94 27
Biologia – BiologiaWydawnictwo Uniwersytetu Przyrodniczo-Humanistycznego w Siedlcachul. Bema 1, 08-110 Siedlce, tel. 25 643 15 20, fax 25 644 20 45
Biotechnologia – BiotechnologiaGeodesia et Descriptio Terrarum – Geodezja i Kartografi aMedicina Veterinaria – WeterynariaWydawnictwo Uniwersytetu Przyrodniczego we Wrocławiuul. Sopocka 23, 50-344 Wrocław, tel./fax 71 328 12 77
Technica Agraria – Inżynieria RolniczaHortorum Cultus – OgrodnictwoWydawnictwo Uniwersytetu Przyrodniczego w Lublinieul. Akademicka 13, 20-033 Lublin, tel. 81 445 67 11, fax 81 533 37 52
Piscaria – RybactwoZootechnica – ZootechnikaWydawnictwo Uczelniane Zachodniopomorskiego Uniwersytetu Technologicznego w Szczecinieal. Piastów 50, 70-311 Szczecin, tel. 91 449 40 90, 91 449 41 39
Silvarum Colendarum Ratio et Industria Lignaria – Leśnictwo i DrzewnictwoTechnologia Alimentaria – Technologia Żywności i ŻywieniaWydawnictwo Uniwersytetu Przyrodniczego w Poznaniuul. Witosa 45, 61-693 Poznań, tel. 61 848 78 07, fax 61 848 78 08
Administratio Locorum – Gospodarka PrzestrzennaWydawnictwo Uniwersytetu Warmińsko-Mazurskiego w Olsztynieul. Heweliusza 14, 10-724 Olsztyn, tel. 89 523 36 61, fax 89 523 34 38
Architectura – BudownictwoOeconomia – EkonomiaWydawnictwo Szkoły Głównej Gospodarstwa Wiejskiego w Warszawieul. Nowoursynowska 166, 02-787 Warszawa, tel. 22 593 55 20, fax 22 593 55 21
Formatio Circumiectus – Kształtowanie ŚrodowiskaWydawnictwo Uniwersytetu Rolniczego w Krakowieal. 29 Listopada 46, 31-425 Kraków, tel. 12 662 51 57, 12 662 51 59
ISSN 1644-0757eISSN 2450-4602
1644 0757
Oeconom
ia 15 (3) 2016
ISSN 1644-0757
ACTA SCIENTIARUM POLONORUMCzasopismo naukowe założone w 200l roku przez polskie uczelnie rolnicze
Scientifi c Journal established in 2001 by Polich Life Sciences Universities
Oeconomia
Economics
Ekonomia
15 (3) 2016
Bydgoszcz Kraków Lublin OlsztynPoznań Siedlce Szczecin Warszawa Wrocław
Acta Scientiarum Polonorum Programming Board
Wiesław Nagórko (Warszawa), Ryszard Źróbek (Olsztyn), Józef Bieniek (Kraków), Krzysztof Szkucik (Lublin), Ewa Sobecka (Szczecin),
Janusz Prusiński (Bydgoszcz), Jerzy Sobota (Wrocław) – chairman,Stanisław Socha (Siedlce), Waldemar Uchman (Poznań)
Oeconomia Scientifi c Board
Carol J. Cumber (South Dakota State University, Brookings, USA), Roman Kisiel (University of Warmia and Mazury, Olsztyn, PL),
Joseph Andrew Kuzilwa (Mzumbe University, Tanzania),Lubos Smutka (Czech University of Life Sciences, Prague, CZ),
Wiesław Musiał (University of Agriculture in Krakow, Kraków, PL),Janina Sawicka (Warsaw University of Life Sciences – SGGW, Warszawa, PL)
– chairperson,Harun Uçak (Muğla Sıtkı Koçman University, Muğla, TR),
Dorota Witkowska (University of Łodz, Łódź, PL)Andra Zvirbule-Bērziņa (Latvia University of Agriculture, LV)
Editing committee
Jan Kiryjow – Warsaw University of Life Sciences PressPaulina Stolarczyk (WULS-SGGW) – Oeconomia secretary
Paulina Tuka (WULS-SGGW) – Oeconomia secretaryMarcin Chciałowski (WULS-SGGW) – Oeconomia secretary
Renata Marks-Bielska – University of Warmia and Mazury in Olsztyn – thematic editor,Tomasz Wojewodzic – University of Agriculture in Krakow – thematic editor,
Wojciech Pizło – WULS-SGGW – thematic editor,Iwona Pomianek – WULS-SGGW – thematic editor,
Aleksandra Matuszewska-Janica – WULS-SGGW – statistical editor,Kuo-Liang “Matt” Chiang – South Dakota State University – language consultant
The printed version of Acta Scientiarum Polonorum Oeconomia is an initial version of the journal
Editorial staff Anna Dołomisiewicz, Violetta Kaska
ISSN 1644-0757, eISSN 2450-4602Edition: 200 prints
© Copyright by Warsaw University of Life Sciences PressWydawnictwo SGGW, ul. Nowoursynowska 166, 02-787 Warszawa
tel. 22 593 55 20 (-22; -25 – sprzedaż), fax 22 593 55 21e-mail: [email protected]
www.wydawnictwosggw.pl
Print: Agencja Reklamowo-Wydawnicza A. Grzegorczyk, www.grzeg.com.pl
From the Scientifi c Board
There has been the fi fteenth year of the Acta Scientiarum Polonorum Oeconomia publishing. The Acta is the periodical including several thematic series with uniform graphics and similar format. The publication was set up by group of enthusiasts – em-ployees of life sciences universities and has been published under the patronage of rectors of these universities. Constant involvement of academic society in increasing substantive and editorial level of the series, with efforts of the authors, the Programming Board and the Scientifi c Boards, has contributed to placing the Acta Scientiarum Polonorum (and our Oeconomia series) on the noticeable position in academic research society. Articles can be prepared in English with Polish title, abstract and keywords. Moreover, we publish latest issues in English only. The Scientifi c Board of the Oeconomia series, concerning the publication range, focuses its attention both on substantive content and precision of the form. The articles are revised in “double-blind review” process. Whole content of the Acta Scientiarum Polonorum Oeconomia is available in electronic version on the follow-ing website http://acta_oeconomia.sggw.pl. We are glad to inform that Acta Scientiarum Polonorum Oeconomia are indexed within the AGRIS-FAO, EBSCO, SIGŻ, Copernicus Index, AGRO, BazEkon, POL-index. Since 2015 each article published in Acta Sci. Pol. Oeconomia has 15 points at the Ministry of Science and Higher Education ranking list.
Please send the articles on one of following e-mail addresses:
While sending a printout, please attach also the electronic version on CD or DVD. Letters including note “the Acta Scientiarum Polonorum Oeconomia” should be sent on the following address:
Prof. dr hab. Janina SawickaDepartment of European Policy, Public Finances and MarketingFaculty of Economic SciencesWarsaw University of Life SciencesNowoursynowska 166, 02-787 Warsaw, Polandtel.: (+4822) 593 40 70; fax: (+4822) 593 40 77
Yours sincerelyJanina SawickaChairperson of the Scientifi c Board of the Acta Sci. Pol. Oeconomia series

Oeconomia 15 (3) 2016, 5–14
ISSN 1644-0757eISSN 2450-4602
http://acta_oeconomia.sggw.pl
Corresponding author: Justyna Kufel, Institute of Agricultural and Food Economics – NRI, Świętokrzyska 20, 00-002 Warszawa, Poland, e-mail: [email protected]
© Copyright by Warsaw University of Life Sciences Press, Warsaw 2016
FOOD PRODUCT INNOVATIONS AND THE MAIN CONSUMER TRENDS
Szczepan FigielUniveristy of Warmia and Mazury in Olsztyn
Justyna KufelInstitute of Agricultural and Food Economics – National Research Institute
Abstract. Relatively slowly growing global food markets, soft demand, and ample supply make product innovations a key factor in attracting consumers attention. Consequently, in order to develop successful innovative products food producers are supposed to accurately track consumer trends. The aim of this paper is twofold. Firstly, recent developments in food product innovations and major consumer trends are contrasted in order to assess how successful food producers are in meeting new consumer demands. Secondly, gaps between the consumer trends and innovativeness of food companies are indicated. Results of the performed analyses based mainly on the data from a study by XTC World Innovation pub-lished in 2015 and literature sources suggest that considering main consumer trends food product innovations should be primary oriented towards pleasure and health.
Key words: food innovations, consumer trends, market niches
INTRODUCTION
Due to strong worldwide competition it becomes more and more difficult to offer differentiated food products, which would be better than existing alternatives. Therefore, not the marketers but the consumers and their aspirations should determine the types and nature of the food product innovations. Tirole [1988] distinguishes product innova-tions as being new kinds of goods and services introduced into a market, and process innovations as concentrated on reducing costs of goods and services already produced. Agro-food sectors need both the product and the process innovations, however from the
6 S. Figiel
Acta Sci. Pol.
consumer utility standpoint the former are much more persuasive and therefore they are often of greater market importance for companies. Consumers expect innovations, what is reflected in new trends appearing currently in the consumer markets. Specifically, 63% of consumers are looking forward to new products, 56% would like to switch to a new brand, and 49% tell the people around about recently purchased products [Nielsen 2014]. The key problem lies therefore in seeking for food product innovations, so that, the food industry may continue growing. As a solution to this stalemate Nielsen [2014] pointed out concentrating on consumers whose behaviour ultimately defines innovations instead of relying on marketers, who because of their past results and practices are not able to decide what a true innovation is, and what is not. Only consumers preferences and aspirations, as well as their purchasing behaviour may reveal and affirm an innovation. Consequently, in order to innovate through meeting unfilled demands, food producers should more ac-curately track consumer trends.
The aim of the paper is to contrast recent developments in food product innovations with features of major consumer trends in order to assess how successful food producers are in meeting new consumer demands, and to indicate gaps between the consumer trends and innovativeness of food companies, so that, market niches could be better identified and filled. The main hypothesis is that not all signs of current consumer trends are rightly detected and considered by food producers, as they are supposed to be when a spectrum of product innovations introduced into food markets is analysed in the context of con-sumer latent needs. In other words innovativeness food producers do not fully match expectations of the changing consumer expectations.
DATA AND METHODS
In quantitative approaches to study economic phenomena a trend is usually meant as a long-term tendency of a given variable to change its value in one direction. The changes may have increasing, decreasing or side character, where a side trend may be also called a stable one, as it lacks significant declines or growths and the considered variable val-ues oscillate around a certain constant level. For the purpose of this paper the term trend is viewed somewhat qualitatively as described in the Cambridge Dictionary, namely as “a general development or change in a situation or in the way that people are behav-ing” (http://dictionary.cambridge.org/dictionary/english/trend). Basic features of trends include their variability, the overlap (comorbidities) and the simultaneous emergence of a counter-trend (divergence). Consumer trends may have a psychological, economic or social, short- or long-term, regional or global character [Vejlgaard 2008]. Simultaneously, they are objective and do not depend on the consumer will or consciousness. Specifically, according to Zalega [2013] consumer trends result from some megatrends observed in the social, economic, legal, political, demographic or technological contexts.
The analysis of consumer trends presented in the paper is based on the critical review of secondary sources, in which results of various studies regarding observed changes and tendencies in consumer behaviours were discussed and synthetized. In the Polish litera-ture especially important contributions to this field have been recently made by Zalega [2013] and Mróz [2014]. Additionally, major megatrends as underlying factors for con-sumer trends are highlighted.
Food product innovations and the main consumer trends 7
Oeconomia 15 (3) 2016
Consumer trends influence producer trends by creating new rules of functioning for food companies. This also refers to their innovative activities being undertaken to address changing needs and wants of the consumers. Developments taking place in this area were analysed using data from a study by XTC World Innovation [2015]. The study consists in segmentation of each food product category launched in 2014 in 40 countries. Each new product is precisely described regarding innovative features and then positioned on the XTC trends tree. Because of the paper space limit only the world perspective was taken into account, however, the issue of regional differences and their consequences was analysed too. After description of the main producer innovation trends and presentation of their examples regarding food, also a change in trends importance between the periods 2002–2006 and 2010–2014 is discussed in this paper.
The next step of the analysis was to identify gaps between potential consumer ex-pectations reflected in the trends and the types of introduced innovations regarding food products. Then, based on deduction and expert assessment areas for promising future innovations comprising specific market niches were indicated. Finally, more detailed sug-gestions are formulated regarding some aspects of consumer preferences, which should be taken into account to avoid failure when developing breakthrough innovations.
RESULTS OF THE ANALYSIS
Consumer trends have their sources in significant social, economic, political and tech-nological changes, which are coming slowly, but they make lasting 7–10 years, profound impacts on our lives. Most of them are connected with the change from the industrial to the post-industrial era characterised with an increasing role of knowledge and creativity as well as with an empowerment of employees [Naisbitt 1982]. These, so-called mega-trends observed today are as follows [Zalega 2013]: gerontologization of society, rejuve-nating society, luxurisation of consumption, lifestyle design, distanced (conscious) con-sumption, lazy (convenient) consumption, increasing mobility of people, centralization of consumption, information society or cybernetic consumerizm (resulting from social media, virtual consumption and multitasking), experience marketing, and avatarization of consumption.
Megatrends are connected most of all with changes regarding life expectancy, level and distribution of income, value systems of consumers, structure of employment, en-vironmental concerns, as well as with rapid development of information technologies [Figiel 2015]. The most significant event influencing recently consumer trends was the 2007–2008 financial crisis. Since then, buying things hasn’t been so strongly placed in the centre of human activity any more. Households had to limit their consumption whilst becoming more conscious that capitalism and mass production may rely also on overex-ploitation of workers, animals and natural environment. Consequently, purchasing deci-sions started to be made in a more responsible way, whereas before the crisis consumers were more individualistic and egocentric. They enjoyed buying and owning tailor-made products, through what they built their ego, and believed that an idyllic world of con-sumption should have ensured a good mood [Mróz 2014].
Eight main post-crisis consumer trends discussed in the literature are the following: anti-consumption, conscious (ethical, responsible) consumption, collaborative consump-

8 S. Figiel
Acta Sci. Pol.
tion (mesh, sharing economy), freeganizm, intelligent (innovative) consumption, smart shopping, cocooning (home centralization), and non-stop [Zalega 2013]. In this paper these trends have been considered with reference to the food consumption.
The consumer megatrends have impact on the marketing-mix of food companies. The most significant changes concern promotion, as general strategy described by spray and pray had to be replaced by attract and engage, which consists in offering experiences and sensations as well as building relationships, what includes responding to consumer feedback, and presumption [Mróz 2014]. In order to attract consumer attention firms take advantage of trexy marketing, which should make a brand more trendy and sexy1. Also, promotion campaigns have to be more innovative, creative and interactive. Specifically, young users of information technologies expect infotainment, edutainment, entertainment [Mróz 2014]. As a result, thought-out, long-term strategies are replaced by marketing happenings and provocations.
In Table 1 there are 15 trends listed, grouped into 5 axes, which represent poten-tial producer responses to consumer expectations with exemplary descriptions regarding features of food products. The axes are meant as major domains of general consumers’ expectations, which are supposed be to addressed by innovative food producers, direct-ing their market efforts eventually reflected in the formation of visible trends concern-ing food product attributes and features. They can be briefly characterised as follows [XTC World Innovation 2015]: pleasure (induced by enticing quality, often emotionally charged), health (expressed by health benefits and risk prevention), physical (driven by attention to appearance, body shape or state of mind), convenience (based on efficiency of use and adaptation to new lifestyles), and ethics (focused on solidarity, concern for others and the environment).
It has been observed that innovations are more likely to occur in certain food catego-ries than in others [XTC World Innovation 2015]. In 2014 the most innovative worldwide were the following categories: soft drinks, dairy products, appetizer grocery products, frozen products, ready-made meals, and biscuits. Innovations noticed in these categories accounted for 8.3, 7.2, 6.3, 5.7, 5.6 and 5.4% of the world total innovations, respectively. Categories with especially fast increasing number of innovations were alcoholic beverag-es/aperitifs and meat/delicatessen. During the last year the share of the first one increased from 2.9 to 4% and the second one from 2.6 to 3.9%.
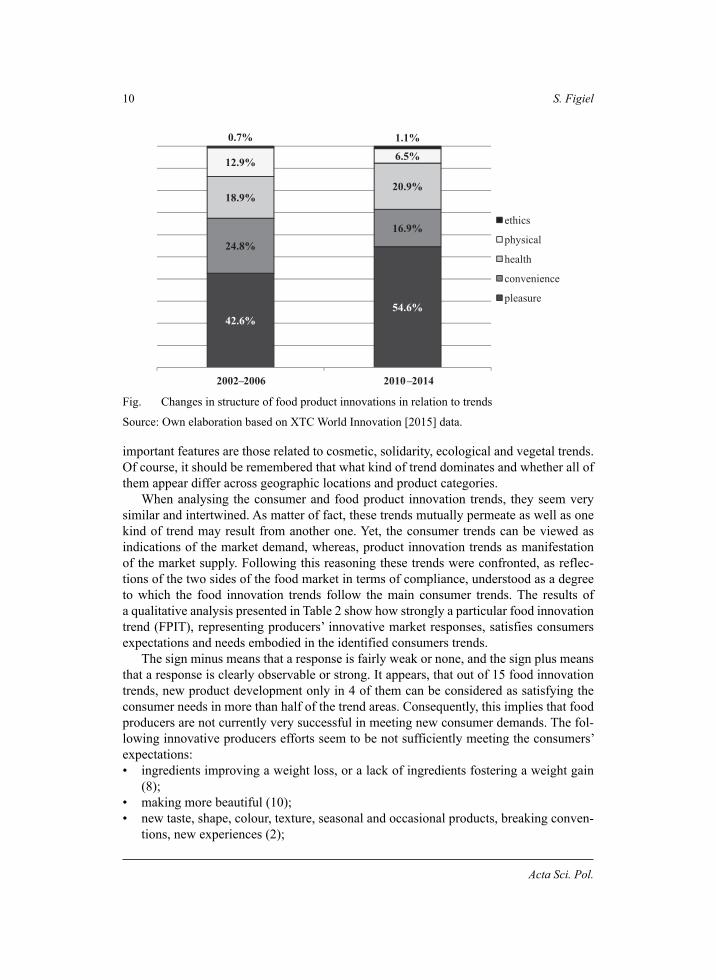
After the crisis producers became more oriented to satisfying needs of the consumers related to pleasure, health and ethics, and relatively less active in introducing innovations embracing convenience and physical aspects (Fig.).
Consequently, more than half of all food products launched in 2014 addressed the needs for pleasure. Second important objective was to make products healthier, and third to make them more convenient. The least important for the food producers were consum-ers expectations linked to physical and ethical issues. According to XTC World Innova-tion [2015] food producers are mostly interested in making their products more varied in senses, more sophisticated, easier to handle, more natural and medical, whereas the least
1 In order to do this virus marketing, world of mouth, guerrilla marketing, ambient media, trendset-ting programs, building controversies around a brand, different platforms for exchanging experi-ences, also virtual ones, are employed [Mróz 2014].

Food product innovations and the main consumer trends 9
Oeconomia 15 (3) 2016
Table 1. Food product innovation axes and trends in context of consumer expectations
Axis Trend Description of product features
Plea
sure
sophistica-tion (1)
high-quality, exclusive, rare, attaching details regarding recipes, ingredients, production processes, packaging, design (e.g. ingredients of prestigious origin like Amazon rainfor-est, adding sweet taste to traditionally savoury meals, food treated as art)
variety of senses (2)
new taste, shape, colour, texture, seasonal and occasional products, breaking conven-tions, new experiences, e.g. Greek yoghurt instead of sour cream, meals for hot and cold consumptions, seaweed as an ingredient in sweet and savoury recipes, more delicacy and lightness of textures, introducing exotic products like wasabi into local recipes (fusion cuisine)
exoticism (3) new, different tastes and recipes from abroad, e.g. Burma cuisine, ready meals based on recipes from Japan, little known fruits like dragon fruit
fun (4) surprising, entertaining, interacting products, e.g. packaging created with a sense of hu-mour, with pictures taken from social networks, tattoo design
Hea
lth
natural (5)improving and not harming health, e.g. limiting a number of ingredients, stevia as a sweetener, animals reared without antibiotics and GMO, leafy vegetables prepared to eat, especially kale, use of vegetables in snacks
medical (6)
ingredients benefiting health, additional or naturally present/absent, e.g. snacks and drinks improving eyesight, rich in vitamins and minerals superfoods like red berries, guarana, spinach, or seeds (chia, amaranth, quinoa), gluten-free products, food and bever-ages alkalizing body, baobab raw or for drinking
vegetal (7)positive influence on health because of basing production on plants, e.g. adding hemp good for heart, vegetable products consumed during symbolic moments of enjoyment and celebrations
Phys
ical
slimness (8)ingredients improving a weight loss or a lack of ingredients fostering a weight gain, e.g. meals with konjac, slower and less industrial production process, edamame (immature soybeans) in dips, products with ingredients of low calories and fat
energy, well-being (9)
relaxing, stimulating body, e.g. single-serve size of beverages used in order to cool down or warm-up the body during sporting, lactose free, and enriched with proteins and cal-cium milk, adding microalgae (e.g. spirula, chlorella, euglena), beverages reducing stress (with lemon balm, kava-kava, GABA)
cosmetic (10)
making more beautiful, e.g. beverages lightening skin for young Asian women, strong trend in Latin America, products with aloe, Coenzyme Q10 and collagen improving a condition of a face skin
Con
veni
ence
easy to han-dle (11)
easier carrying, eating, discarding, e.g. family-sized ready-made dishes, prior division in portions, kit included, separate sauce, special spoon for babies, herbs, vegetables, mush-rooms for self-growing at home, packaging with windows, products ready to be served, e.g. in slices
time saving (12)
short time of preparation or cooking, e.g. semi-ready or precooked products, packages with vanilla, spices, herbs for infusion cooking, so called meal solutions combining ap-petizer, main dish and dessert in a single box to take away
nomadism (13)
easiness of eating regardless conditions, e.g. on-the-go and economy sizes, seaweed in snacks and as salads after adding water
Ethi
cs
solidarity (14)
supporting disadvantaged people, not harming human rights, e.g. resigning from a part of the profit for the sake of regional economic development, children with autism, or people suffering from cancersas, e.g. symbolized by pink ribbon (breast cancer) or moustache (prostate cancer)
ecology (15)respecting animals and nature, e.g. bottles and coffee capsules made of plants, edible packaging, packages embedded with seeds possible to plant in the ground, assuring ani-mal welfare, and protection and sustainability of marine resources
Source: Own elaboration based on XTC World Innovation [2015].
10 S. Figiel
Acta Sci. Pol.
important features are those related to cosmetic, solidarity, ecological and vegetal trends. Of course, it should be remembered that what kind of trend dominates and whether all of them appear differ across geographic locations and product categories.
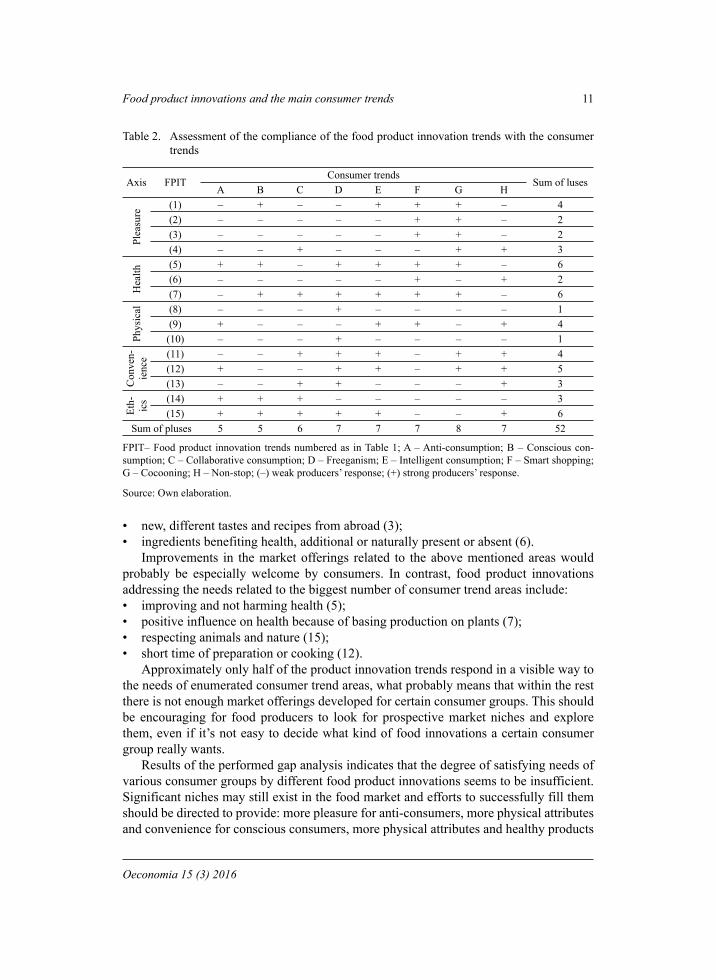
When analysing the consumer and food product innovation trends, they seem very similar and intertwined. As matter of fact, these trends mutually permeate as well as one kind of trend may result from another one. Yet, the consumer trends can be viewed as indications of the market demand, whereas, product innovation trends as manifestation of the market supply. Following this reasoning these trends were confronted, as reflec-tions of the two sides of the food market in terms of compliance, understood as a degree to which the food innovation trends follow the main consumer trends. The results of a qualitative analysis presented in Table 2 show how strongly a particular food innovation trend (FPIT), representing producers’ innovative market responses, satisfies consumers expectations and needs embodied in the identified consumers trends.
The sign minus means that a response is fairly weak or none, and the sign plus means that a response is clearly observable or strong. It appears, that out of 15 food innovation trends, new product development only in 4 of them can be considered as satisfying the consumer needs in more than half of the trend areas. Consequently, this implies that food producers are not currently very successful in meeting new consumer demands. The fol-lowing innovative producers efforts seem to be not sufficiently meeting the consumers’ expectations:
ingredients improving a weight loss, or a lack of ingredients fostering a weight gain (8);making more beautiful (10);new taste, shape, colour, texture, seasonal and occasional products, breaking conven-tions, new experiences (2);
•
••
42.6%54.6%
24.8%16.9%
18.9%20.9%
12.9% 6.5%
0.7% 1.1%
4102–01026002–2002
ethics
physical
health
convenience
pleasure
Fig. Changes in structure of food product innovations in relation to trends
Source: Own elaboration based on XTC World Innovation [2015] data.
Food product innovations and the main consumer trends 11
Oeconomia 15 (3) 2016
new, different tastes and recipes from abroad (3);ingredients benefiting health, additional or naturally present or absent (6).Improvements in the market offerings related to the above mentioned areas would
probably be especially welcome by consumers. In contrast, food product innovations addressing the needs related to the biggest number of consumer trend areas include:
improving and not harming health (5);positive influence on health because of basing production on plants (7);respecting animals and nature (15);short time of preparation or cooking (12).Approximately only half of the product innovation trends respond in a visible way to
the needs of enumerated consumer trend areas, what probably means that within the rest there is not enough market offerings developed for certain consumer groups. This should be encouraging for food producers to look for prospective market niches and explore them, even if it’s not easy to decide what kind of food innovations a certain consumer group really wants.
Results of the performed gap analysis indicates that the degree of satisfying needs of various consumer groups by different food product innovations seems to be insufficient. Significant niches may still exist in the food market and efforts to successfully fill them should be directed to provide: more pleasure for anti-consumers, more physical attributes and convenience for conscious consumers, more physical attributes and healthy products
••
••••
Table 2. Assessment of the compliance of the food product innovation trends with the consumer trends
Axis FPITConsumer trends
Sum of lusesA B C D E F G H
Plea
sure
(1) – + – – + + + – 4(2) – – – – – + + – 2(3) – – – – – + + – 2(4) – – + – – – + + 3
Hea
lth
(5) + + – + + + + – 6(6) – – – – – + – + 2(7) – + + + + + + – 6
Phys
ical (8) – – – + – – – – 1
(9) + – – – + + – + 4(10) – – – + – – – – 1
Con
ven-
ienc
e (11) – – + + + – + + 4(12) + – – + + – + + 5(13) – – + + – – – + 3
Eth- ics (14) + + + – – – – – 3
(15) + + + + + – – + 6Sum of pluses 5 5 6 7 7 7 8 7 52
FPIT– Food product innovation trends numbered as in Table 1; A – Anti-consumption; B – Conscious con-sumption; C – Collaborative consumption; D – Freeganism; E – Intelligent consumption; F – Smart shopping; G – Cocooning; H – Non-stop; (–) weak producers’ response; (+) strong producers’ response.
Source: Own elaboration.
12 S. Figiel
Acta Sci. Pol.
for collaborating consumers, more pleasure for freegans, more convenient and ethical products for smart shoppers, more physical attributes and ethical products for home lov-ers. Interestingly, intelligent and non-stop type of consumers are the only groups, whose expectations are at least partly addressed in each of the five food product innovation axes. This may mean that innovative food producers respond to the needs of such consumers to the greatest extend.
Based on results of the analysis, also some more specific recommendations regarding desired features of innovative food products can be formulated with reference to each consumer trends. They are as follows:
anti-consumption – products supporting disadvantaged people, not harming human rights;conscious consumption – relaxing, stimulating body, plus easiness of eating regar-dless conditions; and ethics;collaborative consumption – surprising, entertaining, interacting products, plus easier carrying, eating, discarding for groups;freeganism – physical, plus respecting animals and nature;intelligent consumption – surprising, entertaining, interacting products (social media), relaxing, stimulating body;smart shopping – new taste, shape, colour, texture, seasonal and occasional products, breaking conventions, new experiences, plus new, different tastes and recipes from abroad;cocooning – improving and not harming health, plus short time of preparation or cooking;non-stop – health plus convenience.The above recommendations represent an attempt to generalize results of the per-
formed study and related analysis considering consumer and food product innovation trends from the perspective of the globalized world. The discussed trends are born and driven mostly by behaviour of consumers and producers representing the Western world. We can also see that the more developed a country is, the stronger are both the orientation towards fun, quality, health, individualization, and the need for diet, functional, organic, fresh, convenient food. Of course, it should be kept in mind that demand for particular innovative food products can significantly differ across product categories, world regions and countries2.
CONCLUSION
A simultaneous analysis of food product innovations and the main consumer trends can provide not only an interesting insight into the degree to which supply in food mar-kets meets the demand, but also allows to identify strategic directions food producers looking for business opportunities should follow. Assuming that consumers’ trends at least to a certain extent are primary and should direct producers responses regarding
2 Description and analysis of such differences in details is beyond the scope of this paper and could be a subject of a separate study.
•
•
•
••
•
•
•
Food product innovations and the main consumer trends 13
Oeconomia 15 (3) 2016
product innovations, the world food industry seems to be fulfilling consumer wants and wishes unequally. An attempt to match characteristics of consumer trends with features of innovative food products, reflecting the food product innovation trends (FPIT) accord-ing to XTC World Innovation [2015], showed that only in case of 52 out of 120 analysed combinations, so less than 50%, represented clearly observable expected producers’ re-sponses. Results of the analysis indicate a constantly increasing role of food innovations connected with health and pleasure. Regarding pleasure, through their purchasing deci-sions consumers want to show respect for other cultures, they are looking for products of better value, and for those which will show them the beauty of life, while social media play an increasingly important role, enabling consumers to create products from the be-ginning (called collaborative customisation).
The ethics and physical trends lose in sense their importance, as instead of buying ethi-cal products people prefer rather to do something else for nature, animals and people, and the physical trend converges to the health trend. A special attention should be paid to such aspects as improving and not harming health, because in future they will probably shape a major trend connected with simplicity regarding ingredients, packaging, recipes, and may be strengthened by a growing tendency to look for food purchased directly from producer (short food supply chains), which involves a face-to-face or through social media interac-tions. The question is however, if such phenomenon being partly a comeback to tradition, should be considered as offering innovative products. This also refers to a revival of tra-ditional food products offered usually by small producers, what is for example observable and publicly supported in the EU countries (http://www.tradeitnetwork.eu/TRADEIT-Sup-port-for-the-Traditional-Food-Sector#&panel1-3). Considering the convenience trend, it no longer seems to be viewed as strongly related to innovations, apart from certain groups of consumers, for instance, those interested in collaborative consumption.
Development of both consumer trends and food product innovation trends is strongly influenced by global events such as the recent 2007–2008 financial crisis. Current con-sumer trends clearly embody much more focus on saving, rational buying and minimizing consumption. Consumers don’t trust marketing messages, they are less loyal to brands, more critical and expect personal attention. This new global business environment drives food product innovations trends, however the results of the gap analysis show that there are still spaces for products innovations, especially regarding pleasure and health in con-nection with the simplicity. So, this means that attractive market niches still exist and should be explored by food producers in terms of business opportunities. But, strategic choices of food producers may be successful only if consumer perspective is properly understood, what means not only showing empathy and judging the products offered in the consumers’ eyes and getting them involved in building collaborative relationships, but also creating open companies acting like innovation hubs.
REFERENCES
Figiel, S. (2015). New Consumer Trends in Traditional Dairy Products. An Economic Perspective. Paper presented at the Conference and Brokerage Event Innovative Technologies for Tra-ditional Dairy Producers, Poznań, 18–19.06.2015.
14 S. Figiel
Acta Sci. Pol.
Mróz, B. (2014). Nowe trendy konsumenckie. Implikacje dla strategii biznesowych firm. Paper presented at the XXV Ogólnopolski Zjazd Katedr Marketingu, Handlu i Konsumpcji, Toruń 14–16.09.2014.
Naisbitt, J. (1982). Megatrends: Ten New Directions Transforming Our Lives. Warner Books.Nielsen (2014). Nielsen Breakthrough Innovation Report – European Edition.Tirole, J. (1988). The Theory of Industrial Organization. MIT Press, Cambridge.Vejlgaard, H. (2008). Anatomy of trend. McGraw-Hill, New York.XTC World Innovation, 2015. World Innovation Panorama. Key facts, new trends, outstanding
concepts in food innovation. Zalega, T. (2013). Nowe trendy i makrotrendy w zachowaniach konsumenckich gospodarstw do-
mowych w XXI wieku. Konsumpcja i Rozwój, 2 (5), 3–21.
ŻYWNOŚCIOWE INNOWACJE PRODUKTOWE A GŁÓWNE TRENDY KONSUMENCKIE
Streszczenie. Rynek dóbr żywnościowych charakteryzuje się znikomym wzrostem, stabil-nym popytem i szeroką ofertą, co sprawia, że innowacje produktowe są głównym czynni-kiem przyciągającym uwagę konsumentów. W konsekwencji, aby udanie rozwijać inno-wacje produktowe, producenci żywności powinni właściwie śledzić trendy konsumenckie. Cel artykułu ma dwojaki charakter. Po pierwsze, pojawiające się ostatnio rodzaje żywnoś-ciowych innowacji produktowych skonfrontowano z głównymi trendami konsumenckimi, aby ocenić jak udanie producenci żywności zaspokajają potrzeby konsumentów. Po drugie, wskazane zostały luki między trendami konsumenckimi a innowacyjnością firm wytwa-rzających żywność. Rezultaty przeprowadzonych analiz opracowane na podstawie danych zaczerpniętych z publikacji XTC World Innovation z 2015 roku oraz źródeł literaturowych wskazują, że biorąc pod uwagę główne trendy konsumenckie, żywnościowe innowacje pro-duktowe powinny być zorientowane przede wszystkim na przyjemność i zdrowie.
Słowa kluczowe: innowacje żywnościowe, trendy konsumenckie, nisze rynkowe
Accepted for print: 16.08.2016
For citation: Figiel S., Kufel J. (2016). Food product innovations and the main consumer trends. Acta Sci. Pol., Oeconomia, 15 (3), 5–14.
Oeconomia 15 (3) 2016, 15–26
ISSN 1644-0757eISSN 2450-4602
http://acta_oeconomia.sggw.pl
Corresponding author: Józef Kania, University of Agriculture in Krakow, Institute of Economics and Social Sciences Department of Social Policy and Extension, al. Mickiewicza 21, 31-120 Kra-kow, Poland, e-mail: [email protected]
© Copyright by Warsaw University of Life Sciences Press, Warsaw 2016
SOURCES AND STRUCTURE OF INCOME OF AGRITOURISM FARMS IN THE POLISH CARPATHIAN MOUNTAINS
Józef Kania, Małgorzata BoguszUniversity of Agriculture in Krakow
Abstract. The paper contains an analysis and evaluation of sources and structure of income in small agritourism farms, located in the region of the Polish Carpathian Mountains. Em-pirical data were obtained using a questionnaire interview with 73 farms. Their analysis enabled separating five types, i.e. agritourism farms with marginalized agricultural produc-tion below 2 ESU, semi-subsistence farms with predominance of plant production 2–4 ESU or with predominance of animal production 2–4 ESU and economically viable farms with predominance of plant production above 4 ESU or with predominance of animal production above 4 ESU. It was demonstrated that the structure of income of all types of the surveyed agritourism farms is dominated by non-agricultural sources of income, i.e. agritourism and accompanying services and permanent or seasonal work beyond the farm, business activi-ties, as well as social benefits – retirement pensions and disability pensions, rather than in-come from agricultural production. Income from agritourism activities has the greatest and positive effect on profitability of the surveyed farms.
Key words: agritourism, small farms, sources of income, Polish Carpathian Mountains
INTRODUCTION
Over centuries, sources of income, their tangible form, and importance for the qual-ity of living were changing but they were always necessary for the human existence. However, for primary societies income alone was not the main purpose of their activities.
16 J. Kania, M. Bogusz
Acta Sci. Pol.
Their needs were reduced to getting food necessary to survive and after satisfying these needs they were ceasing activities which today are described as business activities for the purpose of earning income. With time, income became one of the basic purposes of busi-ness activities, especially when the entities hiring employees started dealing with these business activities, and income generation became a purpose both for employees and business units alone [Zegar 1999].
A characteristic feature of income of agricultural farms is their diversity. The structure of income in agricultural farms includes: income from agricultural production, income from non-agricultural activities, work beyond the farm, but also retirement pensions, dis-ability pensions or allowances. As indicated by the findings of other research, creating alternative sources of income is also one of the most often indicated reasons by farm-ers and country inhabitants who apply for financial support for projects from EU funds [Satoła 2009]. According to the research, agricultural farms and rural areas in Poland were strongly supported under the Common Agricultural Policy (CAP) of the European Union (EU) in the period 2004–2013 [Kania 2009, Kania and Bogusz 2010, Bogusz and Kiełbasa 2014].
Traditional source of income of a farmer’s family, namely agricultural income, be-comes more and more often enriched with non-agricultural sources related both to the farm, e.g. agritourism, and, first of all, gainful employment beyond own farm and social benefits [Zegar 1999, Musiał et al. 2005].
In respect of personal income of peasants’ families, the following can be distinguished [Zegar 2004]:
families where the basic source of income are agricultural activities in own farm (agri-cultural income);families whose maintenance basis is mainly income from work beyond the farm; families whose source of personal income is both income from agricultural activities and from other non-agricultural sources. One of the ways of stimulation of the development of rural areas and their multifunc-
tional development is the development of agritourism activities [Wiatrak 1996, Sikora 1999]. Agritourism as a form of business activities of agricultural families is the subject of social policy analyses and the Common Agricultural Policy. It has a significant role in the development of agricultural farms and multifunctionality of rural areas. This is also an example of additional source of farm owners’ income and one of the elements of the development of rural areas. It uses accommodation, nutritional and recreational base in an agricultural farm and its natural, production and service environment, thereby ensuring an opportunity to improve the quality and living standard for the inhabitants of rural areas.
The essence of agritourism is the fact that it involves a specific type of tourist serv-ices and, what’s most important, sorts of these services and their quality. According to Krzyżanowska and Roman [2012], it is one of the most crucial factors which have an impact on this sort of activity. Agritourism it can be a specific local product [Dziekański et al. 2014].
According to Sikora [2012], an agritourism farm, like every business entity, requires economic analysis. Kutkowska [2003] also states that agritourism requires economic analysis and evaluation. On the other hand Marks-Bielska et al. [2014], as well as Roman [2015], are interested in the subject of agritourism, as a form of business activity.
•
••
Sources and structure of income of agritourism farms... 17
Oeconomia 15 (3) 2016
The income of agritourism farms has not been well analysed yet. Although it was the subject of research carried in Wielkopolskie Province [Jęczmyk et al. 2015], it hasn’t been investigated in details in mountainous regions. Hence, an attempt of this paper’s authors to analyse agritourism farms in the Polish Carpathian Mountains.
The Carpathian Mountains are the largest and most important mountain tourist region of Poland, the only one that features a mountain landscape [Lijewski et al. 2008]. The area of the Polish Carpathian Mountains belongs to the most attractive areas of Poland in terms of tourism. It is a region with unusual natural and cultural wealth. On the other hand, it is an area of small scale of farms and large work resources, and its production space is dominated by individual farms. Basic economic indicators that characterize the Polish Carpathian Mountains in respect of agriculture include: large number of agricultural farms, fragmented areal structure of farms, low soil bonitation index, large share of the area of ar-able lands covered by the support for disadvantaged areas, relatively low yields of plants, high share of permanent grasslands in the area of arable lands and low level of agricultural income [Musiał 2008].
PURPOSE, SCOPE AND RESEARCH METHODS
The purpose of the paper is indicating sources and assessment of the structure of income in agricultural farms conducting agritourism activities, located in the geographic region of the Polish Carpathian Mountains where natural and cultural conditions foster the develop-ment of this form of non-agricultural activities. The research hypothesis was formulated as follows: agritourism activities and income obtained have a significant impact on the eco-nomic situation of the surveyed agricultural farms in the Polish Carpathian Mountains.
The surveys covered over 240 small agricultural farms, located in 17 counties of Małopolskie, Podkarpackie and Śląskie Provinces. On the first stage about 10% of agri-tourism farms in the Polish Carpathian Mountains registered in the Institute of Tourism were investigated. On the basis of the results, the above agritourism farms and their activi-ties were described. The conclusions of the research were basis to a detailed analysis of the income of these farms.
On the second stage 73 farms were analysed which comprised approximately 30% of the total number of all farms investigated on the first stage. It comprised about 3% of all farms registered in the Institute of Tourism. In this paper the authors have presented the results from the second stage. Farms were selected purposefully for the surveys. The selec-tion criterion were: location of a farm in rural areas of the Polish Carpathian Mountains, registering and conducting agritourism activities for minimum three years, arable lands in less developed areas (LFA), a farm registered in the Agency for Restructuring and Mod-ernization of Agriculture (ARMA) as the beneficiary of direct payments.
The source data include the year 2011 and they were acquired by the method of stand-ardized interview using questionnaires. Questions included in it made it possible, among others, to calculate income from agricultural production, income from area payments (direct payments, payments for LFA, agro-environmental payments) and income from non-agricultural activities, i.e. agritourism, services accompanying agritourism, perma-nent or seasonal work of a farmer beyond the farm, own businesses and social benefits
18 J. Kania, M. Bogusz
Acta Sci. Pol.
(retirement pensions and disability pensions). Because of the difficulties connected with confirming data concerning the income not connected with farm activity, they are treated as estimated data. Hence, calculated structure of income reflects only the standpoint and opinions of respondents.
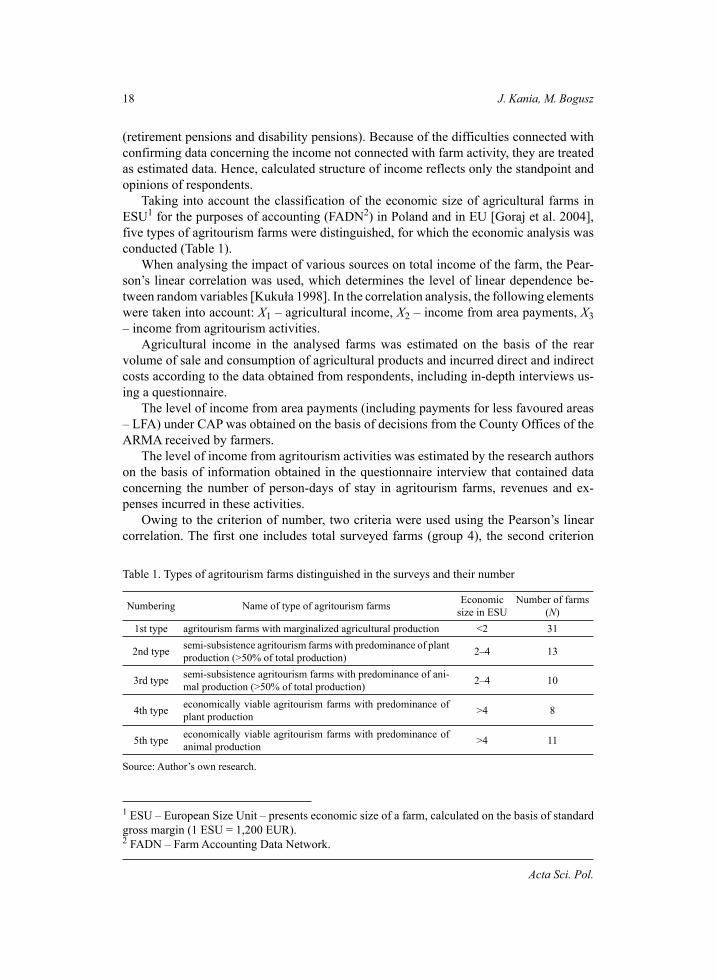
Taking into account the classification of the economic size of agricultural farms in ESU1 for the purposes of accounting (FADN2) in Poland and in EU [Goraj et al. 2004], five types of agritourism farms were distinguished, for which the economic analysis was conducted (Table 1).
When analysing the impact of various sources on total income of the farm, the Pear-son’s linear correlation was used, which determines the level of linear dependence be-tween random variables [Kukuła 1998]. In the correlation analysis, the following elements were taken into account: X1 – agricultural income, X2 – income from area payments, X3 – income from agritourism activities.
Agricultural income in the analysed farms was estimated on the basis of the rear volume of sale and consumption of agricultural products and incurred direct and indirect costs according to the data obtained from respondents, including in-depth interviews us-ing a questionnaire.
The level of income from area payments (including payments for less favoured areas – LFA) under CAP was obtained on the basis of decisions from the County Offices of the ARMA received by farmers.
The level of income from agritourism activities was estimated by the research authors on the basis of information obtained in the questionnaire interview that contained data concerning the number of person-days of stay in agritourism farms, revenues and ex-penses incurred in these activities.
Owing to the criterion of number, two criteria were used using the Pearson’s linear correlation. The first one includes total surveyed farms (group 4), the second criterion
1 ESU – European Size Unit – presents economic size of a farm, calculated on the basis of standard gross margin (1 ESU = 1,200 EUR).2 FADN – Farm Accounting Data Network.
Table 1. Types of agritourism farms distinguished in the surveys and their number
Numbering Name of type of agritourism farms Economic size in ESU
Number of farms(N)
1st type agritourism farms with marginalized agricultural production <2 31
2nd type semi-subsistence agritourism farms with predominance of plant production (>50% of total production) 2–4 13
3rd type semi-subsistence agritourism farms with predominance of ani-mal production (>50% of total production) 2–4 10
4th type economically viable agritourism farms with predominance of plant production >4 8
5th type economically viable agritourism farms with predominance of animal production >4 11
Source: Author’s own research.
Sources and structure of income of agritourism farms... 19
Oeconomia 15 (3) 2016
includes economic size of farm expressed in ESU (groups 1–3), thus the previously ana-lysed five types of farms were reduced to three groups in consequence of excluding in the typology the division of standard gross margin separately for plant production and animal production, but including the whole agricultural production. Therefore, the first group included farms <2 ESU, the second group 2–4 ESU and the third group included farms >4 ESU.
Calculating the standard gross margin (SGM) for plant and animal production as well as for the whole farm was possible on the basis of the data received from the area pay-ments and from the registration of animals (ARMA).
RESEARCH FINDINGS
Structure of income in agritourism farms by types of farms
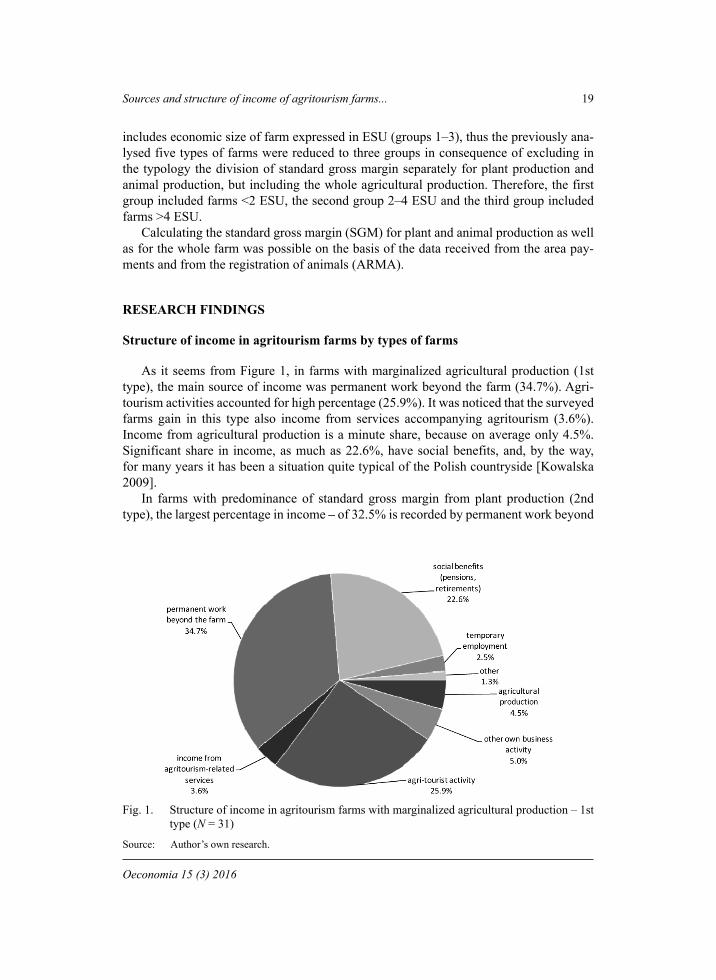
As it seems from Figure 1, in farms with marginalized agricultural production (1st type), the main source of income was permanent work beyond the farm (34.7%). Agri-tourism activities accounted for high percentage (25.9%). It was noticed that the surveyed farms gain in this type also income from services accompanying agritourism (3.6%). Income from agricultural production is a minute share, because on average only 4.5%. Significant share in income, as much as 22.6%, have social benefits, and, by the way, for many years it has been a situation quite typical of the Polish countryside [Kowalska 2009].
In farms with predominance of standard gross margin from plant production (2nd type), the largest percentage in income – of 32.5% is recorded by permanent work beyond
Fig. 1. Structure of income in agritourism farms with marginalized agricultural production – 1st type (N = 31)
Source: Author’s own research.
20 J. Kania, M. Bogusz
Acta Sci. Pol.
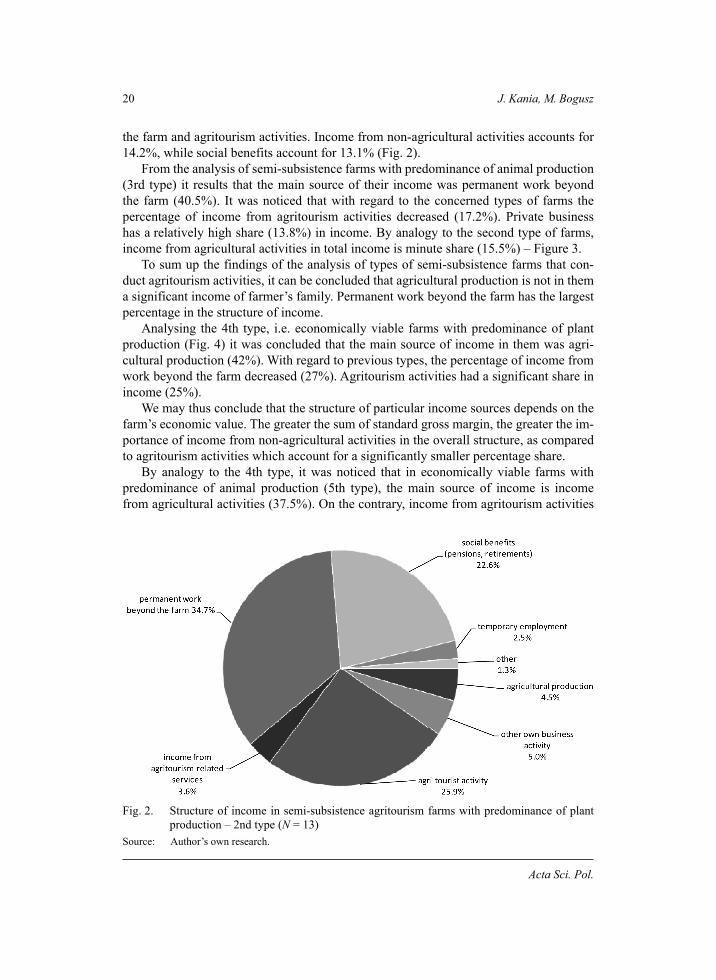
the farm and agritourism activities. Income from non-agricultural activities accounts for 14.2%, while social benefits account for 13.1% (Fig. 2).
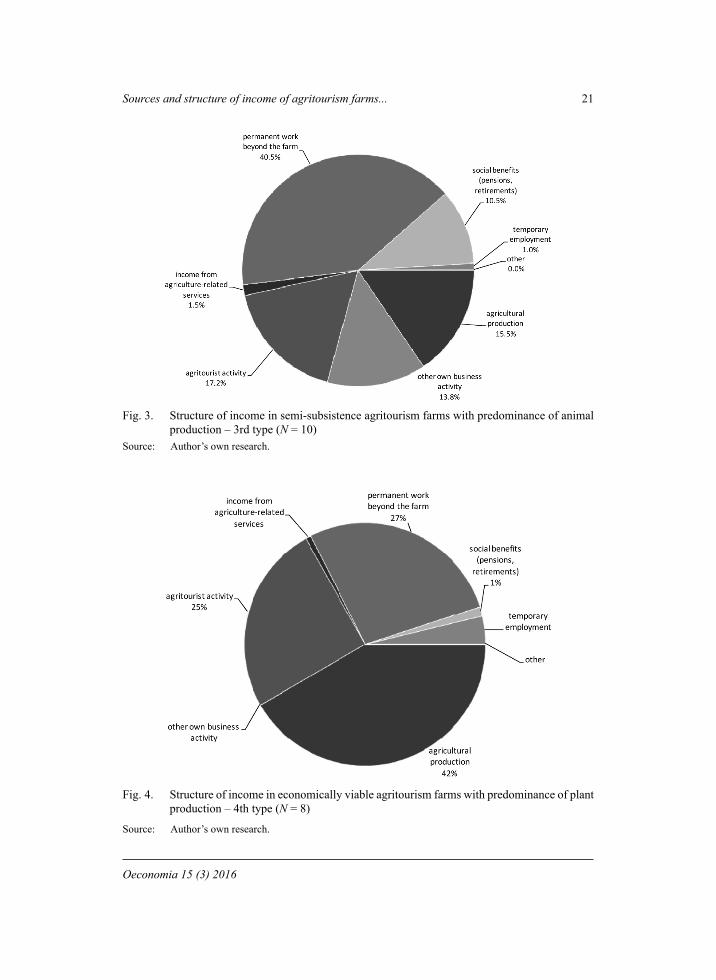
From the analysis of semi-subsistence farms with predominance of animal production (3rd type) it results that the main source of their income was permanent work beyond the farm (40.5%). It was noticed that with regard to the concerned types of farms the percentage of income from agritourism activities decreased (17.2%). Private business has a relatively high share (13.8%) in income. By analogy to the second type of farms, income from agricultural activities in total income is minute share (15.5%) – Figure 3.
To sum up the findings of the analysis of types of semi-subsistence farms that con-duct agritourism activities, it can be concluded that agricultural production is not in them a significant income of farmer’s family. Permanent work beyond the farm has the largest percentage in the structure of income.
Analysing the 4th type, i.e. economically viable farms with predominance of plant production (Fig. 4) it was concluded that the main source of income in them was agri-cultural production (42%). With regard to previous types, the percentage of income from work beyond the farm decreased (27%). Agritourism activities had a significant share in income (25%).
We may thus conclude that the structure of particular income sources depends on the farm’s economic value. The greater the sum of standard gross margin, the greater the im-portance of income from non-agricultural activities in the overall structure, as compared to agritourism activities which account for a significantly smaller percentage share.
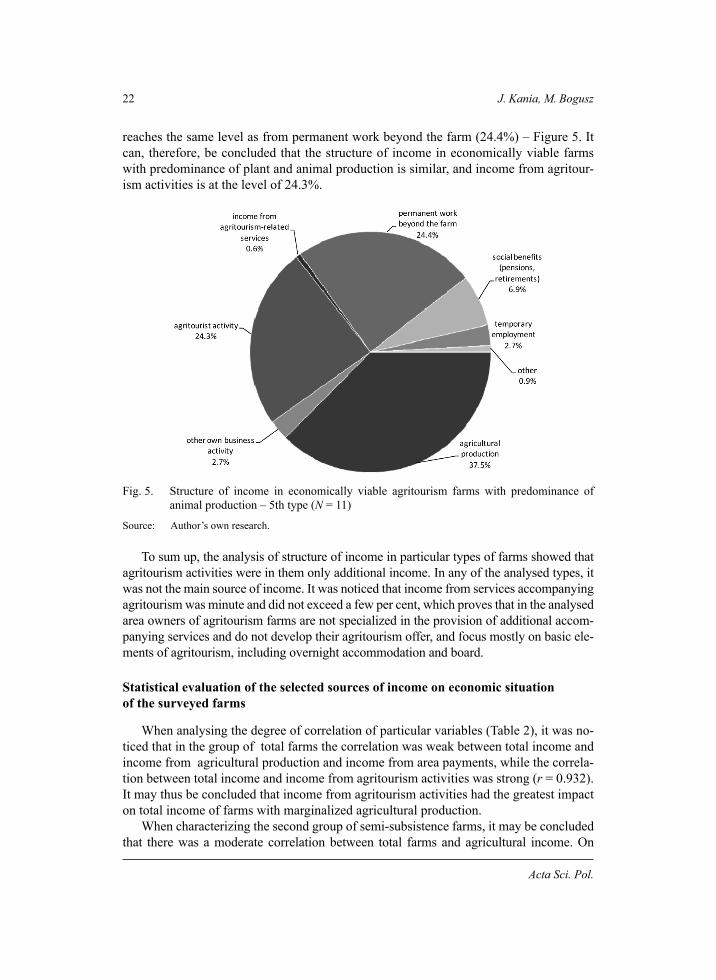
By analogy to the 4th type, it was noticed that in economically viable farms with predominance of animal production (5th type), the main source of income is income from agricultural activities (37.5%). On the contrary, income from agritourism activities
Fig. 2. Structure of income in semi-subsistence agritourism farms with predominance of plant production – 2nd type (N = 13)
Source: Author’s own research.
Sources and structure of income of agritourism farms... 21
Oeconomia 15 (3) 2016
Fig. 3. Structure of income in semi-subsistence agritourism farms with predominance of animal production – 3rd type (N = 10)
Source: Author’s own research.
Fig. 4. Structure of income in economically viable agritourism farms with predominance of plant production – 4th type (N = 8)
Source: Author’s own research.
22 J. Kania, M. Bogusz
Acta Sci. Pol.
reaches the same level as from permanent work beyond the farm (24.4%) – Figure 5. It can, therefore, be concluded that the structure of income in economically viable farms with predominance of plant and animal production is similar, and income from agritour-ism activities is at the level of 24.3%.
Fig. 5. Structure of income in economically viable agritourism farms with predominance of animal production – 5th type (N = 11)
Source: Author’s own research.
To sum up, the analysis of structure of income in particular types of farms showed that agritourism activities were in them only additional income. In any of the analysed types, it was not the main source of income. It was noticed that income from services accompanying agritourism was minute and did not exceed a few per cent, which proves that in the analysed area owners of agritourism farms are not specialized in the provision of additional accom-panying services and do not develop their agritourism offer, and focus mostly on basic ele-ments of agritourism, including overnight accommodation and board.
Statistical evaluation of the selected sources of income on economic situation of the surveyed farms
When analysing the degree of correlation of particular variables (Table 2), it was no-ticed that in the group of total farms the correlation was weak between total income and income from agricultural production and income from area payments, while the correla-tion between total income and income from agritourism activities was strong (r = 0.932). It may thus be concluded that income from agritourism activities had the greatest impact on total income of farms with marginalized agricultural production.
When characterizing the second group of semi-subsistence farms, it may be concluded that there was a moderate correlation between total farms and agricultural income. On

Sources and structure of income of agritourism farms... 23
Oeconomia 15 (3) 2016
the other hand, total income of farms to income from area payments was hardly signifi-cant (low correlation). A considerable dependence was recorded between total income of farms and income from agritourism activities (r = 0.836). Therefore, in 2nd group of farms 2–4 ESU (semi-subsistence) the income from agritourism had the strongest dependence.
The third group of farms >4 ESU (economically viable farms): the correlation be-tween total income of farms and particular sources of income was positive. It was proven that the greatest degree of correlation was between total income of farms and income from agritourism activities (r = 0.889). A high correlation was present also between total income of farms and income from area payments (r = 0.680).
It may be concluded that in all the surveyed farms the largest dependence was be-tween total income from farms and agritourism activities, which is positive from the point of view of promotion and development of agritourism.
When characterizing the fourth group (all 73 surveyed farms), high correlation was noticed between total income and farms and agricultural income and income from area payments. On the other hand, very strong dependence (very high correlation) was be-tween total income of farms and income from agritourism activities (r = 0.844). In turn, income from area payments was most important in economically viable farms.
Table 2. Correlation for surveyed groups of farms between ESU and different income categories
Specifi cation
Categories of income
agricultural incomeX1
area paymentsX2
income from agritourism activities
X3
n r n r n rGroup 1: <2 ESU, Y1 31 0.181 31 0.138 31 0.932Group 2: 2–4 ESU, Y2 23 0.595 23 0.200 23 0.836Group 3: >4 ESU, Y3 19 0.540 19 0.680 19 0.889Group 4: total surveyed farms, Y4 73 0.630 73 0.671 73 0.844
n – number of farms;r – value of Pearson’s linear correlation coefficient;Y1 – Y4 – total income of agricultural farms;Source: Author’s own research.
When analysing the degree of correlation between total income of farms and three sources of income, i.e.: from agricultural activities, area payments and agritourism ac-tivities a strong correlation was shown between variables, and agritourism activities had definitely the greatest impact on total income.
CONCLUSIONS
The analysed research results were the basis to reach the aim of the research that is indicating the sources and estimating the structure of income in agritourism farms.
As it results from the conducted analysis, the structure of income in the surveyed types of farms was diverse. Only in the fourth and fifth type, where economic size
24 J. Kania, M. Bogusz
Acta Sci. Pol.
exceeds 4 ESU, the main source of income was agricultural production (42 and 37.5%, re-spectively), however, it was not a significant advantage. In all of the surveyed agritourism farms part of other household members, apart from work in agriculture, were performing other activities, mainly working for economic purposes (as hired workers) beyond the farm, or on the basis of self-employment.
The survey also proved that in each of distinguished types of farms, the structure of income included social benefits which, in semi-subsistence farms and in farms with mar-ginalized production accounted for even over 10%.
Considering the structure of income of the surveyed farms it should be noted that non-agricultural occupational activity of farming population is necessary, as it raises the standard of living of agricultural families. In addition, large agrarian fragmentation in the area of the Polish Carpathian Mountains and unfavourable conditions of management justify the need for setting up small businesses with the use of farm’s resources, e.g. in agritourism activities, but also they justify the need for working beyond the farm. The diversity of the structure of income of the surveyed farms and presence of income from small entrepreneurship should be considered as a positive phenomenon.
The social and economic conditions of rural areas of the Polish Carpathian Mountains, with a large agrarian fragmentation, unfavourable conditions of management, often not regulated ownership of farms, as well as mental considerations constitute an important barrier in agricultural production in that area. Alternative sources of income – especially agritourism become more and more important in the development of those areas.
From the analysis of the obtained survey findings it can be concluded that the struc-ture of income of the surveyed farms in the Polish Carpathian Mountains is dominated by non-agricultural additional sources of income, i.e. agritourism activities, services ac-companying agritourism, private business, permanent or seasonal farmer’s work beyond the farm and social benefits (pension and retirement), rather than income obtained from agricultural production.
Strong dependence, i.e. positive correlation of total income from a farm to income from agritourism, enables concluding that growth in income of the surveyed farms is mainly an effect of successful agritourism activities.
The level and structure of obtained income in the surveyed farms shows clearly that agritourism occupational activity of agricultural population significantly raises the stand-ard of living of agricultural families by generating additional sources of income. It ena-bles verifying the research hypothesis that conducting agritourism activities and obtained income have a significant effect on the economic situation of agricultural farms within the area of the Polish Carpathian Mountains.
ŹRÓDŁA I STRUKTURA DOCHODÓW GOSPODARSTW AGROTURYSTYCZNYCH W KARPATACH POLSKICH
Streszczenie. W pracy dokonano analizy i oceny źródeł oraz struktury dochodów w drob-nych gospodarstwach agroturystycznych, położonych w regionie Karpat Polskich. Dane empiryczne uzyskano przy użyciu kwestionariusza wywiadu z 73 gospodarstw. Ich analiza
Sources and structure of income of agritourism farms... 25
Oeconomia 15 (3) 2016
pozwoliła na wyodrębnienie pięciu typów, tj. gospodarstwa agroturystyczne ze zmargi-nalizowana produkcją rolniczą poniżej 2 ESU, gospodarstwa niskotowarowe z przewagą produkcji roślinnej 2–4 ESU lub z przewagą produkcji zwierzęcej 2–4 ESU oraz gospodar-stwa żywotne ekonomicznie z przewagą produkcji roślinnej powyżej 4 ESU lub z przewagą produkcji zwierzęcej powyżej 4 ESU. Wykazano, że w strukturze dochodów wszystkich typów badanych gospodarstw agroturystycznych dominują pozarolnicze źródła dochodów, tj. agroturystyka i usługi towarzyszące oraz stała lub sezonowa praca poza gospodarstwem, działalność gospodarcza, a także świadczenia społeczne – renty i emerytury, a nie dochody z produkcji rolniczej. Największy i dodatni wpływ na dochodowość badanych gospodarstw wywierają dochody z działalności agroturystycznej.
Słowa kluczowe: agroturystyka, drobne gospodarstwa, źródła dochodów, Karpaty Polskie
REFERENCES
Bogusz, M., Kiełbasa, B. (2014). Wpływ środków pomocowych Unii Europejskiej na tworzenie gospodarstw młodych rolników. Polskie Wydawnictwo Ekonomiczne, Marketing i Rynek, 10, 96–104.
Dziekański, P., Olak, A., Pytka, S. (2014). Marketing terytorialny – gmina i jej promocja. MUL-TIPRINT, Wyższa Szkoła Biznesu i Przedsiębiorczości w Ostrowcu Św. Koszyce – Ostrowiec Świętokrzyski – Zagnańsk.
Goraj, L. et al. (2004). Rachunkowość rolnicza. Difi n, Warszawa. Jęczmyk, A., Uglis, J., Graja-Zwolińska, S., Maćkowiak, M., Spychała, A., Sikora, J. (2015). Eco-
nomic benefi ts of agritourism development in Poland: an empirical study. Tourism Economics Fast Track, 21 (5), 1120–1126.
Kania, J. (2009). Wkład programu SAPARD w rozwój gospodarstw rolnych w Polsce. Roczniki Naukowe SERiA, 11 (5) 112–118.
Kania, J., Bogusz, M. (2010). Efekty pracy doradczej we wdrażaniu instrumentów Wspólnej Po-lityki Rolnej na przykładzie województwa małopolskiego. Roczniki Naukowe SERiA, 12 (5) 73–77.
Kowalska, M. (2009). Standard materialny i źródła utrzymania wielopokoleniowych rodzin wiej-skich w Małopolsce. Roczniki Naukowe SERiA, 11 (4), 154–158.
Kukuła, K. (1998). Elementy statystyki w zadaniach. Wydawnictwo Naukowe PWN, Warszawa.Krzyżanowska, K., Roman, M. (2012). Metoda servqual jako narzędzie pomiaru jakości usług ofe-
rowanych w gospodarstwach agroturystycznych. Zeszyty Naukowe Uniwersytetu Szczecińskie-go, Ekonomiczne Problemy Usług, 86, 278–288.
Kutkowska, B. (2003). Podstawy rozwoju agroturystyki. Wydawnictwo Akademii Rolniczej we Wrocławiu, Wrocław.
Lijewski, T., Mikułowski B., Wyrzykowski, J. (2008). Geografi a turystyki Polski. PWE, Warszawa. Marks-Bielska, R., Babuchowska, K., Lizinska, W. (2014). Agritourism as a form of business acti-
vity in rural areas. Acta Scientiarum Polonorum, Oeconomia, 13 (3), 69–79.Musiał, W., Wojewodzic, T. (2008). Przesłanki upadku ekonomicznego gospodarstw rolniczych na
obszarach górzystych. Problemy Zagospodarowania Ziem Górskich, 55, 19–31. Musiał, W., Kania, J., Leśniak, L. (red.) (2005). Agroturystyka i usługi towarzyszące. Wydawni-
ctwo MSDR zs. w AR, Kraków.Roman, M. (2015). Profi tability of selected agritourism farms. Journal of Financial Management
and Accounting, 3, 1, 39–46.

26 J. Kania, M. Bogusz
Acta Sci. Pol.
Satoła, Ł. (2009). Przestrzenne zróżnicowanie absorpcji funduszy strukturalnych przeznaczonych na rozwój pozarolniczej działalności na obszarach wiejskich. Zeszyty Naukowe SGGW, Proble-my Rolnictwa Światowego, 7 (22), 133–142.
Sikora, J. (1999). Organizacja ruchu turystycznego na wsi. WSiP, Warszawa.Sikora, J. (2012). Agroturystyka. Przedsiębiorczość na obszarach wiejskich. Wydawnictwo
C.H. Beck, Warszawa. Wiatrak, A.P. (1996). Wpływ agroturystyki na zagospodarowanie obszarów wiejskich. Zagadnienia
Ekonomiki Rolnej, 1, 34–46.Zegar, J.S. (1999). Ludność rolnicza i gospodarstwa chłopskie w Świetle Powszechnego Spisu
Rolnego 1996 roku. Wydawnictwo IERiGŻ, Warszawa. Zegar, J.S. (2004). Dochody w strategii rozwoju rolnictwa (na progu integracji europejskiej). Wy-
dawnictwo IERiGŻ, Warszawa.
Accepted for print: 06.07.2016
For citation: Kania J., Bogusz M. (2016). Sources and structure of income of agritourism farms in the Polish Carpathian Mountains. Acta Sci. Pol., Oeconomia, 15 (3), 15–26.
Oeconomia 15 (3) 2016, 27–34
ISSN 1644-0757eISSN 2450-4602
http://acta_oeconomia.sggw.pl
Corresponding author: Małgorzata Kieżel, University of Economics in Katowice, Faculty of Man-agement, Department of Market Policy and Marketing Management, Bogucicka 14, 40-226 Kato-wice, Poland, e-mail: [email protected]
© Copyright by Warsaw University of Life Sciences Press, Warsaw 2016
INNOVATIONS OF RETAIL BANKS – EXPRESSION OF RELATIONSHIP MARKETING OR PRODUCT ORIENTATION?
Małgorzata KieżelUniversity of Economics in Katowice
Abstract. The goal of the paper is to identify innovative solutions implemented by retail banks in the context of assumptions of paradigm of relationships and features of product orientation. The paper is based on the analysis of the literature of the subject, and it applies documentation method including analysis of secondary sources concerning the studied sector, as well as qualitative case research of several banks that implement particularly active innovative policy. Thanks to conducted research it is ascertained that banks aim at providing customers with a broad scope of benefits while applying, for this purpose, active innovative policy and offer individualisation, frequently on the basis of new technologies. Even if it is convergent with the assumptions of the paradigm of relationships, it should be indicated that some banking products are based on advanced solutions that may surpass real market demands. In this case such operations are closer to implementation of assumptions of product orientation.
Key words: innovations, retail banks, relationship marketing, marketing orientations
INTRODUCTION
Retail banks currently supply the market with really developed, innovative product offer. It is often dictated by changes occurring in the structure of buyers’ needs. Aiming to provide customers with broad range of benefits, often on the basis of active innovative policy and offer individualisation, is characteristic of the assumptions of the paradigm of relationships. At the same time, some banking products, particularly those that apply new technologies, are innovations, the advanced solutions of which sometimes surpass the real market needs. They can even be considered artificial innovations, often supported
28 M. Kieżel
Acta Sci. Pol.
by aggressive promotional activities that ought to reinforce hard selling, and not the best satisfaction of needs. In this case the activities are closer to implementation of assump-tions of product orientation.
The goal of the paper is to identify innovative solutions implemented by retail banks in the context of assumptions of the paradigm of relationship marketing and features of product orientation. It is assumed that in some areas of innovative policy of banks, quali-ties of regression (from the customers’ point of view), as well as the return to assumptions of product orientation are observed. The paper is composed of two parts, where part one includes description of the essence of enterprise orientation as well as major assumptions of product orientation and relationship marketing. The second part is focussed on descrip-tion of selected examples of innovations implemented by some banks in the context of the importance of use of new technologies as an essential condition for application of the assumptions of relationship orientation.
MATERIAL AND METHODS
The method of documentation, including analysis of secondary sources from the stud-ied sector and qualitative case research (scientific case studies) illustrating the latest in-novative practices of selected banks in the context of significance of application of new technologies are applied in the paper. For the purpose of general description of fundamen-tal categories, the theoretical part is based on analysis of the literature of the subject.
ORIENTATION OF ENTERPRISE – FOCUS ON PRODUCT AND RELATIONSHIPS
Enterprise orientation is a set of particularly important criteria adopted by the entity, and supporting decision-making on all management levels. It is also a collection of prin-ciples guiding workers’ conduct in their operational activity. It can be assumed that it is a set of fundamental behaviours in the enterprise [Knecht 2005].
In literature sources that describe the process of evolution of attitudes and market behaviours of entrepreneurs, four basic stages of this process and types of entrepreneurs’ orientations corresponding to them are most often distinguished [Dietl 1985]. They are orientations that are broadly described in the literature: production orientation, sales ori-entation (distribution), customer orientation (marketing) and marketing strategic orienta-tion [Garbarski (Ed.) 2011]. However, it ought to be indicated that the process of shaping of orientation is not finished with the classical marketing option.
These concepts change depending on many elements of broadly perceived environ-ment. The determinants include for example progressing integration of national economic systems, creation of international and global economic structures but also excessive op-erational costs of enterprises that can be related to failures in implementation of innova-tions on market, their low quality, too high distribution costs or inappropriate promotional policy. Increasingly higher demands of customers who look for an offer adjusted to indi-vidual requirements and needs, and who present lower level of loyalty are also important.
Innovations of retail banks – expression of relationship marketing... 29
Oeconomia 15 (3) 2016
Evolution of strategic orientations is a response to these changes among others. Moving from traditional marketing towards its successive, new types, including relationship mar-keting, is expressed mainly by profound changes in customer orientation, which allows for better satisfaction of customers’ needs and expectations.
In product orientation it is assumed that for a particular price, consumers strive to buy products and services of the highest quality. This is accompanied by conviction of enter-prises that customers expect that the products should have various sophisticated qualities and additional functions [Żurawik 1996]. Therefore enterprises adopting such a concept of activity mainly emphasise improvement in the offer quality, however, they do not always take into consideration really actual (or even real) customers’ needs and prefer-ences. Conducting own advanced research and development work or using innovative technologies that are made accessible, is typical of this orientation. Consequently, it is possible to implement innovative solutions that in their assumptions, serve improvement of the product quality and/or increasing the bundle of profits offered by the product to the customers. Recognising real changes in buyers’ needs is an essential condition for success of this approach, so that resources are not wasted on implementation on useless changes. Otherwise, they can become “technologists’ favourite child”, without a real demand from customers.
Unstable market environment forced focussing on establishment of permanent rela-tionships with customer, which contributed to the occurrence of changes in marketing ori-entation of enterprise. Currently, a lot of entities point at establishment and maintenance of relationships with customers in the way that ensures long-term profits for the enterprise. Innovations1 constitute an important reason for establishment of long-term relationships with customers. According to the concept of relationship marketing, innovations are as-sessed from the point of view of customers – they provide them with new values through creation of new products, technologies, ideas, approaches and systems in such a way that they increase the level of satisfaction and loyalty [Dobiegała-Korona 2010].
Enhancing relationships with customers is also the basis for prosumption that rep-resents the possibility to perform two roles by the customer: of the producer and of the consumer. This can result in more complete use of their knowledge that constitutes an important determinant for creation of innovations adjusted to customers’ needs [Kieżel 2015]. It is important for the concept of relationship marketing where customers are not only the recipients of new products and their direct users, but creators of a new product and technological concepts [Lettl and Gemunden 2005].
Tony Cram defines relationship marketing as a consistent application of updated knowledge about customers for designing a product/service that is communicated in an interactive way, for the purpose of development and continuation of mutually profitable relationships [Cram 1994]. The necessity of shaping products on the basis of information obtained from buyers is clearly emphasised here, thanks to which they can be individual-ised and they really correspond to their needs.
At the same time it ought to be indicated that currently, innovations are not only identified with implementation of innovations or changes in the product, process or tech-
1 It is emphasised in the literature that the role of innovations in establishment of permanent rela-tionships with customers is growing in circumstances of crisis [Makovec Brencic et al. 2012].
30 M. Kieżel
Acta Sci. Pol.
nology. They are becoming an integral part of functioning and development of every organisation. There occurs explicit integration of the function of innovation with other functions in the enterprise and increasingly more often with other cooperating entities [Sadkowska-Bień 2007]. Such cooperation ought to improve the process of creation of values on market, particularly in the case of systemic products offered within the net-work. It is often characterised by high level of technological advancement (particularly in the sphere of information and tele-communication technologies), and enterprises apply new, sophisticated designing techniques while creating them2.
INNOVATIONS IMPLEMENTED BY BANKS AND BASED ON NEW TECHNOLOGIES IN THE CONTEXT OF DEMANDS OF ENTERPRISE ORIENTATION
New information technologies are extensively used by banks for the purpose of im-provement of existing products and implementation of innovations. They also contribute to development of communication capabilities of banks, supporting data processing, stor-ing information and constant development of knowledge about customer. These benefits enable banks to implement the main assumptions of the concept of relationship market-ing while enabling collecting and processing information about customers, and thereby enhancing the chance for long-lasting cooperation and probability to offer products that will be attractive for customers.
Relationship marketing assumes that processes are customised to a particular cus-tomer and they should bring satisfaction of their needs. Development of information tech-nology sector made it possible for banks to produce and provide customised products and services. Information technology solutions available nowadays allow for dividing markets into increasingly smaller segments, to the smallest one represented by individual customer. Thanks to devices that give both parties in the relationships the same chance to establish contact, it is not only possible to conduct individualised marketing operations, but frequently also to offer “tailored” services in cooperation with customer.
Really rapid implementation of innovations, mainly technological is observed in banking. Still a few years ago internet accounts were an exotic innovation, and currently there are over 20 millions of such accounts out of which a definite majority is active. Polish banking sector is nowadays one of the most innovative and most rapidly develop-ing in the world. New solutions provided for customers’ use by domestic banks, more and more frequently gain recognition among sector specialists; they receive prestigious awards and are becoming a model to follow by competitors from the whole world. New services of Polish banks were described by prestigious “American Banker” among others (http://natemat.pl/125031,innowacje-w-dziedzinie-bankowosci-elektronicznej).
According to experts in the sector, high level of innovations in banking sector in Po-land is determined by a series of factors. Without any doubts it is important that Polish
2 At the same time it ought to be noticed that many systemic products, particularly complex sys-temic service products do not need to be characterised by the highest technological level in the sphere of all services – components they are formed of.
Innovations of retail banks – expression of relationship marketing... 31
Oeconomia 15 (3) 2016
people willingly accept new technologies, both on demand and supply side. This can be confirmed by the data of Związek Banków Polskich (Association of Polish Banks) indicating that in the 3rd quarter of 2015 over 30 million customers had access to online banking. In comparison with the same period of the previous year this represents increase by 24.3%. The number of mobile banking users is also rapidly growing. Nearly 5 million customers use banking services on mobile devices (http://prnews.pl/wiadomosc/ponad-5-mln-klientow-korzysta-z-bankowosci-w-telefonie-lub-tablecie-3473994.html).
This trend is also used by banks while offering their customers applications for tablets and smartphones. Traditional money transfers, also those made through Internet transac-tion services are still most reliable solution, however they are slowly growing old. Nowa-days more and more banks offer their customers the possibility to make money transfers to a phone number or e-mail address. The only thing needed to conduct such a transfer is the contact details to the recipient (their phone number or e-mail address). Other ele-ments together with classical account number are unnecessary. For several months in some banks it has also been possible to transfer money via Facebook.
In mobile banking currently two main trends are effective: some banks focus on re-sponsive web design (RWD), and some others on native applications. The second option was chosen by Bank Pekao among others. It developed a new program “Pekao24 na tab-lety” (Pekao24 for tablets), (http://prnews.pl/hydepark/bank-pekao-udostepnil-aplikacje-na-tablety-z-managerem-finansow-6551885.html). The application includes basic trans-actional functions that allow for everyday “banking”, including obtaining information about operations on the account, making money transfers, opening deposits or checking balance of possessed products. The tablet version has a new money transfer form in which the scope of necessary boxes is limited to minimum. Financial manager based on PFM module (Personal Financial Management) is the second function of the application. It is a tool for managing household budget. It automatically categorises customers’ expendi-tures and shows them in one of six groups: housing, transport, health, entertainment and recreation, bills, education and children. New solutions associated with the way loans are granted are examples of innovations implemented by banks. Customers of Millenium Bank, interested in such a product can apply online or via telephone, but also using a spe-cial option in the cash point menu. The amount of loan (up to 2 thousand PLN for the period of up to 2 years) is found on the customer’s account in a few minutes and is more profitable than the popular “short-term loans” with respect to the interest rate.
Lion’s Bank card, of Idea Bank brand, serving wealthy customers, is another inter-esting example of innovation. The card is the first metal credit card in the world (made from alloy of zinc, nickel and copper) of irregular shape that looks like a key. Master Key World Elite MasterCard has a very exclusive nature and is offered to the richest contrac-tors, therefore it does not have an upper limit of debt. Apart from prestige, its user obtains the possibility to use many privileges including for example dinner with Dalajlama or climbing the opera building in Sydney (https://masterkey.lionsbank.pl).
The aforementioned Idea Bank also created an interesting innovation for entrepre-neurs that so far has had no equivalent on market. Idea Hub is an unusually arranged space intended for co-working, where the bank customers can go to work, meet a contrac-tor or use previously booked meeting room. The room is equipped with Wi-Fi, electronic and office equipment (including a printer) and also free coffee and current press. This is
32 M. Kieżel
Acta Sci. Pol.
a convenient solution for small and medium-size companies that not always have their own office spaces (https://www.ideabank.pl/idea-hub).
Idea Bank that is clearly focussing on innovations also surprised its customers and the whole banking sector with implementation of fully innovative solution in the form of mobile cashpoints on wheels. Vehicles of Idea Bank, in which it is possible to withdraw and deposit money, went to the streets of several Polish cities. With the use of an appli-cation on the smartphone, customers can also call for such a wheeled ATM to arrive at a specified address, just like they call for a taxi.
On the other hand, GetinBank offered its customers MasterCard Display, which is a card with miniature display unit showing the current account balance of the owner and various communications from the bank. It can also be used as a token to confirm a trans-action in GetinBank internet banking services while replacing traditional text messages or scratch cards. MasterCard Display uses two separate PIN numbers, one is for confirming payments and the other one for using the display placed on the card. MasterCard Display, similarly to majority of currently issued payment cards, also has the function of contact-less payment. The card is produced by Oberthur Technologies, the same company that supplies the Master Key World Elite metal card to Idea Bank (https://www.getinbank.pl/klienci-indywidualni/oferta/karty/karta-debetowa-mastercard-display).
DISCUSIONS AND CONCLUSIONS
Currently banks aim at providing customers with a broad scope of benefits while applying active innovative policy and offer customisation for this purpose. It ought to serve satisfaction of needs in the best way. At the same time some banking products implement solutions that surpass actual customers’ needs. They are a result of technologi-cal race of banks and are closer to implementation of product orientation. Self-service branches of Getin Bank that occurred in several shopping malls (for example in Warsaw and Katowice) can be indicated as examples here. Getin Point that in principle was to allow consumers to use its functionality independently (and bring the bank reduction of service costs), initially demanded more bank workers. They were necessary to explain the customers how it worked and to help customers use this innovation. The same is observed in the case of NFC payments implemented by banks. However, the scale of their applica-tion by individual customers is not as big as banks hoped for and expected.
Product innovations implemented by banks are also frequently encouraged by aggres-sive promotional activities that aim at supporting hard selling and not best satisfaction of customers’ needs. This is the case of loans with “innovative” formulas of charging the interest that are accompanied by intense, friendly campaign. It aims at encouraging to use the benefits they offer, while actually they are not as attractive as it is shown in ad-vertising communication. Similar conclusions can be formulated in the case of modified formulas of bank deposits.
Summing up, in innovative operations of banks, a lot of actions are convergent with the assumptions of the paradigm of relationships. Modernisation of offer thanks to new technological solutions allows banks for recognising, understanding, motivating and serving individual customer as never before. At the same time, the fact that banks seek
Innovations of retail banks – expression of relationship marketing... 33
Oeconomia 15 (3) 2016
for technological innovations sometimes turns out to be the source of implementation of artificial innovations that mainly support interests of banks and not real needs of target groups, which can be considered an expression of regression to product orientation.
REFERENCES
Cram, T. (1994). The Power of Relationship Marketing, Pitman Publishing, London.Dietl, J. (1985). Marketing. PWE, Warszawa.Dobiegała-Korona, B. (2010). Strategie innowacji w budowie kapitału klienta [Strategies of Inno-
vations in Formation of Customer’s Capital]. [In:] B. Dobiegała-Korona, T. Doligalski (Eds), Zarządzanie wartością klienta. Pomiar i strategie [Management of the Value for Customer. Me-asurement and Strategies]. Poltext, Warszawa.
Garbarski, L. (Ed.) (2011). Marketing. Kluczowe pojęcia i praktyczne zastosowania [Marketing. Key notions and Practical Applications]. PWE, Warszawa.
Kieżel, M. (2010). Otwarta architektura produktowa w bankowości prywatnej i osobistej, jako odpowiedź na potrzeby rynku zamożnych klientów [Open Product Architecture in Private and Personal Banking as a Response to Market Needs of Wealthy Customers]. [In:] J. Kall, B. Sojkin (Eds), Zarządzanie produktem. Kreowanie produktu [Product Management. Product Creation]. ZN UE Poznań, 153.
Knecht, Z., (2005). Zarządzanie i planowanie marketingowe [Management and Marketing Plan-ning]. C.H.Beck, Warszawa.
Lettl, Ch., Gemunden H.G. (2005). The entrepreneurial role of innovative users. Journal of Business & Industrial Marketing, 20, 7, 340.
Makovec Brencic, M., Pfajfar, G., Raiakovic, M. (2012). Managing in the time of crisis: marketing, HRM and innovations. Journal of Business & Industrial Marketing, 27, 6, 436–446.
Sadkowska-Bień, J. (2007). Narzędzia ochrony przemysłowej w procesie zmian innowacyjności przedsiębiorstw [Tools of Industry Protection in the Process of Changes in Innovativeness of Enterprises]. [In:] Wspólna Europa – tworzenie wartości przedsiębiorstw w warunkach Unii Europejskiej TRANS’07 [Common Europe – Creation of Enterprise Values in Conditions of European Union TRANS’07] H. Brdulak, E. Duliniec, T. Gołębiewski (Eds). SGH, Warszawa.
Żurawik, B. (1996). Zarządzanie marketingiem w przedsiębiorstwie [Management of Marketig in Enterprise]. PWE, Warszawa.
INNOWACJE BANKÓW DETALICZNYCH – PRZEJAW MARKETINGU RELACJI CZY ORIENTACJI NA PRODUKT?
Streszczenie. Celem artykułu jest identyfikacja rozwiązań innowacyjnych wprowadzanych przez banki detaliczne w kontekście założeń paradygmatu relacyjnego oraz cech orientacji na produkt. W referacie wykorzystano analizę literatury przedmiotu oraz metodę dokumen-tacyjną obejmującą analizę źródeł wtórnych z badanego sektora oraz badania jakościowe case research dla kilku banków, ze szczegółowym uwzględnieniem aktywnej polityki in-nowacyjnej. Dzięki przeprowadzonym badaniom ustalono, że banki dążą do zapewnienia klientom szerokiego zakresu korzyści, wykorzystując w tym celu aktywną politykę innowa-cyjną oraz indywidualizację oferty, bardzo często opierając się przy tym na nowoczesnych technologiach. Jest to wprawdzie zbieżne z założeniami paradygmatu relacyjnego, jednak należy zwrócić uwagę, że część produktów bankowych stosuje zaawansowane rozwiąza-
34 M. Kieżel
Acta Sci. Pol.
nia, które niekiedy przerastają realne potrzeby rynku. Działania takie są wówczas bliższe realizacji założeń orientacji na produkt.
Słowa kluczowe: innowacje, banki detaliczne, marketing relacji, orientacje marketingowe
Accepted for print: 11.08.2016
For citation: Kieżel M. (2016). Innovations of retail banks – expression of relationship marketing or product orientation? Acta Sci. Pol., Oeconomia 15 (3), 27–34.
Oeconomia 15 (3) 2016, 35–43
ISSN 1644-0757eISSN 2450-4602
http://acta_oeconomia.sggw.pl
Corresponding author: Ryszard Kłeczek, Wrocław University of Economics, Faculty of Economic Sciences, Komandorska 118/120, 53-345 Wrocław, Poland, e-mail: [email protected]© Copyright by Warsaw University of Life Sciences Press, Warsaw 2016
HOW THE COMPANY’S ACTIONS INFLUENCE NON-FINANCIAL AND FINANCIAL VALUE DRIVERS: MANAGERS’ PERCEPTIONS IN POLISH FIRMS
Ryszard KłeczekWrocław University of Economics
Abstract. This article has two main purposes: to suggest an explanation model of value creation in business that presents the influence of actions on non-financial and financial value drivers and to identify (based on qualitative research) patterns in which managers in Polish firms perceive this influence. Method used in the research is to generate self--reports about how actions performed in the firms influence value drivers, and to identify repeating (replicating) patterns of such influences in the content of these stories. Author of the article has identified three patterns in which particular actions influence non-financial and financial value drivers: actions that increase productive time outweigh actions that increase knowledge in the firms; there are no stories reported about how the reported actions influence new product introductions; only two of eight financial value drivers are perceived as final effects of the performed actions.
Key words: value drivers, value creation, productive time, knowledge management
INTRODUCTION
Explanation of how value (NPV) is created involves answering three questions: how to measure and manage the value; how to measure and manage the intangible assets; what actions (and relevant spending) can be used as the causes of increase of the immaterial assets (measured by non-financial value drivers) and the value (measured by financial value drivers).
The purpose of this article is to suggest an explanation model of value creation in business that uses actions as causes and value drivers as effects and to identify (based on qualitative research) patterns in which managers in Polish firms perceive these cause-ef-fect relations.
36 R. Kłeczek
Acta Sci. Pol.
FINANCIAL AND NON-FINANCIAL VALUE DRIVERS IN EXPLAINING VALUE CREATION IN BUSINESS
Alfred Rappaport [1986] proposed the concept of financial value drivers as an answer to the question of how to increase value (NPV) in business. The financial value drivers were defined as ways to increase the value or the elements that need to be known to compute value:1. Revenue growth rate.2. Increase of operating profit margin.3. Reduction of taxes paid. 4. Increase of effectiveness of working capital investment. 5. Increase of effectiveness of fixed capital investment.6. Reduction of cost of capital. 7. Extension of ability to generate cash over the cost of capital.8. Development of new business unit (new source of cash generation).
The authors explaining processes of value creation with the usage of financial value drivers usually argue that: financial value drivers are better measures of financial success than the accounting measures [Rappaport 1981, 1983, 1986, 1988] and measures of em-ployees’ control and motivation (Key Performance Indicators) should be based on the finan-cial value drivers [Ittner et al. 1997, Gorzeń et al. 2008, Sowińska-Bonder and Fietkiewicz 2008] because it reconciliates (at least partially) the interests of employees and owners.
The concept of financial value drivers raises the question: what are non-financial value drivers? What do they measure? What is their relation to financial value drivers? Various authors suggest different concepts of non-financial value drivers. Srivastava et al. [1998] and Rust et al. [2004] suggest that non-finanacial value drivers: brand awareness and image, and buyer loyalty, are equal to intangible assets. Other authors [Anderson et al. 1992, Ingram et al. 1997] suggest that the non-financial value drivers measure: the number of sales contacts with the target buyers – this is the measure of productive time (the time in which the employee’s key competences are used) of salespeople; and the ratio of gained transactions to contacts with target buyers – this is the measure of knowledge that is used during the contacts with the target buyers. Consequently, the two non-finan-cial value drivers measure two intangible assets: productive time and the employees’ knowledge. Kaplan and Anderson suggest [2004] that the productive time (the time in which the activities that are needed to serve the client are performed) is the intangible asset. Kłeczek [2014, 2015] suggests that there are two non-financial value drivers that measure two intangible assets: the number of activities (cycles) in which the employee’s key competences are used (they measure productive time of employees); and the ratios between the number of successful results of the activities (cycles) and the number of the activities (the cycles) that are treated as trials to achieve success (they measure knowl-edge of employees).
The suggestions of how to explain the process of value creation in terms of value drivers of(?) an intangible asset require one more question to be answered: what actions should be treated as causes of changes of intangible assets that are measured by non-fi-nancial value drivers?
There are two goals of this article: to elucidate the relation between the actions (causes), non-financial value drivers (and respective intangible assets) and financial
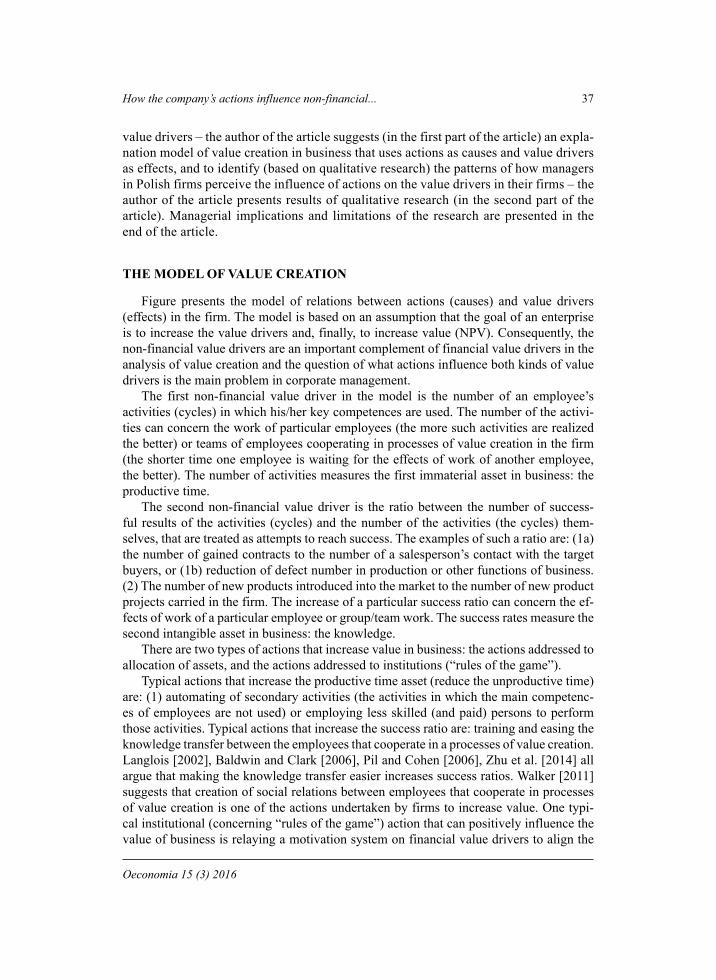
How the company’s actions influence non-financial... 37
Oeconomia 15 (3) 2016
value drivers – the author of the article suggests (in the first part of the article) an expla-nation model of value creation in business that uses actions as causes and value drivers as effects, and to identify (based on qualitative research) the patterns of how managers in Polish firms perceive the influence of actions on the value drivers in their firms – the author of the article presents results of qualitative research (in the second part of the article). Managerial implications and limitations of the research are presented in the end of the article.
THE MODEL OF VALUE CREATION
Figure presents the model of relations between actions (causes) and value drivers (effects) in the firm. The model is based on an assumption that the goal of an enterprise is to increase the value drivers and, finally, to increase value (NPV). Consequently, the non-financial value drivers are an important complement of financial value drivers in the analysis of value creation and the question of what actions influence both kinds of value drivers is the main problem in corporate management.
The first non-financial value driver in the model is the number of an employee’s activities (cycles) in which his/her key competences are used. The number of the activi-ties can concern the work of particular employees (the more such activities are realized the better) or teams of employees cooperating in processes of value creation in the firm (the shorter time one employee is waiting for the effects of work of another employee, the better). The number of activities measures the first immaterial asset in business: the productive time.
The second non-financial value driver is the ratio between the number of success-ful results of the activities (cycles) and the number of the activities (the cycles) them-selves, that are treated as attempts to reach success. The examples of such a ratio are: (1a) the number of gained contracts to the number of a salesperson’s contact with the target buyers, or (1b) reduction of defect number in production or other functions of business. (2) The number of new products introduced into the market to the number of new product projects carried in the firm. The increase of a particular success ratio can concern the ef-fects of work of a particular employee or group/team work. The success rates measure the second intangible asset in business: the knowledge.
There are two types of actions that increase value in business: the actions addressed to allocation of assets, and the actions addressed to institutions (“rules of the game”).
Typical actions that increase the productive time asset (reduce the unproductive time) are: (1) automating of secondary activities (the activities in which the main competenc-es of employees are not used) or employing less skilled (and paid) persons to perform those activities. Typical actions that increase the success ratio are: training and easing the knowledge transfer between the employees that cooperate in a processes of value creation. Langlois [2002], Baldwin and Clark [2006], Pil and Cohen [2006], Zhu et al. [2014] all argue that making the knowledge transfer easier increases success ratios. Walker [2011] suggests that creation of social relations between employees that cooperate in processes of value creation is one of the actions undertaken by firms to increase value. One typi-cal institutional (concerning “rules of the game”) action that can positively influence the value of business is relaying a motivation system on financial value drivers to align the
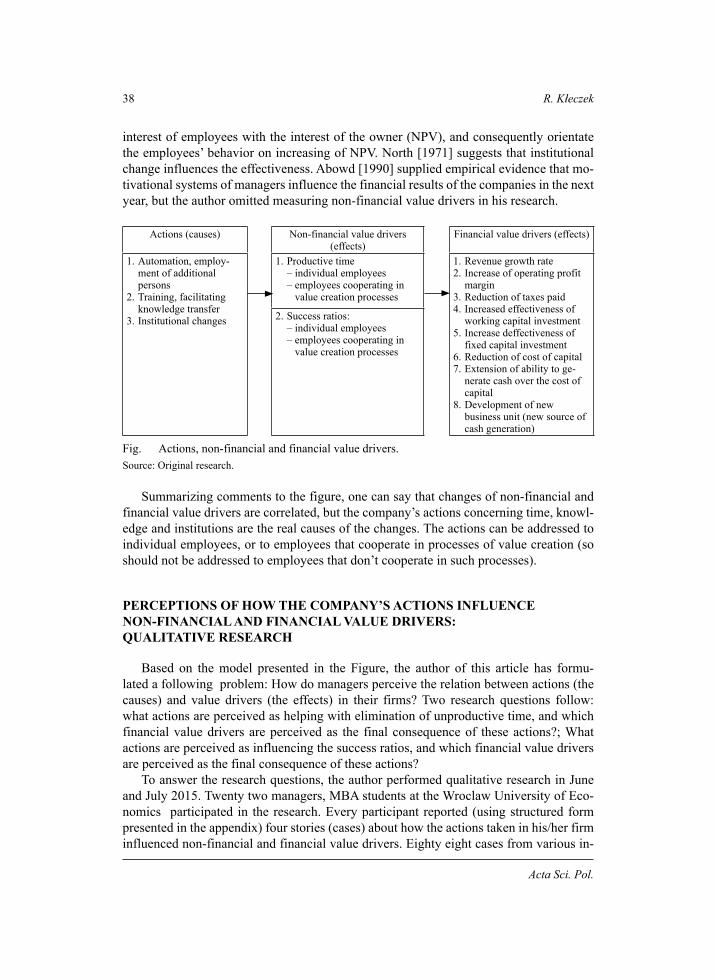
38 R. Kłeczek
Acta Sci. Pol.
interest of employees with the interest of the owner (NPV), and consequently orientate the employees’ behavior on increasing of NPV. North [1971] suggests that institutional change influences the effectiveness. Abowd [1990] supplied empirical evidence that mo-tivational systems of managers influence the financial results of the companies in the next year, but the author omitted measuring non-financial value drivers in his research.
Actions (causes) Non-financial value drivers (effects)
Financial value drivers (effects)
1. Automation, employ-ment of additional persons
2. Training, facilitating knowledge transfer
3. Institutional changes
1. Productive time– individual employees– employees cooperating in
value creation processes
1. Revenue growth rate2. Increase of operating profit
margin 3. Reduction of taxes paid 4. Increased effectiveness of
working capital investment 5. Increase deffectiveness of
fixed capital investment6. Reduction of cost of capital 7. Extension of ability to ge-
nerate cash over the cost of capital
8. Development of new business unit (new source of cash generation)
2. Success ratios:– individual employees– employees cooperating in
value creation processes
Fig. Actions, non-financial and financial value drivers.Source: Original research.
Summarizing comments to the figure, one can say that changes of non-financial and financial value drivers are correlated, but the company’s actions concerning time, knowl-edge and institutions are the real causes of the changes. The actions can be addressed to individual employees, or to employees that cooperate in processes of value creation (so should not be addressed to employees that don’t cooperate in such processes).
PERCEPTIONS OF HOW THE COMPANY’S ACTIONS INFLUENCE NON-FINANCIAL AND FINANCIAL VALUE DRIVERS: QUALITATIVE RESEARCH
Based on the model presented in the Figure, the author of this article has formu-lated a following problem: How do managers perceive the relation between actions (the causes) and value drivers (the effects) in their firms? Two research questions follow: what actions are perceived as helping with elimination of unproductive time, and which financial value drivers are perceived as the final consequence of these actions?; What actions are perceived as influencing the success ratios, and which financial value drivers are perceived as the final consequence of these actions?
To answer the research questions, the author performed qualitative research in June and July 2015. Twenty two managers, MBA students at the Wroclaw University of Eco-nomics participated in the research. Every participant reported (using structured form presented in the appendix) four stories (cases) about how the actions taken in his/her firm influenced non-financial and financial value drivers. Eighty eight cases from various in-
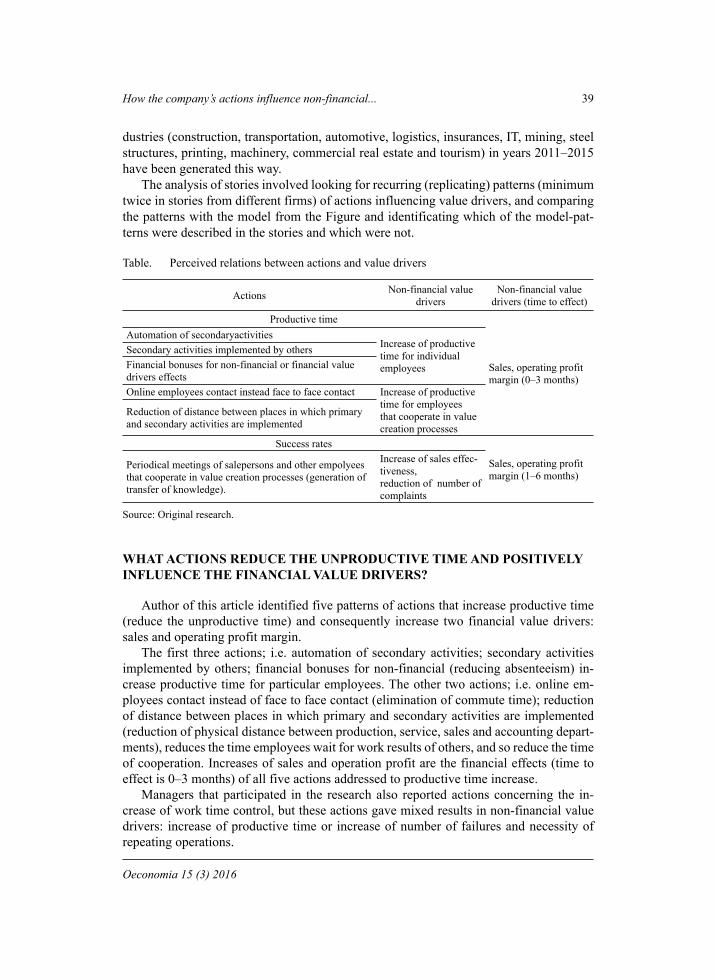
How the company’s actions influence non-financial... 39
Oeconomia 15 (3) 2016
dustries (construction, transportation, automotive, logistics, insurances, IT, mining, steel structures, printing, machinery, commercial real estate and tourism) in years 2011–2015 have been generated this way.
The analysis of stories involved looking for recurring (replicating) patterns (minimum twice in stories from different firms) of actions influencing value drivers, and comparing the patterns with the model from the Figure and identificating which of the model-pat-terns were described in the stories and which were not.
Table. Perceived relations between actions and value drivers
Actions Non-financial value drivers
Non-financial value drivers (time to effect)
Productive time
Sales, operating profit margin (0–3 months)
Automation of secondaryactivitiesIncrease of productive time for individual employees
Secondary activities implemented by othersFinancial bonuses for non-financial or financial value drivers effectsOnline employees contact instead face to face contact Increase of productive
time for employees that cooperate in value creation processes
Reduction of distance between places in which primary and secondary activities are implemented
Success rates
Sales, operating profit margin (1–6 months)
Periodical meetings of salepersons and other empolyees that cooperate in value creation processes (generation of transfer of knowledge).
Increase of sales effec-tiveness, reduction of number of complaints
Source: Original research.
WHAT ACTIONS REDUCE THE UNPRODUCTIVE TIME AND POSITIVELY INFLUENCE THE FINANCIAL VALUE DRIVERS?
Author of this article identified five patterns of actions that increase productive time (reduce the unproductive time) and consequently increase two financial value drivers: sales and operating profit margin.
The first three actions; i.e. automation of secondary activities; secondary activities implemented by others; financial bonuses for non-financial (reducing absenteeism) in-crease productive time for particular employees. The other two actions; i.e. online em-ployees contact instead of face to face contact (elimination of commute time); reduction of distance between places in which primary and secondary activities are implemented (reduction of physical distance between production, service, sales and accounting depart-ments), reduces the time employees wait for work results of others, and so reduce the time of cooperation. Increases of sales and operation profit are the financial effects (time to effect is 0–3 months) of all five actions addressed to productive time increase.
Managers that participated in the research also reported actions concerning the in-crease of work time control, but these actions gave mixed results in non-financial value drivers: increase of productive time or increase of number of failures and necessity of repeating operations.
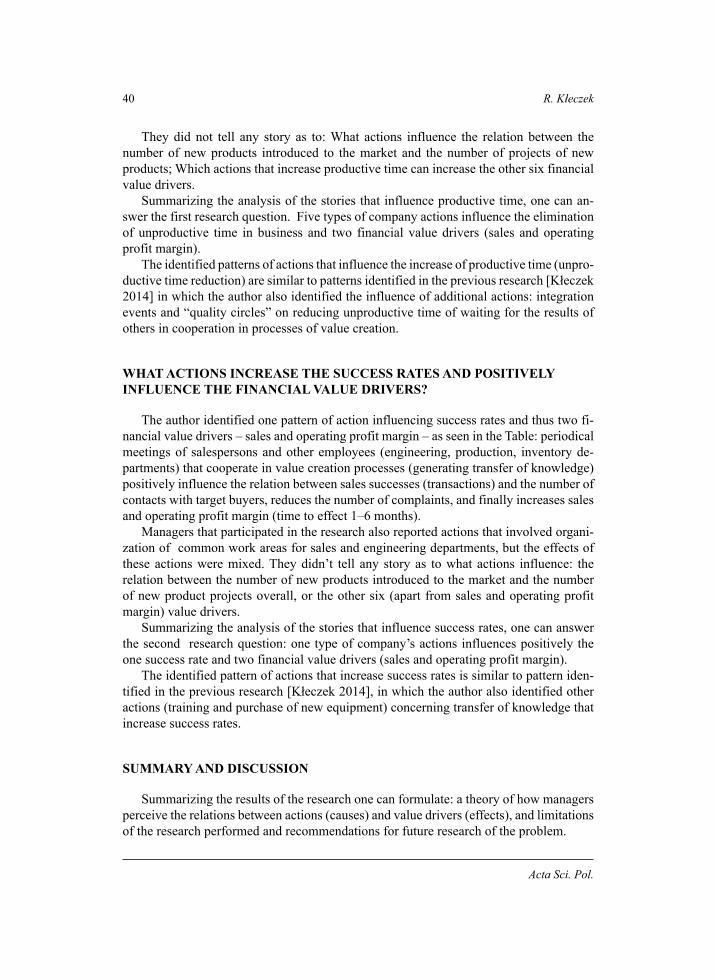
40 R. Kłeczek
Acta Sci. Pol.
They did not tell any story as to: What actions influence the relation between the number of new products introduced to the market and the number of projects of new products; Which actions that increase productive time can increase the other six financial value drivers.
Summarizing the analysis of the stories that influence productive time, one can an-swer the first research question. Five types of company actions influence the elimination of unproductive time in business and two financial value drivers (sales and operating profit margin).
The identified patterns of actions that influence the increase of productive time (unpro-ductive time reduction) are similar to patterns identified in the previous research [Kłeczek 2014] in which the author also identified the influence of additional actions: integration events and “quality circles” on reducing unproductive time of waiting for the results of others in cooperation in processes of value creation.
WHAT ACTIONS INCREASE THE SUCCESS RATES AND POSITIVELY INFLUENCE THE FINANCIAL VALUE DRIVERS?
The author identified one pattern of action influencing success rates and thus two fi-nancial value drivers – sales and operating profit margin – as seen in the Table: periodical meetings of salespersons and other employees (engineering, production, inventory de-partments) that cooperate in value creation processes (generating transfer of knowledge) positively influence the relation between sales successes (transactions) and the number of contacts with target buyers, reduces the number of complaints, and finally increases sales and operating profit margin (time to effect 1–6 months).
Managers that participated in the research also reported actions that involved organi-zation of common work areas for sales and engineering departments, but the effects of these actions were mixed. They didn’t tell any story as to what actions influence: the relation between the number of new products introduced to the market and the number of new product projects overall, or the other six (apart from sales and operating profit margin) value drivers.
Summarizing the analysis of the stories that influence success rates, one can answer the second research question: one type of company’s actions influences positively the one success rate and two financial value drivers (sales and operating profit margin).
The identified pattern of actions that increase success rates is similar to pattern iden-tified in the previous research [Kłeczek 2014], in which the author also identified other actions (training and purchase of new equipment) concerning transfer of knowledge that increase success rates.
SUMMARY AND DISCUSSION
Summarizing the results of the research one can formulate: a theory of how managers perceive the relations between actions (causes) and value drivers (effects), and limitations of the research performed and recommendations for future research of the problem.
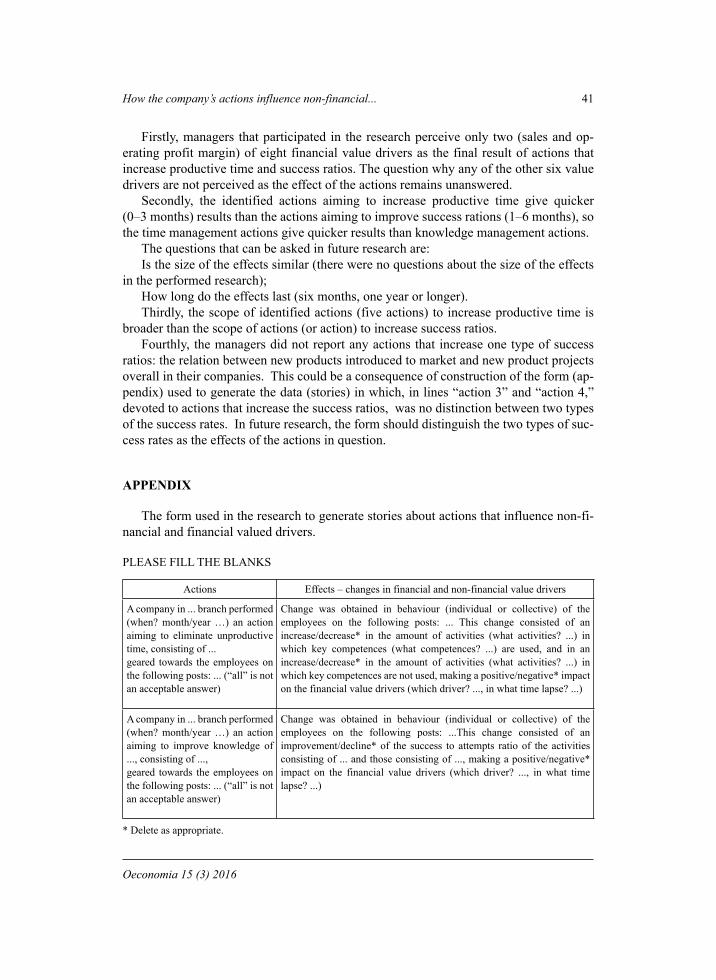
How the company’s actions influence non-financial... 41
Oeconomia 15 (3) 2016
Firstly, managers that participated in the research perceive only two (sales and op-erating profit margin) of eight financial value drivers as the final result of actions that increase productive time and success ratios. The question why any of the other six value drivers are not perceived as the effect of the actions remains unanswered.
Secondly, the identified actions aiming to increase productive time give quicker (0–3 months) results than the actions aiming to improve success rations (1–6 months), so the time management actions give quicker results than knowledge management actions.
The questions that can be asked in future research are: Is the size of the effects similar (there were no questions about the size of the effects
in the performed research);How long do the effects last (six months, one year or longer). Thirdly, the scope of identified actions (five actions) to increase productive time is
broader than the scope of actions (or action) to increase success ratios. Fourthly, the managers did not report any actions that increase one type of success
ratios: the relation between new products introduced to market and new product projects overall in their companies. This could be a consequence of construction of the form (ap-pendix) used to generate the data (stories) in which, in lines “action 3” and “action 4,” devoted to actions that increase the success ratios, was no distinction between two types of the success rates. In future research, the form should distinguish the two types of suc-cess rates as the effects of the actions in question.
APPENDIX
The form used in the research to generate stories about actions that influence non-fi-nancial and financial valued drivers.
PLEASE FILL THE BLANKS
Actions Effects – changes in financial and non-financial value drivers
A company in ... branch performed (when? month/year …) an action aiming to eliminate unproductive time, consisting of ...geared towards the employees on the following posts: ... (“all” is not an acceptable answer)
Change was obtained in behaviour (individual or collective) of the employees on the following posts: ... This change consisted of an increase/decrease* in the amount of activities (what activities? ...) in which key competences (what competences? ...) are used, and in an increase/decrease* in the amount of activities (what activities? ...) in which key competences are not used, making a positive/negative* impact on the financial value drivers (which driver? ..., in what time lapse? ...)
A company in ... branch performed (when? month/year …) an action aiming to improve knowledge of ..., consisting of ...,geared towards the employees on the following posts: ... (“all” is not an acceptable answer)
Change was obtained in behaviour (individual or collective) of the employees on the following posts: ...This change consisted of an improvement/decline* of the success to attempts ratio of the activities consisting of ... and those consisting of ..., making a positive/negative* impact on the financial value drivers (which driver? ..., in what time lapse? ...)
* Delete as appropriate.
42 R. Kłeczek
Acta Sci. Pol.
REFERENCES
Abowd, J.M. (1990). Does performance-based managerial compensation affect corporate perfor-mance? Industrial and Labor Relations Review, 43, 53–72.
Anderson, R.E., Hair, J.F., Bush, A.J. (1992). Professional Sales Management. McGraw-Hill, New York.
Baldwin, C.Y, Clark, K.B. (2006). Modularity in the design of complex engineering systems. Sprin-ger, New York.
Gorzeń, W., Piernicki K., Pniewski, K. (2008). Formułowanie i komunikacja strategii wzrostu wartości. [In:] A. Szablewski, K. Pniewski, B. Bartoszewicz (Eds), [Value Based Ma-nagement]. Koncepcje, narzędzia, przykłady. Poltext, Warszawa, 119–120.
Ingram, T.N., LaForge, R.W., Schwepker, Ch.H. Jr. (1997). Sales management. Analysis and Deci-sion Making. (3rd ed.). The Dryden Press, New York.
Ittner, C.D., Larcker, D.F., Rajan, M.V. (1997). The Choice of performance Measures in Annual Bonus Compensation. The Accounting Review, 72, 2, 231–255.
Kaplan, R.S., Anderson, S.R. (2004). Time-Driven Acivity-Based Costing. HBR Publishing Cor-poration.
Kłeczek, R. (2014). NPV-Relevant Product Description and B2B Marketing Contribution to Va-lue Creation. Management and Business Administration. Central Europe, 22, 4 (127), 109–117.
Kłeczek, R. (2015). Productive time and success rates: their causes and effects in Polish firms. [In:] E. Magier-Łakomy (Ed.), Potencjał kulturowy i społeczny oraz zasoby ludzkie w proce-sach zarządzania. Prace Naukowe Wyższej Szkoły Bankowej w Gdańsku, 41, 149–163.
Langlois, R.N. (2002). Modularity in technology and organization. Journal of Economic Behavior & Organization, 49, 19–37.
North, D. (1971). Institutional change and economic growth. The Journal of Economic History, 31 (1), 118–125.
Pil, F.K., Cohen, S.K. (2006). Modularity: Implications for imitation, innovation, and sustained advantage. Academy of Management Review, 31, 995–1011.
Rappaport, A. (1981). Selecting strategies that create shareholder value. Harvard Business Review, May–June, 139–149.
Rappaport, A. (1983). Corporate performance standards and shareholder value. Journal of Business Strategy, 3, 28–38.
Rappaport, A. (1986). Creating Shareholder Value. A Guide for Managers and Investors. The Free Press.
Rappaport, A. (1988). Cash Flow Analysis of Corporate Performance. Small Business Reports, 13, 9, 80–86.
Rust, R.T., Ambler, T., Carpenter G.S., Kumar, V., Srivastava, R.K. (2004). Measuring marketing productivity: Current knowledge and future directions. Journal of Marketing, October, 76–89.
Sowińska-Bonder, K., Fietkiewicz, D. (2008). Motywowanie menedżerów do realizacji wzrostu wartości. [In:] A. Szablewski, K. Pniewski, B. Bartoszewicz (Eds), [Value Based Ma-nagement]. Koncepcje, narzędzia, przykłady. Poltext, Warszawa, 159–182.
Srivastava, R.K., Shervani, T.A., Fahey, L. (1998). Market-based assets and shareholder value: A framework for analysis. Journal of Marketing, 62, 1, 2–18.
Walker, J.W. (2001). Zero defections? Human Resource Planning, 24 (1), 6–8.Zhu, F., Sun X., Miller, J., Deng, Z. (2014). Innovations in Knowledge Management: Applying
Modular Design. International Journal of Innovation Science, 6, 2, 83–96.
How the company’s actions influence non-financial... 43
Oeconomia 15 (3) 2016
JAKIE DZIAŁANIA WPŁYWAJĄ NA NIEFINANSOWE I FINANSOWE CZYNNIKI WZROSTU WARTOŚCI – PERCEPCJE MENEDŻERÓW W POLSKICH FIRMACH
Streszczenie. Celem artykułu jest przedstawienie modelu wyjaśniającego, w jaki spo-sób podejmowane w firmach działania wpływają na niefinansowe i finansowe czynniki wzrostu wartości, oraz identyfikacja (na podstawie badania jakościowego) powtarzalnych sposobów postrzegania tego wpływu przez menedżerów w polskich firmach. Metoda wy-korzystana w badaniu polega na generowaniu opisów działań podejmowanych w polskich firmach w celu uzyskania wpływu na niefinansowe i finansowe czynniki wzrostu wartości oraz identyfikacji powtarzalnych schematów w treści tych opisów. Autor artykułu ziden-tyfikował trzy schematy wpływu działań na niefinansowe i finansowe czynniki wzrostu wartości: zakres działań zwiększających czas produktywny jest większy od zakresu działań zwiększających wiedzę, nie zostały wygenerowane żadne opisy wpływu podejmowanych działań na wprowadzanie nowych produktów, tylko dwa spośród ośmiu czynników wzrostu wartości są postrzegane jako efekt podejmowanych działań.
Słowa kluczowe: czynniki wzrostu wartości, tworzenie wartości, czas produktywny, za-rządzanie wiedzą
Accepted for print: 16.08.2016
For citation: Kłeczek R. (2016). How the company’s action influence non-financial and financial value drivers: managers’ perceptions in Polish firms. Acta Sci. Pol., Oeconomia, 15 (3), 35–43.

Oeconomia 15 (3) 2016, 45–54
ISSN 1644-0757eISSN 2450-4602
http://acta_oeconomia.sggw.pl
Corresponding author: Jacek Maśniak, Warsaw University of Life Sciences – SGGW, Faculty of Economic Sciences, Department of Economics and Economic Policy, Nowoursynowska 166, 02-787 Warszawa, Poland, e-mail: [email protected]
© Copyright by Warsaw University of Life Sciences Press, Warsaw 2016
INTERVENTIONISM ON THE AGRICULTURAL LAND MARKET – A CRITICAL ANALYSIS
Jacek MaśniakWarsaw University of Life Sciences – SGGW
Abstract. The aim of the article is the economic evaluation of the effects of interventionism on the agricultural land market in the light of the Austrian school of economics theories. The analysis refers mainly to the policy of forming the agricultural system, which constitutes a specialised type of a land allocation policy. The essence of the Austrian school economists’ view on interventionism boils down to the fact that it introduces coercion in place of voluntary cooperation. This leads to the redistribution of wealth and a general decline in social productivity.
Key words: agricultural land market, interventionism, the Austrian school of economics
INTRODUCTION
Considerations concerning the structure of the economic system constitute the funda-mental element of a social policy theory. The mainstream studies concerned with this is-sue postulate the formation of a mixed system, which assumes that the market mechanism is the primary regulator of economy, and the state corrects market failures. State actions aimed at eliminating failures connected with the functioning of the free market and sup-porting development processes are called interventionism. The theory of market failure acts as a basis for the formation of a strong conviction that an intensive state activity is ne-eded in the area of agriculture. One of the main premises of agricultural interventionism points to the fact that agriculture uses a specific production factor, mainly land, which plays various social functions at the same time.
Although the interventionism doctrine is deeply rooted in contemporary economic and economic policy theory, it should also be noted that the considerable output of eco-nomic thought includes divergent views, which consider any forms of state intervention in the free market to be ineffective and harmful. The most interesting in this regard is
46 J. Maśniak
Acta Sci. Pol.
the Austrian school of economics, which has developed a highly insightful and carefully though-out theory of social cooperation. In the light of this theory, the market order is much more effective and socially useful than the economic system that is planned and implemented by pubic authorities.
The aim of the article is to present an economic analysis of the effects of interven-tionism on the agricultural land market in the light of the Austrian school of economics theory. To achieve this, the following issues must be considered and explained:
the causes and forms of interventionism with reference to the agriculture land mar-ket; the functioning of economic system in the Austrian school of economics theory; the effects of the actions taken by the state that have the greatest impact on land mana-gement and the evaluation of such effects from the perspective of an economic theory formed by the Austrian school. The first stage of research concerns the causes and forms of state interventionism on
the land market. It presents principles and instruments of the policy regulating the forma-tion of the agricultural system, which constitutes a specialised type of a land allocation policy. Subsequently, it discusses the main ideas of the Austrian school of economics and evaluates the state agricultural policy from this perspective.
MATERIAL AND METHODS
The work is mainly theoretical and empirical research is only supplementary. The analysis of the selected issue related to the economic reality is conducted with reference to the Austrian school of economics. The research method is also borrowed from this school. It assumes that there are necessary interdependences between events that result from human actions. The task of economics is to discover such causal laws, and the only effective approach is an a priori-deductive approach using verbal logic. This methodolo-gical approach assumes that knowledge about economic reality, which is highly complex and determined by creative human actions, can be acquired only by way of theoretical considerations. On the basis of fundamental and undeniably true statements (axioms) other statements are posed by drawing logical conclusions.
Empirical data used in the work are used to describe the direction and scale of activi-ties undertaken by the state with respect to the agricultural land market. Such information includes the review of legislature with an indication of the most important regulatory solutions and presents the degree of a controlled turnover in agricultural land. Empirical research uses data published in the reports on the activities of the Agricultural Property Agency in the years 2004−2013.
CAUSES AND FORMS OF INTERVENTIONISM ON THE AGRICULTURAL LAND MARKET
Highly developed economies, including the EU states, apply a very extensive and ad-vanced interventionist policy with regard to agriculture. The practically applied economic policy related to agriculture finds its substantiation in numerous works of economists.
•
••
Interventionism on the agricultural land market – a critical analysis 47
Oeconomia 15 (3) 2016
The main reason for such actions is said to be the fact that market mechanism does not guarantee an adequate allocation of resources and that the specific character of the agri-cultural sector requires institutional support. Wilkin [2003] follows Stiglitz [1987] in as-serting that the main reasons behind state intervention in agriculture are as follows:
incomplete and imperfect nature of markets which are connected with agriculture; necessity and usefulness of supplying agriculture with public goods;occurrence of the phenomenon of external costs and externalities; imperfect information; profitability problems in agriculture. To justify the need for an active role of the state, a considerable focus is placed on
the specificity of land, which is the primary factor used in agricultural production. It is accepted that in the presently developed sustainable agriculture model, land provides not only food and energy resources, but also renders services as an element of the natural environment. Such land related utilities, which are created spontaneously, i.e. without an additional capital or labour input, are public goods, and market mechanism usually does not ensure their optimal supply [Czyżewski and Czyżewski 2013].
The state policy influences the way in which the land is used by applying instruments which directly affect trading in agricultural land as well as instruments which intentional-ly stimulate changes in terms of land use. The area of an economic policy which is applied not only in relation to agriculture, but also to other sectors of economy, and which has a direct influence on the structure of production factors, is the pricing and incomes policy. By increasing or restricting the effectiveness of given production factors in their different applications it affects the distribution of income in the economy and, consequently, the allocation of economic resources. Other instruments directly affecting the disposal of land resources in the economy are also used as part of a sectoral policy connected with agriculture. The areas of state activity which have an impact on land management in Po-land include in particular: spatial planning and land development, agricultural land and woodland protection, land consolidation and exchange, and restrictions on real property acquisition by foreigners.
A specialised type of a policy that has a strong influence on the agricultural land management is the agricultural land structuring policy. As in most European countries, the basis of the agricultural system in Poland is family farming. The most important acts governing the agricultural system in Poland are: Article 23 of the Constitution of the Republic of Poland of 2 April 1997, the Act of 11 April 2003 on the Formation of the Agricultural System (AFAS) and the Act of 19 October 1991 on the Management of State Treasury Agricultural Land Property. In accordance with these regulations a family farm means a farm run by an individual farmer, in which the total area of cultivated land does not exceed 300 ha.
An individual farmer means a natural person who is the owner or lessee of agricultural land of the total area of cultivated land not exceeding 300 ha, runs an agricultural farm personally, has agricultural qualifications and has resided for at least 5 years in the com-mune in which one of agricultural land properties comprising his farm is located.
The aim of a state intervention is to form the agricultural system by:improving the area structure of agricultural farms; preventing excessive concentration of agricultural property;
•••••
••

48 J. Maśniak
Acta Sci. Pol.
ensuring that agricultural activity in agricultural farms is conducted by properly qua-lified persons. The control over land market is exercised on behalf of the state by the Agricultural
Property Agency (APA). For the purposes of direct intervention on the land market, APA has been given entitlements such as pre-emptive right and the right of land buy-out. Pre-emptive rights means that in the circumstances stipulated in the act the APA is entitled to take the place of the buyer and acquire agricultural property at the price and on the terms previously established by the buyer and the seller. The right of land buy-out is an entitle-ment similar to the pre-emptive right in terms of its effects. It allows the APA to acquire land property in the case of transfer of ownership agreements other than sale agreements, such as, e.g.: donation agreements, making contribution-in-kind of agricultural proper-ty in a commercial company or partnership, property division agreements, exchange of property. Exercising the pre-emptive right or the right of property buy-out, the APA can prevent the acquisition of agricultural property by natural persons who are not individual farmers and by legal entities.
In the period from 16 July 2003 to the end of 2014, acting pursuant to the act on the formation of the agricultural system, the APA exercised a pre-emptive right (right of buy-out) in 619 cases, and in 2014 it intervened in 9 cases. It expressed its willingness to acquire agricultural property of a total area of 14.9 K ha (Table). In 2014, this area amounted to 189 ha. The Agency acquired the ownership of only larger plots of land that could be used to enlarge individual farms.
Table. Agricultural land area taken over and sold by the APA
Agricultural land To the end of 2014 (ha) In 2014 (ha)Taken over total 4 739 338 246a
of which by AFAS 15 400 189Sold total 2 608 473 120 552
of which by restricted tender 206 600 22 859a Land acquired on the basis of the statement, without formal written acceptance, on the basis of AFAS and the
Act of 19 October 1991 on the Management of the State Treasury Agricultural Land Property.Source: Report on the activities of the Agricultural Property Agency regarding Agricultural Property Stock of the State Treasury in 2014 [2015].
The process of privatization conducted by the APA was initially connected with the need for the development of state-owned land. Since 16 July 2003 the act on the forma-tion of the agricultural system that came into force set some additional tasks for the APA, the purpose of which is to promote family (individual) farms. The privileged position of this group of agricultural farms in relation to other land market players stems from the fact the APA does not have the right to apply restrictions in the form of the pre-emptive right or the right of land buy-out. Furthermore, individual farmers frequently have the exclusive right to acquire land sold by the APA by way of restricted tender.
Sale of land can be carried out by way of tender or without a tender procedure. In 2014, 80.7 K ha of land were sold to entitled entities. Restricted tender was organised mainly with respect to individual farmers. Since this entitlement came into force (June 1999), the land of the area of 206.6 K ha has been sold by way of tender. In 2014, 22.9 K ha were
•
Interventionism on the agricultural land market – a critical analysis 49
Oeconomia 15 (3) 2016
sold by restricted tender, which constituted 59% of the land sold by tender in general and 23% of all land sold in that year by tender and without a tender procedure.
The essence of the formation of agricultural system policy is therefore that fact that the state uses such actions as pre-emption and buy-out to acquire land on the private mar-ket and then sells it to individual farmers on a preferential basis. It is therefore a policy of active impact on the private market in order to encourage the flow of land into family farms. The economic evaluation of the effects of such actions will be conducted based on the Austrian school of economics theory.
THE ECONOMIC SYSTEM OF THE AUSTRIAN SCHOOL AND CRITICISM OF INTERVENTIONISM
The economic theory of the Austrian school of economics places human action at the centre of attention. This approach to studying the reality was developed and systematised by von Mises, who is considered to be the most prominent Austrian school economist. His treatise on economics entitled Human Action [2007] is an insightful and systematized re-flection on regularities and constrains which apply to people as individuals and society.
The research method of the Austrian school is formed on several basic principles:1. Subjectivism and methodological individualism, i.e. a conviction that only individual
human beings act, that is, get engaged in conscious activities, in order to achieve specific goals. “For a social collective has no existence and reality outside of the indi-vidual members’ actions. The life of a collective is lived in the actions of the individu-als” [von Mises 2007]. Human preferences have a subjective character, and therefore the value of market goods is the result of personal judgment and individual choices.Man is able to act because he is capable of discovering causal relationships. Thanks to this, he can set objectives for himself, and then choose means to achieve those objec-tives (Fig.). The essence of human action is a creative approach, which means disco-vering new opportunities, continuous learning and gathering knowledge. Such a cre-ative approach to the use of resources constitutes the essence of entrepreneurship. As a result of entrepreneurial actions man also discovers that social cooperation ensures more benefits that economic self-sufficiency. Management based on specialization and exchange can effectively overcome privation and it is beneficial for all involved.
2. Emphasizing the significance of limited knowledge and uncertainty in the mana-gement process. In such circumstances the most certain mechanism of obtaining knowledge is the free market. The prices of consumer goods reveal the most urgent, unsatisfied needs, while the prices of economic resources provide information on the availability of production factors. Then entrepreneurs seeking profit are motivated to meet consumers’ need as well as possible, at the same time minimising resource consumption. This process is the most effective when accompanied by the protection of personal property and individual freedom, hence any enforced cooperation through a system of “do’s” and “don’ts” limits productivity of the society and undermines its moral foundations.
3. The rejection of mathematical modelling as a method of gaining knowledge about socio-economic reality. Economic knowledge can be obtained only my way of verbal

50 J. Maśniak
Acta Sci. Pol.
explanation of causal relationships. Logical implications are formed on the basis of a priori true statements (e.g. that humans act).An analysis of the effects of state intervention in the economy constitutes an impor-
tant and well developed part of the Austrian school theory. Ludwig von Mises [2000] de-fines interventionism as a set of procedures hindering the functioning of market economy and destroying it as a result. In his view, it hinders production and limits the possibilities of satisfying needs since it forces producers and owners of production resources to use them in a manner different to a manner they would apply under pressure from the market. By destroying economic rationality, it does not make people richer, but in fact poorer. The harmful nature of a state intervention in the economy can be presented with regard to several basic aspects, which also refer to interventionism on the land market.
The first objection refers to the lack of representativeness in terms of state actions. Objectives set by people are individual in their nature, and furthermore, they are assigned a subjective meaning. Since economic resources are scarce, creating solutions that make it easier to meet some objectives must limit the possibilities of meeting other competitive objectives. Hence the questions whether it is possible to set general social objectives related to the management of scarce resources, such as land, which would unquestionably lead to an improvement in the situation of all society members and whether the establish-ment of a family farm as a fundamental form of land management is in the best interests of the whole society.
Representatives of the Austrian school claim that in the conditions of subjective multi-plicities and changing ends, the best way of discovering social preferences is a voluntary cooperation of people who are equal under the law. By means of flexible market prices, scarce resources are directed to the production of the largest possible quantity of useful goods. In contrast, all forms of coercion in the management process generate profits for some participants at the expense of others. Hence interventionism is first and foremost regarded as the form of meeting group interests. In the case of the formation of the agri-cultural system policy, a social group benefiting from this policy undoubtedly includes individual farmers, as they are privileged in terms of gaining access to the land. Ano-ther social group gaining benefits are officials and politicians, as they are equipped with
man
ends
means
entrepreneurship
resources
social cooperation
Fig. Diagram of human actionSource: Own elaboration on the basis of von Mises [2007].
Interventionism on the agricultural land market – a critical analysis 51
Oeconomia 15 (3) 2016
means that are necessary to conduct this policy, and also the scope of their power is in-creased in the process.
The supporters of interventionism are generally known to claim that family farms provide goods of a public character, connected with sustainable development, protection of the environment and rural landscape, and traditional rural culture. However, it can be noted that such claims do not solve the problem of the optimal allocation of land but ra-ther move it to another, more detailed level. All fundamental questions remain open, e.g. How many raw materials should be produced compared to ecological services; Which landscape is more valuable: traditional or modern; should cultural heritage be protected or should the environment be adapted to present and future needs of people; Where does the belief that family farms better fulfil this role come from.
There is also the question of the compensation of losses incurred by consumers on some markets, with increased profits made on other markets. However, in this area we can also notice that human needs are subjective and changing in their nature. This leads to a conclusion that any interpersonal comparisons are impossible to draw, and therefore there is no basis for arbitrary statement as to which goods are needed more by people.
In addition to the presented doubts, which appear when formulating social goals, the possibility of their effective realisation also raises objections. The Austrian school eco-nomists note that there are certain mechanisms incorporated in the state policy which by their very nature lead to poor performance, or in fact to the opposite effect than the one intended. People implementing state policies are subject to other stimuli than entrepre-neurs and employees engaged in market activity. First of all, their personal incomes do not depend on the efficiency of performing public functions because they derive their profits not from the sale of services which are voluntarily purchased by other people on the market, but from obligatory levies imposed on the society. Therefore, they lack a financial incentive to serve the public in a competent way. This leads to a situation in which personal interest begins to dominate, and the realisation of social objectives is merely factitious. Furthermore, there are different criteria for selecting people who are to hold governmental functions and people engaged in the market activity. As Rothbard [2009] notes, “in the market, the fittest are those most able to serve the consumers; in government, the fittest are those most adept at wielding coercion and/or those most adroit at making demagogic appeals to the voting public”.
In addition to the lack of actual motivation to realise common goals, we can also notice the lack of sufficient knowledge that would allow an effective implementation of public schemes. As Hayek [1948] stresses, knowledge required for the functioning of the economic system is dispersed, changing and, what is particularly important, incomplete. This applies to both human needs and preferences as well as available resources. Freque-ntly even the holders of such tacit knowledge are unaware of it. Consumer preferences are not only changeable by their nature, but also frequently become realised only at the moment of making a choice. The means of satisfying needs, on the other hand, are con-tinuously multiplied and improved due to human creativity and entrepreneurship. The conditions in which the ‘discovery procedure’ is most effective are ensured by the econo-mic freedom, according to which the system of market prices operates like a mechanism for transmitting information. In this context, the privileged access to land by a selected group of agricultural producers should be interpreted as an interference in the competition

52 J. Maśniak
Acta Sci. Pol.
process and the modification of the land allocation on the market. Land which is nationa-lised by exercising the pre-emptive right of the right of buy-out is sold by restricted tender to individual farmers. This is accompanied by a conviction that this group of producers is better able to satisfy the needs of the society. Its effectiveness is to be guaranteed by a proper area structure of agricultural farms, the lack of excessive concentration of land, and proper qualifications of people running farms. Those, however, are only the means, and not the goals of the state policy. The final goal should be an increased level of sati-sfaction in the society. However, where should those producers gain knowledge about how much should be produced, what and for whom? For example, should they produce more food or provide agritourism farm services? It turns out that the only instrument that can effectively direct the activities of agricultural producers is a system of flexible prices and economic freedom that have just been negated. Hence the final conclusion is that ar-bitrarily established social goals, already seeming unrepresentative in themselves, always encounter an informational barrier in the process of their realisation since ignoring mar-ket prices means foregoing a unique source of knowledge about the economic reality.
Another unintended result of interventionism is a progressive expansion of the gover-nment structures and bureaucratisation of the economy. This means that more and more resources and products are taken over by the public sector, and production in the private sector encounters growing difficulties.
Yet another element of criticism of interventionism is its instability. The supporters of the Austrian school of economics claim that in the long term interventionism leads to an economic and moral collapse of the society. It violates in a systematic way the principles of peaceful cooperation, which are based on universal equality under the law, respect for private property and individual freedom. Limitation of voluntary cooperation and privi-leges to selected individuals or entities will inevitably lead to the temptation to use state institutions to further the interests of a group. The competition between particular social groups in the process of gaining power and creating legal solutions that are favourable for them will result in a systematic increase in coercive measures applied by the state and, in consequence, a gradual restriction of economic freedom of the society. The problem of the increasing level of interventionism was noted by von Mises [2000], according to whom “Mankind has a choice only between the unhampered market economy, democra-cy, and freedom on the one side, and socialism and dictatorship on the other side. A third alternative – an interventionist compromise – is not feasible”.
In agriculture, where interventionism is fairly advanced in comparison to other econo-mic sectors, we can observe quite common demanding attitudes. Other social groups also strongly lobby for their interests. An escalation of such attitudes results in a decreasing involvement of the society in generating wealth and a growing competition when it comes to its distribution.
CONCLUSIONS
The Austrian school economists’ view on the problem of interventionism boils down to the fact that it introduces coercion in place of voluntary cooperation. Since market exchanges are beneficial to both parties, individuals following their own interests must
Interventionism on the agricultural land market – a critical analysis 53
Oeconomia 15 (3) 2016
at the same time generate benefits for others. The right to use force, however, destroys this relation, leading to the redistribution of wealth and a general drop in the society’s productivity.
When evaluating state interventionism on the land market from the perspective of the Austrian school of economics, a few basic critical views should be formulated:
The lack of representativeness of state actions. The interventionist policy is accompa-nied by a conviction that it seeks to achieve some common goals. The reality seems to be different as any intervention from the government prejudices the interests of some groups for the benefit of others. In the case of the policy concerning the forma-tion of the agricultural system, the social groups benefiting from it are undoubtedly individual farmers, who are privileged in gaining access to land. Another social group deriving benefits are officials and politicians, as they are equipped with means that are necessary to conduct this policy and, furthermore, the scope of their power is in-creased in the process. The lack of efficiency and effectiveness of such measures. State actions interfere with the economic process and bring about a number of adverse effects, as a result of which the achieved state is less desirable than the previous one. Land which is nationalised by exercising the pre-emptive right of the right of buy-out is sold by restricted tender to individual farmers. Such a restriction of competition should be interpreted as an interference in the process of the market land allocation. Since the free market is the best way of discovering social preferences and at the same time it is the most effective way of motivating entrepreneurs and resource holders to maximise the production of useful goods, any intervention in the market must lead to a decline in social welfare. Another unintended result of interventionism is a progressive expansion of the go-vernment structures and bureaucratisation of the economy. Instability of the system based on interventionism. A systematic violation of property rights and introducing privileges for selected individuals must inevitably result in the temptation to use state institutions to further the interests of a group. In the long term such attitudes lead to a decreased productivity and an economic and moral collapse of the society.
REFERENCES
Czyżewski, A., Czyżewski, B. (2013). Ziemia i jej renty w nowym paradygmacie rozwoju rolnictwa [Land and Land Annuities in a New Paradigm of Agricultural Development]. Retrieved from http://www.pte.pl/kongres/referaty (accessed: 14.12.2015).
Hayek, F.A. (1948). Individualism and Economic Order. University of Chicago Press, Chicago.Constitution of the Republic of Poland of 2 April 1997 (Journal of Laws 1997 no 78 item 483).Mises von, L. (2000). Interventionism [Interventionism: An Economic Analysis]. Arcana, Kraków.Mises von, L. (2007). Ludzkie działanie. Traktat o ekonomii [Human Action: A Treatise on Eco-
nomics]. Instytut Ludwiga von Misesa, Warszawa. Report on the activities of the Agricultural Property Agency regarding Agricultural Property Stock
of the State Treasury in 2014, Warszawa 2015.Rothbard, M.N. (2009). Interwencjonizm, czyli władza a rynek [Power and Market: Government
and the Economy]. Fijor Publishing, Warszawa.
•
•
•
54 J. Maśniak
Acta Sci. Pol.
Stiglitz, J.E. (1987). Some Theoretical Aspects of Agricultural Policies. The World Bank Research Observer, 2, 1.
Act of 19 October 1991 on the Management of State Treasury Agricultural Land Property (Journal of Laws 2012 item 1187).
Act of 5 August 2015 on the Formation of the Agricultural System (Journal of Laws 2015 item 1433).
Wilkin, J. (2003). Interwencjonizm państwowy w rolnictwie – dlaczego był, jest i będzie [State In-terventionism in Agriculture – Why It Was, Is and Will Be]. [In:] A. Kowalski (Ed.), Do-stosowanie polskiego rynku rolnego do wymogów Unii Europejskiej [Adjusting Polish Agricultural Market to the Requirements of the European Union]. SGH, IERiGŻ, ARR, Warszawa, 39–50.
INTERWENCJONIZM NA RYNKU ZIEMI ROLNICZEJ – ANALIZA KRYTYCZNA
Streszczenie. Celem artykułu jest ekonomiczna ocena skutków interwencjonizmu na rynku ziemi rolniczej w świetle teorii austriackiej szkoły ekonomii. Analiza odnosi się głównie do polityki kształtowania ustroju rolnego, która stanowi wyspecjalizowany rodzaj polityki w zakresie alokacji ziemi. Istota poglądu ekonomistów szkoły austriackiej na problem in-terwencjonizmu sprowadza się do tego, że wprowadza on przymus w miejsce dobrowolnej współpracy. Prowadzi to do redystrybucji bogactwa i ogólnego spadku produktywności społeczeństwa.
Słowa kluczowe: rynek ziemi rolniczej, interwencjonizm, austriacka szkoła ekonomii
Accepted for print: 22.06.2016
For citation: Maśniak J. (2016). Interventionism on the agricultural land market – a critical analysis. Acta Sci. Pol., Oeconomia, 15 (3), 45–54.

Oeconomia 15 (3) 2016, 55–66
ISSN 1644-0757eISSN 2450-4602
http://acta_oeconomia.sggw.pl
Corresponding author: Krystyna Mazurek-Łopacińska, Wrocław University of Economics, Fac-ulty of Economic Sciences, Institute of Marketing, Department of Market Research, Komandorska 118/120, 53-345 Wrocław, Poland, e-mail: [email protected]
© Copyright by Warsaw University of Life Sciences Press, Warsaw 2016
THE CULTURAL PARADIGM IN MARKETING
Krystyna Mazurek-ŁopacińskaWrocław University of Ekonomics
Abstract. The paper presents the nature and the underlying principles of the cultural paradigm in marketing, corresponding with the concept of value-based marketing. In management sciences, the postulated paradigm may be considered equivalent to the symbolic-interpretive perspective. The transition to the cultural paradigm is a response to the increased role of cultural factors and trends upon the market. The role of cultural codes is presented in the context of identification and anticipation of consumer expectations, with examples of best practices in building culture associations around products. This approach is manifested in the concept of cultural branding and in the development of communication styles and forms adjusted to the generated cultural construct of the product. Another effective method of approach is the use of brand storytelling, designed to engage emotional response from customers as a way of increasing their brand identification and involvement.
Key words: paradigm, marketing, values, culture, branding, storytelling
IN SEARCH OF A NEW MARKETING PARADIGM
The development of marketing sciences stimulates the need to define the cognitive framework of the field to ensure the versatility of studies, while placing proper emphasis on the main dimensions of marketing and the available knowledge (schools and models), and with the intention of producing new paradigms to meet the requirements of manage-ment sciences.
The first stage in the task of defining the cognitive paradigm of marketing is the identification of elements that distinguish marketing from other scientific concepts and disciplines. Based on literature studies, the following characteristics may be postulated as specific for the marketing orientation:
the emphasis on processes taking place in the market environment;concentration on target markets;
••
56 K. Mazurek-Łopacińska
Acta Sci. Pol.
customer-oriented approach – creating customer value;marketing research as basis for the design of strategies and activities;market influence based on a cohesive set of instruments;integration of forms and instruments of communication with the environment;creativity in marketing thinking;anticipation of market phenomena and processes. The evolution of marketing as a concept may be approached from various perspecti-
ves, and emphasise different dimensions of the field under study. The following approa-ches can be of interest here:
the scope – describing the key focus of marketing activities (product, customer, brand, value);the idea – transactional, strategic, partnership-based, value-based, holistic, marketing 3.0;the instruments – forms and mechanisms of market influence (marketing mix, integra-ted marketing, virtual marketing, social media marketing, affiliate marketing, sensory marketing);the structure – marketing in a selected sector, on a selected market, local, internatio-nal, marketing in non-profit organisations.In the course of the development of marketing as a field of study, new basic paradigms
evolved, from the transaction marketing paradigm, through strategic and partnership pa-radigms, up to the present concept of value-based marketing paradigm (Table 1). The lat-ter, widely regarded as an example of a cultural paradigm, postulates the need of adopting a holistic (i.e. multidimensional) approach to customers, taking into account not only the rational and emotional dimensions of this relation, but also the spiritual aspects associated with values that motivate their behaviours. In this way, values become a central idea for the design of mission, vision and marketing strategy of any organisation, and – on the operating level – a basis for the construction of product offer that responds not only to the specific practical (functional) needs, but also those of emotional and spiritual character.
Taking into account the typical approaches employed in the discipline of management sciences, it may be useful to emphasise the fundamental role of value management in the development of value-based marketing. The cultural context of this marketing concept is quite distinct, and results from the fact that the effectiveness of marketing in stimulating the markets and shaping the behavioural responses of customers is inherently determined by culture and its effects on customer perceptions, attitudes and market behaviours. The study of the role of individuals and groups in the perception of market and communica-tion phenomena requires us to adopt the qualitative methodologies of social and human sciences, such as psychology, sociology, cultural anthropology. The symbolic-interpre-tive approach seems best suited for our purposes. As one of the cultural paradigms in management sciences (Table 2), the symbolic-interpretive approach allows for the use of key cultural metaphors, terms, research methods, and instruments of change. This is important, since the bulk of research in this area involves subjective, qualitative analyses, and the fundamental significance is placed on semantic networks identified in texts and other messages (e.g. word-play associations). Only by adopting a certain narrative ap-proach, researchers may proceed with their subjective interpretation of the results obta-ined in the course of study.
••••••
•
•
•
•
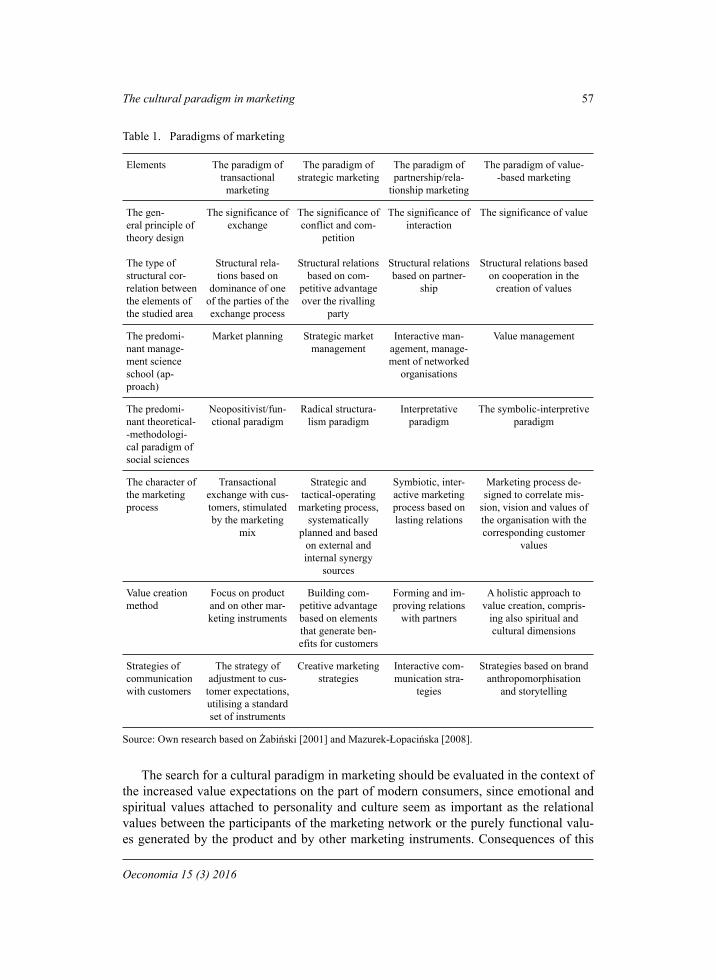
The cultural paradigm in marketing 57
Oeconomia 15 (3) 2016
Table 1. Paradigms of marketing
Elements The paradigm of transactional
marketing
The paradigm of strategic marketing
The paradigm of partnership/rela-
tionship marketing
The paradigm of value--based marketing
The gen-eral principle of theory design
The type of structural cor-relation between the elements of the studied area
The significance of exchange
Structural rela-tions based on
dominance of one of the parties of the exchange process
The significance of conflict and com-
petition
Structural relations based on com-
petitive advantage over the rivalling
party
The significance of interaction
Structural relations based on partner-
ship
The significance of value
Structural relations based on cooperation in the
creation of values
The predomi-nant manage-ment science school (ap-proach)
Market planning Strategic market management
Interactive man-agement, manage-ment of networked
organisations
Value management
The predomi-nant theoretical--methodologi-cal paradigm of social sciences
Neopositivist/fun-ctional paradigm
Radical structura-lism paradigm
Interpretative paradigm
The symbolic-interpretive paradigm
The character of the marketing process
Transactional exchange with cus-tomers, stimulated by the marketing
mix
Strategic and tactical-operating
marketing process, systematically
planned and based on external and internal synergy
sources
Symbiotic, inter-active marketing process based on lasting relations
Marketing process de-signed to correlate mis-
sion, vision and values of the organisation with the corresponding customer
values
Value creation method
Focus on product and on other mar-keting instruments
Building com-petitive advantage based on elements that generate ben-efits for customers
Forming and im-proving relations
with partners
A holistic approach to value creation, compris-
ing also spiritual and cultural dimensions
Strategies of communication with customers
The strategy of adjustment to cus-tomer expectations, utilising a standard set of instruments
Creative marketing strategies
Interactive com-munication stra-
tegies
Strategies based on brand anthropomorphisation
and storytelling
Source: Own research based on Żabiński [2001] and Mazurek-Łopacińska [2008].
The search for a cultural paradigm in marketing should be evaluated in the context of the increased value expectations on the part of modern consumers, since emotional and spiritual values attached to personality and culture seem as important as the relational values between the participants of the marketing network or the purely functional valu-es generated by the product and by other marketing instruments. Consequences of this
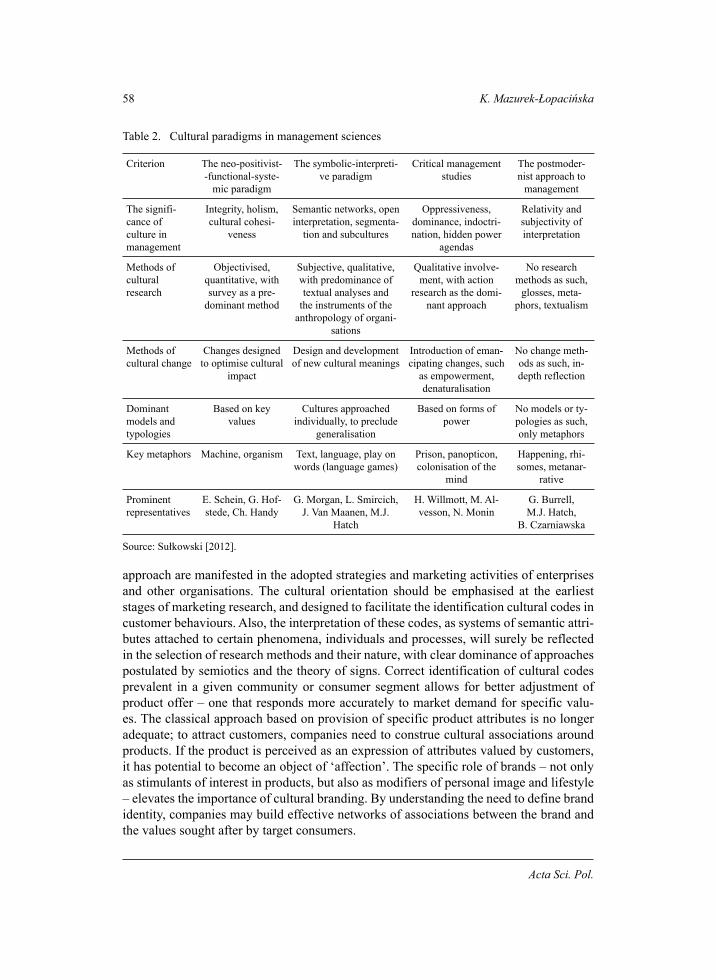
58 K. Mazurek-Łopacińska
Acta Sci. Pol.
Table 2. Cultural paradigms in management sciences
Criterion The neo-positivist--functional-syste-
mic paradigm
The symbolic-interpreti-ve paradigm
Critical management studies
The postmoder-nist approach to
management
The signifi-cance of culture in management
Integrity, holism, cultural cohesi-
veness
Semantic networks, open interpretation, segmenta-
tion and subcultures
Oppressiveness, dominance, indoctri-nation, hidden power
agendas
Relativity and subjectivity of interpretation
Methods of cultural research
Objectivised, quantitative, with survey as a pre-
dominant method
Subjective, qualitative, with predominance of textual analyses and
the instruments of the anthropology of organi-
sations
Qualitative involve-ment, with action
research as the domi-nant approach
No research methods as such,
glosses, meta-phors, textualism
Methods of cultural change
Changes designed to optimise cultural
impact
Design and development of new cultural meanings
Introduction of eman-cipating changes, such
as empowerment, denaturalisation
No change meth-ods as such, in-depth reflection
Dominant models and typologies
Based on key values
Cultures approached individually, to preclude
generalisation
Based on forms of power
No models or ty-pologies as such, only metaphors
Key metaphors Machine, organism Text, language, play on words (language games)
Prison, panopticon, colonisation of the
mind
Happening, rhi-somes, metanar-
rative
Prominent representatives
E. Schein, G. Hof-stede, Ch. Handy
G. Morgan, L. Smircich, J. Van Maanen, M.J.
Hatch
H. Willmott, M. Al-vesson, N. Monin
G. Burrell, M.J. Hatch,
B. Czarniawska
Source: Sułkowski [2012].
approach are manifested in the adopted strategies and marketing activities of enterprises and other organisations. The cultural orientation should be emphasised at the earliest stages of marketing research, and designed to facilitate the identification cultural codes in customer behaviours. Also, the interpretation of these codes, as systems of semantic attri-butes attached to certain phenomena, individuals and processes, will surely be reflected in the selection of research methods and their nature, with clear dominance of approaches postulated by semiotics and the theory of signs. Correct identification of cultural codes prevalent in a given community or consumer segment allows for better adjustment of product offer – one that responds more accurately to market demand for specific valu-es. The classical approach based on provision of specific product attributes is no longer adequate; to attract customers, companies need to construe cultural associations around products. If the product is perceived as an expression of attributes valued by customers, it has potential to become an object of ‘affection’. The specific role of brands – not only as stimulants of interest in products, but also as modifiers of personal image and lifestyle – elevates the importance of cultural branding. By understanding the need to define brand identity, companies may build effective networks of associations between the brand and the values sought after by target consumers.
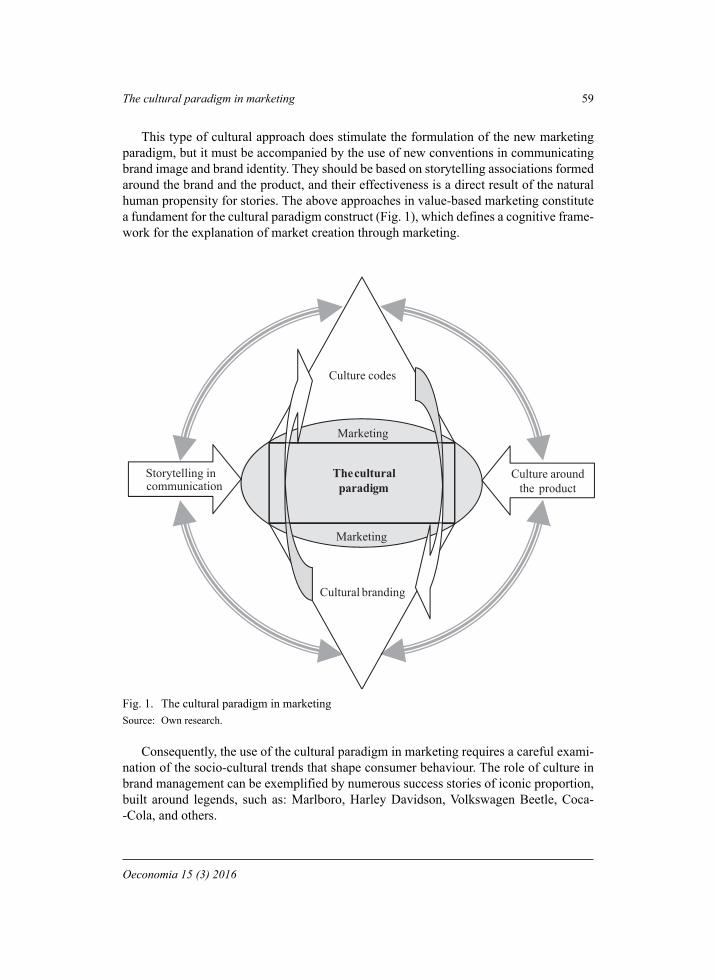
The cultural paradigm in marketing 59
Oeconomia 15 (3) 2016
This type of cultural approach does stimulate the formulation of the new marketing paradigm, but it must be accompanied by the use of new conventions in communicating brand image and brand identity. They should be based on storytelling associations formed around the brand and the product, and their effectiveness is a direct result of the natural human propensity for stories. The above approaches in value-based marketing constitute a fundament for the cultural paradigm construct (Fig. 1), which defines a cognitive frame-work for the explanation of market creation through marketing.
Culture codes
The cultural paradigm
Marketing
Culture around the product
Marketing
Cultural branding
Storytelling in communication
Fig. 1. The cultural paradigm in marketingSource: Own research.
Consequently, the use of the cultural paradigm in marketing requires a careful exami-nation of the socio-cultural trends that shape consumer behaviour. The role of culture in brand management can be exemplified by numerous success stories of iconic proportion, built around legends, such as: Marlboro, Harley Davidson, Volkswagen Beetle, Coca--Cola, and others.
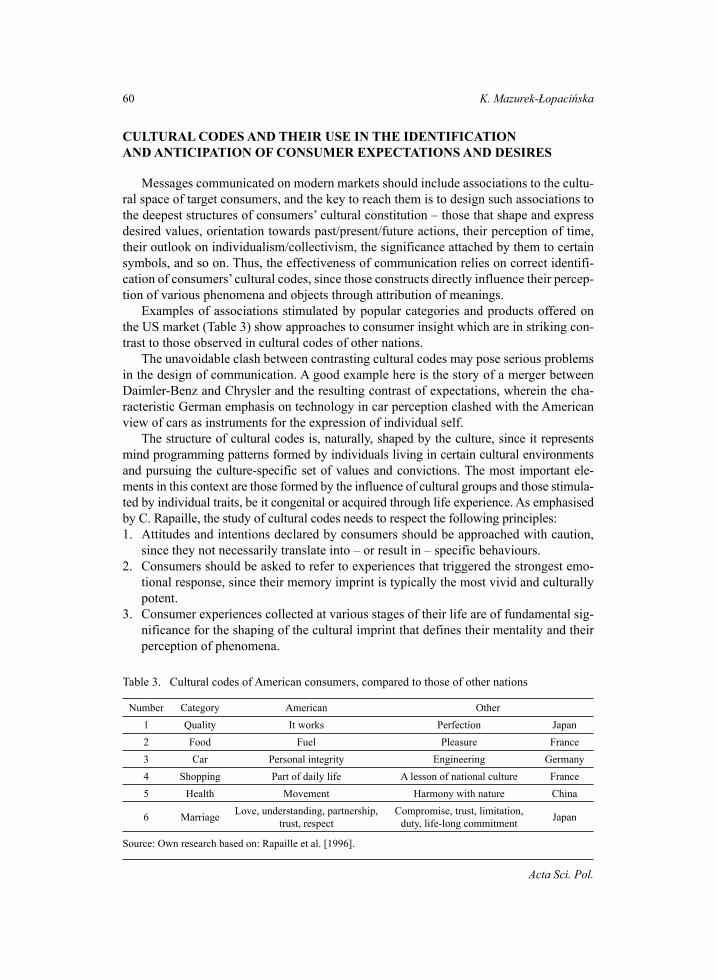
60 K. Mazurek-Łopacińska
Acta Sci. Pol.
CULTURAL CODES AND THEIR USE IN THE IDENTIFICATION AND ANTICIPATION OF CONSUMER EXPECTATIONS AND DESIRES
Messages communicated on modern markets should include associations to the cultu-ral space of target consumers, and the key to reach them is to design such associations to the deepest structures of consumers’ cultural constitution – those that shape and express desired values, orientation towards past/present/future actions, their perception of time, their outlook on individualism/collectivism, the significance attached by them to certain symbols, and so on. Thus, the effectiveness of communication relies on correct identifi-cation of consumers’ cultural codes, since those constructs directly influence their percep-tion of various phenomena and objects through attribution of meanings.
Examples of associations stimulated by popular categories and products offered on the US market (Table 3) show approaches to consumer insight which are in striking con-trast to those observed in cultural codes of other nations.
The unavoidable clash between contrasting cultural codes may pose serious problems in the design of communication. A good example here is the story of a merger between Daimler-Benz and Chrysler and the resulting contrast of expectations, wherein the cha-racteristic German emphasis on technology in car perception clashed with the American view of cars as instruments for the expression of individual self.
The structure of cultural codes is, naturally, shaped by the culture, since it represents mind programming patterns formed by individuals living in certain cultural environments and pursuing the culture-specific set of values and convictions. The most important ele-ments in this context are those formed by the influence of cultural groups and those stimula-ted by individual traits, be it congenital or acquired through life experience. As emphasised by C. Rapaille, the study of cultural codes needs to respect the following principles:1. Attitudes and intentions declared by consumers should be approached with caution,
since they not necessarily translate into – or result in – specific behaviours.2. Consumers should be asked to refer to experiences that triggered the strongest emo-
tional response, since their memory imprint is typically the most vivid and culturally potent.
3. Consumer experiences collected at various stages of their life are of fundamental sig-nificance for the shaping of the cultural imprint that defines their mentality and their perception of phenomena.
Table 3. Cultural codes of American consumers, compared to those of other nations
Number Category American Other1 Quality It works Perfection Japan2 Food Fuel Pleasure France3 Car Personal integrity Engineering Germany4 Shopping Part of daily life A lesson of national culture France5 Health Movement Harmony with nature China
6 Marriage Love, understanding, partnership, trust, respect
Compromise, trust, limitation, duty, life-long commitment Japan
Source: Own research based on: Rapaille et al. [1996].

The cultural paradigm in marketing 61
Oeconomia 15 (3) 2016
4. To study the mechanisms of perception and reaction to different stimuli, researchers should employ a wide spectrum of research approaches that help identify the interna-lised cultural imprints.Good understanding of cultural codes specific for a target group opens up potential
for associating product features with potent cultural elements expressed in myths and archetypes. This makes it easier to attract customers by stimulating their thought proces-ses – and not only those of conscious origin, but also those observed in the unconscious sphere, which seems to be the prime mover of customer responses (reactions) to marke-ting communication.
ARCHETYPE-BASED CULTURAL BRANDING
Cultural branding, as a new concept in brand management and image building, is a good example of practical expression of the cultural approach to modern marketing. The concept, postulated by D. Holt in 2004, is based on two pillars:
true values, i.e. brand authenticity;human archetypes that express consumers’ way of thinking.In this approach, cultural archetypes become a fundament for brand positioning, with
potential to build iconic brands. Their role in stimulating consumer behaviour, as empha-sised by Holt, is a consequence of a good concept design that incorporates the follo-wing:
a legend generated in response to consumer needs;a description of a historic social figure associated with the brand.The most fundamental feature of an iconic brand is its association with a quality
product. In addition, iconic brands are distinguished by their ability to respond to current trends – and not necessarily in terms of keeping up with the fashion.
Figure 2 presents two perspectives of approach to brand identity: the external (ma-terial) dimension of physical properties defining the product’s utility, and the internal (immaterial) dimension expressed through personality, cultural values, self-image and mentality defining consumers’ perception and interpretation of reality.
The functional value of brands is no longer potent enough to maintain consumer in-terest and brand identification. Modern consumers seem to place more and more empha-sis on affinity, i.e. brand accordance with their values, lifestyle choices, mentality and culture. To respond to this trend, brand management utilises anthropomorphisation: by building brand image on human features, we can construe brand personality around its central characteristics, as defined in the brand profile.
The most frequent premise for brand anthropomorphisation (personification) is based on its potential to shape consumer interactions with the brand by stimulating satisfaction, incentive to buy and, ultimately, build customer loyalty. The above objectives can only be reached if the consumers are able to perceive and appreciate such brand features which correspond to their preferred and culturally determined lifestyle choices and values.
The effectiveness of cultural branding results from the fact that the unique personality profile of the brand has the effect of stimulating the purchase of brand-bearing products. At the same time, brand features seem to define target recipients, by expressing their
••
••
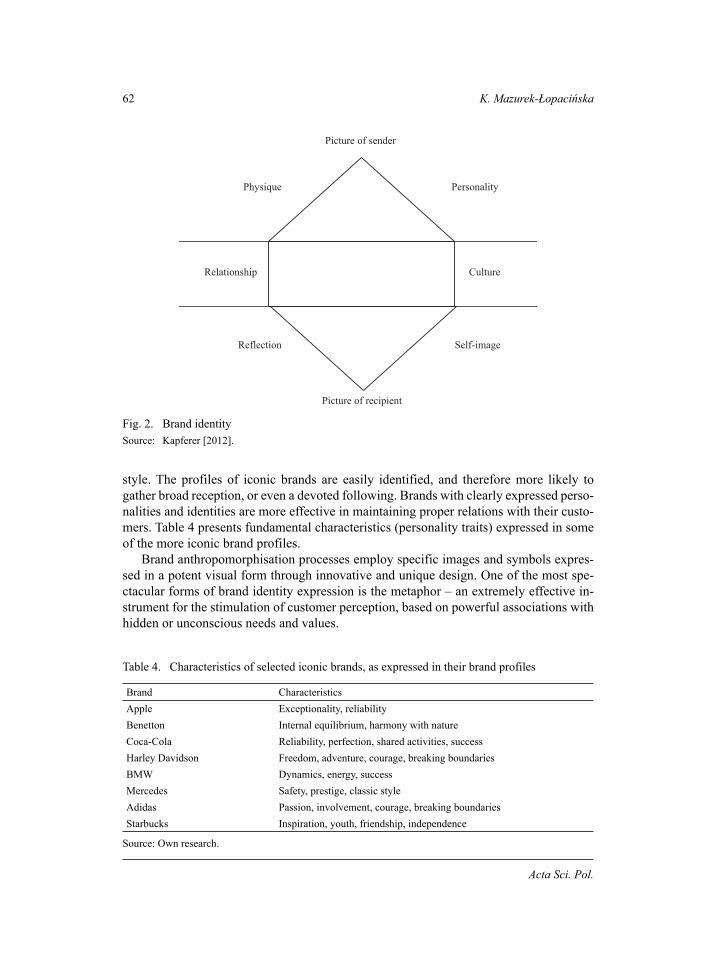
62 K. Mazurek-Łopacińska
Acta Sci. Pol.
style. The profiles of iconic brands are easily identified, and therefore more likely to gather broad reception, or even a devoted following. Brands with clearly expressed perso-nalities and identities are more effective in maintaining proper relations with their custo-mers. Table 4 presents fundamental characteristics (personality traits) expressed in some of the more iconic brand profiles.
Brand anthropomorphisation processes employ specific images and symbols expres-sed in a potent visual form through innovative and unique design. One of the most spe-ctacular forms of brand identity expression is the metaphor – an extremely effective in-strument for the stimulation of customer perception, based on powerful associations with hidden or unconscious needs and values.
erutluC pihsnoitaleR
ytilanosreP euqisyhP
egami-fleS noitcelfeR
Picture of recipient
Picture of sender
Fig. 2. Brand identitySource: Kapferer [2012].
Table 4. Characteristics of selected iconic brands, as expressed in their brand profiles
Brand CharacteristicsApple Exceptionality, reliabilityBenetton Internal equilibrium, harmony with natureCoca-Cola Reliability, perfection, shared activities, success Harley Davidson Freedom, adventure, courage, breaking boundariesBMW Dynamics, energy, successMercedes Safety, prestige, classic styleAdidas Passion, involvement, courage, breaking boundariesStarbucks Inspiration, youth, friendship, independence
Source: Own research.
The cultural paradigm in marketing 63
Oeconomia 15 (3) 2016
The emphasis on the cultural dimensions of brand management strategies based on cultural branding is, at the same time, serves to strengthen brand credibility, which seems of particular importance in the context of the modern appreciation for authenticity.
At this point, it may be interesting to pose the following question: Does the setting of a brand in a specific cultural context necessitate the stability and firmness of values pro-moted in association with the brand. In line with the main premises of cultural branding, the effectiveness of brand management requires constant re-evaluation of promoted valu-es in response to socio-cultural changes in the environment [Kaźmierczak 2013, Skubisz 2013]. Skilful handling of new challenges generated by changes in consumer trends and ideologies helps reinforce the brand’s attribute of cultural innovation.
Good understanding of the mechanism of customer identification with brands helps companies increase their effectiveness in shaping customer preferences and attitudes.
One of the best exemplifications of this approach is the Apple brand. Their products, despite the relatively high price tags, are received with great interest, mainly due to specific features that discern them from the rest of computer, tablet and smartphone devices. As a re-sult, they are favoured by artists, designers and other freelancing professionals. The unique identity of the Apple brand, designed by the visionary Steve Jobs, is perceived as exclusive and satisfying the needs of the most discerning users, those who take care in projecting their prestige and professional position. This is the power of brands built on legends, sets of attributes designed to stimulate imagination and emotions of potential customers.
Brand personality is therefore shaped by brand history, presented in a suggestive form of a ‘legend’. Another good example of a brand built on an attractive legend is Harley Davidson: their products are strongly associated with such qualities as courage, freedom, strength, independence, and breaking boundaries.
To create an attractive legend, it is necessary to start with a promotion concept that accentuates some of the values sought after by the potential customers, both those resul-ting from their psychographic profiles and lifestyles, and those that inspire them to trans-form the existing styles. The effectiveness of a legend lies not only in skilful selection of communication instruments, but also (and most importantly) in transition into a new communication style: from unidirectional to bidirectional, from monologue to dialogue. Stimulating the interactive mechanisms requires a cultural change, since company em-ployees need to acknowledge and appreciate the role of bidirectional communication with customers before they are able to utilise it effectively in the design and sale of products.
BRAND STORYTELLING IN COMMUNICATION
As suggested by the above observations, the most effective forms of communication are those that offer best potential for building strong relations with customers. They should be based on credible and emotionally infused messages, clearly associated with specific experiences and problems of a target consumer. The best way to approach it is through sto-rytelling [Bazydło-Jankowski 2015], a narrative design to stimulate emotional response and increase customer involvement with the brand. Storytelling comes in many forms and utili-ses various methods of stimulating consumer identification with the brand. Ideally, a story should present a protagonist faced with a specific problem, and not necessarily of funda-mental quality – even if the product itself is designed to satisfy fundamental needs. A good
64 K. Mazurek-Łopacińska
Acta Sci. Pol.
example of such an approach is the Real Beauty Sketches campaign by Dove, addressed to women who tend to under-rate their looks [Grzybowska 2013]. The campaign stimulated a broad dispute on the standards of beauty and the nature of self-image and personal value. By exposing the unfounded self-image convictions, the story managed to make strong as-sociations with the detrimental effects of idealised beauty standards propagated in popular culture – a source of stress and anxiety for many women nowadays:
For storytelling to be effective, it must be based on authentic values and presented through well-designed examples that stimulate interest and inspire disputes.
Below are some of the most popular types of stories that may be effectively used for brand storytelling purposes [Nieciecki 2012]:
who I am stories – with focus on description of a product, brand or protagonist, emphasising transition, development, past errors and successes as basis for the design of brand or product image;why I am here stories – presenting ideas, concepts and premises behind company strategic and operating activities;vision stories – presenting suggestion for the use of new ideas and solutions, with emphasis on benefits for the consumer, the brand, and the natural environment;teaching stories – with focus on explaining and motivating the rationale behind speci-fic activities in the context of company mission and strategic objectives.The power of storytelling lies in its ability to trigger customer involvement and aspi-
rations for self-realisation through sharing the company values and through the use of their products.
It must be noted here that storytelling is not limited to simple differentiation of the brand from the mass of competing products, but is designed to respond to specific social needs, motivations, aspirations and previously unrealised desires. The most popular ap-proach to the identification of such desires is the use of metaphors in market communica-tion processes. Deep metaphors seem particularly effective here, since they offer insight into fundamental, deeply rooted needs and values. And this type of values can be utilised regardless of the gender, age, education, profession, religion, cultural background, at-titudes and experiences of the target, because it addresses more universal mechanisms inherent in cultural perception of observable phenomena, problems, and so on.
It seems that best effects in the identification of such mechanisms can be obtained through the use of seven classes of deep metaphors, namely the metaphors of: balance, transformation, journey, connection, container, resource, and control [Zaltman 2010].
Careful analysis of the above metaphors may help explain customer behaviours, iden-tify rationales behind their decisions and understand their responses to marketing mes-sages. Good understanding of consumers’ mind paths, in turn, helps the company design a more effective strategy of market communication.
CONCLUSIONS
While the role of marketing in shaping consumer attitudes and behaviours cannot be underestimated, it seems that the present paradigm should be modified to emphasise the culture-building aspects of marketing. Modern marketing has become a central in-
•
•
•
•
The cultural paradigm in marketing 65
Oeconomia 15 (3) 2016
strument for the formulation and realisation of values through consumption. Marketing activities and messages, through their form and content, effect a significant impact on consumer perception of reality. Marketing has the power to influence the aesthetics of these images, but its effectiveness relies on the accuracy in the identification of cultural trends and codes and in skilful use of the corresponding insights. This focus on cultural aspects of marketing forms a basis for the emergence of a new cultural paradigm defining directions and mechanisms to be used in all areas of marketing, from market research focused on the identification of cultural codes in consumer be-haviours, through cultural branding, product and brand personification, to brand sto-rytelling communicated over specific channels. The new cultural paradigm, correlated with the concept of value-based marketing, forms a fundament for the integration of all dimensions of individual needs in the process of building the product offer. As such, it should be incorporated at the earliest stage of business model design in any company or organisation.
REFERENCES
Bazydło-Jankowski, M. (2015). Storytelling – budowanie angażującej opowieści o marce. Re-trieved from www.brief.pl/artykul,3169,storytelling_-_budowanie_angazujacej_opo-wiesci_o_marce.html (accessed: 21.06.2016).
Grzybowska, K. 10 najpopularniejszych reklam na YouTube. Czym Dove wygrało z Microsoftem? Retrieved from www.interaktywnie.com (accessed: 7.06.2013).
Holt, D.M. (2004). How brands become Icons – the principles of cultural branding. Harvard Busi-ness School Press, Boston.
Kapferer, J.N. (2012). New strategic brand management. Kogan Page, London–Philadelphia. Kaźmierczak, O. (2013). Branding kulturowy nie dla każdego. Retrieved from fashionprgirl.pl/
branding-kulturowy-nie-dla-kazdego.Lustig, M.W., Koster, J. (1996). Intercultural Competence: Interpersonal Communication Across
Cultures. Harper Collins, New York.Mazurek-Łopacińska, K. (2008). Kierunki rozwoju marketingu na współczesnym rynku. Zeszyty
Naukowe Politechniki Rzeszowskiej, Zarządzanie i Marketing, 13/249, 277–287.Nieciecki, Storytelling: jaki rodzaj historii wybrać, by osiągnąć zamierzony cel? Retrieved from
www.mediapolis.com (accessed: 12.10.2012).Rapaille, C. (2006). The Culture Code. An Ingenious Way to Understand Why People Around the
World Live and Buy as They Do. Broadway Books, New York. Sułkowski, Ł. (2012). Kulturowe procesy zarządzania. Difin, Warszawa.Skubisz, E. (2013). Wywiad z… Douglasem Holtem, jednym z wiodących światowych ekspertów
do spraw brandingu i innowacji. Retrieved from www.proto.pl (accessed: 28.03.2013).Zaltman, G.Z. (2010). Metafora w marketingu, jak przeniknąć umysły klientów dzięki metaforom
głębokim. Dom Wydawniczy Rebis, Poznań.Żabiński, L. (2001). Paradygmaty współczesnego marketingu. O niektórych aspektach identyfi-
kacyjnych. [In:] Marketing u progu XXI wieku. Akademia Ekonomiczna w Krakowie, Kraków, 50–52.
66 K. Mazurek-Łopacińska
Acta Sci. Pol.
PARADYGMAT KULTUROWY W MARKETINGU
Streszczenie. W artykule przedstawiono przesłanki i istotę paradygmatu kulturowego marketingu, który odpowiada koncepcji marketingu bazującego na wartościach. Za odnie-sienie dla tego paradygmatu w dziedzinie nauk o zarządzaniu można uznać paradygmat interpretatywno-symboliczny. Przejście do paradygmatu kulturowego jest wynikiem od-działywania na rynek czynników i trendów związanych z kulturą. Przedstawiono rolę ko-dów kulturowych w identyfikacji i antycypowaniu oczekiwań konsumentów, wskazując na udane praktyki tworzenia kultury wokół produktu. Wyrazem takich praktyk są koncepcje brandingu kulturowego oraz rozwój stylów i form komunikacji umiejętnie dostosowanych do wykreowanej kulturowej koncepcji produktu. Skuteczne okazują się formy opowieści o marce opracowane na podstawie historii wykreowanych w taki sposób, aby pobudzić emocje klienta i jego zaangażowanie w relację z marką.
Słowa kluczowe: paradygmat, marketing, wartości, kultura, branding, storytelling
Accepted for print: 09.08.2016
For citation: Mazurek-Łopacińska K. (2016). The cultural parading in marketing. Acta Sci. Pol., Oeconomia, 15 (3), 55–66.
Oeconomia 15 (3) 2016, 67–78
ISSN 1644-0757eISSN 2450-4602
http://acta_oeconomia.sggw.pl
Corresponding author: Nina Moysova Kyoseva, Krakow University of Economics, Sparkasse Bank Makedonija, AD, Skopje Makedonija 9-11, 1000 Skopje, Republic of Macedonia, e-mail: [email protected] © Copyright by Warsaw University of Life Sciences Press, Warsaw 2016
THE RELATION BETWEEN PUBLIC DEBT AND GDP – EMPIRICAL ANALYSIS FOR MACEDONIA AND ROMANIA
Nina Moysova KyosevaKrakow University of Economics
Abstract. The financial crises in 2008 initiated a broad debate on the challenges posed to the economic growth and development by crossing a specific threshold in the ratio between the public debt and the GDP, so that it can be sustainable and without harmful consequences on the future development perspectives. In this paper analysis of comparative data for Macedonia and Romania is performed, having in mind the following facts: both countries belonged to the former socialist block of countries; both countries went through very painful process of socio-economic transition; and Romania is an EU member-country since 2007 and is a good example for Macedonia for its future macroeconomic policies, once it becomes the EU member country in near future. The initial assumption in the research is that there is long run causality between public debt and GDP, as well as short run inverse relationship between the growth rates of these variables. Therefore, cointegration test for the data for Romania is conducted and then vector error correction model (VECM) is applied.
Key words: public debt, GDP, analysis, co-integration, vector error correction model, Granger causality
INTRODUCTION
The financial crises in 2008 initiated broad academic and policymaking debate on the challenges posed to the economic growth and development by crossing a specific thresh-old in the ratio between the public debt and the GDP, so that it can be sustainable and without harmful consequences on the future development perspectives. For developed countries, studies show and refer to the prudential limit (upper red line) of 60% of GDP (this coincides with the Maastricht treaty criteria). In less developed countries and devel-oping countries, prudent limit is calculated at 40% of GDP [Reinhart and Rogoff 2010].
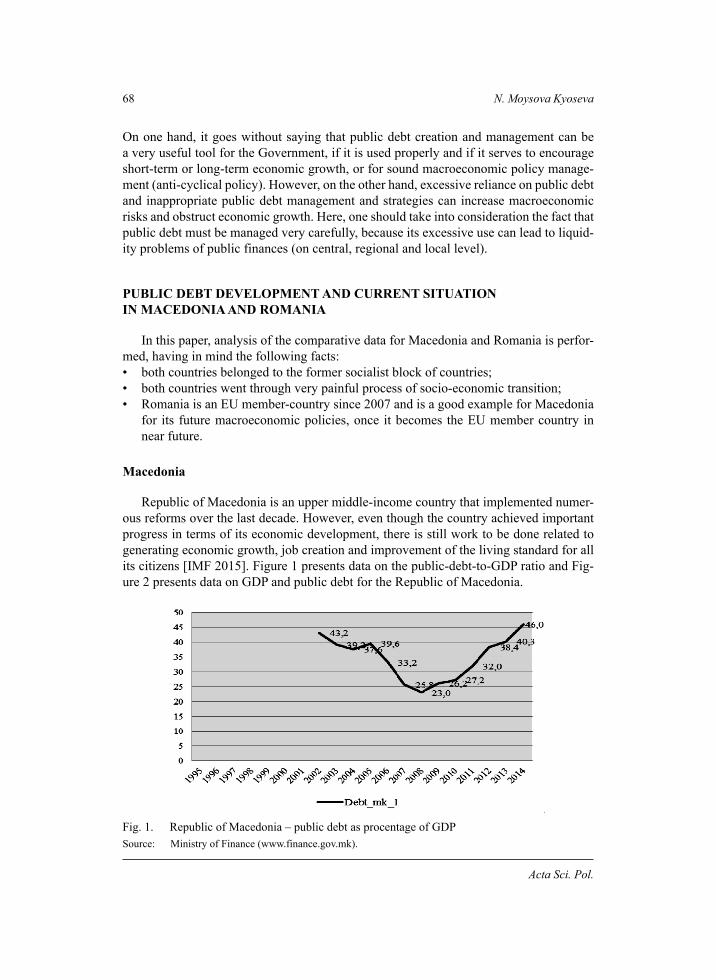
68 N. Moysova Kyoseva
Acta Sci. Pol.
On one hand, it goes without saying that public debt creation and management can be a very useful tool for the Government, if it is used properly and if it serves to encourage short-term or long-term economic growth, or for sound macroeconomic policy manage-ment (anti-cyclical policy). However, on the other hand, excessive reliance on public debt and inappropriate public debt management and strategies can increase macroeconomic risks and obstruct economic growth. Here, one should take into consideration the fact that public debt must be managed very carefully, because its excessive use can lead to liquid-ity problems of public finances (on central, regional and local level).
PUBLIC DEBT DEVELOPMENT AND CURRENT SITUATION IN MACEDONIA AND ROMANIA
In this paper, analysis of the comparative data for Macedonia and Romania is perfor-med, having in mind the following facts:
both countries belonged to the former socialist block of countries;both countries went through very painful process of socio-economic transition;Romania is an EU member-country since 2007 and is a good example for Macedonia for its future macroeconomic policies, once it becomes the EU member country in near future.
Macedonia
Republic of Macedonia is an upper middle-income country that implemented numer-ous reforms over the last decade. However, even though the country achieved important progress in terms of its economic development, there is still work to be done related to generating economic growth, job creation and improvement of the living standard for all its citizens [IMF 2015]. Figure 1 presents data on the public-debt-to-GDP ratio and Fig-ure 2 presents data on GDP and public debt for the Republic of Macedonia.
•••
Fig. 1. Republic of Macedonia – public debt as procentage of GDP Source: Ministry of Finance (www.finance.gov.mk).
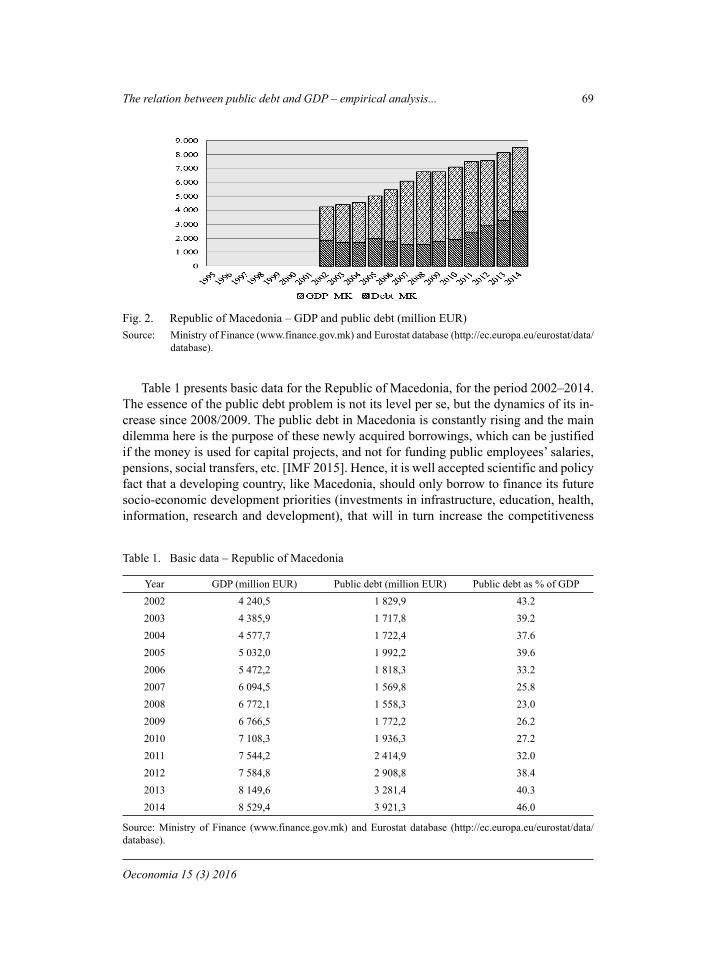
The relation between public debt and GDP – empirical analysis... 69
Oeconomia 15 (3) 2016
Table 1 presents basic data for the Republic of Macedonia, for the period 2002–2014. The essence of the public debt problem is not its level per se, but the dynamics of its in-crease since 2008/2009. The public debt in Macedonia is constantly rising and the main dilemma here is the purpose of these newly acquired borrowings, which can be justified if the money is used for capital projects, and not for funding public employees’ salaries, pensions, social transfers, etc. [IMF 2015]. Hence, it is well accepted scientific and policy fact that a developing country, like Macedonia, should only borrow to finance its future socio-economic development priorities (investments in infrastructure, education, health, information, research and development), that will in turn increase the competitiveness
Fig. 2. Republic of Macedonia – GDP and public debt (million EUR)Source: Ministry of Finance (www.finance.gov.mk) and Eurostat database (http://ec.europa.eu/eurostat/data/
database).
Table 1. Basic data – Republic of Macedonia
Year GDP (million EUR) Public debt (million EUR) Public debt as % of GDP2002 4 240,5 1 829,9 43.22003 4 385,9 1 717,8 39.22004 4 577,7 1 722,4 37.62005 5 032,0 1 992,2 39.62006 5 472,2 1 818,3 33.22007 6 094,5 1 569,8 25.82008 6 772,1 1 558,3 23.02009 6 766,5 1 772,2 26.22010 7 108,3 1 936,3 27.22011 7 544,2 2 414,9 32.02012 7 584,8 2 908,8 38.42013 8 149,6 3 281,4 40.32014 8 529,4 3 921,3 46.0
Source: Ministry of Finance (www.finance.gov.mk) and Eurostat database (http://ec.europa.eu/eurostat/data/database).
70 N. Moysova Kyoseva
Acta Sci. Pol.
of the economy. The increased competitiveness will contribute to higher growth rates in the economy, thus allowing the future generations to easily repay the loans taken by the present generations in the country.
Romania
The analysis of public debt dynamics has the purpose to offer answers and solutions concerning the government’s capacity to maintain the same direction of expenditures an-drevenues, to keep the public debt at sustainable level (as percentage of the GDP). Table 2 presents basic data on the GDP, public debt and public-debt-to-GDP ratio for Romania, for the period 1995–2014.
Romania went through three periods of time differing in economic background and applicable legal regulations [Oprea et al. 2012]:1. Period of 1990–2000 was extremely difficult and tumultuous socio-economically for
Romania. Data from Table 2 shows that the public-debt-to-GDP ratio has generally recorded, with some exceptions, an upward trend, increasing from 8.0% in 1996 to a maximum of 19.2% in 1999 and slight decline to 18.5 in 2000.
2. Period of 2001–2007 – marked by high GDP growth rates (exceeding even, in real-figures, 8% of GDP in 2004) and a constant decline in the public-debt-to-GDP ratio,
Table 2. Basic data – Romania
Year GDP (million EUR) Public debt (million EUR) Public debt as % of GDP1995 28 763,0 – –1996 29 228,7 2 333,9 8.01997 31 683,6 4 334,5 13.71998 37 313,9 4 852,1 13.01999 33 942,7 6 527,4 19.22000 40 796,8 7 532,8 18.52001 45 503,5 10 917,2 24.02002 48 810,4 10 757,1 22.02003 52 931,0 10 309,5 19.52004 61 404,0 11 768,7 19.22005 80 225,6 12 397,6 15.52006 98 418,6 12 585,6 12.82007 125 403,4 14 763,0 11.82008 142 396,3 17 158,6 12.02009 120 409,2 27 970,5 23.22010 126 746,4 37 451,2 29.52011 133 305,9 44 688,3 33.52012 133 511,4 50 128,6 37.52013 144 253,5 54 170,0 37.62014 150 230,1 59 273,0 39.5
Source: Eurostat database (http://ec.europa.eu/eurostat/data/database).
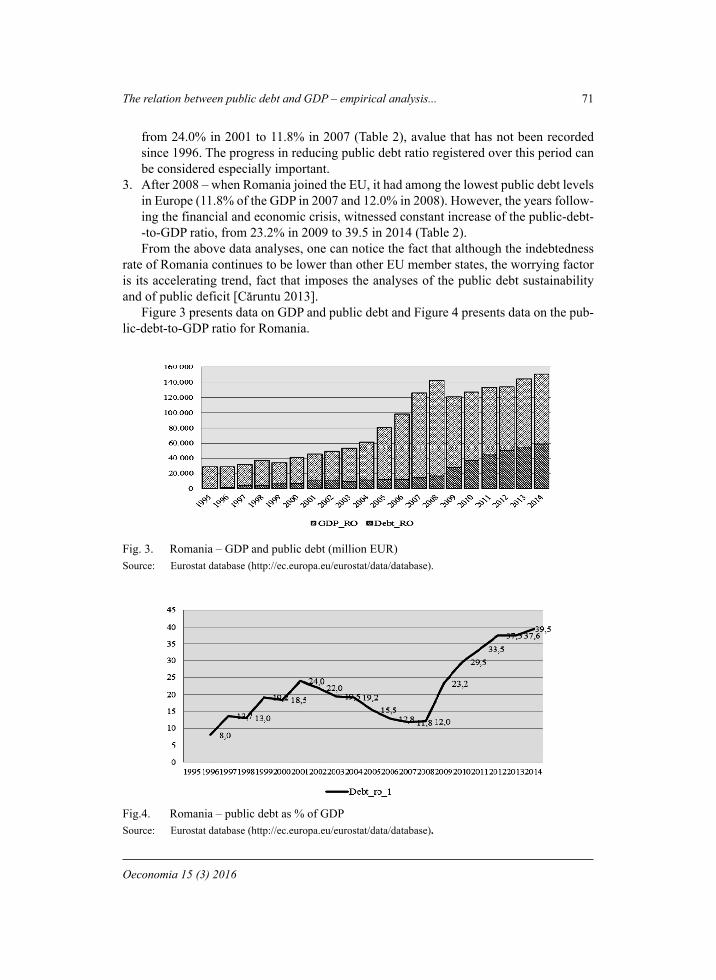
The relation between public debt and GDP – empirical analysis... 71
Oeconomia 15 (3) 2016
from 24.0% in 2001 to 11.8% in 2007 (Table 2), avalue that has not been recorded since 1996. The progress in reducing public debt ratio registered over this period can be considered especially important.
3. After 2008 – when Romania joined the EU, it had among the lowest public debt levels in Europe (11.8% of the GDP in 2007 and 12.0% in 2008). However, the years follow-ing the financial and economic crisis, witnessed constant increase of the public-debt--to-GDP ratio, from 23.2% in 2009 to 39.5 in 2014 (Table 2). From the above data analyses, one can notice the fact that although the indebtedness
rate of Romania continues to be lower than other EU member states, the worrying factor is its accelerating trend, fact that imposes the analyses of the public debt sustainability and of public deficit [Căruntu 2013].
Figure 3 presents data on GDP and public debt and Figure 4 presents data on the pub-lic-debt-to-GDP ratio for Romania.
Fig. 3. Romania – GDP and public debt (million EUR)Source: Eurostat database (http://ec.europa.eu/eurostat/data/database).
Fig.4. Romania – public debt as % of GDPSource: Eurostat database (http://ec.europa.eu/eurostat/data/database).
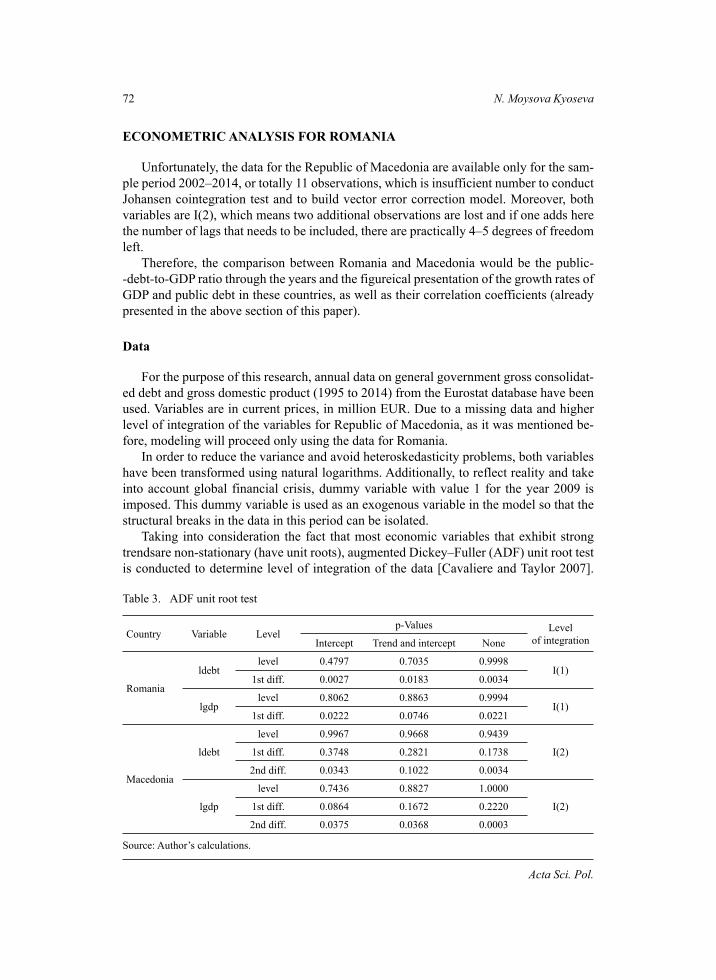
72 N. Moysova Kyoseva
Acta Sci. Pol.
ECONOMETRIC ANALYSIS FOR ROMANIA
Unfortunately, the data for the Republic of Macedonia are available only for the sam-ple period 2002–2014, or totally 11 observations, which is insufficient number to conduct Johansen cointegration test and to build vector error correction model. Moreover, both variables are I(2), which means two additional observations are lost and if one adds here the number of lags that needs to be included, there are practically 4–5 degrees of freedom left.
Therefore, the comparison between Romania and Macedonia would be the public--debt-to-GDP ratio through the years and the figureical presentation of the growth rates of GDP and public debt in these countries, as well as their correlation coefficients (already presented in the above section of this paper).
Data
For the purpose of this research, annual data on general government gross consolidat-ed debt and gross domestic product (1995 to 2014) from the Eurostat database have been used. Variables are in current prices, in million EUR. Due to a missing data and higher level of integration of the variables for Republic of Macedonia, as it was mentioned be-fore, modeling will proceed only using the data for Romania.
In order to reduce the variance and avoid heteroskedasticity problems, both variables have been transformed using natural logarithms. Additionally, to reflect reality and take into account global financial crisis, dummy variable with value 1 for the year 2009 is imposed. This dummy variable is used as an exogenous variable in the model so that the structural breaks in the data in this period can be isolated.
Taking into consideration the fact that most economic variables that exhibit strong trendsare non-stationary (have unit roots), augmented Dickey–Fuller (ADF) unit root test is conducted to determine level of integration of the data [Cavaliere and Taylor 2007].
Table 3. ADF unit root test
Country Variable Levelp-Values Level
of integrationIntercept Trend and intercept None
Romania
ldebtlevel 0.4797 0.7035 0.9998
I(1)1st diff. 0.0027 0.0183 0.0034
lgdplevel 0.8062 0.8863 0.9994
I(1)1st diff. 0.0222 0.0746 0.0221
Macedonia
ldebt
level 0.9967 0.9668 0.9439
I(2)1st diff. 0.3748 0.2821 0.1738
2nd diff. 0.0343 0.1022 0.0034
lgdp
level 0.7436 0.8827 1.0000
I(2)1st diff. 0.0864 0.1672 0.2220
2nd diff. 0.0375 0.0368 0.0003
Source: Author’s calculations.
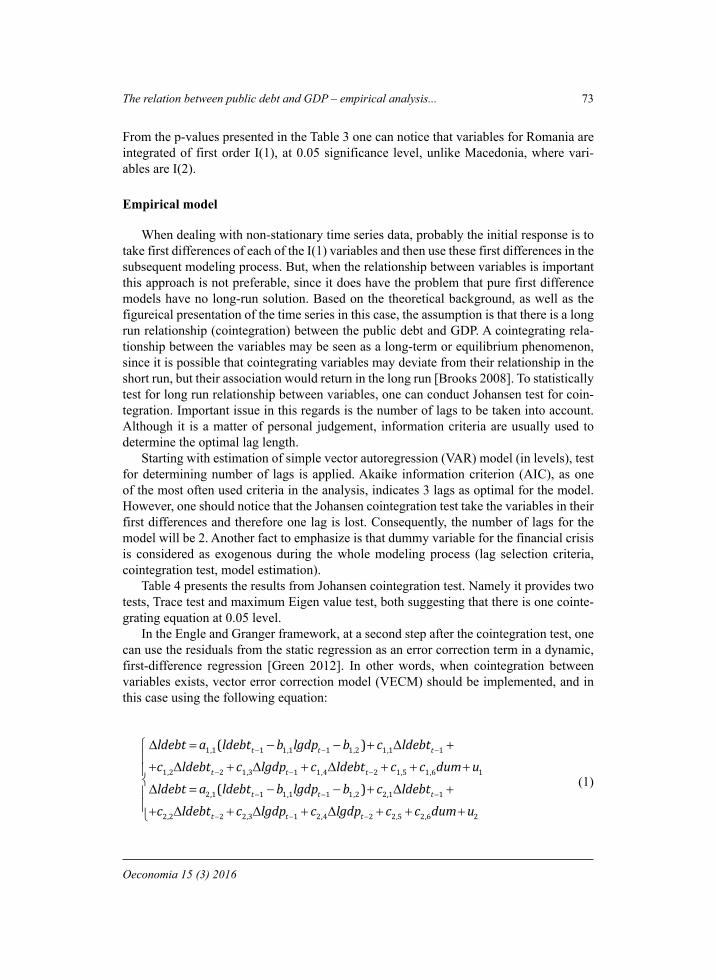
The relation between public debt and GDP – empirical analysis... 73
Oeconomia 15 (3) 2016
From the p-values presented in the Table 3 one can notice that variables for Romania are integrated of first order I(1), at 0.05 significance level, unlike Macedonia, where vari-ables are I(2).
Empirical model
When dealing with non-stationary time series data, probably the initial response is to take first differences of each of the I(1) variables and then use these first differences in the subsequent modeling process. But, when the relationship between variables is important this approach is not preferable, since it does have the problem that pure first difference models have no long-run solution. Based on the theoretical background, as well as the figureical presentation of the time series in this case, the assumption is that there is a long run relationship (cointegration) between the public debt and GDP. A cointegrating rela-tionship between the variables may be seen as a long-term or equilibrium phenomenon, since it is possible that cointegrating variables may deviate from their relationship in the short run, but their association would return in the long run [Brooks 2008]. To statistically test for long run relationship between variables, one can conduct Johansen test for coin-tegration. Important issue in this regards is the number of lags to be taken into account. Although it is a matter of personal judgement, information criteria are usually used to determine the optimal lag length.
Starting with estimation of simple vector autoregression (VAR) model (in levels), test for determining number of lags is applied. Akaike information criterion (AIC), as one of the most often used criteria in the analysis, indicates 3 lags as optimal for the model. However, one should notice that the Johansen cointegration test take the variables in their first differences and therefore one lag is lost. Consequently, the number of lags for the model will be 2. Another fact to emphasize is that dummy variable for the financial crisis is considered as exogenous during the whole modeling process (lag selection criteria, cointegration test, model estimation).
Table 4 presents the results from Johansen cointegration test. Namely it provides two tests, Trace test and maximum Eigen value test, both suggesting that there is one cointe-grating equation at 0.05 level.
In the Engle and Granger framework, at a second step after the cointegration test, one can use the residuals from the static regression as an error correction term in a dynamic, first-difference regression [Green 2012]. In other words, when cointegration between variables exists, vector error correction model (VECM) should be implemented, and in this case using the following equation:
1,1 1 1,1 1 1,2 1,1 11,2 2 1,3 1 1,4 2 1,5 1,6 1
2,1 1 1,1 1 1,2 2,1 12,2 2 2,3 1 2,4
( )( )
t t t
t t t
t t t
t t
ldebt a ldebt b lgdp b c ldebt
c ldebt c lgdp c ldebt c c dum u
ldebt a ldebt b lgdp b c ldebt
c ldebt c lgdp c lgdp 2 2,5 2,6 2t c c dum u
(1)

74 N. Moysova Kyoseva
Acta Sci. Pol.
where: ldebt – natural logarithm of general government gross consolidated public debt;lgdp – natural logarithm of GDP;ai, bi, ci – estimated coefficients;dum – dummy variable for the financial crisis;ui – obtained residuals.
Table 4. Cointegration tests
Johansen cointegration test
Sample (adjusted): 1999, 2014
Included observations: 16 after adjustments
Trend assumption: Linear deterministic trend
Series: LDEBT LGDP
Exogenous series: DUM
Warning: critical values assume no exogenous series
Lags interval (in first differences): 1 to 2
Unrestricted cointegration rank test (Trace test)
HypothesizedNo. of CE(s) Eigen value Trace
statistic0.05
critical value prob.
None* 0.678248 19.19197 15.49471 0.0132
At most 1 0.063424 1.048400 3.841466 0.3059
Trace test indicates 1 cointegrating eqn(s) at the 0.05 level.
* Denotes rejection of the hypothesis at the 0.05 level.
Unrestricted cointegration rank test (Maximum Eigen value test)
HypothesizedNo. of CE(s) Eigen value Max-Eigen
statistic0.05
critical Value prob.
None* 0.678248 18.14357 14.26460 0.0116
At most 1 0.063424 1.048400 3.841466 0.3059
Max-Eigen value test indicates 1 cointegrating eqn(s) at the 0.05 level.
*Denotes rejection of the hypothesis at the 0.05 level.
Source: Author’s calculations.
The error correction term or the co-integrating equation is presented in the first part of the equations. Estimated coefficients that refer to this co-integrating equation (ai) show the speed of adjustment towards equilibrium in the model and they should be negative and statistically significant.
Having in mind that VECM uses first differences of the variables, they could be inter-preted as an increase in the level of public debt and increase in GDP. Thus, if one recalls of the assumption that there is an inverse relationship between the growth rates of public debt and GDP, it is logically to obtain negative estimated coefficients for c1,3, c1,4, c2,1 and c2,2. Moreover, if these coefficients are simultaneously statistically significant, than the model indicates bi-directional relationship between the variables. Simpler way to test this hypothesis is to use Granger causality (block exogeneity) test. It is important to point

The relation between public debt and GDP – empirical analysis... 75
Oeconomia 15 (3) 2016
out that estimated model follows the assumptions of the ordinary least squares (OLS) method: normally distributed residuals, no serial correlation in the model and no hetero-skedasticity [Gujarati 2004, Stock and Watson 2006, Green 2012].
Results’ analysis
Empirical analysis of the data has largely confirmed the initial assumptions about the connection between public debt and GDP. Above all, the research showed negative correlation coefficients between the growth rates of these two variables, which is mostly a result of the use of public debt as a counter-cyclical measure. It is interesting, though, that almost the same correlation coefficients between the growth rates of public debt and GDP are found in both countries, Macedonia and Romania (–0.46), which could be easily noticed from Figures 5 and 6.
Important message from these figures is the dynamics of the post crisis gap between the growth rates of the variables. Namely, both countries experienced economic stabiliza-
Fig. 5. Growth rates of public debt and GDP in RomaniaSource: Author’s calculations.
Fig. 6. Growth rates of public debt and GDP in Macedonia
Source: Author’s calculations.
76 N. Moysova Kyoseva
Acta Sci. Pol.
tion after the economic and financial crisis. Romania and Macedonia faced the beginning of the financial and economic crisis with favorable trends (lowest level of public debt in Romania when it joined EU in 2007 and the low debt level in 2008 in Macedonia as a re-sult of the early debt repayment). However, Romania and Macedonia witnessed a sharp decline in the GDP growth and increase in the public debt growth in 2009, whereas, both countries, after the initial impact of the crisis, went through a process of economic and fi-nancial stabilization, expressed in fairly favorable public debt and GDP growth rates. The main challenge in Macedonia was to maintain economic recovery without jeopardizing sustainability. Macedonia government’s growth strategy focusing on attracting foreign investment and enhancing public infrastructure has produced robust growth and a well--diversified export portfolio [IMF 2015]. In the case of Romania, it reduced internal and external imbalances through sound macroeconomic policies [Dumitrescu 2014]. How-ever, the main concern for Romania and Macedonia is both countries to implement sound macroeconomic policies, based on rationalized and redesigned public expenditures in order to adjust them to socio-economic needs of the current level of development in both economies.
Another confirmation of the theoretical assumptions is the econometric analysis of data in the case of Romania. Estimated equations for both variables in the VECM high level of the R-squared coefficients and both are statistically significant at 0.05 signifi-cance level. This means that data well fits the statistical model.
Regarding the long run relationship, obtained results of the model show significant negative co-integrating coefficient for the debt equation. This means that the model tends to equilibrium with speed of adjustment of 32.16%. Although also negative, co-integra-ting coefficient in the GDP equation is not statistically significant, therefore one cannot accept the hypothesis of long run causality of GDP from public debt.
On the other hand, short run relationship in the model could be explained by the esti-mated coefficients. Although some of them are not statistically significant at 0.05 signi-ficance level, they should be interpreted as a block of coefficients, not individually. For such interpretation Granger causality test is used. This test shows that there exists short run mutual relationship between variables. In other words, public debt Granger causes GDP and GDP Granger causes public debt, at 0.05 level of significance in the short run. Null hypotheses in the Granger causality test are as follows:
H0: c1,3 = c1,4 = 0 (2)
H0: c2,1 = c2,2 = 0 (3)
where: ci – short run coefficients from equation (1).
Finally, the influence of the financial crisis on GDP and public debt of Romania is no-tably expressed in the model. It shows highly significant coefficients of the intercept and the exogenous variable in both equations. The most interesting finding is that the increase of public debt in the crisis period is almost the same as the decrease of GDP in the same period (around 30%).
•
•
The relation between public debt and GDP – empirical analysis... 77
Oeconomia 15 (3) 2016
CONCLUSION
1. Non-stationary variables. For the case of Romania, both variables are integrated of first order I(1), whereas for Macedonia they are I(2). Higher level of integration of the variables, on one hand, and smaller sample of observations, on the other, makes modelling the data for Macedonia irrelevant.
2. Inverse relationship between growth rates of public debt and GDP. This conclusion is confirmed by obtained negative correlation coefficients of around –0.46 for both countries, as well as the figureical presentation of these data. It favours the use of public debt management as a means of counter-cyclical economic policy.
3. Estimated model for Romania is statistically significant and it fulfils the assumptions of the OLS method. Both equations of the model have high values of the F-statistics and high R-squared coefficients. Further, residuals in the model are normally distribu-ted, homoskedastic and no serially correlated. Overall, the model is relevant to derive conclusions.
4. Mutual short run causality of the variables. Although not all of the estimated coef-ficients in the model for Romania are statistically significant, block exogeneity test (Granger causality test) indicates bi-directional causal relationship between variables. If one adds up here the negative sign of these estimated coefficients, it is another con-firmation of the power of the public debt management as a means of counter-cyclical economic policy of the Romanian government.
5. Long run relationship from GDP to public debt. Statistically significant and negative error correction coefficient (–0.3216) in the estimated equation for public debt shows the speed of adjustment to equilibrium of 32.16% per period. This coefficient is also negative, but not significant in the equation for GDP (–0.09241), which means that there is only one-way long run relationship in the model for Romania.
6. High impact of the financial crisis. Economic reality in the model is shown by intro-ducing dummy variable reflecting the financial crisis as exogenous variable. Estima-ted coefficients of this variable show 30% increase in the public debt and almost the same decrease in GDP in the first post-crisis year (2009). This is the ex-post reaction of the Romanian government to the financial crisis.
REFERENCES
Brooks, C. (2008). Introductory Econometrics for Finance. 2nd edition. Cambridge University Press, Cambridge.
Căruntu, R.C. (2013). Public debt – structure and characteristics, Romania’s case. Annals of the “Constantin Brâncuşi” University of Târgu Jiu, Economy, 3, 30–35.
Cavaliere, G., Taylor R. (2007). Testing for unit roots in time series models with non-stationary volatility. Journal of Econometrics, 140, 2, 919–947.
Dumitrescu, B.A. (2014). The public debt in Romania – factors of influence, scenarios for the future and a sustainability analysis considering both a finite and infinite time horizon. Procedia Economics and Finance, 8, 283–292.
Green, W.H. (2012). Econometric Analysis. 7th edition. Pearson Prentice Hall, Upper Soddle River, New Jersey.
Gujarati, D. (2004). Basic Econometrics. 4th edition. McGraw-Hill, New York.
78 N. Moysova Kyoseva
Acta Sci. Pol.
IMF (2015). Article IV Consultation – Press Release, Staff Report, and Statement by the Executive Director for Former Yugoslav Republic of Macedonia. IMF Country Report 15/242.
Oprea, F., Bilan, I., Stoica, O. (2012). Public Debt Policy in Romania – A Critical Review. Models and Methods in Applied Sciences. Proceedings of II international conference EDSCM’12, Saint Malo, Mont Saint-Michel, France, 2–4.04.2012, V. Nida, M. Kadock, A. Zemliak (Eds), WSEAS Press, 212–217.
Reinhart, C.M., Rogoff, K.S. (2010). Growth in a time of debt. American Economic Review: Papers & Proceedings, 100, 573–578.
Stock, J.H., Watson M.W. (2006). Introduction to Econometrics. 3rd edition. Pearson Education, Boston.
RELACJA MIĘDZY DŁUGIEM PUBLICZNYM A PKB – ANALIZA EMPIRYCZNA DLA MACEDONII I RUMUNII
Streszczenie. Kryzys finansowy z 2008 roku stał się przyczynkiem do szerokiej debaty do-tyczącej wyzwań dla wzrostu i rozwoju ekonomicznego, które pojawiają się przy przekro-czeniu pewnego progu relacji długu publicznego do PKB, mając równocześnie na uwadze, aby rozwój ten był zrównoważony, bez negatywnych konsekwencji dla przyszłego wzrostu. W niniejszym artykule analizie poddane są dane porównawcze dla Macedonii i Rumunii, mając jednocześnie na uwadze następujące fakty: obydwa kraje są byłymi członkami blo-ku socjalistycznego; obydwa kraje przeszły przez bolesny okres transformacji socjo-eko-nomicznej; Rumunia jest krajem członkowskim Unii Europejskiej od 2007 roku i z tego powodu może stanowić dobry punkt odniesienia dla przyszłej polityki makroekonomicznej Macedonii, która w najbliższej przyszłości również stanie się członkiem UE. Wstępnym założeniem dla naszego badania jest istnienie związku przyczynowego w długim okresie między długiem publicznym a PKB, jak również istnienie odwrotnej relacji między tem-pem wzrostu tych dwóch zmiennych. Z tego względu przeprowadzono test kointegracji dla Rumunii, a następnie zastosowano model wektorowej korekty błędem (VECM).
Słowa kluczowe: dług publiczny, PKB, analiza, kointegracja, model wektorowej korekty błędem, test przyczynowości Grangera
Accepted for print: 09.06.2016
For citation: Moysova Kyoseva N. (2006). The relation between public debt and GDP – empirical analysis for Macedonia and Romania. Acta Sci. Pol., Oeconomia, 15(3), 67–78.
Oeconomia 15 (3) 2016, 79–90
ISSN 1644-0757eISSN 2450-4602
http://acta_oeconomia.sggw.pl
Corresponding author: Ewa Sobolewska-Poniedziałek, University of Zielona Góra, Faculty of Economics and Management, Podgórna 50, 65-001 Zielona Góra, Poland, e-mail: [email protected]
© Copyright by Warsaw University of Life Sciences Press, Warsaw 2016
EDUCATIONAL ACTIVITY AS THE GROWTH FACTOR OF PROFESSIONAL ACTIVITY OF ELDERLY PEOPLE
Anna Niewiadomska, Ewa Sobolewska-PoniedziałekUniversity of Zielona Góra
Abstract. The article undertakes the problem of the educational activity of elderly people. The research objective is, on the one side, showing the correlation between professional activity of elderly Polish people and their level of education, and on the other hand, the presentation of own research illustrating the attitude and experience of elderly people in the area of education and professional training. The analysis is made based on own research as well as the secondary data which picture educational and professional activity of elderly Poles against the background of the European Union member states. Comparative analysis of the level of educational involvement, measured by means of participation in education and professional training shown elderly Polish people take part in the process of improving qualification in a smaller degree than the inhabitant of the EU. At the same time regularity, manifesting itself in an increase in the level of their professional engagement proportionally to higher levels of education, can be observed. The results of own study showed that the majority of respondents recognize the important role of educational activity in the context of an individual’s position in the labor market. As many as 65% of respondents believed that education, both formal and informal learning, is crucial for maintaining employment or finding job. At the same time more than 74.6% have not been learning in the last 10 years.
Key words: educational activity, professional activity, lifelong learning, courses and oc-cupational training, elderly people
INTRODUCTION
Increasing life expectancy of the Europeans at the fertility rate which has not changed in a few decades means in the longer perspective decrease of the number of people starting their professional activity. As a consequence, shrinking of possible work
80 A. Niewiadomska, E. Sobolewska-Poniedziałek
Acta Sci. Pol.
resources results in a bigger interest in the issue of increasing the professional activity of the elderly. The conviction that it is necessary to keep social productivity of each single person became a signal to create solutions encouraging elderly people to stay in a labor market. It may be assumed that educational activity of the representatives of the older generation is at present one of the most important challenges. As the statistical data show, there is a strong correlation between the level of education and the professional activity rate. In case of Poland, it is especially important to work out solutions which can prevent premature withdrawal of elderly people from the labor market. Data analysis concerning the participation of the elderly in the lifelong learning shows that Polish people undertake educational effort much more rarely than average Europeans.
The study objective is, on the one hand, showing the correlation between professional activity of elderly Polish people and their level of education, and on the other hand, the presentation of own researches illustrating the attitude and experience of elderly people in the area of education and professional training. Simultaneously, the idea and role of lifelong learning in the context of the worker’s position at the dynamically changing labor market is explained. The empirical basis of the analysis are the results of own research and PARP data in a form of the research results of the Human Capital Balance, GUS (Central Statistical Office), Eurostat and especially Adult Education 2011, Social Diagno-sis 2015. Conditions and Quality of Life of Polish People.
The research was conducted at the end of 2015 among people aged 50–65 who lived in Zielona Góra municipality. The research sample consisted of 71 respondents, and the measuring tool was a questionnaire of survey. The questionnaire embraced 23 closed questions, semi-open questions and respondent’s particulars. Taking into account the vast scope of the article, it only presents the selected part of the obtained results. The analysis comprises mainly the results of the study, which are directly or indirectly related to the is-sue of lifelong learning of elderly people. The research gathered opinions of respondents chosen by means of a purposive sampling. The key criteria was respondent’s age. The research was conducted and financed solely by own means of the authors.
ROLE OF LIFELONG LEARNING IN THE CONTEXT OF THE CHANGING LABOR MARKET
Recent decades have been the period of very intensive changes happening in social, economic as well as cultural areas. Progressive process of the ageing of the population in a vital way influences a microeconomic situation, including the employment situation. One of the significant problems of the Polish labor market are competence and qualifica-tions maladjustments between work supply and work demand. As a consequence, it is assumed that lifelong learning needs to be treated as one of the ways of decreasing the discrepancy between workers’ qualifications and employers’ needs. Additional training and participation in lifelong education may influence the improvement of the situation in an essential way. However, it demands enthusiasm and determination of the employees and at the same time support and encouragement of the employers.
Continuous education is also called lifelong education, adult education or lifelong learning (LLL). It is assumed that it is a necessary element in the process of social and pro-fessional activation of elderly people. In the act on employment promotion and work mar-
Educational activity as the growth factor of professional activity... 81
Oeconomia 15 (3) 2016
ket institutions, it is understood as, “…educating in schools for adults, as well as receiving and complementing general knowledge, skills and professional qualifications in reference to the unemployed, those looking for a job, workers and employers” [Ustawa… 2015].
Lifelong learning is treated by the European Union as a vital condition of social and economical development of the memberstates. In published in 1995 the White Paper on Education and Training. Teaching and Learning – Towards the Learning Society the basic objective was to prepare individuals to live in an information society oriented on perma-nent education and gaining skills as a result of lifelong teaching and learning [The White Paper… 1995]. The need of continuous education is also reflected in Polish documents of strategic character, such as the Lifelong Learning Development Strategy, Education Development Strategy or in the National Action Plan aimed at Employment.
Educational activity of adults understood as lifelong learning has three basic forms: formal education, informal education and non-formal education. According to CEDEFOP glossary [Terminology… 2014] formal education takes place in an organized and structur-al environment and is to be undertaken intentionally. Informal education is an intentional actions taking place within planned activity yet not of educational character. Non-formal education, on the other hand, is usually action not planned by a participant, resulting from everyday activities connected with, for example, professional work, family life or enter-tainment, and it is not organized or structured. In the process of building a society based on knowledge, the need for professional training and continuous process of receiving new knowledge and competences are gaining vital importance. Hence, it is assumed that the indicators of adults participation in education and trainings are the main predicaments of the level of lifelong learning [Solarczyk-Ambrozik 2004]. In connection with the need to receive and complete qualifications by adults, there are created, among others, flexible lifelong learning systems, which make gaining qualifications easier in the out-of-school system. Here, the supporting role is played by the universities of the third age, where students may also be people who are still professionally active.
Most often the hardship of lifelong learning is a result of the labor market require-ments. Mature people, both in Poland and in the world, struggle with problems connected with a lower employment rate and professional activity. Training and gaining new skills need to be treated as methods of fighting inequality at the labor market as well as social and professional exclusion prevention [Sobolewska-Poniedziałek and Zarębska 2015].
High and systematic qualification raising is a factor encouraging work productivity and economy competitiveness. They also release the possibility of flexible adjustment to the changing situation in the labor market. The development of continuous education needs to be treated as a tool fighting unemployment, poverty and social exclusion. That is why the mechanism of LLL functioning should be built into the educational system of the society [Kształcenie ustawiczne i... 2011]. Employers, who are on the receiving end of the process, play a very important role in the process of the development and promotion of adult education. According to J. Szłapińska [2012] increasing competitiveness enforces employers to invest in the employees’ education, so they can become “the employees of knowledge” and as a result so that they complete their duties even more effectively. Even though on the one hand it is highly positive, often this phenomena concerns many so called “key employees”, who already hold appropriate education and high competence. It causes a kind of a paradox: the employees with high qualifications use the opportunity to
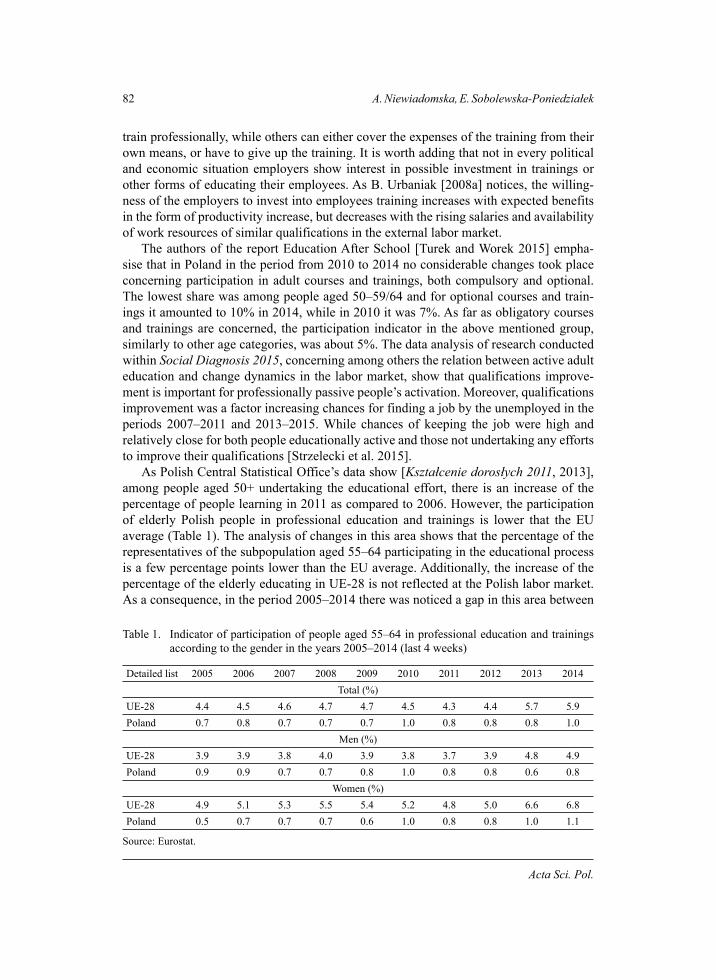
82 A. Niewiadomska, E. Sobolewska-Poniedziałek
Acta Sci. Pol.
train professionally, while others can either cover the expenses of the training from their own means, or have to give up the training. It is worth adding that not in every political and economic situation employers show interest in possible investment in trainings or other forms of educating their employees. As B. Urbaniak [2008a] notices, the willing-ness of the employers to invest into employees training increases with expected benefits in the form of productivity increase, but decreases with the rising salaries and availability of work resources of similar qualifications in the external labor market.
The authors of the report Education After School [Turek and Worek 2015] empha-sise that in Poland in the period from 2010 to 2014 no considerable changes took place concerning participation in adult courses and trainings, both compulsory and optional. The lowest share was among people aged 50–59/64 and for optional courses and train-ings it amounted to 10% in 2014, while in 2010 it was 7%. As far as obligatory courses and trainings are concerned, the participation indicator in the above mentioned group, similarly to other age categories, was about 5%. The data analysis of research conducted within Social Diagnosis 2015, concerning among others the relation between active adult education and change dynamics in the labor market, show that qualifications improve-ment is important for professionally passive people’s activation. Moreover, qualifications improvement was a factor increasing chances for finding a job by the unemployed in the periods 2007–2011 and 2013–2015. While chances of keeping the job were high and relatively close for both people educationally active and those not undertaking any efforts to improve their qualifications [Strzelecki et al. 2015].
As Polish Central Statistical Office’s data show [Kształcenie dorosłych 2011, 2013], among people aged 50+ undertaking the educational effort, there is an increase of the percentage of people learning in 2011 as compared to 2006. However, the participation of elderly Polish people in professional education and trainings is lower that the EU average (Table 1). The analysis of changes in this area shows that the percentage of the representatives of the subpopulation aged 55–64 participating in the educational process is a few percentage points lower than the EU average. Additionally, the increase of the percentage of the elderly educating in UE-28 is not reflected at the Polish labor market. As a consequence, in the period 2005–2014 there was noticed a gap in this area between
Table 1. Indicator of participation of people aged 55–64 in professional education and trainings according to the gender in the years 2005–2014 (last 4 weeks)
Detailed list 2005 2006 2007 2008 2009 2010 2011 2012 2013 2014Total (%)
UE-28 4.4 4.5 4.6 4.7 4.7 4.5 4.3 4.4 5.7 5.9Poland 0.7 0.8 0.7 0.7 0.7 1.0 0.8 0.8 0.8 1.0
Men (%)UE-28 3.9 3.9 3.8 4.0 3.9 3.8 3.7 3.9 4.8 4.9Poland 0.9 0.9 0.7 0.7 0.8 1.0 0.8 0.8 0.6 0.8
Women (%)UE-28 4.9 5.1 5.3 5.5 5.4 5.2 4.8 5.0 6.6 6.8Poland 0.5 0.7 0.7 0.7 0.6 1.0 0.8 0.8 1.0 1.1
Source: Eurostat.
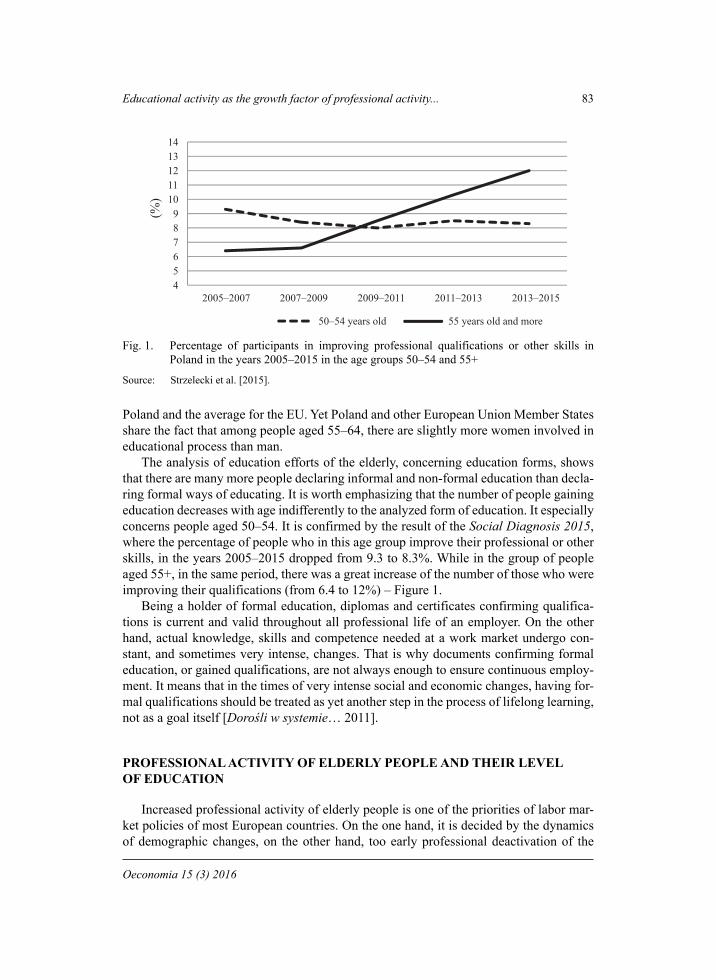
Educational activity as the growth factor of professional activity... 83
Oeconomia 15 (3) 2016
Poland and the average for the EU. Yet Poland and other European Union Member States share the fact that among people aged 55–64, there are slightly more women involved in educational process than man.
The analysis of education efforts of the elderly, concerning education forms, shows that there are many more people declaring informal and non-formal education than decla-ring formal ways of educating. It is worth emphasizing that the number of people gaining education decreases with age indifferently to the analyzed form of education. It especially concerns people aged 50–54. It is confirmed by the result of the Social Diagnosis 2015, where the percentage of people who in this age group improve their professional or other skills, in the years 2005–2015 dropped from 9.3 to 8.3%. While in the group of people aged 55+, in the same period, there was a great increase of the number of those who were improving their qualifications (from 6.4 to 12%) – Figure 1.
Being a holder of formal education, diplomas and certificates confirming qualifica-tions is current and valid throughout all professional life of an employer. On the other hand, actual knowledge, skills and competence needed at a work market undergo con-stant, and sometimes very intense, changes. That is why documents confirming formal education, or gained qualifications, are not always enough to ensure continuous employ-ment. It means that in the times of very intense social and economic changes, having for-mal qualifications should be treated as yet another step in the process of lifelong learning, not as a goal itself [Dorośli w systemie… 2011].
PROFESSIONAL ACTIVITY OF ELDERLY PEOPLE AND THEIR LEVEL OF EDUCATION
Increased professional activity of elderly people is one of the priorities of labor mar-ket policies of most European countries. On the one hand, it is decided by the dynamics of demographic changes, on the other hand, too early professional deactivation of the
456789
1011121314
2005–2007 2007–2009 2009–2011 2011–2013 2013–2015
(%)
50–54 years old 55 years old and more
Fig. 1. Percentage of participants in improving professional qualifications or other skills in Poland in the years 2005–2015 in the age groups 50–54 and 55+
Source: Strzelecki et al. [2015].
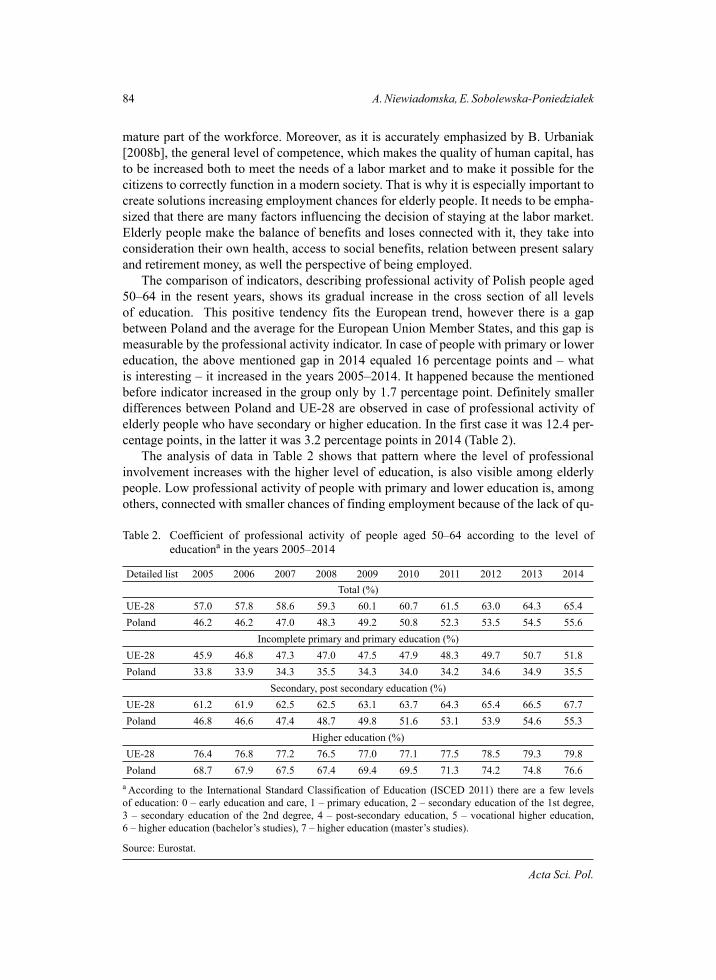
84 A. Niewiadomska, E. Sobolewska-Poniedziałek
Acta Sci. Pol.
mature part of the workforce. Moreover, as it is accurately emphasized by B. Urbaniak [2008b], the general level of competence, which makes the quality of human capital, has to be increased both to meet the needs of a labor market and to make it possible for the citizens to correctly function in a modern society. That is why it is especially important to create solutions increasing employment chances for elderly people. It needs to be empha-sized that there are many factors influencing the decision of staying at the labor market. Elderly people make the balance of benefits and loses connected with it, they take into consideration their own health, access to social benefits, relation between present salary and retirement money, as well the perspective of being employed.
The comparison of indicators, describing professional activity of Polish people aged 50–64 in the resent years, shows its gradual increase in the cross section of all levels of education. This positive tendency fits the European trend, however there is a gap between Poland and the average for the European Union Member States, and this gap is measurable by the professional activity indicator. In case of people with primary or lower education, the above mentioned gap in 2014 equaled 16 percentage points and – what is interesting – it increased in the years 2005–2014. It happened because the mentioned before indicator increased in the group only by 1.7 percentage point. Definitely smaller differences between Poland and UE-28 are observed in case of professional activity of elderly people who have secondary or higher education. In the first case it was 12.4 per-centage points, in the latter it was 3.2 percentage points in 2014 (Table 2).
The analysis of data in Table 2 shows that pattern where the level of professional involvement increases with the higher level of education, is also visible among elderly people. Low professional activity of people with primary and lower education is, among others, connected with smaller chances of finding employment because of the lack of qu-
Table 2. Coefficient of professional activity of people aged 50–64 according to the level of educationa in the years 2005–2014
Detailed list 2005 2006 2007 2008 2009 2010 2011 2012 2013 2014Total (%)
UE-28 57.0 57.8 58.6 59.3 60.1 60.7 61.5 63.0 64.3 65.4Poland 46.2 46.2 47.0 48.3 49.2 50.8 52.3 53.5 54.5 55.6
Incomplete primary and primary education (%)UE-28 45.9 46.8 47.3 47.0 47.5 47.9 48.3 49.7 50.7 51.8Poland 33.8 33.9 34.3 35.5 34.3 34.0 34.2 34.6 34.9 35.5
Secondary, post secondary education (%)UE-28 61.2 61.9 62.5 62.5 63.1 63.7 64.3 65.4 66.5 67.7Poland 46.8 46.6 47.4 48.7 49.8 51.6 53.1 53.9 54.6 55.3
Higher education (%)UE-28 76.4 76.8 77.2 76.5 77.0 77.1 77.5 78.5 79.3 79.8Poland 68.7 67.9 67.5 67.4 69.4 69.5 71.3 74.2 74.8 76.6
a According to the International Standard Classification of Education (ISCED 2011) there are a few levels of education: 0 – early education and care, 1 – primary education, 2 – secondary education of the 1st degree, 3 – secondary education of the 2nd degree, 4 – post-secondary education, 5 – vocational higher education, 6 – higher education (bachelor’s studies), 7 – higher education (master’s studies).
Source: Eurostat.
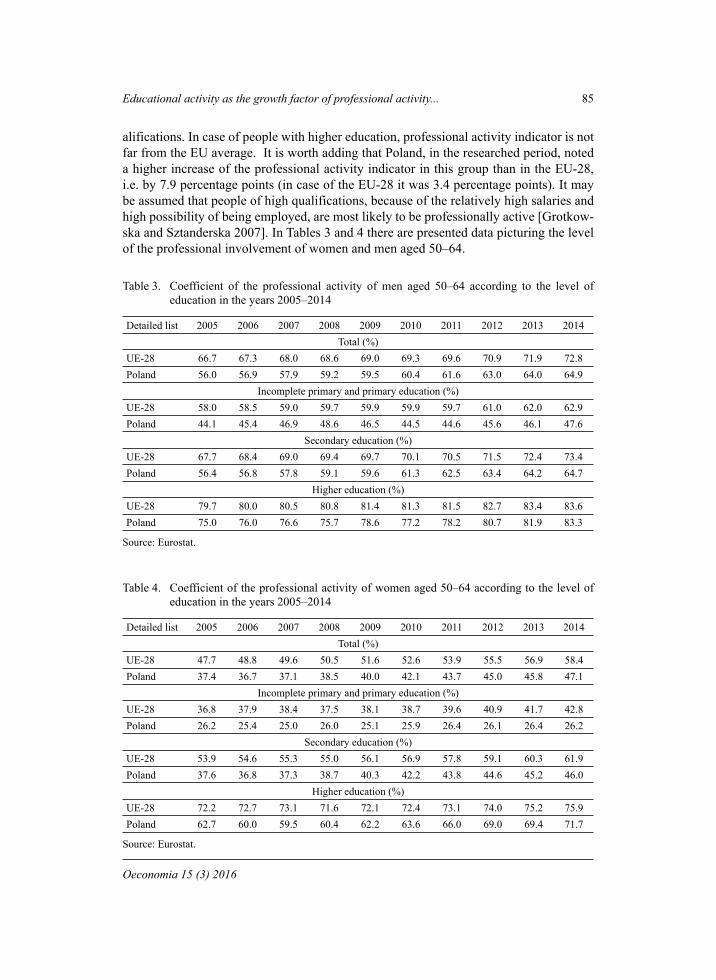
Educational activity as the growth factor of professional activity... 85
Oeconomia 15 (3) 2016
alifications. In case of people with higher education, professional activity indicator is not far from the EU average. It is worth adding that Poland, in the researched period, noted a higher increase of the professional activity indicator in this group than in the EU-28, i.e. by 7.9 percentage points (in case of the EU-28 it was 3.4 percentage points). It may be assumed that people of high qualifications, because of the relatively high salaries and high possibility of being employed, are most likely to be professionally active [Grotkow-ska and Sztanderska 2007]. In Tables 3 and 4 there are presented data picturing the level of the professional involvement of women and men aged 50–64.
Table 3. Coefficient of the professional activity of men aged 50–64 according to the level of education in the years 2005–2014
Detailed list 2005 2006 2007 2008 2009 2010 2011 2012 2013 2014Total (%)
UE-28 66.7 67.3 68.0 68.6 69.0 69.3 69.6 70.9 71.9 72.8Poland 56.0 56.9 57.9 59.2 59.5 60.4 61.6 63.0 64.0 64.9
Incomplete primary and primary education (%)UE-28 58.0 58.5 59.0 59.7 59.9 59.9 59.7 61.0 62.0 62.9Poland 44.1 45.4 46.9 48.6 46.5 44.5 44.6 45.6 46.1 47.6
Secondary education (%)UE-28 67.7 68.4 69.0 69.4 69.7 70.1 70.5 71.5 72.4 73.4Poland 56.4 56.8 57.8 59.1 59.6 61.3 62.5 63.4 64.2 64.7
Higher education (%)UE-28 79.7 80.0 80.5 80.8 81.4 81.3 81.5 82.7 83.4 83.6Poland 75.0 76.0 76.6 75.7 78.6 77.2 78.2 80.7 81.9 83.3
Source: Eurostat.
Table 4. Coefficient of the professional activity of women aged 50–64 according to the level of education in the years 2005–2014
Detailed list 2005 2006 2007 2008 2009 2010 2011 2012 2013 2014Total (%)
UE-28 47.7 48.8 49.6 50.5 51.6 52.6 53.9 55.5 56.9 58.4Poland 37.4 36.7 37.1 38.5 40.0 42.1 43.7 45.0 45.8 47.1
Incomplete primary and primary education (%)UE-28 36.8 37.9 38.4 37.5 38.1 38.7 39.6 40.9 41.7 42.8Poland 26.2 25.4 25.0 26.0 25.1 25.9 26.4 26.1 26.4 26.2
Secondary education (%)UE-28 53.9 54.6 55.3 55.0 56.1 56.9 57.8 59.1 60.3 61.9Poland 37.6 36.8 37.3 38.7 40.3 42.2 43.8 44.6 45.2 46.0
Higher education (%)UE-28 72.2 72.7 73.1 71.6 72.1 72.4 73.1 74.0 75.2 75.9Poland 62.7 60.0 59.5 60.4 62.2 63.6 66.0 69.0 69.4 71.7
Source: Eurostat.
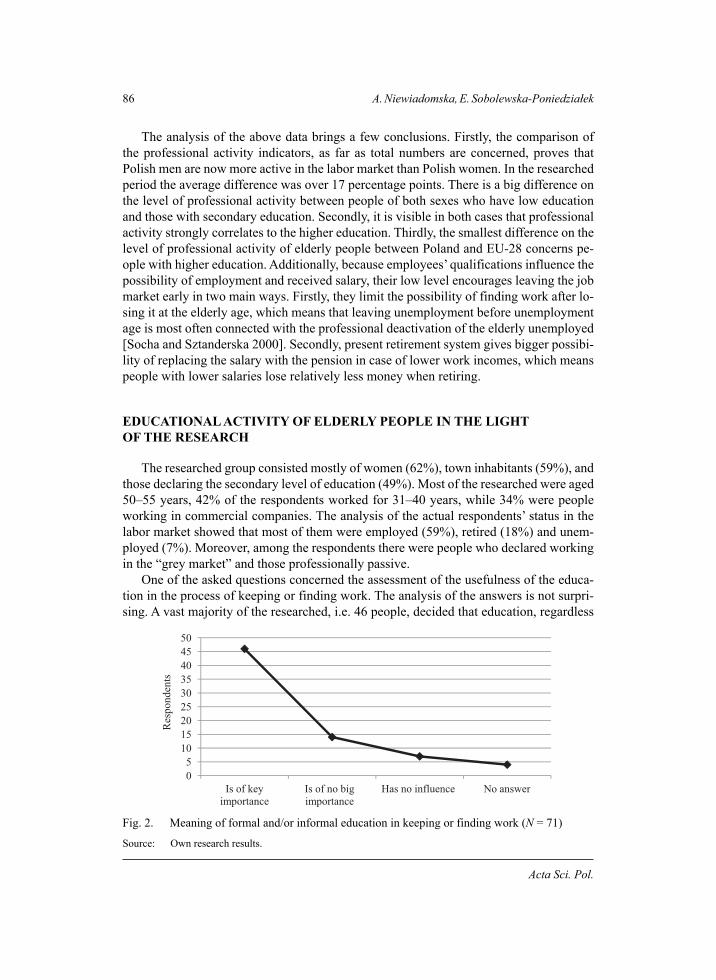
86 A. Niewiadomska, E. Sobolewska-Poniedziałek
Acta Sci. Pol.
The analysis of the above data brings a few conclusions. Firstly, the comparison of the professional activity indicators, as far as total numbers are concerned, proves that Polish men are now more active in the labor market than Polish women. In the researched period the average difference was over 17 percentage points. There is a big difference on the level of professional activity between people of both sexes who have low education and those with secondary education. Secondly, it is visible in both cases that professional activity strongly correlates to the higher education. Thirdly, the smallest difference on the level of professional activity of elderly people between Poland and EU-28 concerns pe-ople with higher education. Additionally, because employees’ qualifications influence the possibility of employment and received salary, their low level encourages leaving the job market early in two main ways. Firstly, they limit the possibility of finding work after lo-sing it at the elderly age, which means that leaving unemployment before unemployment age is most often connected with the professional deactivation of the elderly unemployed [Socha and Sztanderska 2000]. Secondly, present retirement system gives bigger possibi-lity of replacing the salary with the pension in case of lower work incomes, which means people with lower salaries lose relatively less money when retiring.
EDUCATIONAL ACTIVITY OF ELDERLY PEOPLE IN THE LIGHT OF THE RESEARCH
The researched group consisted mostly of women (62%), town inhabitants (59%), and those declaring the secondary level of education (49%). Most of the researched were aged 50–55 years, 42% of the respondents worked for 31–40 years, while 34% were people working in commercial companies. The analysis of the actual respondents’ status in the labor market showed that most of them were employed (59%), retired (18%) and unem-ployed (7%). Moreover, among the respondents there were people who declared working in the “grey market” and those professionally passive.
One of the asked questions concerned the assessment of the usefulness of the educa-tion in the process of keeping or finding work. The analysis of the answers is not surpri-sing. A vast majority of the researched, i.e. 46 people, decided that education, regardless
05
101520253035404550
Is of key importance
Is of no big importance
Has no influence No answer
Res
pond
ents
Fig. 2. Meaning of formal and/or informal education in keeping or finding work (N = 71)
Source: Own research results.
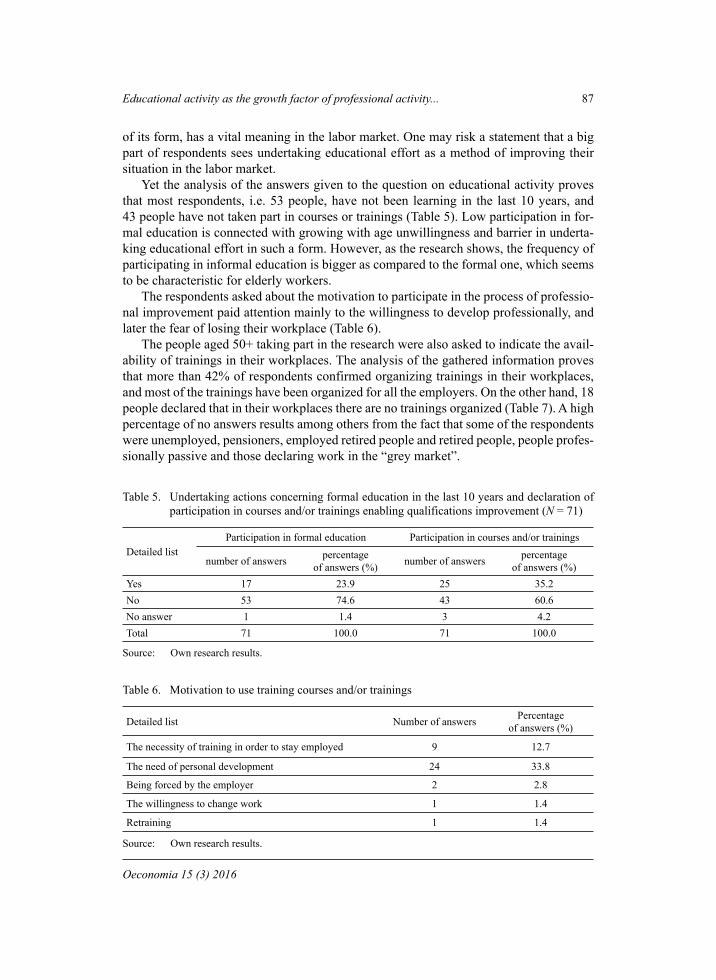
Educational activity as the growth factor of professional activity... 87
Oeconomia 15 (3) 2016
of its form, has a vital meaning in the labor market. One may risk a statement that a big part of respondents sees undertaking educational effort as a method of improving their situation in the labor market.
Yet the analysis of the answers given to the question on educational activity proves that most respondents, i.e. 53 people, have not been learning in the last 10 years, and 43 people have not taken part in courses or trainings (Table 5). Low participation in for-mal education is connected with growing with age unwillingness and barrier in underta-king educational effort in such a form. However, as the research shows, the frequency of participating in informal education is bigger as compared to the formal one, which seems to be characteristic for elderly workers.
The respondents asked about the motivation to participate in the process of professio-nal improvement paid attention mainly to the willingness to develop professionally, and later the fear of losing their workplace (Table 6).
The people aged 50+ taking part in the research were also asked to indicate the avail-ability of trainings in their workplaces. The analysis of the gathered information proves that more than 42% of respondents confirmed organizing trainings in their workplaces, and most of the trainings have been organized for all the employers. On the other hand, 18 people declared that in their workplaces there are no trainings organized (Table 7). A high percentage of no answers results among others from the fact that some of the respondents were unemployed, pensioners, employed retired people and retired people, people profes-sionally passive and those declaring work in the “grey market”.
Table 5. Undertaking actions concerning formal education in the last 10 years and declaration of participation in courses and/or trainings enabling qualifications improvement (N = 71)
Detailed listParticipation in formal education Participation in courses and/or trainings
number of answers percentage of answers (%) number of answers percentage
of answers (%)Yes 17 23.9 25 35.2No 53 74.6 43 60.6No answer 1 1.4 3 4.2Total 71 100.0 71 100.0
Source: Own research results.
Table 6. Motivation to use training courses and/or trainings
Detailed list Number of answers Percentage of answers (%)
The necessity of training in order to stay employed 9 12.7
The need of personal development 24 33.8
Being forced by the employer 2 2.8
The willingness to change work 1 1.4
Retraining 1 1.4
Source: Own research results.
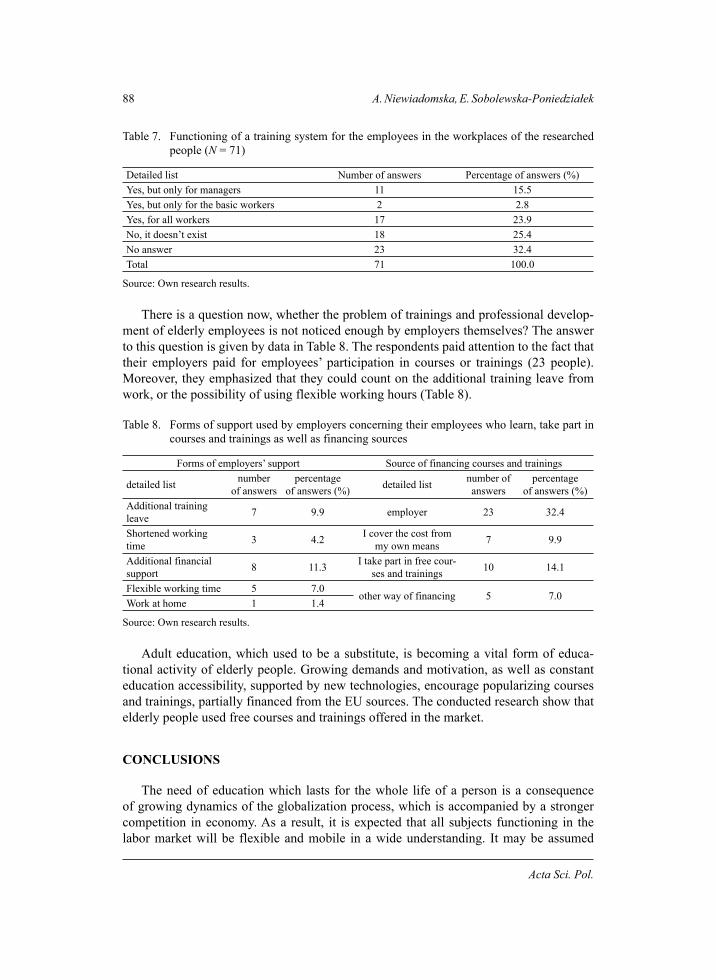
88 A. Niewiadomska, E. Sobolewska-Poniedziałek
Acta Sci. Pol.
Table 7. Functioning of a training system for the employees in the workplaces of the researched people (N = 71)
Detailed list Number of answers Percentage of answers (%)Yes, but only for managers 11 15.5Yes, but only for the basic workers 2 2.8Yes, for all workers 17 23.9No, it doesn’t exist 18 25.4No answer 23 32.4Total 71 100.0
Source: Own research results.
There is a question now, whether the problem of trainings and professional develop-ment of elderly employees is not noticed enough by employers themselves? The answer to this question is given by data in Table 8. The respondents paid attention to the fact that their employers paid for employees’ participation in courses or trainings (23 people). Moreover, they emphasized that they could count on the additional training leave from work, or the possibility of using flexible working hours (Table 8).
Table 8. Forms of support used by employers concerning their employees who learn, take part in courses and trainings as well as financing sources
Forms of employers’ support Source of financing courses and trainings
detailed list number of answers
percentage of answers (%) detailed list number of
answerspercentage
of answers (%)Additional training leave 7 9.9 employer 23 32.4
Shortened working time 3 4.2 I cover the cost from
my own means 7 9.9
Additional financial support 8 11.3 I take part in free cour-
ses and trainings 10 14.1
Flexible working time 5 7.0other way of financing 5 7.0
Work at home 1 1.4
Source: Own research results.
Adult education, which used to be a substitute, is becoming a vital form of educa-tional activity of elderly people. Growing demands and motivation, as well as constant education accessibility, supported by new technologies, encourage popularizing courses and trainings, partially financed from the EU sources. The conducted research show that elderly people used free courses and trainings offered in the market.
CONCLUSIONS
The need of education which lasts for the whole life of a person is a consequence of growing dynamics of the globalization process, which is accompanied by a stronger competition in economy. As a result, it is expected that all subjects functioning in the labor market will be flexible and mobile in a wide understanding. It may be assumed

Educational activity as the growth factor of professional activity... 89
Oeconomia 15 (3) 2016
that qualifications improvement is becoming a constant element of a professional life of a modern employee. Lifelong learning plays a vital role as it prevents qualifications depreciation. The problem in a special way touches elderly people who are of productive age, whose formal education process is already a thing of the past. In their case participa-tion in trainings and courses creates an opportunity to fill qualifications gaps. It is of great importance concerning both looking for work and keeping work. Comparative analysis of the level of educational involvement, measured by means of participation in education and professional training shows that elderly Polish people take part in the process of im-proving qualification in a smaller degree than the inhabitant of the EU. Available research results, among others Social Diagnosis 2015, show a certain regularity visible in a bigger determination in the area of education in case of people older than 55 (55+).
Such a situation may be a result of a more difficult situation of people aged 55+ in the labor market, as compared with younger people, which activates them. The data shown earlier indicate the existence of a strong correlation between professional activation in-dicators and the level of education. It is the highest in case of people who have higher education, both in Poland and in the EU-28. The conducted own research show that most of the researched people can see a vital role of educational activity in the context of a po-sition of a person in the labor market. As much as 65% of the respondents decided that both formal and informal education are of a great importance as far as keeping or finding work is concerned. At the same time, it is worth noticing that there are more people who undertake educational effort in a form of courses and trainings than people who choose formal education. It may be explained, among others, by much bigger effort in case of formal education as compared to non-formal and informal education. Furthermore, now-adays employers more and more often value employee’s competence and skills, which not always result from the formal education.
REFERENCES
Dorośli w systemie edukacji formalnej: polityka i praktyka w Europie (2011). Fundacja Rozwoju Systemu Edukacji, Warszawa.
Grotkowska, G., Sztanderska, U. (2007). Wykształcenie i szkolenia a podaż pracy. [In:] Edukacja dla pracy. Raport o Rozwoju Społecznym. Polska 2007, Warszawa, 130–131.
Kształcenie dorosłych 2011. (2013). GUS, Warszawa.Kształcenie ustawiczne i jego rola w życiu zawodowym człowieka. (2011). Wojewódzki Urząd
Pracy, Kielce, 31. Retrieved from http://www.wup.kielce.pl/images/stories/CIZ/Ksz-talcenie_ustawiczne_www.pdf (accessed: 25.02.16).
Sobolewska-Poniedziałek, E., Zarębska, J. (2015). Koncepcja lifelong learning z perspektywy ge-rontologicznej. Polska na tle Europy. General and Professional Education, 4, 75.
Socha, M.W., Sztanderska, U. (2000). Strukturalne podstawy bezrobocia w Polsce. PWN, Warsza-wa.
Solarczyk-Ambrozik, E. (2004). Kształcenie ustawiczne w perspektywie globalnej i lokalnej. Między wymogami rynku a indywidualnymi strategiami edukacyjnymi. Wydawnictwo Naukowe Uniwersytetu Adama Mickiewicza, Poznań.
Strzelecki, P., Saczuk, K., Grabowska, I., Kotowska, E.I. (2015). Rynek pracy. [In:] J. Czapiński, T. Panek (Eds), Diagnoza społeczna 2015. Warunki i jakość życia Polaków. Rada Moni-toringu Społecznego, Warszawa, 160.
90 A. Niewiadomska, E. Sobolewska-Poniedziałek
Acta Sci. Pol.
Szłapińska, J. (2012). Szkolenia i rozwój zawodowy „utalentowanych” pracowników. Studia Edu-kacyjne, 19, 224.
Terminology of European educational and training Policy (2014). European Centre for the Devel-opment of Vocational Training, Luxembourg.
Turek, K., Worek, B. (2015). Kształcenie po szkole. Raport z badań przeprowadzonych w ramach projektu Bilans Kapitału Ludzkiego. PARP, Warszawa.
Urbaniak, B. (2008a). Wyzwania wobec edukacji starszych pracowników w Polsce. [In:] J.T. Ko-waleski, P. Szukalski (Eds), Pomyślne starzenie się w perspektywie nauk o pracy i polity-ce społecznej. Zakład Demografii i Gerontologii Społecznej UŁ, Łódź, 68–83.
Urbaniak, B. (2008b). Rola edukacji ekonomicznej w globalizującej się Europie. [In:] B. Urbaniak (Ed.), Jak zachęcić pracowników po 45 roku życia do dalszej edukacji. Program Narodów Zjednoczonych ds. Rozwoju (UNDP), Warszawa, 9.
Ustawa z dnia 20 kwietnia 2004 r. o promocji zatrudnienia i instytucjach rynku pracy, Dz.U. 2015, poz. 149.
The White Paper on Education and Training. Teaching and Learning – Towards the Learning Socie-ty (1995). Commission of the European Communities, Brussels. COM(95) 590 final.
AKTYWNOŚĆ EDUKACYJNA JAKO CZYNNIK WZROSTU AKTYWNOŚCI ZAWODOWEJ OSÓB STARSZYCH
Streszczenie. W niniejszym artykule podjęto problematykę aktywności edukacyjnej osób starszych. Celem badawczym jest z jednej strony wskazanie korelacji między aktywnością zawodową starszych Polaków a ich poziomem wykształcenia, z drugiej zaś prezentacja wyników badań własnych ilustrujących stosunek oraz doświadczenia osób starszych w za-kresie kształcenia i szkolenia zawodowego. Analiza została przeprowadzona na podstawie wyników badań własnych oraz danych wtórnych obrazujących edukacyjną i zawodową ak-tywność starszych Polaków na tle rówieśników z innych krajów Unii Europejskiej. Analiza porównawcza poziomu zaangażowania edukacyjnego mierzonego wskaźnikiem uczestnic-twa w kształceniu i szkoleniu zawodowym wykazała, iż starsi Polacy w mniejszym stop-niu biorą udział w procesie podnoszenia kwalifikacji niż przeciętnie mieszkańcy UE. Przy czym można zauważyć prawidłowość przejawiającą się we wzroście poziomu ich zaanga-żowania zawodowego wraz z wyższym poziomem wykształcenia. Wyniki przeprowadzo-nych badań własnych wykazały, że większość badanych dostrzega istotną rolę aktywności edukacyjnej w kontekście pozycji jednostki na rynku pracy. Aż 65% respondentów uznało, iż kształcenie zarówno formalne, jak i nieformalne ma zasadnicze znaczenie dla utrzyma-nia zatrudnienia czy znalezienia pracy. Jednocześnie ponad 74,6% z nich nie kształciło się w ciągu ostatnich 10 lat.
Słowa kluczowe: aktywność edukacyjna, aktywność zawodowa, kształcenie ustawiczne, kursy i szkolenia zawodowe, osoby starsze
Accepted for print: 13.07.2016
For citation: Niewiadomska A., Sobolewska-Poniedziałek E. (2016). Educational activity as the growth factor of professional activity of elderly people. Acta Sci. Pol., Oeconomia, 15 (3), 79–90.
Oeconomia 15 (3) 2016, 91–100
ISSN 1644-0757eISSN 2450-4602
http://acta_oeconomia.sggw.pl
Corresponding author: Anna Olejniczuk-Merta, 05-082 Kwirynów, Zurawiowe Mokradła 37, Poland, e-mail: [email protected]
© Copyright by Warsaw University of Life Sciences Press, Warsaw 2016
INNOVATIONS AND CONSUMPTION VERSUS RAISING THE QUALITY OF LIFE OF SOCIETY
Anna Olejniczuk-MertaLeon Kozminski Academy
Abstract. The article analyses innovation and consumption as growth factors that are conducive to raising the quality of life of society. Factors taken into consideration include the source, factors and effects of innovation. They show consumption as the original source of innovation and a potential long-term driving force of economic development and social progress. I make an attempt to answer the following questions: whether the development of innovation and changes in consumption resulting from it are factors which lead to the raising of the quality of life in society or not, and if not – what conditions should be fulfilled. I also raise the question of further modifications of development – development which serves to increase the quality of society’s life. And in order to achieve this to increase the investments in human and social capital as well as make other significant changes of a cultural nature.
Key words: innovations, consumption, quality of life, solution revolution, cultural changes, inclusive economy
INTRODUCTION
Twenty-five years of development of a market economy in Poland has resulted in numerous and significant changes. These changes are, to begin with, the improvement and modernisation of market supply. These changes also include large modifications in market structure and the development, strengthening and implementation of marketing-oriented companies. Currently companies are focused on the development of innova-tion and aim to balance the economy and consumption. At the present stage of develop-ment consumption and innovation are the leading sources and factors determining further growth. The aim of this article is to show innovation and consumption as the leading fac-tors of economic development which in turn improve the quality of society’s life. These
92 A. Olejniczuk-Merta
Acta Sci. Pol.
considerations are the basis for searching for answers to the following questions: are these factors sufficient on their own to improve the quality of life in society or not, and if not – then what other conditions should be fulfilled.
INNOVATION AS A FACTOR OF SOCIO-ECONOMIC CHANGE
Innovations are not a new phenomenon either in the social or economic sphere. They have accompanied humans throughout history. But it was only one hundred years ago that Schumpeter saw in them a pro-developmental factor. And ever since, the develop-ment of innovations has been spreading at an ever faster rate.
Innovations have many definitions and descriptions. In economic literature, the no-tion of innovation never was and is not to this day a uniform concept. There are a great diversity of views on innovation as well as on the factors by which innovative changes are analysed and evaluated. At their base however there is always a reference to the na-ture of changes, their scope, the time-period of change introduction, and the effects of these changes. Innovative changes may have a sharp or continuous, process-like nature. Sharp changes are connected with the suddenness of their occurrence. They are of an unexpected nature. They may appear as crucial innovations. Continuous changes on the other hand are understood as being those which occur as part of a long process of evolu-tion of economic phenomena and as activities which are accompanied by systematic and long-term research.
Many-years of observations concerning the development of innovations as well as the contemporary experience in this area show that, as a rule, innovations are a result of the evolution of economic and social phenomena and processes. They manifest themselves in the changes of many processes and activities, which does not preclude as an exceptional event the occurrence of sharp-type, decisive innovations. The essence of all innovations, both continuous and sharp, is that they have to result in the better meeting of needs than offered by previous products and, at the same time, to serve the development of business, and economy while not damaging the natural and social environment.
In line with contemporary knowledge, innovations emerge based on human, social and intellectual capital1. In fact, this means that the source of innovation is the human be-ing, and occurs due to the reproductive and incentive effects of his consumption.
The reproductive effect means that the human being in order to live and act needs to meet his needs which are not only constantly renewed but are also developing. During consumption there takes place the destruction of the object of consumption, as a result of which the organism gains substance, energy and maintains the ability to work. Nowadays,
1 We understand human capital as an accumulated stock of knowledge, qualifications, skills, abili-ties, and readiness to create values and to increase the economic potential by owners thereof. Social capital is defined as the potential stocked in units and the society, in the form of institutions, norms, values, behaviour, which forms the basis for building social relations based on confidence, thus facilitating cooperation, creativity, on exchange of knowledge and contributing to reaching the goals which could not be achieved by individual persons alone. Intellectual capital expresses wealth of the enterprise being a result of expertise of its employees engaged in accrual of that enterprise’s goodwill.

Innovations and consumption versus raising the quality of life of society 93
Oeconomia 15 (3) 2016
meeting needs mostly goes substantially beyond basic needs and beyond the basic level of meeting them. It is connected with continuous education, personality development, and an investment in one’s physical and psychical condition, hence in the purchase and consumption of many intangible services. In this way, the human being develops his skills which can also be described as creative capacities which when accumulated in the mind and muscles, acquire the features of capital that is human capital.
The reproductive effect of consumption is reinforced by the incentive effect which expresses the human being’s desire to act towards upgrading his prestige, level of self-realisation and quality of life which can be expressed in a simple relation: the higher the expectations, the stronger the motivation and the greater the activity. Contemporary education in principle has to serve the aspiring individual’s activity, their enterprise and creativity in order to expect from adult, educated people effects in the form of innovative attitudes, activities and results (ideas, products). With the above in mind, axiomatic is the assertion that innovations are created by human, social and intellectual capital, in which one must first earlier invest. That investment is repaid by the absorption of that ‘bailed out’ capital in the implementation of innovative tasks and by overcoming the risk accom-panying the undertaking of challenges and new steps.
In the current world, we deal with numerous and various innovations. The following innovations are mentioned most often: technological, process, organisational, manage-rial, marketing, and, in the recent decade, also social [Olejniczuk-Merta 2013]. The specified types of innovations may be and are set up at various levels; in the micro, mezzo and macro scale; at a functional level of the human being and household, social groups, entire societies, nations, as well as at the level of the micro, medium-sized and large firm. They may take place in various functional areas of a society: in various socio-professional groups as well as in various sectors of the economy and in various business sectors. In a subject-organisational aspect, the participants of an innovative process may be: business (small and large), research units, the state, local self-govern-ments, administrative units, non-business and non-governmental organisations from the so-called business-related environment, social enterprises and more and more often society itself, including consumers. All, depending on the type and scope of innova-tions, have definite roles and tasks in the innovative processes. Thus, acting as a net-work, they exert influence on the created innovations, within their competences, by sharing invention, creativity and activity. And this means that the creation of innovation is already not assigned only or mainly to business but also reaches other organisations. Moreover, innovative processes demonstrate variety in many other aspects, including forms of participation, cooperation, the types of problem being resolved and, in result, in the effects of innovative processes [Eggers and Macmillan 2014]. What makes this real is the cooperation of entities with various forms of ownership: private, public, social, group, and individual. And the scope of participation by individual entities may be clearly diversified; it may relate to the entire innovative process but also it may be restricted to the use of a narrow scope of competences within a given organisation or unit. On the other hand, the types of problems being resolved are practically unlimited. This indicates the formation of numerous ties between the innovative processes’ par-ticipants, which results in the integration of many different entities around important innovative tasks.

94 A. Olejniczuk-Merta
Acta Sci. Pol.
An effect of such contemporary development of innovations is in principle the en-richment of the market, with many new and modern goods facilitating society’s life and improving its activity and functionality. It is also the development of firms which take part in the creation of innovations and the sale of innovative products and services, which translates into the country’s socio-economic development. This may be verified based on the changes which have occurred in the past quarter-century in the development of the countries which are most advanced in the development of innovations and rely for their economic growth on innovations. To a lesser degree, this phenomenon can also be noticed in Poland2.
As presented by PARP (the Polish Agency for Enterprise Development) the char-acteristics of the innovativeness of Polish enterprises show, in addition to their general ineffectiveness in this area, also a considerable differentiation in the 14 levels of that innovativeness within individual groups of large-chain and sector enterprises. Rela-tively higher are the indices of innovativeness at large enterprises and those from the ICT group, while they are low are in services as well as in small and medium-sized enterprises. In general, the gap between the innovation indices of Poland vis-á-vis other EU countries, despite the fact it is slightly improving, has not seen any significant change. In Poland, the overall index of innovation, measured in terms of a firms’ in-novative activity (introduction of new products, processes and new solutions), oscil-lates for large companies between 45–60% of those firms. Within the group of small enterprises, the share of those that implement innovations does not exceed 10%. And taking into account the share of their revenues from the sale of new or substantially improved products, then, irrespective of the size of firms, the index is low and does not reach 15%. Manufacturing companies reach this index value at the level of up to 12%, while services rendering ones – up to 7%. Overall, the general picture of the develop-ment of innovations within enterprises in Poland is not very optimistic. This indicates the rationality of undertaking significantly more activity in this area, particularly in the perspective of the year 2020 when it will be possible to participate in EU programmes within the Horizon 2020 scheme. At the same time, we may conclude on this basis that the chosen path for the development of innovations is right as it leads to the improve-ment and extension of the market offer, market success for firms and, as a result, also to the country’s economic growth. However, there are factors that are not conducive to that development or they even may reduce it. It would seem that also required is their identification and in-depth analysis which will then allow forth implementation of im-provements within this area.
Let’s look therefore at the second factor of development, which, at the same time, de-termines and sets up the grounds for the development of innovations and an improvement of society’s quality of life – consumption.
2 The assessment is based on the following bases: per capita GDP equal 3,000–9,000 USD as the condition for the country being qualified to the second (higher) advancement of its development and the share of innovations in shaping the development at the level of 30% and more. Poland meets only the first criterion. For this, it is at the transition stage between the stage 2 and 3, considered as the stage of development through innovations. [Global Competitiveness Report, World Economic Forum, p. 3].
Innovations and consumption versus raising the quality of life of society 95
Oeconomia 15 (3) 2016
CONSUMPTION AS A FACTOR IN IMPROVING SOCIETY’S QUALITY OF LIFE
The impact of consumption on the development and improvement of quality of life (though not directly) was mentioned in his works by the renowned Polish economist E. Lipiński in the 1960s. He described consumption as a driving force for the development of the human being and the whole of society and, thanks to this, also to enterprises and the economy. He wrote: “(…) in the process of consumption, the human being not only reproduces the life process but it expands, deepens, and changes it. In this meaning, consumption is not only the purpose of production but it is its assumption, condition, driving force. In the process of consumption, there grows human being’s intellectual and moral strength, increases his production capacity, develops imagination, increases mind power. Consumption becomes the most powerful manufacturing power as when at leisure, at the time free of production, there takes place the human being’s development [Lipiński 1969]. This development forms in the human being his creativity, openness, curiosity, propensity to examine his abilities and to create something new. And the American Noble Prize winner of 1992, G.S. Becker spoke in this way of consumers and their households: “(…) households are already not treated as passive consumers of goods and services purchased in the market sector, but as active producers of such non-market goods as, for instance, health or prestige. These goods are an effect of the combination of market commodities, time at the disposal of household’s members, and environmental variables such as education, abilities, and others” [Becker 1990].
The attainment of the large role of consumption in creating innovations, also inclu-sive of innovations which are part of the consumption, was achievable due to marketing. Thanks to marketing research and other tools including social communication, it has been possible since the second half of the 20th century for a fuller and clearer recognition of consumption, consumers’ needs, and the meeting of these needs at an ever higher level.
Such assessments and comments as to the place and the role of consumption in de-velopment confirm, at the same time, that it is within the human being, in his mind and through his activities that the great productive potential, also described as creative and innovative, lies. Hence, the validity of investment in this potential and the transformation this causes in innovative effects seems to be undisputable, and should be a conscious priority, at least as regards educational, cultural and medical services as well as those in the ICT area.
Let’s see, therefore, what consumers’ wealth in Poland looks like and their consump-tion habits. We look at wealth on the basis of individual incomes within households in differentiated quintile groups. In the fifth, the highest quintile group, the bottom line of per capita incomes in the household amounts to 1,867 PLN, while in the first, the lowest quintile group the value of the highest incomes amounts to 694 PLN in 2014 (according to GUS). The level of disposable per capita income in households reaches an average value of approx. 1,300 PLN. The spread between the highest and the lowest disposable incomes is 2.7-fold in 2014 (according to GUS). It is also worth mentioning that since 2000 disposable income has more than doubled and its real value has increased over that time by almost 49%. The main source of incomes is paid work. This illustrates the chang-es taking place in the consumers’ purchasing abilities and, at the same time, indicates
96 A. Olejniczuk-Merta
Acta Sci. Pol.
generally the positive nature of those changes. They are expressed both in consumers’ behaviours and in consumption3. Generally, consumers do not have trouble meeting their needs. More than 45% of families do not report financial troubles as a limiter of their pur-chases. About 11% of consumers speak of minor troubles. The value of household equip-ment including various durables in the period since 2000 has grown several times over (e.g. printer, computer, and video camera) and even more than ten times (dish washer) or even a few dozen times in the case of motorcycles, passenger cars, mobile phones, and new generation electric cookers). Better household equipment is a result of the better fi-nancial condition of households but also from the opportunity to use consumer credit and favourable prices, particularly in case of audio-visual and multimedia devices. However, we must remember that the degree of household saturation as regards durables is socially highly differentiated, and the degree of saturation does not tell us about the innovative-ness of the goods possessed or of the innovativeness of consumers’ attitudes. And the latter, as research shows, is characterised by a low indicator. Purchases of foodstuffs and the pattern of their consumption confirm the systematic improvement in the health aspect. As regards the purchase of many groups of products within the FMCG segment, Polish consumers are quite conservative and economical. They are convinced they are able to well assess product quality. They perceive themselves as rational consumers, who can simultaneously take care of their own aesthetic needs as well as that of the environment. Polish consumers are moderately open to innovations and they take into account low price, though it is not the dominating factor determining their choice. A purchase decision is most often made for a mixture of economic and technical reasons as well as overall preferences and reputation.
Poles’ hierarchy of values has been changing, but only slowly and not by much. The place of new technologies in the value hierarchy is still low. Poles mostly appreciate health, both their own and that of their relatives. Next there are family values, then life self-reliance, tolerance, and having other people’s respect. Even the most up to date de-vices and the possibility to contact other people through the use of new technologies are placed low in the value hierarchy. However, the low place of new technologies is not surprising when compared to such universal values such as health and the family. Never-theless, it is worth emphasising that the importance of up-to-date products and new ways of making contact with people is apparently growing among younger better educated and better off people.
In addition expert evaluations show that the Polish consumer is a consumer who is innovative and pro-innovative to a small extent as they lack sufficient knowledge about innovations and they are also often afraid of innovation. Moreover, Poles have been at-tributed with “anti-innovative roots”, stemming from the political past, including the situation in the country and a lifestyle which did not promote innovation. The lack of a pro-innovative attitudes amongst Poles is a result, in experts’ opinions, also from the traditional approach to the upbringing of children as well as the educational system in
3 The presented below information is a result of our own research carried out within the project of the National Science Centre, NCN: Konsumpcja w innowacyjnej gospodarce, 2012/05/B/HS4/04006. They are of the synthetic and, at the same time, selective nature.
Innovations and consumption versus raising the quality of life of society 97
Oeconomia 15 (3) 2016
Poland, connected with our historical past, which doesn’t facilitate the development of independence, creative thinking and general openness.
Being an innovative consumer relates more to the young generation, people currently learning/studying (secondary school youth and students). This consumer group is char-acterised by the greatest openness, mobilisation, and desire for change and experiencing new things; therefore, one may see among them innovative consumer behaviours and attitudes towards innovation. Greater innovative thinking and pro-innovative consumer activities may be generated through the development of educational background – that is changes in the educational system which are aimed at the promotion of creative and not merely imitative thinking as well as making the society more aware and knowledgeable about their needs and how to meet them as well as, opportunities for development and benefits from innovations.
The segmentation procedure applied in the research allowed for the singling out of five groups of consumers characterised by a different approaches to innovative products and services as well as by estimates as to the size of their segment in the overall popula-tion. They are as follows:
innovative – 15%. The segment of innovative are people who are not only oriented in market novelties but also buy them. This innovative segment is relatively small. The innovativeness of this group of consumers depends on their curiosity, particularly at a stage when they are striving to offset civilizational distances in their standard of living and consumption;oriented – 16%. This segment is made up of people who are in the flow, though only some of them actually buy novelties. It may result from the fact that innovative pro-ducts are expensive and to put it simply, despite their interest in novelties, they often cannot afford to buy them;aspiring – 18%. This group is set up by those who sometimes buy and one out of two of them are not interested in novelties, though they do sometimes buy them. Neverthe-less, only one fifth of this group exhibit an interest in innovative products even though they don’t buy them;indifferent – 27%. This is the segment of people indifferent to innovations, albeit 47% of them sometimes buy innovative products while not paying them any great at-tention. For these consumers, innovative products are those which are marketed with a label novelty and therefore their purchase may be motivated by a desire to satisfy idle curiosity;withdrawn – 24%. The segment of withdrawn are people who are completely cut off from novelties. They are not interested in innovative products/services; however, 39% of them sometimes buy such products.The above description may suggest that Poles’ consumption habits, are not limited,
however, they do not translate necessarily into an improvement of society’s wealth, and the making of anticipated progress in this respect. They don’t definitely help in raising society’s life quality. On the other hand, both the analysed innovations and consumption although insufficient in themselves to cause an improvement of the society’s life quality still remain indispensable.
•
•
•
•
•
98 A. Olejniczuk-Merta
Acta Sci. Pol.
AN ATTEMPT TO INDICATE THE CONDITIONS CONDUCIVE TO RAISING THE SOCIETY’S LIFE QUALITY
In the light of the above considerations, there appears the question of the legitimacy of continuing along the development path outlined which to a definite degree takes place at the expense of less affluent social groups. Why at their expense? Because the free mar-ket is an effective system and induces producers to economise and innovate. It rewards them for achieving the lowest price which requires the use of cheap manpower and raw materials. It can turn against society including many consumers, particularly its poorer parts, and it neither serves development nor health (environmental pollution, high un-employment or wages much lower than the minimum, decline of natural ecosystems and bio variety) [Bendyk 2015]. In contrast, the large, one can say even too large, scale of variety of the offer for affluent customers and the development of consumerism are the effects of the development among the affluent part of the society of excessive consump-tion, not justified by needs, and simply harmful. Consumerism contributes to wastage of manufactured goods, human work, and natural resources [Gilder 2015]. Very significant have become the words assessing this situation, uttered by J.K. Galbraith: they expected the growth of material wealth would solve all social problems, while it has become our main problem.
R. Branson speaking of three issues: unequal growth distribution of social incomes and, more precisely the, growing differentiation of incomes, especially in the aspect of the division of income between remuneration of labour and capital; groundless, too low or imperfect investment in the knowledge-based economy in human, social and intellectual capital; and full identification of the sources of income and property inequalities and their impact on imbalances also on a macroeconomic scale, wrote: “It is time to turn capital-ism upside down. It is time to screw business as usual” [Branson 2015]. The saying can be applied – only to a lesser extent – to the situation in Poland. The issue here is with the diffusion of new solutions, often coined as revolutionary, which deal with the issues of: greater socialisation of the economy, reduction of unemployment and the development of social economics [Kołodko 2013, Kowalik 2013].
On the other hand, G. Gilder sees the future development of society, including im-provements in its life quality, through the harnessing of human’s and society’s activity. He writes: “Interventionism and social work activities have appeared to be ineffective, generating more and more divisions. It is the human being and his creativity that is the source of wealth of nations and unrestricted enterprise provides the economic power and hope for the poor” [Gilder 2015].
In order to improve our, Polish conditions, both for an efficient development of in-novations and changes in consumption, which serve to raise society’s life quality, it is worthwhile to pay attention to the contents of the report Cultural reform 2020–2030––2040. Success demands changes [2015]. The authors present in it the concepts and meas-ures that may stimulate innovativeness at (Polish) enterprises, approaching the problem also innovatively, from the side of culture and habits. They indicate, like W.D. Eggers and P. Macmillan [2014] in their book The Solution Revolution, the areas of activities and also partly the tools that may be useful in enhancing the innovativeness of consumers, enterprises, and the state.
Innovations and consumption versus raising the quality of life of society 99
Oeconomia 15 (3) 2016
They are: the deliberative state intruding, i.a., with the following solutions: universal participa-tive budgets, “local planning cells”, technological panels at the national level, and the state’s deliberation – in order to socialise and introduce elements of reforms indepen-dent of parties;the inclusive state which is conducive to creativity and entrepreneurship, increasing the propensity to take reasonable risk by reinforcement of positive ties based on con-fidence, respect of principles, sense of co-responsibility, security, and community;changes in education, including holistic reforms of schools;individual communities enabling empowerment of the state, economy, education, and relations between the state and its citizens/consumers in various ways. An in-depth analysis of these solutions, as well as other new and interesting proposals
considered, i.a., by authors such as T. Piketty [2015a, b], V.W. Hwang and G. Horowitt [2012], as well as this year’s Nobel Prize winner for economics – A. Deaton [2014] will be discussed in a separate publication devoted to them.
REFERENCES
Becker, G.S. (1990). Ekonomiczne podejście do zachowań ludzkich. PWN, Warszawa.Bendyk, E. (2015). Białe plamy na mapie, czyli o ukrytych potencjałach innowacyjności. [In:]
P. Zadura-Lichota (Ed.), Innowacyjna przedsiębiorczość w Polsce. Odkryty i ukryty potencjał polskiej innowacyjności. Wyd. PARP, Warszawa, 91–107.
Branson, R. (2015). Biznes do góry nogami wywrócony. Studio Emka, Warszawa, 12.Deaton, A. (2014). Przez ciemność w stronę jaśniejszej przyszłości. [In:] Gospodarka za 100 lat.
Najważniejsi ekonomiści przewidują przyszłość. Kurhaus, Warszawa.Eggers, W.D., Macmillan, P. (2014). Rewolucja rozwiązań. Współpraca pomiędzy biznesem,
rządami oraz przedsiębiorstwami społecznymi na rzecz rozwiązywania największych problemów współczesnego świata. Deloitte, Poltext, Warszawa.
Gilder, G. (2015). Bogactwo i ubóstwo. Zysk i S-ka, Warszawa.Hwang, V.W., Horowitt, G. (2012). The rainforest: The sekret to building the next Silicon Valley,
Calif. Regenwad, Los Altos Hills. Kołodko, G. (2013). Dokąd zmierza świat. Ekonomia polityczna przyszłości. Pruszyński i S-ka,
Warszawa.Kowalik, T. (2013). O lepszy ład społeczno-ekonomiczny. PTE, PAN – Instytut Ekonomiczny,
Warszawa. Lipiński, E. (1969). Karol Marks i zagadnienia współczesności. PWN, Warszawa. Olejniczuk-Merta, A. (2013). Innowacje społeczne. Konsumpcja i Rozwój, 1 (4), 21–33.Reforma kulturowa 2020–2030–2040. Sukces wymaga zmian [Cultural reform 2020–2030–2040.
Success demends changes] (2015). PTE, Warszawa.
INNOWACJE I KONSUMPCJA A PODNOSZENIE JAKOŚCI ŻYCIA SPOŁECZEŃSTWA
•
•
••

100 A. Olejniczuk-Merta
Acta Sci. Pol.
Streszczenie. Artykuł jest poświęcony analizie innowacji i konsumpcji jako czynników rozwoju, sprzyjających poprawie jakości życia społeczeństwa. Rozważania w nim zawarte uwzględniają źródła, czynniki i efekty rozwoju innowacji. Pokazują konsumpcję jako pra-źródło innowacji i potencjalną siłę sprawczą długotrwałego rozwoju gospodarki i postępu społecznego. Podjęta zostaje próba odpowiedzi na pytania: czy rozwój innowacji i zmiany konsumpcji zeń wynikające są czynnikiem zapewniającym podnoszenie jakości życia spo-łeczeństwa, czy też nie, a jeżeli nie – to jakie warunki powinny być spełnione. W ramach tego jest podniesiona kwestia modyfikacji dalszej drogi rozwoju, służącego podnoszeniu jakości życia społeczeństwa i zwiększenia w tym celu inwestowania w kapitał ludzki i spo-łeczny oraz dokonanie innych istotnych zmian o charakterze kulturowym.
Słowa kluczowe: innowacje, konsumpcja, czynniki rozwoju, jakość życia, rewolucja roz-wiązań, zmiany kulturowe, inkluzywna gospodarka
Accepted for print: 03.08.2016
For citation: Olejniczuk-Merta A. (2016). Innovations and consumption versus raising the quality of life or society. Acta Sci. Pol., Oeconomia, 15 (3), 91–100.
Oeconomia 15 (3) 2016, 101–113
ISSN 1644-0757eISSN 2450-4602
http://acta_oeconomia.sggw.pl
Corresponding author: Tomasz Siudek, Warsaw University of Life Sciences – SGGW, Faculty of Economic Sciences, Department of Economics and Organization of Enterprises, Nowoursynowska 166, 02-787 Warsaw, Poland, e-mail: [email protected]
© Copyright by Warsaw University of Life Sciences Press, Warsaw 2016
ASSESSMENT OF THE SUSTAINABILITY OF RURAL DEVELOPMENT IN THE EUROPEAN UNION MEMBER STATES
Tomasz Siudek, Edward CzarneckiWarsaw University of Life Sciences – SGGW
Mariana VashchykNational University of Life and Environmental Sciences of Ukraine
Abstract. The aim of the study was to determine the level of sustainability of rural de-velopment in the European Union Member States. The study included three dimensions of rural development, namely economic, environmental and social. Each dimension was determined using synthetic index elaborated on the basis of the primary variables, with the use of factor analysis. The study was conducted in all EU countries in the years 2000–2012. The obtained data shows that the highest degree of sustainability of rural development has occurred in Hungary, Bulgaria and Cyprus, and the lowest in Latvia, Romania and the United Kingdom.
Key words: sustainable development, rural areas, European Union countries
INTRODUCTION
Rural areas in the EU-28 make up 91% of its territory and 56% of the total population. These areas generate more than 15% of the total gross value added and employ 13% of the total working population. Their primary task is to provide food products for rural and urban society, as well as raw materials for industry. Rural development is a vitally impor-tant EU policy area, therefore, its strengthening is one of the EU top priorities.
In terms of indirect effects, any significant cut back in European farming activity would in turn generate losses in GDP and jobs in linked economic sectors – notably within the agri-food supply chain, which relies on the EU primary agricultural sector for
102 T. Siudek, E. Czarnecki, M. Vashchyk
Acta Sci. Pol.
high quality, competitive and reliable raw material inputs, as well as in non-food sectors. Rural activities, from tourism, transport, to local and public services would also be af-fected. Depopulation in rural areas would probably accelerate [Matthews 2012]. Being an integral part of the European economy and society, rural areas and their sustainability are particularly vulnerable, furthermore modern society faces specific challenges, even in relatively prosperous EU, taking into account the fact that rural areas play a huge role for the society, serving a number of socio-economic, environmental, cultural and spatial functions, being significant on local, regional, national and global levels.
The paradigm of sustainability was accepted as a guiding principle few decades ago by governments, businesses, NGOs and civil society. Recently sustainable development became a serious challenge, goal, global “trend” and of course, a continuous process aimed at reloading all the systems of our modern life. Sustainable rural development is vital to the economic, social and environmental viability of nations. It is especially essential for poverty eradication since global poverty is overwhelmingly rural. The other key challenges for both sustainable rural development and agriculture is to increase food production in a sustainable manner, ensuring and enhancing food security and improving livelihoods in rural areas [United Nations 2009a, Shalaby et al. 2011].
We got used to address these challenge calls for changes mainly in developed coun-tries, first due to their financial and technical capacity to implement more sustainable policies and measures, yet the necessary level of political governance and especially an interest of average citizens is still insufficient. On the other hand, there is the lack of action in developing countries sometimes compounded by economic recession [Pearce et al. 1990, Rogers et al. 1997, Shalaby et al. 2011]. While there are common goals that are crucial to sustainable development, there is no single approach guaranteeing sustainable success in every country.
The European Union by its policy declares rural sustainability as a vitally important area, and its strengthening is one of its top priorities (European LEADER Association for Rural Development). Besides, there are many different support programs for agriculture and rural development, financed by the EU, but no final assessment of their efficiency in the long run has been completed. To what extent investing financial resources is resulted in improving sustainability of rural areas and life quality?
On the other hand, the theoretical aspect of the rural sustainability remains mutually contradictory, although a great deal of scientific papers is available in this topic during the last few decades, the authors still argue on the terms of “sustainability” and “su-stainable development”, making those definitions even more complicated, especially in non-native English literature sources1 [Majewski 2008, Cherevko and Cherevko 2010, Stanny 2011].
However, there are many (over 100) definitions, indicators and indices of sustainable development, but still it is not completely clear where the optimal solution(s) are and how to keep the sustainability the point of sustainability is and how to accomplish and balance it (Table 1). What are the factors we should consider in order to estimate the overall level
1 In Ukrainian literature a term “sustainable development” can be translated and applied by some authors as “sustainable growth” and “balanced development” with no or slight difference in mean-ing; in Polish – “zrównoważony rozwój” and “trwały rozwój”.
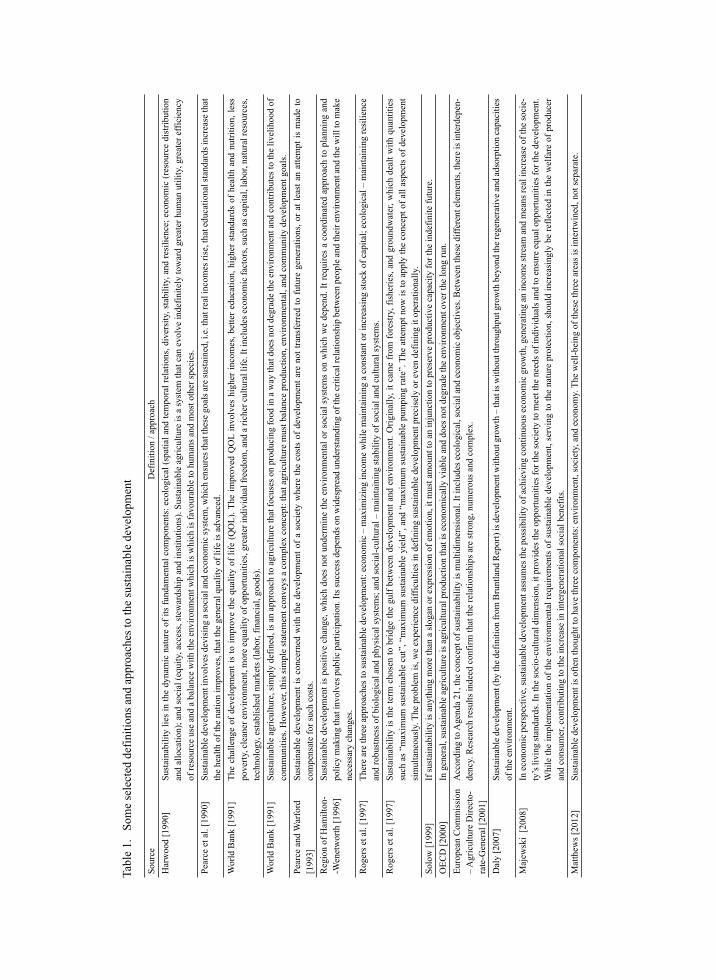
Tabl
e 1.
So
me
sele
cted
def
initi
ons a
nd a
ppro
ache
s to
the
sust
aina
ble
deve
lopm
ent
Sour
ceD
efin
ition
/ ap
proa
chH
arw
ood
[199
0]Su
stai
nabi
lity
lies
in th
e dy
nam
ic n
atur
e of
its
fund
amen
tal c
ompo
nent
s: e
colo
gica
l (sp
atia
l and
tem
pora
l rel
atio
ns, d
iver
sity
, sta
bilit
y, a
nd re
silie
nce;
eco
nom
ic (r
esou
rce
dist
ribut
ion
and
allo
catio
n); a
nd so
cial
(equ
ity, a
cces
s, st
ewar
dshi
p an
d in
stitu
tions
). Su
stai
nabl
e ag
ricul
ture
is a
syst
em th
at c
an e
volv
e in
defin
itely
tow
ard
grea
ter h
uman
util
ity, g
reat
er e
ffici
ency
of
reso
urce
use
and
a b
alan
ce w
ith th
e en
viro
nmen
t whi
ch is
whi
ch is
favo
urab
le to
hum
ans a
nd m
ost o
ther
spec
ies.
Pear
ce e
t al.
[199
0]
Sust
aina
ble
deve
lopm
ent i
nvol
ves d
evis
ing
a so
cial
and
eco
nom
ic sy
stem
, whi
ch e
nsur
es th
at th
ese
goal
s are
sust
aine
d, i.
e. th
at re
al in
com
es ri
se, t
hat e
duca
tiona
l sta
ndar
ds in
crea
se th
at
the
heal
th o
f the
nat
ion
impr
oves
, tha
t the
gen
eral
qua
lity
of li
fe is
adv
ance
d.
Wor
ld B
ank
[199
1]Th
e ch
alle
nge
of d
evel
opm
ent i
s to
impr
ove
the
qual
ity o
f life
(QO
L). T
he im
prov
ed Q
OL
invo
lves
hig
her i
ncom
es, b
ette
r edu
catio
n, h
ighe
r sta
ndar
ds o
f hea
lth a
nd n
utrit
ion,
less
po
verty
, cle
aner
env
ironm
ent,
mor
e eq
ualit
y of
opp
ortu
nitie
s, gr
eate
r ind
ivid
ual f
reed
om, a
nd a
rich
er c
ultu
ral l
ife. I
t inc
lude
s eco
nom
ic fa
ctor
s, su
ch a
s cap
ital,
labo
r, na
tura
l res
ourc
es,
tech
nolo
gy, e
stab
lishe
d m
arke
ts (l
abor
, fin
anci
al, g
oods
). W
orld
Ban
k [1
991]
Sust
aina
ble
agric
ultu
re, s
impl
y de
fined
, is a
n ap
proa
ch to
agr
icul
ture
that
focu
ses o
n pr
oduc
ing
food
in a
way
that
doe
s not
deg
rade
the
envi
ronm
ent a
nd c
ontri
bute
s to
the
livel
ihoo
d of
co
mm
uniti
es. H
owev
er, t
his s
impl
e st
atem
ent c
onve
ys a
com
plex
con
cept
: tha
t agr
icul
ture
mus
t bal
ance
pro
duct
ion,
env
ironm
enta
l, an
d co
mm
unity
dev
elop
men
t goa
ls.
Pear
ce a
nd W
arfo
rd
[199
3]Su
stai
nabl
e de
velo
pmen
t is
conc
erne
d w
ith th
e de
velo
pmen
t of a
soc
iety
whe
re th
e co
sts
of d
evel
opm
ent a
re n
ot tr
ansf
erre
d to
futu
re g
ener
atio
ns, o
r at l
east
an
atte
mpt
is m
ade
to
com
pens
ate
for s
uch
cost
s. R
egio
n of
Ham
ilton
--W
enet
wor
th [1
996]
Sust
aina
ble
deve
lopm
ent i
s po
sitiv
e ch
ange
, whi
ch d
oes
not u
nder
min
e th
e en
viro
nmen
tal o
r soc
ial s
yste
ms
on w
hich
we
depe
nd. I
t req
uire
s a
coor
dina
ted
appr
oach
to p
lann
ing
and
polic
y m
akin
g th
at in
volv
es p
ublic
par
ticip
atio
n. It
s suc
cess
dep
ends
on
wid
espr
ead
unde
rsta
ndin
g of
the
criti
cal r
elat
ions
hip
betw
een
peop
le a
nd th
eir e
nviro
nmen
t and
the
will
to m
ake
nece
ssar
y ch
ange
s.R
oger
s et a
l. [1
997]
Ther
e ar
e th
ree
appr
oach
es to
sust
aina
ble
deve
lopm
ent:
econ
omic
– m
axim
izin
g in
com
e w
hile
mai
ntai
ning
a c
onst
ant o
r inc
reas
ing
stoc
k of
cap
ital;
ecol
ogic
al –
mai
ntai
ning
resi
lienc
e an
d ro
bust
ness
of b
iolo
gica
l and
phy
sica
l sys
tem
s; a
nd so
cial
-cul
tura
l – m
aint
aini
ng st
abili
ty o
f soc
ial a
nd c
ultu
ral s
yste
ms.
Rog
ers e
t al.
[199
7]Su
stai
nabi
lity
is th
e te
rm c
hose
n to
brid
ge th
e gu
lf be
twee
n de
velo
pmen
t and
env
ironm
ent.
Orig
inal
ly, i
t cam
e fr
om fo
rest
ry, f
ishe
ries,
and
grou
ndw
ater
, whi
ch d
ealt
with
qua
ntiti
es
such
as
“max
imum
sus
tain
able
cut
”, “
max
imum
sus
tain
able
yie
ld”,
and
“m
axim
um s
usta
inab
le p
umpi
ng ra
te”.
The
atte
mpt
now
is to
app
ly th
e co
ncep
t of a
ll as
pect
s of
dev
elop
men
t si
mul
tane
ousl
y. T
he p
robl
em is
, we
expe
rienc
e di
fficu
lties
in d
efin
ing
sust
aina
ble
deve
lopm
ent p
reci
sely
or e
ven
defin
ing
it op
erat
iona
lly.
Solo
w [1
999]
If su
stai
nabi
lity
is a
nyth
ing
mor
e th
an a
slog
an o
r exp
ress
ion
of e
mot
ion,
it m
ust a
mou
nt to
an
inju
nctio
n to
pre
serv
e pr
oduc
tive
capa
city
for t
he in
defin
ite fu
ture
. O
ECD
[200
0]In
gen
eral
, sus
tain
able
agr
icul
ture
is a
gric
ultu
ral p
rodu
ctio
n th
at is
eco
nom
ical
ly v
iabl
e an
d do
es n
ot d
egra
de th
e en
viro
nmen
t ove
r the
long
run.
Eu
rope
an C
omm
issi
on
– A
gric
ultu
re D
irect
o-ra
te-G
ener
al [2
001]
Acc
ordi
ng to
Age
nda
21, t
he c
once
pt o
f sus
tain
abili
ty is
mul
tidim
ensi
onal
. It i
nclu
des e
colo
gica
l, so
cial
and
eco
nom
ic o
bjec
tives
. Bet
wee
n th
ese
diffe
rent
ele
men
ts, t
here
is in
terd
epen
-de
ncy.
Res
earc
h re
sults
inde
ed c
onfir
m th
at th
e re
latio
nshi
ps a
re st
rong
, num
erou
s and
com
plex
.
Dal
y [2
007]
Sust
aina
ble d
evel
opm
ent (
by th
e def
initi
on fr
om B
runt
land
Rep
ort)
is d
evel
opm
ent w
ithou
t gro
wth
– th
at is
with
out t
hrou
ghpu
t gro
wth
bey
ond
the r
egen
erat
ive a
nd ad
sorp
tion
capa
citie
s of
the
envi
ronm
ent.
Maj
ewsk
i [2
008]
In e
cono
mic
per
spec
tive,
sust
aina
ble
deve
lopm
ent a
ssum
es th
e po
ssib
ility
of a
chie
ving
con
tinuo
us e
cono
mic
gro
wth
, gen
erat
ing
an in
com
e st
ream
and
mea
ns re
al in
crea
se o
f the
soci
e-ty
’s li
ving
stan
dard
s. In
the
soci
o-cu
ltura
l dim
ensi
on, i
t pro
vide
s the
opp
ortu
nitie
s for
the
soci
ety
to m
eet t
he n
eeds
of i
ndiv
idua
ls a
nd to
ens
ure
equa
l opp
ortu
nitie
s for
the
deve
lopm
ent.
Whi
le th
e im
plem
enta
tion
of th
e en
viro
nmen
tal r
equi
rem
ents
of s
usta
inab
le d
evel
opm
ent,
serv
ing
to th
e na
ture
pro
tect
ion,
sho
uld
incr
easi
ngly
be
refle
cted
in th
e w
elfa
re o
f pro
duce
r an
d co
nsum
er, c
ontri
butin
g to
the
incr
ease
in in
terg
ener
atio
nal s
ocia
l ben
efits
.M
atth
ews [
2012
]Su
stai
nabl
e de
velo
pmen
t is o
ften
thou
ght t
o ha
ve th
ree
com
pone
nts:
env
ironm
ent,
soci
ety,
and
eco
nom
y. T
he w
ell-b
eing
of t
hese
thre
e ar
eas i
s int
ertw
ined
, not
sepa
rate
.
104 T. Siudek, E. Czarnecki, M. Vashchyk
Acta Sci. Pol.
of development, its sustainability? Is there any integral indicator that must be applied in this case?
All the definitions of the sustainable development require that we see the world as a system – a system that connects space: and a system that connects time [International Institute for Sustainable Development 2015].
During the United Nations Conference on the Human Environment, held at Stock-holm in June 1972 the World Commission on Environment and Development (WCED) was created. Reaffirming the Declaration of the United Nations and seeking to build upon it, Rio Declaration on Environment and Development was adopted in 1992 [United Na-tions Environment Programme 1992].
Although the concept of sustainable development has been defined many times, the most often cited is the following: “Sustainable development is development that meets the needs of the present without compromising the ability of future generations to meet their own needs. It contains within it two key concepts: the concept of needs, in particular the essential needs of the world’s poor, to which overriding priority should be given; and the idea of limitations imposed by the state of technology and social organization on the environment’s ability to meet present and future needs” [United Nations 2009b].
In macroeconomic analysis, the simplest measure of the “sustainability” can be de-rived, taking into consideration the fact that in economic processes the natural resources are being changed into the capital goods. At the same time, it is not possible that the re-sources available to today’s generation are not depleted. Therefore, if the sum of capital growth generated in a given period is less than zero, it means a lack of sustainability. The weak sustainability calls for minimum requirements, where the sum of capital growth is greater than zero. Strong sustainability requires protection of “crucial” (non-substitutab-le) capital components [Majewski 2008].
THE RESEARCH PURPOSE, SCOPE AND METHODS
The purpose of the study is to determine the sustainability level of rural development in the EU countries. The research included three pillars of sustainable rural development – its economic, environmental and social dimension of three-dimension space. We assu-me that sustainability degree of each dimension can be calculated as a distance between its particular points from the straight line – equilibrium (sustainability). The set of variab-les has been selected by the authors based on previous research [Siudek and Vashchyk 2014, Vashchyk and Siudek 2014, 2015]. While studying the economic development four primary variables have been considered, namely GDP per capita, cereal yield, livestock production index and agriculture value added per worker. The assessment of ecological development was based on six primary variables: the share of forest area in total land area, emissions of sulphur oxides (SOx) in agriculture, emissions of nitrogen oxides (NOx) in agriculture, electric power consumption per capita, the share of alternative and nuclear energy in total energy use and the share of area under organic farming in total agricultural land area. In turn, to assess social development five primary variables were applied, such as employment in agriculture, unemployment rate, at-risk-of-poverty rate, total social
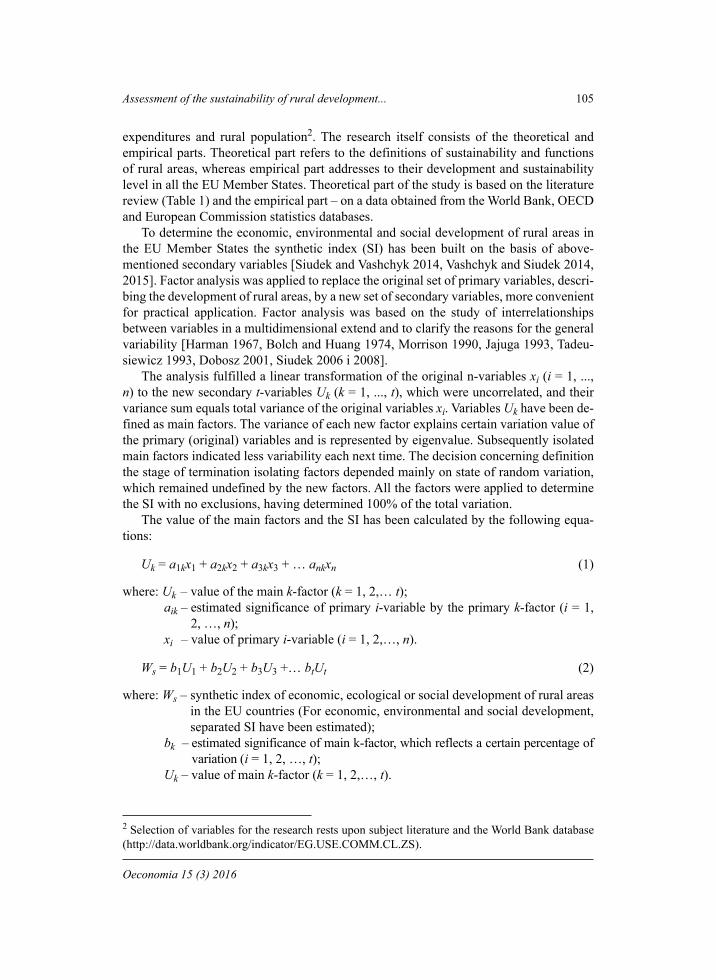
Assessment of the sustainability of rural development... 105
Oeconomia 15 (3) 2016
expenditures and rural population2. The research itself consists of the theoretical and empirical parts. Theoretical part refers to the definitions of sustainability and functions of rural areas, whereas empirical part addresses to their development and sustainability level in all the EU Member States. Theoretical part of the study is based on the literature review (Table 1) and the empirical part – on a data obtained from the World Bank, OECD and European Commission statistics databases.
To determine the economic, environmental and social development of rural areas in the EU Member States the synthetic index (SI) has been built on the basis of above-mentioned secondary variables [Siudek and Vashchyk 2014, Vashchyk and Siudek 2014, 2015]. Factor analysis was applied to replace the original set of primary variables, descri-bing the development of rural areas, by a new set of secondary variables, more convenient for practical application. Factor analysis was based on the study of interrelationships between variables in a multidimensional extend and to clarify the reasons for the general variability [Harman 1967, Bolch and Huang 1974, Morrison 1990, Jajuga 1993, Tadeu-siewicz 1993, Dobosz 2001, Siudek 2006 i 2008].
The analysis fulfilled a linear transformation of the original n-variables xi (i = 1, ..., n) to the new secondary t-variables Uk (k = 1, ..., t), which were uncorrelated, and their variance sum equals total variance of the original variables xi. Variables Uk have been de-fined as main factors. The variance of each new factor explains certain variation value of the primary (original) variables and is represented by eigenvalue. Subsequently isolated main factors indicated less variability each next time. The decision concerning definition the stage of termination isolating factors depended mainly on state of random variation, which remained undefined by the new factors. All the factors were applied to determine the SI with no exclusions, having determined 100% of the total variation.
The value of the main factors and the SI has been calculated by the following equa-tions:
Uk = a1kx1 + a2kx2 + a3kx3 + … ankxn (1)
where: Uk – value of the main k-factor (k = 1, 2,… t);aik – estimated significance of primary i-variable by the primary k-factor (i = 1,
2, …, n);xi – value of primary i-variable (i = 1, 2,…, n).
Ws = b1U1 + b2U2 + b3U3 +… btUt (2)
where: Ws – synthetic index of economic, ecological or social development of rural areas in the EU countries (For economic, environmental and social development, separated SI have been estimated);
bk – estimated significance of main k-factor, which reflects a certain percentage of variation (i = 1, 2, …, t);
Uk – value of main k-factor (k = 1, 2,…, t).
2 Selection of variables for the research rests upon subject literature and the World Bank database (http://data.worldbank.org/indicator/EG.USE.COMM.CL.ZS).

106 T. Siudek, E. Czarnecki, M. Vashchyk
Acta Sci. Pol.
Sustainability (balance) of rural development was determined by a simple equili-brium l: Ax = By = Cz, where A = B = C = 1, wherein x, y, z ∈ R (x – economic dimension of rural development; y – environmental dimension of rural development; z – social di-mension of rural development).
Rural development in the EU Member States was delineated by the points Pi (xi, yi, zi) located in three-dimensional space (xi – the economic dimension of the EU i-country; yi – the environmental dimension of the EU i-country; zi – the social dimension of the EU i-country).
The degree of sustainability of rural areas in the EU Member States has been calcula-ted as a distance between points Pi from the straight line – equilibrium l. The shorter was the distance, the more balanced (sustainable) was the development of rural areas in the particular EU country and vice versa. Research covered the period of 2000–2012. All the results are presented in the respective tables and in previous research phases [Siudek and Vashchyk 2014, Vashchyk and Siudek 2014, 2015].
DISCUSSION AND RESULTS
Rural development in the EU Member States can be considered in three dimensions – economic, environmental and social. In economic contest, the EU’s most develo-ped countries in 2000–2012 were: Luxembourg, the Netherlands, Slovenia, France and Malta, and the least developed – Lithuania, Romania, Slovakia, Poland and the Czech Republic (Table 2). From the ecological point of view, Latvia, Finland, Austria, Swe-den and Estonia have been carrying the palm, whereas the UK, Spain, France, Poland and Malta have been those with the worst parameters. On the whole, the highest level of social development in terms of applied indicators had been held by Luxembourg, Denmark, Belgium, Sweden and the Netherlands, and lowest – in Romania, Croatia, Poland, Lithuania and Greece. In 2000–2012 the highest sustainability level among the EU Member States was observed in Hungary, Bulgaria, Cyprus, Italy and Greece, whereas Latvia, the UK, Romania, Luxembourg and the Netherlands demonstrated the worst situation.
Among all the EU countries, the largest differences were observed between ecologi-cal and social development (16 countries, namely: Belgium, Croatia, Cyprus, Estonia, France, the Netherlands, Lithuania, Luxembourg, Latvia, Malta, Germany, Portugal, Ro-mania, Slovakia, Slovenia and the United Kingdom), economic and social development (6 countries: Bulgaria, Czech Republic, Denmark, Greece, Poland and Hungary) and economic and environmental development (6 countries, that is Austria, Finland, Spain, Ireland, Sweden and Italy).
Having calculated the average rural development by the three dimensions and having estimated the deviation from an average, we may determine which dimensions has the gre-atest impact on rural instability in the EU Member States. The obtained data indicated that there was an imbalance of rural development in the EU by all the dimensions (Table 3).
Table 3. The dimensions and non-sustainability of rural development in the EU Member States,

Tabl
e 2.
T
he d
egre
e of
rura
l are
as su
stai
nabi
lity
in th
e Eu
rope
an U
nion
Mem
ber S
tate
s in
2000
–201
2
Cou
ntry
Dim
ensi
ons o
f dev
elop
men
tD
imen
sion
s of d
evel
opm
ent
Dim
ensi
ons o
f dev
elop
men
tD
imen
sion
s of d
evel
opm
ent
Dim
ensi
ons o
f dev
elop
men
tEc
on.
Ecol
.So
cial
.R
DD
FEEc
on.
Ecol
.So
cial
.R
DD
FEEc
on.
Ecol
.So
cial
.R
DD
FEEc
on.
Ecol
.So
cial
.R
DD
FEEc
on.
Ecol
.So
cial
.R
DD
FE20
0020
0020
0020
0020
0120
0120
0120
0120
0220
0220
0220
0220
0320
0320
0320
0320
0420
0420
0420
04A
ustri
a–0
.026
61.
5776
0.65
401.
1387
0.06
231.
6030
0.68
951.
0957
0.07
841.
6121
0.68
191.
0927
–0.0
099
1.67
500.
6151
1.20
460.
0818
1.75
040,
7183
1,19
09B
elgi
um
0.39
50–0
.731
31.
8562
1.83
470.
3029
–0.7
007
1.95
001.
8926
0.43
21–0
.637
51.
9160
1.81
350.
3778
–0.6
509
1.73
081.
6893
0.50
48–0
.642
31,
8686
1,77
77B
ulga
ria1.
0272
–0.8
993
–1.4
330
1.83
020.
7340
–0.8
832
–1.5
643
1.66
95–0
.382
7–0
.787
2–1
.399
00.
7236
–0.8
759
–0.8
078
–1.0
899
0.20
82–0
.657
6–0
.755
9–1
,052
10,
2904
Cro
atia
–1.3
323
0.01
57–2
.084
91.
5051
–1.0
488
–0.0
572
–2.1
583
1.48
65–1
.039
3–0
.068
5–2
.084
91.
4261
–0.9
643
–0.0
143
–2.2
317
1.57
33–0
.660
9–0
.015
0–2
,158
31,
5549
Cyp
rus
4.46
10–0
.688
7–0
.054
73.
9713
–0.2
521
–0.6
868
–0.0
132
0.48
30–0
.111
9–0
.681
70.
0530
0.54
52–0
.140
6–0
.682
00.
0762
0.55
23–0
.158
5–0
.670
80,
0459
0,52
21C
zech
Rep
ublic
–0.5
622
0.01
460.
3369
0.64
42–0
.447
00.
0693
0.40
130.
6045
–0.5
329
0.09
100.
4921
0.73
05–0
.597
80.
0772
0.44
730.
7494
–0.4
239
0.11
210,
4993
0,65
56D
enm
ark
–0.0
421
0.03
672.
0024
1.63
810.
0516
0.13
211.
9354
1.50
630.
1444
0.21
172.
1043
1.57
350.
2871
0.24
622.
0295
1.43
970.
4337
0.30
872.
1482
1.45
36Es
toni
a–1
.217
51.
1826
–1.0
950
1.91
16–1
.043
41.
1937
–1.0
368
1.82
39–0
.579
01.
2334
–0.8
578
1.60
58–0
.622
51.
1895
–0.8
162
1.56
46–0
.654
51.
2097
–0.9
129
1.63
78Fi
nlan
d–0
.116
22.
0087
0.92
951.
5026
–0.0
208
1.93
811.
0073
1.38
570.
0896
2.05
161.
1256
1.38
810.
2193
1.94
461.
2124
1.22
460.
3122
2.02
681.
2635
1.21
48Fr
ance
0.30
48–1
.552
60.
5773
1.63
920.
3121
–1.4
450
0.93
261.
7441
0.46
54–1
.381
21.
0774
1.81
010.
4070
–1.3
467
1.12
081.
7957
0.55
17–1
.341
91.
0816
1.80
18G
erm
any
–0.2
593
–1.6
022
1.07
431.
8926
–0.2
322
–1.4
904
1.03
361.
7847
–0.1
985
–1.3
813
1.01
191.
6923
–0.0
962
–1.2
960
1.06
181.
6673
0.11
11–1
.205
81.
0503
1.60
27G
reec
e–0
.652
1–1
.005
9–1
.958
90.
9559
–0.6
066
–1.0
209
–1.8
169
0.86
99–0
.558
1–0
.888
0–1
.767
10.
8838
–0.4
224
–0.5
692
–1.6
752
0.96
86–0
.311
9–0
.557
8–1
.506
30.
8919
Hun
gary
–0.1
606
–0.7
436
–0.3
055
0.42
93–0
.218
0–0
.676
0–0
.162
20.
3987
–0.1
465
–0.6
480
–0.0
472
0.45
55–0
.238
7–0
.612
2–0
.150
40.
3467
–0.2
708
–0.4
941
–0.0
733
0.29
77Ir
elan
d0.
0085
–0.9
708
–0.7
729
0.73
23–0
.016
7–0
.950
5–0
.679
10.
6793
–0.0
594
–0.9
286
–0.5
286
0.61
530.
1239
–0.9
133
–0.4
412
0.73
440.
2004
–0.8
910
–0.3
492
0.77
17Ita
ly–0
.012
2–1
.170
7–0
.340
70.
8444
0.00
43–1
.016
5–0
.315
90.
7383
0.08
22–0
.971
3–0
.258
20.
7603
0.06
24–0
.946
8–0
.206
10.
7392
0.20
53–0
.916
8–0
.034
70.
8356
Latv
ia–1
.078
21.
6774
–1.6
409
2.51
14–1
.089
61.
7366
–1.5
551
2.51
92–1
.188
71.
7465
–1.5
760
2.56
93–1
.011
01.
7628
–1.3
422
2.41
14–0
.837
81.
8194
–1.2
224
2.34
24Li
thua
nia
–1.2
427
0.19
21–2
.134
41.
6600
–1.4
299
0.18
07–2
.015
11.
6081
–1.3
512
0.16
75–1
.900
21.
5147
–1.1
145
0.16
41–1
.877
81.
4591
–0.7
929
0.19
64–1
.616
41.
2836
Luxe
mbo
urg
1.13
42–0
.366
22.
0778
1.74
310.
4347
–0.2
856
2.19
471.
8045
0.72
15–0
.235
62.
2561
1.77
760.
8248
–0.2
300
2.26
061.
7680
1.17
12–0
.217
12.
2906
1.77
66M
alta
0.23
64–1
.093
21.
0102
1.50
450.
7475
–1.1
164
1.04
381.
6561
0.84
06–1
.117
01.
1477
1.73
740.
8762
–1.1
273
0.96
961.
6753
0.46
03–1
.102
21.
0135
1.55
17N
ethe
rland
s0.
3085
–0.9
373
1.40
291.
6559
0.14
63–0
.910
11.
4874
1.69
930.
1273
–0.8
615
1.58
211.
7383
0.19
38–0
.860
61.
5269
1.69
200.
4066
–0.8
117
1.50
791.
6409
Pola
nd–0
.960
6–1
.533
9–2
.265
70.
9251
–0.9
774
–1.4
619
–2.3
776
1.00
56–0
.828
2–1
.382
1–2
.455
31.
1699
–0.7
400
–1.3
668
–2.3
526
1.14
97–0
.799
3–1
.320
8–2
.326
51.
0978
Portu
gal
–0.5
129
0.24
92–1
.623
21.
3316
–0.5
630
0.32
32–1
.476
21.
2724
–0.4
780
0.32
47–1
.465
61.
2682
–0.5
795
0.44
82–1
.454
71.
3470
–0.4
428
0.63
33–1
.437
41.
4646
Rom
ania
–1.0
737
–0.4
484
–3.9
718
2.65
86–1
.079
7–0
.558
7–3
.883
52.
5290
–0.8
371
–0.5
527
–3.6
325
2.40
70–0
.542
7–0
.622
7–3
.466
92.
3556
–0.6
684
–0.4
757
–3.3
021
2.23
32Sl
ovak
ia–0
.568
0–0
.115
7–1
.636
01.
1040
–0.7
298
–0.1
302
–1.5
939
1.04
06–0
.408
1–0
.128
7–1
.523
81.
0439
–0.3
621
–0.1
135
–1.4
187
0.98
01–0
.510
8–0
.061
1–1
.401
30.
9646
Slov
enia
–0.2
689
0.86
79–0
.943
31.
2945
0.27
740.
8607
–0.8
629
1.23
980.
3471
0.83
36–0
.763
81.
1579
0.54
250.
8628
–0.6
457
1.12
400.
5444
0.87
08–0
.749
61.
2120
Spai
n–0
.361
5–2
.256
4–0
.559
11.
4732
–0.2
696
–2.2
669
–0.4
078
1.57
74–0
.093
2–2
.298
3–0
.348
41.
7058
0.05
07–2
.101
4–0
.278
01.
6395
0.02
84–2
.182
2–0
.316
91.
6818
Swed
en0.
0632
1.57
241.
9959
1.43
670.
0179
1.50
632.
0142
1.46
730.
0927
1.52
231.
9419
1.37
110.
1887
1.61
941.
9815
1.34
070.
3698
1.57
481.
9411
1.16
26U
nite
d K
ingd
om0.
0079
–2.3
575
0.84
402.
3483
–0.1
782
–2.2
178
1.05
382.
3367
–0.0
105
–2.0
423
1.04
172.
2171
0.03
67–2
.044
90.
9771
2.18
710.
1120
–1.9
360
1.09
352.
1860
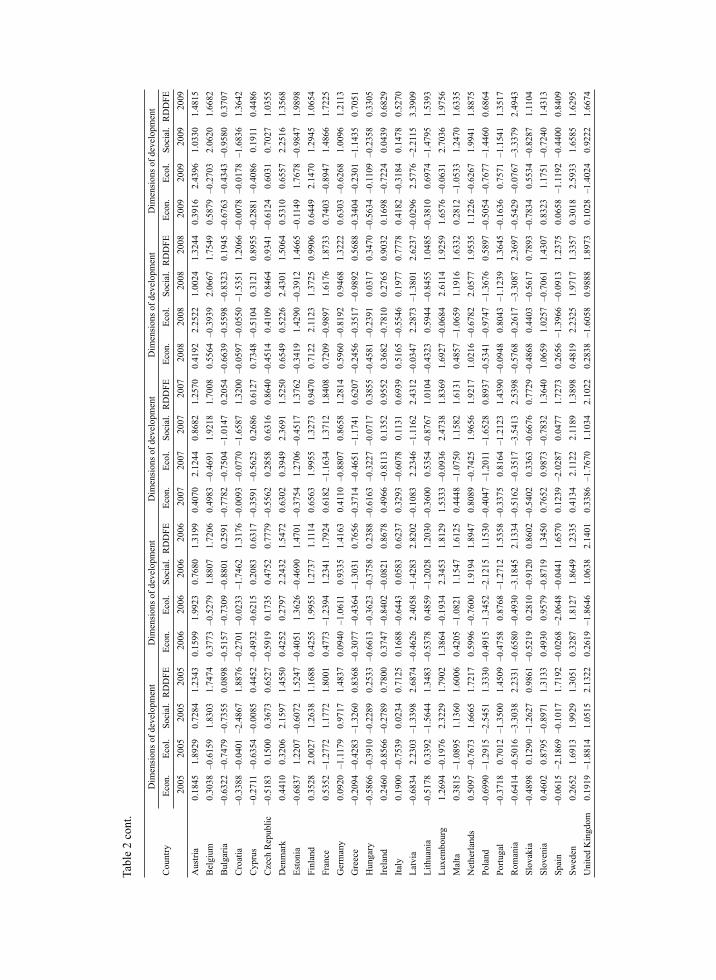
Tabl
e 2
cont
.
Cou
ntry
Dim
ensi
ons o
f dev
elop
men
tD
imen
sion
s of d
evel
opm
ent
Dim
ensi
ons o
f dev
elop
men
tD
imen
sion
s of d
evel
opm
ent
Dim
ensi
ons o
f dev
elop
men
tEc
on.
Ecol
.So
cial
.R
DD
FEEc
on.
Ecol
.So
cial
.R
DD
FEEc
on.
Ecol
.So
cial
.R
DD
FEEc
on.
Ecol
.So
cial
.R
DD
FEEc
on.
Ecol
.So
cial
.R
DD
FE20
0520
0520
0520
0520
0620
0620
0620
0620
0720
0720
0720
0720
0820
0820
0820
0820
0920
0920
0920
09A
ustri
a0.
1845
1.89
290.
7284
1.23
430.
1599
1.99
230.
7680
1.31
990.
4070
2.12
440.
8682
1.25
700.
4192
2.25
221.
0024
1.32
440.
3916
2.43
961.
0330
1.48
15B
elgi
um
0.30
38–0
.615
91.
8303
1.74
740.
3773
–0.5
279
1.88
071.
7206
0.49
83–0
.469
11.
9218
1.70
080.
5564
–0.3
939
2.06
671.
7549
0.58
79–0
.270
32.
0620
1.66
82B
ulga
ria–0
.632
2–0
.747
9–0
.735
50.
0898
–0.5
157
–0.7
309
–0.8
801
0.25
91–0
.778
2–0
.750
4–1
.014
70.
2054
–0.6
639
–0.5
598
–0.8
323
0.19
45–0
.676
3–0
.434
3–0
.958
00.
3707
Cro
atia
–0.3
388
–0.0
401
–2.4
867
1.88
76–0
.270
1–0
.023
3–1
.746
21.
3176
–0.0
093
–0.0
770
–1.6
587
1.32
00–0
.059
7–0
.055
0–1
.535
11.
2066
–0.0
078
–0.0
178
–1.6
836
1.36
42C
ypru
s–0
.271
1–0
.635
4–0
.008
50.
4452
–0.4
932
–0.6
215
0.20
830.
6317
–0.3
591
–0.5
625
0.26
860.
6127
0.73
48–0
.510
40.
3121
0.89
55–0
.288
1–0
.408
60.
1911
0.44
86C
zech
Rep
ublic
–0.5
183
0.15
000.
3673
0.65
27–0
.591
90.
1735
0.47
520.
7779
–0.5
562
0.28
580.
6316
0.86
40–0
.451
40.
4109
0.84
640.
9341
–0.6
124
0.60
310.
7027
1.03
55D
enm
ark
0.44
100.
3206
2.15
971.
4550
0.42
520.
2797
2.24
321.
5472
0.63
020.
3949
2.36
911.
5250
0.65
490.
5226
2.43
011.
5064
0.53
100.
6557
2.25
161.
3568
Esto
nia
–0.6
837
1.22
07–0
.607
21.
5247
–0.4
051
1.36
26–0
.469
01.
4701
–0.3
754
1.27
06–0
.451
71.
3762
–0.3
419
1.42
90–0
.391
21.
4665
–0.1
149
1.76
78–0
.984
71.
9898
Finl
and
0.35
282.
0027
1.26
381.
1688
0.42
551.
9955
1.27
371.
1114
0.65
631.
9955
1.32
730.
9470
0.71
222.
1123
1.37
250.
9906
0.64
492.
1470
1.29
451.
0654
Fran
ce0.
5352
–1.2
772
1.17
721.
8001
0.47
73–1
.239
41.
2341
1.79
240.
6182
–1.1
634
1.37
121.
8408
0.72
09–0
.989
71.
6176
1.87
330.
7403
–0.8
947
1.48
661.
7225
Ger
man
y0.
0920
–1.1
179
0.97
171.
4837
0.09
40–1
.061
10.
9335
1.41
630.
4110
–0.8
807
0.86
581.
2814
0.59
60–0
.819
20.
9468
1.32
220.
6303
–0.6
268
1.00
961.
2113
Gre
ece
–0.2
094
–0.4
283
–1.3
260
0.83
68–0
.307
7–0
.436
4–1
.303
10.
7656
–0.3
714
–0.4
651
–1.1
741
0.62
07–0
.245
6–0
.351
7–0
.989
20.
5688
–0.3
404
–0.2
301
–1.1
435
0.70
51H
unga
ry–0
.586
6–0
.391
0–0
.228
90.
2533
–0.6
613
–0.3
623
–0.3
758
0.23
88–0
.616
3–0
.322
7–0
.071
70.
3855
–0.4
581
–0.2
391
0.03
170.
3470
–0.5
634
–0.1
109
–0.2
358
0.33
05Ir
elan
d0.
2460
–0.8
566
–0.2
789
0.78
000.
3747
–0.8
402
–0.0
821
0.86
780.
4966
–0.8
113
0.13
520.
9552
0.36
82–0
.781
00.
2765
0.90
320.
1698
–0.7
224
0.04
390.
6829
Italy
0.19
00–0
.753
90.
0234
0.71
250.
1688
–0.6
443
0.05
830.
6237
0.32
93–0
.607
80.
1131
0.69
390.
5165
–0.5
546
0.19
770.
7778
0.41
82–0
.318
40.
1478
0.52
70La
tvia
–0.6
834
2.23
03–1
.339
82.
6874
–0.4
626
2.40
58–1
.428
32.
8202
–0.1
083
2.23
46–1
.116
22.
4312
–0.0
347
2.28
73–1
.380
12.
6237
–0.0
296
2.57
76–2
.211
53.
3909
Lith
uani
a–0
.517
80.
3392
–1.5
644
1.34
83–0
.537
80.
4859
–1.2
028
1.20
30–0
.360
00.
5354
–0.8
767
1.01
04–0
.432
30.
5944
–0.8
455
1.04
85–0
.381
00.
6974
–1.4
795
1.53
93Lu
xem
bour
g1.
2694
–0.1
976
2.32
291.
7902
1.38
64–0
.193
42.
3453
1.81
291.
5333
–0.0
936
2.47
381.
8369
1.69
27–0
.068
42.
6114
1.92
591.
6576
–0.0
631
2.70
361.
9756
Mal
ta0.
3815
–1.0
895
1.13
601.
6006
0.42
05–1
.082
11.
1547
1.61
250.
4448
–1.0
750
1.15
821.
6131
0.48
57–1
.065
91.
1916
1.63
320.
2812
–1.0
533
1.24
701.
6335
Net
herla
nds
0.50
97–0
.767
31.
6665
1.72
170.
5996
–0.7
600
1.91
941.
8947
0.80
89–0
.742
51.
9656
1.92
171.
0216
–0.6
782
2.05
771.
9535
1.12
26–0
.626
71.
9941
1.88
75Po
land
–0.6
990
–1.2
915
–2.5
451
1.33
30–0
.491
5–1
.345
2–2
.121
51.
1530
–0.4
047
–1.2
011
–1.6
528
0.89
37–0
.534
1–0
.974
7–1
.367
60.
5897
–0.5
054
–0.7
677
–1.4
460
0.68
64Po
rtuga
l–0
.371
80.
7012
–1.3
500
1.45
09–0
.475
80.
8768
–1.2
712
1.53
58–0
.337
50.
8164
–1.2
123
1.43
90–0
.094
80.
8043
–1.1
239
1.36
45–0
.163
60.
7571
–1.1
541
1.35
17R
oman
ia–0
.641
4–0
.501
6–3
.303
82.
2331
–0.6
580
–0.4
930
–3.1
845
2.13
34–0
.516
2–0
.351
7–3
.541
32.
5398
–0.5
768
–0.2
617
–3.3
087
2.36
97–0
.542
9–0
.076
7–3
.337
92.
4943
Slov
akia
–0.4
898
0.12
90–1
.262
70.
9861
–0.5
219
0.28
10–0
.912
00.
8602
–0.5
402
0.33
63–0
.667
60.
7729
–0.4
868
0.44
03–0
.561
70.
7893
–0.7
834
0.55
34–0
.828
71.
1104
Slov
enia
0.46
020.
8795
–0.8
971
1.31
330.
4930
0.95
79–0
.871
91.
3450
0.76
520.
9873
–0.7
832
1.36
401.
0659
1.02
57–0
.706
11.
4307
0.83
231.
1751
–0.7
240
1.43
13Sp
ain
–0.0
615
–2.1
869
–0.1
017
1.71
92–0
.026
8–2
.064
8–0
.044
11.
6570
0.12
39–2
.028
70.
0477
1.72
730.
2656
–1.3
966
–0.0
913
1.23
750.
0658
–1.1
192
–0.4
400
0.84
09Sw
eden
0.26
521.
6913
1.99
291.
3051
0.32
871.
8127
1.86
491.
2335
0.41
342.
1122
2.11
891.
3898
0.48
192.
2325
1.97
171.
3357
0.30
182.
5933
1.65
851.
6295
Uni
ted
Kin
gdom
0.19
19–1
.881
41.
0515
2.13
220.
2619
–1.8
646
1.06
382.
1401
0.33
86–1
.767
01.
1034
2.10
220.
2838
–1.6
058
0.98
881.
8973
0.10
28–1
.402
40.
9222
1.66
74
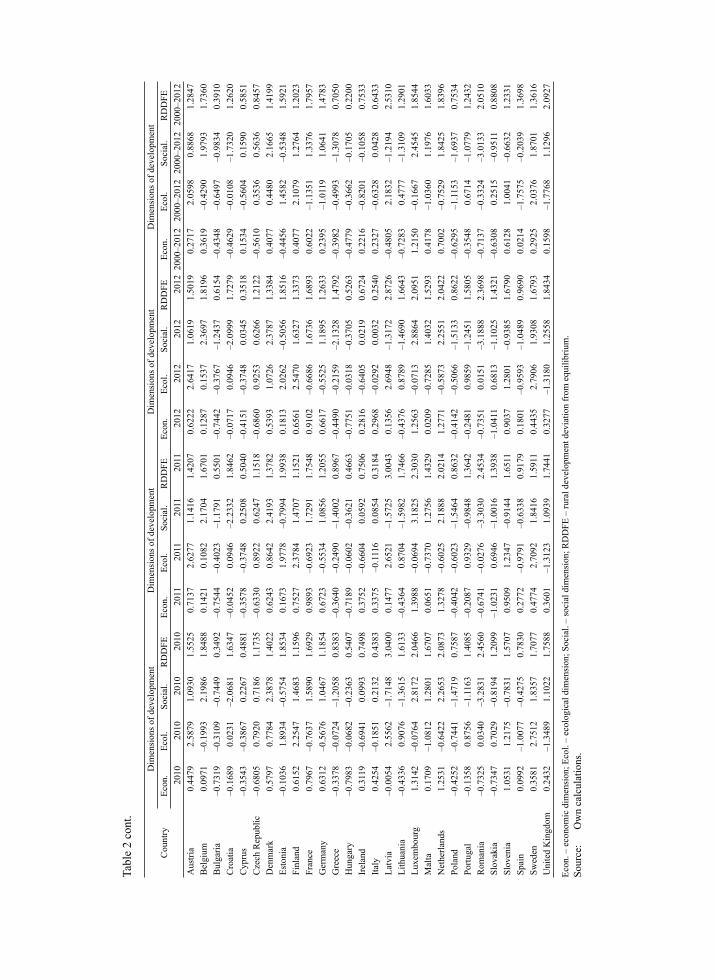
Tabl
e 2
cont
.
Cou
ntry
Dim
ensi
ons o
f dev
elop
men
tD
imen
sion
s of d
evel
opm
ent
Dim
ensi
ons o
f dev
elop
men
tD
imen
sion
s of d
evel
opm
ent
Econ
.Ec
ol.
Soci
al.
RD
DFE
Econ
.Ec
ol.
Soci
al.
RD
DFE
Econ
.Ec
ol.
Soci
al.
RD
DFE
Econ
.Ec
ol.
Soci
al.
RD
DFE
2010
2010
2010
2010
2011
2011
2011
2011
2012
2012
2012
2012
2000
–201
220
00–2
012
2000
–201
220
00–2
012
Aus
tria
0.44
792.
5879
1.09
301.
5525
0.71
372.
6277
1.14
161.
4207
0.62
222.
6417
1.06
191.
5019
0.27
172.
0598
0.88
681.
2847
Bel
gium
0.
0971
–0.1
993
2.19
861.
8488
0.14
210.
1082
2.17
041.
6701
0.12
870.
1537
2.36
971.
8196
0.36
19–0
.429
01.
9793
1.73
60B
ulga
ria–0
.731
9–0
.310
9–0
.744
90.
3492
–0.7
544
–0.4
023
–1.1
791
0.55
01–0
.744
2–0
.376
7–1
.243
70.
6154
–0.4
348
–0.6
497
–0.9
834
0.39
10C
roat
ia–0
.168
90.
0231
–2.0
681
1.63
47–0
.045
20.
0946
–2.2
332
1.84
62–0
.071
70.
0946
–2.0
999
1.72
79–0
.462
9–0
.010
8–1
.732
01.
2620
Cyp
rus
–0.3
543
–0.3
867
0.22
670.
4881
–0.3
578
–0.3
748
0.25
080.
5040
–0.4
151
–0.3
748
0.03
450.
3518
0.15
34–0
.560
40.
1590
0.58
51C
zech
Rep
ublic
–0.6
805
0.79
200.
7186
1.17
35–0
.633
00.
8922
0.62
471.
1518
–0.6
860
0.92
530.
6266
1.21
22–0
.561
00.
3536
0.56
360.
8457
Den
mar
k0.
5797
0.77
842.
3878
1.40
220.
6243
0.86
422.
4193
1.37
820.
5393
1.07
262.
3787
1.33
840.
4077
0.44
802.
1665
1.41
99Es
toni
a–0
.103
61.
8934
–0.5
754
1.85
340.
1673
1.97
78–0
.799
41.
9938
0.18
132.
0262
–0.5
056
1.85
16–0
.445
61.
4582
–0.5
348
1.59
21Fi
nlan
d0.
6152
2.25
471.
4683
1.15
960.
7527
2.37
841.
4707
1.15
210.
6561
2.54
701.
6327
1.33
730.
4077
2.10
791.
2764
1.20
23Fr
ance
0.79
67–0
.763
71.
5890
1.69
290.
9893
–0.6
923
1.72
911.
7548
0.91
02–0
.668
61.
6736
1.68
930.
6022
–1.1
351
1.33
761.
7957
Ger
man
y0.
6312
–0.5
676
1.04
671.
1854
0.67
23–0
.553
41.
0856
1.20
550.
6617
–0.5
525
1.18
951.
2633
0.23
95–1
.011
91.
0641
1.47
83G
reec
e–0
.337
8–0
.072
4–1
.205
80.
8383
–0.3
640
–0.2
490
–1.4
002
0.89
67–0
.449
0–0
.215
9–2
.132
81.
4792
–0.3
982
–0.4
993
–1.3
078
0.70
50H
unga
ry–0
.798
3–0
.068
2–0
.236
30.
5407
–0.7
189
–0.0
602
–0.3
621
0.46
63–0
.775
1–0
.031
8–0
.370
50.
5263
–0.4
779
–0.3
662
–0.1
705
0.22
00Ir
elan
d0.
3119
–0.6
941
0.09
930.
7498
0.37
52–0
.660
40.
0592
0.75
060.
2816
–0.6
405
0.02
190.
6724
0.22
16–0
.820
1–0
.105
80.
7533
Italy
0.42
54–0
.185
10.
2132
0.43
830.
3375
–0.1
116
0.08
540.
3184
0.29
68–0
.029
20.
0032
0.25
400.
2327
–0.6
328
0.04
280.
6433
Latv
ia–0
.005
42.
5562
–1.7
148
3.04
000.
1477
2.65
21–1
.572
53.
0043
0.13
562.
6948
–1.3
172
2.87
26–0
.480
52.
1832
–1.2
194
2.53
10Li
thua
nia
–0.4
336
0.90
76–1
.361
51.
6133
–0.4
364
0.87
04–1
.598
21.
7466
–0.4
376
0.87
89–1
.469
01.
6643
–0.7
283
0.47
77–1
.310
91.
2901
Luxe
mbo
urg
1.31
42–0
.076
42.
8172
2.04
661.
3988
–0.0
694
3.18
252.
3030
1.25
63–0
.071
32.
8864
2.09
511.
2150
–0.1
667
2.45
451.
8544
Mal
ta0.
1709
–1.0
812
1.28
011.
6707
0.06
51–0
.737
01.
2756
1.43
290.
0209
–0.7
285
1.40
321.
5293
0.41
78–1
.036
01.
1976
1.60
33N
ethe
rland
s1.
2531
–0.6
422
2.26
532.
0873
1.32
78–0
.602
52.
1888
2.02
141.
2771
–0.5
873
2.25
512.
0422
0.70
02–0
.752
91.
8425
1.83
96Po
land
–0.4
252
–0.7
441
–1.4
719
0.75
87–0
.404
2–0
.602
3–1
.546
40.
8632
–0.4
142
–0.5
066
–1.5
133
0.86
22–0
.629
5–1
.115
3–1
.693
70.
7534
Portu
gal
–0.1
358
0.87
56–1
.116
31.
4085
–0.2
087
0.93
29–0
.984
81.
3642
–0.2
481
0.98
59–1
.245
11.
5805
–0.3
548
0.67
14–1
.077
91.
2432
Rom
ania
–0.7
325
0.03
40–3
.283
12.
4560
–0.6
741
–0.0
276
–3.3
030
2.45
34–0
.735
10.
0151
–3.1
888
2.36
98–0
.713
7–0
.332
4–3
.013
32.
0510
Slov
akia
–0.7
347
0.70
29–0
.819
41.
2099
–1.0
231
0.69
46–1
.001
61.
3938
–1.0
411
0.68
13–1
.102
51.
4321
–0.6
308
0.25
15–0
.951
10.
8808
Slov
enia
1.05
311.
2175
–0.7
831
1.57
070.
9509
1.23
47–0
.914
41.
6511
0.90
371.
2801
–0.9
385
1.67
900.
6128
1.00
41–0
.663
21.
2331
Spai
n0.
0992
–1.0
077
–0.4
275
0.78
300.
2772
–0.9
791
–0.6
338
0.91
790.
1801
–0.9
593
–1.0
489
0.96
900.
0214
–1.7
575
–0.2
039
1.36
98Sw
eden
0.35
812.
7512
1.83
571.
7077
0.47
742.
7092
1.84
161.
5911
0.44
352.
7906
1.93
081.
6793
0.29
252.
0376
1.87
011.
3616
Uni
ted
Kin
gdom
0.24
32–1
.348
91.
1022
1.75
880.
3601
–1.3
123
1.09
391.
7441
0.32
77–1
.318
01.
2558
1.84
340.
1598
–1.7
768
1.12
962.
0927
Econ
. – e
cono
mic
dim
ensi
on; E
col.
– ec
olog
ical
dim
ensi
on; S
ocia
l. –
soci
al d
imen
sion
; RD
DFE
– ru
ral d
evel
opm
ent d
evia
tion
from
equ
ilibr
ium
. So
urce
: O
wn
calc
ulat
ions
.
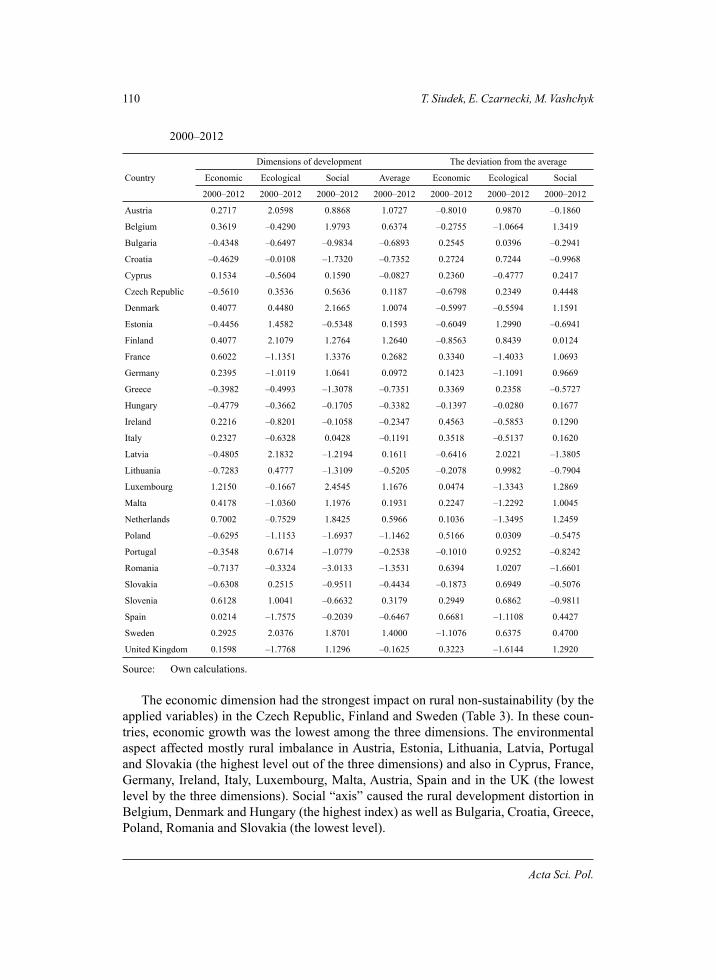
110 T. Siudek, E. Czarnecki, M. Vashchyk
Acta Sci. Pol.
2000–2012
Country
Dimensions of development The deviation from the average
Economic Ecological Social Average Economic Ecological Social
2000–2012 2000–2012 2000–2012 2000–2012 2000–2012 2000–2012 2000–2012
Austria 0.2717 2.0598 0.8868 1.0727 –0.8010 0.9870 –0.1860
Belgium 0.3619 –0.4290 1.9793 0.6374 –0.2755 –1.0664 1.3419
Bulgaria –0.4348 –0.6497 –0.9834 –0.6893 0.2545 0.0396 –0.2941
Croatia –0.4629 –0.0108 –1.7320 –0.7352 0.2724 0.7244 –0.9968
Cyprus 0.1534 –0.5604 0.1590 –0.0827 0.2360 –0.4777 0.2417
Czech Republic –0.5610 0.3536 0.5636 0.1187 –0.6798 0.2349 0.4448
Denmark 0.4077 0.4480 2.1665 1.0074 –0.5997 –0.5594 1.1591
Estonia –0.4456 1.4582 –0.5348 0.1593 –0.6049 1.2990 –0.6941
Finland 0.4077 2.1079 1.2764 1.2640 –0.8563 0.8439 0.0124
France 0.6022 –1.1351 1.3376 0.2682 0.3340 –1.4033 1.0693
Germany 0.2395 –1.0119 1.0641 0.0972 0.1423 –1.1091 0.9669
Greece –0.3982 –0.4993 –1.3078 –0.7351 0.3369 0.2358 –0.5727
Hungary –0.4779 –0.3662 –0.1705 –0.3382 –0.1397 –0.0280 0.1677
Ireland 0.2216 –0.8201 –0.1058 –0.2347 0.4563 –0.5853 0.1290
Italy 0.2327 –0.6328 0.0428 –0.1191 0.3518 –0.5137 0.1620
Latvia –0.4805 2.1832 –1.2194 0.1611 –0.6416 2.0221 –1.3805
Lithuania –0.7283 0.4777 –1.3109 –0.5205 –0.2078 0.9982 –0.7904
Luxembourg 1.2150 –0.1667 2.4545 1.1676 0.0474 –1.3343 1.2869
Malta 0.4178 –1.0360 1.1976 0.1931 0.2247 –1.2292 1.0045
Netherlands 0.7002 –0.7529 1.8425 0.5966 0.1036 –1.3495 1.2459
Poland –0.6295 –1.1153 –1.6937 –1.1462 0.5166 0.0309 –0.5475
Portugal –0.3548 0.6714 –1.0779 –0.2538 –0.1010 0.9252 –0.8242
Romania –0.7137 –0.3324 –3.0133 –1.3531 0.6394 1.0207 –1.6601
Slovakia –0.6308 0.2515 –0.9511 –0.4434 –0.1873 0.6949 –0.5076
Slovenia 0.6128 1.0041 –0.6632 0.3179 0.2949 0.6862 –0.9811
Spain 0.0214 –1.7575 –0.2039 –0.6467 0.6681 –1.1108 0.4427
Sweden 0.2925 2.0376 1.8701 1.4000 –1.1076 0.6375 0.4700
United Kingdom 0.1598 –1.7768 1.1296 –0.1625 0.3223 –1.6144 1.2920
Source: Own calculations.
The economic dimension had the strongest impact on rural non-sustainability (by the applied variables) in the Czech Republic, Finland and Sweden (Table 3). In these coun-tries, economic growth was the lowest among the three dimensions. The environmental aspect affected mostly rural imbalance in Austria, Estonia, Lithuania, Latvia, Portugal and Slovakia (the highest level out of the three dimensions) and also in Cyprus, France, Germany, Ireland, Italy, Luxembourg, Malta, Austria, Spain and in the UK (the lowest level by the three dimensions). Social “axis” caused the rural development distortion in Belgium, Denmark and Hungary (the highest index) as well as Bulgaria, Croatia, Greece, Poland, Romania and Slovakia (the lowest level).
Assessment of the sustainability of rural development... 111
Oeconomia 15 (3) 2016
CONCLUSIONS
There is no unified approach that would ensure maintaining of sustainability in a long run steady success in each country, whereas the sustainable development of rural areas implies achieving common goals. This non-uniformity must be considered in rural deve-lopment policies and strategies for the EU Member States due to specific characteristics of their agriculture and rural areas.
According to the synthetic index and in terms of economic development the lowest in-dicators in 2000–2012 were typical for the Central and Eastern European countries (Lithua-nia, Romania, Slovakia, Poland and the Czech Republic), while the highest – in the Western and Southern Europe (Luxembourg, the Netherlands, France, Malta and Slovenia).
The worst ecological situation of rural areas (by the analyzed factors) was recorded in some of the “old” EU Member States (the United Kingdom, Spain and France) and the “new” ones (Malta and Poland). The highest ecological development was observed in the Scandinavian region (Finland and Sweden) and in one Baltic country (Latvia). In general, better outcomes in environmental situation in above mentioned states isn’t necessarily explained by higher level of economic development and vice versa. This means that some countries succeeded in economy growth while increasing emissions, pollution or electric power consumption etc. Neither it means that some countries succeeded in economy gro-wth while increasing emissions, pollution or electric power consumption etc.
The lowest social development level of rural areas was in the countries which had joined the EU after its last enlargements (Romania, Croatia, Poland and Lithuania) and the highest level – in the Benelux (Belgium, the Netherlands, Luxembourg) and the Scan-dinavian states (Denmark and Sweden). These outcomes confirmed disparities between these two “poles” of the EU-28 and demonstrated strong interdependence between the country’s social development and its welfare.
Unexpectedly, the overall degree of rural sustainability was the lowest both in some of the “new” EU countries (Latvia and Romania), as well as in the “old” EU countries (the UK, Luxembourg, the Netherlands and France). The same diversity is true for the states with the highest sustainability level – in Hungary, Bulgaria, Cyprus and in Italy, Greece and Ireland.
Among all the EU countries, the ecological “vector” had the strongest impact on rural non-sustainability in the EU countries, whereas the economic component was not a key factor.
Generally, there is large diversification in economic, ecological and social develop-ment of rural areas among the EU Member States. The synthetic index of rural sustainable development and it’s value can be considered as a measure of the relative likelihood of the country’s ability to achieve favorable status. However, the high value of that index can’t guarantee its ability to remain sustainable rural development in a long-term perspective.
The research has pointed out discrepancies among the different EU nations by all the three dimensions, mainly among the “old” and the “new” EU Member States. On the other hand, it has demonstrated their strong cohesion.
In fact, the sustainable (rural) development exists only in theory. In practice, this de-velopment deviates from equilibrium in some measure. In addition, the development of rural areas is a dynamic effect, because it is constantly changing over time.
112 T. Siudek, E. Czarnecki, M. Vashchyk
Acta Sci. Pol.
REFERENCES
Bolch, B.W., Huang, C.J. (1974). Multivariate statistical methods for business and economics. Prentice-Hall, Englewood Cliffs, NJ:
Cherevko, G., Cherevko, I. (2010). Sustainable development of rural areas. Agrarian Economy, 3 (1–2), 77–84.
Daly, H.E. (2007). Ecological Economics and Sustainable Development-Selected Essays of H. Daly (Advances in ecological econo¬mics). Edward Elgar Publishing Limited, UK.
Dobosz, M. (2001). Wspomagana komputerowo statystyczna analiza wyników badań. Wyd. Aka-demicka Oficyna Wydawnicza EXIT, Warszawa.
European Commission – Agriculture Directorate-General (2001). Framework for Indicators for the Economic and Social Dimensions of Sustainable Agriculture and Rural Development. Retrieved from: http://ec.europa.eu/agriculture/publi/reports/sustain/index_en.pdf.
Harman, H.H. (1967). Modern factor analysis. University of Chicago Press, Chicago.Harwood, R.R. (1990). A history of sustainable agriculture. [In:] Edwards C.A., Lal R., P. Madden,
R. Miller, G. House (Eds). Sustainable Agricultural Systems. Soil and Water Conservati-on Society, Ankeny, IA.
International Institute for Sustainable Development (2015). What is Sustainable Development? Re-trieved from: https://www.iisd.org/sd/#one.
Jajuga, K. (1993). Statystyczna analiza wielowymiarowa. Wyd. Naukowe PWN, Warszawa.Majewski, E. (2008). Trwały rozwój i trwałe rolnictwo – teoria a praktyka gospodarstw rolniczych.
Wyd. SGGW, Warszawa.Matthews, A. (2012). What role for agriculture in rural development? Retrieved from: http://capre-
form.eu/what-role-for-agriculture-in-rural-development/.Morrison, D.F. (1990). Wielowymiarowa analiza statystyczna. PWN, Warszawa.OECD (2000). Sustainable agriculture 2000. Agricultural Policies in OECD Countries: Monitoring
and Evaluation. Glossary of Agricultural Policy Terms.Pearce, D., Barbier, E., Markandya, A. (1990). Sustainable Development: Economics and Environ-
ment in the Third World. Edward Elgar Publishing/ Earthscan Publications.Pearce, D., Warford J. (1993). World without end: Economics, Environment, and Sustainable De-
velopment. Oxford University Press, New York – Oxford.Region of Hamilton-Wenetworth (1996). Creating a Sustainable Community: Hamilton-Wentworth’s
VISION 2020, Canada. Retrieved from: http://www.unesco.org/most/usa4.htm.Rogers P., Jalal K.F et al., 1997. Measuring Environmental Quality in Asia. Harvard University and
Asian Development Bank.Shalaby, M.Y., Al-Zahrani, K.H., Baig, M.B., Straquadine, G.S., Aldosari, F. (2011). Threats and
Challenges to Sustainable Agriculture and Rural Development in Egypt: Implications for Agricultural Extension. The Journal of Animal & Plant Sciences, 21 (3), 581–588.
Siudek, T. (2006). Badanie regionalnego zróżnicowania sytuacji ekonomiczno-finansowej banków spółdzielczych w Polsce z wykorzystaniem metod taksonomicznych. Zeszyty Naukowe SGGW, Ekonomika i Organizacja Gospodarki Żywnościowej, 58, 41–53.
Siudek, T. (2008).Wpływ kredytów rolniczych udzielanych przez banki spółdzielcze na rozwój rolnictwa w Polsce. Zeszyty Naukowe SGGW, Ekonomika i Organizacja Gospodarki Żywnościowej, 66, 37–47.
Siudek, T., Vashchyk, M. (2014). Economic development of rural areas in European Union Member States in 2000–2012. Acta Scientiarum Polonorum, Oeconomia, 13 (3), 95–105.
Solow, R. (1999). Notes on Social Capital and Economic Performance. [In:] P. Dasgupta, I. Seragel-din (Eds). Social Capital. A Multifaceted perspective. The World Bank, Washington.
Stanny, M. (2011). Analiza poziomu komponentów rozwoju zrównoważonego i ocena stopnia ich zrównoważenia na obszarach wiejskich ZPP. Spatial analysis of the level of sustainable
Assessment of the sustainability of rural development... 113
Oeconomia 15 (3) 2016
development components and evaluation of their degree of sustainability in rural areas of the green lungs of Poland. Folia Oeconomica, 253, 99–114.
Tadeusiewicz, R. (1993). Biometria. Wyd. Akademii Górniczo-Hutniczej, Kraków.United Nations (2009a). Report of the World Commission on Environment and Development: Our
Common Future.United Nations (2009b). Report on the 17th session of CSD-E/CN.17/2009/19/ Sustainable Deve-
lopment Knowledge Platform. Retrieved from: https://sustainabledevelopment.un.org/to-pics/ruraldevelopment/decisions.
United Nations Environment Programme (1992). Rio Declaration an Environment and Develop-ment. UN Document A/CONF.151/26. Retrieved from: http://www.unep.org /Documents.Multilingual/Default.asp?DocumentID=78&ArtideID=1163.
Vashchyk, M., Siudek, T. (2014). Ecological development of rural areas in European Union Mem-ber States in 2000–2012. Problemy Rolnictwa Światowego, 14 (4), 194–204.
Vashchyk, M., Siudek, T. (2015). Social development of rural areas in European Union Member States in 2000–2012. Roczniki Ekonomii Rolnictwa i Rozwoju Obszarów Wiejskich, 102, (1), 7–17.
World Bank (1991). World Development Report. Retrieved from http://web.world-bank.org/WBSITE/EXTERNAL/EXTDEC/EXTRESEARCH/EXTWDRS/0,,contentMDK:22295143~pagePK:478093~piPK:477627~theSitePK:477624,00.html.
OCENA ZRÓWNOWAŻENIA ROZWOJU OBSZARÓW WIEJSKICH W KRAJACH UNII EUROPEJSKIEJ
Streszczenie. Celem pracy jest określenie stopnia zrównoważenia rozwoju obszarów wiej-skich w krajach Unii Europejskiej. Badania obejmowały trzy wymiary rozwoju obszarów wiejskich, tj. ekonomiczny, ekologiczny i społeczny. Każdy wymiar określany był za po-mocą wskaźnika syntetycznego opracowanego na podstawie zmiennych pierwotnych, przy wykorzystaniu analizy czynnikowej. Badania przeprowadzono we wszystkich krajach UE w latach 2000–2012. Z uzyskanych danych wynika, że najwyższy stopień zrównoważenia rozwoju obszarów wiejskich wystąpił na Węgrzech, w Bułgarii i na Cyprze, a najniższy na Łotwie, w Rumunii i Wielkiej Brytanii.
Słowa kluczowe: zrównoważony rozwój, obszary wiejskie, kraje Unii Europejskiej
Accepted for print: 09.06.2016
For citation: Siudek T., Czarnecki E., Vashchyk M. (2016). Assessment of the sustainability of rural development in the European Union Member States. Acta Sci. Pol., Oeconomia, 15 (3), 101–113.


Oeconomia 15 (3) 2016, 115–122
ISSN 1644-0757eISSN 2450-4602
http://acta_oeconomia.sggw.pl
Corresponding author: Katarzyna Szalonka, University of Wrocław, Faculty of Law, Administra-tion and Economics, Uniwersytecka 22/26, 50-145 Wrocław, Poland, e-mail: [email protected]
© Copyright by Warsaw University of Life Sciences Press, Warsaw 2016
HEALTH AS A DETERMINANT OF THE DEVELOPMENT OF THE ORGANIC FOOD MARKET
Katarzyna SzalonkaUniversity of Wrocław
Grażyna ŚwiatowyWrocław University of Economics
Lucyna Witek Rzeszow University of Technology
Abstract. This article attempts to answer the questions if the desire to maintain good health is a major factor in the development of the organic food market and whether managers in the organic food market should focus on this factor in marketing communication strategies to win new customers and increase the number of buyers regularly. The organic food market is one of the most dynamically developing sectors of the food industry, but it is still small. Consumers who appreciate healthy lifestyle, taste, life in clean environment can become potential buyers of organic food. Our study shows that health is an important motive of organic food consumption. Practitioners during the construction of promotional message, especially in mature markets should in the future pay attention to the environmental benefits and sustainable mode of production, while all the nutritional and health benefits should be treated only as a premium. There is no conclusive evidence that organic food is more health than conventional alternatives.
Key words: sustainability, organic food, health, consumer, green consumer
INTRODUCTION
Fear of civilization diseases, deterioration of health of societies, food scandals, en-vironmental disasters and their exposure in the media cause health problems, which in turn has an impact on consumer behavior. The quest for health and wellness is becoming

116 K. Szalonka, G. Światowy, L. Witek
Acta Sci. Pol.
a driving force in today’s food market, which is characterized by a relatively high level of innovation, which is a consequence of increasingly diversified consumer expectations about food products [Gutkowska 2011]. The consumer is looking for food products that meet a variety of added features which are conducive to preservation of health, fitness and beauty [Gutkowska and Ozimek 2005]. At present consumers are paying more atten-tion to the health benefits of foods in order to achieve a healthier diet [Chrysochou 2010]. Consumers are interested in healthy food which increases the healthy products market [Sahota 2009]. Scientific publications show that health is an important theme of organic food consumption. Awareness of the impact of environmental pollution on health and safety make that the issue of sustainable development is included into business models.
This article attempts to answer the questions if the desire to maintain good health is a major factor in the development of the organic food market and whether managers in the organic food market should focus on this factor in marketing communication strate-gies to win new customers and increase the number of buyers regularly.
HEALTH AS VALUE FOR CONSUMERS AND BUSINESSES
Health, as defined by the World Health Organization (WHO), is not only physical welfare, but mental and spiritual as well as social one. It is a life resource which includes personal and social resources and opportunities for physical activity, and not only the shortages (illness or disability). It is the result of a balance between the organism and the environment. Health is a dynamic process, a system of mutual considerations in relation organism–environment. It is the potential adaptability of the organism to environmental requirements and supports body disposition to maintain a balance between it and envi-ronmental requirements [Karwat et al. 2012]. Currently, when analyzing health issues the holistic concept is developed, which includes four dimensions of health, namely physi-cal (related to the proper functioning of the body), mental, social (connected with the fulfillment of social roles and maintaining normal relationships with other people), and spiritual (related to religion, principles and maintaining inner harmony). The health status of the people is conditioned to the greatest extent by their lifestyle, less by the physical and social environment and genetic factors, and the least it is affected by the health serv-ice. The health for consumers is a specific type of wealth, a life asset which is the most priceless value to them and also they have right to protect it. Research shows that among the top values and goals of Polish households it occupies the second position just after a successful family life [Kusińska 2011]. Consumers in the pursuit of their own individu-al needs focus on improving the quality of their lives, care for the health and maintaining good physical and mental condition [Światowy 2012]. Increasingly popular it is to adopt a healthy lifestyle and to respect the principles of sustainable development, thus increas-ing consumer segment of LOHAS (Lifestyles of Health and Sustainability). This is also reflected in the emergence of new trends in consumption such as slow life, deconsump-tion, ecological consumption. A group of consumers with particular interest in health and those who are trying to follow a healthier, balanced diet and a balanced lifestyle has a positive attitude towards organic food [de Magistris and Gracia 2008]. In recent years the demand for organic products in developed countries has shown a significant growth.

Health as a determinant of the development of the organic food market 117
Oeconomia 15 (3) 2016
Organic foods are perceived by consumers as being less harmful to the environment and healthier than conventional food.
DETERMINANTS THE ORGANIC FOOD MARKET DEVELOPMENT
Currently, the organic food market is one of the most dynamically developing sectors of the food industry, but it is still small. Consumer spendings in the EU for organic food in 2013 amounted to 22 billion EUR, which increased by almost 6% compared to last year [European Parliament 2015]. Not only the interest of consumers, but also agricul-tural policy and state aid and the inclusion of large stores to sell organic products affect its growth.
In Poland factors that largely affect the demand for organic food in addition to changes in the system of values (increase awareness of the social or environmental) is an increas-ing consumer affluence and saturation of nutritional needs. It is expected that demand will increase due to the growing affluence of Polish society, the search for new solu-tions habits, as well as the growing ecological consciousness of the Poles [Pilarczyk and Nestorowicz 2010]. Polish organic food consumers perceive this as a specific group of food products with a primarily pro-health qualities. This is combined with motifs of the acquisition, which is dominated by health care. In comparison with other countries they are characterized by their relatively low percentage of indications of environmental con-cern and support of organic farms [Łuczka-Bakuła 2007].
CONSUMER BEHAVIOR IN THE ORGANIC FOOD MARKET
Consumer behavior towards organic food are determined by many factors. Health problems are a key factor in the purchase of organic food. This is indicated by several studies [Wandel and Bugge 1997, Schifferstein and Oude Ophuis 1998]. Ahmad and Ke-lana [2010] indicate that purchases of organic food are rising because consumers believe that organic food is safer than the conventional one. Hartman Group [2010] found three key determinants that induce consumers to do first organic shopping. These are: preg-nancy, health conditions and social impact.
The attitudes and decisions of consumers towards organic food are also affected by demographic and social factors, such as age, gender and level of education [Aertsens et al. 2011, van Doorn and Verhoef 2011]. People with higher education are more likely to buy organic food than people with lower levels of education [Dettmann and Dimitri 2007, Roitner-Schobesberger et al. 2008, Tsakiridou et al. 2008]. Conflicting conclusions can be found in the research by Yin et al. [2010], who showed that age and educational level do not play a big role in purchasing organic food. Willingness to buy organic food has more to do with the impact of individual lifestyle than socio-demographic profile [Schifferstein and Oude Ophuis 1998, Chryssohoidis and Krystallis 2005]. Studies also show that organic food buyers have a higher level of income than consumers not buying this kind of food [Roitner-Schobesberger et al. 2008].
Place of residence may determine organic food choices. In industrialized cities we can notice a significant increase in the market share of certified organic food products
118 K. Szalonka, G. Światowy, L. Witek
Acta Sci. Pol.
[Richter 2008]. The fact of having children is also a factor stimulating organic shopping [Frostling-Henningsson et al. 2014]. Consumer knowledge is an important construct that affects consumer behavior. Information on organic foods is an important issue because it affects its perception and is the only instrument that allows us to distinguish the attributes of organic food products from those of conventional products and build positive attitudes towards organic food [von Alvesleben 1997]. Scientists say that the lack of consumer awareness of organic food is an important factor slowing its growth. A higher level of objective and subjective knowledge with regard to organic food is positively correlated with a positive attitude towards this category of products and with more experience [Aert-sens et al. 2011]. The experience of the consumer is essential for its attitudes. Consumers who have already bought organic food showed more positive attitudes towards organic food purchases than those who did not have any experience, and bought them at a higher frequency [Roddy et al. 1996]. Gil et al. [2000] suggest that lifestyle of consumers is the most important factor explaining the behavior of consumers towards organic food. Stud-ies have shown that a segment of consumers with favorable attitudes towards organic food has a higher level of health orientation in relation to other segments [Nasir and Karakaya 2014]. The buyer regularly spend on average less than half of their budget to purchase organic products. The most important factors that discourage consumers from buying organic products are: high prices, insufficient availability and quality of the prod-uct [Buder et al. 2014].
MOTIVES OF ORGANIC FOOD PURCHASING
The motives of buying organic food are concentrated in the area of health or the envi-ronment [Honkanen et al. 2006]. The main motive is health [Shepherd et al. 2005]. Padel and Foster [2005] found that consumers buy organic food because they see it as better for their health. In contrast, the concern about the environment is not as strong motive as health [Tregear et al. 1994, Durham and Andrade 2005]. Also Millock et al. [2004] argued that attitudes towards the environment and animal welfare influence on the selection of organic food less than aspects of taste, freshness and health. Similarly Chryssohoidis and Krystallis [2005] indicate that the most important motive of purchasing organic products is an aspect of health and taste. Tregear and his colleagues [1994] found that 54% of con-sumers claim that they purchase organic foods because of concerns about their health or their families, while only 9% of consumers indicate that they buy as a result of concern for the environment. However, it should be noted that health is a more important motive to buy for casual buyers than regular ones who do this not only for health reasons as well as for environmental ones [Schifferstein and Oude Ophuis 1998]. The motives of pur-chasing organic foods are determined by demographic factors. Wandel and Bugge [1997] indicate that young consumers take into account more environmental issues, while older consumers consider a purchase organic food for health. The studies conducted by Chen [2009] have shown that a healthy lifestyle has an impact on consumer attitudes towards organic food. Also, the security of value in use was a factor that played an important role [Aertsens et al. 2009]. One can find research which shows that health has a negligible im-pact on the buying behavior of organic food [Michaelidou and Hassan 2008]. Attention to
Health as a determinant of the development of the organic food market 119
Oeconomia 15 (3) 2016
health has been recognized as a priority for which consumers are willing to pay a higher price [Paul and Rana 2012]. Purchasers treat organic food purchases as an investment in good health. The perceived nutritional attributes of organic food represent a competitive advantage over conventional foods.
CONCLUSIONS AND IMPLICATIONS
The article provides useful information for the operators in the market for organic products to indicate that the most important determinant choices by consumers of organic food are health benefits. Therefore, managers should emphasize marketing communi-cation that organic food is produced without the use of artificial chemicals, pesticides, fertilizers, does not contain genetically modified substances or other additives. In or-der to encourage consumers to buy organic food, the health statements pointing out the manufacturing method can be useful in marketing communication strategy. However, such campaigns must be designed with care as most research indicates that there are no significant differences in food content or additional health benefits between organic foods and conventionally produced one, but in spite of this, consumers perceive organic food as healthier, tastier and more environmentally friendly than the conventional food [Shepherd et al. 2005, Dangour et al. 2009].
The concentration of various antioxidants in organic crops are much higher than in conventional food [Barański et al. 2014]. There is no conclusive evidence that antioxi-dants increase health and organic food is more nutritious and reduces health risks than conventional alternatives [Smith-Spangler et al. 2012]. Practitioners during the construc-tion of promotional message, especially in mature markets should in the future pay atten-tion to the environmental benefits and sustainable mode of production, while all the nu-tritional and health benefits should be treated only as a premium. Managers can give rise to associations of organic food purchases from socially responsible consumption [Nasir and Karakaya 2014].
The results of our study indicate that Polish consumers with still low environmental awareness and at this early stage of development of the organic food market will be recep-tive to marketing messages that focus more on health benefits than on environmentally re-sponsible actions. Therefore it should be considered whether manufacturers should look for links between health and the quality of the environment. This study may be useful as a set of guidelines and suggestions for producers and retailers of organic food, which identifies buyers of organic foods, their motivations and barriers to purchase. Organic food is seen as difficult to access food and of high prices [Aertsens et al. 2011]. For a large group of consumers it is a barrier to their purchase, so consumers should explain in detail the source of the higher costs that are necessary to produce organic food and re-evaluate distribution channels. The results on the determinants of consumer behavior imply some guidance for product strategy and marketing communication. Market participants should take care to provide knowledge on labels of organic products and their characteristics, the explanation of worse physical look and stress the flavor attributes or benefits for the environment. The problem is not only in the Polish market, but also in developed coun-tries there is a small number of regular buyers. Hence, a useful tool in the animation may
120 K. Szalonka, G. Światowy, L. Witek
Acta Sci. Pol.
be loyalty programs as well as forms and means of sales promotion. Many surveys show the results of declared answers, and not the picture of actual behavior. It is suggested to conduct research, both quantitative and qualitative ones, in order to minimize the effect of double talk of the answers that quite often appear in the quantitative surveys and to obtain in-depth knowledge about the causes and motives of consumer choices towards food [Gutkowska and Ozimek 2005].
REFERENCES
Aertsens, J., Mondelaers, K., Verbeke, W., Buysse, J., Van Huylenbroeck, G. (2011). The influence of subjective and objective knowledge on attitude, motivations and consumption of orga-nic food. British Food Journal, 113, 11, 1353–1378.
Aertsens, J., Verbeke, W., Mondelaers, K., Van Huylenbroeck, G. (2009). Personal determinants of organic food consumption: a review. British Food Journal, 111, 10, 1140–1167.
Ahmad, S.N.B.B., Kelana, J. (2010). Organic food: A study on demographic characteristics and factors influencing purchase intentions among consumers in Klang Valley, Malaysia. In-ternational Journal of Business and Management, 5 (2), 105–118.
Alvesleben von, R. (1997). Consumer behavior. [In:] D.I. Padberg, C. Ritson, L.M. Albisu (Eds), Agro-food Marketing. CAB International, New York.
Barański, M., Srednicka-Tober, D., Volakakis, N., Seal, C., Sanderson, R., Stewart, G.B., Benbrook, Ch., Biavati, B., Markellou, E., Giotis, Ch., Gromadzka-Ostrowska, J., Rembiałkowska, E., Skwarło-Son, K., Tahvonen, R., Janovska, D., Niggli, U., Nicot, Ph., Leifert, C. (2014). Higher antioxidant and lower cadmium concentrations and lower incidence of pesticide residues in organically grown crops: a systematic literature review and meta-analyses. British Journal of Nutrition, 112, 794–811.
Buder, F., Feldmann, C., Hamm, U. (2014). Why regular buyers of organic food still buy many conventional products. British Food Journal, 116, 3, 390–404.
Chen, M-F. (2009). Attitude toward organic foods among Taiwanese as related to health conscious-ness, environmental attitudes, and the mediating effects of a healthy lifestyle. British Food Journal, 111, 2, 165–178.
Chrysochou, P. (2010). Food health branding: the role of marketing mix elements and public dis-course in conveying a healthy brand image. Journal of Marketing Communications, 16, 1–2, 69–85.
Chryssohoidis, G.M., Krystallis, A. (2005). Organic consumers’ personal values research: testing and validating the list of values (LOV) scale and implementing a value-based segmenta-tion task. Food Quality and Preference 16, 585–599.
Dangour, A.D., Dodhia, S.K., Hayter, A., Allen, E., Lock, K., Uauy, R. (2009). Nutritional quality of organic foods: a systematic review. The American Journal of Clinical Nutrition, 90 (3), 680–685.
Dettmann, R., Dimitri, C. (2007). Who’s buying organic vegetables? Demographic characteristics of US consumers. Journal of Food Distribution Research, 49–62.
Doorn van, J., Verhoef, P.C. (2011). Willingness to pay for organic products: differences between virtue and vice foods. International Journal of Research in Marketing, 28, 3, 167–180.
Durham, C.A., Andrade, D. (2005). Health vs. environmental motivation in organic preferences and purchases. American Agricultural Economics Association Annual Meeting. Providence, RI, 24-27 July.
Frostling-Henningsson, M., Hedbom, M., Wilandh, L. (2014). Intentions to buy “organic” not ma-nifested in practice. British Food Journal, 116, 5, 872–887.
Health as a determinant of the development of the organic food market 121
Oeconomia 15 (3) 2016
Gil, J.M., Gracia, A., Sa´nchez, M. (2000). Market segmentation and willingness to pay for or-ganic products in Spain. International Food and Agribusiness Management Review, 3, 207–226.
Gutkowska, K. (2011). Innowacyjność konsumentów wobec produktów żywnościowych jako wa-runek rozwoju rynku żywności [Innovation of consumers to food products as a condition for the development of the food market]. Konsumpcja i Rozwój, 1, 108–119.
Gutkowska, K., Ozimek, I. (2005). Wybrane aspekty zachowań konsumentów na rynku żywności – kryteria zróżnicowania [Selected aspects of consumer behavior in the food market – the criteria of differentiation]. Wydawnictwo SGGW, Warszawa.
Hartman Group (2010). Beyond organic & natural 2010. Retrieved from http://store.hartman-group.com/content/organic-and-natural-2010-overview.pdf (accessed: 05.10.2015).
Honkanen, P., Olsen S.O., Verplanken B. (2006). Ethical value and motive driving organic food choice. Journal of Consumer Behaviour, 5, 5, 420–430.
European Parliament (2015). Organic food: Helping EU consumers make an informed choice. EPRS Report. Retrieved from http://www.europarl.europa.eu/RegData/etudes/BRIE/2015/557009/EPRS_BRI%282015%29557009_EN.pdf (accessed: 11.10.2015).
Karwat, I.D., Jędrych, M., Skawiński, D., Piecewicz, H., Sobieszczański, S.J., Żukow, W., Fronczek, M., Borzęcki, P. (2012). Health and disability – problems with defining, Part 1. Characteri-stics used in evaluation of the state of health. Journal of Health Sciences, (2) 5, 87–100.
Kusińska, A. (2011). Hierarchia uznawanych wartości jako czynnik kreujący popyt i konsumpcję (The hierarchy of recognized values as a factorcreating demand and consumption). Kon-sumpcja i Rozwój, 1, 93–107.
Łuczka-Bakuła, W. (2007). Rynek żywności ekologicznej. Wyznaczniki i uwarunkowania rozwo-ju (The organic food market. Determinants and conditions of the development). PWE, Warszawa.
Magistris, T.D., Gracia, A. (2008). The decision to buy organic food products in Southern Italy, British Food Journal, 110, 9, 929–947.
Michaelidou, N., Hassan, L.M. (2008). The role of health consciousness, food safety concern and ethical identity on attitudes and intentions towards organic food. International Journal of Consumer Studies, 32, 2, 163–170.
Millock, K., Wier, M., Andersen, L.M. (2004). Consumer’s demand for organic foods-attitudes, value and purchasing behaviour. XIII Annual Conference of European Association of Environmental and Resource Economics, Budapest, 25–28 June.
Nasir, V.A., Karakaya, F. (2014). Consumer segments in organic foods market. Journal of Consu-mer Marketing, 31, 4, 263–277.
Padel, S., Foster, C. (2005). Exploring the gap between attitudes and behaviour. British Food Jour-nal, 107, 8, 606–625.
Paul, J., Rana, J. (2012). Consumer behavior and purchase intention for organic food. Journal of Consumer Marketing, 29, 6, 412–422.
Pilarczyk, B., Nestorowicz, R. (2010). Marketing ekologicznych produktów żywnościowych [Mar-keting of organic food products]. Wolters Kluwer, Warszawa.
Richter, T. (2008). Trends in the organic retailing sector in Europe 2007. [In:] H. Willer, M. Yussefi--Menzler, N. Sorensen (Eds), The World of Organic Agriculture – Statistics and Emerging Trends. Earthscan, London, 140–147.
Roddy, G., Cowan, C.A., Hutchinson, G. (1996). Consumer attitudes and behaviour to organic foods in Ireland. Journal of International Consumer Marketing, 9, 2, 41–63.
Roitner-Schobesberger, B., Darnhofer, I., Somsook, S., Vogl, C.R. (2008). Consumer perceptions of organic foods in Bangkok. Thailand, Food Policy, 33, 2, 112–121.
Sahota, A. (2009). The global market for organic food and drink. [In:] H. Willer, L. Klicher (Eds), World of Organic Agriculture – Statistics and Emerging Trends 2009. FiBL-IFOAM Re-port. FiBL. Geneva, 59–64.
122 K. Szalonka, G. Światowy, L. Witek
Acta Sci. Pol.
Schifferstein, H.N.J., Oude Ophuis, P.A.M. (1998). Health-related determinants of organic food consumption in The Netherlands. Food Quality and Preference, 9, 3, 119–133.
Shepherd, R., Magnusson, M., Sjödén, P.O. (2005). Determinants of consumer behavior related to organic foods. Ambio, 34, 4/5, 352–359.
Smith-Spangler, C., Brandeau, M.L., Hunter, G.E., Bavinger, J.C., Pearson, M., Eschbach, P.J., Sundaram, V., Liu, H., Schirmer, P., Stave, C., Olkin, I., Bravata, D.M. (2012). Are Or-ganic Foods Safer or Healthier Than Conventional Alternatives? A Systematic Review. Annals of Internal Medicine 4, 157 (5), 348–366.
Światowy, G. (2012). Gospodarstwo domowe jako kreator przemian społecznych i gospodarczych [Household as a creator of social and economic changes]. Konsumpcja i Rozwój, 2 (3), 56–66.
Tregear, A., Dent, J.B., McGregor, M.J. (1994). The demand for organically grown produce. British Food Journal, 96, 4, 21–25.
Tsakiridou, E., Boutsouki, C., Zotos, Y., Mattas, K. (2008). Attitudes and behaviour towards orga-nic products: an exploratory study. International Journal of Retail and Distribution Ma-nagement, 36, 2, 158–175.
Wandel, M., Bugge, A. (1997). Environmental concern in consumer evaluation of food quality. Food Quality and Preference, 8, 1, 19–26.
Yin, S., Wu, L., Du, L., Chen, M. (2010). Consumers’ purchase intention of organic food in China. Journal of the Science of Food and Agriculture, 90, 8, 1361–1367.
ZDROWIE JAKO DETERMINANTA ROZWOJU RYNKU ŻYWNOŚCI EKOLOGICZNEJ
Streszczenie. Celem artykułu jest podjęcie próby odpowiedzi na pytanie czy dążenie do utrzymania dobrego stanu zdrowia jest głównym czynnikiem rozwoju rynku żywności eko-logicznej oraz czy menedżerowie na rynku żywności ekologicznej powinni koncentrować się na tym czynniku w strategii marketingowej żywności ekologicznej, a zwłaszcza w stra-tegii komunikacji marketingowej, aby pozyskać nowych nabywców oraz zwiększyć liczbę kupujących regularnie. Artykuł dostarcza cennych informacji wskazując ze najważniejszym wyznacznikiem wyborów żywności organicznej przez konsumentów są korzyści dla zdrowia. W celu zachęcenia konsumentów do zakupu żywności ekologicznej, użyteczne w strategii komunikacji marketingowej mogą być oświadczenia zdrowotne podkreślające metodę wy-twarzania. Jednak takie kampanie muszą być zaprojektowane z ostrożnością, ponieważ więk-szość badań wskazuje, że nie ma istotnych różnic w zawartości żywieniowej lub dodatko-wych korzyściach zdrowotnych między ekologiczną żywnością a tradycyjnie wytwarzaną.
Słowa kluczowe: zrównoważony rozwój, żywność ekologiczna, zdrowie, konsument, kon-sument ekologiczny
Accepted for print: 11.08.2016
For citation: Szalonka K., Światowy G., Witek L. (2016). Health as a determinant of the develop-ment of the organic food market. Acta Sci. Pol., Oeconomia, 15 (3), 115–122.

Oeconomia 15 (3) 2016, 123–133
ISSN 1644-0757eISSN 2450-4602
http://acta_oeconomia.sggw.pl
Corresponding author: Joanna Szwacka-Mokrzycka, Warsaw University of Life Sciences – SGGW, Poland, Department of European Policy, Public Finance and Marketing, Nowoursynowska 166, 02-787 Warszawa, e-mail: [email protected]
© Copyright by Warsaw University of Life Sciences Press, Warsaw 2016
STIMULATORS AND BARRIERS OF DEMAND FOR FOOD (POLISH CASE)
Joanna Szwacka-MokrzyckaWarsaw University of Life Sciences – SGGW
Abstract. The main objective of the paper is to analyse the influence of stimulators and barriers of demand for food in Poland in 2001–2014. The results of econometric and single source analyses constituted the basis for the diagnosis in this respect and determining the level of saturation of food requirements, scale of qualitative transformations related to food consumption and direction of changes related to purchasing preferences under the influ-ence of both economic and non-economic factors. It was concluded that the overall level of economic development and consumers’ disposable income still constitute significant stimulators of demand for food, although it ought to be noted that its developmental trend is associated with the level of saturation and combination of individual preferences. In the case of households with relatively high incomes, the demand for highly processed foods is created above all. The same applies to external demand, including in particular the offer of foods exported onto EU markets.
Key words: food demand, barriers, stimulators, income elasticity, preferences of food con-sumer
INTRODUCTION
The regularities defined by Keynes and Engel, referring to regularities in expending the income and foreseeing changes of general relations in consumption related expen-ditures and savings as well as changes in the expenditure structure, have proven correct for the food market on many occasions. Pursuant to Keynes’ rules, the share of total consumption expenditures in total expenditures decreases along with income growth. Moreover, pursuant to Engel’s rules, the share of food related expenditures decreases along with income growth. Consumption expenditures account for the largest share of
124 J. Szwacka-Mokrzycka
Acta Sci. Pol.
total expenditures and, therefore, understanding the reasons underlying fluctuations in aggregated demand requires an analysis of consumption.
Pursuant to the first theory of consumption proposed by J.M. Keynes [1956], the con-sumption function is characterised with the following three features:
consumption volume is determined exclusively by disposable income. In his analysis, Keynes did not consider the importance of future income or interest rates;the ultimate consumption inclination falls within the (0,1) range – only a part of ad-ditional income unit is dedicated by the consumer to consumption purposes, while the rest is saved;the average consumption inclination decreases along with income growth – wealthy people save a greater share of their income.The first empirical studies (performed on short-term data) suggested that the consump-
tion function proposed by Keynes provided a good reflection of consumers’ behaviours. Further research performed for long-term data demonstrated that the average consump-tion inclination (in the long term) was constant, whereas subsequent studies revealed an insignificant relationship between disposable income and consumption volume. Thus, it turned out that consumption behaves in the manner foreseen by Keynes in the short term only. In order to clarify the discrepancy between the short- and long-term consumption function, economists referred to microeconomic basics – selections made by households in particular periods, while introducing other factors which (next to the income) would allow explaining fluctuations in consumption expenditures.
As opposed to Keynes’ theory, Fisher’s model demonstrates that important factors are not only the current income, but also the amount of future income and real interest rates.
Empirical research shows that consumption is characterised with much lower short--term fluctuations than income. This suggests that, while saving, people shift resources from periods of high income to periods of lower income in order to maintain a relatively constant level of consumption. Basing on Fisher’s model, the lifecycle theory proposed by F. Modigliani assumes that people aim to “smoothen” the consumption level through-out their lifecycle. In particular, they will save during the period of professional activity and finance consumption during the retirement period from the resources they managed to save.
Modigliani’s lifecycle model is supplemented by Friedman’s model, which assumes division of the total income generated by a consumer into a fixed part (permanent, pre-dictable part) and unexpected income (temporary income).
Pursuant to the model’s concept, unexpected income growth does not have signifi-cant influence onto the consumption level, i.e. unexpected income is likely to be saved. In contrast, growth in permanent income translates onto increased consumption. Fried-man argued that consumption is nearly proportionate to permanent income [Świsłowska 2005/2006].
Analyses and tests aimed at verifying correctness of currently dominating theories, i.e. the hypotheses of F. Modigliani and M. Friedman as well as of supplementing works, suggest that the predictive value of those models is frequently low. Indeed, human be-haviours observed seem to deviate from conclusions drawn from approaches based on the model of a rational consumer who optimises the decisions over time.
•
•
•
Stimulators and barriers of demand for food (Polish case) 125
Oeconomia 15 (3) 2016
The present analysis must include the basic principle of behavioural economics, which refers to decision making in the conditions of uncertainty and risk. It suggests that many decisions adopted by people are systematically burdened and the behaviours observed do not correspond with conclusions drawn from the theory of expected utility [Bańbuła 2006]. In the light of Bańbuła’s works, it was demonstrated that predictions of the lifecycle model do not reflect the reality satisfactorily. Consumption is depend-ent on the level of current, not of expected income. Smoothening of consumption is not observed in any period, whether in an annual or lifelong perspective. Thus, it may be concluded that consumption follows the income. The proportionality hypothesis turns out to be untrue as well – the rate of savings depends on the individual’s wealth. Upon retirement, people’s savings are too low, which causes a consumption decrease. Inter-estingly enough, even though the consumption level could be higher at that time, this is not the case. People who end their professional activity do not reduce their savings; in fact, they do the opposite. The motive of decrease cannot explain that phenomenon. The motive of caution does appear, but concerns a relatively narrow group of indi-viduals. Inconsistence between conclusions from the lifecycle model and the observed phenomena is, above all, due to adoption of unrealistic assumptions concerning peo-ple’s behaviours and decision making processes. The normative approach presented in the lifecycle model assumes complete reasonability of entities, their long-sightedness and optimisation driven character of their actions. Yet, rich literature on behaviourism, numerous papers, research projects or simple observation of reality proves this is not the case. People have serious problems with decoding probabilities, with many of their judgements being materially and systematically burdened. They also find it difficult to resolve complex optimisation related issues. In their actions, they often turn out to be short-sighted and their preferences are not constant over time. Dynamic inconsist-ence of preferences means problems with self-control, which seriously hinders effec-tive accomplishment of long-term plans. In confrontation with problems containing an element or risk, people frequently act differently than the theory of expected utility foresees. Inclusion of some of those observations only into the Behavioural Lifecycle Hypothesis (BLCH) allowed a simple and clear explanation of numerous anomalies observed by researches using the lifecycle model methodology.
From the perspective of the analysis covered by this paper, reference to empirical verification of Engel’s rule is of importance. This occurred over years within works con-ducted by numerous researchers [Szwacka-Salmonowicz and Zielińska 1996, Szwacka--Mokrzycka 2013, Kwasek 2015]. Research pursued over years confirmed Engel’s regu-larity assuming a falling share of expenditures on food along with growth in consumers’ incomes.
MATERIAL AND METHODS
In the present paper, the basis for diagnosing the demand segment were the results of econometric and single source (Target Group Index) surveys. Information for conducting the econometric analysis was provided by investigations into household budgets, con-ducted by the Central Statistical Office (GUS) over 2001–2014. The basis for diagnosing
126 J. Szwacka-Mokrzycka
Acta Sci. Pol.
changes occurring in food consumers’ behaviour patterns and evaluating changes in their preference distribution were the results of single source (TGI) surveys. The TGI survey is performed by the Research Institute of Millward Brown Company and is the only continuous project carried out in Poland on a sample of n = 36 000 respondents surveyed on an annual basis since January 1998. The surveys covers respondents aged 15–75 and allows collecting data on approximately 400 product categories, over 4,000 brands and includes information on consumers’ lifestyles. The data from TGI allows performance of multidimensional analyses of the consumer market. The surveys allows positioning of an existing brand, identification of its users’ behaviours, type of user or consumption as well as a detailed overview of consumers and market segments.
Results presented in the article constitute continuation of the author’s research con-ducted in the 1990s. Moreover, the paper presents results of an econometric analysis based on the works of other authors.
STIMULATORS AND BARRIERS OF DEMAND FOR FOOD
The paper focuses on factors which stimulated or hindered the demand for food over the analysed period. The stimulators of demand for food in years 2007–2014 in Poland include the level of the country’s economic development, incomes and product prices, ex-ports and marketing instruments. One ought to emphasise that the above factors may both stimulate and hinder the development of demand, depending on the country’s economic condition and level of consumers’ awareness.
In 2007–2014, Poland experienced diversified conditions in terms of creating con-sumer demand, including the demand for food. The global crisis of 2008 and 2009 had negative impact onto the economic condition of the European Union’s states. Poland, too, experienced a slowdown of GDP dynamics, even though in 2009 it was still on a positive level of 1.6%. To compare, other European Union states did not manage to stop the falling trend. In the subsequent years of 2010–2011, GDP growth dynamics in the countries of the European Union remained on the level of 1.8 and 1.3, whereas Poland was much above that level. The figures calculated for years 2010 and 2011 were, respectively 3.8 and 3.9% [Szwacka-Mokrzycka 2015]. This was caused by no-ticeably weakened negative consequences of the economic crisis in Poland, which oc-curred in 2010 as a result of increased economic activity. However, the following years saw a slowdown of GDP dynamics in Poland as a consequence of economic recession which fell on the first half of 2013. The following year 2014 shows considerable im-provement in the economic condition of all EU member states, yet characterised with significant differentiation in terms of GDP growth indices as compared with 2013. In 2014, Poland was among the countries with a relatively high level of growth, i.e. by 3.4% as compared with the preceding year.
The macroeconomic measure reflecting the population’s standard of living is the gross disposable income per 1 inhabitant in the sector of households. Disposable in-come is allocated to financing consumption and savings. The amount of income is calculated based on the purchasing power parity of the population and expressed in the universal conceptual currency of PPS (Purchasing Power Standard). The analyses
Stimulators and barriers of demand for food (Polish case) 127
Oeconomia 15 (3) 2016
conducted demonstrated that, in 2007, the highest disposable income in the sector of households per 1 resident was that of highly developed EU states. In those countries, incomes were much above the EU-28 average (by 10 up to 24%), whereas real dispos-able income in Polish households in 2007 was lower than the EU-28 average by 45%. In 2007, much lower incomes than in Poland were recorded in Bulgaria and Romania. The situation changed dramatically in 2013, when the distance between Poland and EU-28 was reduced to 31%. That was accompanied by improvement of the condition of households in Bulgaria and Romania, where the share of the population’s disposable incomes was, respectively 44 and 43%. One ought to note that in 2013, as compared with 2007, real disposable income per 1 resident increased in most of EU’s countries. On the other hand, the rate of real income growth in particular countries was highly di-versified. The highest growth dynamics was recorded in post-communist countries, i.e. in Poland, Lithuania, Bulgaria, Romania and Estonia. Other countries of the block in question remained on a stable level. The most developed EU countries also experienced significant growth in real incomes. One should also emphasise that the global financial crisis had major impact onto development of the population’s incomes in 2010. In the pre-crisis period, i.e. between 2007 and 2010, considerable growth in gross incomes was recorded in EU-27 (by over 2.5%). In that period, the highest increase in real in-come was recorded in Poland (by 12.4%).
From the point of view of the conducted analysis, detailed information comes from surveys into the household budgets in Poland, conducted in division into household types. The research suggests explicitly that stratification of households’ incomes was decreasing over 2011–2014. On the other hand, the trend related to generation of relatively highest incomes as compared with the average disposable income by households of persons con-ducting their own businesses, as well as above-average incomes of retired persons and pensioners and of employed persons’ households is maintained. The relatively lowest level of disposable income occurs in the case of farmers’ households. Decreasing strati-fication of households’ incomes is confirmed by the falling Gini’s index: in 2011–2013 by 0.012, from 0.338 to 0.326 in 2014, which shows an explicit trend related to falling diversification of households’ incomes per person [Household budgets 2015].
Thus, it may be concluded that incomes stimulated the development of demand over the analysed period.
In the general perspective, it ought to be assumed that, with respect to food, Engel’s rule was confirmed as correct. Obviously, this related to average income, whereas the analysis conducted in various income groups indicates strong influence of that factor on stimulation of demand for food in the poorest households.
The price is another factor influencing changes with respect to the level and structure of demand for food. It is the price that determines the real value and purchasing power of the income. In 2009–2014, the prices of food and non-alcoholic beverages were grow-ing faster than general prices of goods and services. The share of food expenditures in total consumption expenditures decreased over the analysed period, which resulted from growth in salaries allowing maintenance of economic availability of food on a stable lev-el. As compared with 2013, 2014 saw a decrease in the prices of food and non-alcoholic beverages by 0.9%, along with increase in the average real gross monthly salary by 3.4% [Statistical annals of the Central Statistical Office 2015].
128 J. Szwacka-Mokrzycka
Acta Sci. Pol.
Considering the role of exports in stimulating the demand for food, one ought to state that – beginning in 2014, as a result of the imposed embargo – exports onto the Russian market (mainly fruit, vegetables and dairy products) have been reduced. Development of exports onto non-EU markets, including in particular those of the Middle East, North Africa, East and South Asia, is an important opportunity to stimulate the demand. Obvi-ously, conquering those sales markets is a major challenge before Polish producers, with the domestic and EU markets still playing a dominant role in shaping the demand.
As far as the impact of non-economic factors onto the demand for food is concerned, marketing factors are of considerable importance. Among these, particular attention ought to be paid to product brand and promotion. Research into the influence of reputa-tion of the food brand on building purchasing loyalty clearly shows that the dependence became deeper during the first decade of the 21st century. That was shown on the example of industries characterised with a varied level of concentration, i.e. dairy and fat produc-tion segments [Szwacka-Mokrzycka 2013]. In subsequent years, in the light of research focused on the same segments of the food industry, a shift of that trends towards building a strong connotation of the brand with the product price was demonstrated.
LEVEL OF FOOD REQUIREMENTS SATISFACTION IN POLAND
From the research conducted by numerous authors into the level of satisfaction of food related requirements in Poland it can be concluded that the level of saturation of those needs increased considerably over 2001–2014. Such conclusions may be drawn both on the basis of econometric research [Szwacka-Salmonowicz 2003, Kwasek 2008, 2012, 2015], and single source research [Szwacka-Mokrzycka 2013, SMG/KRC 2016].
Even though the income and prices continue to determine the level and structure of food consumption in Poland, a considerable decrease of the share of consumers’ spending on food must be noted in 2007–2014 within the total volume of household expenditures, from 32% in 2007 to 24.4% in 2014 [Household budgets 2015]. The results related to in-come flexibility of demand confirm considerable influence of income onto development of the level and structure of food consumption.
While evaluating the degree of satisfaction of requirements for food in 2014 in com-parison with 2001, one needs to note clear reduction of income flexibility indices with respect to food consumption, which occurred over the analysed period. As compared with 2001, 2014 saw a significant reduction of food consumption flexibility in all groups (of luxury products, standard and basic products), although the degree of decrease is varied. Relatively, the greatest reduction of indices over the analysed period occurred in the con-sumption group connected with satisfaction of basic needs. In particular, this concerns such products as rice or eggs (reduction of the income related consumption flexibility index from 0.410 in 2001 to 0.150 in 2014 – in the case of rice, and from 0.260 to 0.110 – for eggs). For bread and potatoes, negative flexibility indices were obtained in years 2004–2014, which proves a high level of demand saturation with these products. At the same time, many products were shifted from the second group (standard products) to the third group (basic products). Such products include: vegetables and processed vegetable products, fruit and processed fruit products, juices, fish and processed fish products, yo-

Stimulators and barriers of demand for food (Polish case) 129
Oeconomia 15 (3) 2016
ghurt, butter, cheese and meat in general. With respect to the above products, the shift to the third group was even connected with a 2–3-fold reduction of the demand flexibility indices (Table). Beef is the only product that occupies a permanent position in the group of luxury products in recent years, which is evidenced by the high level of income related flexibility index for beef consumption at 0.985 (nearly 1.5-fold increase in the consump-tion flexibility index over 2001–2014).
The regularity observed reflects ongoing transformation of food requirements over the analysed period. Moreover, it evidences growing satisfaction of food related needs over the first and second decades of the 21st century.
Another change trend, observed in the comparative analysis of needs in 2014 in com-parison with 2001, is the scale of qualitative transformations with respect to consumption of food. The comparative analysis of needs in 2014 in comparison with 2001 revealed that, with respect to products located within groups one and two (i.e. luxury and stand-ard products), the positon of quality is already well established and, therefore, the scale of changes is much smaller than in the group of products which satisfy basic needs. Moreover, the analysis of changes in the area of food related needs demonstrated that qualitative transformations are highly the result of substitution processes among the food product groups and within those groups. Ongoing substitution is reflected in the shift of many products from group I (luxury products) to group II (standard products), as well as transfer of many items from group II to group III – of basic products. The econometric analysis proved that this concerned, above all, such products as fish and processed fish products, cakes and fresh fruit, which were perceived as luxury products still in the 1990s. Intensification of the substitution processes may also be evidenced by the shift of certain products from group II to group III, as well as regrouping of certain categories within the groups, which concerns above all such products as meat, cheese, dairy products for which the substitution effect became clearly visible over the analysed period (Table).
Summing up the above analyses, one ought to add that the performed analysis of transformations regarding food requirements of Polish households demonstrated a certain continuation of the trends evidenced in previous research [Szwacka-Salmonowicz and Zielińska 1996, Szwacka-Salmonowicz 2003, Kwasek 2008, 2012]. The analysed period of 2001–2014 saw clear dynamic growth with respect to transformations related to growth in food related needs saturation, qualitative transformations and substitution processes.
An important element supplementing the conducted analysis is the presented evalua-tion of food requirements satisfaction (with respect to selected categories of the market of dairy and fat products) and evaluation of consumers’ purchasing preferences in the light of single source data (TGI). The following analytical aspects were considered:
analysis of trends in the consumption of product categories selected for the research;distribution of purchasing preferences in terms of prices and quality (product brand) – based on evaluation of the level of price and qualitative indices [Szwacka-Mokrzy-cka 2013, SMG/KRC 2016].In order to determine purchasing preferences of the buyers of dairy products and veg-
etal fats, the analysis was performed on the basis of:percentage share of consumption of the given brand towards all consumed products of the given category;level of the buyer’s brand and product price orientation.
••
•
•
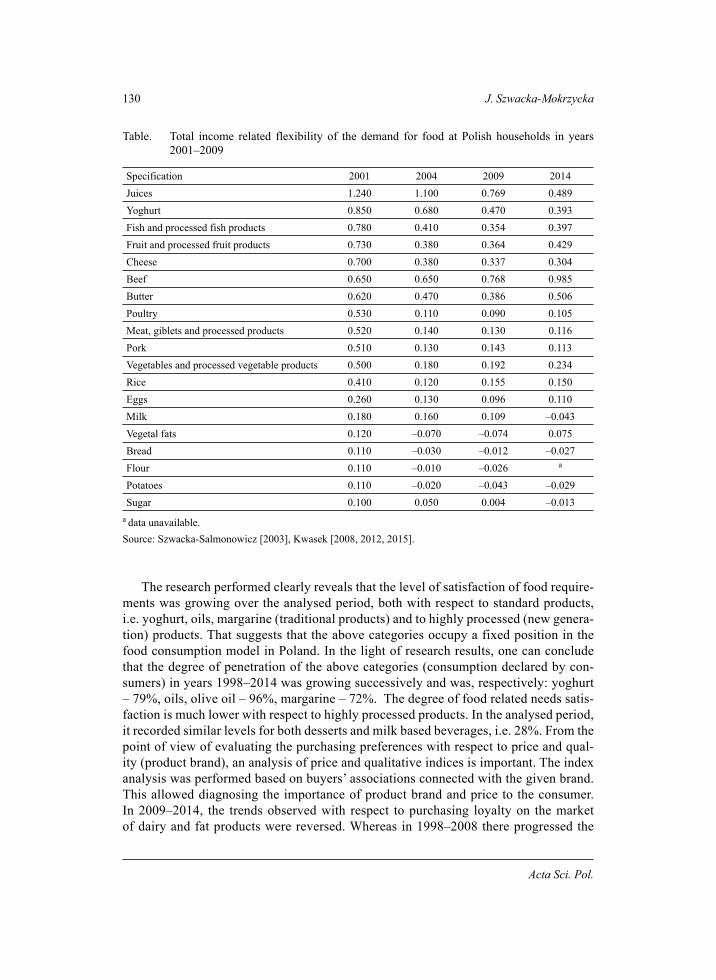
130 J. Szwacka-Mokrzycka
Acta Sci. Pol.
The research performed clearly reveals that the level of satisfaction of food require-ments was growing over the analysed period, both with respect to standard products, i.e. yoghurt, oils, margarine (traditional products) and to highly processed (new genera-tion) products. That suggests that the above categories occupy a fixed position in the food consumption model in Poland. In the light of research results, one can conclude that the degree of penetration of the above categories (consumption declared by con-sumers) in years 1998–2014 was growing successively and was, respectively: yoghurt – 79%, oils, olive oil – 96%, margarine – 72%. The degree of food related needs satis-faction is much lower with respect to highly processed products. In the analysed period, it recorded similar levels for both desserts and milk based beverages, i.e. 28%. From the point of view of evaluating the purchasing preferences with respect to price and qual-ity (product brand), an analysis of price and qualitative indices is important. The index analysis was performed based on buyers’ associations connected with the given brand. This allowed diagnosing the importance of product brand and price to the consumer. In 2009–2014, the trends observed with respect to purchasing loyalty on the market of dairy and fat products were reversed. Whereas in 1998–2008 there progressed the
Table. Total income related flexibility of the demand for food at Polish households in years 2001–2009
Specification 2001 2004 2009 2014Juices 1.240 1.100 0.769 0.489Yoghurt 0.850 0.680 0.470 0.393Fish and processed fish products 0.780 0.410 0.354 0.397Fruit and processed fruit products 0.730 0.380 0.364 0.429Cheese 0.700 0.380 0.337 0.304Beef 0.650 0.650 0.768 0.985Butter 0.620 0.470 0.386 0.506Poultry 0.530 0.110 0.090 0.105Meat, giblets and processed products 0.520 0.140 0.130 0.116Pork 0.510 0.130 0.143 0.113Vegetables and processed vegetable products 0.500 0.180 0.192 0.234Rice 0.410 0.120 0.155 0.150Eggs 0.260 0.130 0.096 0.110Milk 0.180 0.160 0.109 –0.043Vegetal fats 0.120 –0.070 –0.074 0.075Bread 0.110 –0.030 –0.012 –0.027Flour 0.110 –0.010 –0.026 a
Potatoes 0.110 –0.020 –0.043 –0.029Sugar 0.100 0.050 0.004 –0.013
a data unavailable.Source: Szwacka-Salmonowicz [2003], Kwasek [2008, 2012, 2015].
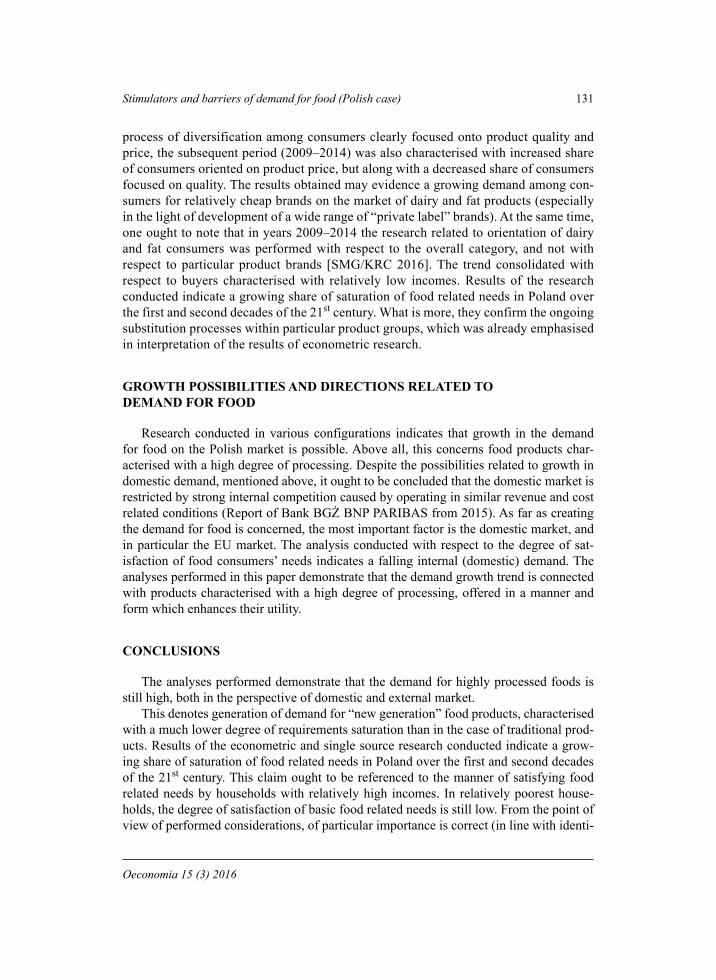
Stimulators and barriers of demand for food (Polish case) 131
Oeconomia 15 (3) 2016
process of diversification among consumers clearly focused onto product quality and price, the subsequent period (2009–2014) was also characterised with increased share of consumers oriented on product price, but along with a decreased share of consumers focused on quality. The results obtained may evidence a growing demand among con-sumers for relatively cheap brands on the market of dairy and fat products (especially in the light of development of a wide range of “private label” brands). At the same time, one ought to note that in years 2009–2014 the research related to orientation of dairy and fat consumers was performed with respect to the overall category, and not with respect to particular product brands [SMG/KRC 2016]. The trend consolidated with respect to buyers characterised with relatively low incomes. Results of the research conducted indicate a growing share of saturation of food related needs in Poland over the first and second decades of the 21st century. What is more, they confirm the ongoing substitution processes within particular product groups, which was already emphasised in interpretation of the results of econometric research.
GROWTH POSSIBILITIES AND DIRECTIONS RELATED TO DEMAND FOR FOOD
Research conducted in various configurations indicates that growth in the demand for food on the Polish market is possible. Above all, this concerns food products char-acterised with a high degree of processing. Despite the possibilities related to growth in domestic demand, mentioned above, it ought to be concluded that the domestic market is restricted by strong internal competition caused by operating in similar revenue and cost related conditions (Report of Bank BGŻ BNP PARIBAS from 2015). As far as creating the demand for food is concerned, the most important factor is the domestic market, and in particular the EU market. The analysis conducted with respect to the degree of sat-isfaction of food consumers’ needs indicates a falling internal (domestic) demand. The analyses performed in this paper demonstrate that the demand growth trend is connected with products characterised with a high degree of processing, offered in a manner and form which enhances their utility.
CONCLUSIONS
The analyses performed demonstrate that the demand for highly processed foods is still high, both in the perspective of domestic and external market.
This denotes generation of demand for “new generation” food products, characterised with a much lower degree of requirements saturation than in the case of traditional prod-ucts. Results of the econometric and single source research conducted indicate a grow-ing share of saturation of food related needs in Poland over the first and second decades of the 21st century. This claim ought to be referenced to the manner of satisfying food related needs by households with relatively high incomes. In relatively poorest house-holds, the degree of satisfaction of basic food related needs is still low. From the point of view of performed considerations, of particular importance is correct (in line with identi-
132 J. Szwacka-Mokrzycka
Acta Sci. Pol.
fied market trends) decoding of changes occurring within consumer behaviour patterns. A correct response to those changes ought to involve profiling of the offer in compliance with food buyers’ expectations. These problems become particularly topical in the condi-tions of shrinking domestic demand and limited possibilities related to creation thereof on the broad EU market and in Eastern European countries.
REFERENCES
Bańbuła, P. (2006). Oszczędności i wybór międzyokresowy – podejście behawioralne. Materiały i Studia 208. NBP, Warszawa.
Budżety gospodarstw domowych [Household budgets]. (2015). Wydawnictwo GUS, Warszawa.Keynes, J.M. (1956). Ogólna teoria zatrudnienia, procentu i pieniądza. Warsaw.Kwasek, M. (2008). Dochodowa elastyczność popytu w Polsce. Wiadomości Statystyczne. Kwasek, M. (2012). Wzorce konsumpcji żywności w Polsce. Studia i Monografie. IERiGŻ,
Warszawa.Kwasek, M. (Ed.) (2015). Z badań nad rolnictwem społecznie zrównoważonym. Analiza
bezpieczeństwa żywnościowego Polski. Monografie Programu Wieloletniego 19, Warszawa.
Rocznik statystyczny GUS [Statistical annals of the Central Statistical Office] (2015). Wydawnict-wo GUS, Warszawa.
SMG/KRC. (2016). A Millward Brown Company, Warsaw.Szwacka-Mokrzycka, J. (2013). Tendencje rozwojowe popytu i podaży żywności w Polsce.
Wydawnictwo SGGW, Warszawa.Szwacka-Mokrzycka, J. (2015). The standard of living of households in Poland compared to other
EU member states. Journal of Advances in Agriculture 20.Szwacka-Salmonowicz, J., Zielińska, Z. (1996). Hierarchia potrzeb żywnościowych w 1993 roku
na tle 1986 roku. IRWiR PAN, Warszawa.Szwacka-Salmonowicz, J. (2003). Zmiany zachowań nabywców jako determinanta kształtowania
strategii segmentacyjnych przedsiębiorstw przemysłu spożywczego w Polsce. Wydaw-nictwo SGGW, Warszawa.
Świsłowska, D. (2005/2006). Konsumpcja. Retrieved from coin.wne.edu.pl/apugacewicz/kon-sumpcja.pdf.
Wpływ ograniczeń handlowych wprowadzonych przez Rosję na sektor rolno-spożywczy w Polsce (2015). Report Bank. BGŻ BNP PARIBAS, Warszawa.
STYMULATORY I BARIERY POPYTU NA ŻYWNOŚĆ (STUDIUM POLSKIE)
Streszczenie. Celem przewodnim artykułu jest prześledzenie wpływu czynników stymulujących bądź ograniczających popyt na produkty żywnościowe w Polsce w latach 2001–2014. Podstawę do diagnozowania w tym zakresie stanowiły wyniki badań ekonom-etrycznych oraz jednoźródłowych. Na ich podstawie ustalono poziom nasycenia potrzeb żywnościowych, skalę przemian jakościowych w spożyciu żywności oraz kierunek zmian preferencji nabywczych pod wpływem zarówno czynników ekonomicznych, jak i pozaekonomicznych. Stwierdzono, że ogólny poziom rozwoju gospodarczego i dochody rozporządzalne konsumentów stanowią wciąż istotny stymulator popytu na żywność, choć należy zauważyć, że tendencja jego rozwoju jest związana z poziomem jego nasycenia i układem indywidualnych preferencji. W gospodarstwach o relatywnie wysokich docho-

Stimulators and barriers of demand for food (Polish case) 133
Oeconomia 15 (3) 2016
dach popyt jest kreowany przede wszystkim na produkty żywnościowe o wysokim stop-niu przetworzenia. Dotyczy to również popytu zewnętrznego, a w szczególności oferty żywnościowej eksportowane na rynki UE.
Słowa kluczowe: popyt na żywność, bariery, stymulatory, dochodowa elastyczność, pref-erencje konsumentów
Accepted for print: 02.09.2016
For citation: Szwacka-Mokrzycka J. (2016). Stimulators and barriers of demand for food (Polish case). Acta Sci. Pol., Oeconomia, 15 (3), 123–133.


Oeconomia 15 (3) 2016, 135–144
ISSN 1644-0757eISSN 2450-4602
http://acta_oeconomia.sggw.pl
Corresponding author: Elżbieta Wolanin-Jarosz, Bronisław Markiewicz State Higher School of Technology and Economics in Jarosław, Institute of Economics and Management, Św. Roch 27, 35-330 Rzeszów, Poland, e-mail: [email protected]
© Copyright by Warsaw University of Life Sciences Press, Warsaw 2016
THE ANALYSIS OF GLOBAL BRANDS – A COMPARATIVE STUDY POLAND – SLOVAKIA – HUNGARY
Elżbieta Wolanin-Jarosz Bronisław Markiewicz State Higher School of Technology and Economics in Jarosław
Abstract. The empirical research results, which aim was to define the degree of awareness of the leading global brands, have been presented in the following article. The fundamental research material has been acquired thanks to direct interviews done in three cities: Rzeszów (Poland), Debrecen (Hungary) and Kosice (Slovakia), on the sample of 1,200 respondents (adult inhabitants). The survey questionnaire, elaborated by the author of this article, has been used as a measuring tool. The research period was from 2012 to 2013 year.The achieved research results indicate that the most popular food products brands are Swiss chocolate Milka, French yoghurt Danone and Italian wine Martini. In turn, according to the respondents, the most recognizable non-food products brands are: American clothes and Nike sports shoes, Finnish mobile phones Nokia, Czech Škoda cars and Italian clothes and perfumes Giorgio Armani.
Key words: brand awareness, consumer, direct research, Polish, Slovakian and Hungarian respondents
INTRODUCTION
Shaping a strong brand is a key element of the marketing strategy of every enterprise. A well-known brand, however, is perceived by a prism of emotional and rational benefits, offered to the customers. It increases’ value of a product for the customers. A strong brand is, in the opinion of the customers, a symbol of a high quality of a given good, its strong market position and prestige [Steenkamp 2014].
It is worth to stress the fact that from the point of view of a company, a stable and strong brand means customers’ loyalty, what comes after that, the increase in sales and
136 E. Wolanin-Jarosz
Acta Sci. Pol.
profits of the company. A decisive factor about loyal behaviour of the customers towards a given product is, among others, “brand awareness”. This term includes ordinary brand recognition as well as complex, cognitive structures, built based on detailed information about it. Brand understanding with its most essential element such as brand awareness is a very important factor, which conditions making final purchasing decision by consum-ers. That is why the companies are at constant “war on brands” – which is a psychological fight about “a place in customers’ minds”.
In the present elaboration, the empirical research results have been shown. Their aim was to define a degree of the leading global brands awareness. The research has been done among consumers, who live on the territory of the three countries, which belong to the Carpathian Euroregion – Poland, Slovakia, Hungary.
THE BRAND AWARENESS – THE ESSENCE AND RANGE OF THE TERM
In the marketing literature, a product brand is not unambiguously defined category. It is most often called as “name, symbol, pattern or combination of these elements, given in order to mark a product (or service) and to differentiate it from the offer of the competi-tors” [Kotler et al. 2002].
The brand has characteristic attributes, which create the capital. From the marketing point of view, the brand equity is responsible for how a brand is evaluated and perceived by the customers – “what does a brand mean for customers” [Dębski 2009]. Among the elements, which create its capital, the following can be distinguished: perceived brand quality, loyalty towards a brand, awareness of the brand existence, brand associations and other assets (patents, trademarks, etc.) [Urbanek 2002].
In the present article, a particular attention has been paid to the brand awareness, understood as the ability of a potential buyer to recognize the brand and associate it with a certain product category. The brand awareness is a foundation, a starting point for fur-ther activities connected to brand creation – building its personality, image, meeting the purchasers with the benefits offered by the brand [Kędzior 2003].
The brand awareness plays a crucial role in the purchasing decision making process by a consumer. This strategy allows customers to save time and effort, while making buying choices. In case of lack of this strategy, they would spend more time comparing certain goods by paying additional attention to other attributes [Stawecki 2015]. The category – awareness of the brand existence in the consumers’ minds can be interpreted as certain cognitive simplification. Purchasing decisions are made by referring to such simplification, especially when a product is cheap and quickly marketable [Özsomer 2012].
The usage of the brand awareness is a decision making tactics when a product is bought for the first time. When another purchasing decision is made, usable product at-tributes are important for a customer: quality, functionality, taste or smell, especially, when products differ significantly among each other by criteria, which have important meaning for them [Urbanek 2010].

The analysis of global brands – a comparative study Poland – Slovakia – Hungary 137
Oeconomia 15 (3) 2016
MATERIAL AND METHODS
As it has already been mentioned, the empirical research results have been presented in this article. Their main aim was to define the level of awareness of the global brand products.
The basic source material has been acquired thanks to the direct interviews conducted in three cities, which belong to the Carpathian Euro region: Rzeszów (Poland), Kosice (Slovakia) and Debrecen (Hungary)1 The interviews were done in the period from De-cember 2011 to June 2012. The research sample included 1,200 respondents (400 people in each city), selected in the quota way Quotas were – gender, age and education. As far as the age criterion is concerned, the respondents were divided into three groups: people aged 15–44, 45–64, 65 and older. In turn, taking education into account, three groups were distinguished among the consumers: one with higher, secondary and post-secondary education, the other two belong to basic and vocational ones. A survey questionnaire was used as a measurement tool. A questionnaire, which included questions subordinated to the research aims, has been used as a measuring tool.
RESULTS ANALYSIS OF GLOBAL BRANDS AWARENESS RESEARCH
In this part of the publication, the direct research results done among the inhabitants of Poland, Slovakia and Hungary have been presented. In the beginning, I would like to compare the two researched groups in relation to the features describing social status of the respondents. Gender, age and education belong to them.
In the Table 1, the level of the respondents diversity has been presented, taking into consideration gender and nationality. It results from the placed data that the women population taking part in the research outnumbered the amount of men with a few per cent, in the all analyzed groups.
Table 1. The Polish, Slovakian and Hungarian respondents structure taking gender into conside-ration
SpecificationPoland Slovakia Hungary
numerousness % numerousness % numerousness %Woman 222 56 207 52 199 52Man 174 44 192 48 183 48Sum 396 100 399 100 382 100
Source: Own elaboration.
1 In Rzeszów the direct interviews have been done by the author of the present work and the chosen to this aim respondents. In Kosice, the initial research has been done by a group of employees and students of the Department of Management of Bratislava University of Economics in Kosice under prof. dr hab. W. Liestkovska direction. In turn, in Debrecen, the empirical material has been col-lected by a team of employees of the consulting company Tö-Vill Kft.
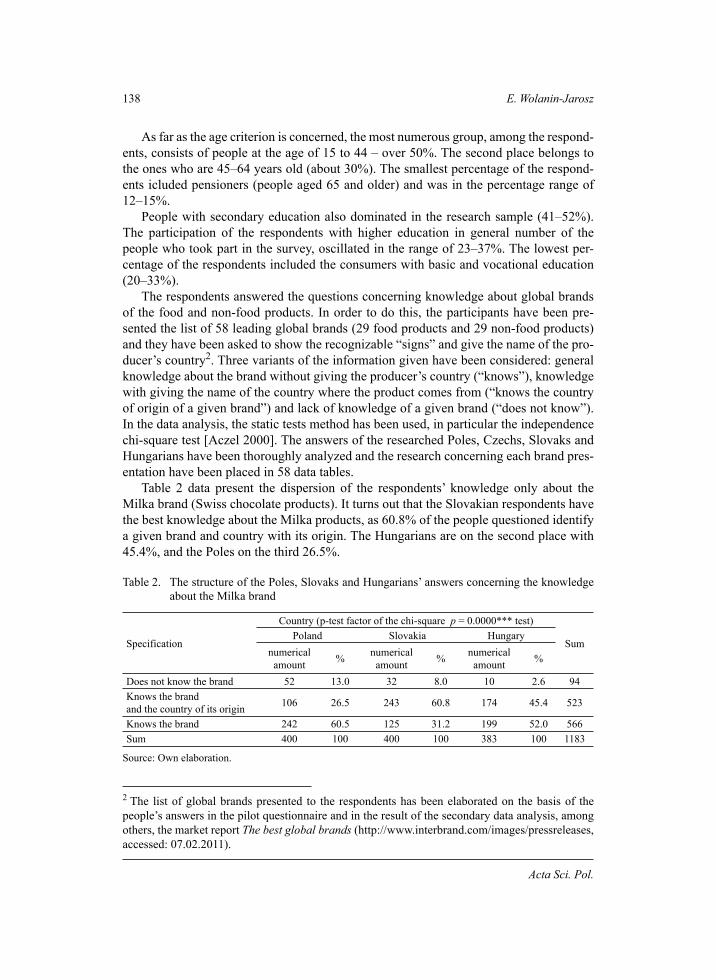
138 E. Wolanin-Jarosz
Acta Sci. Pol.
As far as the age criterion is concerned, the most numerous group, among the respond-ents, consists of people at the age of 15 to 44 – over 50%. The second place belongs to the ones who are 45–64 years old (about 30%). The smallest percentage of the respond-ents icluded pensioners (people aged 65 and older) and was in the percentage range of 12–15%.
People with secondary education also dominated in the research sample (41–52%). The participation of the respondents with higher education in general number of the people who took part in the survey, oscillated in the range of 23–37%. The lowest per-centage of the respondents included the consumers with basic and vocational education (20–33%).
The respondents answered the questions concerning knowledge about global brands of the food and non-food products. In order to do this, the participants have been pre-sented the list of 58 leading global brands (29 food products and 29 non-food products) and they have been asked to show the recognizable “signs” and give the name of the pro-ducer’s country2. Three variants of the information given have been considered: general knowledge about the brand without giving the producer’s country (“knows”), knowledge with giving the name of the country where the product comes from (“knows the country of origin of a given brand”) and lack of knowledge of a given brand (“does not know”). In the data analysis, the static tests method has been used, in particular the independence chi-square test [Aczel 2000]. The answers of the researched Poles, Czechs, Slovaks and Hungarians have been thoroughly analyzed and the research concerning each brand pres-entation have been placed in 58 data tables.
Table 2 data present the dispersion of the respondents’ knowledge only about the Milka brand (Swiss chocolate products). It turns out that the Slovakian respondents have the best knowledge about the Milka products, as 60.8% of the people questioned identify a given brand and country with its origin. The Hungarians are on the second place with 45.4%, and the Poles on the third 26.5%.
Table 2. The structure of the Poles, Slovaks and Hungarians’ answers concerning the knowledge about the Milka brand
Specification
Country (p-test factor of the chi-square p = 0.0000*** test)
SumPoland Slovakia Hungary
numerical amount % numerical
amount % numerical amount %
Does not know the brand 52 13.0 32 8.0 10 2.6 94Knows the brand and the country of its origin 106 26.5 243 60.8 174 45.4 523
Knows the brand 242 60.5 125 31.2 199 52.0 566Sum 400 100 400 100 383 100 1183
Source: Own elaboration.
2 The list of global brands presented to the respondents has been elaborated on the basis of the people’s answers in the pilot questionnaire and in the result of the secondary data analysis, among others, the market report The best global brands (http://www.interbrand.com/images/pressreleases, accessed: 07.02.2011).
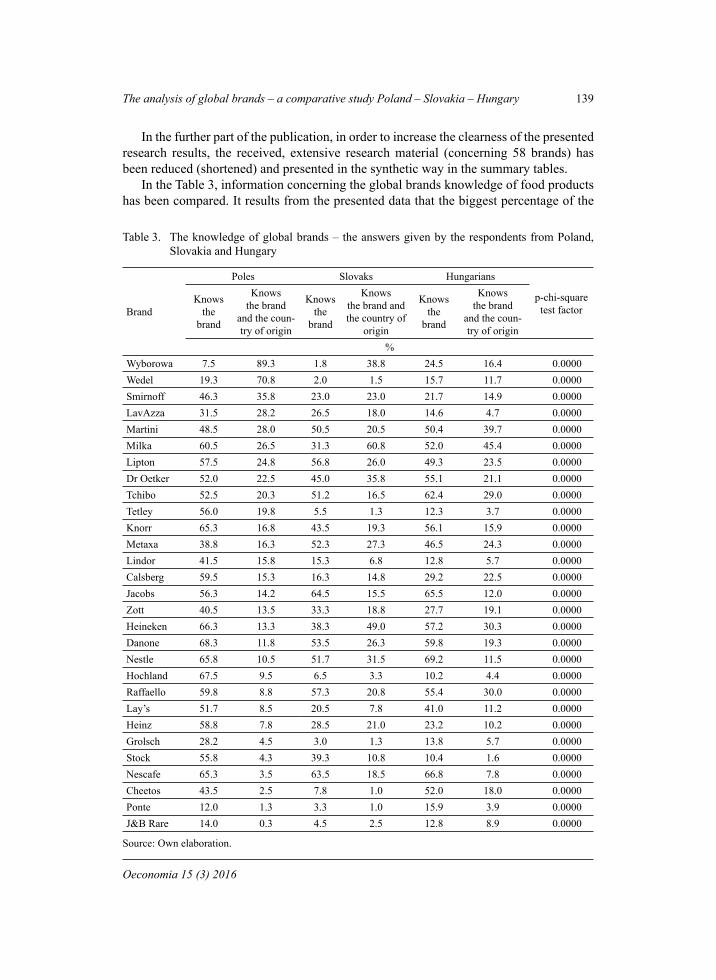
The analysis of global brands – a comparative study Poland – Slovakia – Hungary 139
Oeconomia 15 (3) 2016
In the further part of the publication, in order to increase the clearness of the presented research results, the received, extensive research material (concerning 58 brands) has been reduced (shortened) and presented in the synthetic way in the summary tables.
In the Table 3, information concerning the global brands knowledge of food products has been compared. It results from the presented data that the biggest percentage of the
Table 3. The knowledge of global brands – the answers given by the respondents from Poland, Slovakia and Hungary
Brand
Poles Slovaks Hungarians
p-chi-square test factor
Knows the
brand
Knows the brand
and the coun-try of origin
Knows the
brand
Knows the brand and the country of
origin
Knows the
brand
Knows the brand
and the coun-try of origin
%Wyborowa 7.5 89.3 1.8 38.8 24.5 16.4 0.0000Wedel 19.3 70.8 2.0 1.5 15.7 11.7 0.0000Smirnoff 46.3 35.8 23.0 23.0 21.7 14.9 0.0000LavAzza 31.5 28.2 26.5 18.0 14.6 4.7 0.0000Martini 48.5 28.0 50.5 20.5 50.4 39.7 0.0000Milka 60.5 26.5 31.3 60.8 52.0 45.4 0.0000Lipton 57.5 24.8 56.8 26.0 49.3 23.5 0.0000Dr Oetker 52.0 22.5 45.0 35.8 55.1 21.1 0.0000Tchibo 52.5 20.3 51.2 16.5 62.4 29.0 0.0000Tetley 56.0 19.8 5.5 1.3 12.3 3.7 0.0000Knorr 65.3 16.8 43.5 19.3 56.1 15.9 0.0000Metaxa 38.8 16.3 52.3 27.3 46.5 24.3 0.0000Lindor 41.5 15.8 15.3 6.8 12.8 5.7 0.0000Calsberg 59.5 15.3 16.3 14.8 29.2 22.5 0.0000Jacobs 56.3 14.2 64.5 15.5 65.5 12.0 0.0000Zott 40.5 13.5 33.3 18.8 27.7 19.1 0.0000Heineken 66.3 13.3 38.3 49.0 57.2 30.3 0.0000Danone 68.3 11.8 53.5 26.3 59.8 19.3 0.0000Nestle 65.8 10.5 51.7 31.5 69.2 11.5 0.0000Hochland 67.5 9.5 6.5 3.3 10.2 4.4 0.0000Raffaello 59.8 8.8 57.3 20.8 55.4 30.0 0.0000Lay’s 51.7 8.5 20.5 7.8 41.0 11.2 0.0000Heinz 58.8 7.8 28.5 21.0 23.2 10.2 0.0000Grolsch 28.2 4.5 3.0 1.3 13.8 5.7 0.0000Stock 55.8 4.3 39.3 10.8 10.4 1.6 0.0000Nescafe 65.3 3.5 63.5 18.5 66.8 7.8 0.0000Cheetos 43.5 2.5 7.8 1.0 52.0 18.0 0.0000Ponte 12.0 1.3 3.3 1.0 15.9 3.9 0.0000J&B Rare 14.0 0.3 4.5 2.5 12.8 8.9 0.0000
Source: Own elaboration.
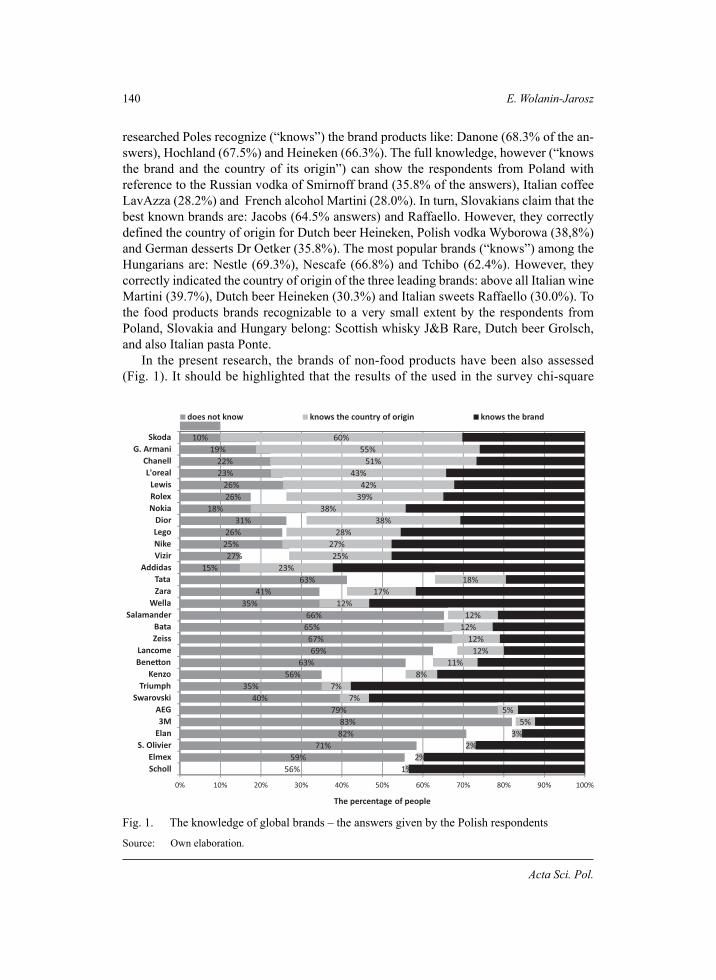
140 E. Wolanin-Jarosz
Acta Sci. Pol.
researched Poles recognize (“knows”) the brand products like: Danone (68.3% of the an-swers), Hochland (67.5%) and Heineken (66.3%). The full knowledge, however (“knows the brand and the country of its origin”) can show the respondents from Poland with reference to the Russian vodka of Smirnoff brand (35.8% of the answers), Italian coffee LavAzza (28.2%) and French alcohol Martini (28.0%). In turn, Slovakians claim that the best known brands are: Jacobs (64.5% answers) and Raffaello. However, they correctly defined the country of origin for Dutch beer Heineken, Polish vodka Wyborowa (38,8%) and German desserts Dr Oetker (35.8%). The most popular brands (“knows”) among the Hungarians are: Nestle (69.3%), Nescafe (66.8%) and Tchibo (62.4%). However, they correctly indicated the country of origin of the three leading brands: above all Italian wine Martini (39.7%), Dutch beer Heineken (30.3%) and Italian sweets Raffaello (30.0%). To the food products brands recognizable to a very small extent by the respondents from Poland, Slovakia and Hungary belong: Scottish whisky J&B Rare, Dutch beer Grolsch, and also Italian pasta Ponte.
In the present research, the brands of non-food products have been also assessed (Fig. 1). It should be highlighted that the results of the used in the survey chi-square
10%19%
22%23%
26%26%
18%31%
26%25%27%
15%63%
41%35%
66%65%67%69%
63%56%
35%40%
79%83%82%
71%59%
56%
60%55%
51%43%
42%39%
38%38%
28%27%25%
23%18%
17%12%
12%12%
12%12%
11%8%
7%7%
5%5%
3%2%
2%1%
30%26%27%
34%32%
35%44%
31%46%
48%48%
62%20%
42%53%
22%23%21%20%
27%37%
58%53%
17%12%
16%27%
40%44%
0% 10% 20% 30% 40% 50% 60% 70% 80% 90% 100%
SkodaG. Armani
ChanellL'oreal
LewisRolexNokia
DiorLegoNikeVizir
AddidasTataZara
WellaSalamander
BataZeiss
LancomeBene�on
KenzoTriumph
SwarovskiAEG3M
ElanS. Olivier
ElmexScholl
The percentage of people
does not know knows the country of origin knows the brand
Fig. 1. The knowledge of global brands – the answers given by the Polish respondents
Source: Own elaboration.
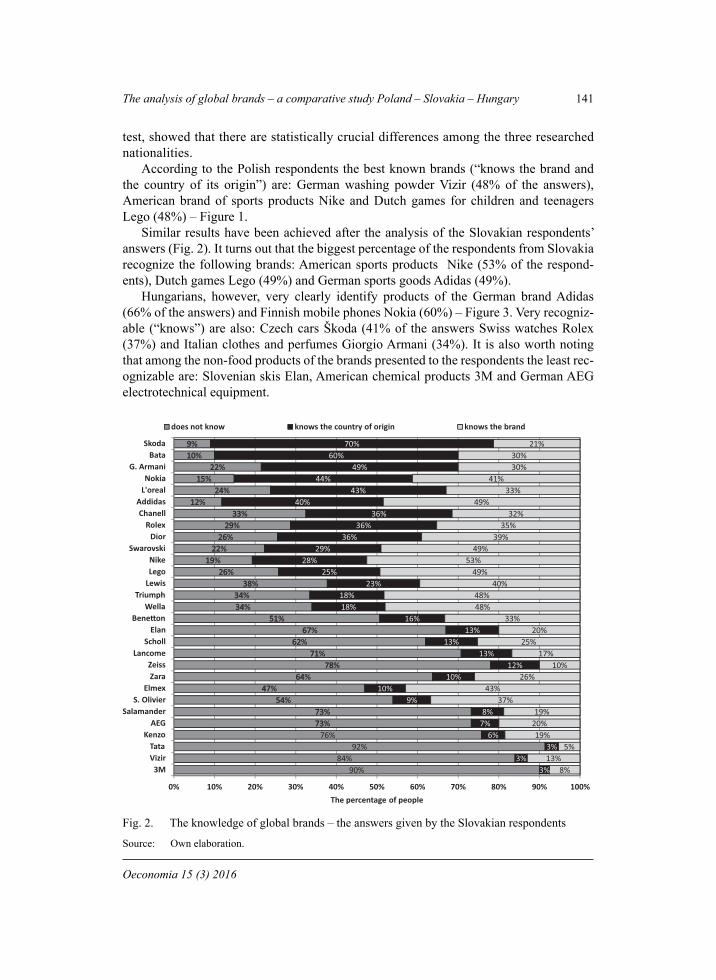
The analysis of global brands – a comparative study Poland – Slovakia – Hungary 141
Oeconomia 15 (3) 2016
test, showed that there are statistically crucial differences among the three researched nationalities.
According to the Polish respondents the best known brands (“knows the brand and the country of its origin”) are: German washing powder Vizir (48% of the answers), American brand of sports products Nike and Dutch games for children and teenagers Lego (48%) – Figure 1.
Similar results have been achieved after the analysis of the Slovakian respondents’ answers (Fig. 2). It turns out that the biggest percentage of the respondents from Slovakia recognize the following brands: American sports products Nike (53% of the respond-ents), Dutch games Lego (49%) and German sports goods Adidas (49%).
Hungarians, however, very clearly identify products of the German brand Adidas (66% of the answers) and Finnish mobile phones Nokia (60%) – Figure 3. Very recogniz-able (“knows”) are also: Czech cars Škoda (41% of the answers Swiss watches Rolex (37%) and Italian clothes and perfumes Giorgio Armani (34%). It is also worth noting that among the non-food products of the brands presented to the respondents the least rec-ognizable are: Slovenian skis Elan, American chemical products 3M and German AEG electrotechnical equipment.
99%1010%
2222%1515%
2424%1212%
3333%2929%
2626%2222%
1919%2626%
3838%3434%3434%
5151%6767%
6262%7171%
7878%6464%
4747%5454%
7373%7373%
76%92%
84%90%
70%60%
49%44%
43%40%
36%36%
36%29%
28%25%
23%18%18%
16%13%
13%13%
12%10%
10%9%
8%7%
6%3%
3%3%
21%30%30%
41%33%
49%32%
35%39%
49%53%
49%40%
48%48%
33%20%
25%17%
10%26%
43%37%
19%20%19%
5%13%
8%
0% 10% 20% 30% 40% 50% 60% 70% 80% 90% 100%
SkodaBata
G. ArmaniNokia
L'orealAddidasChanell
RolexDior
SwarovskiNikeLego
LewisTriumph
WellaBene�on
ElanScholl
LancomeZeissZara
ElmexS. Olivier
SalamanderAEG
KenzoTataVizir
3M
The percentage of people
does not know knows the country of origin knows the brand
Fig. 2. The knowledge of global brands – the answers given by the Slovakian respondents
Source: Own elaboration.
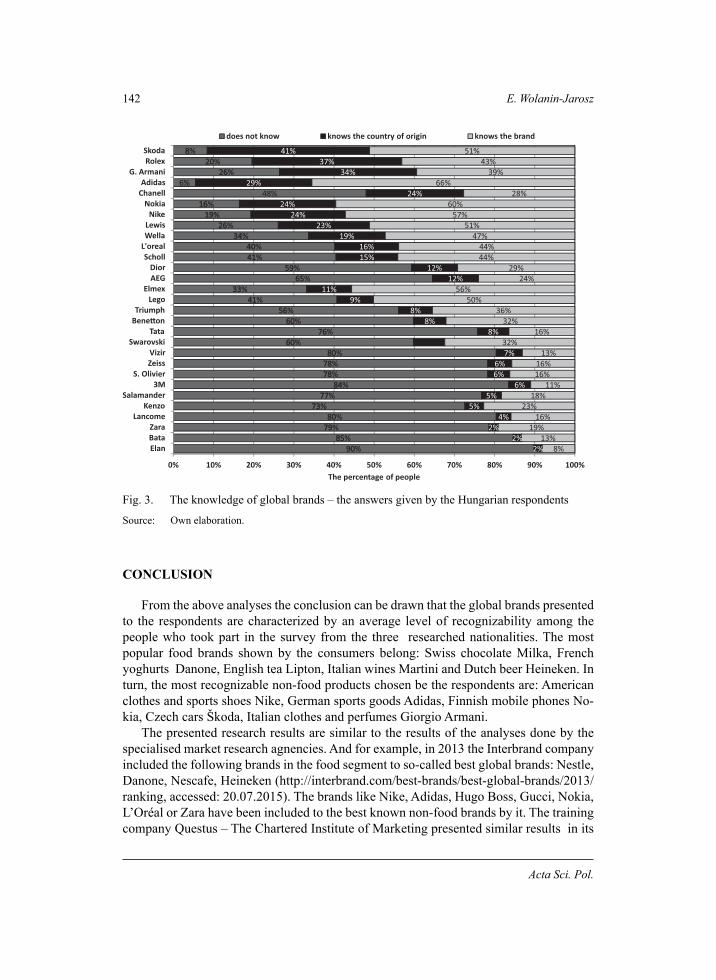
142 E. Wolanin-Jarosz
Acta Sci. Pol.
CONCLUSION
From the above analyses the conclusion can be drawn that the global brands presented to the respondents are characterized by an average level of recognizability among the people who took part in the survey from the three researched nationalities. The most popular food brands shown by the consumers belong: Swiss chocolate Milka, French yoghurts Danone, English tea Lipton, Italian wines Martini and Dutch beer Heineken. In turn, the most recognizable non-food products chosen be the respondents are: American clothes and sports shoes Nike, German sports goods Adidas, Finnish mobile phones No-kia, Czech cars Škoda, Italian clothes and perfumes Giorgio Armani.
The presented research results are similar to the results of the analyses done by the specialised market research agnencies. And for example, in 2013 the Interbrand company included the following brands in the food segment to so-called best global brands: Nestle, Danone, Nescafe, Heineken (http://interbrand.com/best-brands/best-global-brands/2013/ranking, accessed: 20.07.2015). The brands like Nike, Adidas, Hugo Boss, Gucci, Nokia, L’Oréal or Zara have been included to the best known non-food brands by it. The training company Questus – The Chartered Institute of Marketing presented similar results in its
88%2020%
2626%6%
48%1616%
1919%2626%
3434%4040%4141%
5959%6565%
3333%4141%
5656%6060%
7676%6060%
8080%7878%7878%
8484%7777%
7373%8080%
7979%8585%
9090%
41%37%
34%29%
24%24%
24%23%
19%16%15%
12%12%
11%9%
8%8%
8%8%
7%6%6%
6%5%
5%4%
2%2%
2%
51%43%
39%66%
28%60%
57%51%
47%44%44%
29%24%
56%50%
36%32%
16%32%
13%16%16%
11%18%
23%16%
19%13%
8%
0% 10% 20% 30% 40% 50% 60% 70% 80% 90% 100%
SkodaRolex
G. ArmaniAdidas
ChanellNokia
NikeLewisWella
L'orealScholl
DiorAEG
ElmexLego
TriumphBene�on
TataSwarovski
VizirZeiss
S. Olivier3M
SalamanderKenzo
LancomeZaraBataElan
The percentage of people
does not know knows the country of origin knows the brand
Fig. 3. The knowledge of global brands – the answers given by the Hungarian respondents
Source: Own elaboration.
The analysis of global brands – a comparative study Poland – Slovakia – Hungary 143
Oeconomia 15 (3) 2016
report The strongest brands in the world. It was in 2013 (https://questus.pl/globalne-po-tegi-wsrod-marek-dobr-konsumpcyjnych, accessed: 15.06.2015).
It needs to be highlighted at this point again that the brand awareness has a very crucial meaning in purchasing decisions of customers. The brand recognizability – “brand exist-ence in customers’ minds” increases the probability of choosing this and no other brand in the offered set of products. Building brand awareness being the element of a strong brand is therefore a very crucial tool in shaping marketing strategies of the companies [Michal-ski 2015]. Strong brand is success and can become the biggest value of every company in gaining competitive advantage as well as on the domestic and foreign market.
REFERENCES
Aczel, A.D. (2000). Statystyka w zarządzaniu [Statistics in management]. Wyd. Nauk. PWN, War-szawa.
Dębski, M. (2009). Kreowanie silnej marki [Creating strong brand]. PWE, Warszawa. Kędzior, Z. (2003). Konsument na rynku [Consummer on the market]. Postawy wobec produk-
tów [Attitudes towards products]. Centrum Badań i Ekspertyz Akademii Ekonomicznej w Katowicach, Katowice.
Kotler, Ph., Amstrong, G., Saunders, J., Wong, W. (2002). Marketing. Podręcznik Europejski. PWE, Warszawa.
Michalski, E. (2015). Foreign market entry strategy. Acta Scientiarum Polonorum, Oeconomia, 14 (2), 107–117.
Özsomer, A. (2012). The Interplay Beetwen Global and Local Brands. A Closer Look at Percei-ved Brand Globalnees and Local Iconness. Journal of International Marketing. American Marketing Association, 20 (2), 72–95
Stawecki, Ł. (2005). Zarządzanie marką oraz jej architekturą na przykładzie marki Porsche [Brand and its architecture management on the example of Porche brand] Marketing i Rynek, 4, 24–32.
Steenkamp, J.B. (2014). How global brands create firm value: the 4V model. International marke-ting Review, 31(1), 5–29.
Urbanek. G. (2002). Zarządzanie marką [Brand management]. PWE, Warszawa. Urbanek, G. (2010). Wykorzystanie marki w sektorze dostaw energii [The use of brand in the sup-
plying energy sector]. Marketing i Rynek, 10, 54–55.
ANALIZA ŚWIADOMOŚCI MAREK GLOBALNYCH – STUDIUM PORÓWNAWCZE POLSKA – SŁOWACJA – WĘGRY
Streszczenie. W artykule zaprezentowano wyniki badań empirycznych, których celem jest określenie stopnia świadomości wiodących marek globalnych. Zasadniczy materiał badawczy pozyskano dzięki wywiadom bezpośrednim przeprowadzonych w trzech miastach: Rzeszowie (Polska), Debreczynie (Węgry) i Koszycach (Słowacja), na próbie 1200 respondentów (dorosłych mieszkańców). Jako instrument pomiarowy wykorzystano kwestionariusz wywiadu, opracowany przez autorkę artykułu. Okresem badawczym były lata 2012–2013.Otrzymane wyniki badań wskazują, iż najbardziej popularnymi markowymi produktami żywnościowymi okazały się: szwajcarskie czekolady Milka, francuskie jogurty Danone czy
144 E. Wolanin-Jarosz
Acta Sci. Pol.
włoskie wina Martini. Z kolei za najbardziej znane markowe produkty nieżywnościowe uczestnicy badania uznali: amerykańską odzież i obuwie sportowe Nike, fińskie telefony komórkowe Nokia, czeskie samochody Škoda oraz włoską odzież i perfumy Giorgio Armani.
Słowa kluczowe: świadomość marki, konsument, badania bezpośrednie, respondenci pol-scy, słowaccy i węgierscy
Accepted for print: 21.07.2016
For citation: Wolanin-Jarosz E. (2016). The analysis of global brands – a comparative study Poland – Slovakia – Hungary. Acta Sci. Pol., Oeconomia, 15 (3), 135–144.
Oeconomia 15 (3) 2016, 145–154
ISSN 1644-0757eISSN 2450-4602
http://acta_oeconomia.sggw.pl
Corresponding author: Alina Źróbek-Różańska, University of Warmia and Mazury in Olsztyn, Faculty of Economics, Department of Economic and Regional Policy, Oczapowskiego 4, 10-719 Olsztyn, Poland, e-mail: [email protected]
© Copyright by Warsaw University of Life Sciences Press, Warsaw 2016
STUDIES OVER CHARACTERISTICS SHAPING RESIDENTIAL ATTRACTIVENESS OF SUBURBAN RURAL AREAS
Alina Źróbek-Różańska, Elżbieta Zysk, Anna Źróbek-SokolnikUniversity of Warmia and Mazury in Olsztyn
Abstract. Nearly every third migrating person in Poland is found to have moved out of the city and into a rural area near big cities. Local authorities should analyze governed area in the terms of residential attractiveness and identify the most attractive localizations prone to residential development concentration. The aim of the article was to apply the weighted additive rule to identify the most attractive areas. It required creating the potential newcomer’s profile and the list of demanded characteristics equipped with weights. It ap-peared that potential newcomers would be people in their 25–40 with small children, with the ability to achieve mortgage credit, higher education and strong links with neighboring city. The strongest impact on their decision would have low price of real estate, lack of bur-densome objects, full access to media and neat surroundings. The scarcity of some charac-teristics can be compensated by the high quality of the others, and the level of compensation depends on the prescribed weights.
Key words: suburbanization, rural areas, residential attractiveness
INTRODUCTION
According to the United Nations, our planet has gone through a process of rapid urba-nization over the past six decades. In 2014, over half of the world’s population (54%) li-ved in urban areas. The urbanization trend continues to this day, and the urban population is expected to continue to grow. It is predicted that, by 2050, this percentage will have risen to 66% [UN DESA 2014]. The 2014 revision of World Urbanization Prospects by UN DESA’s Population Division notes that the largest urban growth is expected to take place in India, China and Nigeria. In the case of Europe, North America and Oceania, the
146 A. Źróbek-Różańska, E. Zysk, A. Źróbek-Sokolnik
Acta Sci. Pol.
urbanization process will be rather stable, with the urbanization rate slowly increasing. At the same time, modern cities take the form of traditionally concentrated centers less and less frequently. The administrative borders of cities become too tight for urban pe-ople, who seek larger areas of space in order to increase their comfort of living. On the other hand, the convenience of living in the city has resulted in high prices being paid for urban real estates, which in turn has led to people looking for less expensive alternatives. Moreover, the crowds and noise encountered in urban residential districts have resulted in people moving to areas outside of, but at the same time, near the city, so that they can benefit from the city’s advantages while living far enough away not experience its many inconveniences. Therefore, the process referred to as urban sprawl has become very com-mon, especially in the United States and Europe. Urban functions spreading outwards from a city to its outskirts, have been regularly observed and described since the second half of the 20th century for the Western countries and the beginning of the 21th century in Central and Eastern Europe, including Poland1. Although it differs in different continents (i.e. in the US, sprawl is wider than in relatively compact Europe), it is an inevitable and controversial process, described as a major problem of today [Coisnon et al. 2014]. It af-fects every dimension of rural areas. According to Anas and Pines [2008], “low densities resulting from urban expansion to the nearest rural areas are blamed for the death of tra-ditional neighborhoods, increasing obesity trends, reduced social interaction, and the de-population of central cities”. Cities are sprawling because the mobile urban population is earning higher incomes, has relatively easy access to plots of land localized in rural areas and, simultaneously, a greater need for living space, enabling escape from the traffic and stresses of daily life [Almeida et al. 2015]. The reasons behind urban sprawl have been revealed by scientists who studied the phenomenon in different contexts, e.g. Brueck-ner [2000], Glaeser et al. [2004], Nechyba and Walsh [2004], Lorens [2005], Anas and Rhee [2006], Burchfield et al. [2006], Jałowiecki and Szczepański [2006] or Śleszyński [2013]. All these authors agreed, that this process is common, therefore should be treated seriously and directed by the authorities.
Due to urban sprawl occurrence, suburban areas should be governed according to a policy taking into account the advantages and disadvantages of this process. Local authorities must implement spatial policies to ensure that the effects of urban sprawl are more beneficial (i.e. higher tax incomes) than their unfavorable effects (i.e. spatial di-sorder). Diversified policies are needed to plan for and manage the spatial distribution of the population and internal migration, as the development of the residential function is not spatially consistent. The residential function concentrates in areas with excep-tional values understood as a set of demanded characteristics, which results in a popu-lation concentration in selected localizations. Residential value increases along with economic, social and environmental attributes. Such set of values encourages people to migrate from cities to neighboring rural areas. According to GUS (Central Statistical Office of Poland), 435,684 people in Poland checked out from the previous place of re-
1 The symptoms of urban sprawl were noticed earlier in Poland [Czarnecki 1965, Zuziak 1982, Król et al. 1983, Jałowiecki 1987], however this process gathered momentum and scale only after transition, due to i.e. real estate market and mortgage development and after EU accession, due to i.e. increased transport mobility resulting from the import of the used cars.
Studies over characteristics shaping residential attractiveness... 147
Oeconomia 15 (3) 2016
sidence and the 43% of this number migrated toward rural areas [GUS]. The dominant majority (78%) [Migracje… 2014] moved in the new house localized within the borders of the same voivodship, thus migrations had a regional character. Observed migrations were both urban-rural and rural-urban. Authors of this article focused on the urban-ru-ral direction, as nearly every third migrating person is found to have moved out of the city and into a rural area, mainly into rural communes surrounding big cities. Therefore, urban sprawl process should be monitored and directed mainly by local authorities, who need to analyze governed area in the terms of residential attractiveness and identify the most attractive localizations prone to concentration of residential development. The latter activity should be proceeded with the basic knowledge on the decision making process of potential “newcomer”, because only then local authorities would be able to indicate the areas, that are the most attractive for the potential buyers. Currently, many models describing decision making process are supported by behavioral economics, i.e. models2 based on the assumption, that buyers use the subsets of information, which are relatively easy to obtain [Tietz 1992, Todd and Gigerenzer 2000, Betsch and Glöckner 2010]. Acting accordingly to compensatory strategy, potential newcomers make use of all available cues to distinguish decision alternatives. With additive rules, they make choices by adding the cues associated with each available decision alternative and se-lecting the alternative with the highest score [Rieskamp and Hoffrage 1999]. Using the unweighted additive (ADD) rule, they simply add up the number of cues that support each alternative whereas in the weighted additive (WADD) rule they weight cues by their validity as defined by the conditional probability that the cue naturally occurs for a given decision alternative [Bryant 2014]. Therefore, knowledge on demanded charac-teristics of suburban area and their weights enables identification of the areas, that are the most attractive from the residential point of view.
Major aim of the article was to apply the WADD rule for selecting the most attractive areas. It required achieving two specific goals. The first specific aim was to create the profile of the potential newcomer – person, who would move out of the city and move in a rural municipality neighboring big city. The second specific aim was to prepare a list of demanded characteristics of potential new place of residence and to equip them with adequate weights. The results can be applied by the local authorities to identify the most attractive localization for the potential newcomers. However, it must be underlined, that the assessments should be repeated, as each one is valuated for the current state – the majority of newcomers take into consideration values available at the moment of decision (so-called hyperbolic discounting) [Laibson 1997, O’Donoghue and Rabin 1999, Brocas and Carrillo 2014].
MATERIAL AND METHODS
First aim was achieved through careful examination of data shared by GUS and CBOS (Public Opinion Research Centre) and observations described in the literature [Frenkel 2011, Zysk 2013, Rosner 2014]. On the basis of gathered information, the profile of the
2 Such models are often used in the economics, i.e. to analyze financial markets [Banasiak 2010].
148 A. Źróbek-Różańska, E. Zysk, A. Źróbek-Sokolnik
Acta Sci. Pol.
person, who would probable settle in the suburban rural municipality, was created. The potential newcomer can be described as a person, who simultaneously:
currently lives and works in the neighboring big city and will keep the previous work-place, because:
78% internal migrations in Poland were registered within the borders of the same voivodship (intraregional migrations) [Migracje… 2014]; population increase could be noticed mainly in the municipalities surrounding big cities [Frenkel 2011];cities offered better employment opportunities, i.e. in 2014 registered unemploy-ment rate in the city of Olsztyn was 6.9%, while for the whole Warmia and Mazury voivodship it was 18.9% (according to GUS);the majority of suburban inhabitants works in the neighboring city [Drejerska et al. 2014];the most often observed daily commuting distance (from home to work) was be-tween 6 and 20 km [Dojazdy do pracy…2011];
has a creditworthiness, what means:stable professional situation; at least average income;more than 25, but less than 40 years (it results from banks requirements for the debtors of long-term mortgage credits);
is married, because 74% of people, who moved in the rural areas were married [Mi-gracje… 2014];has a 0–9 years old child/children, because children 0–9 years old, migrating with parents, made another numerous group [Migracje… 2014];has higher education, because well-educated people tended to change living place more often [Skwara 2007, Rosner 2014];prefers “urban style of living” but moves out into rural areas, because needs more space for enlarging family, demands higher comfort of living in own house built in the proximity of natural environment [Zysk 2013].Achieving second aim required preparing the list of demanded characteristics of resi-
dentially attractive localization, conducting a survey among people coherent with created profile of potential newcomer, and finally calculating the impact indicators and conver-ting them into weights. The list was elaborated on the basis of data published by GUS and CBOS, relevant literature [Bryant et al. 1982, McFadden 1997, Claval 2005, de Palma et al. 2005, Zondag and Pieters 2005, Charmes 2009, Kałuża, 2010, Pagliara et al. 2010, Bijker et al. 2012, Rosner 2014, Rothwell et al. 2015] and reports [Diagnoza przyczyn… 2010, Mobilność… 2011, Migracje… 2014]. The list includes following 18 characteri-stics of particular suburban area residential attractiveness (Table 1).
The list was used to prepare a survey that was conducted in 2015 among 164 people coherent with the created profile (married couples with: minimum one child, higher edu-cation and average earnings, who lived, worked and preferred leisure activities within the borders of the big city). Respondents were asked to assess with 0–3 scale the importance of each characteristic in decision making process while choosing particular suburban plot, where: 0 – zero importance, 1 – low importance, 2 – medium importance, and 3 – high
•
–
–
–
–
–
•–––
•
•
•
•

Studies over characteristics shaping residential attractiveness... 149
Oeconomia 15 (3) 2016
importance. The answers were aggregated and impact indicators for each characteristic were calculated according to the following formula [Karaszewski and Sudoł 1997]:
1 1 1ki n wW k N
(1)
where: W – impact indicator; k – maximum assessment from 1 to k; i – assessment index; n – number of answers for particular factor on the i place; w – assessment proper for the place of factor i;N – number of respondents.
Finally, achieved impact indicators were converted into weights, that were used in the calculations with the use of Fishbein model formula, adjusted by authors for the residen-tial attractiveness [Holbrook and Hulbert 1975]:
1ni i iA w v (2)
where: A – total assessment of residential attractiveness;wi – weight adequate for the i-characteristic; vi – value adequate for the i-characteristic.
Table 1. Characteristics of residential attractiveness of suburban plots (alphabetical order)
Number Characteristic1 access to preschool2 access to primary school3 access to public transport4 access to recreational infrastructure5 access to trade and services6 aesthetic buildings in the neighborhood7 exceptional natural environment 8 forest in the neighborhood9 good communication with the city10 lack of burdensome objects in the neighborhood11 lake in the neigborhood12 low real estate price13 media (water, sewage, gas, internet)14 neighbors with similar income15 security16 significant number of municipal investment17 spatial order18 watering place in the neighborhood
Source: Own elaboration on the base of the literature.
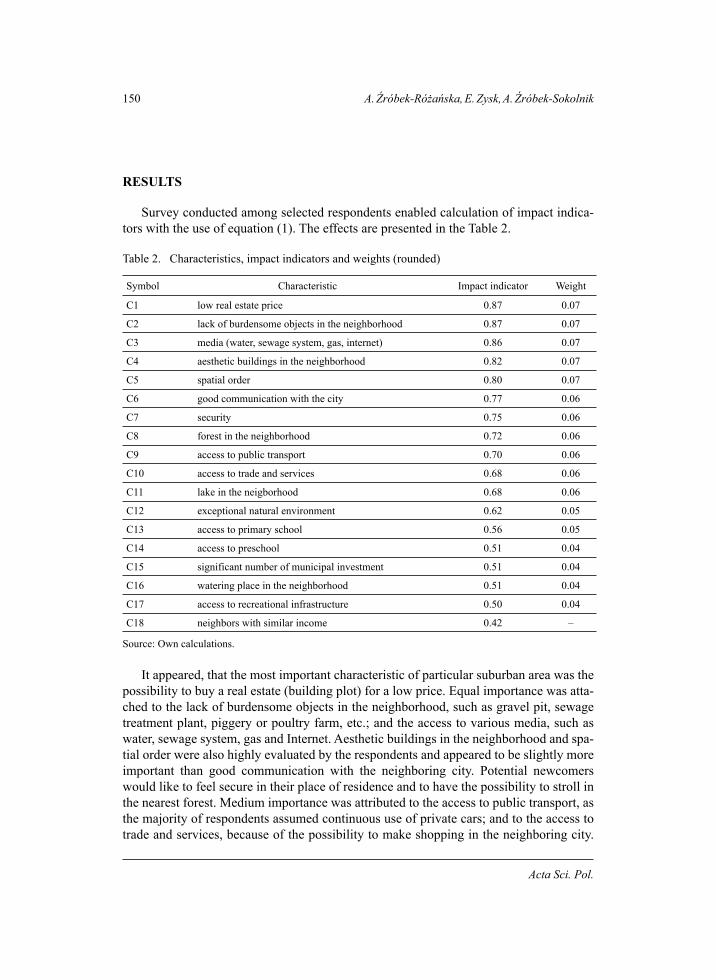
150 A. Źróbek-Różańska, E. Zysk, A. Źróbek-Sokolnik
Acta Sci. Pol.
RESULTS
Survey conducted among selected respondents enabled calculation of impact indica-tors with the use of equation (1). The effects are presented in the Table 2.
Table 2. Characteristics, impact indicators and weights (rounded)
Symbol Characteristic Impact indicator Weight
C1 low real estate price 0.87 0.07
C2 lack of burdensome objects in the neighborhood 0.87 0.07
C3 media (water, sewage system, gas, internet) 0.86 0.07
C4 aesthetic buildings in the neighborhood 0.82 0.07
C5 spatial order 0.80 0.07
C6 good communication with the city 0.77 0.06
C7 security 0.75 0.06
C8 forest in the neighborhood 0.72 0.06
C9 access to public transport 0.70 0.06
C10 access to trade and services 0.68 0.06
C11 lake in the neigborhood 0.68 0.06
C12 exceptional natural environment 0.62 0.05
C13 access to primary school 0.56 0.05
C14 access to preschool 0.51 0.04
C15 significant number of municipal investment 0.51 0.04
C16 watering place in the neighborhood 0.51 0.04
C17 access to recreational infrastructure 0.50 0.04
C18 neighbors with similar income 0.42 –
Source: Own calculations.
It appeared, that the most important characteristic of particular suburban area was the possibility to buy a real estate (building plot) for a low price. Equal importance was atta-ched to the lack of burdensome objects in the neighborhood, such as gravel pit, sewage treatment plant, piggery or poultry farm, etc.; and the access to various media, such as water, sewage system, gas and Internet. Aesthetic buildings in the neighborhood and spa-tial order were also highly evaluated by the respondents and appeared to be slightly more important than good communication with the neighboring city. Potential newcomers would like to feel secure in their place of residence and to have the possibility to stroll in the nearest forest. Medium importance was attributed to the access to public transport, as the majority of respondents assumed continuous use of private cars; and to the access to trade and services, because of the possibility to make shopping in the neighboring city.

Studies over characteristics shaping residential attractiveness... 151
Oeconomia 15 (3) 2016
Respondents would appreciate the lake view and exceptional natural environment values as well as an access to primary school and preschool. However, they declared, that as well as sending children to the local educational institutions, they can drive them to preschools and primary schools in the neighboring city. Rather low importance was attributed to the significant number of municipal investment, and respondents would not regularly use the watering place or recreational infrastructure, except summer season. The lowest grade achieved the neighbors with the similar income, however, it can be assumed, that respon-dents were ashamed to answer this question with honesty, thus this characteristic was not taken into consideration while calculating the weights.
Impact indicators calculated for each characteristic achieved values from 0.42 to 0.87. They were converted into weights. Characteristics C1–C5 achieved weight 0.07; C6–C11 weight 0.06; C12–C13 weight 0.05; C14–C17 weight 0.04. To simulate decision making process according to WADD rule, local authorities should assess the value of each cha-racteristic for the particular areas and add their weighted values according to the adjusted Fishbein model – equation (2):
A = 0.07vc1 + 0.07vc2 + 0.07vc3 + 0.07vc4 + 0.07vc5 + 0.06vc6 + 0.06vc7 + 0.06vc8+ 0.06vc9 + + 0.06vc10 + 0.06vc11 + 0.05vc12 + 0.05vc13 + 0.04vc14 + 0.04vc15 + 0.04vc16 + 0.04vc17
At this level, the most important task for local authorities would be the application of adequate method to assess the values. One of the suggestion is to use the 0–3 scale for the following assessment of i.e. media (C3), where: 0 – if there is no media available, 1 – if only water is available, 2 – if water and sewage system are available, 3 – if water, sewage system, gas and Internet are available.
CONCLUSIONS
Urban sprawl, process currently common worldwide, is also observed in Poland, where nearly every third migrating person is found to have moved out of the city and into a rural area, mainly into rural municipalities surrounding big cities. It causes many effects, both beneficial and disadvantageous. Therefore, urban sprawl process should be monitored and directed by local authorities, who need to analyze their municipality area in the terms of residential attractiveness and identify the most attractive localiza-tions. Such identification can be made according to the WADD rule. It requires infor-mation on the demanded characteristics of the particular objects, as well as the weight and value of each characteristic. According to authors’ studies, the majority of new settlements established in the rural areas neighboring big city are people in the age of 25–40 with children 0–9 years old, with sufficient income to achieve a mortgage credit, higher education and strong links with the city (work, recreation, shopping, etc.). They seek for real estate with a relatively low price, localized in the environment free from burdensome objects, equipped with media and surrounded by neat houses built with the rule of spatial order. Newcomers would also appreciate comfortable daily communica-tion with the city, security, strolling in the nearby forest or toward the lake and using occasionally public transport or local stores. Moreover, they would be quite satisfied with exceptional natural landscape and the opportunity to choose among urban and
152 A. Źróbek-Różańska, E. Zysk, A. Źróbek-Sokolnik
Acta Sci. Pol.
rural educational institutions. Occasionally, they would use recreational facilities or watering place, and would like to observe public investments taking place. Conducted survey enabled calculation of weights. Therefore, the next task for local authorities is choosing and applying adequate method to assess the values. It must be underlined, that the assessments should be repeated, as it is valuated for the current state and the total score will change if any characteristic changes.
REFERENCES
Almeida, M., Loupa-Ramos, I., Menezes, H., Carvalho-Ribeiro, S., Guiomar N., Pinto-Correia, T. (2015). Urban population looking for rural landscapes: Different appreciation patterns identified in Southern Europe. Land Use Policy, 53, 44–55.
Anas, A., Rhee, H-J. (2006). Curbing excess sprawl with congestion tolls and urban boundaries. Regional Science and Urban Economics, 36, 510–541.
Banasiak, K. (2010). Zachowania inwestorów w warunkach globalnego kryzysu finansowego. Acta Scientiarum Polonorum, Oeconomia, 9 (2),17–28.
Betsch, T., Glöckner, A. (2010). Intuition in judgment and decision making: Extensive thinking without effort. Psychological Inquiry, 21, 279–294.
Bijker, R.A., Haartsen, T., Strijker, D. (2012). Migration to less-popular rural areas in the Nether-lands: exploring the motivations. Journal of Rural Studies, 8, 490–498.
Brocas, I., Carrillo, J.D. (2014). Dual-process theories of decision-making: A selective survey. Journal of Economic Psychology, 41, 45–54.
Brueckner, J. (2000). Urban sprawl: diagnosis and remedies. International Regional Science Re-view, 23, 160–179.
Bryant, C.R., Russwurm, L.H., McLellan, A.G. (1982). The city’s countryside. Land and its man-agement in the rural-urban fringe. Longman, London–New York.
Bryant, D.J. (2014). Strategy Selection in Cue-Based Decision Making. Canadian Journal of Ex-perimental Psychology, 68, 2, 97–110.
Burchfield, M., Overman, H.G., Puga, D., Turner, M.A. (2006). Causes of sprawl: a portrait from space. Quarterly Journal of Economics, May.
Charmes, E. (2009). On the Residential ‘Clubbisation’ of French Periurban Municipalities. Urban Studies, SAGE Publications, 46 (1), 189–212.
Claval, P. (2005). Reading the rural landscapes. Landscape and Urban Planning, 70, 9–19.Czarnecki, W. (1965). Planowanie miast i osiedli. T.1. Wiadomości ogólne. Planowanie przestrzen-
ne. PWN, Warszawa.de Palma, A., Motamedi, K., Picard N., Waddell, P. (2005). A model of residential location choice
with endogenous housing prices and traffic for the Paris region. European Transport / / Trasporti Europei, 31.
Drejerska, N., Chrzanowska, M., Pomianek, I. (2014). Strefa podmiejska Warszawy. Wybrane za-gadnienia. Wyd. SGGW, Warszawa.
Frenkel, I. (2011). Przemiany demograficzne na wsi w latach 2006–2009. Wieś i Rolnictwo, 1 (150), 55–74.
Fundacja CBOS (2011). Mobilność i preferencje migracyjne Polaków. Wyd. CBOS, Warszawa.Glaeser, E., Kahn, M. (2004). Sprawl and urban growth. [In:] Handbook of Urban and Regional
Economics. Vol. 4, NBER Working Paper 9733, Amsterdam.Główny Urząd Statystyczny [GUS] (2011). Dojazdy do pracy w 2010 roku na podstawie BAEL.
Materiał na konferencję prasową w dniu 22 grudnia 2011 r. [unpublished].Główny Urząd Statystyczny [GUS] (2014). Migracje wewnętrzne ludności. Narodowy Spis Po-
wszechny Ludności i Mieszkań, Wyd. GUS, Warszawa.
Studies over characteristics shaping residential attractiveness... 153
Oeconomia 15 (3) 2016
Holbrook, M.B., Hulbert, J.M. (1975). Multi-Attribute Attitude Models: a Comparative Analysis. [In:] M.J. Schlinger, A. Abor (Eds), Advances in Consumer Research. Vol. 2. Association for Consumer Research, 375–388.
Jałowiecki, B. (1987). Proces urbanizacji a relacje miasto-wieś. Problemy Rozwoju Wsi i Rolnict-wa. PWN, Warszawa.
Jałowiecki, B., Szczepański, M.S. (2006). Miasto i przestrzeń w perspektywie socjologicznej. Wy-dawnictwo Naukowe Scholar, Warszawa.
Kałuża, D. (2010). Migracje wewnętrzne a poziom rozwoju społeczno-gospodarczego wybrany-ch największych miast w Polsce. Acta Universitatis Lodziensis, Folia Oeconomica, 237, 29–41.
Karaszewski, W., Sudoł, S. (1997). Empirical Research on the Process of Transformation of Polish Companies in the Period of 1990–1995. Wyd. UMK w Toruniu, Toruń.
Konsorcjum profile – ARC Rynek i Opinia. Diagnoza przyczyn i motywów wewnętrznej i za-granicznej migracji zarobkowej, charakter mobilności regionalnej pracowników (ra-port cząstkowy z IV etapu projektu: Badanie rynku na potrzeby projektu „Od diagnozy do prognozy – potrzeby gospodarki a jakość kapitału ludzkiego w województwie świętokrzyskim”, Priorytet VIII, Działania 8.1, Poddziałania 8.1.4. Programu Operacyj-nego Kapitał Ludzki).
Król, B., Majdecki, L., Wolski, P. (Eds), (1983). Kształtowanie krajobrazu stref podmiejskich. Ses-ja Naukowa. Wyd. SGGW-AR, Warszawa.
Laibson, D.I. (1997). Golden eggs and hyperbolic discounting. Quarterly Journal of Economics, 112, 443–477.
Lorens, P. (Ed.), (2005). Problem suburbanizacji. Urbanista, Warszawa.McFadden, D. (1997). Modelling the choice of residential location [In:] J. Quigley (Ed.), The Eco-
nomics of Housing. Edwarg Elgar, London.Nechyba, T.J., Walsh, R.P. (2004). Urban sprawl. Journal of Economic Perspectives, 18 (4), 177–
–200.O’Donoghue, T., Rabin, M. (1999). Doing it now or later. American Economic Review, 89, 103–
–124; Pagliara, F., Preston, J., Simmonds, D. (Eds), (2010). Residential Location Choice. Models and
Applications. Springer Heidelberg Dordrecht, London–New York.Rieskamp, J., Hoffrage, U. (1999). When do people use simple heuristics, and how can we tell?
[In:] G. Gigerenzer, P.M. Todd (Eds), Simple heuristics that make us smart. Oxford Uni-versity Press, Oxford.
Rosner, A. (2014). Migracje wewnętrzne i ich związek z przestrzennym zróżnicowaniem rozwoju społeczno-gospodarczego wsi. Wieś i Rolnictwo, 1 (162), 63–79.
Rothwell, A., Ridoutt, B., Page, G., Bellotti, W. (2015). Feeding and housing the urban population: Environmental impacts at the peri-urban interface under different land-use scenarios. Land Use Policy, 48, 377–388.
Skwara, A. (2007). Tendencje zmian na obszarach wiejskich w Polsce. Acta Scientiarum Po-lonorum, Oeconomia, 6 (4), 83–93.
Śleszyński, P. (Ed.), (2013). Wskaźniki zagospodarowania i ładu przestrzennego w gminach. Biu-letyn KPZK PAN, Warszawa.
Tietz, R. (1992). Semi-normative theories based on bounded rationality. Journal of Economic Psy-chology, 13, 297–314.
Todd, P.M., Gigerenzer, G. (2000). Précis of Simple heuristics that make us smart. Behavioral and Brain Sciences, 23, 727–741.
United Nations DESA (2014). World Urbanisation Prospects, New York. Retrived from https://www.un.org/development/desa/publications/2014-revision-world-urbanization-pros-pects.html (accessed: 21.10.2015).
154 A. Źróbek-Różańska, E. Zysk, A. Źróbek-Sokolnik
Acta Sci. Pol.
Zondag, B., Pieters, M. (2005). Influence of accessibility on residential location choice. Transporta-tion Research Record Journal of the Transportation Research Board, August.
Zuziak, Z.K. (1982). Przestrzeń, miejsce, przestrzeń społeczna – rozważania nad naturą pojęć. Osiedlowa przestrzeń społeczna. II Ogólnopolskie Konserwatorium Polskiej Architektu-ry Współczesnej, 18–19.11.1981, Mogilany, Polska Akademia Nauk, Oddział w Krako-wie. Komisja Urbanistyki i Architektury. Wyd. Politechniki Krakowskiej, Kraków.
Zysk, E. (2013). Funkcja mieszkaniowa na obszarach wiejskich na przykładzie gminy Stawiguda – aspekty społeczne i rynku nieruchomości. [In:] K. Kurowska (Ed.), Planowanie rozwo-ju przestrzeni wiejskiej. Urząd Marszałkowski Województwa Warmińsko-Mazurskiego, Olsztyn.
BADANIE CECH KSZTAŁTUJĄCYCH ATRAKCYJNOŚĆ MIESZKANIOWĄ PODMIEJSKICH OBSZARÓW WIEJSKICH
Streszczenie. Co trzecia migrująca osoba w Polsce przeprowadza się z miasta na obszar wiejski w sąsiedztwie dużego miasta. Władze podmiejskich gmin powinny badać atrak-cyjność mieszkaniową oraz identyfikować obszary najbardziej podatne na koncentrację inwestycji zabudowy rezydencjonalnej. Głównym celem artykułu było zastosowanie re-guły addytywnej ważonej w celu wskazania tego rodzaju miejsc. Wymagało to stworzenia profilu potencjalnego osadnika oraz przygotowania listy pożądanych cech lokalizacja wraz z ich wagami. Badania wykazały, iż na wsi zamieszkałyby osoby w wieku 25–40 lat z ma-łymi dziećmi, zdolnością kredytową, wyższym wykształceniem oraz silnymi powiązaniami z miastem. Na wybór miejsca zamieszkania największy wpływ miałaby niska cena nieru-chomości, brak obiektów uciążliwych, pełny dostęp do mediów oraz zadbane otoczenie. Jednakże niedostatek poszczególnych charakterystyk lokalizacji może być rekompensowa-ny wysoką jakością innych, a stopień kompensacji zależy od wag przypisanych poszcze-gólnym charakterystykom.
Słowa kluczowe: suburbanizacja, obszary wiejskie, atrakcyjność mieszkaniowa
Accepted for print: 17.08.2016
For citation: Źróbek-Różańska A., Zysk E., Źróbek-Sokolnik A. (2016). Studies over characteri-stics shaping residential attractiveness of suburban rural areas. Acta Sci. Pol., Oeconomia, 15 (3), 145–154.
CONTENTSSPIS TREŚCI
Szczepan Figiel, Justyna KufelFood product innovations and the main consumer trends ..................................... 5Żywnościowe innowacje produktowe a główne trendy konsumenckie
Józef Kania, Małgorzata BoguszSources and structure of income of agritourism farms in the Polish Carpathian mountains ............................................................................................................ 15Źródła i struktura dochodów gospodarstw agroturystycznych w Karpatach Polskich
Małgorzata KieżelInnovations of retail banks – expression of relationship marketing or product orientation? .......................................................................................................... 27Innowacje banków detalicznych – przejaw marketingu relacji czy orientacji na produkt?
Ryszard KłeczekHow the company’s actions influence non-financial and financial value drivers: managers’ perceptions in Polish firms ................................................................. 35Jakie działania wpływają na niefinansowe i finansowe czynniki wzrostu wartości – percepcje menedżerów w polskich firmach
Jacek MaśniakInterventionism on the agricultural land market – a critical analysis ................. 45Interwencjonizm na rynku ziemi rolniczej – analiza krytyczna
Krystyna Mazurek-ŁopacińskaThe cultural paradigm in marketing .................................................................... 55Paradygmat kulturowy w marketing
Nina Moysova Kyoseva The relation between public debt and GDP – empirical analysis for Macedonia and Romania ........................................................................................................ 67Relacja między długiem publicznego a PKB – analiza empiryczna dla Macedonii i Rumunii
Anna Niewiadomska, Ewa Sobolewska-PoniedziałekEducational activity as the growth factor of professional activity of elderly people .................................................................................................. 79Aktywność edukacyjna jako czynnik wzrostu aktywności zawodowej osób starszych
Anna Olejniczuk-MertaInnovations and consumption versus raising the quality of life of society ......... 91Innowacje i konsumpcja a podnoszenie jakości życia społeczeństwa
Tomasz Siudek, Edward Czarnecki, Mariana VashchykAssessment of the sustainability of rural development in the European Union Member States ......................................................................................... 101Ocena zrównoważenia rozwoju obszarów wiejskich w krajach Unii Europejskiej
Katarzyna Szalonka, Grażyna Światowy, Lucyna Witek Health as a determinant of the development of the organic food market .......... 115Zdrowie jako determinanta rozwoju rynku żywności ekologicznej
Joanna Szwacka-MokrzyckaStimulators and barriers of demand for food (Polish case) ............................... 123Stymulatory i bariery popytu na żywność (studium polskie)
Elżbieta Wolanin-JaroszThe analysis of global brands – a comparative study Poland – Slovakia – – Hungary .......................................................................................................... 135Analiza świadomości marek globalnych – studium porównawcze Polska – – Słowacja – Węgry
Alina Źróbek-Różańska, Elżbieta Zysk, Anna Źróbek-SokolnikStudies over characteristics shaping residential attractiveness of suburban rural areas .......................................................................................................... 145Badanie cech kształtujących atrakcyjność mieszkaniową podmiejskich obszarów wiejskich