Embed Size (px)
Citation preview
ISOTOPIC FRACTIONATION IN SPUTTERING
Thesis by
Stephen James Spicklemire
In Partial Fulfillment of the Requirements
for the Degree of
Doctor of Philosophy
California Institute of Technology
Pasadena, California
1990
(Submitted January 5, 1990)
- }l -
Acknowledgments
I wish to thank everyone who either directly, or indirectly, made this work pos
sible. I am grateful to my advisor, Tom Tombrello, without whose encouragement
and support I could have never completed this project. Thanks a re certainly due
to the indefatigable Duncan Weathers, for his countless hours of labor, his unlim
ited supply of enthusiasm, his neat 'lEX macros and the figures for Chapter 2. I
am indebted to G. J. Wasserburg for the use of the PANURGE ion probe and the
generous assistance of Ian Hutcheon in operating and maintaining the instrument
during the course of this work. I would like to thank Kevin Hubbard for the use
of his In:Ga collectors and I wish to acknowledge the considerable effort of Hide
Suzuki in helping with the final measurements.
Among the others who made substantial contributions to my overa ll graduate
school experience I must express my sincere and deep appreciation for the friend
ships of Alan Rice and Shouleh Nikzad. They made, what could otherwise have
been at times, a rather gloomy existence, downright enjoyable. I would like to
thank Michelle Vine for her skilled assistance with countless administrative details,
and for many interesting contributions to our 'group discussions. ' I am also grateful
to Steve Stryker for his patient guidance in the machine shop and I thank the rest
of the Brown Bag crew, present and past, for their friendship and encouragement.
I wish to thank Don Burnett and Dorothy Woolum for providing some additional
interesting problems to think about and for their generous support. I am fur ther
indebted to Tim and Barbara Zukowski for their generous hospitality during my
stays in Southern California, and for a most enjoyable friendship. Thanks a re also
due the faculty and staff of the University of Indianapolis for their pat ience and
support . Also I would like to thank Carl Calabria and the folks at Truevision Inc.
for the ATVista(tm) graphics card which has proven very helpful in visualizing the
simulation results and for the various consulting opportunities they have provided.

- 111-
I must also acknowledge three individuals, who perhaps more than any others,
fueled my interest in Physics. The first is my undergraduate advisor, Mike Moloney,
who to this day, keeps me on my toes by posing various puzzles and problems. The
second is my high school physics teacher, Richard Hammond, whose encouragement
and guidance I shall always value. The third is Kevin Friedly, who not only helped
with proofreading of this thesis, but also encouraged and supported my throughout
my graduate school career and continues to provide stimulating ideas and very
interesting discussions.
I thank my parents, and the rest of my family, for providing the kind of emo
tional and intellectual support that has allowed me to do these things. Finally, for
her understanding, flexibility, companionship, encouragement, and unquestioning
love I dedicate this thesis to Sherri, my wife.
- lV-
Abstract
Isotopic fractionation due to sputtering has been investigated via a collector
type experiment in which targets of known isotopic composition have been bom
barded with several keV Ar+ and Xe+ ions with fl.uences down to 3.0x 10¹⁴ ions/cm2 ,
believed to be the lowest fl.uences for which such detailed measurements have ever
been made. The isotopes were sputtered onto carbon collectors and analyzed with
Secondary Ion Mass Spectroscopy (SIMS.) There is clear indication of preferential
effects several times that predicted by the dominant analytical theory. Results also
show a fairly strong angular variation in the fractionation. The maximum effect is
usually seen in the near normal direction, measured from the target surface, falling
continuously, by a few percent in some cases, to a minimum in the oblique direc
tion. Measurements have been made using Mo isotopes: 100 Mo and 92 Mo and a
liquid metal system of In:Ga eutectic. The light isotope of Mo is found to suffer a
53±5%0 (note: 1.0 %o = 0.1%) enrichment in the sputtered flux in the near normal
direction, compared to the steady state near normal sputtered composition, under
5.0 keV xe+ bombardment of 3.0 X 10¹⁴ ions/cm2 0 In the liquid metal study only the
angular dependence of the fractionation could be measured due to the lack of a well
defined reference and the nature of the liquid surface, which is able to 'repair' itself
during the course of a bombardment. The results show that 113In is preferentially
sputtered over 115In in the near normal direction by about 8.7 ± 2.7%o compared
to the oblique direction. 69 Ga, on the other hand, is sputtered preferentially over
71 Ga in the oblique direction by about 13 ± 4.4%0 with respect to the near normal
direction.
- v -
Table of Contents
Acknowledgments
Abstract
Table of Contents
List of Figures
List of Tables
1. Overview of the Sputtering Processes
1.1 Sputtering by keV Ions
1.2 Characterization of Sputtering: The Sputtering Yield
1.3 Sputtering of Multicomponent Materials
2. Experimental Methods
2.1 The Sputtering Experiments
2.1.1 The In : Ga Sputtering
2.1.2 The Mo Sputtering
2.2 Measuring Isotopic Ratios using SIMS
3. Preferential Sputtering of Mo Isotopes
3.1 Dependence on Dose
3 .2 Dependence on Angle
4. Sputtering of Ga/In Isotopes from the Eutectic Alloy
4.1 Issues Involved in Sputtering from a Liquid Target
4.2 Angular Dependence of the Isotopic Composition
5. Theoretical Understanding of Preferential Sputtering
5.1 Predictions of Analytical Theories
5.2 Computer Simulations
5.3 Outlook and Summary of Results
A. Factors Involved in Maintaining a Clean Surface
B. Calculation of the Ratio of Two Isotopes From SIMS Data
References
Figure Captions
11
IV
v
Vll
Vlll
1
1
2
2
6
6
6
6
9
13
13
14
16
16
18
19
19 21
24
27
29
32
34

Figures
Tables
- Vl -
36
49
- Vll -
List of Figures
2.1 Ion Optics for the Mo experiments 36
2.2 The sputtering apparatus for the Mo experiments 37
3.1 92 Mo/100Mo vs. ion beam fluence 38
3.2 92 Mojl 00Mo vs. angle for 5 keV Xe+ 39
3.3 92 Mojl 00 Mo vs. angle for 5 keV Xe+ 40
3.4 92 Mojl 00 Mo vs. angle for 5 keV Xe+ 41
3.5 92Mo/looMo vs. angle for 5 ke V Xe + 42
3.6 92Mojl 00 Mo vs. angle for 10 keV Xe+ 43
3.7 92Mo/lOOMo vs. angle for 5 ke V Ar+ 44
3.8 92 Mo/100 Mo vs. angle for 10 keV Ar+ 45
4.1 In and Ga fractionation vs. angle 46
5.1 MCBCA simulation results 47
B.1 Raw SIMS data from the Mo experiment 48
- Vlll-
1.1 Results of Previous Investigations
3.1 Measured Enrichments of Isotopic Ratios
B.1 Example differences in SIMS analysis
List of Tables
4
49
31
- 1 -
Chapter 1 Overview of the Sputtering Process
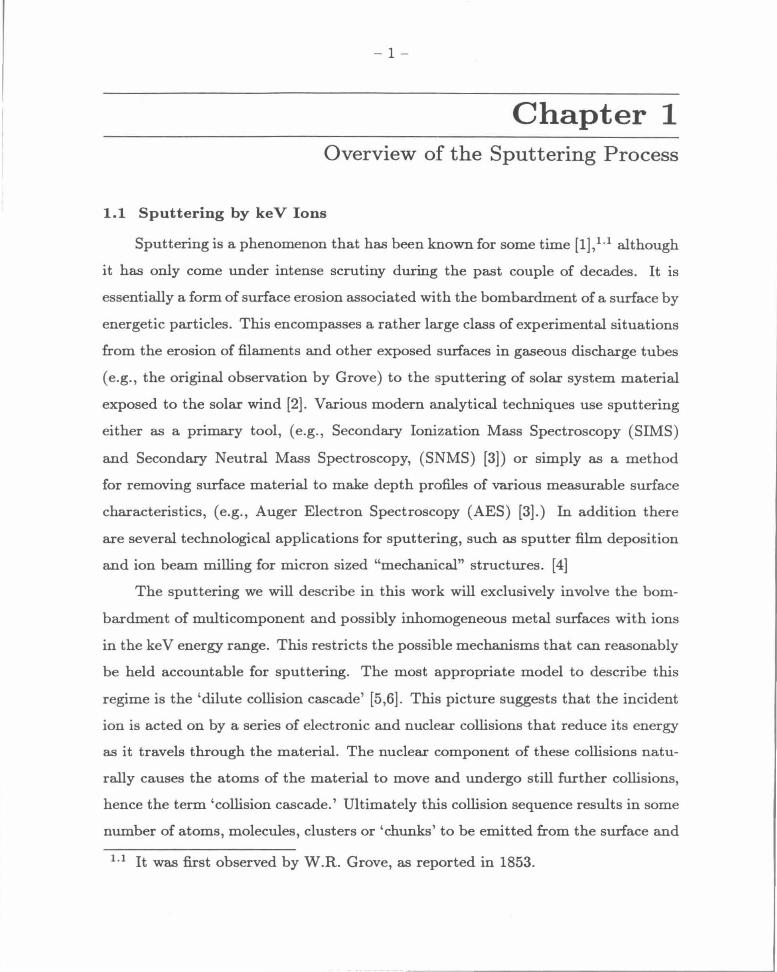
1.1 Sputtering by keV Ions
Sputtering is a phenomenon that has been known for some time [1], 1.1 although
it has only come under intense scrutiny during the past couple of decades. It is
essentially a form of surface erosion associated with the bombardment of a surface by
energetic particles. This encompasses a rather large class of experimental situations
from the erosion of filaments and other exposed surfaces in gaseous discharge tubes
(e.g., the original observation by Grove) to the sputtering of solar system material
exposed to the solar wind [2] . Various modern analytical techniques use sputtering
either as a primary tool, (e.g., Secondary Ionization Mass Spectroscopy (SIMS)
and Secondary Neutral Mass Spectroscopy, (SNMS) [3]) or simply as a method
for removing surface material to make depth profiles of various measurable surface
characteristics, (e.g., Auger Electron Spectroscopy (AES) [3].) In addition there
are several technological applications for sputtering, such as sputter film deposition
and ion beam milling for micron sized "mechanical" structures. [4]
The sputtering we will describe in this work will exclusively involve the bom
bardment of multicomponent and possibly inhomogeneous metal surfaces with ions
in the ke V energy range. This restricts the possible mechanisms that can reasonably
be held accountable for sputtering. The most appropriate model to describe this
regime is the 'dilute collision cascade' [5,6]. This picture suggests that the incident
ion is acted on by a series of electronic and nuclear collisions that reduce its energy
as it travels through the material. The nuclear component of these collisions natu
rally causes the atoms of the material to move and undergo still further collisions,
hence the term 'collision cascade.' Ultimately this collision sequence results in some
number of atoms, molecules, clusters or 'chunks' to be emitted from the surface and
l.I It was first observed by W.R. Grove, as reported in 1853.
- 2-
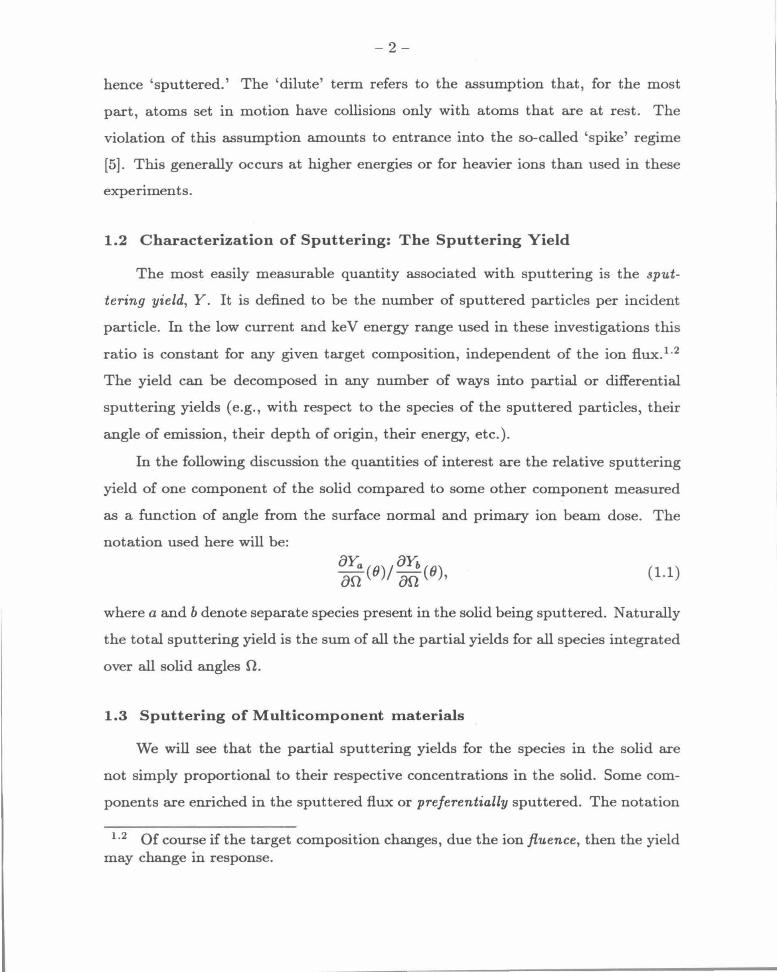
hence 'sputtered.' The 'dilute' term refers to the assumption that, for the most
part, atoms set in motion have collisions only with atoms that are at rest. The
violation of this assumption amounts to entrance into the so-called 'spike' regime
[5] . This generally occurs at higher energies or for heavier ions than used in these
experiments.
1.2 Characterization of Sputtering: The Sputtering Yield
The most easily measurable quantity associated with sputtering is the sput
tering yield, Y. It is defined to be the number of sputtered particles per incident
particle. In the low current and ke V energy range used in these investigations this
ratio is constant for any given target composition, independent of the ion flux. 1 ·2
The yield can be decomposed in any number of ways into partial or differential
sputtering yields (e.g. , with respect to the species of the sputtered particles, their
angle of emission, their depth of origin, their energy, etc.).
In the following discussion the quantities of interest are the relative sputtering
yield of one component of the solid compared to some other component measured
as a function of angle from the surface normal and primary ion beam dose. The
notation used here will be:
(1.1)
where a and b denote separate species present in the solid being sputtered. Naturally
the total sputtering yield is the sum of all the partial yields for all species integrated
over all solid angles n.
1.3 Sputtering of M ulticomponent materials
We will see that the partial sputtering yields for the species in the solid are
not simply proportional to their respective concentrations in the solid. Some com
ponents are enriched in the sputtered flux or preferentially sputtered. The notation
1.2 Of course if the target composition changes, due the ion fluence, then the yield may change in response.
-3-
used in this work to describe this effect is the following:
6ij = (}i/Yj - 1) X 1000, CjjCj
(1.2)
where 6ij is sometimes called the enrichment, Yi and Yj are the sputtering yields
for the components i and j and Ci and Cj are the concentrations of the components i
and j, in the bulk material being sputtered. The factor of 1000 indicates that 6ij is
normally expressed as parts per thousand or '%0 .' Clearly if 6ij > 0 then component
i is enriched with respect to component j in the sputtered flux compared to their
respective concentrations in the bulk sample. This naturally induces changes in the
composition of the sample near the surface1 ·3
, and as a result the partial sputtering
yields are a function of ion beam ft:uence. It is clear therefore that if accurate
measurements of the enrichment effect are to be made, they must be made in
the low ft:u.ence limit. This demands a low primary ion beam dose and hence a
high degree of sensitivity in any detection method used to measure the sputtered
material.
In the experiments described in this work the 'components' whose sputtering
yields are compared are all isotopes of the same element. This is done so that any
chemical effects, which are surely present in the general ease of multicomponent
sputtering, will be absent. Unfortunately this restricts these experiments to sys
tems with fairly small relative mass difference (e.g., 6MfM ~ 10%) between the
components under study. This obviously limits the magnitude of the preferential
effects we can generate and underscores the need for an analytical technique that
is both sensitive and precise.
Before launching into a detailed description of these experiments it is worth
while to peruse the results obtained by other investigators. Below are listed some
results of studies of other researchers relevant to the issue of isotopic fractionation
in sputtering. The nature of the isotopic systems studied varies fairly widely both in
the composition of the target materials and the identity of the bombarding species.
l.J At least this is the case while sputtering a solid target. We will discuss exceptions to this in chapter 4 when considering preferential sputtering of liquid targets.
- 4-
The most important issue though is probably the lowest bombarding fiuence used
in a measurement. In general, large bombarding fiuences have been used, which
cause the measured fractionation to be rather small in most cases. The recent mea-
surements of Gnaser[7,8) are an exception to this rule and compare quite favorably
to the results of these studies.
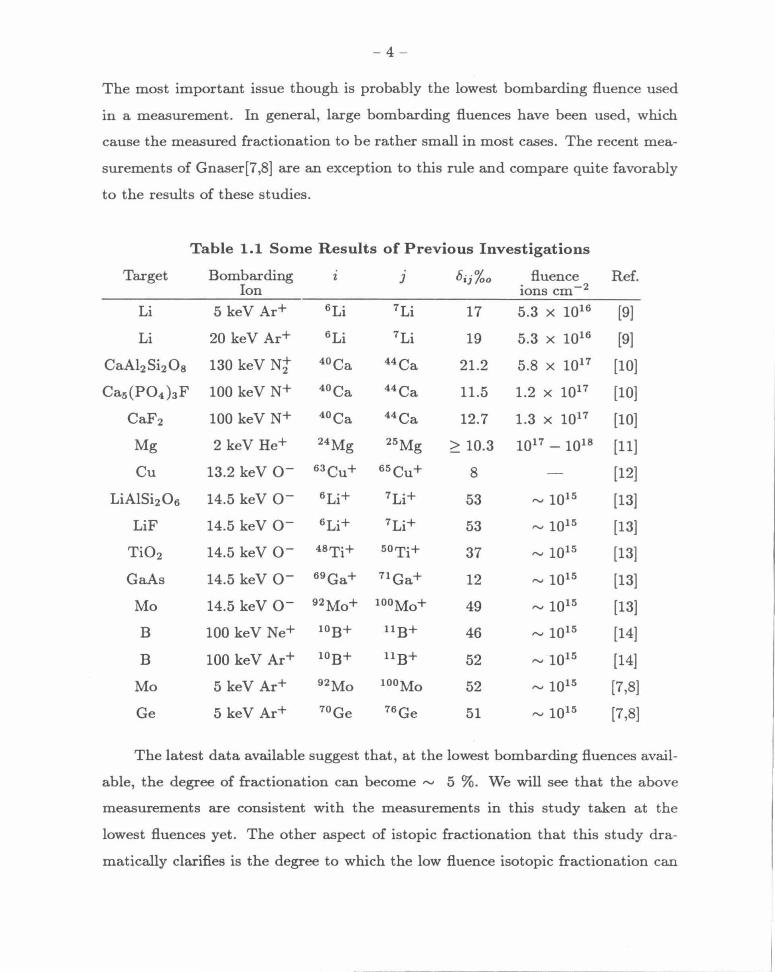
Table 1.1 Some Results of Previous Investigations
Target Bombarding l J Dij%o fiuence Ref. Ion ions cm-2
Li 5 keV Ar+ 6Li 7Li 17 5.3 X 10¹⁶ [9)
Li 20 keV Ar+ 6Li 7Li 19 5.3 X 10¹⁶ [9)
CaAhSi20s 130 keV Nt 40Ca 44Ca 21.2 5.8 X 10¹⁷ [10)
Ca5(P04)aF 100 keV N+ 40Ca 44Ca 11.5 1.2 X 10¹⁷ [10)
CaF2 100 keV N+ 40Ca 44Ca 12.7 1.3 X 10¹⁷ [10)
Mg 2 keV He+ 24Mg 25Mg ~ 10.3 1017- 1018 [11]
Cu 13.2 keV o- 63cu+ 65cu+ 8 [12)
LiAlSi206 14.5 keV o- 6Li+ 7Li+ 53 """' 1015 [13)
LiF 14.5 keV o- 6Li+ 7Li+ 53 """'1015 [13)
Ti02 14.5 keV o- 48Ti+ 5oTi+ 37 """'1015 [13)
GaAs 14.5 keV o- 69Ga+ 71 Ga+ 12 """' 1015 [13)
Mo 14.5 keV o- 92Mo+ lOOMo+ 49 """'1015 [13)
B 100 keV Ne+ lOB+ uB+ 46 """' 1015 [14)
B 100 keV Ar+ lOB+ uB+ 52 """'1015 [14)
Mo 5 keV Ar+ 92Mo 100Mo 52 """'1015 [7,8)
Ge 5 keV Ar+ 70Ge 76Ge 51 """'1015 [7,8)
The latest data available suggest that, at the lowest bombarding fiuences avail-
able, the degree of fractionation can become """' 5 %. We will see that the above
measurements are consistent with the measurements in this study taken at the
lowest fiuences yet. The other aspect of istopic fractionation that this study dra-
matically clarifies is the degree to which the low fiuence isotopic fractionation can
- 5-
depend on angle. There is very little data available on angular dependence. Rus
sell et al. [10] made a measurement of the angular dependence of 6 (4°Caj44 Ca) by
measuring the istopic composition of sputtered material ejected into polar angular
ranges 5- 25° , 25-41°, and 41- 72° . The fractionation 6 (4°Caj44 Ca) was found
to be 13.3%0 , 17.3%0 , and 8.0%0 for a fluorite (CaF2) target bombarded with
"' 1.3 - 2.4 x 10¹⁷ em - 2. This angular fractionation is observed to persist even
when the overall isotopic composition of the sputtered flux is equal to the bulk
composition of the target.

- 6 -
Chapter 2 Experimental Methods
2.1 The Sputtering Experiments
The first stage of the experiments consisted of bombarding targets of known
isotopic composition, thereby sputtering the target material onto carbon collectors
maintained in a well defined geometry.
2.1.1 The In : Ga Sputtering
The In : Ga sputtering was performed at Yale University by Dr. Kevin Hub
bard. The conditions of these bombardments are very similar to those for the
92Mo : 100Mo experiments. The important differences will be discussed in chap
ter 4.
2.1.2 The Mo Sputtering
In the 92 Mo : 100 Mo experiments the sputtering took place in the target room
of the Cal tech 6MV (million volt) Van de Graaff Tandem Accelerator. The geometry
of the target chamber in relation to the ke V accelerator and the 6MV machine is
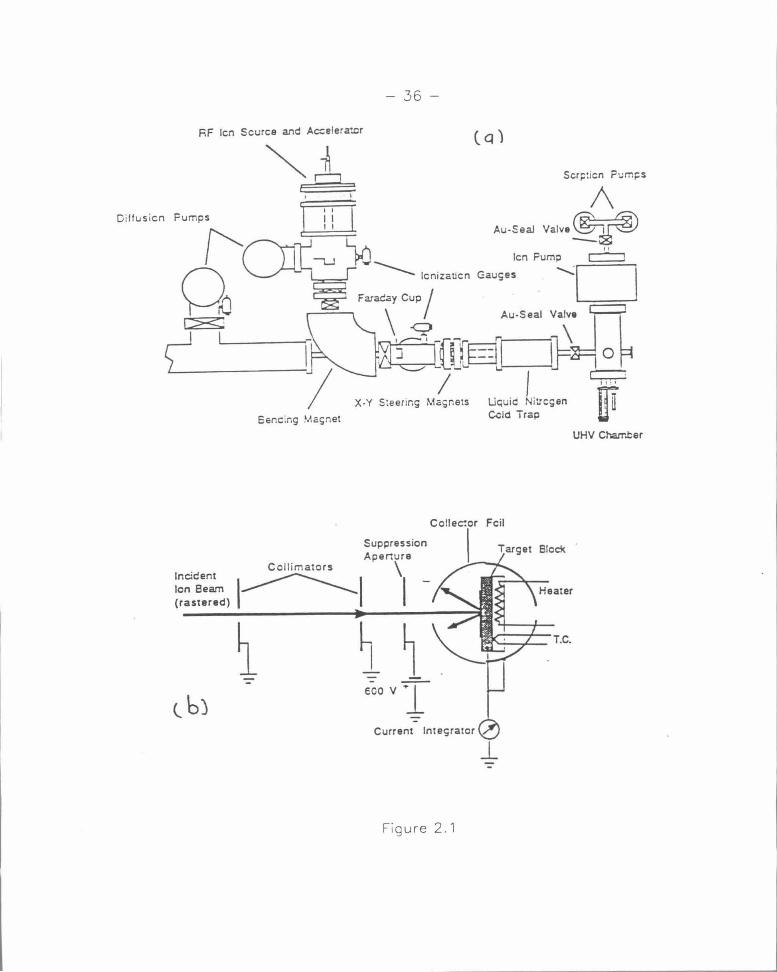
rendered in figure 2.1. This station was originally designed so MeV and keV ions
could be used in one experiment in :Jitu. The keV accelerator consisted of an RF
(radio frequency) ion source connected to a short accelerating column followed by
focusing and steering optics including a 90 degree double focusing sector magnet ,
which was used to momentum analyze the ions. There were additional focusing and
steering optics just upstream from the target chamber. The targets were mounted in
an ion pumped UHV (ultra high vacuum) chamber immediately following an in line
LN2 cold trap. The ultimate pressure of the target chamber was typically "" 10-9
Torr without beam. When the ion beam was directed into the target chamber the
pressure rose to"" 1 to 5xlo-s Torr; however this pressure was probably dominated
- 7-
by the noble gas used in the ion source to provide the incident ions and would have
little effect on the sputtering process.2·1 Both Xe+ and Ar+ were used to bombard
the targets, one ( Ar) lighter than Mo and one (Xe) heavier. The energies of the
bombarding ions were selected as 5keV and lOkeV. The ion optics become difficult
much below 5keV while the 90 degree magnet was incapable of bending anything
more energetic than lOkeV Xe+ . The ion beam was rastered over the target surface
during the bombardment to insure a uniform dose. Typical rastering frequencies
were several Hz for one direction and a fraction of a Hz for the other. Bombardment
times were as long as several hours for large doses, and never less than "' 5 min.
even for the lowest dose runs.
The targets were "' 5 mg./ em. 2 Mo foil manufactured at 0 ak Ridge National
Laboratory to have a 1:1 ratio (50 atomic percent each) of 92 Mo and 100Mo with
only t race concentrations of the other stable Mo isotopes. The large 80%o mass
difference was intended to accentuate any mass effect present in the sputtering of
the foils.
The foils were etched in a 1:1 mixture of HCl and H2 0 2 diluted with deionized
water then rinsed with isopropanol and warm air dried prior to being loaded into
the target chamber. Once loaded and evacuated to "' 1 x 10⁻⁶ Torr the chamber
was baked for 24 hours at 300 co after which the base pressure in the chamber fell
to "' 1 x 10⁻⁹ Torr.
During the bombardment the targets were held at an elevated temperature of
150 ± lC0, which helped to maintain a relatively clean surface. The geometry of the
interior target chamber is depicted in figure 2.2. The collectors were carbon sheets
several mils thick, and were held inside a right cylinder of circular cross section.
There were "' 0.25 in. holes along the length of the foil holder that allowed the
beam to pass through to the targets. Corresponding holes were cut in the carbon
foils making the minimum angle for which sputtered material could be measured
2 ·1 See appendix A for a discussion of various issued related to vacuum requirements and surface cleanliness in surface analysis.
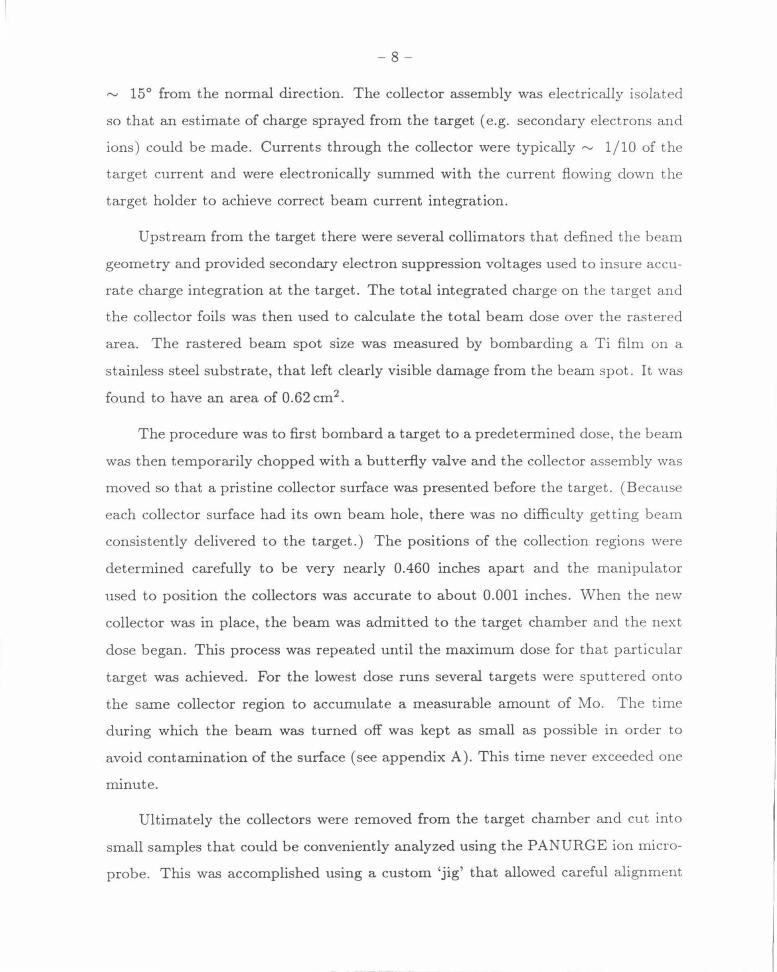
- 8-
......_, 15° from the normal direction. The collector assembly was electrically isolated
so that an estimate of charge sprayed from the target (e.g. secondary electrons and
ions) could be made. Currents through the collector were typically ......_, 1/10 of the
target current and were electronically summed with the current flowing down the
target holder to achieve correct beam current integration.
Upstream from the target there were several collimators that defined the beam
geometry and provided secondary electron suppression voltages used to insure accu
rate charge integration at the target. The total integrated charge on the target and
the collector foils was then used to calculate the total beam dose over the rastered
area. The rastered beam spot size was measured by bombarding a Ti film on a
stainless steel substrate, that left clearly visible damage from the beam spot . It was
found to have an area of 0.62 cm2 .
The procedure was to first bombard a target to a predetermined dose, the beam
was then temporarily chopped with a butterfly valve and the collector assembly was
moved so that a pristine collector surface was presented before the target . (Because
each collector surface had its own beam hole, there was no difficulty getting beam
consistently delivered to the target .) The positions of the collection regions were
determined carefully to be very nearly 0.460 inches apart and the manipulator
used to position the collectors was accurate to about 0.001 inches. When the new
collector was in place, the beam was admitted to the target chamber and the next
dose began. This process was repeated until the maximum dose for that particular
target was achieved. For the lowest dose runs several targets were sputtered onto
the same collector region to accumulate a measurable amount of Mo. The time
during which the beam was turned off was kept as small as possible in order to
avoid contamination of the surface (see appendix A) . This time never exceeded one
minute.
Ultimately the collectors were removed from the target chamber and cut into
small samples that could be conveniently analyzed using the PANURGE ion micro
probe. This was accomplished using a custom 'jig' that allowed careful a lignment
- 9-
of the collectors and maintained fixed registration so that angular positions of the
collector surface could be repeatably positioned on the sample holder of the micro
probe. Positioning repeatability was determined to be,..__ ±50p. with moderate care
in a ligning the samples.
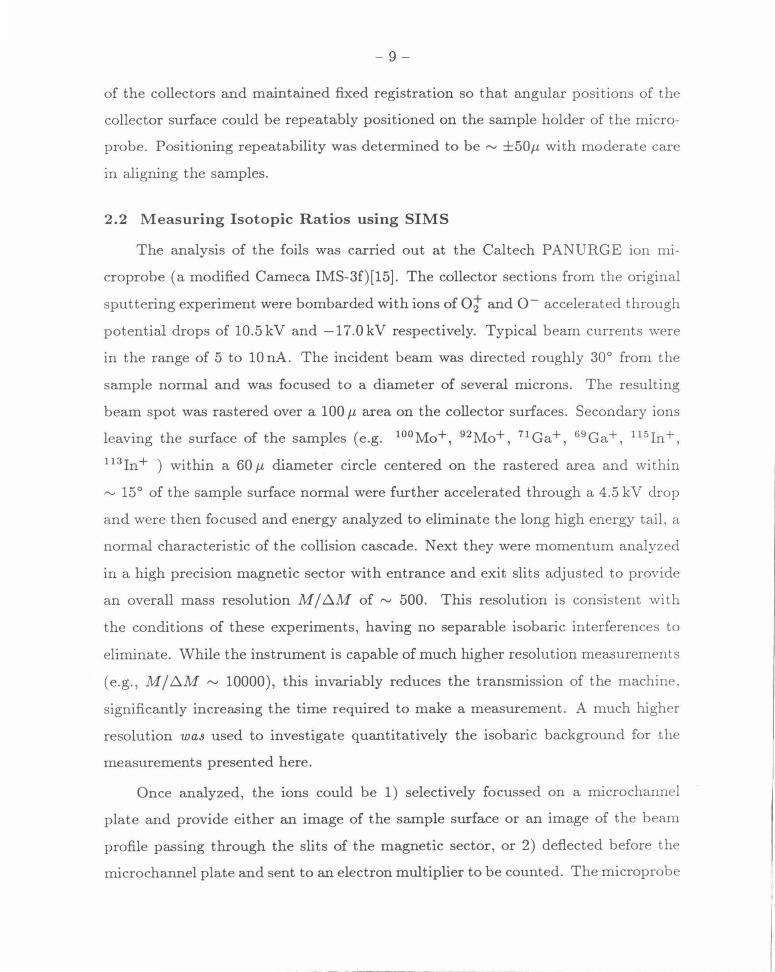
2.2 Measuring Isotopic Ratios using SIMS
The analysis of the foils was carried out at the Caltech PANURGE ion mi
croprobe (a modified Cameca IMS-3f)[15]. The collector sections from the original
sputtering experiment were bombarded with ions of o; and o- accelerated through
potential drops of 10.5kV and -17.0kV respectively. Typical beam currents were
in the range of 5 to 10 nA. The incident beam was directed roughly 30° from the
sample normal and was focused to a diameter of several microns. The resulting
beam spot was rastered over a 100 p. area on the collector surfaces. Secondary ions
leaving the surface of the samples (e.g. 100 Mo+, 92Mo+, 71 Ga+, 69 Ga+, 115 In+,
113In+ ) within a 60 p. diameter circle centered on the rastered area and within
,..__ 15° of the sample surface normal were further accelerated through a 4.5 kV drop
and were then focused and energy analyzed to eliminate the long high energy tail, a
normal characteristic of the collision cascade. Next they were momentum analyzed
in a high precision magnetic sector with entrance and exit slits adjusted to provide
an overall mass resolution M/b.M of,..__ 500. This resolution is consistent with
the conditions of these experiments, having no separable isobaric interferences to
eliminate. While the instrument is capable of much higher resolution measurements
(e.g., Mjb.M ,..__ 10000), this invariably reduces the transmission of the machine,
significantly increasing the time required to make a measurement. A much higher
resolution was used to investigate quantitatively the isobaric background for the
measurements presented here.
Once analyzed, the ions could be 1) selectively fo cussed on a microchannel
plate and provide either an image of the sample surface or an image of the beam
profile passing through the slits of the magnetic sector, or 2) deflected before the
microchannel plate and sent to an electron multiplier to be counted. The microprobe
- 10-
runs under the control of an HP9845B workstation via an IEEE-488 bus connected
to all the relevant power supplies and meters/instruments.
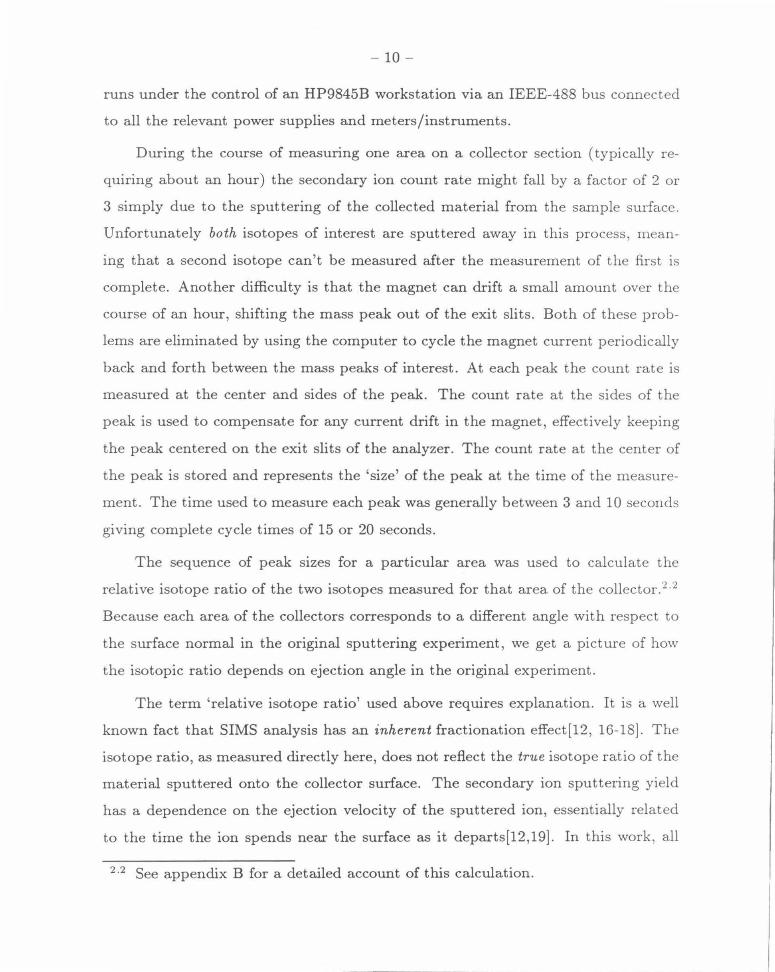
During the course of measuring one area on a collector section (typically re
quiring about an hour) the secondary ion count rate might fall by a factor of 2 or
3 simply due to the sputtering of the collected material from the sample surface.
Unfortunately both isotopes of interest are sputtered away in this process, mean
ing that a second isotope can't be measured after the measurement of the first is
complete. Another difficulty is that the magnet can drift a small amount over the
course of an hour, shifting the mass peak out of the exit slits. Both of these prob
lems are eliminated by using the computer to cycle the magnet current periodically
back and forth between the mass peaks of interest. At each peak the count rate is
measured at the center and sides of the peak. The count rate at the sides of the
peak is used to compensate for any current drift in the magnet , effectively keeping
the peak centered on the exit slits of the analyzer. The count rate at the center of
the peak is stored and represents the 'size' of the peak at the time of the measure
ment. The time used to measure each peak was generally between 3 and 10 seconds
giving complete cycle times of 15 or 20 seconds.
The sequence of peak sizes for a particular area was used to calculate the
relative isotope ratio of the two isotopes measured for that area of the collector.2 ·2
Because each area of the collectors corresponds to a different angle with respect to
the surface normal in the original sputtering experiment, we get a picture of how
the isotopic ratio depends on ejection angle in the original experiment.
The term 'relative isotope ratio' used above requires explanation. It is a well
known fact that SIMS analysis has an inherent fractionation effect(12, 16-18]. The
isotope ratio, as measured directly here, does not reflect the true isotope ratio of the
material sputtered onto the collector surface. The secondary ion sputtering yield
has a dependence on the ejection velocity of the sputtered ion, essentially related
to the time the ion spends near the surface as it departs[12,19]. In this work, all
2 ·2 See appendix B for a detailed account of this calculation.

-11-
of the isotopic fractionations are reported with respect to the near normal angle
(determined by target/collector geometry) at the highest beam fiuences available.
In the case of 92 Mo:100Mo this corresponds to the 5.0 keV Xe+ bombardment at
"' 20 x 10-15 cm- 2 . We will see in chapter 4 that when sputtering a liquid target,
the fiuence is irrelevant to the isotopic fractionation of the sputtered material. This
means that, in the In- Ga experiments we can only measure the zero fiuence limit of
the relative fractionation of the In and Ga isotopes as a function of ejection angle.
In performing the SIMS analysis some concerns developed regarding the ac
curacy of the results. It had been observed previously that Heavy Ion Rutherford
Backscattering (HIRBS) analysis of the foils was very difficult due to unusually long,
low energy 'tails' in the HIRBS spectra.[20] These tails could be a result of the rel
atively 'rough' nature of the machined carbon foil surfaces. On the other hand, it
is also possible that the Mo could have diffused into the carbon foil , giving 'tails'
from the depth profile of diffused Mo. This could be a problem in SIMS analysis
because the diffusion depth would be mass dependent, resulting in a dependen ce of
the isotope ratio on time during the SIMS analysis. Another effect that was watched
for was 'secondary preferential sputtering.' Because there were two isotopes on the
collectors it seemed plausible that they might suffer from a preferential sputtering
effect similar to the one we were trying to measure from the original metal surface.
To the degree that this secondary preferential sputtering was constant, it was not
an issue, because it would be corrected along with any other overall instrumental
fractionations, when the results were normalized as outlined above. During the vast
majority of SIMS measurements there was no indication of any systematic trend in
the isotope ratio over time. However, there were several instances where an unusual
' hot spot' was discovered on the collectors that had an isotopic ratio that was 1)
unusually high compared to the measured isotope ratio in the vicinity (e.g., 150.0 f-L
in any direction from the hot spot) and 2) became systematically higher the longer
the SIMS analysis progressed. The locations could be re-analyzed at any time with
essentially the same result. These points are currently suspected to be the result of

- 12-
contamination of the either the collectors or the targets with some of the pure 92 Mo
used in a related experiment. This seems surprising in view of the considerable
precautions taken to avoid such a contamination. Fortunately they do seem to have
a characteristic signature and can be fairly easily identified and eliminated from the
data at the outset.
There is also evidence that the surface of the Mo samples was at least par
tially oxidized before the bombardment. This is not entirely surpnsmg because
they were exposed to air as they were loaded into the target chamber. Ruther
ford Backscattering analysis of the collector foils has indicated that the sputtering
yield of the Mo isotopes increased by about a factor of 2 during the bombardment.
This can be explained by assuming that the oxygen on the surface of the Mo was
sputtered preferentially and as it was sputtered away, the relative yield of Mo in
creased. TRJM[28] calculations were performed that indicate that it would only
require'""" 25% coverage of 0 to reduce the Mo sputtering yield by a factor of 2. As
the 0 is sputtered the yield of Mo presumably goes up to its 'clean' surface value.
It is difficult to determine the precise effect this might have on the isotopic frac
tionation. There is evidence that the isotopic fractionation is relatively insensitive
to the chemical matrix of the solid[lO], however it is not immediately clear how this
should be understood theoretically (e.g., see chapter 5). In any case the presence
of 0 at the surface is indicated and should be kept in mind when interpreting these
results.
- 13-
Chapter 3
Preferential Sputtering of Mo Isotopes
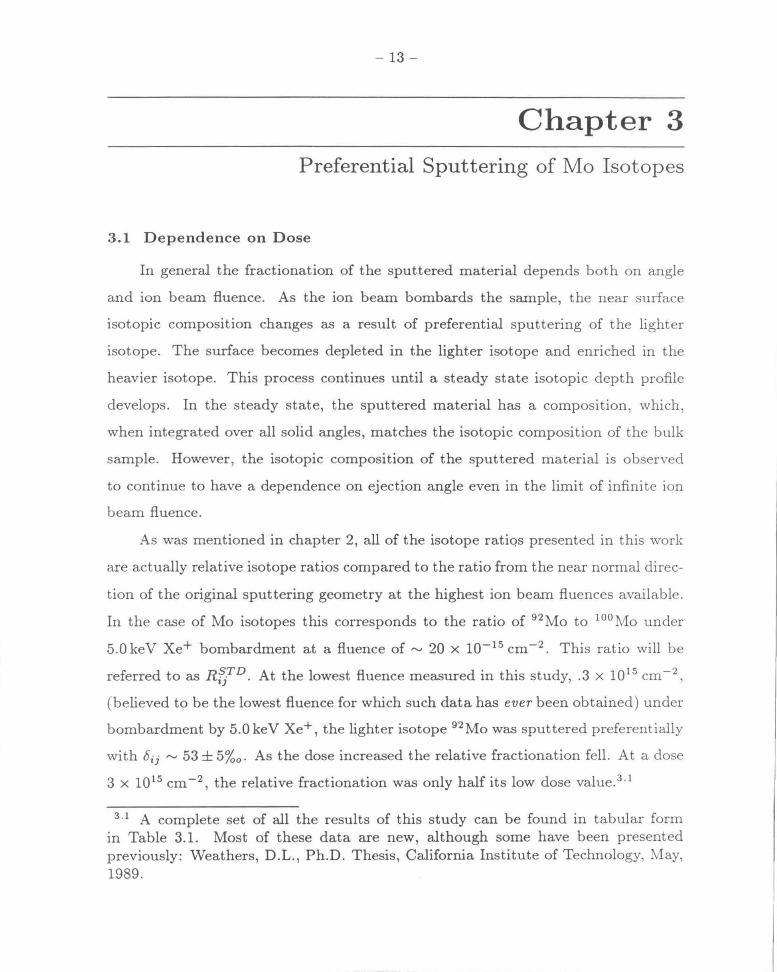
3.1 Dependence on Dose
In general the fractionation of the sputtered material depends both on angle
and ion beam fluence. As the ion beam bombards the sample, the near surface
isotopic composition changes as a result of preferential sputtering of the lighter
isotope. The surface becomes depleted in the lighter isotope and enriched in the
heavier isotope. This process continues until a steady state isotopic depth profile
develops. In the steady state, the sputtered material has a composition, which,
when integrated over all solid angles, matches the isotopic composition of the bulk
sample. However, the isotopic composition of the sputtered material is observed
to continue to have a dependence on ejection angle even in the limit of infinite ion
beam fl.uence .
As was mentioned in chapter 2, all of the isotope ratiqs presented in this work
are actually relative isotope ratios compared to the ratio from the near normal direc
tion of the original sputtering geometry at the highest ion beam fl.uences available.
In the case of Mo isotopes this corresponds to the ratio of 92 Mo to 100 Mo under
5 .0 ke V Xe+ bombardment at a fluence of "" 20 x 10-15 em - 2. This ratio will be
referred to as Rf{D. At the lowest fluence measured in this study, .3 x 1015 cm- 2,
(believed to be the lowest fluence for which such data has ever been obtained) under
bombardment by 5.0 keV Xe+, the lighter isotope 92 Mo was sputtered preferentially
with bij ""53± 5%0 • As the dose increased the relative fractionation fell . At a dose
3 x 1015 cm-2 , the relative fractionation was only half its low dose value.3·1
3 ·1 A complete set of all the results of this study can be found in tabular form in Table 3.1. Most of these data are new, although some have been presented previously: Weathers, D.L., Ph.D. Thesis, California Institute of Technology, May, 1989.
- 14-
Figure 3.1 shows the fractionation of the Mo isotopes as a function of ion beam
fluence measured in the near normal direction under bombardment of Ar+ and Xe+
ions with energies of 5.0 keV and 10.0 keV respectively. Note that except for the case
of 10.0 ke V Xe+, the relative composition of the sputtered material goes to ,....._ 1.0 in
the limit of 'infinite' fluence. This is an indication that the high dose, near normal
estimate of the steady state composition Rf{D is close to a true steady state value.
The 10.0 keV Xe+ ratio appears to be falling still at the highest fluence measured,
suggesting that it too might eventually reach ,....._ 1, given a large enough dose. In
any case our value of Rf{D is, if anything, low. This means ratios calculated using
our experimental Rf{D will be inherently conservative. Furthermore, because we
are measuring relative to the near normal we are also underestimating the absolute
fractionation effect compared to the bulk ratio because, in the steady state, it
is the integrated sputtered composition that is equal to the bulk ratio, not the
composition in the normal direction. As we will see, the theoretical fractionation 8fj , (i.e., 8ij compared to the true bulk composition, as opposed to our experimentally
de termined Rf{D) is largest in the near normal direction for 5.0 keV Xe+, and
remains non-zero there, even in the infinite fluence limit. Finally the 'fluence range',
over which the fractionation changes significantly, is also nearly the same for both
energies of a given ion species. Clearly these systems are all qualitatively similar ,
at least as far as dose dependence is concerned. At low doses the lighter isotope
is preferentially sputtered with a fractionation of 30 to 50%o until, after ,....._ 2 x
1016 ions/cm2 or so, the overall fractionation goes essentially to zero.
3.2 Dependence on Angle
Figures 3.2 through 3.8 show the angular dependence of the relative isotope
ratios of 92 Mo compared to 100Mo relative to the standard Rf{D, for a series of
doses and ion/ energy combinations. The most thoroughly investigated case was that
of 5.0 keV Xe+. The effects here were large, meaning that a statistically m eaningful
conclusion could be drawn with a reasonably short experiment.
The general trend in the data in the 5.0 keV Xe+ case is that the fract iona-
- 15-
tion goes down at higher angles from the surface normal. The effect clearly doesn't
disappear as the primary ion beam dose is decreased. In fact, it seems that addi
tional ion beam dose has the sole effect of (sliding' the whole curve down by about
50%0 in the infinite fiuence limit . The shape of the curve does appear to change
som ewhat at very high fiuence. This might be due to changes in surface topology
as a result of ion beam damage. There is evidence, namely Heavy Ion Rutherford
Backscattering data, indicating that the surface of the samples was suffering from
some modification in the high fiuence runs [20]. Some sharp angular features are
therefore not entirely surprising in these instances. At any given fiuence there is
,...., 25%0 difference between the isotopic ratios measured near the normal and far
from the normal direction. The other ion/energy combinations produce results that
a re not altogether different from the 5 kev Xe+ case. In general the fractionation
falls with dose and, with the exception of the low dose 10 keV Ar+, the fraction
ation falls somewhat with the angle from the normal directon. It will be seen in
chapter 5 that these results stand in fairly sharp contrast with the predictions of
most analytical theories, and are in at least partial agreement with other computer
simulation efforts [21-23].
-16-
Chapter 4
Sputtering of Ga/In Isotopes from the Eutectic Alloy
4.1 Issues Involved in Sputtering from a Liquid Target
The possibility of sputtering from a liquid target holds special interest in a
study of fractionation because of the ability of a liquid surface to 'repair' itself,
under all but the most intense bombardments, to the degree that it appears forever
undamaged. A typical self diffusion constant for a liquid metal near its melting
point is 1012 A2 /s. Typical incident ion beam current densities are 1f.l-A/cm2 or
,....., 1012 ions/(cm2 s) for these studies. Damage cross sections are typically on the
order of 10-14 cm2 indicating that the timescale for two collisions in the same region
of impact is ,....., 100 s. Given the large self-diffusion constants for liquid m etals it
seems clear that isotopic equilibrium should be maintained in the surface layer as
long as the bulk ratio of isotopes is fixed. A sufficiently long bombardment might
deplete the bulk sample of a particular isotope, but this is not an issue as long as
most of the sample remains unsputtered. (From the conditions used in this study
it would take on the order of 1010 s or ,....., 300 years to reach such a condition.) As
a result, sputtering of a liquid metal target is essentially equivalent to the extreme
low fiuence limit of sputtering from a solid target. Given the efforts required to
make meaningful measurements at low fiuence in the Mo system this is a profound
improvement.
Another distinctive feature of sputtering from a liquid target is that the surface
may be easily cleaned prior to the collection experiment by sputtering any impuri ties
away without regard to possible damage to the surface. The presence of oxides or
other contaminants can be largely eliminated from consideration. This is also in
sharp contrast with the solid target experiment where preparing a clean initial target
surface without modifying the isotopic composition is problematic.
-17-
There is a particularly interesting issue associated with the structure of liquid
In:Ga eutectic. There is a built in inhomogeneity in the In:Ga system due to
an effect known as Gibbsian segregation[24]. There is a large reduction in the
free energy of In when it sits on the surface, compared to its value in the bulk
liquid[24] . This has the remarkable effect of rendering the surface layer of the
liquid extremely enriched in In compared to the bulk composition. Experiments by
Dumke[24], and Hubbard[25], have shown that the surface composition is "' 96%
In, while in the bulk In consists of only "' 9.7% of the overall composition. This
has two effects on the sputtering yields of In and Ga: 1) In is sputtered with a
much higher yield than one would expect from the composition in the bulk, and 2)
the angular distributions of sputtered In and Ga atoms are very different, with In
having a roughly Yin"' cosl.8 (8) dependence and Ga falling off much more sharply
Yea"' cos3·2 (8).
These factors play a role in the analysis of the collectors for isotopic fraction
ation. Because there is no change in the surface isotopic composition with dose
we cannot normalize the In:Ga results in the same fashion as was done in the Mo
case. There, the largest dose run was used as the standard against which all other
isotope ratios were measured. The idea being that after a sufficiently large dose,
the integrated sputtering yield must represent the bulk composition as a result of
changes in the near surface target composition. For the liquid target, the sputter
ing yield is essentially dose independent meaning that there is no reliable reference
to compare the SIMS data to in order to calculate the absolute isotopic ratio of
sputtered flux. As a result the only meaningful measurement that can be made is
that of the relative fractionation of the In:Ga isotopes with respect to angle. The
angular dependence of the fractionation of the In and Ga isotopes is given below.
All measurements are made relative to the unknown fractionation of the isotopes
at the near normal direction ("' 6°.) The fractionation data for Ga isotopes is also
limited to about 70° from the normal direction due to the sharp decrease of Ga
coverage on the collectors at large angles, a result of the corresponding sharpness of
the Ga sputtering yield as a function of emission angle. It was also discovered that
- 18-
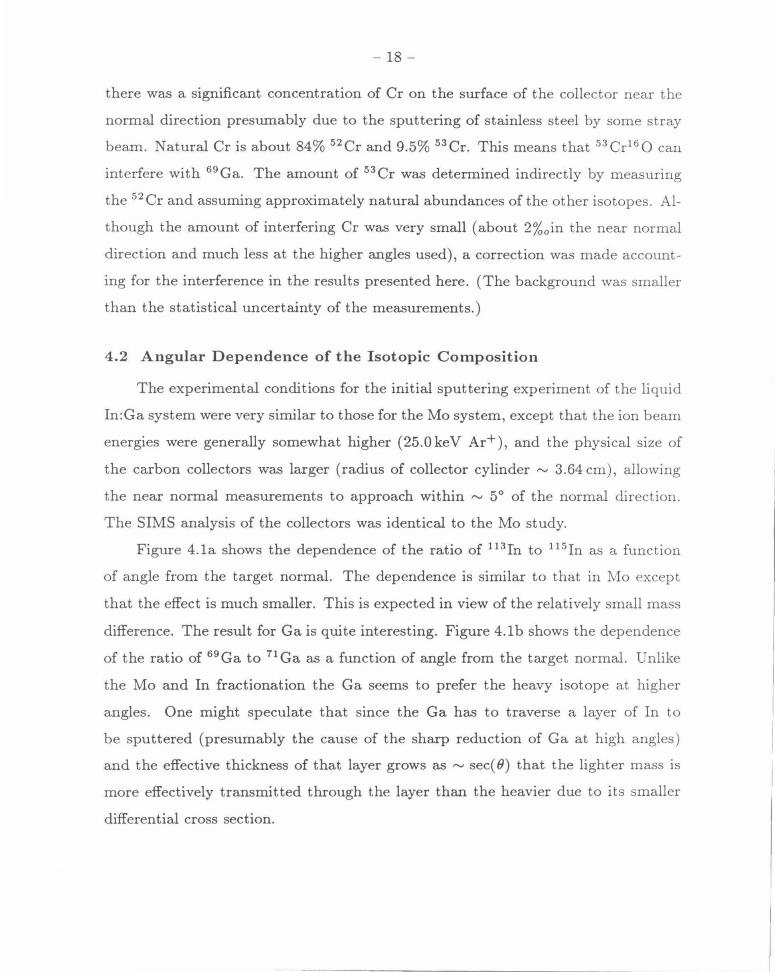
there was a significant concentration of Cr on the surface of the collector near the
normal direction prestrmably due to the sputtering of stainless steel by some stray
beam. Natural Cr is about 84% 52 Cr and 9.5% 53 Cr. This means that 53 Cr16 0 can
interfere with 69 Ga. The amount of 53Cr was determined indirectly by measuring
the 52 Cr and assuming approximately natural abundances of the other isotopes . Al
though the amount of interfering Cr was very small (about 2%0 in the near normal
direction and much less at the higher angles used), a correction was made account
ing for the interference in the results presented here. (The background was smaller
than the statistical uncertainty of the measurements.)
4.2 Angular Dependence of the Isotopic Composition
The experimental conditions for the initial sputtering experiment of the liquid
In:Ga system were very similar to those for the Mo system, except that the ion beam
energies were generally somewhat higher (25.0 keV Ar+), and the physical size of
the carbon collectors was larger (radius of collector cylinder ,....., 3.64 em), allowing
the near normal measurements to approach within ,....., 5° of the normal direction.
The SIMS analysis of the collectors was identical to the Mo study.
Figure 4.1a shows the dependence of the ratio of 113In to 115 In as a function
of angle from the target normal. The dependence is similar to that in Mo except
that the effect is much smaller. This is expected in view of the relatively small mass
difference. The result for Ga is quite interesting. Figure 4.1b shows the dependence
of the ratio of 69 Ga to 71 Ga as a function of angle from the target normal. Unlike
the Mo and In fractionation the Ga seems to prefer the heavy isotope at higher
angles. One might speculate that since the Ga has to traverse a layer of In to
be sputtered (presumably the cause of the sharp reduction of Ga at high angles)
and the effective thickness of that layer grows as ,....., sec( B) that the lighter mass is
more effectively transmitted through the layer than the heavier due to its smaller
differential cross section.
- 19 -
Chapter 5 Theoretical Understanding of P referential Sputtering
5.1 Predictions of Analytical T heory
The most dominant, and largely successful, theory of sputtering is that due
to Sigmund[26]. This theory results from the linearization of a m odified Boltz
mann equation in the 'dilute cascade limit'. This is a reasonable approximation
if the density of the cascade is low, (i.e., moving atoms rarely collide with atoms
previously set in motion) , but still contains many atoms. Sputtering is t reated in
this framework by embedding a mathematical surface in the bulk of the cascade
and calculating the flux of particles moving across it, taking into account the sur
face binding energy, which prevents low energy recoils from being sput tered. To
firs t order in the mass difference, this theory predicts that the effect of p referential
sputtering comes entirely from the relative differential cross sections for collisions
between the light and heavy isotopes. In particular the light isotope is predicted to
be enriched isotropically in the sputtered flux by a factor of:
( 5.1 )
where m is the characteristic exponent from the differential cross section ,
(5.2)
appropriate for the energy of a particular class of collisions. The power m comes
from approximating the shielded Coulomb potential as a simple power law for in
cident particles of energy E and recoiling atoms of energy T . T is limited to the
range 0 to / ij E where / ij is the maximum fraction of the energy of the incident
particle that can be transferred to the stationary atom: / ij = 4MiMi /( M i + lv11 )2
.
The factor Cij is calculated as:
m ::::; 1/4, (5.3)
-20 -
where aii = 0.219 A, Aii ~ 52(ZiZj)314 eV, Am is a well defined constant depen
dent only on m, e the elementary charge, and a0 = 0 .529 A the radius of the first
Bohr orbital. The value of m often used on theoretical grounds is m 8 M = 0.055 ,
appropriate for a Born-Mayer potential. It is clear, as Sigmund has pointed out[27],
that the factor Iii can only lead to preferential sputtering as a second order effect
in the mass difference. This can most easily be seen[27] by writing
M · · =M±8M· · 1 ,) 1 ,)) ( 5.4a)
where
8Mi,i ~ M, (5.4b)
then Mt:j becomes:
· · = 1±m--' + ... M m Mm ( 8Mij ) I,J M ' (5.4)
and:
(8Mi- 8Mi)
2
Iii = 1 - 2M . .. ~ 1. (5.5)
The fact that the fractionation goes like (Mi/Mi) 2 m while Cii only has a factor
of ( M;j Mi )m can be traced[27] to two separate contributions to the fractionation
according to Sigmund's theory. One factor of (M;j Mi )m comes from the dependence
in the nuclear stopping power Si on Cij and the other comes from a factor of C;1
in the cascade recoil density Fij. Basically this means that lighter atoms are harder
to stop (one factor) and easier to get going (the other factor).
If one assumes that m = .055 is a reasonable value then Sigmund's theory
predicts an overall fractionation of 9.2%o for the 92 Mo :100Mo experiment. This
is clearly low compared to the observed fractionation. The value of m, consistent
with the theory, would be m ~ 0.3, typical of much higher energy collisions than
are appropriate for use in sputtering theory. One objection to the application of
this theory directly to the systems under consideration might be that if there is
significant oxygen contamination at the surface of the Mo sample, then the average
mass would be significantly lower than the average mass of the Mo isotopes. This
- 21 -
would be contrary to the condition of 5.4b. However, it should be noted that other
experiments(lO] seem to indicate that isotopic fractionation is relatively insensitive
to the chemical composition of the sample in some cases, and Sigmund has readily
compared predictions based on this theory to experiments[27] for which relation
5.4b is clearly not satisfied. In any case, the theory predicts no angular dependence
on the isotopic fractionation and in most of the systems studied here there was clear
angular dependence, even in the 'low fluence' limit.
5.2 Computer Simulations
There are several interesting advantages to using computer simulations to study
isotopic fractionation in sputtering. The problem is 'reduced' to following the tra
jectories of atoms obeying some set of rules designed to approximate, to one degree
or another, the actual trajectories of atoms in the cascade. There have developed
two basic strategies for attacking this problem: The Binary Collision Approxima
tion (BCA)[28], and Molecular Dynamics (MD)[29] simulation. The BCA approach
is most appropriate in the high energy regime where collisions occur with distances
of closest approach that are small compared to the average distance between atoms.
As the energy falls, special 'tricks' need to be employed to keep track of weak, si
multaneous collisions. The advantage of such a scheme is simplicity and speed.
Because atoms are assumed to be stationary until involved in a collision there is no
need to keep track of any atoms other than those in the cascade (i.e., with enough
energy to be sputtered). Collisions are dealt with using approximate scattering
integrals treated as two body events. There is essentially no limit to the depth
scale that can be included in the cascade, and the number of atoms involved can
become quite high without seriously degrading performance. The MD version is
comparatively slow and (currently) limited in its ability to deal with large targets
and deep cascades. But its superior performance at low energy makes it an ideal ap
proach for sputtering calculations where, presumably, the low energy regime is most
important. The idea is to follow the motion of every atom in the target by integrat
ing Newton's Second Law assuming some interaction potential between the atoms.
-22-
This potential can become quite sophisticated, including, for example, many body
effects[23) and periodic boundary conditions. The results of the experiments carried
out here compare favorably with the results of MD simulations, which indicate both
larger fractionations than predicted by equation 5.1, and angular dependence of the
isotopic fractionation[23) that is excluded by the analytical theory altogether[27].
A monte carlo BCA code has been developed to simulate, at least qualitatively,
the systems discussed here so that some more insight might be gained as to the
nature of the physical processes that lead to fractionation and to the cause of the
apparent failure of the analytical theory in explaining them. At this time the
effort is only beginning but it has shown some interesting results. The following is
a basic description of the code, which closely resembles the TRIM and TRIDYN
programs[28,30,31) used for many radiation damage, preferential sputtering, and ion
implantation studies. The latest results are discussed in relation to the analytical
theory, experimental results, and results from MD simulations.
The strategy used here was to follow a series of randomly selected binary colli
sion partners until the energy of any atom dropped below the surface binding energy,
therefore making no further contribution to the sputtering yield, or the atom was
sputtered. A ' collision' consisted of the following sequence of events:
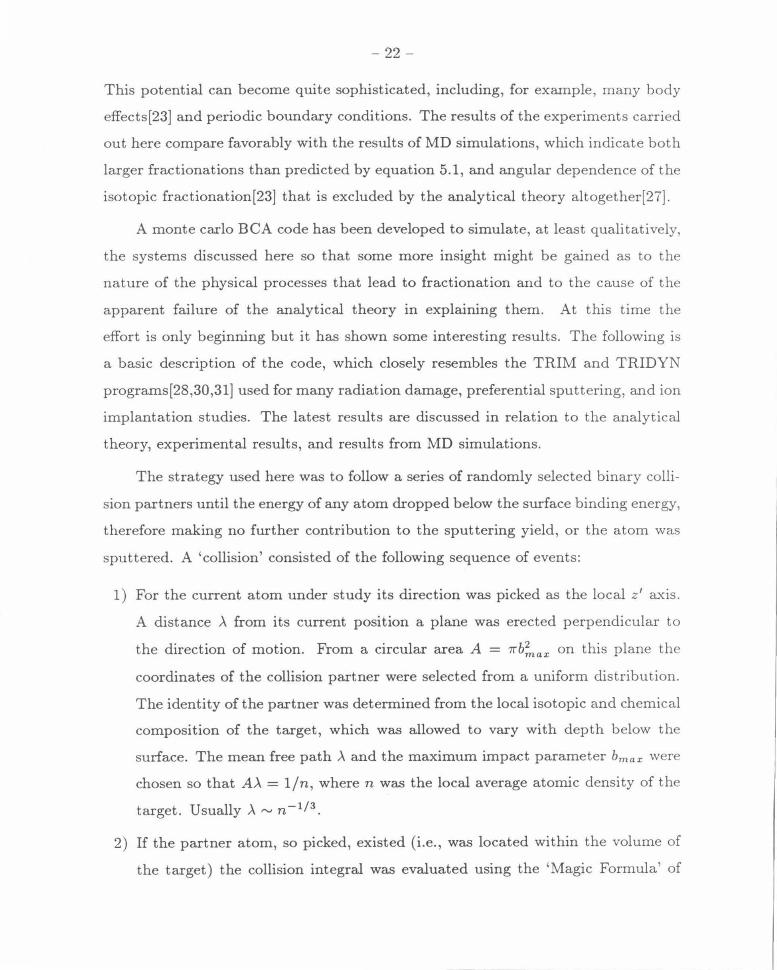
1) For the current atom under study its direction was picked as the local z ' a-xis.
A distance >. from its current position a plane was erected perpendicular to
the direction of motion. From a circular area A = 1rb~ax on this plane the
coordinates of the collision partner were selected from a uniform distribution.
The identity of the partner was determined from the local isotopic and chemical
composition of the target, which was allowed to vary with depth below the
surface. The mean free path>. and the maximum impact parameter bmax were
chosen so that A>. = 1/n, where n was the local average atomic density of the
target. Usually >. ""n- 113•
2) If the partner atom, so picked, existed (i.e., was located within the volume of
the target) the collision integral was evaluated using the ' Magic Formula' of
- 23 -
TRIM[28). This is essentially a parameterized fit for the scattering angle e as a
function of reduced energy and impact parameter, appropriate for approximate
interaction potentials between atoms in a solid. The result of the calcu la tion
gives, as a ' bonus ,' the distance of closest approach between the two atoms
involved in the collision. This could optionally be used in the calculation as
part of the electronic stopping of recoil atoms according to the formalism of
Oen and Robinson[32). Also before the collision, one could optionally add an
electronic loss proportional to the length of the path and VB.
3) Once the scattering calculation was complete the atoms ' new directions were
se t, assuming the partner started at rest in the target. The sca t tering direc
tions were determined first in the local basis of the incoming a tom , and t hen
converted to the coordinate system of the target. The incoming atom was then
propagated to its new location in the target . The distance of propaga tion was
the mean free path ,\ minus the so called time integral r, which is simply a
correction for the fact that , after the collision, the incoming atom appears to
come from a point somewhat before the plane of the partner.
4) Finally the partner atom was followed until it, and all its partner atoms, were
sputtered or stopped, and then the steps were repeated for the incoming a tom.
This highly recursive algorithm was implemented as a single recursive func
tion in the ' C ' programming language insuring that all collisions were treated
equivalently.
The target composition can also be adjusted and 'relaxed' in response to t he
b ombardment by keeping track of the number of atoms originating and stopp ing in
discrete layers of the target. As the composition profile of the target changes t he
sputtering yield naturally responds, ultimately leading to a steady st a t e profile.
Some results of the simulation are plotted in figure 5.1, which shows the ra
t io of 92 Mo to 100Mo atoms sputtered into angular bins from 0- 30° , 30- 60°, and
60- 90°. The 'target' in this case was 90% Mo (50:50 mixture of isotopes) and
10% Oxygen to try to account for an oxidized layer. It is difficult to make any
-24-
clear interpretation of these results at this early stage, due to the poor statistics
accumulated so far; however, it does appear that although overall sputtering yield
of Mo calculated in this case is about right (Y ,....._ 3), the isotopic fractionation is
much more nearly consistent with the analytical theory than the experiment. The
oxygen, on the other hand is clearly sputtered very preferentially compared to the
Mo, as would be expected due to its much smaller mass. It seems that the failing
of the analytical theory cannot be explained by simply saying that it treats the
surface or the time evolution of the cascade too naively. The Monte Carlo BCA
strategy, while admittedly somewhat simplistic, allows for considerable complexity
in the cascade, including anisotropic momentum distributions, essentially arbitrary
energy distributions, sophisticated treatment of electronic stopping, and a realistic
treatment of an atomically ' rough' surface. Yet it also appears to fail to predict
the measured fractionation, at least in the relatively simple form used here. 5 ·1 This
may indicate that the essential ingredient missing from the analytical theory and
the BCA strategy, both of which perform well when predicting the total sputtering
yield, is the ability to deal with low-energy many-body collisions, which allows the
MD approach to match more nearly the experimental result . There is also evidence
that even within the MD simulation arena one can find significant differences be
tween calculations done with two-body potentials and many body-potentials[23].
These kinds of subtleties would be very difficult to incorporate into either a BCA
or an analytical approach.
5.3 Outlook and Summary of Results
Significant advances have been made in the experimental determination of the
angular dependence and the overall size of isotopic fractionation due to sputtering
5 ·1 There are several improvements[30] one might make to the basic MCBCA scheme. These include allowing for multiple, simultaneous, weak collisions under some circumstances where a significant fraction of the energy of an atom can be lost in large impact parameter collisions, and a more sophisticated treatment of the surface. It is not yet clear whether addition of these improvements would significantly alter the results.
- 25-
under keV ion bombardment, especially in the low fiuence regime, using a simple
collection technique and SIMS analysis. The effects are larger than is predicted by
the dominant analytical theory and are similar to the results of some MD computer
simulations[23]. There is a rather striking angular variation in the fractionation ,
most clearly seen in the 5keV Xe+ on Mo data that indicates a 3% drop in 8ij from
the near normal to the oblique direction.
Isotopic fractionation has also been studied in the liquid metal ln:Ga eutectic
and suggests that something very interesting is happening in the inhomogeneous
surface layer where the In concentration goes from the bulk value of "" 10% to the
enriched value of "' 97%. Whereas the fractionation of the In isotopes falls with
angle, in a fashion similar to the Mo isotopes from the solid target experiments, the
Ga fractionation goes up with angle indicating a different mechanism most likely
associated with the In-rich layer at the surface.
The ln:Ga experiments suggest some possibly interesting future investigations.
The advantages of using a liquid target for studying isotopic fractionation are nu
merous, as presented in chapter 4. There are however several problems with the
In:Ga system that would be avoided in an experiment using pure Ga metal. One
could imagine sputter cleaning the target in the liquid state, effectively removing
any surface contaminants. Then the target could be re-frozen and sputtered, in
solid form, until a steady state flux is achieved. Frozen In:Ga eutectic measure
ments would be difficult to interpret due to the presence of the In enriched surface
layer. Interpretation of frozen Ga data would presumably be straightfoward. The
frozen Ga system could be measured to get an Rf{D reference for an absolute iso
topic fractionation measurement as a function of dose. The beauty of this is that
to run a 'new' sample, one merely needs to melt the target and re-freeze! Naturally
the measurement could also be done in the liquid state to get zero fiu ence data.
The use of a Monte Carlo Binary Collision Approximation (MCBCA) calcu
lation to describe isotopic fractionation is being investigated. The latest results
indicate that this t echnique produces fractionation values much more nearly in

- 26 -
agreement with the analytical theory than with the experimental data. It is sug
gested that this might help determine the essential physics required to describe mass
fractionation properly. Important things seem to be happening in the low-energy
many body regime, where the Molecular Dynamics approach is more appropriate
and appears to produce results more nearly in agreement with the experimental
data.
- 27-
Appendix A Factors Involved in Maintaining a Clean Surface
During a sputtering experiment the target surface is exposed to bombardment
by an ion beam that has been carefully energy and momentum analyzed so that
its properties are well understood. Unfortunately it is also exposed to a flux of
unwanted particles that constitute the residual gas inside the target chamber. In
the best of all possible worlds the background pressure in the target chamber due
to the residual gas would be zero. The purpose of the following discussion is to
point out the necessary conditions on the vacuum system, ion beam current, and
timescale of the experiment required to maintain a 'clean' surface during the course
of a sputtering experiment.
According to the classical equipartition theorem, atoms and molecules in an
ideal gas each get ~ kT of translational kinetic energy per degree of freedom. The
implication being that Vrms for atoms at a temperature Tis J3kT jm. This results
in a flux of particles <P per unit area per unit time striking an arbitrary surface[33]:
p
<P = v'2rrmkT' (A.l)
where P is the pressure, T is the temperature, m IS the particle mass and k is
Boltzmann's constant . If a fraction f of the particles striking the surface actually
stick to it, then the rate of sticking will be f</J . In order for the surface to remain
clean, the rate at which atoms are sputtered must exceed, by some considerable
margin, the rate at which new residual atoms stick to the surface. If the total
sputtering yield is Y and the incident ion beam flux is I incident ions per unit area
per unit time, then the condition becomes:
f<P «:: Y I . (A .2)
The effort to reduce the product f <P has been centered on reducing <P by keeping
the pressure of residual gasses in the target chamber as low as possible. Typical base
-28-
pressures in the target chamber, before an experiment, were in the neighborhood of
10-9 Torr. The target chamber pressure invariably rose with the addition of beam,
but this additional pressure was likely dominated by the ion source gas, and hence
made little contribution to the effective f<P since, presumably, f is small for noble
gasses that are only weakly adsorbed to most surfaces. Additionally f was kept
as small as possible by raising the temperature of the target to 150 co during the
bombardment, which should have removed any weakly adsorbed atoms from the
surface.
In order to reach such pressures, several additional precautions had to be taken.
All components to be loaded into the target chamber were cleaned and/or etched
carefully beforehand. All parts were rinsed in an ultrasonic bath of reagent grade
isopropyl alcohol and warm air dried before being introduced into the UHV en
vironment. Cleaned parts were handled only with clean tools and gloved hands.
Only UHV compatible materials could be used in the construction of the appara
tus. This included type 304 stainless steel structural supports, OFHC or 99.995%
pure copper conductors, MACOR or alumina insulators and carefully cleaned Ta
collimators. After the fully assembled apparatus was loaded into the target cham
ber, it was evaluated to 10-6 Torr and then the entire chamber was baked at 300 co for at least 24 hours until the base pressure reached 10-9 Torr when cool. At this
base pressure, with the beam current densities used in these studies, relation A.2
could be easily satisfied.
-29-
Appendix B
Calculation of the Ratio of Two Isotopes From SIMS Data
Several different approaches to analyzing the SIMS data were investigated as
a part of this study. It was discovered that there are some subtleties associated
with taking the ratio of two quantities that are known with finite precision. This
appendix briefly describes the nature of these subtleties and the methods used here
to avoid the associated pitfalls.
Data was taken from the Caltech PANURGE ion probe (a modified Cameca
IMS-3f)[15] as a function of time. The computer cycled the magnet from one peak
to another and counted the number of secondary ions from each peak for the same
length of time (typically 2 to 10 seconds.) The result was a sequence of ion counts
for a set of different times for each peak under investigation. Because the count
rate was roughly proportional to the coverage of sputtered atoms on the collector
surface the count rate generally fell as a function of time. A typical set of data can
be found in figure B.l. This data was taken from the Mo experiment , 5 keV Xe+
at a fiuence of 0 .3 x 1015 em - 2 .
One problem was that data for different isotopes was taken at different times,
while the coverage of atoms on the collectors was changing as a function of time
and thereby changing the count rate for both isotopes. In order to correct for
this effect the data for one isotope was interpolated between two measurements to
a get an ' averaged' value appropriate for the intermediate time during which the
other isotope was measured. It was this interpolated count that was used to get
an isotope ratio for that intermediate time. Then the ratios calculated for each
cycle were combined in a weighted average for the entire run, the weights being
determined by the statistical uncertainties of the individual ratios. This averaged
ratio was then used to determine the relative isotope ratio for that run by comparing
it to Rf{D.
- 30 -
Unfortunately it appears that there is an additional built-in bias to the above
procedure that was not immediately recognized. If, at some time during a run,
a number of ions is measured, it is only 'measured' in a statistical sense (i.e., i t
is effectively drawn from a distribution of counts that has a well defined set of
statistical moments). Let's say that the expectation value of counts from the light
isotope is J.LA = (A} and the corresponding value from the heavy isotope is J.LB = (B ).
What we wish to measure is J.LAI J.LB = (A} I (B}. What we get when we average in
the above sense is more nearly
J.LA/B =(AlB}. (B.l )
That these two quantities are different is the main point of this appendix.
In order to study this effect a more sophisticated approach was taken. A monte
carlo, non-linear least squares program was written that fit the data in a non-biased
fashion (i.e. , both isotopes were treated in an entirely equivalent manner ) . The
ratio of isotopes was one parameter and the coverage as a function of dose was fit
using a linear superposition of Legendre Polynomials and a non-linea r exponent ial
multiplier, both of which were functions of time. The result was a non-biased
estimator of the isotope ratio. Because this program was written using monte-carlo
error estimation it was easily modified to produce 'pseudo-data' representing well
known isotope ratios that could be analyzed with any technique to see built-in biases
directly. This program was then used to test other calculations.
The simplest alternative to the 'running average' calculation was the 'sum then
average' technique. In other words, add the counts from a single isotope for an entire
run taking into account appropriate weighting at the endpoints, then calculate the
ratio of the sums afterwards . At first glance this may seem equivalent to the original
scheme, but it is not . By summing the counts from one isotope for an entire run
the r elative statistical uncertainty is reduced significantly ,...., 1 I VN. This means
that non-linear fluctuations in the denominator do not bias the results away from
the 'true' mean as badly.
The net result of the pseudo-data tests was that, for the typical count rates

- 31 -
found in the lowest coverage runs used in these investigations, the results of the
running average technique were biased by about 1o- from the 'true mean' (i.e., the
ratio used by the computer to generate the pseudo-data). The sum then average
technique, and the non-linear least squares techniques, on the other hand gave con
sistent results, within statistical uncertainty, equally distributed above and below
the 'true mean.' Table B.1 gives example results for the data shown in figure B.l.
Table B.l Example of differences between three computational techniques used to determine the raw isotope ratio for the SIMS studies.
Technique
Running Average with Interpolation Sum then Average Nonlinear Least Squares with M.C. Error Estimation
a. Errors shown are ±2a.
b. The Monte Carlo error is a 95% confidence interval.
1.172±.012 1.177±.012
1.178 + .012- .013b
There may be better estimators than the non-linear least squares code or the
sum then average techniques used here, but because they give reasonable results
when applied to the computer generated pseudo-data, they were considered suf
ficient for these studies. The sum then average result never differed significantly
from the more sophisticated non-linear least squares calculation and so was used
throughout the study because it was much faster.
- 32-
References
[1] W. R. Grove, Philos. Mag. 5 (1853) 203.
[2] T. A. Tombrello, Rad. Effects 65 (1982) 389.
[3] L. C. Feldman and J . W. Mayer, Fundamentals of Surface and Thin Film Analysis (North-Holland, New York, 1986).
[4] H. L . Garvin, E . Garmire, S. Somekh, H. Stoll and A. Yariv, Appl. Optics 12 (1973) 455.
[5) P. Sigmund in Sputtering by Particle Bombardment I, R. Behrisch, ed., Topics Appl. Phys., Vol. 47 (Springer, Berlin, Heidelberg, New York, 1981).
[6] M. W . Thompson, Physics Reports, 69, 4, (1981), 335.
[7] H. Gnaser, H. Oechster, submitted to Nucl. Instr. Meth. B (1989) .
[8) H. Gnaser, H. Oechster, Phys. Rev. Lett. 63 24 (1989) 2673.
[9) J. M. Fluit, L. Friedman, A. J. H. Boerboom and J. Kistemaker, J. Chern. Phys. 35 (1961) 1143.
[10) W. A. Russell, D. A. Papanastassiou and T. A. Tombrello, Rad. Effects 52 (1980) 41.
[11] 0. Arai, Y. Tazawa, T. Shimamura and K. Kobayashi, Jpn. J. Appl. Phys. 18 (1979) 1231.
[12) N. Shimizu and S. R. Hart, J . Appl. Phys. 53 (1982) 1303.
[13) H. Gnaser and I. D. Hutcheon, Surface Sci. 195 (1988) 499.
[14) L. M. Baumel, M. R . Weller, R. A. Weller and T. A. Tombrello, Nucl. Instr. Meth. B34 (1988) 427.
[15] J. C. Huneke, J. T . Armstrong and G. J . Wasserberg, Geochim. Cosmochim. Acta 4 7 (1983) 1635.
[16] H. Gnaser and I. D. Hutcheon, Phys. Rev. B35 (1987) 877.
[17] S. A. Schwarz, J. Vac. Sci. Techno!. A5 (1987) 308.
[18] H. Gnaser and I. D. Hutcheon, Phys. Rev. B38 (1988) 11112.
[19} N.D. Lang, J . K. Novskov, Physica Scripta, T6 (1983) .
[20] D. L. Weathers, Thesis, California Institute of Technology, May 1989.
[21] M. H. Shapiro and T . A. Tombrello, Nucl. Instr. Meth. B18 (1987) 355.
[22} M. Shapiro, T. Tombrello, D. E. Harrison, Nucl. Instr. Meth. B30 (1988) 152.

- 33 -
[23] D . Lo, et al., J . Vac. Sci. Tech A6 (1988) 718.
[24] M. Dumke, Thesis, California Institute of Technology, (1983).
[25] K. Hubbard, Thesis , Yale University, (1988).
[26] P. Sigmund, Phys. Rev. 184 (1969) 383.
[27] P. Sigmund, Nucl. lnstr. Meth. B18 (1987) 375.
[28] J . P. Biersack, Nucl. lnstr. Meth. B27 (1987) 21.
[29] M. M. Jakas and D. E. Harrison Jr., Nucl. lnstr. Meth. B14 (1986) 535.
[30] J . Biersack, W . Eckstien, Appl. Phys. A34 (1989) 73.
[3 1] W . Moller, W. Eckstien, Nucl. Instr. Meth. B2 (1984) 814.
[32] 0. Oen , M. Robinson, Nucl. lnstr. Meth. 132 (1976) 647.
[33] T . L. Hill, An Introduction to Statistical Thermodynamics (Addison-·wesley, Reading, MA, 1960).
- 34-
Figure Captions
Figure 2.1 Ion Optics for the Mo experiments Schematic layout of the keV ion accelerator used in the Mo experiments showing (a) the ion beam optics, and (b) the collimation and electron supression scheme. The beamline entering on the left is the Mev line from the 6MV T andem Van De Graaff accelerator.
Figure 2.2 The sputtering apparatus for the Mo experiments Perspective diagram of the collimator and collector assemblies. The collectors are shown pulled away from the target block for clarity. The target block was as shown except that there were three fin/target combinations to allow different experiments without venting the chamber.
Figure 3.1 92 Mojl00 Mo vs. ion beam fl.uence Fractionation of Mo isotopes as a function of accumulated ion beam fl.uence (a) Ar+ and (b) Xe+ bombardment. The error bars are ±2u.
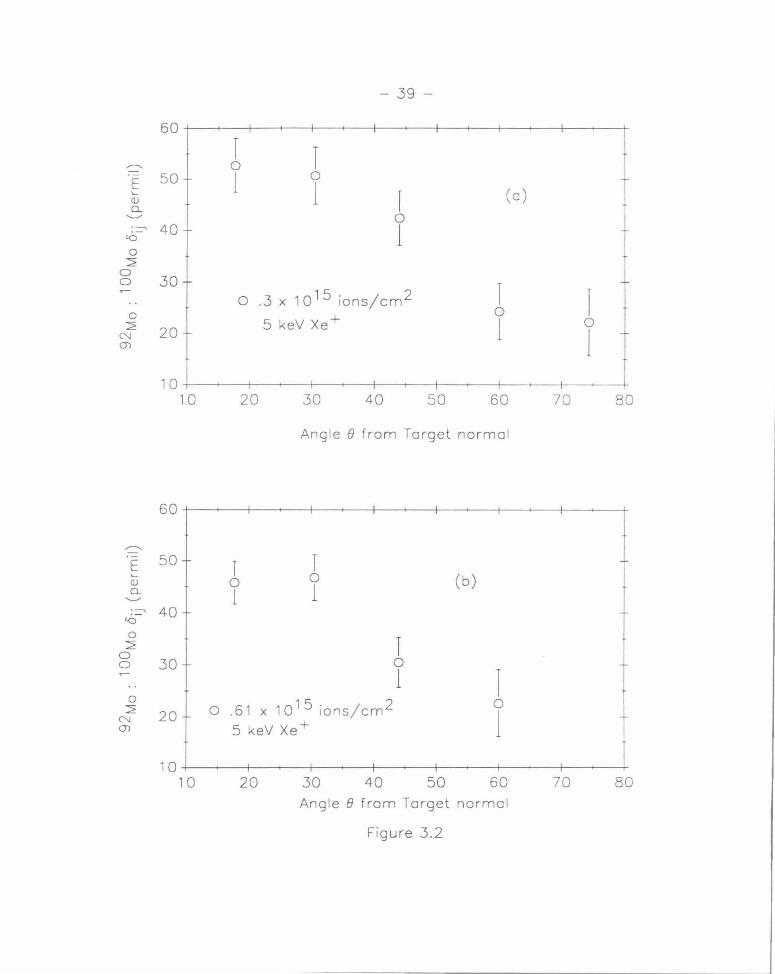
Figure 3.2 92 Mo/100Mo vs. angle for 5 keV Xe+ Fractionation of Mo isotopes under 5keV Xe+ bombardment as a function of angle with doses of (a)0.3 x 10¹⁵ ions/cm2 and (b)0.61 x 10¹⁵ ions/cm2 . The error bars are ±2u.
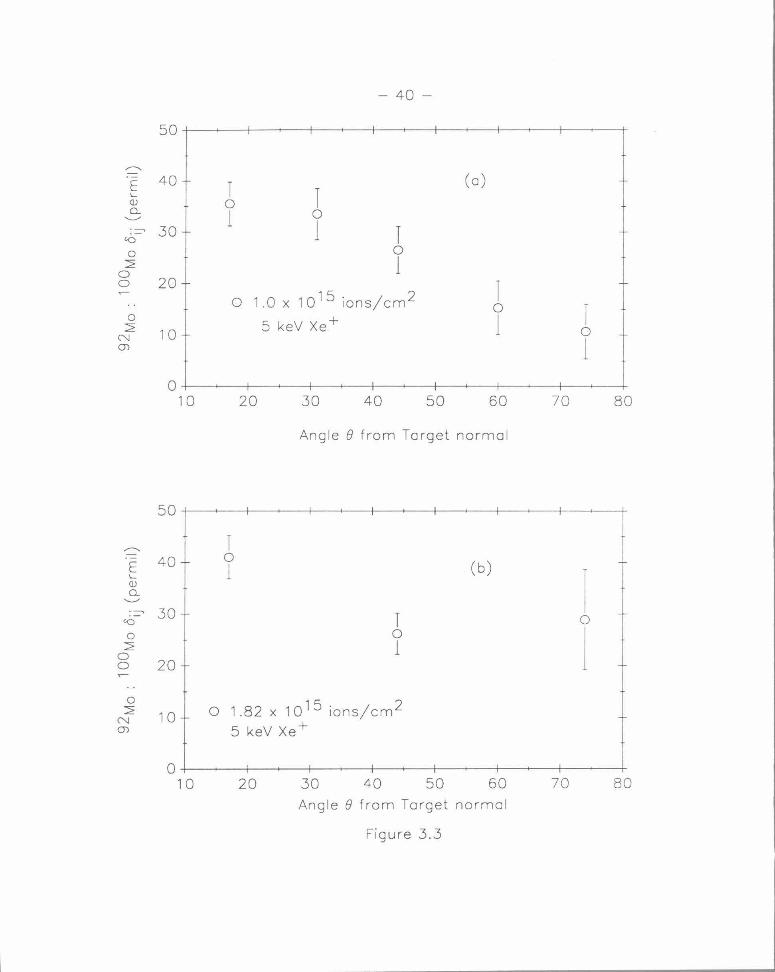
Figure 3.3 92 Mo/100 Mo vs. angle for 5 keV Xe+ Fractionation of Mo isotopes under 5 keV Xe+ bombardment as a function of angle with doses of (a)l.O x 1015 ions/cm2 and (b)1.82 x 10¹⁵ ions/cm2 . The error bars are ±2u.
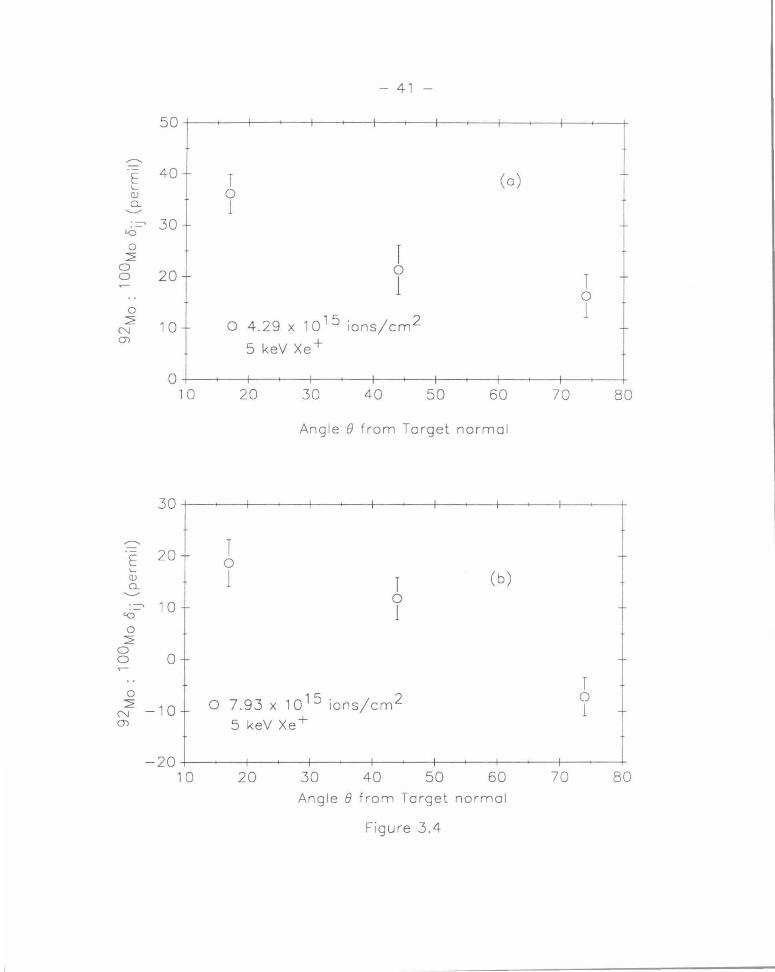
Figure 3.4 92 Mojl00 Mo vs. angle for 5 keV Xe+ Fractionation of Mo isotopes under 5 keV Xe+ bombardment as a function of angle with doses of (a)4.29 x 10¹⁵ ions/cm2 and (b)7.93 x 10¹⁵ ions/cm2
. The error bars are ±2u.
Figure 3.5 92 Mojl00 Mo vs. angle for 5 keV Xe+ Fractionation of Mo isotopes under 5 keV Xe+ bombardment as a function of angle with a dose of 20.05 x 10¹⁵ ions/cm2 . The error bars are ±2u.
Figure 3.6 92 Mo/100 Mo vs. angle for 10keV Xe+ Fractionation of Mo isotopes under 10 ke V Xe+ bombardment as a function of angle with doses of (a)0.61 x 10¹⁵ ions/cm2 and (b)9.74 x 10¹⁵ ions/cm2
. The error bars are ±2u.
Figure 3. 7 92 Mo/100Mo vs. angle for 5 keV Ar+ Fractionation of Mo isotopes under 5 ke V Ar+ bombardment as a function of angle with doses of ( a)l.22 x 1015 ions/cm2 and (b )20.63 x 10¹⁵ ions/cm2
. The error bars are ±2u.
- 35 -
Figure 3.8 92 Mo/100Mo vs. angle for 10 ke V Ar+ Fractionation of Mo isotopes under 10 ke V Ar+ bombardment as a function of angle with doses of ( a)1.21 x 10¹⁵ ions/cm2 and (b )19.45 x 10¹⁵ ions/cm2
. The error bars are ±2a.
Figure 4.1 In and Ga fractionation vs. angle Fractionation of (a) In and (b) Ga isotopes under 20 ke V Ar+ bombardment as a function of angle. The error bars are ±2a.
Figure 5.1 MCBCA simulation results The simulated sputtered fractionation of (a) Mo isotopes (i.e., 92 Mojl 00 Mo) and the sputtered fraction of (b) 0 atoms (i.e., 0/Mo) as a function of angle at zero simulated fluence.
Figure B.1 Raw SIMS data from the Mo experiment Raw isotope counts for an example SIMS run. This particular set of data was taken from the 5.0keV xe+ bombardment with the lowest dose (i.e., 0.3 X 10¹⁵ ions/cm2 ).
- 36-
RF len Seuree and Ac:::elercr..cr
Incident ton Beam (rastered)
Suppression Aperture
1~1 '1
(q)
Scr;::icn ?um;:s
Au-SeaJ Valve~ len Pump ~
UHV Charr.l::er
Fcil
Block
Heater
~ 11 ~~~ T.C.
€00 v ._1_
Current
j_
Figure 2.1
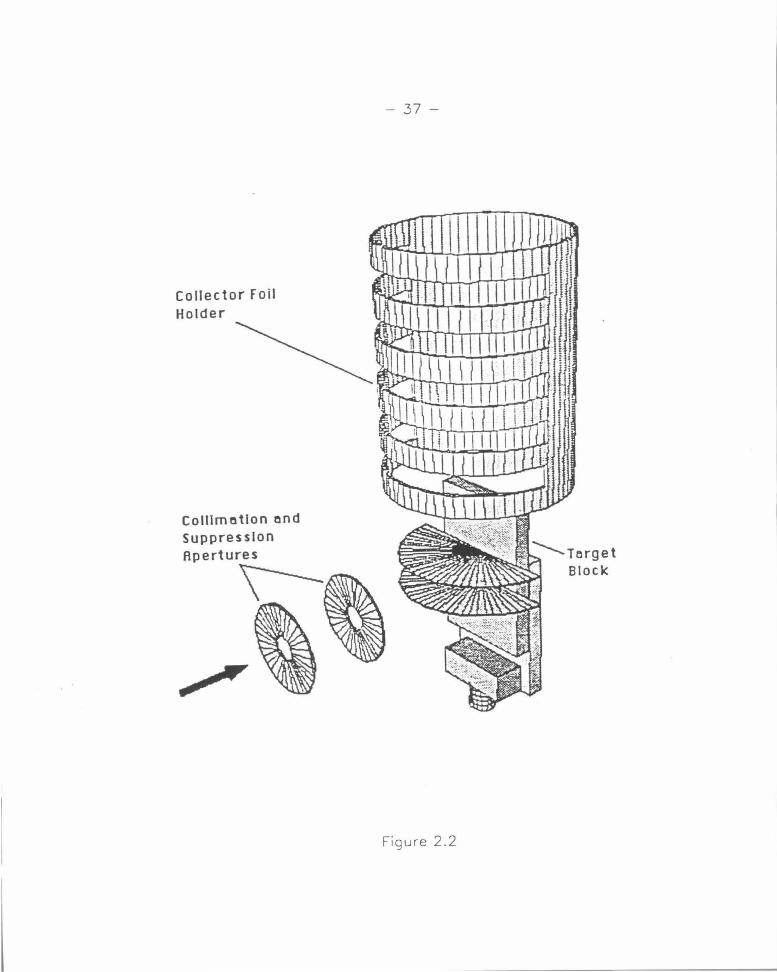
Collector Foil Holder
Colllmatlon and
- 37-
Figure 2 .2

- 38-
,...--.. 50 E 0--- -0 10 keV Ar+ '-Q)
Q. 6.-6 5 kev Ar+
'-" . --,
'0 30 0
2 (a)
0 0
0 10 J.
2 N
-6.
Q)
-10 0 5 10 15 20
Accumulated Dose (x 1015 ions/cm2)
,...--.. 50 E '(!)
Q.
T
liT 6, T
\ ,1---_ T
_/"....T 6.
1 J. ' ',,,
0----0 10 keV Xe+
6.-6. 5 kev xe+
(b) '0
0 2
0 0
TTO, T 1~ 30 0~ J. ',0,,
' ,J
0 2
N Q)
10
t::,'',-6 1
T 6 1
25
- 10+-~----~--~~~-+~--~~4-~~~~~~T 0 5 10 15 20
Accumulated Dose (x 10 15 ions/cm2)
Figure 3.1
- 39-
60
r l ....---... 0
E 50 1 0 "-- 1 r (a) Q)
a.. '--" 0 : =-' 40 1 '0
0 2
0 30 0
1 0 .3 x 10 15 ions/cm 2 l 0 5 keV Xe+
0 2 1 0
N 20 l CJ)
10 1 0 20 30 40 50 60 70 80
Angle e from Target normal
60
....---...
E 50 r T "-- 0 (b) Q) 0 a.. 1 1 '--" ·---.,
'0 40
0
I 2 0 0 30 0
1 l 0
.61 x 1015 ians/cm2 0 2 20 0
1 N 5 keV Xe+ CJ)
10 10 20 30 40 50 60 70 80
Angle e from Target normal
Figure 3.2
- 40-
50
,..---.,.
E 40 T
(a) \._ l Q) 0 0.. 1 0 ....__.., ·~ 30 1 I 1.()
0 0 2 1 0
0 20 I 0 1 .0 X 10 15 ions/cm 2 0 r 0
5 keV xe+ 1 2 10 0 N
1 01
0 10 20 30 40 50 60 70 80
Angle 8 from Target normal
50
,..---.,. T
E 40 0 (b)
\._ 1 I Q)
0.. ....__.., ·~ 30
T 1.() 0 0 0
j 2 1 0 0 20
0 1.82 x 10 15 ions/cm2 2 10 0
N 5keVXe+ 01
0 1 0 20 30 40 50 60 70 80
Angle 8 from Target normal
Figure 3.3
50
........._
E 40 \._
Q)
0.. '---' ·-, 30
'0
0 L
0 20 0
0 L 10 N
(j)
0 10
30
........._
E 20 \._
Q)
0.. '---' ·-, 10
'0
0 L
0 0 0
- 41 -
T 0
(o)
l
I 0
1 0 4.29 X 10¹⁵ ions/cm2
5 keV Xe+
20 30 40 50 60
Angle e from Target normal
I 0
1 T 0 1
0 7.93 x 10¹⁵ ions/cm2
5 keV Xe+
(b)
70
T 0 1
T 0 1
80
-20+-----~-----+--~--r-~--+-----~-----+------+ 10 20 30 40 50 60 70 80
Angle e from Target normal
Figure 3.4
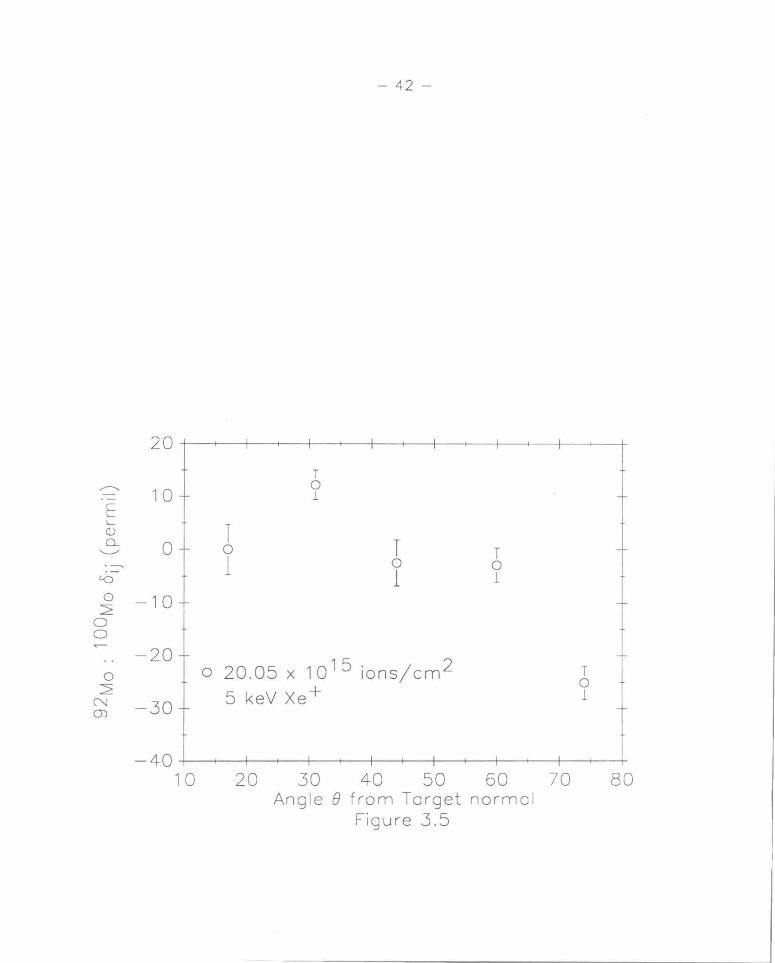
- 42-
20
T _.....-.....
10 0 1
E 1-
T Q) Q_
0 T '--.../ 0 T 1 0 0
l.Q 1 1 0 -10 2
0 0 ...--
-20 0 0 20.05 x 10 1 5 ions/ c m 2 T
0 2 5 keV Xe+ 1 N -30 OJ
-40 10 20 30 40 50 60 70 80
Angle 8 from Target normal Figure 3 .5
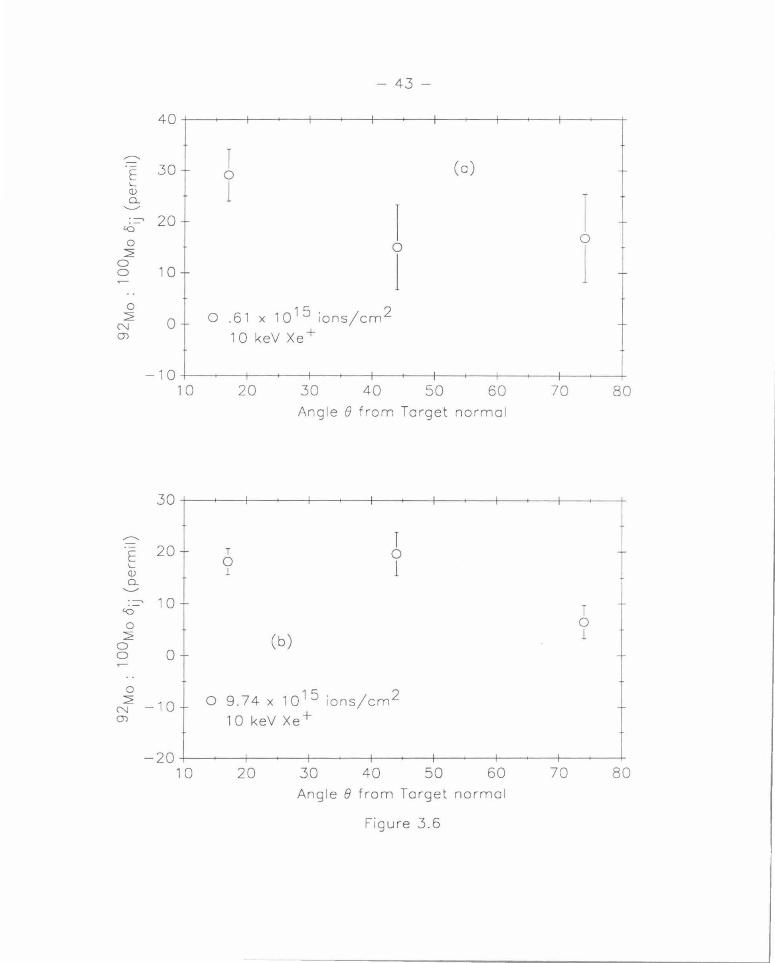
- 43-
40
.....---.. l E 30 0 (a) 1.... 1 Q)
l 0... ..___.-
l :=' 20 '0
0 0 2 0
1 0 10 1 0
0 .61 x 10 15 ions/cm 2 2 0 0
N 10 keV xe+ (J')
-10 10 20 30 40 50 60 70 80
Angle 8 from Target normal
30+-~---r-----r----~~~--~--~-+--~--~-----+
E 20 1.... Q)
0...
·~ 10 '0
0 2
0 0 0
T 0 1
(b)
l 0 1
0 9.74 x 10 15 ions/cm2 10 keV Xe+
T 0 1
-20+-----,_-----r----~~~--~-----+------~----~
10 20 30 40 50 60 70 80 Angle 8 from Target normal
Figure 3.6
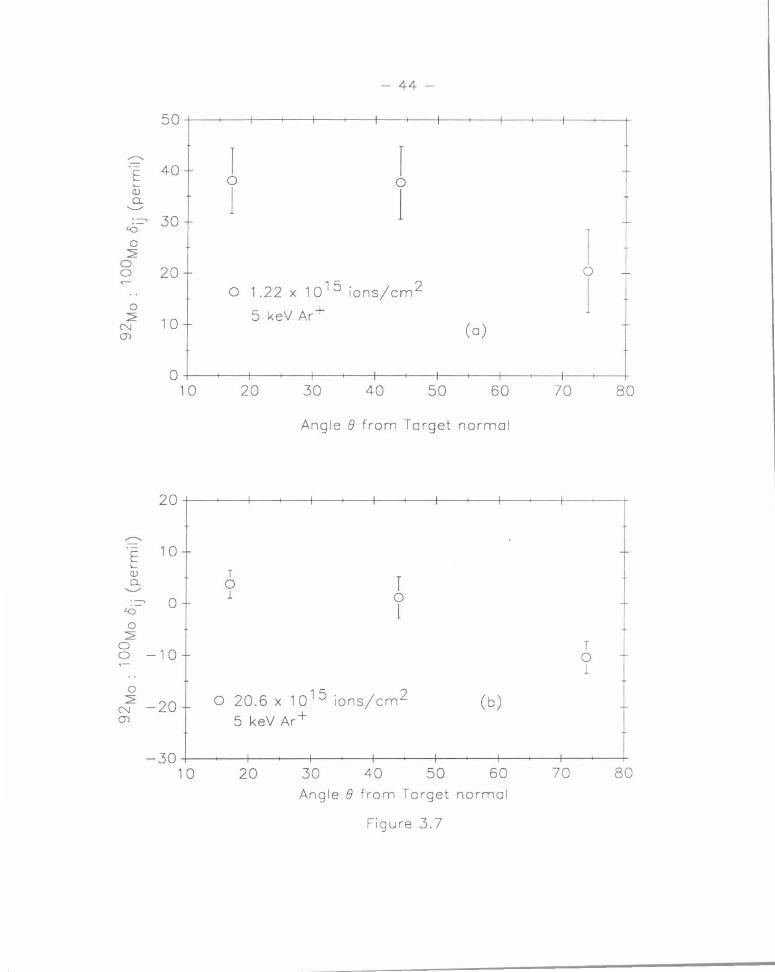
50
,....--...
E 40 '-Q) Q_ ..._... ·~ 30
'0
0 2
0 0 20
0 2 1 0 N
(J)
0
20
,....--...
E 10 '-Q) Q_ ..._... ·~
'0 0
0 2
0 0 -1 0
0
N2 -20
(J)
10
- 44-
l I 0 0
l 1
0 1 .22 x 1015 ions/cm 2
5 keV Ar+ (a)
20 30 40 50 60
Angle e from Target norma l
T T 0
1 0 1
0 20.6 x 10 15 ians/cm 2
5 keV Ar+ (b)
70
l 0
1
T 0 1
80
-30+-~--~-----+------~~--+-~---r--~~------+
10 20 30 40 50 60 70 80 Angle e from Target normal
Figure 3. 7

50
,----....
E 40 \,._
Q) Q_ ...___, . ----.,
'0 30
0 2
0 0 20
0 2 1 0 N
(J)
0 10
20
,----....
E 10 \,._
Q) Q_ ..___., . ----.,
'0 0
0 2
0 0 -10
0
~ -20 (J)
- 45-
l I 0 0
l 1 0 1 .21 X 1015 ions/cm 2
10keVAr+
20 30 40 50 60
Angle e From Target normal
T 0 l
0 19.45 x 10 15 ions/cm2 10 keV Ar+ (b)
I 0
1
(a)
70 80
T 0 l
-30+-----~--~-+--~--~~--+-----~--~~--~--+
1 0 20 30 40 50 60 70 80 Angle e From Ta rget normal
Figure 3.8
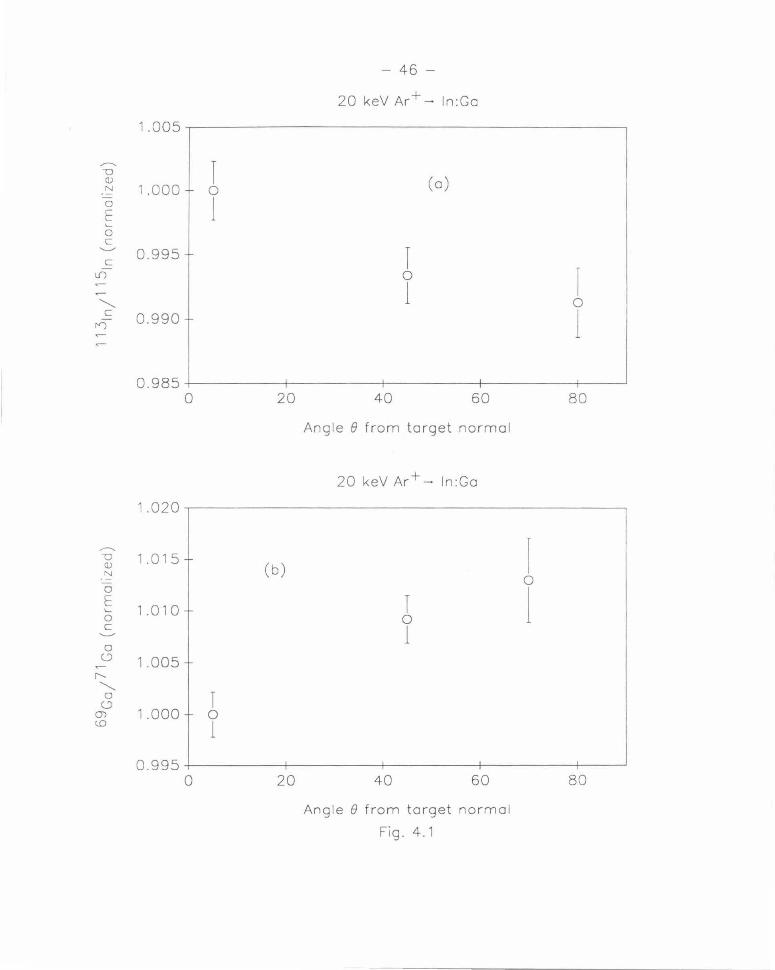
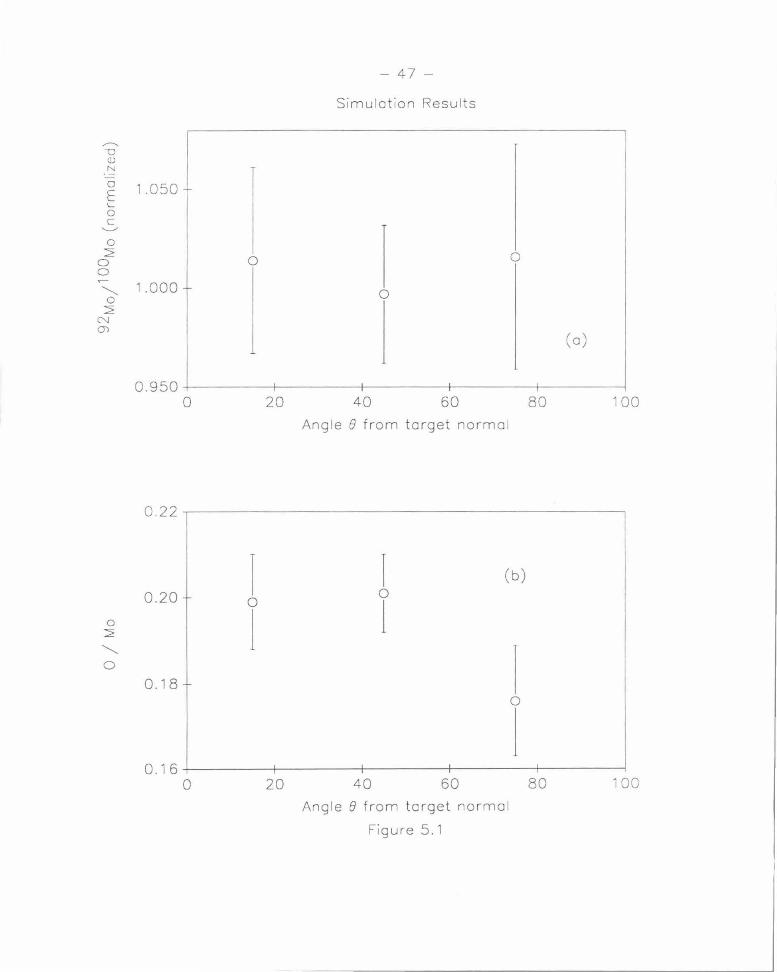
.....--... u Q)
N
0
E '--0 c
0 2
0 0
1.050
............. 1.000 0
2 N ())
- 47-
Simulation Results
0
1 0
0
(a)
0.950+--------+--------1--------4--------~------~
0 20 40 60 80 100
Angle e from target normal
0.22
1 l (b)
0.20 0 0
1 0 j 2 .............
1 0
0.18 0
j 0.16
0 20 40 60 80 100
Angle e from target normal
Figure 5. 1
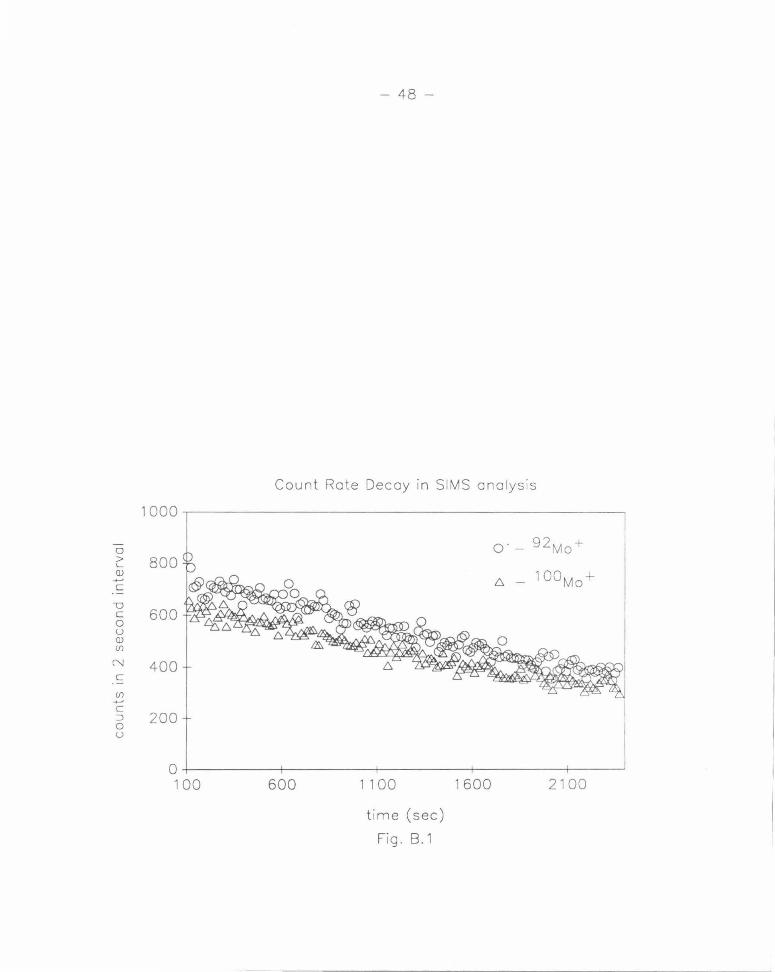
- 48-
Count Rote Decoy in SIMS analysis
1000~------------------------------------------~
0 > \._
(!) ....., c
u c 0 u (!) (f)
N
c (f) ....., c
800
600
400
:J 200 0 u
o·- 92 Mo+
6 - 1 OOMo+
0+---------1----------r---------+--------~----~
100 600 1100
time (sec)
Fig. 8.1
1600 2100
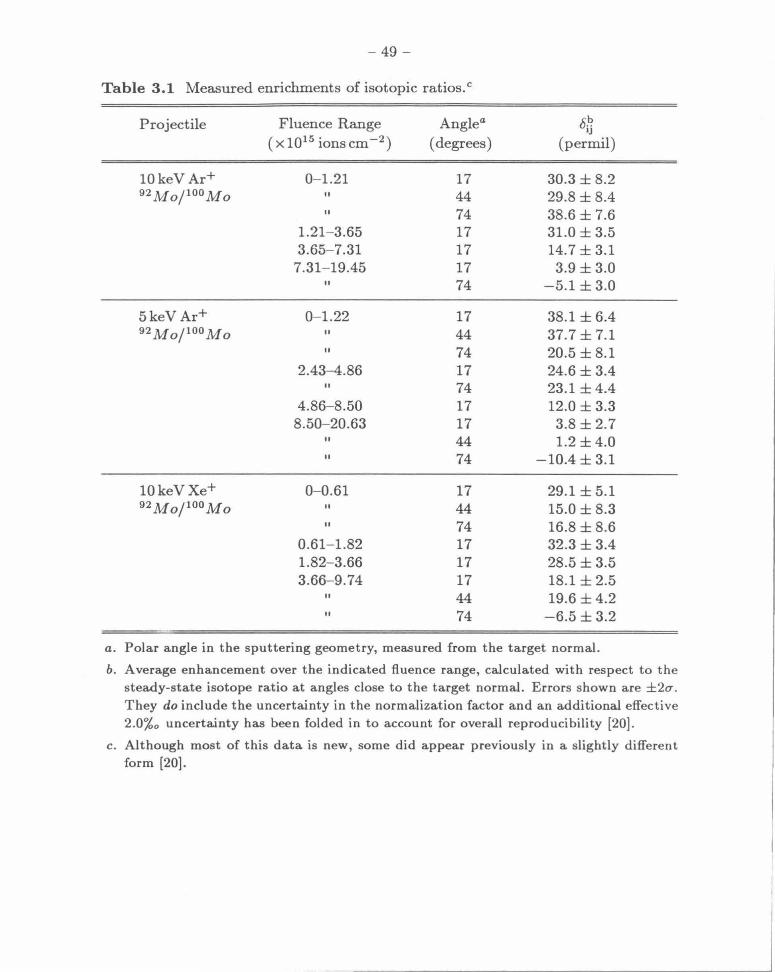
- 49 -
Table 3.1 Measured enrichments of isotopic ratios. c
Projectile Fluence Range Angle0 t5.~ IJ
(x1015 ionscm-2 ) (degrees) (permil)
10keV Ar+ 0- 1.21 17 30.3 ± 8.2 92MopooMo II 44 29.8 ± 8.4
II 74 38.6 ± 7.6 1.21- 3.65 17 31.0 ± 3.5 3.65- 7.31 17 14.7 ± 3.1
7.31- 19.45 17 3.9 ± 3.0 II 74 -5.1 ± 3.0
5keV Ar+ 0- 1.22 17 38.1 ± 6.4 92MopooMo II 44 37.7 ± 7.1
II 74 20.5 ± 8.1 2.43-4.86 17 24.6 ± 3.4
II 74 23.1 ± 4.4 4.86-8.50 17 12.0 ± 3.3
8.50- 20.63 17 3.8 ± 2.7 II 44 1.2 ± 4.0 II 74 -10.4 ± 3.1
10keVXe+ 0- 0.61 17 29.1 ± 5.1 92MopooMo II 44 15.0 ± 8.3
II 74 16.8 ± 8.6 0.61- 1.82 17 32.3 ± 3.4 1.82- 3.66 17 28.5 ± 3.5 3.66- 9.74 17 18.1 ± 2.5
II 44 19.6 ± 4.2 II 74 -6.5 ± 3.2
a. Polar angle in the sputtering geometry, measured from the target normal.
b. Average enhancement over the indicated fluence range, calculated with respect to the steady-state isotope ratio at angles close to the target normal. Errors shown are ±2a. They do include the uncertainty in the normalization factor and an additional effective 2.0%o uncertainty has been folded in to account for overall reproducibility [20).
c . Although most of this data is new, some did appear previously in a slightly different form [20).

-50-
Table 3.1 cont'd: Measured enrichments of isotopic ratios. c
Projectile Fluence Range Angle a a!:? IJ
( x 1015 ions cm-2 ) (degrees) (pennil)
5keVXe+ 0- 0.30 17 52.7 ± 5.3 92MopooMo II 31 50.7 ± 5.6
II 44 42.4 ± 5.3 II 60 24.3 ± 5.5 II 74 22.2 ± 6.5
0- 0.61 17 45.8 ± 4.1 II 31 46.8 ± 4.4 II 44 30.5 ± 4.8 II 60 22.6 ± 6.5
0-1.0 ± 0.3 17 35.5 ± 4.3 II 31 33.5 ± 5.0 II 44 26.5 ± 4.6 II 60 15.3 ± 5.2 II 74 10.7 ± 5.3
0.61- 1.82 17 41.0 ± 4.2 II 44 26.2 ± 4.0 II 74 28.9 ± 9.7
1.82-4.29 17 36.1 ± 3.8 II 44 21.3 ± 4.8 II 74 16.3 ±4.2
4.29- 7.93 17 18.6 ±4.5 II 44 11.8 ±4.1 II 74 -7.2 ± 3.7
7.93- 20.05 17 0.0 ± 4.7 II 31 12.2 ± 2.8 II 44 -2.5 ±4.3 II 60 -2.9 ± 3.2 II 74 -25.1 ± 3.1
20keV Ar+ 6.47mC 113Jn/nsln 5 0.0 ± 2.3
46 -6.6 ± 2.2 80 -8.7 ± 2.7
20keV Ar+ 6.47mC 69Ga/11 Ga 5 0.0 ± 2.2
46 9.2 ± 2.3 70 13.0 ± 4.4
abc. See notes on previous page.


![Predicting Isotopic Fractionation in Water from Quantum ... · PDF filePREDICTING ISOTOPIC FRACTIONATION IN WATER FROM ... and Schulman [17]. 2.1.1. Path Integral Quantum ... PREDICTING](https://img.dokumen.tips/doc/110x75/5a79ebdf7f8b9ab05f8dafe9/predicting-isotopic-fractionation-in-water-from-quantum-isotopic-fractionation.jpg)