Embed Size (px)
Citation preview
Journal of Chromatography, 505 (1990) 257-211 Elsevier Science Publishers B.V., Amsterdam - Printed in The Netherlands
CHROM. 22 249
Isolation of tocopherols from wheat germ oil by recycle semi-preparative supercritical fluid chromatography”
MUNEO SAITO* and YOSHIO YAMAUCHI
JASCO, Japan Spectroscopic Co., Ltd., 2967-5 Ishikawa-cho, Hachioji City, Tokyo 192 (Japan)
SUMMARY
Isolation of tocopherols from wheat-germ oil was achieved by recycle semi- preparative supercritical fluid chromatography using two 250 mm x 10 mm I.D. columns packed with 5-pm silica gel. /I-Tocopherol was fractionated after recycling twice and a-tocopherol after two additional recycles. Peak assignment was performed by comparing the UV spectra of the fractionated substances, which were obtained during the chromatographic run using a photodiode-array UV detector, with those of standard tocopherols. The identification of the fractionated substances was con- firmed from the IR spectra. The purities of CL- and fi-tocopherols were found to be about 85 and 70%, respectively, by capillary gas chromatography.
INTRODUCTION
We have previously reported’,’ a method for the extraction and fractionation of substances from complex mixtures such as natural products by using supercritical carbon dioxide both as an extraction medium and as a mobile phase in preparative chromatography, and we have demonstrated the enrichment of tocopherols from wheat germ. The method was based on coupled supercritical fluid extraction (SFE)-preparative supercritical fluid chromatography (SFC). It was reported’ that tocopherols were enriched from 0.05 to about 5%, i.e., by a factor of 100, in a single run of coupled SFE-preparative SFC. However, even after repeated chromatography of the a-tocopherol fraction, the final concentration was only about 20%, owing to the low initial concentration (0.05%) of the compounds in the complex matrix of wheat germ.
The major components of wheat-germ oil are triglycerides with various lengths of alkyl chains. These are co-eluted as a broad peak with small peaks on it, resembling a gel-permeation chromatogram of an oligomer mixture. This broad peak interferes with the isolation of tocopherol peaks in preparative separation. In order to separate tocopherol peaks from the triglyceride peak in preparative SFC, a highly efftcient
’ This paper was presented in part at the 1989 Pittsburgh Conference on Analytical Chemistry and Applied Spectroscopy, Atlanta, GA, U.S.A.
0021-9673/90/$03.50 0 1990 Elsevier Science Publishers B.V.
258 M. SAITO. Y. YAMAUCHI
column with a high loading capacity is required. However, the use of a long column packed with microparticulate (less than 5 pm) material results in a decrease in the column efficiency owing to too high a column pressure drop (dP), as reported by Schoenmakers3 and Schoenmakers and Uunk4.
Recycle operation is very suitable for preparative SFC, because the method offers a high plate number without increasing the column pressure drop (dP), as was reported previously5. In addition, the consumption of mobile phase fluid can be drastically reduced. In this paper we describe the isolation of tocopherols from wheat- germ oil by recycle semi-preparative SFC.
EXPERIMENTAL
Materials Wheat-germ oil was extracted and tocopherols were enriched by the method
described previously’. The tocopherol concentration of the oil was determined to be about 4% by high-performance liquid chromatography (HPLC).
Chemicals Standard-grade carbon dioxide was purchased from Toyoko Kagaku (Kawasaki,
Japan) and was used as the mobile phase. HPLC-grade ethanol (Wako, Osaka, Japan) was mixed with carbon dioxide as a modifier solvent. HPLC quantitation-grade u- and /I-tocopherol standards (purity 98% by HPLC) (Eizai, Tokyo, Japan) were used as the standard samples for the UV and IR spectrometric analyses.
Potassium bromide powder used in the diffuse-reflectance infrared (IR) spectral measurements was from Jasco (Hachioji, Tokyo). Chloroform of special reagent grade (Wako) was used for dissolving samples for the IR measurements.
Apparatus Two Jasco SuperMegaPak SIL columns, 250 mm x 10 mm I.D., were used for
the SFC separations. The packing material was 5-pm silica gel. Recycle SFC system. A flow diagram of the recycle semi-preparative SFC system
is shown in Fig. 1. It is similar to that used in our previous study’, but an additional column (10’) is placed between the switching valve (13) and in-line pump (8) (Jasco 880-PU HPLC pump with modification for alternative dual-piston operation). This modification is required in order to have the pump serve as an in-line pump, because such a pump is needed to suck and discharge fluid simultaneously in order to circulate the fluid in a closed loop line without causing pressure fluctuations.
The column serves to retain components that have only weak retentions on it. This is very important for the practical application of recycle SFC. Capacity factors (k’) of peak components may be in the range from 0 to 10 when natural products are involved. This means that the migration velocities of the components in a column vary by the same factors. As a result, components with smaller capacity factors often pass through the column several times before components with greater capacity factors are eluted from the column. This means that some components which have already been separated can be re-mixed as the number of recycles increases. Therefore, some means of retaining the components with smaller k’ is required in order to operate recycle SFC successfully.
ISOLATION OF TOCOPHEROLS BY SFC 259
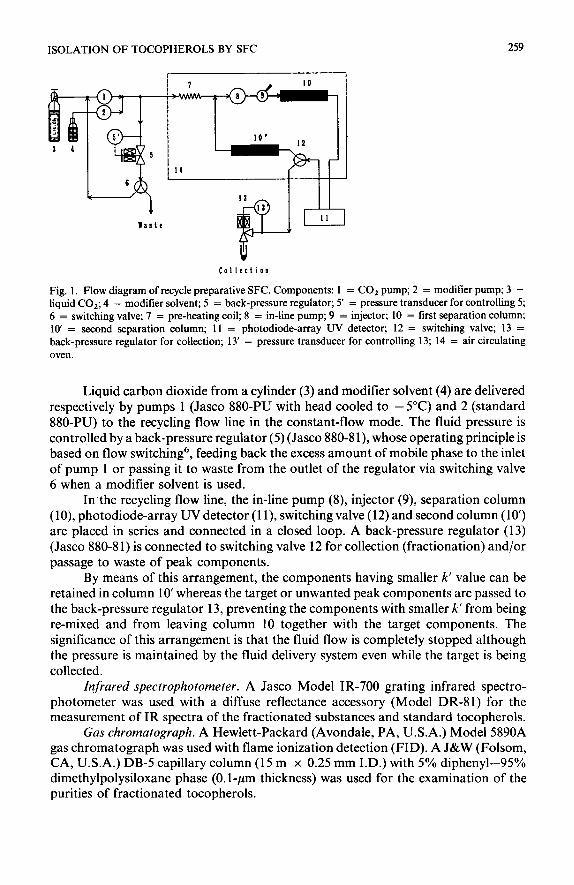
Fig. 1. Flow diagram of recycle preparative SFC. Components: 1 = CO2 pump; 2 = modifier pump; 3 = liquid CO,; 4 = modifier solvent; 5 = back-pressure regulator; 5’ = pressure transducer for controlling 5; 6 = switching valve; 7 = pre-heating coil; 8 = in-line pump; 9 = injector; 10 = first separation column; 10 = second separation column; 11 = photodiode-array UV detector; 12 = switching valve; 13 = back-pressure regulator for collection; 13’ = pressure transducer for controlling 13; 14 = air circulating oven.
Liquid carbon dioxide from a cylinder (3) and modifier solvent (4) are delivered respectively by pumps 1 (Jasco 880-PU with head cooled to -5°C) and 2 (standard 880-PU) to the recycling flow line in the constant-flow mode. The fluid pressure is controlled by a back-pressure regulator (5) (Jasco 880-8 l), whose operating principle is based on flow switching6, feeding back the excess amount of mobile phase to the inlet of pump 1 or passing it to waste from the outlet of the regulator via switching valve 6 when a modifier solvent is used.
In’the recycling flow line, the in-line pump (8), injector (9), separation column (lo), photodiode-array UV detector (1 l), switching valve (12) and second column (10’) are placed in series and connected in a closed loop. A back-pressure regulator (13) (Jasco 880-8 1) is connected to switching valve 12 for collection (fractionation) and/or passage to waste of peak components.
By means of this arrangement, the components having smaller k’ value can be retained in column 10’ whereas the target or unwanted peak components are passed to the back-pressure regulator 13, preventing the components with smaller k’ from being re-mixed and from leaving column 10 together with the target components. The significance of this arrangement is that the fluid flow is completely stopped although the pressure is maintained by the fluid delivery system even while the target is being collected.
Zqfrared spectrophotometer. A Jasco Model IR-700 grating infrared spectro- photometer was used with a diffuse reflectance accessory (Model DR-81) for the measurement of IR spectra of the fractionated substances and standard tocopherols.
Gas chromatograph. A Hewlett-Packard (Avondale, PA, U.S.A.) Model 5890A gas chromatograph was used with flame ionization detection (FID). A J&W (Folsom, CA, U.S.A.) DB-5 capillary column (15 m x 0.25 mm I.D.) with 5% diphenyl-95% dimethylpolysiloxane phase (O.l-pm thickness) was used for the examination of the purities of fractionated tocopherols.
240 M. SAITO. Y. YAMAUCHI
RESULTS AND DISCUSSION
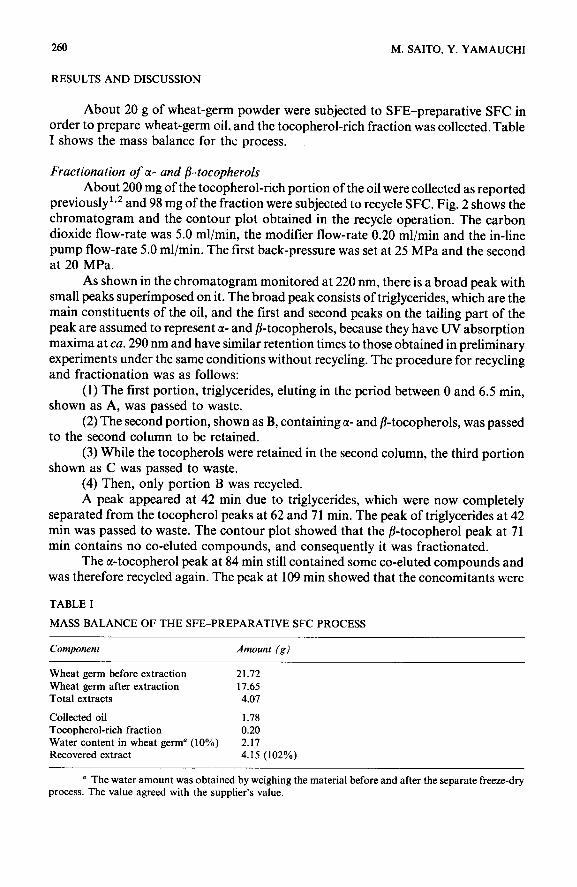
About 20 g of wheat-germ powder were subjected to SFE-preparative SFC in order to prepare wheat-germ oil, and the tocopherol-rich fraction was collected. Table I shows the mass balance for the process.
Fractionation of a- and /T-tocopherols About 200 mg of the tocopherol-rich portion of the oil were collected as reported
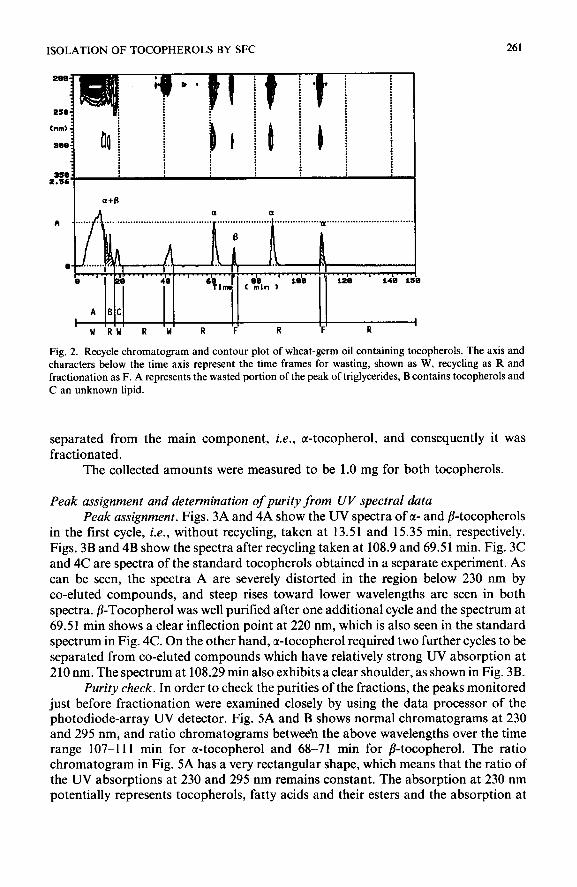
previously’~2 and 98 mg of the fraction were subjected to recycle SFC. Fig. 2 shows the chromatogram and the contour plot obtained in the recycle operation. The carbon dioxide flow-rate was 5.0 ml/min, the modifier flow-rate 0.20 ml/min and the in-line pump flow-rate 5.0 ml/min. The first back-pressure was set at 25 MPa and the second at 20 MPa.
As shown in the chromatogram monitored at 220 nm, there is a broad peak with small peaks superimposed on it. The broad peak consists of triglycerides, which are the main constituents of the oil, and the first and second peaks on the tailing part of the peak are assumed to represent u- and B-tocopherols, because they have UV absorption maxima at ca. 290 nm and have similar retention times to those obtained in preliminary experiments under the same conditions without recycling. The procedure for recycling and fractionation was as follows:
(1) The first portion, triglycerides, eluting in the period between 0 and 6.5 min, shown as A, was passed to waste.
(2) The second portion, shown as B, containing a- and b-tocopherols, was passed to the second column to be retained.
(3) While the tocopherols were retained in the second column, the third portion shown as C was passed to waste.
(4) Then, only portion B was recycled. A peak appeared at 42 min due to triglycerides, which were now completely
separated from the tocopherol peaks at 62 and 71 min. The peak of triglycerides at 42 min was passed to waste. The contour plot showed that the /I-tocopherol peak at 71 min contains no co-eluted compounds, and consequently it was fractionated.
The cc-tocopherol peak at 84 min still contained some co-eluted compounds and was therefore recycled again. The peak at 109 min showed that the concomitants were
TABLE I
MASS BALANCE OF THE SFE-PREPARATIVE SFC PROCESS
Component Amount (g)
Wheat germ before extraction 21.72 Wheat germ after extraction 17.65 Total extracts 4.07
Collected oil 1.78 Tocopherol-rich fraction 0.20 Water content in wheat germ’ (10%) 2.17 Recovered extract 4.15 (102%)
’ The water amount was obtained by weighing the material before and after the separate freeze-dry process. The value agreed with the supplier’s value.
ISOLATION OF TOCOPHEROLS BY SFC 261
I --..I.‘.. .-.,-... ..C
me
I i20 r4b 4
A BC t I 1 I I
I! i
WRW R W R F R F R
B
Fig. 2. Recycle chromatogram and contour plot of wheat-germ oil containing tocopherols. The axis and characters below the time axis represent the time frames for wasting, shown as W, recycling as R and fractionation as F. A represents the wasted portion of the peak of triglycerides, B contains tocopherols and C an unknown lipid.
separated from the main component, i.e., a-tocopherol, and consequently it was fractionated.
The collected amounts were measured to be 1.0 mg for both tocopherols.
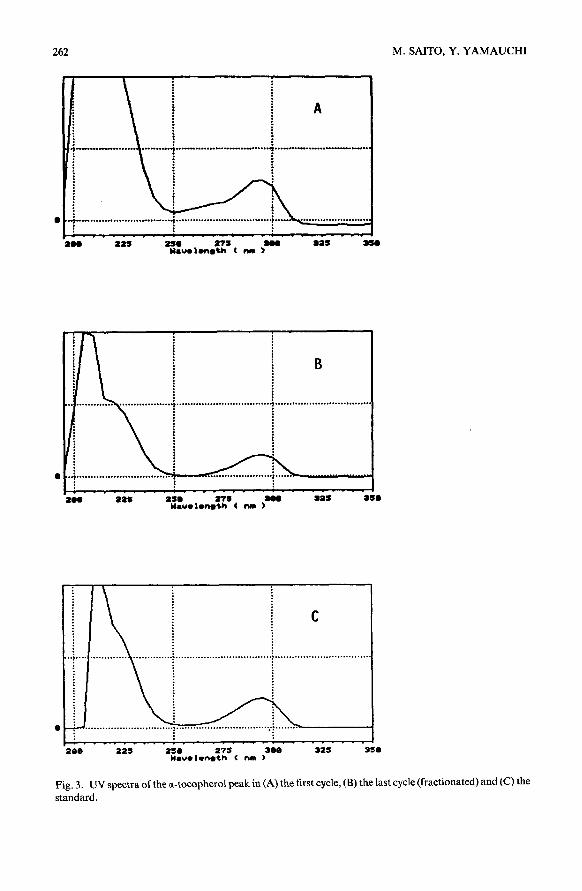
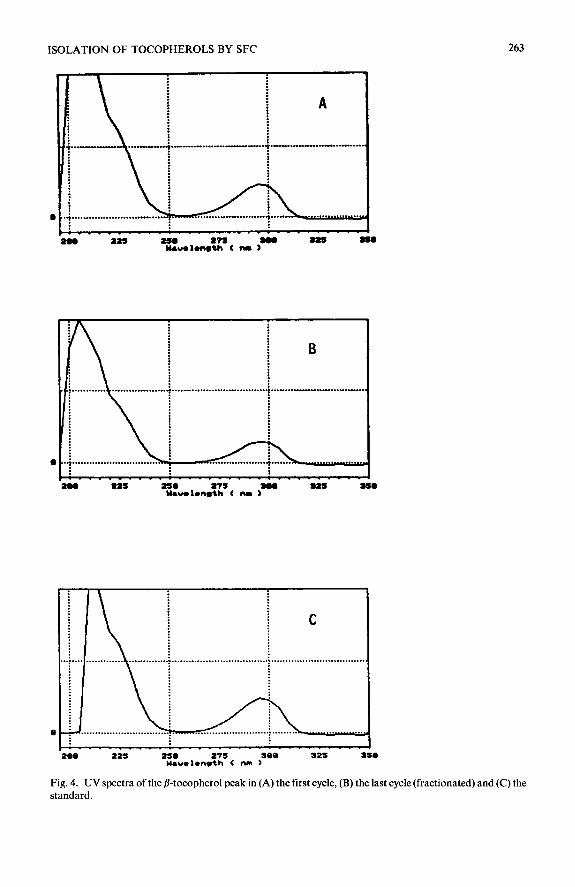
Peak assignment and determination of purity from UV spectral data Peak assignment. Figs. 3A and 4A show the UV spectra of c1- and /I-tocopherols
in the first cycle, i.e., without recycling, taken at 13.51 and 15.35 min, respectively. Figs. 3B and 4B show the spectra after recycling taken at 108.9 and 69.51 min. Fig. 3C and 4C are spectra of the standard tocopherols obtained in a separate experiment. As can be seen, the spectra A are severely distorted in the region below 230 nm by co-eluted compounds, and steep rises toward lower wavelengths are seen in both spectra. P-Tocopherol was well purified after one additional cycle and the spectrum at 69.51 min shows a clear inflection point at 220 nm, which is also seen in the standard spectrum in Fig. 4C. On the other hand, a-tocopherol required two further cycles to be separated from co-eluted compounds which have relatively strong UV absorption at 210 nm. The spectrum at 108.29 min also exhibits a clear shoulder, as shown in Fig. 3B.
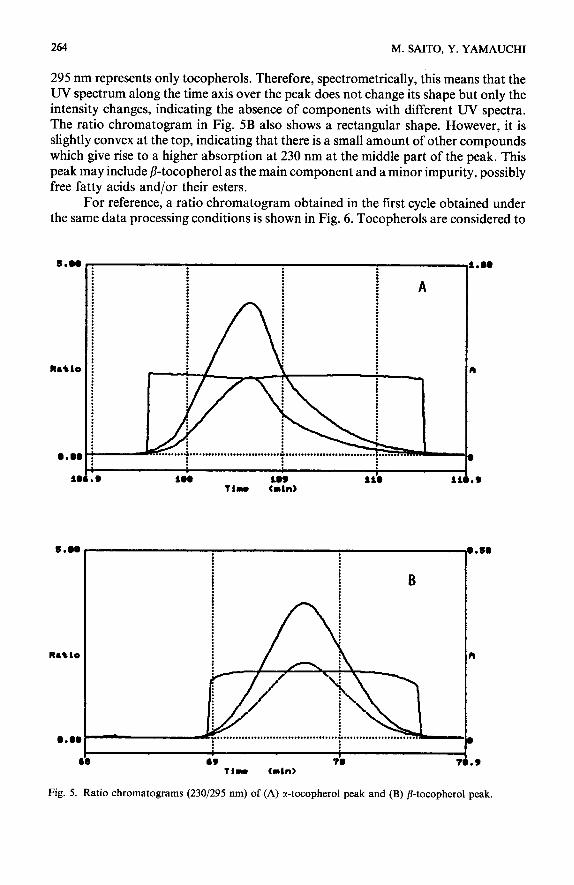
Purity check. In order to check the purities of the fractions, the peaks monitored just before fractionation were examined closely by using the data processor of the photodiode-array UV detector. Fig. 5A and B shows normal chromatograms at 230 and 295 nm, and ratio chromatograms between the above wavelengths over the time range 107-111 min for cr-tocopherol and 68-71 min for /I-tocopherol. The ratio chromatogram in Fig. 5A has a very rectangular shape, which means that the ratio of the UV absorptions at 230 and 295 nm remains constant. The absorption at 230 nm potentially represents tocopherols, fatty acids and their esters and the absorption at
262 M. SAITO, Y. YAMAUCHI
a
0
Fig. 3. UV spectra of the c+tocopherol peak in (A) the first cycle, (B) the last cycle (fractionated) and (C) the standard.
ISOLATION OF TOCOPHEROLS BY SFC 263
288 aas 250 27s 22a m 2S2 Yawlonmth ( 1)1 >
i C
. . . . . . . . . . . . . . . . . . . . . . . . . . . . . . . . . . . i . . . . . .._........................... . . . . . . . . . . . . . . . . . . . . . . . . . . . . . . . .
~~ . . . . . . . . . . . . . . . . . . . . . . . . . . . . . . . . . . . . . . . . . . . . . . . . . . . . . . . . . . . . . . . . . . . . . . . . . . .
2w 22s 250 275 30Q Yavrlonmth < nm )
32s im
Fig. 4. UV spectra of the fi-tocopherol peak in (A) the first cycle, (B) the last cycle (fractionated) and(C) the standard.
264 M. SAITO. Y. YAMAUCHI
295 nm represents only tocopherols. Therefore, spectrometrically, this means that the UV spectrum along the time axis over the peak does not change its shape but only the intensity changes, indicating the absence of components with different UV spectra. The ratio chromatogram in Fig. 5B also shows a rectangular shape. However, it is slightly convex at the top, indicating that there is a small amount of other compounds which give rise to a higher absorption at 230 nm at the middle part of the peak. This peak may include /?-tocopherol as the main component and a minor impurity, possibly free fatty acids and/or their esters.
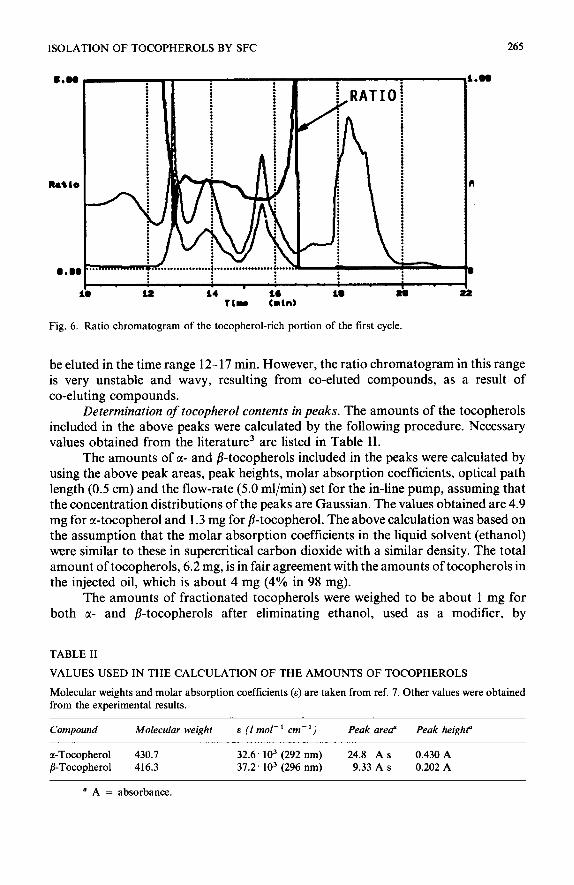
For reference, a ratio chromatogram obtained in the first cycle obtained under the same data processing conditions is shown in Fig. 6. Tocopherols are considered to
1
?D 7 Tlmu Cnln>
Fig. 5. Ratio chromatograms (230/295 nm) of (A) a-tocopherol peak and (B) P-tocopherol peak.
ISOLATION OF TOCOPHEROLS BY SFC 265
Fig. 6. Ratio chromatogram of the tocopherol-rich portion of the first cycle.
be eluted in the time range 12-17 min. However, the ratio chromatogram in this range is very unstable and wavy, resulting from co-eluted compounds, as a result of co-eluting compounds.
Determination of tocopherol contents in peaks. The amounts of the tocopherols included in the above peaks were calculated by the following procedure. Necessary values obtained from the literature3 are listed in Table II.
The amounts of GI- and /I-tocopherols included in the peaks were calculated by using the above peak areas, peak heights, molar absorption coefficients, optical path length (0.5 cm) and the flow-rate (5.0 ml/min) set for the in-line pump, assuming that the concentration distributions of the peaks are Gaussian. The values obtained are 4.9 mg for cr-tocopherol and 1.3 mg for fi-tocopherol. The above calculation was based on the assumption that the molar absorption coefficients in the liquid solvent (ethanol) were similar to these in supercritical carbon dioxide with a similar density. The total amount of tocopherols, 6.2 mg, is in fair agreement with the amounts of tocopherols in the injected oil, which is about 4 mg (4% in 98 mg).
The amounts of fractionated tocopherols were weighed to be about 1 mg for both LX- and /I-tocopherols after eliminating ethanol, used as a modifier, by
TABLE II
VALUES USED IN THE CALCULATION OF THE AMOUNTS OF TOCOPHEROLS
Molecular weights and molar absorption coefficients (.s) are taken from ref. 7. Other values were obtained from the experimental results.
Compound Molecular weight
a-Tocopherol 430.7 B-Tocopherol 416.3
a A = absorbance.
E (I mol-’ cm-‘)
32.6 lo3 (292 nm) 37.2 lo3 (296 nm)
Peak area” Peak height”
24.8 A s 0.430 A 9.33 A s 0.202 A
266 M. SAITO, Y. YAMAUCHI
evaporation. These values do not agree with the above values, and only about one third to half of the tocopherols in the peaks was recovered. The reason of this disagreement is considered to be that part of the tocopherols was removed by ethanol mist in the carbon dioxide vented to the waste line.
,....1....,....,...., . . . , . I . I
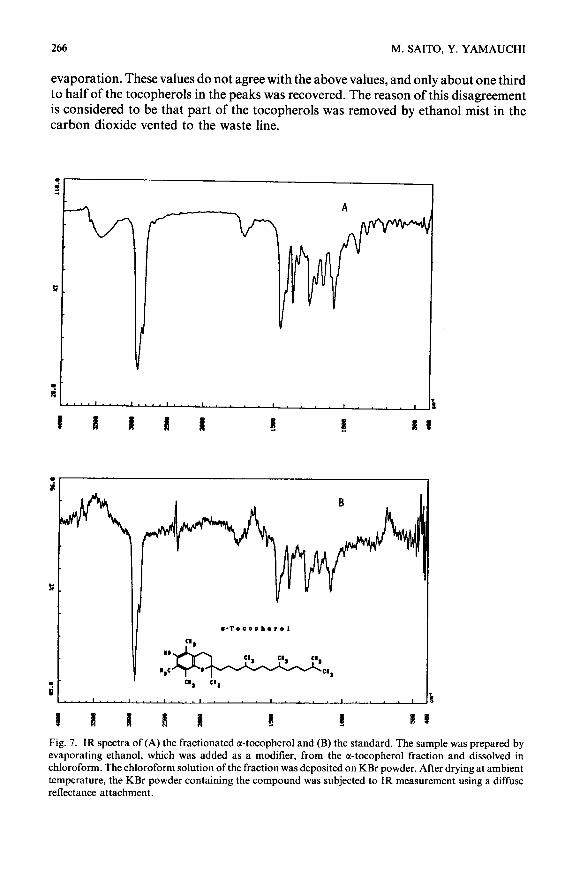
Fig. 7. IR spectra of (A) the fractionated cc-tocopherol and (B) the standard. The sample was prepared by evaporating ethanol, which was added as a modifier, from the a-tocopherol fraction and dissolved in chloroform. The chloroform solution of the fraction was deposited on KBr powder. After drying at ambient temperature, the KBr powder containing the compound was subjected to IR measurement using a diffuse reflectance attachment.
ISOLATION OF TOCOPHEROLS BY SFC 261
\ I
L-focophorol
Cl* Cl)
l....I....I....I....I . . . . I . . . . I . . . . ,
% H A 8 A f !l t 0
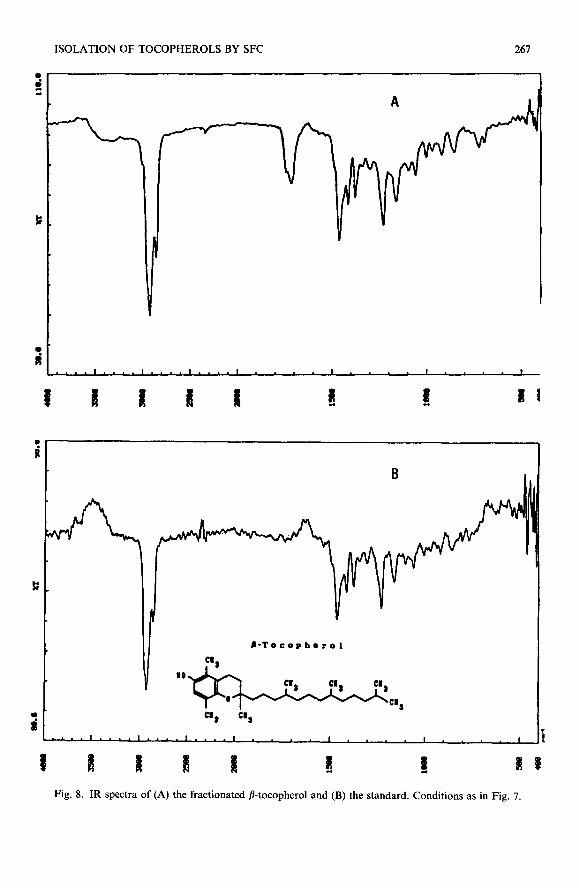
Fig. 8. IR spectra of (A) the fractionated jl-tocopherol and (B) the standard. Conditions as in Fig. 7.
268 M. SAITO, Y. YAMAUCHI
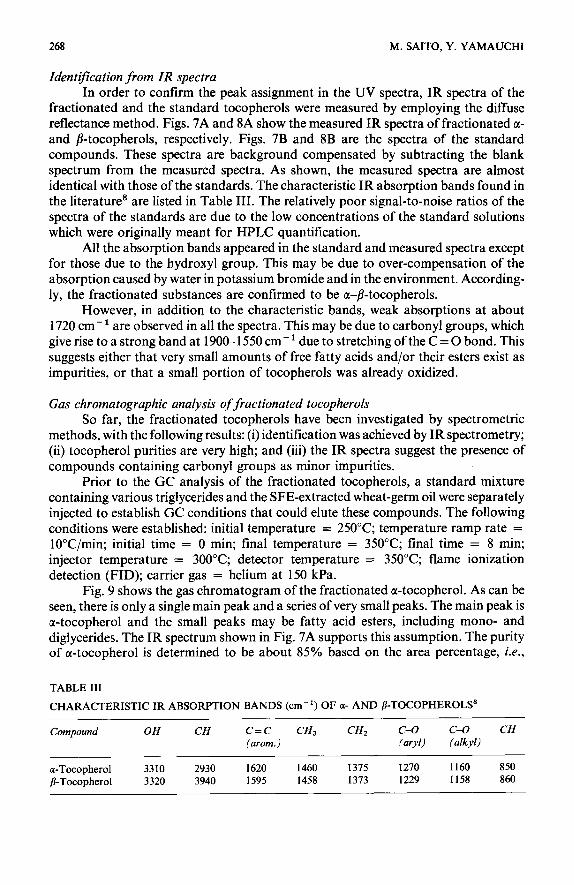
Identification from IR spectra In order to confirm the peak assignment in the UV spectra, IR spectra of the
fractionated and the standard tocopherols were measured by employing the diffuse reflectance method. Figs. 7A and 8A show the measured IR spectra of fractionated a- and @tocopherols, respectively. Figs. 7B and 8B are the spectra of the standard compounds. These spectra are background compensated by subtracting the blank spectrum from the measured spectra. As shown, the measured spectra are almost identical with those of the standards. The characteristic IR absorption bands found in the literature* are listed in Table III. The relatively poor signal-to-noise ratios of the spectra of the standards are due to the low concentrations of the standard solutions which were originally meant for HPLC quantification.
All the absorption bands appeared in the standard and measured spectra except for those due to the hydroxyl group. This may be due to over-compensation of the absorption caused by water in potassium bromide and in the environment. According- ly, the fractionated substances are confirmed to be a-p-tocopherols.
However, in addition to the characteristic bands, weak absorptions at about 1720 cm- ’ are observed in all the spectra. This may be due to carbonyl groups, which give rise to a strong band at 1900-l 550 cm-’ due to stretching of the C = 0 bond. This suggests either that very small amounts of free fatty acids and/or their esters exist as impurities, or that a small portion of tocopherols was already oxidized.
Gas chromatographic analysis of fractionated tocopherols So far, the fractionated tocopherols have been investigated by spectrometric
methods, with the following results: (i) identification was achieved by IR spectrometry; (ii) tocopherol purities are very high; and (iii) the IR spectra suggest the presence of compounds containing carbonyl groups as minor impurities.
Prior to the GC analysis of the fractionated tocopherols, a standard mixture containing various triglycerides and the SFE-extracted wheat-germ oil were separately injected to establish CC conditions that could elute these compounds. The following conditions were established: initial temperature = 250°C; temperature ramp rate = lO”C/min; initial time = 0 min; final temperature = 350°C; final time = 8 min; injector temperature = 300°C; detector temperature = 350°C; flame ionization detection (FID); carrier gas = helium at 150 kPa.
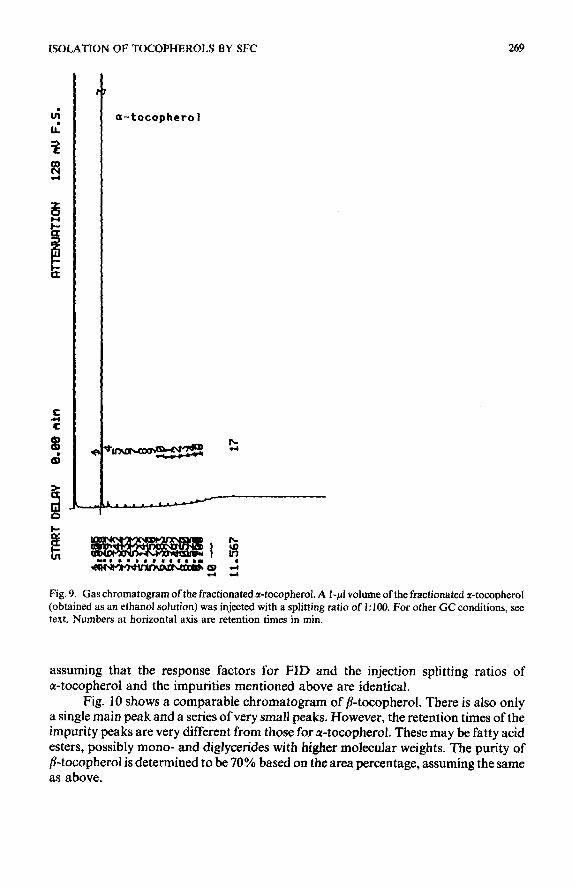
Fig. 9 shows the gas chromatogram of the fractionated a-tocopherol. As can be seen, there is only a single main peak and a series of very small peaks. The main peak is a-tocopherol and the small peaks may be fatty acid esters, including mono- and diglycerides. The IR spectrum shown in Fig. 7A supports this assumption. The purity of a-tocopherol is determined to be about 85% based on the area percentage, i.e.,
TABLE III
CHARACTERISTIC IR ABSORPTION BANDS (cm-‘) OF a- AND p-TOCOPHEROLS’
Compound OH CH C=C CH3 (arom.)
CHz c-o
(avl)
C-O CH
(alkyl)
wTocophero1 3310 2930 1620 1460 1375 1270 1160 850 p-Tocopherol 3320 3940 1595 1458 1373 1229 1158 860
WOLATION OF TOCOPHEROLS BY SFC 269
f
-
a-tocopherol
Fig. 9. Gas chromatogram of the fractionated a-tocopherol. A I-p1 volume of the fractionated a-tocopherol (obtained as an ethanol solution) was injected with a splitting ratio of 1:lOO. For other GC conditions, see text. Numbers at horizontal axis are retention times in min.
assuming that the response factors for FID and the injection splitting ratios of n-tocopherol and the impurities mentioned above are identical.
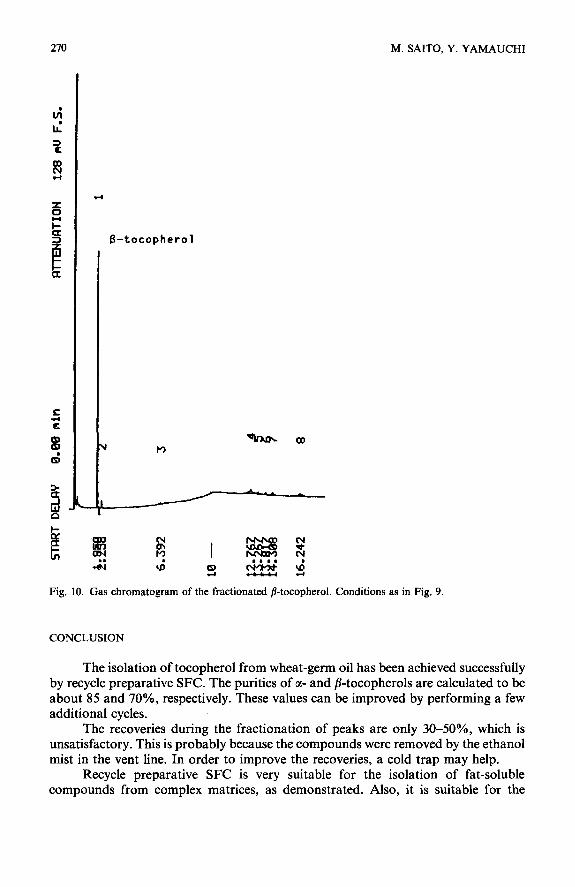
Fig. 10 shows a comparable chromatogram of p-tocopherol. There is also only a single main peak and a series of very small peaks. However, the retention times of the impurity peaks are very different from those for a-tocopherol. These may be fatty acid esters, possibly mono- and diglycerides with higher molecular weights. The purity of @-tocopherol is determined to be 70% based on the area percentage, assuming the same as above.
M. SAITO, Y. YAMAUCHI
B-tocopherol
Fig. 10. Gas chromatogram of the fractionated ,%tocopherol. Conditions as in Fig, 9.
CONCLUSION
The isolation of tocopherol from wheat-germ oil has been achieved successfully by recycle preparative SFC. The purities of a- and /I-tocopherols are calculated to be about 85 and 70%, respectively. These values can be improved by performing a few additional cycles.
The recoveries during the fractionation of peaks are only 30-50%, which is unsatisfactory. This is probably because the compounds were removed by the ethanol mist in the vent line. In order to improve the recoveries, a cold trap may help.
Recycle preparative SFC is very suitable for the isolation of fat-soluble compounds from complex matrices, as demonstrated. Also, it is suitable for the
ISOLATION OF TOCOPHEROLS BY SFC 271
separation and fractionation of compounds of which the a-values are small and cannot be improved by varying the mobile-phase conditions, i.e., by a change in density or temperature or the addition of a modifier solvent. In such a case, the column length has a major effect on the resolution. Recycle preparative SFC offers a high efficiency, because the pressure drop AP is minimized, regardless of the number of recycles, which is virtually equivalent to using a long column with a minimum pressure drop. Typical examples of such applications include the separation of optical isomers.
REFERENCES
1 M. Saito, T. Hondo and Y. Yamauchi, in R. M. Smith (Editor), Supercritical Fluid Chromatography, Royal Society of Chemistry, London, 1988, Ch. 8, p. 203.
2 M. Saito and Y. Yamauchi, J. Chromatogr. Sci., 27 (1988) 79. 3 P. J. Schoenmakers, in R. M. Smith (Editor), Supercritical Fluid Chromatography, Royal Society of
Chemistry, London, 1988, Ch. 4, p. 102. 4 P. J. Schoenmakers and L. G. M. Uunk, Chromutogruphiu, 24 (1987) 51. 5 M. Saito and Y. Yamauchi, J. High Resolut. Chromatogr. Chromafogr. Commun., 11 (1988) 741. 6 M. Saito. Y. Yamauchi. H. Kashiwazaki and M. Sugawara, Chromutogruphiu, 25 (1988) 801. 7 Chemical Society of Japan (Editor), Kuguku Binrun (Chemical Dufu BookJ, Maruzen Corp., Tokyo,
1975, p. 350. 8 J. F. Pennock, in R. A. Morton (Editor), Biochemistry of Quinones, Academic Press, London, 1965, p.
67.