Embed Size (px)
Citation preview
JOURNAL OF BACTERIOLOGY,0021-9193/00/$04.0010
Oct. 2000, p. 5692–5699 Vol. 182, No. 20
Copyright © 2000, American Society for Microbiology. All Rights Reserved.
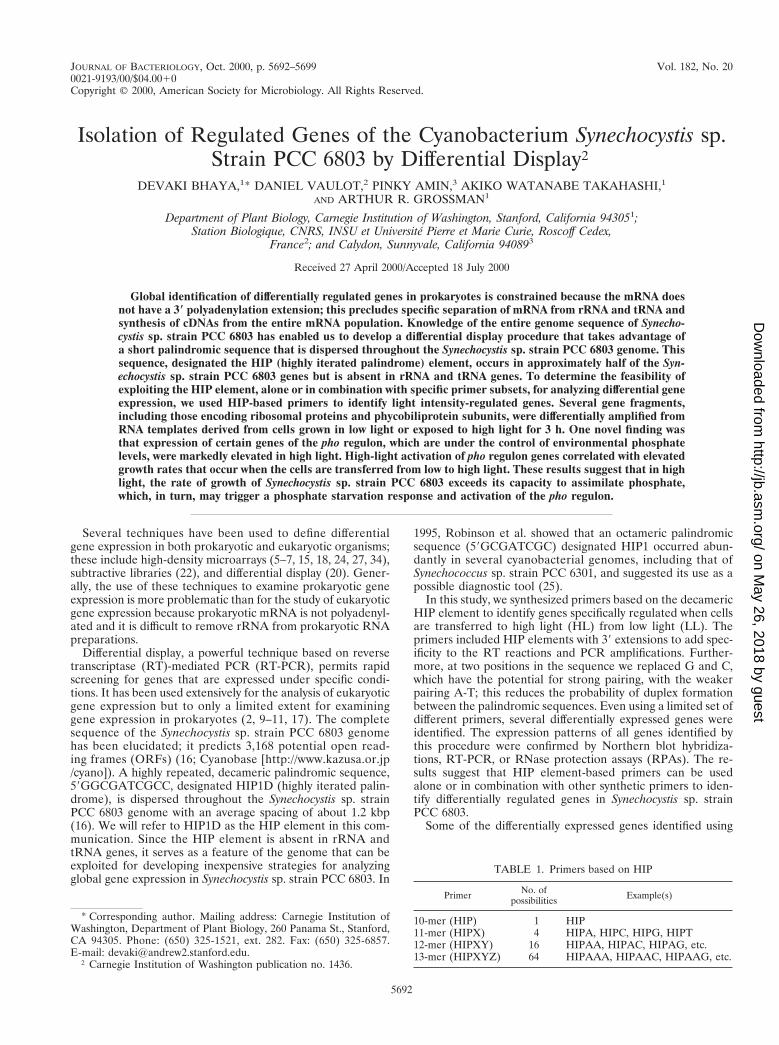
Isolation of Regulated Genes of the Cyanobacterium Synechocystis sp.Strain PCC 6803 by Differential Display†
DEVAKI BHAYA,1* DANIEL VAULOT,2 PINKY AMIN,3 AKIKO WATANABE TAKAHASHI,1
AND ARTHUR R. GROSSMAN1
Department of Plant Biology, Carnegie Institution of Washington, Stanford, California 943051;Station Biologique, CNRS, INSU et Université Pierre et Marie Curie, Roscoff Cedex,
France2; and Calydon, Sunnyvale, California 940893
Received 27 April 2000/Accepted 18 July 2000
Global identification of differentially regulated genes in prokaryotes is constrained because the mRNA doesnot have a 3* polyadenylation extension; this precludes specific separation of mRNA from rRNA and tRNA andsynthesis of cDNAs from the entire mRNA population. Knowledge of the entire genome sequence of Synecho-cystis sp. strain PCC 6803 has enabled us to develop a differential display procedure that takes advantage ofa short palindromic sequence that is dispersed throughout the Synechocystis sp. strain PCC 6803 genome. Thissequence, designated the HIP (highly iterated palindrome) element, occurs in approximately half of the Syn-echocystis sp. strain PCC 6803 genes but is absent in rRNA and tRNA genes. To determine the feasibility ofexploiting the HIP element, alone or in combination with specific primer subsets, for analyzing differential geneexpression, we used HIP-based primers to identify light intensity-regulated genes. Several gene fragments,including those encoding ribosomal proteins and phycobiliprotein subunits, were differentially amplified fromRNA templates derived from cells grown in low light or exposed to high light for 3 h. One novel finding wasthat expression of certain genes of the pho regulon, which are under the control of environmental phosphatelevels, were markedly elevated in high light. High-light activation of pho regulon genes correlated with elevatedgrowth rates that occur when the cells are transferred from low to high light. These results suggest that in highlight, the rate of growth of Synechocystis sp. strain PCC 6803 exceeds its capacity to assimilate phosphate,which, in turn, may trigger a phosphate starvation response and activation of the pho regulon.
Several techniques have been used to define differentialgene expression in both prokaryotic and eukaryotic organisms;these include high-density microarrays (5–7, 15, 18, 24, 27, 34),subtractive libraries (22), and differential display (20). Gener-ally, the use of these techniques to examine prokaryotic geneexpression is more problematic than for the study of eukaryoticgene expression because prokaryotic mRNA is not polyadenyl-ated and it is difficult to remove rRNA from prokaryotic RNApreparations.
Differential display, a powerful technique based on reversetranscriptase (RT)-mediated PCR (RT-PCR), permits rapidscreening for genes that are expressed under specific condi-tions. It has been used extensively for the analysis of eukaryoticgene expression but to only a limited extent for examininggene expression in prokaryotes (2, 9–11, 17). The completesequence of the Synechocystis sp. strain PCC 6803 genomehas been elucidated; it predicts 3,168 potential open read-ing frames (ORFs) (16; Cyanobase [http://www.kazusa.or.jp/cyano]). A highly repeated, decameric palindromic sequence,59GGCGATCGCC, designated HIP1D (highly iterated palin-drome), is dispersed throughout the Synechocystis sp. strainPCC 6803 genome with an average spacing of about 1.2 kbp(16). We will refer to HIP1D as the HIP element in this com-munication. Since the HIP element is absent in rRNA andtRNA genes, it serves as a feature of the genome that can beexploited for developing inexpensive strategies for analyzingglobal gene expression in Synechocystis sp. strain PCC 6803. In
1995, Robinson et al. showed that an octameric palindromicsequence (59GCGATCGC) designated HIP1 occurred abun-dantly in several cyanobacterial genomes, including that ofSynechococcus sp. strain PCC 6301, and suggested its use as apossible diagnostic tool (25).
In this study, we synthesized primers based on the decamericHIP element to identify genes specifically regulated when cellsare transferred to high light (HL) from low light (LL). Theprimers included HIP elements with 39 extensions to add spec-ificity to the RT reactions and PCR amplifications. Further-more, at two positions in the sequence we replaced G and C,which have the potential for strong pairing, with the weakerpairing A-T; this reduces the probability of duplex formationbetween the palindromic sequences. Even using a limited set ofdifferent primers, several differentially expressed genes wereidentified. The expression patterns of all genes identified bythis procedure were confirmed by Northern blot hybridiza-tions, RT-PCR, or RNase protection assays (RPAs). The re-sults suggest that HIP element-based primers can be usedalone or in combination with other synthetic primers to iden-tify differentially regulated genes in Synechocystis sp. strainPCC 6803.
Some of the differentially expressed genes identified using
* Corresponding author. Mailing address: Carnegie Institution ofWashington, Department of Plant Biology, 260 Panama St., Stanford,CA 94305. Phone: (650) 325-1521, ext. 282. Fax: (650) 325-6857.E-mail: [email protected].
† Carnegie Institution of Washington publication no. 1436.
TABLE 1. Primers based on HIP
Primer No. ofpossibilities Example(s)
10-mer (HIP) 1 HIP11-mer (HIPX) 4 HIPA, HIPC, HIPG, HIPT12-mer (HIPXY) 16 HIPAA, HIPAC, HIPAG, etc.13-mer (HIPXYZ) 64 HIPAAA, HIPAAC, HIPAAG, etc.
5692
on May 26, 2018 by guest
http://jb.asm.org/
Dow
nloaded from

HIP element-based differential display could have been pre-dicted from previous work with cyanobacteria, while otherswere novel. For example, HL caused a decrease in the accu-mulation of the cpcBAHCD transcript and an increase in thelevel of the rpl11 or rpl1 transcript. Both of these cases cor-roborate what is already known about light responses of cya-nobacteria and serve as proof-of-concept examples. However,unexpectedly, expression of the phoA gene, which encodes analkaline phosphatase that was previously shown to be con-trolled by the level of phosphate in the environment (1, 21, 23,36), was markedly elevated when the cells were exposed to HL.These results are discussed in the context of the acclimation ofcells to both HL and nutrient limitation.
MATERIALS AND METHODSCulture and growth conditions. The nonmotile strain of Synechocystis sp.
strain PCC 6803 (originally from John Williams) was obtained from TeruoOgawa, Bioscience Centre, Nagoya University, Japan. Cells were grown in BG-11medium in moderate light (70 mmol of photons m22 s21) at 30°C. The cultures
were bubbled with 3% CO2 in air and harvested when they reached mid-loga-rithmic phase of growth (between 107 and 108 cells/ml). To elicit a light intensity-dependent change in the pattern of gene expression, Synechocystis sp. strain PCC6803 cells were transferred from growth in 30 mmol of photons m22 s21 (i.e., LLconditions) to 500 mmol of photons m22 s21 for 3 h (or for periods of time asindicated in figure legends).
DNA and RNA isolation. Molecular techniques were performed according tostandard procedures (26). DNA was isolated from Synechocystis sp. strain PCC6803 according to the method of Tandeau de Marsac et al. (32). RNA wasisolated from pelleted cells frozen at 280°C, using a slight modification of themethod of De Saizieu (8) as described by Bhaya et al. (3). Briefly, 500 ml ofacidified phenol and 500 ml of NAES (50 mM sodium acetate [pH 5.1], 10 mMEDTA, 1% sodium dodecyl sulfate) were added to cell pellets from a 50-mlculture; after the addition of 100 mg of glass beads (0.1-mm, average diameter),the suspension was agitated in a Mini-Bead Beater (Biospec Products, Bartles-ville, Okla.) three times for 20 s each at 5,000 rpm. This was followed by twophenol-chloroform (1:1) and one chloroform extraction. The RNA preparationswere treated for 30 min at room temperature with RNase-free DNase I (20 U;Roche Molecular Biochemicals, Indianapolis, Ind.) followed by phenol-chloro-form extraction (1:1) and precipitation in 2 volumes of ethanol. The final pelletwas dissolved in 50 ml of 10 mM Tris (pH 8.0)–1 mM EDTA. RNA yields rangedfrom 150 to 250 mg from a 50-ml culture (approximately 5 3 108 cells).
RT-PCR. The primers used for RT-PCRs were variations of HIP elements, asshown in Tables 1 and 2. For the RT reaction between 10 and 100 ng of RNA wasincubated with 4 pmol of primer for 10 min at 70°C prior to adding 100 U ofSuperscript II RT (GIBCO BRL, Grand Island, N.Y.). The reaction was allowedto proceed for 50 min at 42°C and terminated by incubation at 72°C for 15 min;1 ml of the RT reaction, which contained 0.5 to 2.5 ng of DNA, was used for PCR.Approximately 5 pmol of primer and 2 U of Platinum Taq DNA polymerase(GIBCO BRL) were used in a 25-ml reaction volume. PCR was initiated with ahot start step at 94°C for 120 s, followed by 30 cycles of 94°C for 30 s, 40°C for30 s, 72°C for 150 s, and termination after the last cycle at 72°C for an additional5 min. The samples were maintained at 4°C until they were analyzed on a 2%agarose gel in TAE (40 mM Tris-acetate [pH 8.0, 1 mM EDTA]) buffer; theamplified fragments were visualized by staining with ethidium bromide. For con-firmation of differential expression of the cpcBACHD genes, we used the specific
FIG. 1. Positions of HIP elements in the Synechocystis sp. strain PCC 6803 genome. The position of each HIP element is marked with a cross (1). The sequencebegins at the lower left (nucleotide 1 of the sequence) and ends at the top right (nucleotide 3573470). Positions of the rRNA genes which lack HIP elements are shownby thick lines.
TABLE 2. Modified HIP primers
Modification Sequencea (59339)
HIP GGCGATCGCCW1-HIP AGAGATCGCCW2-HIP WGWGATCGCCW3-HIP GWCWATCGCCW4-HIP GGWGATCGCC
a W 5 A or T.
VOL. 182, 2000 ISOLATION OF REGULATED GENES IN SYNECHOCYSTIS 5693
on May 26, 2018 by guest
http://jb.asm.org/
Dow
nloaded from
primer pair 59AATTGCTTTCGGTCGTCTA-59GCGTAATCGAGGTAGGAfor RT-PCR. The conditions for RT-PCR were the same as described above.
Cloning and sequencing. PCR fragments were extracted from the agarose gelusing a gel extraction kit (Qiagen, Chatsworth, Calif.) and ligated into pGEM-Tor pGEM-T Easy vectors (Promega, Madison, Wis.). The cloned fragments weresequenced from both directions with either the T7 or SP6 primer using therecommended Big Dye protocol (PE Biosystems, Foster City, Calif.).
Northern blot hybridizations. Northern blot hybridizations and preparation ofradiolabeled DNA probes were performed as previously described (3).
RPA. RPAs were performed according to the protocol supplied with theHyperspeed RPA kit (Ambion, Tex.). To amplify the rpl1 and rpl11 fragmentsfrom genomic DNA, the primer pairs 59AGGTAGATGACAGCAAAC-59GTGGCCTCCTTGACCTTT and 59AAAGTCGTCGCTCTGATT-59TGCCATGATATTAACCCC, respectively, were used. The PCR products were ligated into thepGEM-T Easy vector, and the labeled RNA (antisense) probe was synthesizedwith a STRIP-EZ RNA kit (Ambion), using the T7 promoter for rpl11 and theSP6 promoter for rpl1. Labeled antisense RNA was incubated with 5 mg of totalRNA (DNase treated), and the assay along with the appropriate controls wereperformed according to recommendations of the manufacturer. A portion ofeach RNA sample was subjected to electrophoresis on a formaldehyde agarosegel to confirm the RNA concentration, which was also determined spectropho-tometrically.
RESULTSThe palindromic, decameric HIP element, 59GGCGATCG
CC, occurs a total of 2,823 times throughout the Synechocystissp. strain PCC 6803 genome, of which 2,562 (or 90.7%) arelocated in ORFs (14a, 16). The genome wide distribution ofHIP elements is shown in Fig. 1 (positions of the HIP elementsare available at http://www.sb-roscoff.fr/Phyto/Syn6803_HIP_sequences.html). Of the 3,168 ORFs identified in the genome,1,653 (52.2%) contain HIP elements; 1,008 contain a singleHIP element, while 645 contain multiple HIP elements. Withina coding region, the position of a HIP element appears to berandom. Notably, it is absent in all rRNA and tRNA genes aswell as in genes encoding transposases. It is significantly under-represented among genes encoding chaperones, ribosomal pro-teins, proteins involved in photosynthetic function, and certainhypothetical ORFs (D. Vaulot, A. R. Grossman, D. Bhaya,J. Mrázek, and S. Karlin, unpublished data).
Initial experiments were performed to test the use of HIPprimers for the implementation of differential display in Syn-echocystis sp. strain PCC 6803. Two types of modifications ofHIP primers were used in these experiments. First, the primerswere extended at their 39 ends by one, two, and three nucleo-
tides (HIPX, HIPXY, and HIPXYZ, respectively) to add spec-ificity to the RT reactions and/or PCR (Table 1). Second,because the primers are palindromes and tend to anneal toeach other, we modified positions by changing strongly pairingbases (G and C) to the weakly pairing bases (A and T); fourdifferent kinds of modifications (designated W1-HIP, W2-HIP,W3-HIP, and W4-HIP; [Table 2]) were incorporated into theprimers.
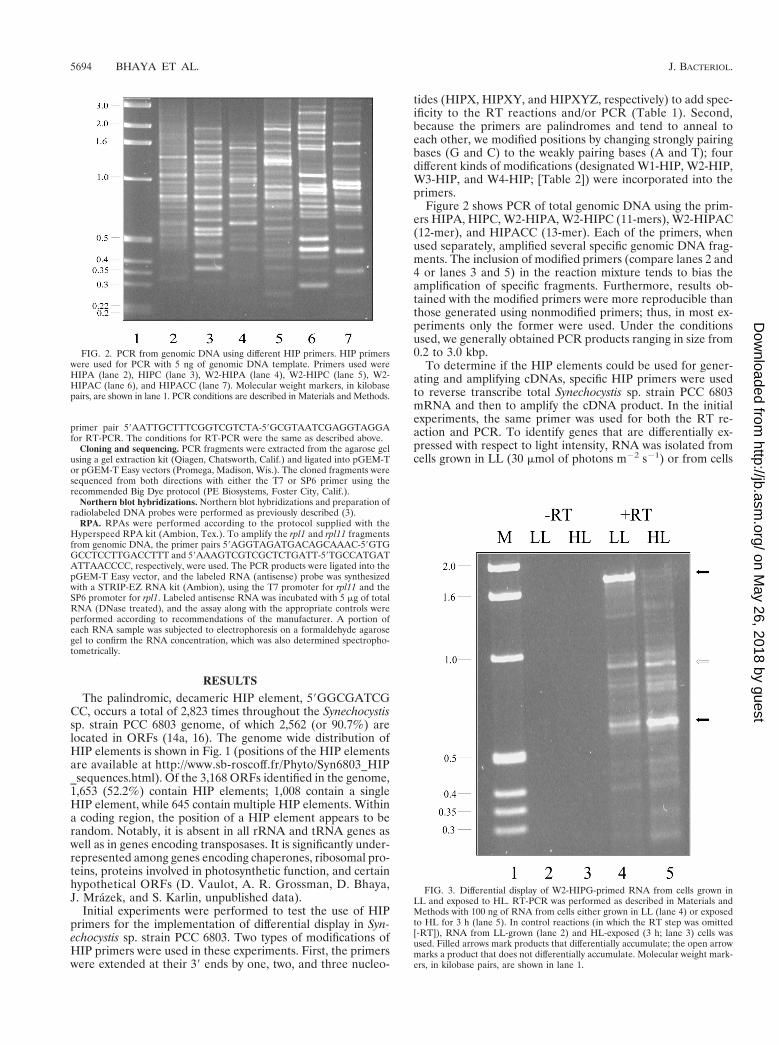
Figure 2 shows PCR of total genomic DNA using the prim-ers HIPA, HIPC, W2-HIPA, W2-HIPC (11-mers), W2-HIPAC(12-mer), and HIPACC (13-mer). Each of the primers, whenused separately, amplified several specific genomic DNA frag-ments. The inclusion of modified primers (compare lanes 2 and4 or lanes 3 and 5) in the reaction mixture tends to bias theamplification of specific fragments. Furthermore, results ob-tained with the modified primers were more reproducible thanthose generated using nonmodified primers; thus, in most ex-periments only the former were used. Under the conditionsused, we generally obtained PCR products ranging in size from0.2 to 3.0 kbp.
To determine if the HIP elements could be used for gener-ating and amplifying cDNAs, specific HIP primers were usedto reverse transcribe total Synechocystis sp. strain PCC 6803mRNA and then to amplify the cDNA product. In the initialexperiments, the same primer was used for both the RT re-action and PCR. To identify genes that are differentially ex-pressed with respect to light intensity, RNA was isolated fromcells grown in LL (30 mmol of photons m22 s21) or from cells
FIG. 2. PCR from genomic DNA using different HIP primers. HIP primerswere used for PCR with 5 ng of genomic DNA template. Primers used wereHIPA (lane 2), HIPC (lane 3), W2-HIPA (lane 4), W2-HIPC (lane 5), W2-HIPAC (lane 6), and HIPACC (lane 7). Molecular weight markers, in kilobasepairs, are shown in lane 1. PCR conditions are described in Materials and Methods.
FIG. 3. Differential display of W2-HIPG-primed RNA from cells grown inLL and exposed to HL. RT-PCR was performed as described in Materials andMethods with 100 ng of RNA from cells either grown in LL (lane 4) or exposedto HL for 3 h (lane 5). In control reactions (in which the RT step was omitted[-RT]), RNA from LL-grown (lane 2) and HL-exposed (3 h; lane 3) cells wasused. Filled arrows mark products that differentially accumulate; the open arrowmarks a product that does not differentially accumulate. Molecular weight mark-ers, in kilobase pairs, are shown in lane 1.
5694 BHAYA ET AL. J. BACTERIOL.
on May 26, 2018 by guest
http://jb.asm.org/
Dow
nloaded from
exposed to HL (500 mmol of photons m22 s21) for 3 h aftergrowth in LL. Figure 3 shows the amplified products when theprimer W2-HIPG was used for both the RT reaction and PCR.No products are observed in the no-RT control (lanes 2 and 3).Some of the products generated from the RNA isolated fromcells grown in LL or exposed to HL were the same in size andintensity, suggesting that they did not originate from differen-tially expressed genes. However, there were also products thatexhibited differential accumulation between the two condi-tions. For instance, there was a strong band at 1.75 kbp in LLbut not HL samples (lanes 4 and 5). Conversely, a fragment ofapproximately 0.6 kbp was present at a higher level in HLsamples than in LL samples.
The differential display product of 1.75 kbp was cloned intothe pGEM T-Easy vector, and the sequences at both ends ofthe cloned fragment were determined. This identified the frag-ment as part of the cpcBACHD operon, which contains genesencoding phycocyanin, and the phycocyanin linker polypep-tides. We could locate the two W2-HIPG-like priming sites(59CTTGATCGCCG and 59CGGCGATCGTG, where under-lined letters represent deviations from the W2-HIPG se-quence) on the genomic DNA; the distance between them is
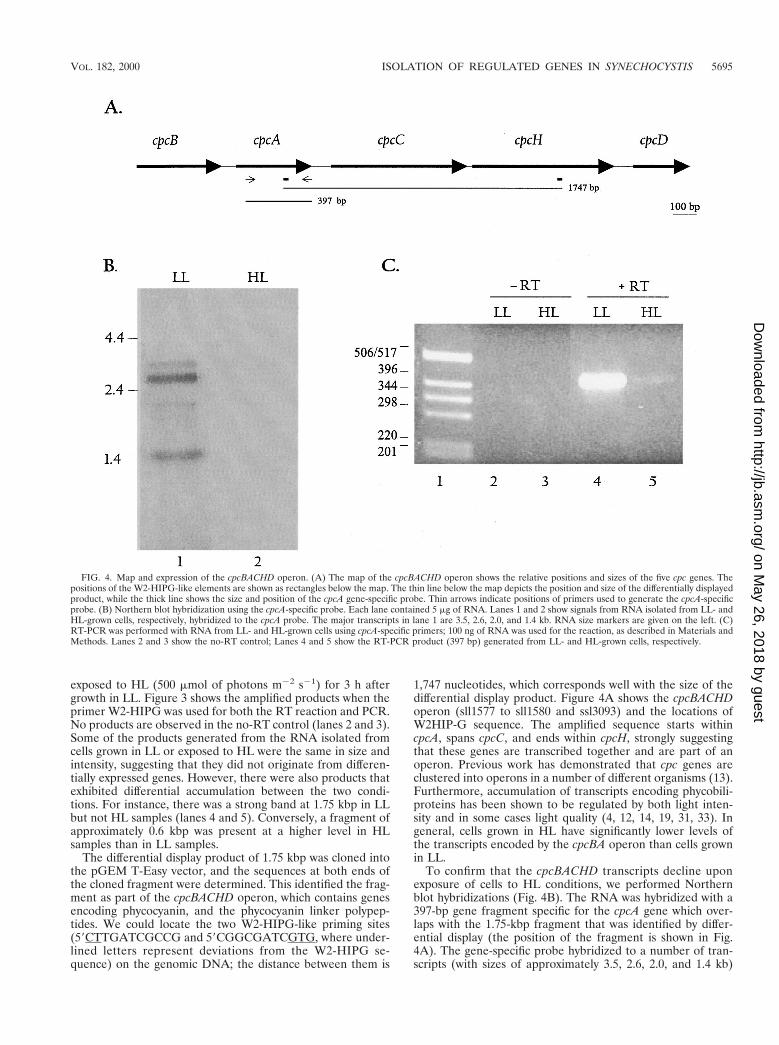
1,747 nucleotides, which corresponds well with the size of thedifferential display product. Figure 4A shows the cpcBACHDoperon (sll1577 to sll1580 and ssl3093) and the locations ofW2HIP-G sequence. The amplified sequence starts withincpcA, spans cpcC, and ends within cpcH, strongly suggestingthat these genes are transcribed together and are part of anoperon. Previous work has demonstrated that cpc genes areclustered into operons in a number of different organisms (13).Furthermore, accumulation of transcripts encoding phycobili-proteins has been shown to be regulated by both light inten-sity and in some cases light quality (4, 12, 14, 19, 31, 33). Ingeneral, cells grown in HL have significantly lower levels ofthe transcripts encoded by the cpcBA operon than cells grownin LL.
To confirm that the cpcBACHD transcripts decline uponexposure of cells to HL conditions, we performed Northernblot hybridizations (Fig. 4B). The RNA was hybridized with a397-bp gene fragment specific for the cpcA gene which over-laps with the 1.75-kbp fragment that was identified by differ-ential display (the position of the fragment is shown in Fig.4A). The gene-specific probe hybridized to a number of tran-scripts (with sizes of approximately 3.5, 2.6, 2.0, and 1.4 kb)
FIG. 4. Map and expression of the cpcBACHD operon. (A) The map of the cpcBACHD operon shows the relative positions and sizes of the five cpc genes. Thepositions of the W2-HIPG-like elements are shown as rectangles below the map. The thin line below the map depicts the position and size of the differentially displayedproduct, while the thick line shows the size and position of the cpcA gene-specific probe. Thin arrows indicate positions of primers used to generate the cpcA-specificprobe. (B) Northern blot hybridization using the cpcA-specific probe. Each lane contained 5 mg of RNA. Lanes 1 and 2 show signals from RNA isolated from LL- andHL-grown cells, respectively, hybridized to the cpcA probe. The major transcripts in lane 1 are 3.5, 2.6, 2.0, and 1.4 kb. RNA size markers are given on the left. (C)RT-PCR was performed with RNA from LL- and HL-grown cells using cpcA-specific primers; 100 ng of RNA was used for the reaction, as described in Materials andMethods. Lanes 2 and 3 show the no-RT control; Lanes 4 and 5 show the RT-PCR product (397 bp) generated from LL- and HL-grown cells, respectively.
VOL. 182, 2000 ISOLATION OF REGULATED GENES IN SYNECHOCYSTIS 5695
on May 26, 2018 by guest
http://jb.asm.org/
Dow
nloaded from
that are synthesized from the cpcBACHD operon (lane 1) inLL. The 3.5-kb transcript may be just long enough to encodeall of the genes of the operon (cpcBACHD). The shorter tran-scripts may cover a subset of these genes; for instance, thestrong transcript of 1.4 kb may cover cpcBA. Barely detectabletranscript levels are present in cells exposed to HL for 3 h (lane2). RT-PCR using primers specific for the cpcA gene (positionsof the primers are shown in Fig. 4A) also confirmed thatexpression declined dramatically upon exposure of cells to HL(Fig. 4C). While there were no bands in lanes 2 and 3 (no-RTcontrols), a strong band of 397 bp was present in lane 4 (LL)and a faint band was present in lane 5 (HL). In fact, a 30-minexposure to HL caused a marked reduction in transcript levels(data not shown).
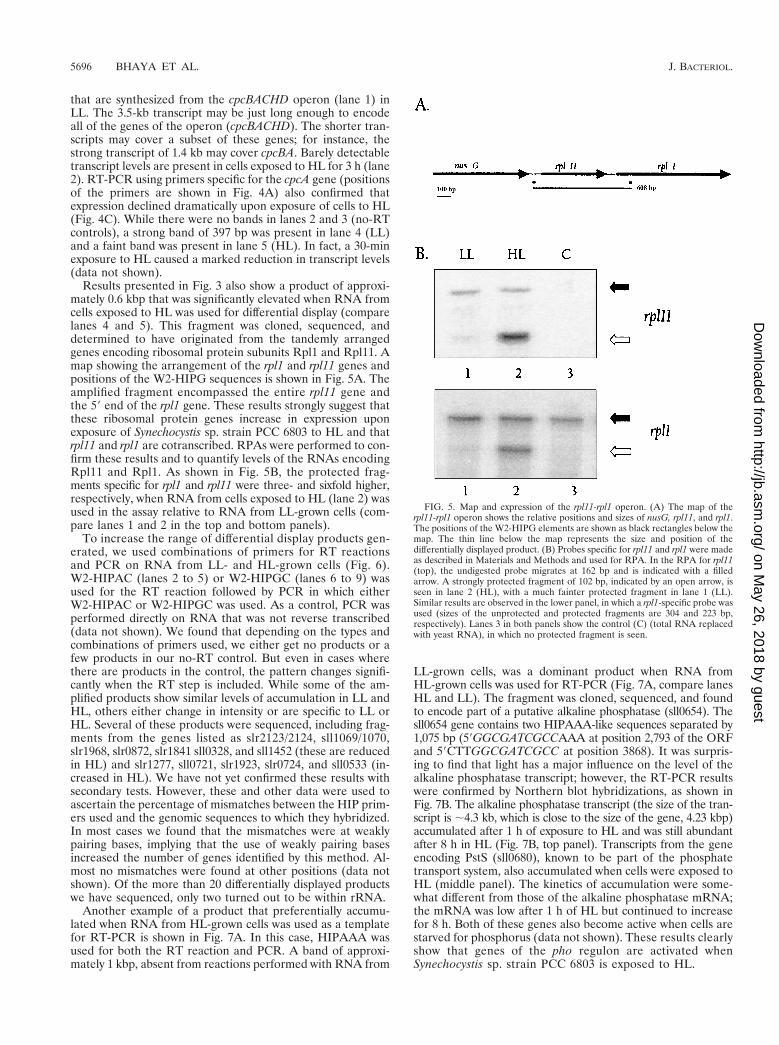
Results presented in Fig. 3 also show a product of approxi-mately 0.6 kbp that was significantly elevated when RNA fromcells exposed to HL was used for differential display (comparelanes 4 and 5). This fragment was cloned, sequenced, anddetermined to have originated from the tandemly arrangedgenes encoding ribosomal protein subunits Rpl1 and Rpl11. Amap showing the arrangement of the rpl1 and rpl11 genes andpositions of the W2-HIPG sequences is shown in Fig. 5A. Theamplified fragment encompassed the entire rpl11 gene andthe 59 end of the rpl1 gene. These results strongly suggest thatthese ribosomal protein genes increase in expression uponexposure of Synechocystis sp. strain PCC 6803 to HL and thatrpl11 and rpl1 are cotranscribed. RPAs were performed to con-firm these results and to quantify levels of the RNAs encodingRpl11 and Rpl1. As shown in Fig. 5B, the protected frag-ments specific for rpl1 and rpl11 were three- and sixfold higher,respectively, when RNA from cells exposed to HL (lane 2) wasused in the assay relative to RNA from LL-grown cells (com-pare lanes 1 and 2 in the top and bottom panels).
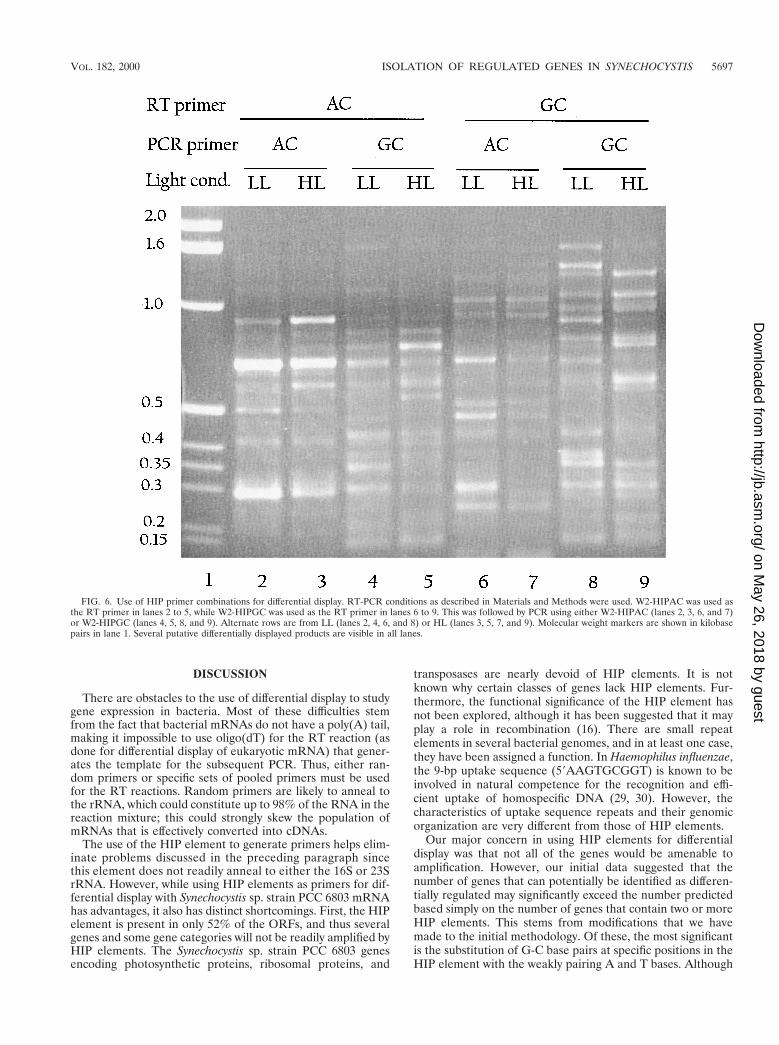
To increase the range of differential display products gen-erated, we used combinations of primers for RT reactionsand PCR on RNA from LL- and HL-grown cells (Fig. 6).W2-HIPAC (lanes 2 to 5) or W2-HIPGC (lanes 6 to 9) wasused for the RT reaction followed by PCR in which eitherW2-HIPAC or W2-HIPGC was used. As a control, PCR wasperformed directly on RNA that was not reverse transcribed(data not shown). We found that depending on the types andcombinations of primers used, we either get no products or afew products in our no-RT control. But even in cases wherethere are products in the control, the pattern changes signifi-cantly when the RT step is included. While some of the am-plified products show similar levels of accumulation in LL andHL, others either change in intensity or are specific to LL orHL. Several of these products were sequenced, including frag-ments from the genes listed as slr2123/2124, sll1069/1070,slr1968, slr0872, slr1841 sll0328, and sll1452 (these are reducedin HL) and slr1277, sll0721, slr1923, slr0724, and sll0533 (in-creased in HL). We have not yet confirmed these results withsecondary tests. However, these and other data were used toascertain the percentage of mismatches between the HIP prim-ers used and the genomic sequences to which they hybridized.In most cases we found that the mismatches were at weaklypairing bases, implying that the use of weakly pairing basesincreased the number of genes identified by this method. Al-most no mismatches were found at other positions (data notshown). Of the more than 20 differentially displayed productswe have sequenced, only two turned out to be within rRNA.
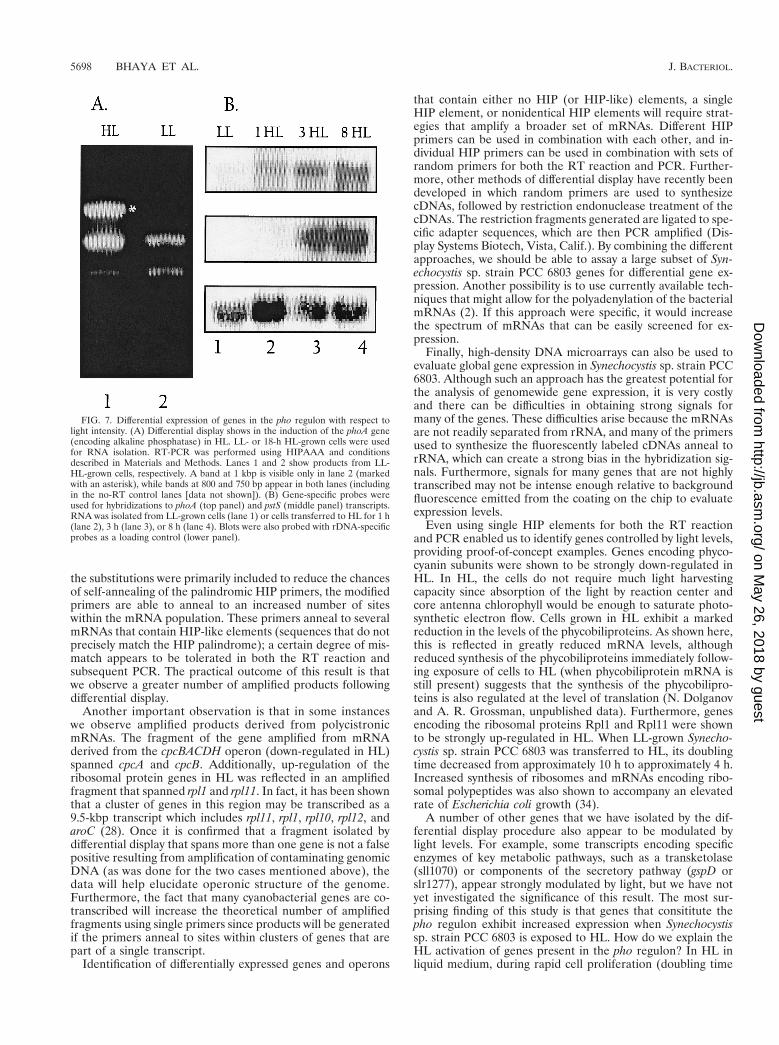
Another example of a product that preferentially accumu-lated when RNA from HL-grown cells was used as a templatefor RT-PCR is shown in Fig. 7A. In this case, HIPAAA wasused for both the RT reaction and PCR. A band of approxi-mately 1 kbp, absent from reactions performed with RNA from
LL-grown cells, was a dominant product when RNA fromHL-grown cells was used for RT-PCR (Fig. 7A, compare lanesHL and LL). The fragment was cloned, sequenced, and foundto encode part of a putative alkaline phosphatase (sll0654). Thesll0654 gene contains two HIPAAA-like sequences separated by1,075 bp (59GGCGATCGCCAAA at position 2,793 of the ORFand 59CTTGGCGATCGCC at position 3868). It was surpris-ing to find that light has a major influence on the level of thealkaline phosphatase transcript; however, the RT-PCR resultswere confirmed by Northern blot hybridizations, as shown inFig. 7B. The alkaline phosphatase transcript (the size of the tran-script is ;4.3 kb, which is close to the size of the gene, 4.23 kbp)accumulated after 1 h of exposure to HL and was still abundantafter 8 h in HL (Fig. 7B, top panel). Transcripts from the geneencoding PstS (sll0680), known to be part of the phosphatetransport system, also accumulated when cells were exposed toHL (middle panel). The kinetics of accumulation were some-what different from those of the alkaline phosphatase mRNA;the mRNA was low after 1 h of HL but continued to increasefor 8 h. Both of these genes also become active when cells arestarved for phosphorus (data not shown). These results clearlyshow that genes of the pho regulon are activated whenSynechocystis sp. strain PCC 6803 is exposed to HL.
FIG. 5. Map and expression of the rpl11-rpl1 operon. (A) The map of therpl11-rpl1 operon shows the relative positions and sizes of nusG, rpl11, and rpl1.The positions of the W2-HIPG elements are shown as black rectangles below themap. The thin line below the map represents the size and position of thedifferentially displayed product. (B) Probes specific for rpl11 and rpl1 were madeas described in Materials and Methods and used for RPA. In the RPA for rpl11(top), the undigested probe migrates at 162 bp and is indicated with a filledarrow. A strongly protected fragment of 102 bp, indicated by an open arrow, isseen in lane 2 (HL), with a much fainter protected fragment in lane 1 (LL).Similar results are observed in the lower panel, in which a rpl1-specific probe wasused (sizes of the unprotected and protected fragments are 304 and 223 bp,respectively). Lanes 3 in both panels show the control (C) (total RNA replacedwith yeast RNA), in which no protected fragment is seen.
5696 BHAYA ET AL. J. BACTERIOL.
on May 26, 2018 by guest
http://jb.asm.org/
Dow
nloaded from
DISCUSSION
There are obstacles to the use of differential display to studygene expression in bacteria. Most of these difficulties stemfrom the fact that bacterial mRNAs do not have a poly(A) tail,making it impossible to use oligo(dT) for the RT reaction (asdone for differential display of eukaryotic mRNA) that gener-ates the template for the subsequent PCR. Thus, either ran-dom primers or specific sets of pooled primers must be usedfor the RT reactions. Random primers are likely to anneal tothe rRNA, which could constitute up to 98% of the RNA in thereaction mixture; this could strongly skew the population ofmRNAs that is effectively converted into cDNAs.
The use of the HIP element to generate primers helps elim-inate problems discussed in the preceding paragraph sincethis element does not readily anneal to either the 16S or 23SrRNA. However, while using HIP elements as primers for dif-ferential display with Synechocystis sp. strain PCC 6803 mRNAhas advantages, it also has distinct shortcomings. First, the HIPelement is present in only 52% of the ORFs, and thus severalgenes and some gene categories will not be readily amplified byHIP elements. The Synechocystis sp. strain PCC 6803 genesencoding photosynthetic proteins, ribosomal proteins, and
transposases are nearly devoid of HIP elements. It is notknown why certain classes of genes lack HIP elements. Fur-thermore, the functional significance of the HIP element hasnot been explored, although it has been suggested that it mayplay a role in recombination (16). There are small repeatelements in several bacterial genomes, and in at least one case,they have been assigned a function. In Haemophilus influenzae,the 9-bp uptake sequence (59AAGTGCGGT) is known to beinvolved in natural competence for the recognition and effi-cient uptake of homospecific DNA (29, 30). However, thecharacteristics of uptake sequence repeats and their genomicorganization are very different from those of HIP elements.
Our major concern in using HIP elements for differentialdisplay was that not all of the genes would be amenable toamplification. However, our initial data suggested that thenumber of genes that can potentially be identified as differen-tially regulated may significantly exceed the number predictedbased simply on the number of genes that contain two or moreHIP elements. This stems from modifications that we havemade to the initial methodology. Of these, the most significantis the substitution of G-C base pairs at specific positions in theHIP element with the weakly pairing A and T bases. Although
FIG. 6. Use of HIP primer combinations for differential display. RT-PCR conditions as described in Materials and Methods were used. W2-HIPAC was used asthe RT primer in lanes 2 to 5, while W2-HIPGC was used as the RT primer in lanes 6 to 9. This was followed by PCR using either W2-HIPAC (lanes 2, 3, 6, and 7)or W2-HIPGC (lanes 4, 5, 8, and 9). Alternate rows are from LL (lanes 2, 4, 6, and 8) or HL (lanes 3, 5, 7, and 9). Molecular weight markers are shown in kilobasepairs in lane 1. Several putative differentially displayed products are visible in all lanes.
VOL. 182, 2000 ISOLATION OF REGULATED GENES IN SYNECHOCYSTIS 5697
on May 26, 2018 by guest
http://jb.asm.org/
Dow
nloaded from
the substitutions were primarily included to reduce the chancesof self-annealing of the palindromic HIP primers, the modifiedprimers are able to anneal to an increased number of siteswithin the mRNA population. These primers anneal to severalmRNAs that contain HIP-like elements (sequences that do notprecisely match the HIP palindrome); a certain degree of mis-match appears to be tolerated in both the RT reaction andsubsequent PCR. The practical outcome of this result is thatwe observe a greater number of amplified products followingdifferential display.
Another important observation is that in some instanceswe observe amplified products derived from polycistronicmRNAs. The fragment of the gene amplified from mRNAderived from the cpcBACDH operon (down-regulated in HL)spanned cpcA and cpcB. Additionally, up-regulation of theribosomal protein genes in HL was reflected in an amplifiedfragment that spanned rpl1 and rpl11. In fact, it has been shownthat a cluster of genes in this region may be transcribed as a9.5-kbp transcript which includes rpl11, rpl1, rpl10, rpl12, andaroC (28). Once it is confirmed that a fragment isolated bydifferential display that spans more than one gene is not a falsepositive resulting from amplification of contaminating genomicDNA (as was done for the two cases mentioned above), thedata will help elucidate operonic structure of the genome.Furthermore, the fact that many cyanobacterial genes are co-transcribed will increase the theoretical number of amplifiedfragments using single primers since products will be generatedif the primers anneal to sites within clusters of genes that arepart of a single transcript.
Identification of differentially expressed genes and operons
that contain either no HIP (or HIP-like) elements, a singleHIP element, or nonidentical HIP elements will require strat-egies that amplify a broader set of mRNAs. Different HIPprimers can be used in combination with each other, and in-dividual HIP primers can be used in combination with sets ofrandom primers for both the RT reaction and PCR. Further-more, other methods of differential display have recently beendeveloped in which random primers are used to synthesizecDNAs, followed by restriction endonuclease treatment of thecDNAs. The restriction fragments generated are ligated to spe-cific adapter sequences, which are then PCR amplified (Dis-play Systems Biotech, Vista, Calif.). By combining the differentapproaches, we should be able to assay a large subset of Syn-echocystis sp. strain PCC 6803 genes for differential gene ex-pression. Another possibility is to use currently available tech-niques that might allow for the polyadenylation of the bacterialmRNAs (2). If this approach were specific, it would increasethe spectrum of mRNAs that can be easily screened for ex-pression.
Finally, high-density DNA microarrays can also be used toevaluate global gene expression in Synechocystis sp. strain PCC6803. Although such an approach has the greatest potential forthe analysis of genomewide gene expression, it is very costlyand there can be difficulties in obtaining strong signals formany of the genes. These difficulties arise because the mRNAsare not readily separated from rRNA, and many of the primersused to synthesize the fluorescently labeled cDNAs anneal torRNA, which can create a strong bias in the hybridization sig-nals. Furthermore, signals for many genes that are not highlytranscribed may not be intense enough relative to backgroundfluorescence emitted from the coating on the chip to evaluateexpression levels.
Even using single HIP elements for both the RT reactionand PCR enabled us to identify genes controlled by light levels,providing proof-of-concept examples. Genes encoding phyco-cyanin subunits were shown to be strongly down-regulated inHL. In HL, the cells do not require much light harvestingcapacity since absorption of the light by reaction center andcore antenna chlorophyll would be enough to saturate photo-synthetic electron flow. Cells grown in HL exhibit a markedreduction in the levels of the phycobiliproteins. As shown here,this is reflected in greatly reduced mRNA levels, althoughreduced synthesis of the phycobiliproteins immediately follow-ing exposure of cells to HL (when phycobiliprotein mRNA isstill present) suggests that the synthesis of the phycobilipro-teins is also regulated at the level of translation (N. Dolganovand A. R. Grossman, unpublished data). Furthermore, genesencoding the ribosomal proteins Rpl1 and Rpl11 were shownto be strongly up-regulated in HL. When LL-grown Synecho-cystis sp. strain PCC 6803 was transferred to HL, its doublingtime decreased from approximately 10 h to approximately 4 h.Increased synthesis of ribosomes and mRNAs encoding ribo-somal polypeptides was also shown to accompany an elevatedrate of Escherichia coli growth (34).
A number of other genes that we have isolated by the dif-ferential display procedure also appear to be modulated bylight levels. For example, some transcripts encoding specificenzymes of key metabolic pathways, such as a transketolase(sll1070) or components of the secretory pathway (gspD orslr1277), appear strongly modulated by light, but we have notyet investigated the significance of this result. The most sur-prising finding of this study is that genes that consititute thepho regulon exhibit increased expression when Synechocystissp. strain PCC 6803 is exposed to HL. How do we explain theHL activation of genes present in the pho regulon? In HL inliquid medium, during rapid cell proliferation (doubling time
FIG. 7. Differential expression of genes in the pho regulon with respect tolight intensity. (A) Differential display shows in the induction of the phoA gene(encoding alkaline phosphatase) in HL. LL- or 18-h HL-grown cells were usedfor RNA isolation. RT-PCR was performed using HIPAAA and conditionsdescribed in Materials and Methods. Lanes 1 and 2 show products from LL-HL-grown cells, respectively. A band at 1 kbp is visible only in lane 2 (markedwith an asterisk), while bands at 800 and 750 bp appear in both lanes (includingin the no-RT control lanes [data not shown]). (B) Gene-specific probes wereused for hybridizations to phoA (top panel) and pstS (middle panel) transcripts.RNA was isolated from LL-grown cells (lane 1) or cells transferred to HL for 1 h(lane 2), 3 h (lane 3), or 8 h (lane 4). Blots were also probed with rDNA-specificprobes as a loading control (lower panel).
5698 BHAYA ET AL. J. BACTERIOL.
on May 26, 2018 by guest
http://jb.asm.org/
Dow
nloaded from

of 4 to 5 h), the acquisition of phosphate may not be able tokeep pace with the growth potential of the cells; initially, cellsuse the phosphate more rapidly than it can be acquired.Therefore, although there are high levels of phosphate inthe medium (1 mM), the cells are starved for phosphorus,which could lead to activation of the pho regulon. An alterna-tive possibility is that the pho regulon is directly activated byhigh light, perhaps via a SphR/SphS-like regulator/sensor pair(1, 21). Thus, it is interesting that SphS and its homolog inSynechocystis sp. strain PCC 6803, sll0337, may contain a some-what diverged PAS domain (Igor Zhulin, personal communi-cation). PAS domains are cytosolic sensor modules that mon-itor changes in light, redox potential, or oxygen (35). Theseunexpected results serve to illustrate two points: (i) differentialdisplay may allow us novel insights into the interactions be-tween various stress conditions, although (ii) such interactionsmay be a consequence of indirect effects.
ACKNOWLEDGMENTS
We thank Samuel Karlin and Jan Mrázek, Department of Mathe-matics, Stanford University, for helping with analysis of the HIP ele-ments. We had several helpful discussions with Jeffrey Shrager, Chung-Soon Im, Chao-Jung Tu, and Hideki Takahashi concerning both theprocedure and the data that were generated.
This work was supported by National Science Foundation grantMCB 9727836 and USDA grant 98-35301-6445 to A.R.G. as well as abilateral NSF-CNRS grant to A.R.G. and D.V. The sabbatical stay ofD.V. was supported by a NATO fellowship.
REFERENCES
1. Aiba, H., M. Nagaya, and T. Mizuno. 1993. Sensor and regulator proteinsfrom the cyanobacterium Synechococcus species PCC7942 that belong to thebacterial signal-transduction protein families: implication in the adapativeresponse to phosphate limitation. Mol. Microbiol. 8:81–91.
2. Amara, R. R., and S. Vijaya. 1997. Specific polyadenylation and purificationof total messenger RNA from Escherichia coli. Nucleic Acids Res. 25:3465–3470.
3. Bhaya, D., N. Watanabe, T. Ogawa, and A. R. Grossman. 1999. The role ofan alternate sigma factor in motility and pili formation in the cyanobacte-rium Synechocystis sp. strain PCC6803. Proc. Natl. Acad. Sci. USA 96:3188–3193.
4. Campbell, D., M. J. Eriksson, G. Oquist, P. Gustafsson, and A. K. Clarke.1998. The cyanobacterium Synechococcus resists UV-B by exchanging pho-tosystem II reaction-center D1 proteins. Proc. Natl. Acad. Sci. USA 95:364–369.
5. Castellino, A. M. 1997. When the chips are down. Genome Res. 7:943–946.6. Cho, R. J., M. J. Campbell, E. A. Winzeler, L. Steinmetz, A. Conway, L.
Wodicka, T. G. Wolfsberg, A. E. Gabrielian, D. Landsman, D. J. Lockhart,and R. W. Davis. 1998. A genome-wide transcriptional analysis of the mitoticcell cycle. Mol. Cell 2:65–73.
7. DeRisi, J. L., V. R. Iyer, and P. O. Brown. 1997. Exploring the metabolic andgenetic control of gene expression on a genomic scale. Science 278:680–686.
8. De Saizieu, A., U. Certa, J. Warrington, C. Gray, W. Keck, and J. Mous.1998. Bacterial transcript imaging by hybridization of total RNA to oligo-nucleotide arrays. Nat. Biotechnol. 16:45–48.
9. Fislage, R. 1998. Differential display approach to quantitation of environ-mental stimuli on bacterial gene expression. Electrophoresis 19:613–616.
10. Fislage, R., M. Berceanu, Y. Humboldt, M. Wendt, and H. Oberender. 1997.Primer design for a prokaryotic differential display RT-PCR. Nucleic AcidsRes. 25:1830–1835.
11. Fleming, J. T., W.-H. Yao, and G. S. Sayler. 1998. Optimization of differen-tial display of prokaryotic mRNA: application to pure culture and soil mi-crocosms. Appl. Environ. Microbiol. 64:3698–3706.
12. Fujita, Y., A. Murakami, K. Aizawa, and K. Ohki. 1994. Short-term andlong-term adaptation of the photosynthetic apparatus: homeostatic proper-ties of thylakoids, p. 677–692. In D. A. Bryant (ed.), The molecular biologyof cyanobacteria. Kluwer Academic Publishers, Dordrecht, The Netherlands.
13. Grossman, A. R., D. Bhaya, K. E. Apt, and D. M. Kehoe. 1995. Light-harvesting complexes in oxygenic photosynthesis: Diversity, control and evo-
lution. Annu. Rev. Genet. 29:231–287.14. Grossman, A. R., and D. M. Kehoe. 1997. Phosphorelay control of phyco-
bilisome biogenesis during complementary chromatic adamptation. Photo-synth. Res. 53:95–108.
14a.Karlin, S., J. Mrazek, and A. M. Campbell. 1996. Frequent oligonucleotidesand peptides of the Hemophilus influenzae genome. Nucleic Acids Res.24:4263–4272.
15. Kehoe, D. M., P. Villand, and S. Somerville. 1999. DNA microarrays forstudies of higher plants and other photosynthetic organisms. Trends PlantSci. 4:38–41.
16. Kotani, H., and S. Tabata. 1998. Lessons from sequencing of the genome ofa unicellular cyanobacterium, Synechocystis sp. PCC6803. Annu. Rev. PlantPhysiol. Plant Mol. Biol. 49:151–171.
17. Kwaik, Y., and L. Pederson. 1996. The use of differential display-PCR toisolate and characterize a Legionella pneumophila locus induced during theintracellular infection of macrophages. Mol. Microbiol. 21:543–556.
18. Lashkari, D. A., J. L. DeRisi, J. H. McCusker, A. F. Namath, C. Gentile, S. Y.Hwang, P. O. Brown, and R. W. Davis. 1997. Yeast microarrays, for genomewide parallel genetic and gene expression analysis. Proc. Natl. Acad. Sci.USA 94:13057–13062.
19. Lemaux, P. G., and A. R. Grossman. 1985. Major light-harvesting polypep-tides encoded in polycistronic transcript in eukaryotic algae. EMBO J.4:1911–1919.
20. Liang, P., and A. B. Pardee. 1997. Differential display methods and proto-cols. Humana Press, Totowa, N.J.
21. Nagaya, M., H. Aiba, and T. Mizuno. 1994. The sphR product, a two-component system response regulator protein, regulates phosphate assimi-lation in Synechococcus sp. strain PCC 7942 by binding to two sites upstreamfrom the phoA promoter. J. Bacteriol. 176:2210–2215.
22. Plum, G., and J. E. Clark Curtiss. 1994. Induction of Mycobacterium aviumgene expression following phagocytosis by human macrophages. Infect. Im-mun. 62:476–483.
23. Ray, J. M., D. Bhaya, M. A. Block, and A. R. Grossman. 1991. Isolation,transcription, and inactivation of the gene for an atypical alkaline phospha-tase of Synechococcus sp. strain PCC 7942. J. Bacteriol. 173:4297–4309.
24. Richmond, C. S., J. D. Glasner, R. Mau, H. F. Jin, and F. R. Blattner. 1999.Genome-wide expression profiling in Escherichia coli K-12. Nucleic AcidsRes. 27:3821–3835.
25. Robinson, N. J., P. J. Robinson, A. Gupta, A. J. Bleasby, B. A. Whitton, andA. P. Morby. 1995. Singular over-representation of an octameric palindrome,HIPI, in DNA from many cyanobacteria. Nucleic Acids Res. 23:729–735.
26. Sambrook, J., E. F. Fritsch, and T. Maniatis. 1989. Molecular cloning: alaboratory manual, 2nd ed. Cold Spring Harbor Laboratory Press, ColdSpring Harbor, N.Y.
27. Schena, M., D. Shalon, R. Heller, A. Chai, P. O. Brown, and R. W. Davis.1996. Parallel human genome analysis: microarray-based expression moni-toring of 1000 genes. Proc. Natl. Acad. Sci. USA 93:10516–10619.
28. Schmidt, J., M. Bubenenko, and A. R. Subramanian. 1993. A novel operonorganization involving the genes for chorismate synthase (aromatic biosyn-thesis pathway) and ribosomal GTPase center proteins (L11, L1, L10, L12:rplKAJL) in cyanobacterium Synechocystis PCC 6803. J. Biol. Chem. 268:27447–27457.
29. Smith, H. O., M. S. Gwinn, and S. L. Salzberg. 1999. DNA uptake signalsequences in naturally transformable bacteria. Res. Microbiol. 150:603–616.
30. Smith, H. O., J.-F. Tomb, B. A. Dougherty, R. D. Fleischmann, and J. C.Venter. 1995. Frequency and distribution of DNA uptake signal sequences inthe Haemophilus influenzae Rd genome. Science 269:538–540.
31. Sobczyk, A., G. Schyns, N. Tandeau de Marsac, and J. Houmard. 1993.Transduction of the light signal during complementary chromatic adaptationin the cyanobacterium Calothrix sp. PCC7601: DNA-binding proteins andmodulation by phosphorylation. EMBO J. 12:997–1004.
32. Tandeau de Marsac, N., W. E. Borrias, C. J. Kuhlemeier, A. M. Castets,G. A. van Arkel, and C. A. M. J. J. van den Hondel. 1982. A new approachfor molecular cloning in cyanobacteria: cloning of an Anacystis nidulans metgene using a Tn901-induced mutant. Gene 20:111–119.
33. Tandeau de Marsac, N., and J. Houmard. 1993. Adaptation of cyanobacteriato environmental stimuli: new steps towards molecular mechanisms. FEMSMicrobiol. Rev. 104:119–190.
34. Tao, H., C. Bausch, C. Richmond, F. R. Blattner, and T. Conway. 1999.Functional genomics: expression analysis of Escherichia coli growing onminimal and rich media. J. Bacteriol. 181:6425–6440.
35. Taylor, B. B., and I. B. Zhulin. 1999. PAS domains: internal sensors ofoxygen, redox potential, and light. Microbiol. Mol. Biol. Rev. 63:479–506.
36. Wanner, B. L. 1993. Gene regulation by phosphate in enteric bacteria.J. Cell. Biochem. 51:47–54.
VOL. 182, 2000 ISOLATION OF REGULATED GENES IN SYNECHOCYSTIS 5699
on May 26, 2018 by guest
http://jb.asm.org/
Dow
nloaded from