Embed Size (px)
Citation preview

ISOLATION AND CHARACTERIZATION OF MICROALGAE WITH
COMMERCIAL POTENTIAL
Indrayani Indrayani
This thesis is presented for the degree of Doctor of Philosophy of
Murdoch University
2017

ii
DECLARATION
I declare that this thesis is my own account of my research and contains
work which has not been previously submitted for
a degree at any tertiary institution.
Indrayani Indrayani

iii
ABSTRACT
This study focused on bioprospecting of microalgae species with
commercial potential and their potential to be cultured under outdoor
conditions, with the main focus on lipids/fatty acids and carotenoids.
Species and strain selection was done by isolation of algal species from
highly selective environments (hypersaline microalgae) and by selection of
potential species from the Murdoch University culture collection. Three
algae species have been isolated from hypersaline environments (the
coccoid red, Amphora sp. MUR 258 and Navicula sp) and only one species,
Botryococcus braunii 807/2, was from our culture collection. Through the
initial selection processes, two promising species, Amphora sp. MUR 258
and Botryococcus braunii 807/2 were chosen for further study.
Amphora sp. MUR 258 is a newly isolated hypersaline pennate diatom
(Bacillariophyceae) that contaminated and took over a Dunaliella salina
culture grown in a 10m2 raceway pond at Murdoch University and
showed promise as a lipid producer. Limits to growth factors, lipids and
fatty acids profiles and the feasibility for outdoor long-term cultivation in
open raceway ponds were studied. This strain was able to grow well over
a wide range of temperatures (19-36oC) and salinities (6-12% NaCl). The
optimum specific growth rates occurred at 25 and 35o C at 9 and 7% NaCl
salinity, respectively. The cells accumulated more lipids in the exponential
phase except, when cultured at the highest salinity (12% NaCl) when more
lipids accumulated in the stationary phase. The highest lipid productivity
(41.5 mg.L-1.d-1) was achieved at 9% salinity and 25oC. When grown under
different N and P ratios, Amphora sp. MUR 258 achieved its highest
biomass productivity (84.74 mg.L-1.d-1) at the lowest nutrient
concentrations (1N:1P), whereas the highest lipid productivity (40 mg.L-

iv
1.d-1) was observed at the highest nitrogen concentration (3N:1P). Cultures
grown at high phosphorus concentration (1N:2P) had the lowest growth
rate, biomass and lipid productivity. When grown under different N
sources (sodium nitrate, ammonium nitrate, ammonium chloride or urea),
Amphora sp. MUR 258 achieved its highest cell density (67X104 cells.mL-1),
growth rate (0.33 d-1) and biomass productivity (74.1 mg.L-1.d-1) with urea.
Irrespective of the growing conditions, the predominant fatty acids of the
Amphora sp. MUR 258 were palmitic acid (C16:0), stearic acid (C18:0),
palmitoleic acid (C16:1), and oleic acid (C18:1), as well as low quantities of
eicosapentaenoic acid (C20:5). The fatty acid profile of this strain makes it
a suitable species for biodiesel production.
Investigation on the reliability and performance of the long term growth
of Amphora sp. MUR 258 in outdoor paddle-wheel driven raceway ponds
in Perth, Western Australia showed that the alga can be grown
successfully in semi-continuous culture outdoor raceway ponds for 13
months when culture salinity was kept between 8.6 and 14.9% NaCl. The
highest cell density (167x104 cells.mL-1), specific growth rate (0.3 d-1),
biomass (24 g.m-2.d-1) and lipid productivity (6.8 g.m-2.d-1) were achieved
in summer. There was no contamination by other algae during the first
three months of culturing, but after this some contamination by Navicula
sp, Tetraselmis sp and Dunaliella sp were observed.
Botryococcus braunii strain 807/2 has been studied intensively in relation to
its hydrocarbon production and its ability to grow outdoors in raceway
ponds. However, B. braunii 807/2 also is a potential strain for carotenoid
production. Carotenoid production of B. braunii 807/2 was studied under
different growing conditions expected to favour carotenogenesis (nitrogen
limitation, high iron concentration at low and high light). The rate of

v
carotenoid production of B. braunii 807/2 was faster under nitrogen
deprivation, high iron concentration at high light intensity than other
growing conditions. Lutein was the predominant carotenoid (43-55% of
total carotenoids) under optimum growing conditions (green cells),
whereas canthaxanthin (6-13% of total carotenoids) and astaxanthin (3.2-
28% of total carotenoids) were the major carotenoids of red cells grown
indoors and outdoors, respectively.
In summary, this study suggests that the Amphora sp. MUR 258 and B.
braunii 807/2 are promising strains for the production of lipids/fatty acids
and carotenoids, respectively. However, further studies are still needed to
optimize the growth and the production of the product of interest.

vi
ACKNOWLEDGEMENTS
First of all, I would like to express my special gratitude and indebtedness
to my supervisors, Prof. Michael Borowitzka and Dr. Navid Moheimani
for giving me the opportunity to pursue my PhD under their guidance
and expertise, for their encouragement, enthusiastic supervision and
endless willingness to devote time to support me in doing this project and
for their understanding of having a student as well as a mother of four
little ones. Your kindness made my PhD journey more easy and enjoyable.
I would like also to acknowledge all members of the Algae R&D centre at
Murdoch University. To Jasper, Ganjar, Ashiwin, Ankita, Jeremy, Jason
Crisp, Jason Webb and Dr. Jeff Cosgrove for the friendships and for
helping during my study. Special thanks to Eric Raes for his generous
assistance during my first settlement in the lab and to Dr. Karne de Boer
for his assistant with GC-FID/MS for fatty acids analysis.
I would also like to thank Prof. Jacob John from Curtin University
(Western Australia) for helping me with the diatom identification and to
Prof. Einar Skarstad Egeland from The University of Nordland (formerly
known as Bodø University College, Norway) for sharing expertise and
knowledge and for helping me with carotenoid analysis.
Finally, I dedicate this thesis to my beloved parents (H. Tajuddin Halim
and Hj. Mudaedar), brothers (Burhanuddin, S.Si and Ilham, ST, Fadli,
S.Kom, MS, Fajrin, SE) and sisters (Dr. Ratmawati, MPd, Halimah, SE,
Chadidjah, SE, Fadilah, SE and Fajriani) for their endless support and
encouragement, to my husband (Ardiansyah, S.Pi, M.Biotech.Stu, PhD) for
all his love, patience and support throughout my study and to my beloved

vii
kids (Anindra, Audrey, Amira and Abyana) for making my PhD a
wonderful journey. You are my source of inspiration and strength.

viii
TABLE OF CONTENTS
DECLARATION .................................................................................................. ii
ABSTRACT ......................................................................................................... iii
ACKNOWLEDGEMENTS ............................................................................... vi
TABLE OF CONTENTS .................................................................................. viii
CHAPTER 1. INTRODUCTION .................................................................... 1
1.1 Microalgae and their current commercial applications and
potential application ....................................................................................... 1
1.1.1 Lipids/fatty acids ............................................................................. 1
1.1.2 Carotenoids ...................................................................................... 9
1.1.3 Phycobiliproteins .......................................................................... 15
1.1.4 Other chemicals ............................................................................. 17
1.1.5 Other potential applications of microalgae ............................. 19
1.2 Large scale outdoor systems ............................................................ 21
1.2.1 Open pond culture systems ......................................................... 22
1.2.2 Closed systems (PBRs) ................................................................. 24
1.3 Screening methods and key criteria microalgae should meet
their use to produce specific products in large scale outdoor culture 27
1.3.1 Wide temperature tolerance ........................................................ 28
1.3.2 Wide salinity tolerance................................................................. 29
1.3.3 Ease of harvesting ......................................................................... 30
1.3.4 Outcompete other contamination .............................................. 30
1.4 Key factors affecting growth and productivity (both biomass
and products) in outdoor large-scale cultures ......................................... 31
1.4.1 Light ................................................................................................. 31
1.4.2 Temperature ................................................................................... 35

ix
1.4.3 CO2 and pH ..................................................................................... 39
1.4.4 Salinity ............................................................................................ 40
1.4.5 O2 ...................................................................................................... 42
1.4.6 Nutrients ......................................................................................... 43
1.4.7 Mixing/turbulence ........................................................................ 49
1.4.8 Contaminants ................................................................................. 50
1.4.9 Auto-inhibition/Inhibitory substances ..................................... 50
1.5 Aims of this thesis ............................................................................. 52
Chapter 2. GENERAL MATERIALS AND METHODS ........................... 54
2.1 Media and culture maintenance .......................................................... 54
2.2 Analytical Methods ................................................................................ 57
2.2.1 Cell counting .................................................................................... 57
2.2.2 Specific growth rate ........................................................................ 57
2.2.3 Dry weight (DW) and ash free dry weight (AFDW)
determination ............................................................................................. 57
2.2.4 Total protein determination .......................................................... 58
2.2.5 Total carbohydrate determination ............................................... 60
2.2.6 Lipid Extraction ............................................................................... 62
2.2.7 Fatty acid analysis ........................................................................... 63
2.2.8 Observation of neutral lipids with Nile red .............................. 64
2.2.9 Chlorophyll determination ........................................................... 64
2.2.10 Phycobilin determination ............................................................ 66
2.3 Data Analysis .......................................................................................... 67
Chapter 3. ISOLATION, PRELIMINARY SCREENING AND
SELECTION OF SPECIES ............................................................................... 68
3.1 Introduction ........................................................................................ 68
3.2 Materials and methods ..................................................................... 69
3.2.1 Isolation of the Adelaide sample (Tetraselmis contaminant) 69

x
3.2.2 Isolation of the Perth sample 1 (Dunaliella contaminant) ...... 70
3.2.3 Isolation of the Perth sample 2 (Amphora contaminant) .......... 70
3.2.4 Identification of the algae............................................................... 70
3.3 Results ................................................................................................. 71
3.3.1 Isolation and identification of Adelaide sample .................... 71
3.3.2 Isolation and identification of the Perth Dunaliella culture
contaminant ................................................................................................ 72
3.3.3 Isolation and identification of the Perth Amphora
contaminant sample .................................................................................. 75
3.4 Discussion and Conclusion ............................................................. 76
Chapter 4. AMPHORA SP. MUR 258 – A LIPID PRODUCER ................ 78
4.1 Introduction ............................................................................................. 78
4.2 Materials and methods ..................................................................... 78
4.2.1 Indoor Studies ............................................................................... 78
4.2.2 Outdoor Studies ............................................................................ 80
4.3 Results ................................................................................................. 83
4.3.1 Indoor studies ................................................................................ 83
4.3.2 Outdoor Studies .......................................................................... 107
4.4 Discussion......................................................................................... 125
4.4.1 Indoor Studies ............................................................................. 125
4.4.2 Outdoor Studies .......................................................................... 140
4.5 Conclusion ........................................................................................ 150
Chapter 5. BOTRYOCOCCUS BRAUNII 807/2 – A CAROTENOID
PRODUCER ..................................................................................................... 152
5.1 Introduction ...................................................................................... 152
5.2 Materials and methods ................................................................... 153
5.2.1 The source of the strain ................................................................. 153

xi
5.2.2 Carotenoid production of B. braunii 807/2 under different
growing conditions ................................................................................. 153
5.2.3 Comparison of carotenoid composition of green, intermediate
and red cells of B. braunii 807/2 cultured in indoors and outdoors 156
5.3 Results ............................................................................................... 159
5.3.1 Carotenoid production of B. braunii 807/2 under different
growth conditions ................................................................................... 159
5.3.2 Comparison of carotenoid composition of green, intermediate
and red cells of Botryococcus braunii807/2 cultured indoors and
outdoors .................................................................................................... 166
5.4 Discussion......................................................................................... 169
5.4.1 Carotenoid production of Botryococcus braunii 807/2 under
different growing conditions ................................................................ 169
5.4.2 Comparison of carotenoid composition of green, intermediate
and red cells of Botryococcus braunii 807/2 cultured indoors and
outdoors .................................................................................................... 173
5.5 Conclusion ........................................................................................ 175
CHAPTER 6. GENERAL CONCLUSIONS AND FUTURE
DIRECTIONS .................................................................................................. 177
REFERENCES .................................................................................................. 183

1
CHAPTER 1. INTRODUCTION
1.1 Microalgae and their current commercial applications and
potential application
Microalgae are prokaryotic or eukaryotic photosynthetic microorganisms
that can be found in all ecosystems both aquatic and terrestrial (Richmond
2004; Mata et al. 2010). According to Brennan and Owende (2013),
microalgae are categorized mainly based on their pigmentation, life cycle
and basic cellular structures. Borowitzka (2012) lists one Division of
prokaryotic microalgae, the Cyanophyta (Cyanobacteria), and eight
Divisions of eukaryotic algae with microalgal species: the Glaucophyta,
Rhodophyta, Cryptophyta, Heterokontophyta, Dinophyta, Haptophyta,
Euglenophyta and Chlorophyta.
Microalgae are an extremely heterogeneous group of microorganisms
which are potentially rich source of important chemicals with potential
application in the feed, food, nutritional, cosmetics, pharmaceuticals and
even in fuel industries (Olaizola 2003). Some of the important chemicals
from microalgae and their applications are discussed below.
1.1.1 Lipids/fatty acids
Microalgae can produce many different classes of lipids. Lipids produced
by microalgae can be grouped into two categories, structural lipids (polar
lipids) with a high content of polyunsaturated fatty acids (PUFAs) and
storage lipids (non-polar lipids) mainly in the form of TAG made of
predominantly saturated fatty acids and some unsaturated fatty acids
(Sharma et al. 2012).

2
Polar lipids (phospholipids) and sterols are important structural
components of cell membranes which act as a selective permeable barrier
for cells and organelles. These lipids maintain specific membrane
functions, providing the matrix for a wide variety of metabolic processes
and participate directly in membrane fusion events. In addition to a
structural function, some polar lipids may act as key intermediates (or
precursors of intermediates) in cell signalling pathways (e.g., inositol
lipids, sphingolipids, oxidative products) and play a role in responding to
changes in the environment. Of the non-polar lipids, TAGs are abundant
storage products which can be easily catabolized to provide metabolic
energy (Gurr et al. 2002). In general, TAGs are mostly synthesized in the
light, stored in cytosolic lipid bodies, and then reutilized for polar lipid
synthesis in the dark (Thompson 1996). Microalgal TAGs are generally
characterized by both, saturated and monounsaturated FAs. However,
some oil-rich species have demonstrated a capacity to accumulate high
levels of long-chain polyunsaturated fatty acids (PUFA) as TAG (Alonso et
al. 1998; Bigogno et al. 2002).
Compared to terrestrial crops, yields of microalgal lipids are higher.
Depending on the lipid content, microalgae can produce about 58,700 –
136,900 L oil ha-1 year-1 compared to that of soybean (636 L oil ha-1 year-1),
jatropha (741 L oil ha-1 year-1), canola (974 L oil ha-1 year-1) and palm oil
(5366 L oil ha-1 year-1) (Ahmad et al. 2011). Furthermore, microalgae can
be grown on non-arable land and can utilise sea water so that they will not
compete with food crops for habitats and for limited source of fresh water
(Borowitzka and Moheimani 2013b). They also can use industrial flue gas
as carbon source (Chisti 2007). Therefore, microalgae are more sustainable
to grow for lipid production.

3
Lipids and fatty acids content of microalgae are species specific and varied
widely among different species. Lipid content of thousands of microalgae
species studied showed huge variation ranging from 1 – 85% of dry cell
weight (Spolaore et al. 2006; Chisti 2007; Li et al. 2008). Nannochloropsis
spp and Botryococcus braunii can accumulate up to 80% of lipid (Larkum et
al. 2012). Similarly, Chlorella pyrenoidosa was able to accumulate up to 85%
lipid under nitrogen starvation (Rodolfi et al. 2009). There are some
potential applications of microalgal lipids. For example, in the cosmetic
industry, ethanolic or supercritical CO2 extract derived from microalgae
are used for lipid-based cosmetics such as cremes or lotions due to their
provision of both nourishing and protecting effects to the skin (Pulz and
Gross 2004). In addition, other lipid classes such as glycol- and
phospholipid are also considered for future developments in skin care.
The algae are used for the preparation of anti-wrinkle cream due to its
great concentration in long chain fatty acids with great regenerative
capacities of the skin (Satyanarayana et al. 2011). Squalene is another type
of lipid that widely used in cosmetic and skin care preparation (Spanova
and Daum 2011). Some species of microalgae are reported to accumulate
high levels of squalene including Botryococcus (Achitouv et al. 2004) and
Aurantiochytrium (Kaya et al. 2011).
Microalgae have been suggested as a potential feedstock for the
production of bioenergy and biofuels (Ndimba et al. 2013). Biofuel
products from microalgae include biodiesel, bioethanol and biomethane
(Sing and Gu 2010). Biodiesel from microalgae has been reviewed
extensively by some authors (Chisti 2007; Hu et al. 2008b; Mata et al. 2010).
The potential of microalgae as biodiesel feedstock is due their capability to
accumulate high quantity of lipid that can be converted to biodiesel
(Parmar et al. 2011).

4
Recent interest in microalgal lipids has really focussed on their potential
for PUFAs production (Harwood and Guschina 2009). Many algae
produce lipids as storage products which can be seen as oil droplets in
cells (Andersen 2013). These lipids contain mainly polyunsaturated fatty
acids (PUFAs) including arachidonic acid (AA), docosahexaenoic acid
(DHA) and eicosapentaenoic acid (EPA). For example, the green alga
Parietochloris incisa can accumulate high amount of AA (33.6% of total fatty
acids) at logarithmic phase and 42.5% AA of the total fatty acids at the
stationary phase of growth (Bigogno et al. 2002). The marine
eustigmatophyte Nannochloropsis oculata, a marine unicellular alga with
high EPA content up to 68% at the end of stationary phase (Tonon et al.
2002) has been used in many mariculture hatcheries since the late 1980s
(Cheng-Wu et al. 2001). However, these microalgae species accumulate
high amount of PUFAs at stationary phase where the growth is slowing
down which in turn led to much lower productivity. In order to achieve
high productivity, the species should be able to produce high amount of
lipid/PUFAs at exponential phase. Therefore, screening and selecting
species/strains that can accumulate high amount of lipids/PUFAs at
exponential phase are extremely important as to achieve high
productivity.
Large quantities of EPA are also produced by the Pinguiophyceae
(Kawachi et al. 2002). The marine microalga Pavlova viridis
(Prymnesiophyceae) is extensively used in marine aquaculture industries
of China for feeding bivalves at all stages of growth, mainly for its
richness in EPA (Hu et al. 2008a). Meireles et al. (2003) found significant
quantities of DHA in TAG (27%) of P. viridis. Several species of
thraustochytrids produce substantial amounts of DHA including
Schizochytrium spp (35.6% of total fatty acids) (Yaguchi et al. 1997) and

5
Thraustochytrium aureum (40% of total fatty acids) (Iida et al. 1996).
However, currently, the only commercial production of microalgal
lipids/fatty acids especially for the production of DHA is derived from
Crypthecodinium cohnii(Wynn et al. 2010). This alga can produce up to 50%
of fatty acids as DHA (De Swaaf et al. 1999) and is marketed by Martek in
more than 60 countries (Harwood and Guschina 2009). This oil is mainly
used in infant formula (Borowitzka 2013b). According to Frost and
Sullivan (2010), the global market for EPA and DHA was estimated to
exceed 85,000 t in 2009 and to grow to 135,000-190,000 t by 2015.
Therefore, bioprospecting of microalgae species for the production of high
value PUFAs such as AA, DHA and EPA is important.
In relation to lipids/PUFAs production, diatoms are particularly
interesting due to their well-known ability to accumulate high amount of
lipids/PUFAs (Table1 and Table2). Diatoms are highly productive source
of long-chain polyunsaturated fatty acids that are nutritionally and
therapeutically important as food additives and pharmaceuticals. For
example, Phaeodactylum or Nitzschia are a potential source of
eicosapentaenoic acid (EPA) (Gong et al. 2011). Phaeodactylum tricornutum
can accumulate up to 30% of total fatty acids as EPA and it has been
widely used as a food in aquaculture (Jiang and Gao 2004). Kitano et al.
(1997) studied EPA production of two diatom species, Navicula saprophila
and Nitzschia sp and they found that N. saprophila and Nitzschia sp
produced 20.1 and 24.7 % EPA under photoautotrophic condition,
respectively. However, most diatoms especially pennate diatoms have a
tendency to stick to a substrate and therefore are not suitable for
cultivation in low cost open pond system such as raceway ponds. A study
done by Fon Sing (2010) found a pennate diatom Amphora coffeaeformis
MUR 158 that contain remarkably high lipid content up to 70% and has an

6
ability to grow at hypersaline condition. However, this diatom has a
tendency to adhere strongly to a substrate making it unsuitable for
outdoor mass cultivation in raceway ponds. Microalgae species with
sticky behaviour are unreliable to grow inraceway ponds because mixing
facilitated by the paddle wheels is unable to suspend the cells to get access
to light resulted in much lower productivity. This diatom is probably
suitable to grow in biofilms. Therefore, it is a challenging task to find a
diatom species that can be grown reliably for a long period in an outdoor
open pond system i.e. raceway ponds for the production of lipids/PUFAs
or for other applications.
Table 1. Lipid content of various diatom species
Diatom species Lipid content (% Dry weight)
References
Amphora exigua 32.21-44.95 Chen 2012 Amphora bigibba 34.30-39.16 Chen 2012 Amphora sp 20 - 23 Khatoon et al. 2010 Amphora coffeaeformis MUR 158 70 Fon Sing 2010 Caloneis platycephala 38.39-45.05 Chen 2012 Chaetoceros muelleri 30.39-35.15 Chen 2012 Chaetoceros muelleri F&M-M43 33.6 Rodolfi et al. 2008 Chaetoceros calcitrans CS178 39.8 Rodolfi et al. 2008 Cocconeis scutellum 30.24-33.37 Chen 2012 Cylindrotheca sp 31.34-34.99 Chen 2012 Cymbella sp 20 - 25 Khatoon et al. 2010 Melosira nummuloides 32.84-33.18 Chen 2012 Navicula lyra 37.59-42.09 Chen 2012 Navicula sp 19 – 24 Khatoon et al. 2010 Nitzschia panduriformis 32.56-39.88 Chen 2012 Nitzschia grossestriata 33.19-41.49 Chen 2012 Phaeodactylum tricornutum 10.6-16.1 Laurenco et al. 2002 Phaeodactylum tricornutum F&M-M40 18.7 Rodolfi et al. 2008 Seminavis gracilenta 34.99-42.96 Chen 2012 Skeletonema costatum 36.90-41.42 Chen 2012 Skeletonema costatum 11.8-13.1 Laurenco et al. 2002 Skeletonema costatum CS181 21.1 Rodolfi et al. 2008 Skeletonema sp. CS252 31.8 Rodolfi et al. 2008 Thalassiosira pseudonana C5173 20.6 Rodolfi et al. 2008

7
Table 2. Fatty acid profiles (as % of total fatty acids) of various diatom species
Diatom species C12:0 C14:0 C15:0 C16:0 C16:1 C16:2 C16:3 C18:0 C18:1 C18:2 C18:3 C20:0 C20:1 C20:5 C22:1 C22:5 C24:0 Chaetoceros calcitrans - 17.5 0.8 10.7 30.8 4.1 8 0.8 3.0 1.6 - - - 11.1 - - - Chaetoceros gracilis no 1
- 8.8 1.0 23.3 34.7 4.6 2.3 4.1 5.3 2.5 - 0.6 - 4.6 - - -
Chaetoceros gracilis no 2
- 11.6 1.2 17.8 28.6 3.1 2.2 3.1 9.9 4.9 - 0.6 - 5.7 - - -
Skeletonema costatum - 20.1 1.2 16.5 30.5 6.8 3.7 0.8 1.5 - - - - 6.0 - - - Thalasissira pseudonana
- 14.3 0.8 11.2 18.7 7.2 12.7 0.7 0.6 - - - - 19.3 - - -
Phaeodactylum tricornutum
0.3 20.3-25.4
0.5 9.7-10.3
11.1-11.7
- - 4.5-7.0
2.4 1.9 1.4 - - 21.2-23.2
- 1.0-1.2
-
Skeletonema costatum 0.8 7.1-8.0
1.7-1.9
13.8-14.6
14.0-18.1
- - 3.1-3.5
6.7-8.6
2.1-2.5
1.9-2.7
- - 1.2-1.7
- 2.6-2.8
-
Amphora exigua* - 51.39 - 11.78 15.52 - - 2.25 2.28 1.82 0.43 - - 8.6 - - 0.61 Amphora exigua** 32.18 3.2 - 2.21 16.07 - - 1.75 5.94 2.53 1.2 - - 13.14 - - 1.31 Amphora bigibba* - 32.33 - 9.81 2.70 - - 8.09 17.04 4.9 - - - 3.68 9.51 - 7.56 Amphora bigibba** - 37.98 - 12.89 2.55 - - 6.70 15.77 3.47 0.83 - - 3.98 3.38 - 4.41 Caloneis platycephala* - 62.09 - 8.75 6.75 - - 3.77 3.81 1.16 0.51 0.22 0.54 4.84 - - 0.34 Caloneis platycephala**
- 23.24 - 15.66 4.70 - - 15.21 18.23 5.39 0.62 0.75 - 3.59 0.74 - 3.48
Chaetoceros muelleri*
- 65.10 - 7.40 3.03 - - 9.01 4.44 2.86 0.64 - 0.95 3.64 - - 1.23
Chaetoceros muelleri**
8.92 77.41 - 2.56 2.11 - - 3.18 2.63 0.54 0.1 0.05 - 1.61 - - 0.15
Cocconeis - 44.82 - 11.49 3.12 - - 5.37 16.06 3.43 1.50 - 2.08 2.47 1.36 - 1.9

8
scutellum* Cocconeis scutellum**
6.03 51.10 - 8.12 3.82 - - 8.58 3.94 1.88 0.36 0.69 0.55 0.74 - - 9.92
Cylindrotheca sp* 10.55 66.71 - 3.26 1.55 - - 9.33 3.59 0.45 0.22 0.22 - 0.94 - - 0.08 Cylindrotheca sp** 36.64 3.12 - 18.68 9.25 - - 8.64 7.81 2.08 1.87 - - 5.31 - - 0.57 Melosira nummuloides*
1.46 28.14 - 11.45 1.96 - - 10.66 17.38 5.57 1.45 - - 6.51 1.55 - 1.96
Melosira nummuloides**
0.36 14.73 - 10.48 2.63 - - 8.51 14.89 4.74 2.20 - - 12.10 3.91 - 2.81
Navicula lyra* 5.23 65.67 - 8.84 6.12 - - 2.18 1.69 1.76 0.37 - 0.08 5.51 - - - Navicula lyra** 6.68 45.41 - 12.25 9.78 - - 5.25 3.27 2.96 0.61 0.34 0.39 9.26 - - - Nitzschia panduriformis*
1.43 7.12 - 10.86 4.89 - - 7.81 15.59 6.02 2.36 5.29 3.55 8.61 - - 5.37
Nitzschia panduriformis**
8.95 49.20 - 10.39 6.13 - - 9.91 4.60 2.30 0.71 0.61 0.25 2.18 - - 2.03
Nitzschia grossestriata*
- 4.91 - 15.07 4.61 - - 32.24 18.86 8.39 0.53 0.68 - 2.84 - - 0.91
Nitzschia grossestriata**
3.85 15.24 - 16.29 6.48 - - 19.06 12.74 5.78 3.66 2.28 - 3.37 - - 1.78
Seminavis gracilenta* - 4.27 - 10.02 3.88 - - 14.36 13.17 4.78 3.05 1.65 - 15.72 - - 5.60 Seminavis gracilenta** 4.17 15.25 - 15.53 13.75 - - 10.51 9.56 2.15 0.71 - 0.19 10.65 - - 2.99 Skeletonema costatum* 3.73 30.69 - 11.84 4.45 - - 15.16 20.13 2.92 1.45 1.01 0.68 0.47 - - 0.58 Skeletonema costatum**
5.52 21.33 - 15.69 6.33 - - 22.37 14.57 4.57 1.37 2.42 0.68 0.31 - - 0.19
* in summer **in winter Modified from Volkman et al. 1989; Laurenco et al. 2002; Chen 2012;

9
1.1.2 Carotenoids
Carotenoids are lipid soluble pigments that give yellow, orange or red
colours of plant leaves, fruit, flowers, feathers, crustacean shells, flesh and
skin of fish (Negro and Garrido-Fernandez 2000; Del Campo et al. 2007).
They are produced de novo by all photosynthetic organisms including
microalgae (Goodwin 1980).
Natural carotenoids can be divided into two classes: oxygen-free
hydrocarbons, the carotenes which are few in number and their
oxygenated derivatives, the xanthophylls which make up the vast majority
of carotenoids (Nakayama 1962; Rowan 1989). The xanthophylls can be
present as OH groups as in lutein, as oxi-group as in canthaxanthin or in a
combination of both as in astaxanthin (Higuera-Ciapara et al. 2006).
There are two major functions of carotenoids in microalgae, light
harvesting and photoprotection (Liaaen-Jensen and Egeland 1999). The
role of carotenoids in photosynthesis is due to the occurrence of
carotenoids as integral part of the photosynthetic apparatus (Nakayama
1962) which involved in the energy transfer to chlorophylls. As
photoprotection, carotenoids play role in quenching chlorophyll triplet
states, scavenging reactive oxygen species and dissipating excess energy
(Demming-Adams and Adams 2002).
There are over 600 naturally occurring carotenoids that have been
structurally identified to date. Amongst them, more than one hundred
carotenoids are found in microalgae (Liaaen-Jensen and Egeland 1999),
but only a few are used and produced commercially, the two main
compounds being β-carotene and astaxanthin. Increasing demand for β-
carotene is due to its extensive applications as colouring agents, feed

10
additive, antioxidant, anti-cancer agent and heart disease preventive in the
food, aquaculture, cosmetics and pharmaceutical and nutraceutical
industries (Edge et al. 1997; Del Campo et al. 2007; Prieto et al. 2011). β-
carotene produced by microalgae stimulates the immune system via
facilitating the monocyte's function to increase the number of surface
molecules expressed while protecting cellular damage from oxidative
stress. Coupled with its strong antioxidant properties, β-carotene can
extend its activity against several disease conditions, including cancer,
cardiovascular disease, rheumatoid arthritis and several
neurodegenerative diseases (Dembinska-Kiec 2005).
According to Gomez and Gonzalez (2005), β-carotene available
commercially in the markets is dominated by chemically synthesized β-
carotene. However, there has been considerable interest in the production
of natural β-carotene due to its superior bioavailability, antioxidant
capacity and physiological effects over its synthetic counterparts (Becker
1994). Therefore, searching for novel sources of natural β-carotene is
necessary.
Currently, the main producer of natural β-carotene is the halophilic green
microalga Dunaliella salina(Ben-Amotz and Avron 1990). The extracted β-
carotene is valued between US$300-1,500 kg-1 depending on formulation
with the total market value of about US$ 270 million in 2010 (Figure 1)
(Borowitzka 2013b).
Astaxanthin is another important carotenoid currently produced
commercially from the fresh water green alga Haematococcus
pluvialis(Olaizola and Huntley 2003). It has many applications in
nutraceuticals, cosmetics, food and feed industries with the major use for
pigmentation of fish flesh, primarily salmon, trout and red sea bream (Del

11
Campo et al. 2007). The addition of the astaxanthin derived from
microalgae into the fish food of salmonids enhances the colour of the fish
muscles (Pulz and Gross 2004). Natural astaxanthin from Haematococcus
shows pharmaceutical efficacies, such as protecting against chemically
induced cancers, increasing high-density lipoproteins, and enhancing the
immune system (Lorenz and Cysewski 2000). It is valued at US$ 2.500 kg-1
with an annual worldwide aquaculture market of about US$ 200 million in
2004 and about US$ 257 million in 2009 (Del Campo et al. 2007).
Figure 1. Global market value of both synthetic and natural carotenoids in 2010 (Borowitzka 2013b)
Another important carotenoid is lutein which is present in leafy green
vegetables, in corn, egg yolk and other foods with yellow colour (Del
Campo et al. 2007). Lutein is used as food colouring, as feed additives in
aquaculture and poultry farming (Lorenz and Cysewski 2000; George et
12
al. 2001). In the US, sales of lutein as additive valued to about US$ 150
million per year (Sanchez et al. 2008). Emerging evidence of the human
health benefits of lutein has also been reported. For example, Mares-
Perlman et al. (2002) reported a protective role of lutein in delaying
chronic disease. Lutein seems to hamper the development of cataracts and
muscular degeneration and the progression of atherosclerosis (Dwyer et
al. 2001; Olmedilla et al. 2003; Koh et al. 2004).
Some microalgae are known to accumulate lutein. For example,
Muriellopsis sp is able to produce 4.3 mg lutein g-1 dry weight, with the
lutein productivity of about 180 mg.m-2.d-1 when grown in a tubular
photobioreactor outdoors (Del Campo et al. 2001). Chlorella protothecoides
accumulated lutein of about 4.6 mg g-1 dry weigh in batch heterotrophic
growth at laboratory scale (Shi et al. 2006). Chlorella zofingiensis also
accumulated 3.4 mg lutein g-1Dry weight when grown in bath
photoautotrophic growth at laboratory scale (Del Campo et al. 2004).
However, none of these algae are produced commercially as yet.
Currently, the main source of lutein for the market is derived from
marigold flowers (Piccaglia et al. 1998). One of the important factor that
need to be considered for bioprospecting microalgal species for any
commercial application including for the production of high value
carotenoids is the ability of the algal species to grow reliably for long-
period in a low cost production system (i.e raceway ponds). The
Muriellopsis sp was grown in a closed system which is difficult and costly
to scaled-up whereas the Chlorella species were cultured in small scales in
indoor. It is necessary that the algal species could be able to grow at large-
scale in oudoor open pond systems for long-period to determine their
reliability and productivity. Therefore searching for new lutein source
from microalgae is important. The target species is not only the one with

13
greater lutein productivity than marigold flowers, but also should be able
to grow outdoors for more economical and sustainable production.
Yet another important carotenoid is fucoxanthin. Fucoxanthin is a
yellowish brown xanthophyll found in the chloroplast of brown algae
(macroalgae) (Fung et al. 2013) and is the major carotenoid found in
diatoms (Foo et al. 2015). Although fucoxanthin is mainly reported from
macroalgae (Nomura et al. 2013; Rajauria and Abu-Ghannam 2013; Conde
et al. 2015; Fariman et al. 2015), some microalgae mainly diatom are also
known to accumulate high amount of fucoxanthin. According to Xia et al.
(2013), microalgae contain more fucoxanthin (about one to three order of
magnitude) than that found in macroalgae. For example, the diatom
Phaeodactylum tricornutum extracted with ethanol contained about 15.71
mg.g-1Dry weight (Kim et al. 2012a). Kim et al. (2012b) also studied five
species of fucoxanthin-containing microalgae and found that Isochrysis
galbana had the highest fucoxanthin content of about 18.23±0.54 mg.g-1 dry
weight sample followed by Phaeodactylum tricornutum at about 8.55±1.89
mg.g-1 dry weight sample. Xia et al. (2013) reported fucoxanthin
production of Odontella aurita (Bacillariophyceae) of about 14-15 mg
fucoxanthin.g-1 dry weight. The marine diatom Chaetoceros calcitrans
(UPMC-A0010) extracted with Dichloromethane fraction (DCMF)
contained 5.25 ±0.03 mg fucoxanthin.g-1 dry weight (Foo et al. 2015).
Growing interest in fucoxanthin is mainly due to its potential as
therapeutic agents as reported in many studies. For instance, fucoxanthin
isolated from the brown algae, Hijikia fusiforme showed anti-tumor activity
through inhibiting the growth of GOTO cells, human neuroblastoma cell
line (Okuzumi et al. 1990). Fucoxanthin extracted from Sargassum
siliquastrum showed antioxidant activity by inhibiting intracellular ROS

14
formation, DNA damage and apoptosis induced by H2O2 (Heo et al. 2008).
Fucoxanthin derived from the edible brown alga Saccharina japonica has
inhibitory effect on the invasion, migration, arrangement, adhesion of
metastatic cancer cells to endothelia cells by down-regulating the
expression of MMP-9, CD44 and CXCR4 (Chung et al. 2013). Fucoxanthin
and its metabolite fucoxanthinol showed anticancer effects on leukaemia,
lung, prostate, gastrointestinal, liver, bladder, skin, cervical, and breast
cancers via several mechanisms including cell proliferation inhibition,
apoptosis induction, cell cycle arrest and anti-angiogenesis (Martin 2015).
Liu et al. (2015) studied the effect of fucoxanthin extracted from Laminaria
japonica against visible light-induced retinal damaged and found that
fucoxanthin is more superior than lutein in suppressing overexpression of
vascular endothelial growth factor, resisting senescence, improving
phagocytic function, and clearing intracellular reactive oxygen species in
retinal pigment epithelium cells in vitro as well as in protecting retina
against photoinduced damage in vivo. Fucoxanthin also has potential in
terms of anti-obesity activity due to its ability to stimulate lipolysis and to
inhibit lipogenesis (Muradian et al. 2015).
Although both macro and microalgae are potential sources of fucoxanthin,
commercial production of carotenoids from macroalgae is still not feasible
due to low yields and slow growing calli which in turn lead to low
productivity (Reddy et al. 2008). In contrast, microalgae are fast growing
organisms due to their simple growth requirements and structures so that
energy is directed into growth and reproduction instead of the
maintenance of the differentiated structures (Walker et al. 2005).
Moreover, industrial production of microalgae for the production of other
high value carotenoids i.e. astaxanthin from Haematococcus pluvialis and β-
carotene from Dunaliella salina is on-going, raising the possibility of

15
commercial production of fucoxanthin from microalgae. Therefore,
screening for microalgae species with high fucoxanthin content as well as
their potential for low cost production in outdoor system is thus an
important task.
Other carotenoids of interest are also found in microalgae including
echinenone from Botryococcus braunii (Matsuura et al. 2012), canthaxanthin
from Scenedesmus komareckii (Hanagata 1999) and zeaxanthin from
Dunaliella salina mutants (Jin et al. 2003).
Considering the potential market value as well as huge range of potential
applications of carotenoids especially β-carotene, astaxanthin, lutein and
fucoxanthin, searching for new sources of carotenoids from microalgae
with commercial potential is an important and challenging task.
1.1.3 Phycobiliproteins
Phycobiliproteins are a protein family covalently attached to linear
tetrapyrole prosthetic groups known as bilins due their close relationship
to the well-known humans bile pigments, biliverdin and bilirubin (Glazer
1999). Phycobiliproteins are pigments generally found in the
Cyanophyceae, Rhodophyceae and Cryptophyceae (Rowan 1989) where
they function as photosynthetic accessory proteins that absorb light at a
wide range of wavelength in the visible part of the spectrum and transfer
the excited energy in to the reaction centres of the photosynthetic
membranes for conversion to chemical energy (Glazer 1999).
There are four major types of phycobiliproteins namely phycocyanin,
phycoerythrin, allophycocyanin and phycoerythrocyanin (Rowan 1989).
The classification of these pigments is based on their absorption spectra.

16
For example, phycobiliproteins in cyanobacteria and Rhodophyta can be
divided into three classes on the basis of their major absorbance maxima.
Phycoerythrin absorption maxima are ~ 550-565 nm, phycocyanin is ~ 610-
625 nm and allophycocyanin is 650 nm. Visually, phycoerythrins appear
red, phycocyanins range from purple (phycoerythrocyanin, R-
phycocyanin) to deep blue (C-phycocyanin) whereas allophycocyanins
appear blue with a hint of green. Originally, the prefixes, C-, R-, and B-
designated the pigments extracted from Cyanophyceae, Rhodophyceae
and Bangiales, respectively. However, further investigation showed that
the pigments from these groups do not entirely match; Cyanophyceae
sometimes contain R-phycoerythrin or B-phycoerythrin (Heocha 1962) and
the prefixes now refer to the pigments on the basis of absorption spectra
characteristic (Rowan 1989).
The phycobilin pigments have a wide range potential application
including as food colouring agents and cosmetics such as lipstick and
eyeliners in Japan, China and Thailand (Dainippom Ink and Chemicals
1985), as fluorescent conjugates in activated cell sorting, flow cytometry,
immunoassay and microscopy (Glazer and Stryer 1984) and as probes for
immunodiagnostics (Kronick and Grossman 1983). Depending on the
purity, the C-phycocyanin is valued between US$500-100,000 kg-1(Rito-
Palomares et al. 2001). The global market for phycobiliproteins has been
increasing. In 1997, the global market value was estimated at US$50
million (Spolaore et al. 2006) and the current total market value for
phycobiliprotein products is estimated to exceed US$60 million
(Borowitzka 2013b).

17
1.1.4 Other chemicals
Some species of microalgae contain high protein content that sometimes is
even superior to that of conventional plant protein making them a good
source of protein for exploitation as food supplements (Chacon-Lee and
Gonzales-Marino 2010). Species of interest include Spirulina platensis and
Arthrospira maxima with protein content over 60% of dry matter, Chlorella
vulgaris (48-58% of dry weight) (Tokusoglu and Unal 2003; Becker 2007),
and Porphyridium cruentum(34%) (Rebolloso-Fuentes et al. 2000).
Microalgae are also a good source of carbohydrate found in the form of
starch, cellulose, sugars and other polysaccharides (Chacon-Lee and
Gonzales-Marino 2010). According to Borowitzka (2013b), a few
polysaccharides derived from microalgae have found niche market for use
in cosmetics. Polysaccharides can also be used as bio-flocculants, as an
agent for emulsion stabilization, as thickening agent for alteration of water
rheological characteristics and as heavy metal removal agents for
treatment of polluted water (Markou and Nerantzis 2013). Several
microalgae are known to produce relatively high amount of
polysaccharides including Botryococcus sp (Lupi et al. 1994), Dunaliella sp
(Mishra and Jha 2009), Cyanospira capsulate (De Philippis et al. 2001), and
Cyanothece sp (Philippis et al. 1993; Chi et al. 2007).
Carbohydrates are also a preferable feedstock for several biological
biomass conversion technologies and especially for the technology of
fermentation of sugars for the production of bioethanol (Markou and
Nerantzis 2013). In contrast to biodiesel production, bioethanol
production from microalgae by fermentation has not been reported
extensively. Microalgae are suitable for bioethanol production due to
their high carbohydrate and protein content that can be used as carbon

18
sources for fermentation carried out by bacteria, yeast or fungi under
anaerobic conditions. Ethanol production from microalgae has been
reported by several authors. For example, Harun et al. (2010) reported
bioethanol production from fermentation of Chlorococcum sp using yeast.
Ueda et al. (1996) have patented ethanol production by fermentation in
anaerobic and dark environment and then used the remaining algal
biomass after fermentation to produce methane. In relation to biomethane
production from microalgae, biogas produced from anaerobic digestion of
microorganisms consists mainly of methane (55-75%) and CO2 (25-45%)
(Sing and Gu 2010) and that methane can be used as fuel gas and to
generate electricity (Holm-Nielsen et al. 2009).Microalgae with high
carbohydrate content include Porphyridium cruentum (40-57% of dry
weight) and Spirogyra sp (33-64% of dry weight) (Becker 2007), and
Nannochloropsis spp (36%) (Rebolloso-Fuentes et al. 2001).
Microalgae also have the ability to produce other biologically active
compounds including antimicrobial (antibacterial, antifungal, antialgal
and antiprotozoal), antiviral, toxins and other pharmacologically active
compounds (Borowitzka 1995; Singh et al. 2005). Antiviral substances
found in cyanobacteria, diatoms and the conjugatophyte Spirogyra,
antifungal from cyanobacteria extract, anthelmintic from Spirogyra and
Oedogonium (Pulz and Gross 2004) and the algacides (cyanobacterin and γ-
lactone) from cyanobacteria (Gleason et al. 1986).
Many microalgae especially the cyanobacteria and the dinoflagellates are
known to produce toxins (Borowitzka 1995; Singh et al. 2005). For
example, saxitoxin found in a number of dinoflagellates has been used as
an aid in microsurgical procedures and as an experimental treatment for
short-sightedness. Other toxins including okadaic acid and

19
dinophysistoxin-1 produced by dinoflagellates and microcystin, nodularin
and hepatotoxins produced by cyanobacteria are useful tools in studies of
cellular regulation (Borowitzka 1995). Some other toxins including
hepatotoxin, kalkitoxin, antillatoxin, barbamide and anatoxin, have been
isolated from cyanobacteria (Singh et al. 2005).
Other pharmacologically active compounds derived from microalgae
include anti-hypertensive agents from Dunaliella tertiolecta, nicotine block
from Phaeodactylum tricornutum and neuromuscular block from Navicula sp
(Borowitzka 1995), anticancer (Sirenko et al. 1999), and anti-
inflammatoryagents(Baker 1984). High value metabolites such as
cyanovirin-N (anti HIV), borophysin (potent cytotoxicity against human
epidermoid carcinoma and human colorectal adenocarcinoma cell lines),
cryptophycin (antifungal), lipopeptides (anticancer, antibiotic, antiviral,
enzyme inhibitor), and protease inhibitor have been found in
cyanobacteria (Singh et al. 2005).
1.1.5 Other potential applications of microalgae
Apart from the important products produced by microalgae, they also
have some other important uses/application including animal feed, CO2
fixation and waste water treatments (Pulz and Gross 2004).
Microalgae are considered to be the best food source and feed additive for
aquaculture (Milledge 2011). They are a food source for early stage of
many species of molluscs, crustaceans and fish (Lavens and Sorgeloos
1996). In addition to direct feed, they serve as food source forzooplankton
including rotifers and copepods used as feed for rearing fish larvae (Raja
et al. 2008). Microalgae species such as Spirulina/Arthrospira and Dunaliella

20
are often added to common fish feed to enhance the colour of the
ornamental fish (Pulz and Gross 2004).
There are over 40 species of microalgae used in aquaculture worldwide
including Skeletonema, Chaetoceros, Phaeodactylum, Nitzschia, Thalassiosira
(Bacillariophyta), Isochrysis and Pavlova (Prymnesiophyceae), Tetraselmis
(Prasinophyceae), Chlorella, Scenedesmus, Dunaliella (Chlorophyceae) and
Spirulina/Arthrospira (Cyanobacteria). The production of microalgae used
in aquaculture reached 1000 t in 1999 (Spolaore et al. 2006).
Microalgae are also included in pet food which affect not only the health
but also the external appearance of the pets such as shiny hair and
beautiful feathers (Pulz and Gross 2004). Feeding poultry with algae (5-
10%) enhances the colour of the skin and egg yolk due to the carotenoids
(Milledge 2011). However, too much algae in the feed may lead to adverse
effects (Spolaore et al. 2006).
The ability of microalgae to utilize CO2 and to convert it to biomass
containing various important chemical substances with various important
applications has led to the exploitation of microalgae for CO2 fixation from
industrial exhaust gases (Moheimani et al. 2012; Lara-Gil et al. 2014). This
is an emerging microalgal application which has been explored in many
countries including Germany, Norway, Japan, Italy and the United States
(Pulz and Gross 2004).
Some species of microalgae are considered to be suitable for CO2 fixation
from flue gases due to their ability to tolerate high levels of CO2. A study
done by Zeiler et al. (1995) demonstrated the ability of the green alga
Monoraphidium minutum to efficiently utilise simulated flue gas containing
high concentration of CO2, sulphur and nitrogen oxides to generate

21
substantial biomass. Chlorococcum littorale can tolerate high CO2 levels up
to 60% using step wise adaptation technique (Kodama et al. 1993).
Chlorella sp. and Scenedesmus sp. can be grown under 40 and 80% CO2
conditions, respectively (Hanagata et al. 1992). The coccolithophorid
algae such as Pleurochrysis carterae and Emiliania huxleyi havepotential for
biological CO2 fixation and recycling (Moheimani and Borowitzka 2006;
Moheimani et al. 2012).
Another potential application of microalgae is for wastewater treatments,
producing clean water sources for various uses as well as preventing
water pollution and health hazards (Brenner and Abeliovich 2013).
According to Wu et al. (2014), domestic effluents and livestock and
agricultural wastewaters are types of wastewater recently used by
researchers for microalgal cultivation. In addition, wastewater can contain
high concentration of ammonia, other chemicals or growth inhibitors,
organic matters that stimulate the growth of other microorganisms i.e.
bacteria, and toxins such as heavy metals (cadmium, mercury or zinc).
The most commonly used microalgal species for wastewater treatments
are unicellular green microalgae because they seems to be more tolerant to
many wastewater conditions (Sydney et al. 2011; Park et al. 2012) being
Chlorella and Scenedesmus as the predominant species of the microalgal
communities in waste stabilization ponds (Powell et al. 2008) or high-rate
algal ponds (Canovas et al. 1996; Craggs et al. 2012).
1.2 Large scale outdoor systems
Generally, there are two major systems of mass cultivation of microalgae:
(1) open systems where the culture is directly exposed to the environment
and (2) closed systems where the culture is totally enclosed within the
22
culture vessels commonly called photobioreactors (PBRs) (Borowitzka and
Moheimani 2013a).
1.2.1 Open pond culture systems
Open pond culture systems can be classified as shallow ponds, circular
ponds, raceway ponds, inclined systems and mixed ponds (Borowitzka
and Moheimani 2013a).
Shallow ponds (lagoons)
Large ponds greater than 200 ha with an average depth of about 0.3 m
used for cultivation of D. salina at Hutt Lagoon in Australia is an example
of shallow big ponds (Borowitzka 2013a). Mixing of the ponds is by wind
and convection (Borowitzka 1999a; Tredici 2004).
Raceway ponds
Raceway ponds are the most common type of culture system used for
commercial production of microalgae. The systems consist of a circuit of
parallel channels equipped with a paddle wheel used for circulating the
microalgal culture (Zittelli et al. 2013). Raceway ponds can be built in
concrete or dug in the ground and may be covered with a plastic liner.
These systems are used to produce Arthrospira by Earthrise Nutritionals,
LLC (California, USA) and Hainan DIC Microalgae (China) and to
produce astaxanthin from Haematococcus pluvialis by Cyanotech Co.
(Hawaii, USA) and Parry Agro Industries Ltd (India) (Zittelli et al. 2013)
and for commercial Dunaliella production (Borowitzka 2013a).
Circular ponds
Circular ponds with a centrally pivoted rotating agitator are still widely
used in Japan, Taiwan and Indonesia (Lee 2001; Zittelli et al. 2013).

23
However, the size of the pond is limited to about 10,000 m2 due to the
nonhomogeneous mixing and mechanical problems of a long rotating arm
(Tredici 2004). The largest pond reported is 50 m diameter (Lee 1997).
Inclined systems (cascades)
These systems allow the alga culture to flow down a sloping surface and
end in a retention tank from where it is pumped back to the top of the
incline (Borowitzka and Moheimani 2013a; Zittelli et al. 2013). The
advantages of these systems include efficient use of light due to short
optical path (< 10 mm) of the flowing algal culture thus giving high
biomass density and ease/cheaper harvesting (Masojidek et al. 2011) and
the possibility to quickly secure the culture in case of emergency
(accidents or unfavourable culture conditions) (Borowitzka and
Moheimani 2013a; Zittelli et al. 2013).
Mixed ponds
These systems are mainly used for the production of microalgae for
aquaculture feed (Borowitzka 1997). The pond/tank is about 50-80 cm
deep. Mixing of the culture is provided from aeration from the bottom of
the pond/tank thus giving low productivity (Borowitzka and Moheimani
2013a).
The most successful commercial algal strains grown in outdoor open
ponds have the ability to thrive in extreme environments that inhibit
competition (Lee 2001). For example, Dunaliella, Spirulina and Chlorella
strains grow in environments with extremely high salinity, alkalinity and
nutrients, respectively (Borowitzka 1999a).

24
1.2.2 Closed systems (PBRs)
In these systems, the light as the source of energy does not directly
impinge on the surface of the culture but needs to pass through the
transparent walls of the vessels before reaching the algal cells (Tredici
2004). In addition, direct exchange of gases, liquids and particles between
the cultures and atmosphere is very limited (Zittelli et al. 2013).
Closed photobioreactors can be tubes, plates or bags made of plastics,
glass or other transparent materials, in which the algae are supplied with
light, nutrients and carbon dioxide (Carvalho et al. 2006). In general, there
are two major types of enclosed photobioreactors; tubular and flat plate
photobioreactors (Lee 2001).
Tubular photobioreactors
These reactors are the most common design available and the preferred
ones in commercial algae production (Tredici et al. 2010) and they are
usually constructed from with either glass or plastic tubes in which the
culture is circulated with pumps or by means of airlift systems. Various
forms of tubular reactors have been proposed including horizontal
straight tubes connected by U-bends (Tredici and Materassi 1992), flexible
tubing coiled around a vertical cylindrical frame work (Borowitzka 1999a),
a type of photobioreactors with cross tubes arranged at an angle with the
horizontal(Lee et al. 1995), vertical (Pirt et al. 1983) and inclined
arrangement (Ugwu et al. 2002).
Flat (plate) photobioreactors
Several studies have investigated the growth of algae in different types of
plate photobioreactors. For example, Nedbal et al. (2008) designed a flat-
cuvette photobioreactor that can accurately control culture irradiance,

25
temperature, pH and gas composition combined with real-time
monitoring by a build-in fluorometer and densitometer and demonstrated
the performance of the reactor using the nitrogen fixing cyanobacterium
Cyanothece sp. ATCC51142. Moheimani et al. (2011) have successfully
grown Pleurochrysis carterae in a specially designed flat reactor with the V-
shape of the base of the reactor. Flat plate photobioreactors were also
used for growing Spirulina platensis(Hu et al. 1998), Isochrysis sp (Liu and
Lin 2001; Zhang and Richmond 2003), Nannochloropsis sp (Zittelli et al.
2000; Richmond and Wu 2001), Porphyridium sp (Singh et al. 2000), and
Chaetoceros muelleri var. subsalsum(Zhang and Richmond 2003).
Compared to open systems, closed systems have higher productivity due
to a greater degree of control regarding process parameters and protection
against invading species (Table 3). However, high capital and operating
costs of PBRs have limited their commercial use for the production of high
value products (Tredici 2010).
Table 3. Biomass productivity of several microalgal species cultured in outdoors
Microalgal Species
Biomass productivity
Culture systems References
Chaetoceros muelleri var. subsalsum
8.7-15.4 g.m-2.d-1 Vertical plate-glass reactors
Zhang and Richmond 2003
Chlorella sp 25 g.m-2.d-1 Thin-layer high density microalgal culture system
Doucha and Livansky 1995
Cyclotella sp 12 g.m-2.d-1 Raceway ponds Huesemann et al.2009
Dunaliella salina 1.65 g.m-2.d-1 (average annual productivity)
Open tanks Garcia-Gonzalez et al. 2003
Haematococcus 3.5 g.m-2.d-1 Vertical panel Imamoglu et

26
pluvialis photobioreactors al.2008 Isochrysis galbana
7.9-13.3 g.m-2.d-1 Vertical plate-glass reactors
Zhang and Richmond 2003
Nannochloropsis oculata
0.37 g.L-1.d-1 (max productivity) 0.16 g.L-1.d-1 (annual average productivity)
Outdoor photobioreactors
Quinn et al. 2012
Scenedesmus obliquus
15 g.m-2.d-1 (average annual productivity)
Raceway ponds Payer et al. 1978
Phaeodactylum tricornutum
13.1 g.m-2.d-1 Tubular photobioreactors
Benavides et al. 2013
Phaeodactylum tricornutum
11.7 g.m-2.d-1 Open ponds Benavides et al. 2013
Pleurochrysis carterae
33.68 g.m-2.d-1 Raceway ponds Moheimani and Borowitzka 2006
Spirulina platensis
27 g.m-2.d-1 Raceway ponds Richmond et al. 1990
Spirulina platensis
33 g.m-2.d-1 Flat-plate photobioreactors
Hu et al. 1996
Spirulina platensis
24 g.m-2.d-1 Flat-plate photobioreactors
Tredici et al. 1991
Spirulina maxima
25 g.m-2.d-1 Tubular photobioreactors
Torzillo et al.1986
Spirulina sp 27.8 g.m-2.d-1 Tubular photobioreactors
Torzillo et al.1986
Tetraselmis 5-40 g.m-2.d-1 Raceway ponds Matsumoto et al. 1995
Amphora sp. MUR 258
24 g.m-2.d-1 (max productivity) 7 g.m-2.d-1 (the annual average productivity)
Raceway ponds In this study

27
1.3 Screening methods and key criteria microalgae should meet their
use to produce specific products in large scale outdoor culture
Species or strain selection is the first and critical step in bioprospecting of
microalgae for any commercial application (Borowitzka 2013c). In
addition, the selected species/strain must have high productivities of the
target products when mass cultivated in the preferred culture system.
Screening of microalgae of microalgae species involves a series of steps
including sample collection, isolation, purification, identification,
maintenance and characterization of potential products (Gong and Jiang
2011). There are two possible sources of selecting/screening microalgae;
from microalgae culture collections and from natural environments.
Species selection through microalgae culture collections can be accessed
easily although the number of microalgae species kept in the culture
collection is only a small fraction of microalgae species that exist in nature
(Borowitzka 2013c). On the other hand, untapped resources of microalgae
species can be isolated from natural environments. Isolating and selecting
of local microalgae species/strains has a competitive advantage especially
for microalgae species intending to be mass produced in outdoor as they
are well adapted to the local climatic environment (Larkum et al. 2012).
Isolation of microalgae from a wide range of environments can be done
through a variety of techniques including traditional and
automated/advanced processes. Traditional methods include single-cell
isolation using micropipette, isolation using agar media, dilution
techniques and gravity separation using centrifugation and settling and
media enrichment (Andersen and Kawachi 2005; Mutanda et al. 2011).
Automated techniques of microalgal isolation have been developed to
28
reduce the time required to collect and isolate new algae species including
flow cytometry (Sieracki et al. 2005; Mutanda et al. 2011).
Apart from the productivity of the product of interest, there are some
other criteria that need to be considered to improve the reliability of the
cultures in outdoors for long periods as well as to reduce the production
cost. Some of the important criteria are discussed below.
1.3.1 Wide temperature tolerance
When grown in outdoor open pond systems, cultures will expose to
varying environmental conditions i.e. temperature and irradiance.
Depending on location, temperature can vary during the day and with
season (Borowitzka 2013c). In an area with high insulation i.e. Perth,
Western Australia, temperature can reach up to 42oC in summer and can
drop to -1oC in winter (Bureau meteorology 2012). Therefore, it is
important that the selected species/strain is able to tolerate a wide range of
temperature so that algal biomass can be produced at all times of the year.
Dunaliella salina can be grown at the production plants in Australia for the
whole year due to its very broad temperature tolerance (Borowitzka,
2015). Monoraphidium minutum was grown in outdoor raceway ponds in
Roswell, New Mexico, USA throughout the year although the productivity
was markedly lower in winter (Weissman et al. 1989). A similar study
done by (Moheimani and Borowitzka 2006)who found that the
coccolithophore Pleurochrysis carterae could be grown in outdoor raceway
ponds over a period of 13 months in Perth, Western Australia.

29
1.3.2 Wide salinity tolerance
Tolerance to a wide range of salinity is one of the important criteria for
growing microalgae at large scale in outdoor open pond systems because
salinity variation is most likely to occur due to extensive evaporation and
dilution caused by high temperature and rain, respectively (Khatoon et al.
2010). To make up for evaporation losses, freshwater is added to the
culture to maintain constant salinity. Alternatively, saline water is used
leading to increase in salinity over time (Borowitzka 2013c). Therefore, if
the latter option is used, microalgae species with a wide salinity tolerance
is preferred to obtain reliable cultures for long period. In addition,
microalgae species that are tolerant of a wide range of salinity will
potentially less prone to contamination in large-scale culture for long
period.
Several microalgal species have beenreported to have a wide salinity
tolerance. For example, Fon Sing and Borowitzka (2015) have isolated and
screened microalgae species from hypersaline environments in Western
Australia for outdoor large scale culture in hypersaline media for biodiesel
production. They found several strains that can grow at high wide
salinity ranging from 3-11% NaCl with high productivity. However, both
biomass and lipid productivity were higher at low salinity (3% NaCl) as a
result of high growth rate and much lower productivities at the highest
salinity (11% NaCl) due lower growth rate. If the strains are grown at low
salinity as to achieve high productivities, the contamination issues would
likely to be encountered resulted in the difficulty to obtain reliable culture
for long-period. On the other hand, strains that can grow well at
hypersaline media with high productivity would be more reliable and
sustainable to be cultured in outdoor open pond systems i.e. raceway

30
ponds as the contamination issues would be less likely to have occurred
and the gradual increase in salinity due to the use of sea water to make up
evaporation loss would not be a problem. It is therefore, important to
isolate and screen for microalgae species capable to grow well at a wide
range of salinity specifically in hypersaline environments as to achieve
more reliable culture for long period.
1.3.3 Ease of harvesting
Harvesting of microalgal biomass is a costly process accounting for about
20-30% of the total cost (Molina Grima et al. 2003). One of the main
considerations in selecting cost-effective and high recovery efficiency of
harvesting techniques is the morphology of the algae (Gong and Jiang
2011; Borowitzka 2013c). For example, heavy cells of diatoms and
coccolithophorid algae settle easily allowing simplification of the
harvesting process by settling the cells whereas filtration is effective for
large, filamentous and colonial species such as Spirulina, Skeletonema or
Botryococcus(Borowitzka 2013c).
1.3.4 Outcompete other contamination
One of the major limitations of sustainable production of microalgae
culture in outdoor open pond systems is contamination by other
microorganisms (Richmond 2013). Contamination is unavoidable due to
the impossibility to maintain sterile and axenic conditions in outdoor open
pond systems (Packer 2009).
To be successfully grown in outdoor for long periods, species of
microalgae must have the ability to grow at highly selective environments
to enable them to grow and to outcompete other contaminants (other
algae and protozoa) (Borowitzka 1999a). Some species of microalgae
31
currently produced commercially in outdoor open pond systems include
Dunaliella salina that requires very high salinity to grow (optimum at 22%
NaCl) (Borowitzka 2013a), Chlorella that grow well at higher nutrient
concentration (Liu and Hu 2013) and Arthrospira (Spirulina) that requires
high carbonate and bicarbonate alkalinity and high pH (Belay 2013). Sing
et al. (2011) proposed an alternative strategy to guarantee the dominance
of the target species by inoculating high concentration of the starter
cultures.
Hypersaline environmentsare one of the ideal extreme environments for
screening purposes as the isolates from this environment are robust with
unusual characteristics adapted to high salt concentration (Mutanda et al.
2011) allowing them to outcompete other contaminating algae and
protozoa as not many microorganisms can withstand high salt
concentration.
1.4 Key factors affecting growth and productivity (both biomass and
products) in outdoor large-scale cultures
1.4.1 Light
Light is the source of energy which drives photosynthesis (Masojídek et al.
2013) and the quantity and quality of light are the major factors controlling
the productivity of photosynthetic cultures (Pulz and Scheinbenbogen
1998). However, too much light can lead to reduced productivity due to
photoinhibition and photodamage (Borowitzka, 2015)
Microalgae cultivation systems can be illuminated by sunlight or artificial
light. The use of sunlight as a light source in algal cultivation has several
advantages. First, it is abundant and can provide the highest light
intensity at ~1100 W m-2 at mid-day (≈5000µmol photons m-2 s-1), exceeding

32
the required irradiance for efficient production of microalgae (Miyake et
al. 1999). Second, it is free compared to the costly artificial light and
thirdly, sunlight provides full spectrum of light energy to support the
growth of microalgae and the production of the target products (Chen et
al. 2008). In addition, most commercial cultivation of microalgae carried
out in open ponds utilizes solar energy as the light source (Pulz 2001).
However, the impossibility to control the fluctuations of light intensity
(diurnal and seasonal variation) and day-night cycles which are location-
specific is the main drawback of the use of sunlight (Blanken et al. 2013).
Fluctuations in irradiance can be managed by applying artificial lighting
(Blanken et al. 2013). There are three promising types of artificial light
sources for microalgae cultivation which are of interest for indoor
cultivation systems. The first type are fluorescent tubes which exhibit a
PAR efficiency of 1.25 µmol photons s−1W−1 (µmol PAR photons per
second per watt of energy) and are mostly exploited in laboratories and
plant growth chambers. The second type are the HIDs from which the
high pressure sodium lamp with a PAR efficiency of 1.87 is the most
commonly employed in horticulture. The third type are LEDs, which are
continuously being improved. Currently, commercially available LEDs
exhibit a PAR efficiency of 1.91 µmol-photons s−1W−1(Blanken et al. 2013).
However, the use of artificial light has some drawbacks. The first
disadvantage is the increase of the overall costs. Gordon and Polle (2007)
pointed out that the extensive exploitation of artificial light results in
investment and electricity costs which in turn led to the increase in the
final production costs. The second disadvantage is the negative energy
balance caused by energy losses in luminaries and during energy fixation
into microalgae biomass. These disadvantages might be acceptable in the
production of high value products but should in general be avoided

33
(Blanken et al. 2013). Therefore, the use of sunlight as the energy source is
the best option for large scale microalgal cultivation.
Algae cultures growing in outdoors are exposed to varying light intensity
during the day and with seasons and the photosynthetic productivity of
algae cultures at any given irradiance is influenced several factors
including cells concentration, culture depth, turbulence, nutrient supply,
temperature and oxygen concentration (Borowitzka 2016). Several
strategies can be applied to deal with irradiance fluctuation in outdoors as
to achieve higher productivity including managing cell density and
mixing. In the very dense cultures, the irradiance decreases rapidly from
the surface of the culture and cells deeper within the culture may actually
be in the dark (Oswald 1988). Hence, mixing is needed to enhance
photosynthesis (Richmond 2013) as mixing facilitates the algal cells
movement from unilluminated/low light regions to the high-light upper
layer so that the cells are exposed to an alternating light/dark pattern
(Richmond 1986a; Borowitzka 2016). However, mixing cannot be applied
to all cultures due shear sensitivity of many algae species (Sulivan and
Swift 2003; Sulivan et al. 2003). It is therefore important to select shear
resistance species for outdoor mass cultivation.
Maintaining cell density at or near the optimum cell density (OCD) will
sustain maximum productivity. Increased in cell density beyond OCD
will reduce productivity due to shelf-shading of the algal cells
(Borowitzka 2016).Hu et al. (1996) studied the relationships between
different cell density (much below the OCD, around OCD and well above
OCD) and the extent of photoinhibition of Spirulina sp. They found that
the PS II efficiency was greatly reduced at lower cell density. At OCD,
alittle decrease in Fv/Fm was observed in midday. Conversely, at high cell

34
density above OCD, the availability of the light was very limited due to
mutual shading which in turn reduced productivity. Hence, cell density
should be maintained at the OCD range. If regular harvesting and
topping up of the cultures is done, harvesting the cultures at late
afternoon or evening may be more practical and may improve the overall
productivity of outdoor algal cultures (Richmond 2013) as harvesting
during the day will expose the remaining cells to high irradiances which
in turn can lead to photo-inhibition and even photo-damage resulting in
reduced productivity (Borowitzka 2016).
Light intensity affects the biochemical composition of microalgae (De la
Pena 2007). Lamers et al. (2010) studied the effect of light on both
carotenoids and fatty acid levels in Dunaliella salina using a plate panel
photobioreactor. They observed a massive increased in β-carotene
production (one or two orders of magnitude larger than the average
production rate obtained at commercial β-carotene production plant)
upon the shift to an increase light intensity. In addition, accumulation of
cellular β-carotene correlates with accumulation of specific fatty acids
(C16:0 and C18:1) rather than with total fatty acid content. The effect of
different light intensity on astaxanthin accumulation of Haematococcus
pluvialis was studied by (Imamoglu et al. 2009). They found that the
astaxanthin content increased up to 25% as the light intensity increased
from 445 to 546 µmol photons m-2 s-1. In addition, the cells grown at high
light intensity (546 µmol photons m-2 s-1) appeared brighter red
demonstrating that high light intensity had better influence on astaxanthin
accumulation. When Chlorella zofingiensis cells exposed to 460 or 920
µmol photons m−2 s−1, the lutein level in the cells was less than half of that
maintained at low light intensity (90 µmol photons m−2 s−1). In contrast,
the astaxanthin level was about 3 times higher at high irradiance than that

35
at low irradiance (Del Campo et al. 2004). In Muriellopsis sp, lutein was
enhanced up to 40% as light intensity increased from 184-460µmol
photons m-2 s-1but decreased by about the same proportion at higher
irradiance (Del Campo et al. 2000). In contrast, astaxanthin and
canthaxanthin production exhibited an opposite trend reaching maximal
at the highest irradiance assayed (1725 µmol photons m-2 s-1).
The effects of different light intensities (75, 150 and 300 µmol photons m-2s-
1) on the fatty acids compositions of two strains of Spirulina were studied
by Cohen et al. (1987). They found that the fatty acid content of both
strains at high light intensity (300 µmol photons m-2s-1) was much lower
than at low light intensity (150 and 75 µmol photons m-2s-1). An opposite
effect was observed in Nannochloropsis sp (Pal et al. 2011), where the total
fatty acids content was higher at high light intensity (700 µmol photons m-
2 s-1) compared to that at low light intensity (170 µmol photons m-2 s-1).
Exposure to high light intensity (300 µmol photons m-2 s-1) increased the
level of TAG and decreased the total phospholipid content of the
filamentous green alga Cladophora sp (Napolitano 1994). Similarly, Brown
et al. (1996) observed an increased percentage of TAG concomitant with a
reduced percentage of the total polar lipids in the cells of the diatom
Thalassiosira pseudonana grown under 100 µmol photons m-2 s-1 compared
to 50 µmol photons m-2 s-1.
1.4.2 Temperature
Temperature is the most important limiting factor, after light, for culturing
microalgae in any outdoor cultivation systems, since exceeding the
optimum temperature may result in the total culture loss (Zeiler et al.
1995). The influence of temperature on living organisms may be

36
considered from the ecologist and physiologist points of view. The
ecologist is interested in this factor primarily because it affects the
distribution of species whereas physiologist strives towards an
understanding of the biochemical and biophysical mechanisms which
permit certain species to prosper under conditions incompatible with the
survival of others (Marre 1962).
In relation to temperature, microalgae are particularly interesting because
of the extremely wide range of thermal environments which they occupy
and the high degree of adaptation shown by various species to their
particular environments (Marre 1962). For example, some algal species
known to thrive on the surface of snow include Ancylonema nordenskioldii,
Ancylonema meridionale, Chlamydomonas nivalis, Chlamydomonas flavo-virens
(Fritsch 1935) and many species of Stichococcus (Broady 1996; Hughes
2006; Chen et al. 2012). The ability to survive at such a low temperature
can be attributed to the frost resistance which is an abnormal capacity of
the protoplasm to survive mechanical damage caused by the freezing and
thawing of intracellular liquids (Levitt 1956; Kanwisher 1957). Chen et al.
(2012) pointed out that elevated nitrate reductase activity and
photosynthetic rates at low temperatures together with the high
proportion of unsaturated fatty acids allow the two Stichococcus species (S.
bacillaris and S. minutus) to thrive in Antarctica. Another defence
mechanism against low temperatures may lie in a high osmotic pressure
of the cell which is correlated with a lowering of its freezing point as
observed in Dunaliella salina which can survive without freezing and even
maintain some motility at temperature as low as -15oC (Marre 1962).
Some other algae have been reported to grow at extremely high
temperature from hot springs including Cyanidium caldarium which can be

37
cultured at temperatures as high as 50oC (Allen 1959) and Oscillatoria
geminata which can carry out photosynthesis efficiently and continuously
at 40oC (Bunning and Herdtle 1946). The ability of the hot spring algae to
tolerate the heat is a consequence of the capacity of their proteins to
endure without denaturation at abnormally high temperatures, thereby
enabling them to grow in environments which tend to exclude
competition from other species (Marre 1962). With the exception of cold-
water stenothermic and thermophilic species, most of the microalgae
including cyanobacteria tested achieved their maximum specific growth
rate in the temperature range 25-35oC (Reynolds 2006).
Temperature is one of the most important and well-studied factors
influencing the chemical composition of algae, particularly lipids and fatty
acids (Guschina and Harwood 2013). Variations in lipid composition were
studied in Isochrysis galbana exposed to two different temperatures, 15 and
30oC (Zhu et al. 1997). The lipid content was higher at 30oC than at 15oC
(regardless of the growth phase) with neutral lipids as the predominant
lipid class accounting for more than 45% of total lipids. Whilst the
phospholipid content remained constant at the two temperatures,
glycolipids increased with increasing temperature. Higher proportion of
18:3 (n–3) and 22:6 (n–3) concomitant with a decrease in 18:2 (n–6),
monounsaturated and saturated fatty acids were observed in the cells
grown at 15oC.
Renaud et al. (2002)also studied the effect of five different temperatures
(25, 27, 30, 33 and 35oC) on fatty acid composition of four tropical
Australian microalgae species, a diatom Chaetoceros sp. (CS256), two
cryptomonads, Rhodomonas sp. (NT15) and Cryptomonas sp. (CRFI01) and
unidentified prymnesiophyte (NT19) and found that total highly

38
unsaturated fatty acids (HUFA) of all species decreased with increasing
growth temperatures.
The temperature also affected lipid composition in Chaetoceros muelleri and
Navicula lyra (Chen 2012). C. muelleri accumulated more PUFAs when
cultured at higher temperature in a summer greenhouse (30-32oC).
However, when cultured at lower temperature in the incubator (17-18oC),
the cells accumulated more saturated fatty acids (SFAs). An opposite
trend was observed in N. lyra, where the cells produced more SFAs at
higher temperature and PUFAs at lower temperature.
In Nitzschia laevis, TAG was the predominant lipid fraction which
decreased along with the decrease of temperature. The largest polar lipid
component was phosphatidylcholine which increased at low temperature.
Moreover, polar lipids, especially phospholipids (PLs) contained high
percentage of PUFA and low temperature favoured the distribution of
PUFAs in PLs (Chen et al. 2008)
A shift in temperature from 25 to 10oC increased the proportion of oleate
and ergosterol in the green alga Selenastrum capricornutum (McLarnon-
Riches et al. 1998). Similarly, Jiang and Chen (2000) employed
temperatures as a shift strategy on DHA production of the marine
microalgae Crypthecodinium cohnii ATCC 30556. They found that a shift in
temperature from 25oC for 48 h followed by to 15oCfor 24 h resulted in the
19.9% increase in cellular DHA content and a 6.5% increase in DHA
productivity as compared to that at 25oC for 72 h demonstrating the
capability of C. cohnii to rapidly modify its fatty acid composition in
response to the temperature decrease. These results further support the
idea that low temperature was necessary for the synthesis of DHA and the
39
DHA might be a temperature-dependant fatty acid (Hamamoto et al.
1994).
Temperature also affects the carotenoid composition of microalgae. Lutein
and astaxanthin accumulation in Chlorella zofingiensis enhanced within the
temperature range 20-28oC with lutein reaching a maximum at 28oC.
Increase in temperature to 32oC resulted in decrease in cellular levels of
lutein and total carotenoids to less than one-half of those recorded at 28oC
(Del Campo et al. 2004).
1.4.3 CO2 and pH
In addition to light and water, CO2 is required for photosynthesis to occur.
However, high CO2 concentration can be detrimental to photosynthesis
and cell growth whereas limited supply of CO2 will restrict photosynthesis
and growth (Kunjapur and Eldridge 2010).
In relation to carbon uptake, species that can utilize HCO3- as an inorganic
carbon source when CO2 is limited can still continue to photosynthesise at
high pH (Korb et al. 1997; Giordano et al. 2005). Diatoms are known to
actively take up HCO3- and convert it into intracellular CO2 by the enzyme
carbonic anhydrase (Reuter and Muller 1993) and can also utilize HCO3-
directly for carbon fixation through C4 photosynthesis (Tortell et al. 1997;
Reinfelder et al. 2000).
pH is one of the important factors affecting the aqueous chemistry of polar
compounds and the nutrient availability including iron, organic acids and
CO2 (Coleman and Colman 1981; Lee and Pirt 1984)and also directly and
indirectly influences the metabolism of the algae (Becker 1994). Each algal
species has a narrow optimal pH range (Kunjapur and Eldridge 2010).
40
According to Coutteau (1996), the vast majority of cultured microalgae
species has pH range between 7 and 9 with pH range optimum being 8.2-
8.7. A study done by Søgaard et al. (2011)found that the two diatoms
(Fragilariopsis nana and Fragilariopsis sp.) exhibited maximal growth rate at
pH 8.0 and/or 8.5 and they stopped growing at pH 9.5. However, some
microalgae have been reported to grow well at extremely high and low
pH. For example, the pH optimum for the growth of Spirulina is between
9-10 (Belay 2013) whereas Chlorella sp.KR-1 can tolerate pH below 4.0
(Sung et al. 1998) and Cyanidium grew well at pH 2 (Venkataraman and
Becker 1982). Garbayo et al. (2012) have isolated a microalga species
belonging to the genus Coccomyxa from an acidic river in Huelva, Spain
that exhibits extremely low pH (1.7-3.1).
Several studies have reported the effect of CO2on the chemical
composition of microalgae. For example, Pronina et al. (1998) studied the
effect of CO2 concentration on the fatty acid composition of wild-type
Chlamydomonas reinhardtii and a mutant strain. They found that there was
an increased in the total PUFA content in both strains as the CO2
concentration was decreased from 2% to 0.03%. Muradyan et al.
(2004)also studied the effect of CO2 on the lipid content and fatty acid
composition in Dunaliella salina and found an increase in the total fatty
acids by 30% as well as the ratio of ω-3/ω-6 fatty acid and the proportion
of trans-16:1∆3 in phosphatidylglycerol as the CO2 concentration was
increased from 2 to 10%.
1.4.4 Salinity
Salinity is a primary factor influencing the growth of marine microalgae as
algae often have a negative response in morphology and physiology with
fluctuating salinity (Aizdaicher and Markina 2010). Biochemical

41
compositions of microalgae have been reported to change in response to
salinity changes. For example, Al observed an increase in the lipid content
and the carotene to chlorophyll ratio of Navicula sp as the salinity increase.
The gross chemical and fatty acid composition of Isochrysis sp.,
Nannochloropsis oculata and Nitzschia were significantly different at
different salinities (Renaud and Parry 1994). The hydrocarbon,
carbohydrate and carotenoids contents of Botryococcus braunii are also
influenced by different levels of salinity (Zhila et al. 2005; Ranga Rao et al.
2007a). Specific growth rate of Nannochloropsis oculata decreased
significantly at higher salinity and the fatty acid methyl esters (FAME)
content increased with increasing salinity (Gu et al. 2012). Increase of
NaCl concentration from 0.5 to 1.0 M increased the lipid content of
Dunaliella tertiolecta up to 10% (Takagi et al. 2006).
Diatoms are known to thrive in water containing a wide range of
dissolved salts, from fresh water to marine and hypersaline water.
Hypersaline environments contain higher salt concentrations than
seawater (4% to over 30% of salinity) (Clavero et al. 2000). In addition,
about thirty-four benthic diatoms have been isolated from the thalassic
hypersaline marine environments in which most of them (31 of 34 strains)
were able to grow at more than twice seawater salinities. Amongst them,
only 5 species (Nitzschia fusiformis strains MPI97D5 and Ni203, Amphora
sp. strain MPI97D4, Amphora cf. subacutiuscula strain MPI97D6 and
Entomoneis sp strain MPI97D8) could grow at 15% salinity (the upper limit
of salinity for diatom growth). Similarly, Rince and Robert (1983)
observed upper limits of diatom distribution at 15%-16.5% total salts.
Beyond the upper limits of salinity tolerance, growth may be stopped to
maintain osmotic adjustment that guarantees survival for short periods
(Clavero et al. 2000). However, in response to salinity changes, microalgae

42
have evolved certain mechanisms of adaptation. For example, Dunaliella
salina synthesizes the compatible solute glycerol in response to osmotic
stress (Borowitzka 1981; DasSarma and Arora 2001). The amino acid
proline is used by most studied diatom for controlling internal osmolarity
whatever the extent of their salinity tolerance in the range of oligohaline to
highly hypersaline environments (Liu and Hellebust 1975; Ben-Amotz and
Avron 1983; Fujii et al. 1995).
1.4.5 O2
High concentration of dissolved oxygen is a sign of a healthy
photoautotrophic culture with high photosynthesis. However, high
oxygen concentration in algal cultures at high light intensity is undesirable
because combination of both high oxygen and high light intensity will
promote photorespiration and will lead to photooxidative damage of
photosynthesis (Hu and Richmond 1994).
Photorespiration is the light stimulated oxidation of the products of
photosynthesis to CO2 and is due to the oxygenase activity of Rubisco
(ribulose-1,5-bisphosphate carboxylase/oxygenase) (Beardall et al. 2003).
As Rubiscos have competitive carboxylase and oxygenation function, high
O2concentration promotes the oxygenase activity of Rubisco resulting in
the preferential uptake of O2 rather than CO2and converts ribulose-1,5-
bisphosphate to 3-phosphoglyceric acid and 2-phosphoglycolate (Hough
and Wetzel 1978; Beardall et al. 2003). The effect photorespiration is even
worse at high O2, light and temperature, resulting in a significant loss of
fixed carbon and indisputably results in appreciable declines in biomass
productivities (Hartig et al. 1988).

43
In terms of photo-damaged caused by high O2 concentration at high light
intensity, Asada and Takahashi (1987) pointed out that persistent high
dissolved oxygen concentration will lead to the formation of harmful
oxygen radicals through multiple mechanisms which in turn lead to a
potentially deleterious effect on photosynthetic structures. Torzillo et al.
(1984) reported oxygen inhibition on the growth of Arthrospira maxima.
They found a 40% decrease in growth of the cultures grown under 0.7 atm
of O2 compared to the culture grown at 0.2 atm of O2. Sing et al. (1995)
investigated oxygen species that involved in the oxidative damage of
Arthrospira cells and they found that the singlet oxygen generated at high
light played a major role in the photooxidative damage of Arthrospira cells
compared to that of superoxide and hydroxyl radicals.
The effect of high O2 is even worse in closed reactors as it cannot be
outgassed as efficiently as in open systems (Camacho Rubio et al. 1999).
The negative effects of high O2 concentration can be reduced by
maintaining a high CO2:O2 ratio in the cultures through improving
techniques of oxygen stripping/degassing and through enhancing carbon
concentrating mechanisms activity in order to promote the carboxylase
activity of RuBisCO (Fon Sing 2010).
1.4.6 Nutrients
In addition to light, temperature and carbon, microalgae need nutrients
for the assembly of photoautotrophic biomass (Reynolds 2006). The key
nutrients of microalgal growth are nitrogen, phosphorus, iron, trace
elements and vitamins as well as silicate which are required by diatoms
for growth.
44
Nitrogen
Nitrogen is the most important nutrient for biomass production
(Grobbelaar 2013). It accounts for not less than 3% of the ash-free dry
weight of living cells. In N-replete cells, the nitrogen increases to 10-12%
in cells storing condensed proteins (Reynolds 2006).
Nitrate (NO3-) is the most common nitrogen source for growing algae but
ammonia (NH4+) and urea are also used with similar growth performances
(Kaplan et al. 1986). Microalgae preferentially take up ammonium if
concentrations exceed 0.15-0.5 µM because the initial intracellular of
nitrogen assimilation proceeds through a reductive amination forming
glutamate and subsequent transamination to form other amino acids and
the substrate is apparently always ammonium (Owens and Esaias 1976).
Therefore, the algae should use ammonium first as nitrate and nitrite
have to be reduced prior to assimilation in reaction catalysed by nitrate
and nitrite reductase, respectively, so adding to the energetic cost of
nitrogen metabolism.
The capability of microalgae to utilize different source of nitrogen is
species specific. Some cyanobacteria, especially the nostocalean genera,
have the ability to fix nitrogen from the atmosphere (Reynolds 2006).
Fixation is confined to the heterocysts, which are specialised cells
differentiated along the vegetative filaments (Fay et al. 1968)
Nitrogen is probably the most important nutrient affecting lipid
metabolism in algae and nutritional stress caused by nitrogen deprivation
might be an efficient way to increase lipid content of microalgae (Sharma
et al. 2012). Many studies have shown that a number of microalgae
accumulate more lipids when grown under nitrogen deficiency (Hu 2004)
45
includingTetraselmis subcordiformis, Nannochloropsis oculata and Pavlova
viridis (Huang et al. 2012), Nannochloropsis oculata(Jiang 2002; Huang et al.
2003), Chlorella (Illman et al. 2000; Tang et al. 2011; Yeh and Chang 2011;
Praveenkumar et al. 2012) and Phaeodactylum tricornutum (Alonso et al.
2000). However, nitrogen deficiency is not always linked to lipid
accumulation. Some species, including Achnanthes brevipes (Guerrini et al.
2000) and Tetraselmis sp (Gladue and Maxey 1994), accumulate more
carbohydrates under nitrogen limitation indicating that lipid
accumulation induced by nitrogen limitation is species specific.
There have been several hypotheses explaining the biosynthesis and lipid
accumulation of microalgae under nitrogen depletion. Under nitrogen
limitation, photosynthetically-derived energy, which is normally directed
to produce more cells and therefore more proteins, is in part diverted to
make storage products (i.e. carbohydrates and lipids) which lack of
nitrogen (D´Souza and Kelly 2000). The conversion of glucose into lipids
is triggered when nitrogen is exhausted caused by the presence of high-
energy charge ratio of ATP/AMP(Botham and Ratledge 1979). Lipid
accumulation might also be related not only to higher levels of lipid-
synthesising enzymes under nitrogen starvation, but also to the cessation
of other enzymes associated with cell growth and proliferation and the
operation of enzymes specifically related to the accumulation of lipid
(Ganuza et al. 2008). According to (Takagi et al. 2000), three things would
change under nitrogen starvation: decreasing of the cellular content of
thylakoid membrane, activation of acyl hydrolase and stimulation of the
phospholipid hydrolysis, which in turn lead to increase of the intracellular
content of fatty acid acyl-coA. In addition, diacylglycerol acyltransferase
which converts acyl-coA to triglyceride (TAG) could also be activated
under nitrogen deprivation.

46
Nitrogen availability also influences carotenoid accumulation in some
microalgae. For example, the level of lutein in the culture of Muriellopsis
sp increased up to two fold when nitrate concentration was increased
from 10 to 20 mM (Del Campo et al. 2000). Haematococcus pluvialis
accumulated maximum amount of total carotenoids of 67.49 µgmL-1 at
0.2M NaNO3 on 27th day (more than 15% to that of control (0.3M
NaNO3))(Nagaraja et al. 2012). In the flagellated cells Haematococcus
pluvialis, nitrogen limitation played a greater effect than high light
intensity on astaxanthin production (Fabregas et al. 1998). An
enhancement of astaxanthin production in the H. pluvialis cells under
combination of nitrogen and phosphate limitation was also observed by
Brinda et al. (2004).
Phosphorus
Phosphorus is an essential requirement of living, functional microalgae
because it is a component of nucleic acids governing the synthesis of
protein and of the adenosine phosphate transformations that power
intracellular transport (Reynolds 2006). In addition, it is one of the most
important limiting factors to growth in algal biotechnology due to its
ability to easily bind to other ions such as CO32- and iron resulting in its
precipitation making it impossible to be taken up by the algae (Grobbelaar
2013). Chisti (2007)suggested that phosphorus be supplied in excess
because phosphates react with metal ions. However, the phosphorus
requirement for optimum growth vary considerably from species to
species, even if no other external factor is limiting, and the majority of
algae can grow at low to medium phosphorus concentration (Kaplan et al.
1986).

47
The preferred form of phosphorus supplied to algae is as orthophosphate
(PO42-) (Grobbelaar 2013). According to Round (1965) and Lund (1965), in
healthy and actively growing microalgal cells, the phosphorus content is
about 1-2% of ash-free dry mass with a molecular ratio to carbon of
around 0.0094 (106 C:P).
The effect of phosphorus on chemical composition of microalgae has been
reported in several studies. For example, Reitan et al. (1994) reported an
increase in the total lipid content in Chaetoceros sp, Phaeodactylum
tricornutum and Pavlova lutheri, but a decrease in the total lipid content in
Tetraselmis sp and Nannochloris atomus, when the algae were grown under
phosphorus limitation condition. Scenedesmus sp. LX1 could accumulate
lipid to as high as 53% of dry weight at low phosphorus concentration (0.1
mg.L-1), whereas at high phosphorus concentration (0.2 to 2.0 mg.L-1), the
lipid content was about 23-28% of dry weight (Xin et al. 2010). In Chlorella
sp, the lipid content and lipid productivity increased under low
phosphorus conditions (Liang et al. 2012). In addition, the lipid
accumulation in cells decreased by supplementing the growth media with
K2HPO4 in the late growth phase. In Arthrospira (Spirulina) platensis,
however, the lipid content was not affected by the phosphorus
concentration (10, 50, 250 and 500 mg L-1 K2HPO4) (Markou et al. 2012).
Silicate
Silicate is needed for the formation of the diatom cell walls/frustules.
Diatoms have the ability to take up silicic acid from their environment (at
low concentration < 1 µM) and transport it through the lipid bilayer of the
cell membrane, resulting in accumulation of over 1000-fold higher
concentration inside the cell (Hildebrand et al. 1997; Hildebrand et al.
1998). However, when the silicate is limited, cells cannot complete their

48
growth cycle which in turn led to the failure of new frustule formation
(Reynolds 2006).
Iron
Iron plays an important role in photosynthetic carbon reduction and
nitrogen reduction through its participation in electron transport (such as
ferredoxin and nitrogenase) and pigment biosynthesis (Reynolds 2006).
Iron deficiency symptoms can be recognize by low cytochrome f level
(Glover 1977), the blockage of chlorophyll and possibly phycobilin
synthesis (Spiller et al. 1982), impaired the structure of thylakoid
membranes and the restriction of the nitrite reductase synthesis (Guikema
and Sherman 1984).
The effect of iron on the growth and biochemical composition of
microalgae is not well documented (Liu et al. 2008). Liu et al (2008) then
studied the effects of different iron concentrations (1.2x10⁻⁵, 1.2x10⁻⁶,
1.2x10⁻⁷, 1.2x10⁻⁸ and 0 mol.L-1 FeCl3.6H2O/EDTA) on the growth and lipid
content in marine strain Chlorella vulgaris. They found that the total lipid
content in cultures supplemented with the highest iron concentration
(1.2x10⁻⁵ ) was up to 56.6% of dry weight (3-7 fold that of lower iron
concentration). Effects of iron on fatty acid and astaxanthin production in
mixotrophic Chromochloris zofingiensis were studied by Wang et al. (2013).
They observed an enhancement of both total fatty acids and astaxanthin
production in C. zofingiensis with addition of iron reaching maximum at
0.2 mM Fe2+concentration (41.8% of dry weight for total fatty acids and 1.6
mg.L-1 for astaxanthin). However, further increase in iron concentration
resulted in decrease in both total fatty acids and astaxanthin content.

49
Trace elements and vitamins
Trace elements are nutrients needed in minute quantities including boron,
manganese, copper, molybdenum, cobalt, nickel and selenium (Suh and
Lee 2003) whereas thiamine (vitamin B1), biotin and cyanocobalamin
(vitamin B12) are some of the vitamins commonly supplemented at low
concentration in a microalgal culture medium. Thiamine and biotin are co-
factors in the decarboxylation of pyruvic acid and in the carboxylation and
transcarboxylation reaction of photosynthesis, respectively whereas
vitamin B12 mediates reactions involving intramolecular combinations
involving C-C bond cleavage (Swift 1980). The vitamins are integrated in
a culture medium singly or in combination of two or three vitamins.
Vitamin B12 is required for centric diatom and several pennate diatoms
and most of the dinoflagellates. A majority of Haptophyceae require
thiamine, sometimes with B12, whereas most species of Chrysophyceae
require the supplementation of two or three vitamins (Reynolds 2006).
1.4.7 Mixing/turbulence
Mixing is the most influential factor affecting algal growth rates when
environmental conditions do not limit the growth rates (Suh and Lee
2003). The aim of mixing of the culture is to facilitate cells movement from
illuminated upper layer of the photic zone to the unilluminated lower
strata in the pond and then move back again to the surface (Richmond
1986a). Mixing plays an important role in algal cultivation to keep the
cells in suspension in the water column so that they are exposed to light
and to optimise gas exchange and nutrient uptake. Mixing creates
turbulence and shear (Camacho et al. 2000) which in turn enhance nutrient
supply to the cells, however strong turbulence may damage the cells of
shear sensitive algae (Thomas and Gibson 1990; Thomas et al. 1995;

50
Sulivan et al. 2003). In addition, the shear sensitivity of microalgae is
related to the presence or absence of flagellates as the strong
turbulence/shear can damage the fragile flagella which in turn reduce the
growth rate (Sulivan and Swift 2003).
1.4.8 Contaminants
Contaminants are inevitable especially in outdoor algal cultures where
neither the medium nor the surroundings are sterile. Types of
contaminants include other algae, zooplankton, protozoa, bacteria,
viruses, fungi and insects (Becker 1986). In addition, the types and the
extent of contamination may vary according to geographic location,
climate condition and the cultivation systems.
Although contamination in outdoor algal cultures cannot be avoided,
early detection of the presence of the contaminants can help minimise the
potential of culture crashes. Growth measurements should be
accompanied by detailed microscopic observation to trace the possible
growth of the foreign algal species as well as grazers and predators (i.e.
amoebae, ciliates, rotifers and fungi) that can grow quickly and take over
the cultivated species causing culture collapse (Richmond 2013).
Furthermore, the presence of the contaminants in the culture should be
regarded as a warning signal indicating that the cultured species is most
probably stressed.
1.4.9 Auto-inhibition/Inhibitory substances
Many microalgae could release substances which inhibit their own growth
and the growth of others (Hellebust 1974). The growth of Chlorella
vulgaris was depressed by a kind of compound named chlorellin which

51
was produced and excreted into the cultural liquid (Pratt 1942). Harris
(1970) observed Platydorina caudata (a colonial green flagellate) produced a
heat-labile extra cellular autoinhibitory substance. Haematococcus pluvialis
and Skeletonema costatum also produce substances that inhibit their own
growth (Imada et al. 1991; Sun et al. 2001). Some microalgae also produce
inhibitory substances that could affect the growth of other microalgae cells
such as Chlamydomonas reinhardtii, Peridinium bipes, Peridinium polonicum,
Nitzschia frustulum, Scrippsiella trochoidea, Prorocentrum donghaiense and
Nannochloropsis oculata (Proctor 1957; Wu et al. 1998; Arzul et al. 1999;
Perez et al. 1999).
Free fatty acids are also known to inhibit the growth of a variety
organisms (McCracken et al. 1980). Furthermore, Chlamydomonas
unsaturated fatty acids can be toxic to other organisms (i.e. Chlorella).
Nieman (1954) and Okamoto and Katoh (1977) proposed the mode of
action of fatty acids as inhibitory by altering membrane function. Sun et
al. (2008) found a growth inhibitor isolated and purified from the death
phase of Isochrysis galbana culture identified as 1-[hydroxyl-diethyl
malonate]-isopropyl dodecanoic acid strongly suppressed the growth of I.
galbana, D. salina, C. vulgaris, N. closterium, C. muelleri, C. gracilis and P.
tricornutum.
In conclusion, microalgae are a potential source of important chemicals
including carotenoids and lipids/fatty acids with a huge range of potential
application. Although, there are over thousands or even millions of
microalgae species exist in nature. Only a few of them have been
successfully produced commercially for the production of high value
products (i.e. Dunaliella salina for β-carotene, Haematococcus pluvialis for
astaxanthin and Crypthecodinium cohnii for EPA production). Hence,

52
bioprospecting of microalgae species with commercial potential is thus an
important and challenging task. The target algal species is not only the
one with high product of interest production but also the one that can
thrive over a wide-range of environmental condition so that they can be
easily cultured and maintained at a low cost production system i.e.
raceway ponds.
1.5 Aims of this thesis
The main aim of this study was to isolate and characterise new microalgae
species/strains suitable for large-scale cultures and with commercial
potential, with the main interests being in algae suitable for the
production of lipids/fatty acids and/or carotenoids which are of interest
due to their high values and wide range of potential applications. To
achieve this aim the following tasks were undertaken:
1. Species isolation and strain selection
The focus was on the isolation of algal species from a selective
environment although screening of potential species from the Murdoch
University Microalgal culture collection was also undertaken. For
isolation of algal species, the focus was mostly on microalgae capable of
growth in halotolerant and hypersaline environments, as hypersaline
microalgae are more likely to be successful when grown in outdoors
2. Characterization of microalgae products with the main focus in
lipids/fatty acids and carotenoids.
3. Study of the limits to the growth, biomass production and product
formation.
4. Achieving reliable cultivation of the target species under outdoor
condition.

53
Isolation and characterization of microalgae with commercial potential
Isolation and preliminary screening of potential species/strains for lipid/fatty acids
and carotenoid production
Isolation From hypersaline environments Selection from the Algae R&D culture collection, Murdoch University
Characterization of biochemical compositions focusing on lipid/FAs and
carotenoids
Study on limits to growth factors on selected species/strains in indoors
(laboratory)
Outdoor studies (i.e. long-term culture and growth optimization in outdoors)
Figure 2. The outline of the experimental approach used in this study

54
CHAPTER 2. GENERAL MATERIALS AND METHODS
2.1 Media and culture maintenance For marine algae, seawater used for media preparation was collected from
Hillary’s Beach (Perth, Western Australia) and stored in 10,000 L holding
tanks at the Algae R & D Centre at Murdoch University. Prior to use for
indoor cultures, the sea water was filtered through a filter tank filled with
stacks of charcoal and cotton. The salinity of the media was adjusted to
desired salinity before adding nutrients, trace elements and vitamins. For
outdoor culture, the seawater from a holding tank was transferred into
2200 L tanks. Sea salt was then added into the tanks to the desired
salinity before adding nutrients. For fresh water algae, deionised water
was used as the basis of the media for indoor cultures and tap water was
used for outdoor cultivation.
Several media compositions were used for culturing the different species -
F+Si medium (Guillard and Ryther 1962 ) was used for growing Amphora
sp. MUR 258 and modified CHU 13 medium (Yamaguchi et al. 1987) was
used for B. braunii.
Working solution for F+Si medium was prepared according to the recipe
shown in Table 4. Autoclaved Na2H2PO4.H2O stock and filtered vitamin
solution was added aseptically after autoclaving the medium.

55
Table 4. . Stock solution of F+Si medium
Component Stock solution Quantity per 1 L of medium
Molar concentration in
final medium NaNO3 150 g L-1 dH2O 1 mL 17.64x10⁻⁴ M Na2H2PO4.H2O 10 g L-1 dH2O 1 mL 7.24x10⁻⁵ M Na2SiO3.9H2O 60 g L-1 dH2O 1 mL 2.12x10⁻⁴ M Trace metal solution
(see recipe below) 1 mL -
Vitamin solution (see recipe below) 0.5 mL -
Trace metal solutions was prepared by firstly dissolving the EDTA in 950
mL of dH2O, followed by the iron chloride and then adding the amount of
the other components as indicated in the quantity column in Table 5 and
the final volume was brought to 1 L with distilled H2O.
Table 5. Trace metal solution of F medium
Components Primary stock solution
Quantity Molar concentration in final medium
FeCl2.6H2O - 3.15 g 1.17x10⁻⁵ M Na2EDTA.2H2O - 4.36 g 1.17x10⁻⁵ M CuSO4.5H2O 9.8 g L-1 dH2O 1 mL 3.93x10⁻⁸ M NaMoO4.2H2O 6.3 g L-1 dH2O 1 mL 2.60x10⁻⁸ M ZnSO4.7H2O 22 g L-1 dH2O 1 mL 7.65x10⁻⁸ M CoCl2.6H2O 10 g L-1 dH2O 1 mL 4.20x10⁻⁸ M MnCl2.4H2O 180 g L-1 dH2O 1 mL 9.10x10⁻⁷ M
F vitamin solution was prepared by firstly dissolving the thiamine HCl in
950 mL of dH2O and then adding the amounts of the primary stock
solutions as indicated in the quantity column in Table 6 and the final
volume was brought to 1 L with dH2O. The vitamin solution was then
filter sterilised through a 50 mm GF/C Whatman filter paper and then
stored in the fridge.

56
Table 6. The vitamin solution of F medium
Components Primary stock solution
Quantity Molar concentration in final medium
Thiamine HCl - 200 mg 2.96x10⁻⁷ M Biotin 1 g L-1 dH2O 1 mL 2.05x10⁻⁹ M Cyanocobalamin 1 g L-1 dH2O 1 mL 3.69x10⁻¹⁰ M
Modified CHU 13 medium was prepared by adding the amounts of the
stock solutions as indicated in Table 7. The pH of the media was adjusted
to 7.5 with 1 M KOH solution (5.6 g (100 mL)-1) prior to autoclaving.
Table 7. Modified CHU 13 medium
Compounds Stock solution (g.L-1)
Quantity Final concentration in the medium
(mg.L-1) KNO3 K2HPO4 CaCl2.2H2O MgSO4.7H2O
400 80 107 200
1 mL 1 mL 1 mL 1 mL
400 80 107 200
Ferric citrate Citric acid
20 100
1 mL 1 mL
20 100
Trace elements
(see recipe below)
1 mL
The trace elements stock solution was prepared by adding 0.02 g.L-1 of
CoCl2, 5.72 g.L-1 of H3BO3, 3.62 g.L-1 of MnCl2.4H2O, 0.44 g.L-1 of
ZnSO4.7H2O, 0.16 g.L-1 of CuSO4.5H2O and 0.084 g.L-1 of Na2MoO4.2H2O
into 1 L of dH2O.
Stock cultures of all species were maintained in 250 mL conical flasks
containing 100 mL of medium at growth temperature of 25±1oC
illuminated with cool white fluorescence lights that provide an irradiance

57
of 100 µmol photons.m-2.s-1 with a 12h: 12 h light: dark cycle. The stocks
were sub-cultured every 2 weeks. Amphora sp MUR 258 was also
maintained on agar plates (1% agar) which were sub-cultured every 6
months.
All glassware and polycarbonate containers used for stock cultures,
experimental cultures and media preparation were thoroughly cleaned by
soaking in Decon/bleach overnight, brushed, rinsed well with tap water
and with deionised water and then dried. All glassware used for
culturing was autoclaved prior to use.
2.2 Analytical Methods
2.2.1 Cell counting
The growth of the cultures was monitored by counting the numbers of
microalgae cells using a Neubauer haemocytometer (Moheimani et al.
2013a). About 1 mL of the culture was homogenized thoroughly using
homogenizer before loading the counting chamber.
2.2.2 Specific growth rate
The specific growth rate (µ) was calculated using the following equation:
𝝁 =𝑳𝑳 (𝑵𝟐 /𝑵𝟏 )𝒕𝟐 − 𝒕𝟏
Where N1 and N2 are the cell density at time 1 (t1) and 2 (t2) within the
exponential phase
2.2.3 Dry weight (DW) and ash free dry weight (AFDW) determination
Five mL of culture was filtered through pre-weighed and pre-combusted
Whatman GF/C, 25 mm filter paper. The filtered cells were washed with 5

58
mL of 0.65 M of ammonium formate for cultures at salinity ≤ 7% NaCl and
2.6 M of ammonium formate for cultures at salinity ≥ 7 % NaCl
(Moheimani et al., 2013). The filters were removed from the Millipore
filter apparatus, folded and patted dry with a paper towel. Then, the
filters were dried in an oven at 75oC for 5 hours. Dry weight (DW) was
determined by the following equation:
𝑫𝑫𝑫 𝒘𝒘𝒘𝒘𝒘𝒕 �𝒘.𝑳−𝟏� = (𝒘𝒘𝒘𝒘𝒘𝒕 𝒐𝒐 𝒐𝒘𝒇𝒕𝒘𝑫𝒇 𝒑𝒇𝒑𝒇 𝒂𝒇𝒘𝒂𝒘) − (𝒘𝒘𝒘𝒘𝒘𝒕 𝒐𝒐 𝒐𝒘𝒇𝒕𝒘𝑫𝒇)
The filters were then transferred to a furnace at 450oC and ashed for 5
hours. Organic dry weight (Ash-free dry weight) was calculated by the
following equation:
𝑨𝒇𝒘 − 𝒐𝑫𝒘𝒘𝒇𝑫𝑫𝒘𝒘𝒘𝒘𝒘𝒕(𝒘.𝑳−𝟏) = 𝑫𝑫𝑫𝒘𝒘𝒘𝒘𝒘𝒕 − 𝒘𝒘𝒘𝒘𝒘𝒕𝒂𝒐𝒕𝒘𝑫𝒂𝒇𝒘𝒘𝑳𝒘
2.2.4 Total protein determination
Total protein analysis was using a modified Lowry method based on
(Doresey et al. 1978). Briefly, about 5 mL of cultures was filtered through
2.5 cm Whatman GF/C filters and the saline algae were rinsed with
isotonic ammonium formate solution. The filters were folded and patted
dry and stored in the freezer for further analysis.
For extraction, the filter containing algae was put in a 4 mL glass test tube.
About 1 table spoon (5 mL) of liquid N2 was added into the tube and left
for 30 minutes. Then, the filter was crushed with a glass rod. About 1 mL
of Biuret reagent (Table 8) was added into the test tube and mixed well
with the glass rod before transferring into a 10 mL centrifuge tube.
Another 1 mL of Biuret reagent was added into the test tube to clean all
the remaining cell debris and then transferred it into the centrifuge tube
before toping up to 5 mL with another 3 mL of biuret reagent. Another 5

59
mL of Biuret reagent was added into each centrifuge tube. The samples
and the protein standard were put in a water bath at 100oC for 60 minutes.
After removing the centrifuge tubes from the water bath, about 0.5 mL of
the folin-phenol reagent was added immediately while mixing in a vortex
stirrer. The samples and the protein standard were then placed in a cold
water bath (10-15oC) for about 20 minutes to cool them and then
equilibrated them to room temperature for another 15 minutes before
centrifugation at 1107xg for 10 minutes. The supernatant was carefully
transferred into a clean tube before reading the absorbance at 660 nm. The
protein content was determined using the standard curve from protein
standard using the equation below:
𝑷𝑫𝒐𝒕𝒘𝒘𝑳𝑷𝒐𝑳𝒕𝒘𝑳𝒕(𝒎𝒘.𝑳−𝟏) =𝑷𝑫𝒐𝒕𝒘𝒘𝑳𝑷𝒂𝒇𝒑𝒘𝒐𝑫𝒐𝒎𝒇𝒕𝒂𝑳𝒇𝒂𝑫𝒇𝑷𝒑𝑫𝑷𝒘𝑷𝒐𝒇𝒑𝒎𝒘𝒘𝒗𝒕𝑫𝒂𝑷𝒕 × 𝑷𝒑𝒇𝒕𝒑𝑫𝒘𝑷𝒐𝒇𝒑𝒎𝒘
Table 8. Reagents used for protein analysis
Components Concentration (g L-1 dH2O)
Quantity (mL)
Protein standard (Bovine serum albumin fraction V)
2.5 100
Biuret reagent Na2CO3 NaOH NaK tartrate CuSO4.4H2O dH2O
- 200 40 200 50 -
612 60 60 6 6
480 Folin-phenol reagent Folin-phenol dH2O
- - -
50 25 25
Note: the biuret reagent was prepared by adding the Na2CO3 and NaOH
together with dH2O, well mixing before adding NaK tartrate solution and
CuSO4 solution

60
The protein standard curve (Table 9) was prepared in triplicate for each
protein concentration in a 10 mL centrifuge tube from the protein stock
solution.
Table 9. Set of the protein standard curve samples
Protein (µg) 0 50 100 150 200 250 300 350 BSA V* (mL) 0.00 0.02 0.04 0.06 0.08 0.10 0.12 0.14 dH2O (mL) 0.14 0.12 0.10 0.08 0.06 0.04 0.02 0.00 Biuret reagent (mL) 5 5 5 5 5 5 5 5
* Bovine Serum Albumin Fraction V
2.2.5 Total carbohydrate determination
Total carbohydrate analysis measured by the phenol-sulphuric acid based
on method of Kochert (1978) as modified by Ben-Amotz et al. (1985) and
updated by (Mercz 1994). Reagents used for carbohydrate analysis was
freshly prepared including glucose standard stock solution (40 mg glucose
(40 mL)-1), glucose standard (1 mg glucose (10 mL)-1), phenol stock
solution (5 g (100 mL)-1), 1 M H2SO4 (AR grade) and concentrated H2SO4
(AR grade).
Briefly, 5 mL of culture was filtered through 2.5 cm Whatman GF/C filters
and then saline microalgae were rinsed with isotonic ammonium formate
solution. The filters were folded and patted dry and stored in the freezer
for further analysis.
For extraction, the filter containing algae was put in a 4 mL glass test tube.
About 1 table spoon of liquid N2 was added into the tube and leaved for
30 minutes. Then, the filter was crushed with a glass rod. About 1 mL of
1 M H2SO4 was added to homogenise the sample which was then
transferred into a plastic centrifuge tube with screw cap. Another 1 mL of

61
1 M H2SO4 was added into the glass tube to wash and clean all the
remaining cell debris then transferred in the centrifuge tube. The
centrifuge tube was topped up to 5 mL by adding another 3 mL of 1 M
H2SO4. The lid of the centrifuge tube was tightly screwed on to prevent
solvent vapour loss then the tube was incubated in a water bath at 100oC
for 60 min. The samples were then cooled to room temperature (approx.
30 min) and centrifuged at 1107xg for 10 min. Two mL of the supernatant
was transferred into a clean acid-resistant plastic test tube. 1 mL of 5%
(w/v) phenol solution was added and rapidly mixed with a vortex. Then,
5 mL of concentrated H2SO4 was added, and then shaken 3 times by hand.
The samples were let to cool at room temperature for about 30 minutes
and then shaken again 3 times manually before the absorbance was read at
485 nm.
The carbohydrate content was calculated from the standard curve using
the following equation:
𝑪𝒂𝑫𝒃𝒐𝒘𝑫𝒇𝑫𝒂𝒕𝒘 𝑷𝒐𝑳𝒕𝒘𝑳𝒕(𝒎𝒘.𝑳−𝟏) =𝑷𝒂𝑫𝒃𝒐𝒘𝑫𝒇𝑫𝒂𝒕𝒘𝑷𝒂𝒇𝒑𝒘𝒐𝑫𝒐𝒎𝒇𝒕𝒂𝑳𝒇𝒂𝑫𝒇𝑷𝒑𝑫𝑷𝒘
𝑷𝒐𝒇𝒑𝒎𝒘𝒘𝒗𝒕𝑫𝒂𝑷𝒕 × 𝑷𝒑𝒇𝒕𝒑𝑫𝒘𝑷𝒐𝒇𝒑𝒎𝒘
The glucose standard curve (Table10) was prepared by preparing a set of
tubes containing 0, 40, 80, 120, 160 and 200 µg glucose as standards and
then topped up to 2 mL with dH2O. The standards were the analysed in
the same way as the samples.
Table 10. Set of the glucose standard curve samples
Final glucose amount (µg) 0 40 80 120 160 200 Standard solution (mL) 0 0.4 0.8 1.2 1.6 2.0 dH2O (mL) 2 1.6 1.2 0.8 0.4 0

62
2.2.6 Lipid Extraction
Lipid extraction was performed following the method of Bligh and Dyer
(1959) as modified by Kates and Volcani (1966), adapted by (Mercz 1994).
Five mL of cultures was filtered through Whatman GF/C, 25 mm filters.
Filters were removed, folded and patted dry with paper towel then stored
in a freezer for further analysis.
The filters containing cells were put in 4 mL glass test tubes. About 1 table
spoon of liquid N2 was added into each tube and left for 30 minutes. The
cells were then crushed with a glass rod until a smooth green paste of
about 0.5 mL was obtained. One mL of solvent mixture (methanol:
chloroform: DI water in the ratio of 2:1:0.8 v/v/v) was added into the tubes,
mixed well with the glass rod and then transferred into a plastic centrifuge
tube with screw cap. Another 1 mL of the solvent mixture was added into
the glass tube to wash and clean all the remaining cells debris then
transferred in the centrifuge tube. An extra 3.7 mL of the solvent mixture
was added. The cap was then tightly screwed to prevent solvent vapour
loss and the sample was centrifuged at 1107xg for 10 minutes. After
centrifugation, the supernatant was transferred to a 20 mL glass tube with
screw cap. For the second extraction, 5.7 mL of the solvent mixture were
added to pellet in the centrifuge tube, vortexed to re-suspend the pellet
and then centrifuged again at 1107xg for 10 minutes. The supernatants
were combined in the 20 mL glass tube. Three mL of DI water and 3 mL
of chloroform were added to the 20 mL tubes and mixed well by
vortexing. The samples were then stored in the fridge undisturbed for 24
h for complete phase separation. After phase separation the upper layer
was removed carefully with a very fine Pasteur pipette connected to a
syringe and discarded. About 6-8 drops of toluene were added to the

63
chloroform layer containing the lipids, shaken by hand and then
transferred to a dry and pre-weighed 10 mL vial. Any residual traces of
water floating on the chloroform layer were removed using a very fine
Pasteur pipette. The solvents were evaporated under a stream of pure N2
gas on heating plates at 38oC until complete dryness. After complete
evaporation, the vials containing lipids were carefully weight using
analytical balance (Mettler Toledo AB135-S). Weight of lipids was
calculated by subtracting the weight of vials containing lipids with the
weight of the vials.
2.2.7 Fatty acid analysis
Lipid samples extracted using the Bligh and Dyer method were used for
fatty acid analysis following the method adapted from Christie (1989).
Briefly, 1 mL of toluene was added to the lipid sample before adding 2 mL
of 1.5% sulphuric acid in methanol. The samples were then incubated in a
water bath at 50oC overnight. After incubation, about 5 mL of 5% NaCl in
deionised water was added to the sample to dissolve water soluble
compounds. The top organic phase was transferred into a clean vial and
the bottom aqueous phase was washed twice with 5 mL of hexane. The
organic phase and the two hexane washes were combined in the vial then
washed with 4 mL of 2% NaHCO3 in deionised water. The top layer was
then transferred into a clean and dry vial. The samples were evaporated
under nitrogen gas at 38oC until the sample volume was about 300 µL.
The sample was then transferred into a smaller insert ready for analysis
using gas chromatography.
Fatty acid components were analysed with a Varian CP3800 Gas
Chromatograph. The instrument was equipped with a split/split less

64
injector and a Flame Ionisation Detector (FID) with analysis performed
using an Agilent VF-5MS (30m, 0.32mm ID) fused silica column coated
with a 0.1 µm film of phenyl. Samples (1 µL) were injected via a split/split
less (5:1) injector held at 280°C. The oven temperature was initially held at
80°C then heated at 7°C min-1 until 310°C and held isothermally for 3
minutes. The carrier gas was hydrogen at 1.2 mL.min-1 and the detector
was held at 280°C with a hydrogen flow rate of 30 mL.min-1 and air flow
rate of 300mL.min-1. The total run time was 35.86 min. The fatty acid
profile was determined by dividing the area of the fatty acid of interest by
the sum of all fatty acid areas present in the sample. All analyses were
done in duplicate.
FAME identification was performed on a HP 6890 GC-MS using the same
column and conditions as outlined above. Component identification was
by residence time and MS data. A handful of samples (60 µL) were spiked
with alkane mix (5 µL dodecane, pentadecane, nonadecane, docosane,
octacosane, and dotriacontane) to calculate the Kovats Retention Index
(KRI) of the FAMES identified on the GC-MS. The KRI was then used to
identify the residence time of the FAMES in the GC-FID data.
2.2.8 Observation of neutral lipids with Nile red
Five µl of Nile Red stock (1 mg mL-1 acetone) were added to 5 mL cell
suspension and gently mixed (Greenspan et al. 1985). Samples were
observed after 5 minutes staining using an Olympus fluorescence
microscope at 475 nm excitation wave length.
2.2.9 Chlorophyll determination
Chlorophyll concentration determined using the method of Jeffrey and
Humphrey (1975). 5 mL of the cultures was filtered through GF/C

65
(Whatman) filters. The filters were folded with algae side inwards and
patted dry with paper towel. The samples could be stored in a freezer for
further analysis. For extraction, the filters containing cells were put in 4
mL glass test tubes. About 1 table spoon of liquid N2 was added into each
of the tube and incubated for 30 minutes. The cells were then crushed
with a glass rod until a smooth paste of about 0.5 mL was obtained. One
mL of 90% cold acetone was added into the tube, mixed well with the
glass rod then poured into a centrifuge tube. Another 1 mL of the cold
acetone was added to clean the vial then poured into the tube. Another 2
mL of the cold acetone was added into the tube to make up 4 mL extract.
The samples were then centrifuged for 10 minutes at 1107xg. The
supernatant was transferred into a clean centrifuge tube. For the second
extraction, about 2 mL of 90% of cold acetone was added into each tube,
vortexed and then centrifuged again at 1107xg for 10 minutes. The
supernatant was combined with the supernatant from the first extraction
giving the final extract volume of about 6 mL. The volume of the
supernatant was measured before measuring absorbance at 664 and 647
nm using the UV spectrophotometer (UV-1601 Visible spectrophotometer,
Shimadzu).
As general precautions, all the processes were performed under dim light
as pigments are easily bleached by lights. The pigment extracts and the
solvent were kept in an ice-bath at all times to prevent pigment
breakdown. A pinch of MgCO3 was added to the acetone to remove any
traces of acids from the algae or from the glassware as the acids remove
the Mg2+ from chlorophylls, forming phaeophytin (Moheimani et al.
2013a).

66
The concentrations of chlorophylls a and b for green algae were calculated
using the following equations (Jeffrey and Humphrey 1975):
𝑪𝒘𝒇𝒐𝑫𝒐𝒑𝒘𝑫𝒇𝒇𝒂(𝝁𝒘.𝒎𝑳−𝟏) = 𝟏𝟏.𝟗𝟗 𝑨𝟔𝟔𝟔 − 𝟏.𝟗𝟗 𝑨𝟔𝟔𝟔
𝑪𝒘𝒇𝒐𝑫𝒐𝒑𝒘𝑫𝒇𝒇𝒃(𝝁𝒘.𝒎𝑳−𝟏) = 𝟐𝟐.𝟗𝟔 𝑨𝟔𝟔𝟔 − 𝟓.𝟓𝟐 𝑨𝟔𝟔𝟔
2.2.10 Phycobilin determination
Phycobilin extraction was performed following the lab standard method
of phycobilin determination modified by Borowitzka (1995). Five mL of
cultures of the coccoid red alga were filtered through Whatman GF/C, 25
mm filter papers secured in a Millipore filter apparatus. Filters were
removed, folded and patted dry with paper towel then put into the glass
vials or stored in a freezer for further analysis. One tablespoon of liquid
Nitrogen was added into the vials then left for about 30 minutes. The cells
were then crushed with a glass rod before extracted with 2 mL of 0.2 M
cold 0.1 M phosphate buffer (pH 6.8). Samples were frozen overnight and
repeatedly thawing and freezing (3x) to enhance extractability. The
samples were then centrifuged at 1107xg for 10 minutes. Carefully the
supernatant was transferred into clean tubes and made up to known
volume with the buffer. 1 mL of the sample were put into
thequartzcuvette and read the absorbance at the appropriate wavelengths
(scanning range 350-700 nm) using a spectrophotometer.
The pigment concentration was calculated from the following equation
(results in mg.mL-1) (MacColl and Guard-Friar 1987) :
Blue-green algae/Cyanobacteria
C-Phycoerythrin = 0.00251 A650 – 0.0321 A620 + 0.0787 A565
C-Phycocyanin = -0.0911 A650 + 0.166 A620

67
Allophycocyanin= 0.159 A650 – 0.0410 A620
2.3 Data Analysis
All indoor experiments were done in at least duplicates. Significant
differences between treatments (temperatures and salinities, nitrogen
sources and N:P ratios) were analysed with a one-way analysis of variance
(ANOVA). When normality and equal variance test failed, the Holm-
Sidak pairwise comparison method based on ranks was applied. All
statistical analyses were performed using Sigma-Plot 12.5 package.
For outdoor experiments, significant differences between treatments
(different depths, heated and heated, continuous and intermittent mixing)
were analysed with Wilcoxon signed-ranks test using SPSS 22.

68
CHAPTER 3. ISOLATION, PRELIMINARY SCREENING AND SELECTION OF SPECIES
3.1 Introduction
Species and strain selection is the first and most important aspect in bio-
prospecting of microalgae for any commercial application (Borowitzka
2013c). The search for algae species with potential commercial application
was not focussed on any particular final product, although high-value
products such as long-chain polyunsaturated fatty acids and carotenoids
were of particular interest. New species with potential for biofuel
production were also considered potentially interesting. Species capable
of growth in a hypersaline environment were considered particularly
attractive due to the fact these species are more likely to succeed when
grown in outdoors. Three potential target species were initially identified;
(1) a contaminant in a Tetraselmis sp. pond culture in Adelaide (salinity
7.8% NaCl). The purpose of the Tetraselmis culture was for biofuels and
high value products production. (2) a contaminant from a Dunaliella salina
pond culture in Perth (salinity 14% NaCl). The purpose of the Dunaliella
salina culture was for a research project. (3) a contaminant from an
Amphora sp. pond culture in Perth (salinity 12% NaCl). The Amphora sp.
MUR 258 was cultured for research purposes. These algae were
interesting due to their ability to grow at hypersaline environments and
their ability to contaminate and take over well-established cultures.
The main aim of this chapter was to isolate and screen potential
species/strains for the production of high value products, focusing on
lipid/fatty acids and carotenoids and their potential for mass cultivation in
outdoors open systems.

69
3.2 Materials and methods
3.2.1 Isolation of the Adelaide sample (Tetraselmis contaminant)
This alga was chosen due to its red colour and its ability to grow well in
outdoors in a hypersaline environment at 7.8% NaCl. The algal species
were isolated using the agar plating technique (Andersen and Kawachi
2005) using F, 2Fand 2Fe with 2xFe agar medium at salinity 7.8 and 9%
NaCl. The reason for adding extra nutrients and Fe was because the
contaminant had appeared in these cultures after inadvertent addition of
excess nutrients and Fe.
Agar medium was prepared by adding 1% of agar into the liquid medium
prior to autoclaving. After autoclaving, the medium was let to cool for
about 30 minutes or until it warmed enough to hold. Then, vitamins and
phosphate were added into the autoclaved medium under aseptic
condition and gently mixed by hand. Immediately, the medium was
poured into petri dishes (9 mm diameter) of about 20 mL or 3/4 of the
plate volume.
About 0.1 mL of sample was spotted on the middle of the agar plates and
spread evenly on the surface using L-shaped glass spreader. The plates
were labelled and sealed with parafilm to avoid drying out. The plates
were then incubated in the culture room at 25±1oC, under dim light with
12 h light and 12 h dark cycle.
Colonies that emerged on the agar plates were picked up and re-streaked
onto fresh agar medium using standard microbiology agar streaking
technique. Pure unialgal colonies were obtained after repeated streaking
on fresh agar media and confirmed by microscopic observation.

70
Following successful establishment of the pure colonies, liquid cultures
were gradually prepared by inoculating a single colony into each well of
the 24-wells microtiter plate containing 2 mL of the specified medium.
From the microtiter plate, cultures were then gradually scaled up to 10
mL, 50 mL, 100 mL, and 250 mL and to 1L.
3.2.2 Isolation of the Perth sample 1 (Dunaliella contaminant)
This was a pennate diatom that contaminated and took over a culture of
Dunaliella salina cultivated in 10m2 paddle wheel driven race way pond at
the Algae R & D Centre at Murdoch University, Western Australia. The
salinity of this culture was 14% NaCl. Agar plating technique was also
used for the isolation of this alga. The sample was plated on F +Si agar
medium at 3 different salinities (10, 12 and 15% NaCl).
3.2.3 Isolation of the Perth sample 2 (Amphora contaminant)
This was a pennate diatom that contaminated Amphora sp. MUR 258
cultures in a 1m2 raceway pond at the Algae R & D Centre at Murdoch
University during winter months with the salinity around 12% NaCl.
Similar to the previous alga, this alga was also plated on F+Si agar media
at salinity 7, 12 and 15% NaCl.
3.2.4 Identification of the algae
Identification of the target species was based on pigmentation,
morphology (coccoid, filamentous), size, the presence or absence of
flagella/cell organelles and other distinctive features (Kumar 1990; John
2012a, b).

71
3.3 Results
3.3.1 Isolation and identification of Adelaide sample
Isolation of this alga took some time before unialgal colonies were
successfully established. After two weeks plating on agar, some red and
green colonies emerged on all plates. It was difficult to find clear red
colonies as they were all mixed up/contaminated with the green ones.
Under the microscope, it was observed that the green colonies were
Tetraselmis sp and the red colonies were the target species. More red
colonies appeared on the plate containing 2F with two times iron
concentration medium. Unialgal colonies were successfully established
after repeated streaking on the fresh agar 2F with 2x iron concentration
medium at 7% salinity.
Microscopic observation revealed that this alga is a coccoid alga with
reddish/purple colour sized about 5-10 µm. It was identified as a
cyanobacterium due to its small size, the absence of the cell organelles and
its pigmentation (Figure3).
Figure 3. Photomicrograph of the coccoid red cyanobacterium

72
This species originally was interesting due to the red colour of the cells
which was assumed as being due to possible high value carotenoids (i.e.
β-carotene, astaxanthin etc.). However, as the alga appeared to be a
cyanobacterium which produce phycobilins rather than significant
amounts of carotenoids (Heocha 1962; Mulders et al. 2014), phycobilin
determination was then carried out (Table 11). This analysis confirmed
that the water soluble pigments responsible for the red/purple colours was
c-phycoerythrin which has the absorption maxima at 550 nm (Rowan
1989). Moreover, this alga grew slowly and tended to adhere strongly to
the glass surface. Therefore, this alga was considered unsuitable for
further study. There may be potential to grow this alga in biofilm for
phycoerythrin production. However, further studies will be required.
Table 11. The absoption spectra of the phycobilin pigment of the coccoid red
Wave length
(nm) Absorbance reading Average
Absorbance 1 2 3 400 0.0297 0.0281 0.0383 0.0320 450 0.0255 0.022 0.0291 0.0255 500 0.0276 0.0247 0.033 0.0284 550 0.0356 0.0341 0.0463 0.0387 600 0.0168 0.0135 0.0179 0.0161 650 0.0125 0.0089 0.0122 0.0112 700 0.0121 0.0061 0.0095 0.0092
3.3.2 Isolation and identification of the Perth Dunaliella culture
contaminant
After two weeks of inoculation, some colonies appeared on agar plates at
10% salinity. Colonies emerged on agar plates at 12% and 15% NaCl a few
days later. Visually, all colonies on the plates at 10 and 12% NaCl were

73
brown in colour and the ones at 15% were only green colonies.
Microscopic observation revealed that the brown colonies were the target
species, a pennate diatom, and the green ones were Dunaliella salina. The
diatom colonies were repeatedly plated on fresh agar medium at 10 and
12% salinity in order to establish the unialgal colonies.
Microscopic observation showed that this diatom is a small pennate
diatom with a bilaterally asymmetrical valve, sized about 15-20 µm in
length and about 4-6 µm in width (Figure 4). It is believed to belong to
the Cymbella group characterized by asymmetrical valves (John 2012a).
Within Cymbelloids group, there are two genera; Cymbella and Amphora.
The two genera are difficult to differentiate morphologically. Whilst
Cymbella is a fresh water genus, Amphora species have a wide
distribution, from fresh water to sea water and even at very high salinity
up to 100 ppt or 10% NaCl (Jacob John, personal communication 2014).
The fact that this diatom grew at very high salinity, means that it could not
be Cymbella, but must be an Amphora sp characterized by a smooth, arched
valve on the dorsal side with almost straight to slightly concave ventral
margin. This alga was therefore identified as Amphora sp. MUR 258.
Figure 4. Photomicrograph of the diatom, Amphora sp. MUR 258

74
Prior to the establishment of the monoalgal culture and in order to obtain
a rough idea about biochemical composition of this diatom, samples from
the outdoor pond which was dominated by the diatom with very minor
contamination by the Dunaliella sp (2%) were taken for determination of
the total lipids, protein and carbohydrate. The results showed that the
diatom contained predominantly lipids up to 61% of AFDW, followed by
protein up to 26% of AFDW and carbohydrate up to 11% of AFDW
(Figure 5).
Figure 5. Biochemical composition of samples from the original pond culture consisting mainly of Amphora sp MUR 258. Values represent mean±range (n=3)

75
3.3.3 Isolation and identification of the Perth Amphora contaminant
sample
This diatom grew well in F+Si agar media. After about three weeks of
inoculation on the agar plates, some brown colonies appeared on all plates
at 7, 12 and 15% NaCl salinity. The colonies on the agar plate at 7%
salinity contained not only the target species but also the Amphora sp.
colonies. The colonies on the agar plates at 12% salinity were mainly the
target species, with a few colonies of Amphora sp., and at 15% salinity, all
colonies were the target species. It is important to note that this diatom
grew very well at 15% salinity compared to 7 and 12% NaCl.
Microscopic observation revealed that this alga is a pennate diatom sized
about 20-30 µm in length and about 6-8 µm in width having bilaterally
symmetrical valve (Figure 6). Nile Red staining of the cells showed some
globules stained in yellow indicating the presence of the lipid bodies
(Figure 6C).
Figure 6. Navicula sp (Bacillariophyceae) under microscope; Bright field (A & B) Nile Red staining (C). The scale mark applies to all pictures

76
This is a potential strain to be developed in outdoors at hypersaline
conditions (7-15% NaCl) and at low temperature due to the fact that this
alga flourished during winter months and gradually disappeared towards
summer. Moreover, Nile Red staining showed the presence of some lipid
globules making it potential for exploitation as lipid/PUFA producer.
3.4 Discussion and Conclusion
This study focused on bio-prospecting for new microalgae species with
potential for commercial applications, especially as sources of lipid/fatty
acids or carotenoids. As pointed out by Borowitzka (2013c), species and
strain selection are the first and critical step in bio-prospecting of
microalgae species for producing targeted compounds in a reliable and
commercially viable process. Furthermore, for the success of any
commercial microalgal process, the chosen species should be able to
demonstrate high productivity of the product of interest when grown in
the preferred culture system (i.e. raceway pond).
The screening strategy employed in this study was based on isolating
microalgae from extreme environments particularly hypersaline
environment and focused on the targeted products (lipid/fatty acids and
carotenoids). Hypersaline environments are unique environments that
can keep out most other microalgae strains and many zooplankton and
protozoan grazers of microalgae so that monoalgal culture can be possibly
maintained outdoors for long periods (Barclay and Apt 2013); this is one
of the important factors contribute to the successful establishment of
commercial cultivation of Dunaliella salina that grow at hypersaline
condition (>2M NaCl = 30% NaCl).

77
Out of three potential species isolated, I decided to only focus on the
Amphora sp. MUR 258 in the next stage of this study, due to its high lipid
content, the higher temperature tolerance than the other diatom isolated,
and also its potential to be developed for outdoor culture due to its ability
to take over D. salina culture at hypersaline conditions. The coccoid red
cyanobacterium was interesting, but as the focus was on lipids/fatty acids
and carotenoids production and not on phycobilins. Also, the slow
growth and the stickiness of the coccoid cyanobacterium made it
unsuitable for further study. With the Navicula sp, this alga seems
promising for bioprospecting for lipid/PUFAs production, but time
limitation precluded further work. Therefore, the Amphora sp. MUR 258
was selected for further detailed study of its potential for lipids/fatty acids
production.

78
CHAPTER 4. AMPHORA SP. MUR 258 – A LIPID PRODUCER
4.1 Introduction The high lipid content and the ability of the Amphora sp. MUR 258 to take
over a culture of Dunaliella salina in a 10m2 raceway pond could potentially
make this species a - candidate for lipid/PUFAs production in outdoor
open pond system i.e. raceway ponds. However, as a newly isolated
species, there was no information available regarding limits to growth
factors of the Amphora sp. MUR 258. Therefore, the main aims of the
experiments described in this chapter were to determine limits to growth
factors, lipid and fatty acids composition of the Amphora sp. MUR 258
under various growth conditions indoors and to investigate the reliability
and performance of the Amphora sp. MUR 258 grown in 1 m2 outdoor
paddle wheel driven raceway pond for long periods.
4.2 Materials and methods
4.2.1 Indoor Studies
4.2.1.1 Effects of different temperatures and salinities on the growth of
Amphora sp. MUR 258
Before the establishment of the monoculture, a preliminary experiment
was conducted to evaluate the optimum salinity and temperature for
growth. The mixed culture from the outdoor pond containing
predominantly Amphora (about 98%) with minor presence of D. salina and
Tetraselmis was used as the inoculum. The cultures were grown under
different temperatures (20±1oC, 25±1oC and 35±1oC) and salinities (6, 9 and
12% NaCl) in 250 mL Erlenmeyer flasks containing 150 mL of F+Si
medium and illuminated with fluorescent lamps at light intensity of 65±5
µmol photons.m-2.s-1 with a 12 h light: 12 h dark cycle. The initial Amphora
cell density was about 10x104 cells.mL-1. The cultures were mixed

79
manually by hand twice a day (morning and afternoon) to re-suspend the
cells and to avoid clumping. The experiment was run in batch mode for
about 4 weeks. Sampling for cell counting and DW/AFDW were carried
out every two days.
The experiment was then repeated upon the establishment of the
monoculture. The cultures were grown in 500 mL Schott bottles
containing 300 mL of F+Si medium at three different salinities (7, 9 and
12%) and two different temperatures (25±1oC and 35oC) under the same
light: dark cycle (12 h:12 h) and irradiance (65±5 µmol photons.m-2.s-1)in
triplicates. The initial cell concentration was 10x104cells.mL-1 and the
culture was grown in batch mode for two weeks. To make sure that the
cultures were receiving the same amount of light, the culture flasks were
rotated randomly every day according to a random number table. Cell
counting was carried out every two days, whereas dry weight (DW) and
ash free dry weight (AFDW) were measured on day 2 (logarithmic phase)
and day 9 (early stationary phase).
4.2.1.2 Effects of different nitrogen and phosphorous ratios on the
growth of Amphora sp. MUR 258
To study the effects of various nitrogen to phosphorous ratios on the
growth of the Amphora sp. MUR 258, four different N:P molar ratios were
tested (1N:1P, 2N:1P, 3N:1P and 1N:2P). 1N:1P ratio was defined as the
ratio in the original F+Si medium. The cultures were grown at 10%
salinity at 25±1oC. Light cycle and light intensity were as in the previous
study (section 4.2.1.1). The culture was grown in batch mode for two
weeks starting at an initial cell concentration of 10x104 cells.mL-1 and in
duplicates. The cultures were continuously mixed using a shaker set at

80
100 rpm and culture flasks were rotated randomly every day to minimise
any small differences in irradiance.
4.2.1.3 Effects of different nitrogen sources on the growth of Amphora
sp.MUR 258
This experiment was carried out using F+Si medium with different
nitrogen sources (NH4NO3, NH4Cl, NaNO3 and urea). They were
incorporated in the culture medium at the same nitrogen concentrations
(molar ratio of “N”) as in the original F+Si medium. The cultures were
grown in 250 mL conical flasks with a working volume of 150 mL culture
medium at the same salinity, temperature, light cycle and light intensity as
in the previous experiment (Section 4.2.1.1). The cultures grown on
different N sources were not buffered. The experiment was carried out for
two weeks in batch mode with an initial cell concentration of 10x104
cells.mL-1 in duplicates. The cultures were continuously mixed using a
shaker set at 100 rpm and the culture flasks were randomly rotated every
day.
4.2.2 Outdoor Studies
All outdoor trials were conducted using 1m2 raceway ponds at a paddle
wheel speed of about 28 rpm generating an average flow rate of 20 cm.s-1.
The growth of the cultures was monitored by cell counting every second
day using a Neubauer haemocytometer (Section 2.2.1). Samples for
DW/AFDW (Section 2.2.3) and total lipids (Section 2.2.6) were taken prior
to each harvesting (dilution).

81
4.2.2.1 The long-term culture of Amphora sp. MUR 258 in a 1m2
outdoor raceway pond
Inoculum cultures were prepared in indoor using 2 x 20 L and 1 x 10 L
carboys. They were cultured at the same growth condition (temperature,
salinity and light and dark cycle) as the previous experiments (Section
4.2.1) but with much higher light intensity (200-250 µmol photons.m-2.s-1).
These cultures were then used as inoculum for the outdoor cultivation
giving an initial cell concentration of about 20x104 cells.mL-1.
The outdoor culture was conducted at the Algae R & D Centre at Murdoch
University using 1 m2 fibreglass paddle wheel-driven raceway pond at 15
– 20 cm depth. Natural seawater adjusted to 10% NaCl salinity by the
addition of NaCl and enriched with nitrate, phosphate, silicate and iron
concentration as for the F+Si medium. The culture was initially operated
in a batch mode. As the culture reached stationary phase, a semi-
continuous regime was initiated by harvesting a certain amount of the
culture and replacing the harvested volume with the same amount of
fresh medium. The culture was run for about 13 months.
Air temperature, rainfall and irradiance data were obtained from the
Bureau of Meteorology of Western Australia.
4.2.2.2 Effects of different pond depth on the growth of Amphora sp.
MUR 258
The experiment was carried using 1m2 paddle-wheel driven raceway
ponds at 15 cm and 20 cm depth. The culture from the outdoor pond
(section 4.2.2.1) was used to inoculate the ponds at initial cell
concentrations of 50x104 cells.mL-1. Both ponds were run under identical
conditions, except for the depth, for three weeks under semi-continuous

82
regimes. Salinity was maintained at 11±1% NaCl. Salinity was adjusted at
that range by topping up with tap water to replace evaporated water or
adding more salt when diluted.
4.2.2.3 Effect of un-heated and heated pond on the growth of Amphora
sp. MUR 258
This experiment was carried out in order to study the effects of
temperature, especially morning temperature, on the algae. One pond
was heated with an aquarium heater set at 28oC whereas the other pond
was left unheated. The cultures were operated at 15 cm depth and at
salinity 11±1% run for about 4 weeks under semi-continuous culture
mode.
4.2.2.4 Effect of daytime only mixing and continuous mixing on the
growth of Amphora sp. MUR 258
This experiment was carried out to study the effect of continuous mixing
and daytime only mixing on the growth of the alga. Two 1m2 raceway
ponds were used. One pond was continuously mixed for 24 h and the
other pond was only mixed during the day. The paddle wheel was turned
off in the afternoon at around 6 pm and it was turned on again in the
following morning at around 8 am. The cultures were maintained in
semicontinuous culture mode, at the same depth 15 cm, salinity 11±1%
NaCl for 4 weeks

83
4.3 Results
4.3.1 Indoor studies
4.3.1.1 Effects of different temperature and salinity on the growth, lipid
and fatty acid composition of Amphora sp. MUR 258
Growth
The preliminary experiment showed that the Amphora sp. MUR 258 grew
well at all temperatures (20±1oC, 25±1oC and 35±1oC) and salinities (6, 9
and 12% NaCl) tested. The highest maximum cell density (291x104
cells.mL-1) was obtained from the cultures grown at 9% salinity and 35oC,
whereas the lowest maximum cell density (102.5x10⁴ cells.mL-1) was
achieved at the lowest salinity and temperature (6% and 20oC). It is
interesting to note that the cell numbers of the cultures at 9% and 35oC and
the ones at 12% and 25oC continued to increase towards the end of the
culture period. In contrast, all cultures grown at 6% salinity reached their
maximum cell density early on day 9 and then the cell number decreased
until the culture was terminated on day 19 due to heavy contamination
with Tetraselmis sp (about 30% of total cells). Although the cultures were
contaminated with other algae (Tetraselmis sp and Navicula sp), none of
these was able to take over the Amphora cultures over the three weeks of
culturing and the presence of protozoans was not an issue since they did
not feed on the diatom.
The specific growth rate of the Amphora sp. MUR 258 was not affected by
the temperatures and salinities tested (One Way ANOVA, P> 0.05). The
average specific growth rate ranged from 0.33 d-1 (cultures at 6% salinity
and 20oC) to 0.41 d-1 (cultures at 9% salinity and 35oC) (Figure 7).
Similarly, the biomass productivity was not affected by the temperature
and salinity tested (One Way ANOVA, P> 0.05). The average biomass

84
productivity ranged from 0.063 g.L-1.d-1 obtained at 12% salinity and 20oC
to 0.088 g.L-1.d-1 achieved at 9% salinity and 25oC (Figure 7).
Figure 7. Growth curves (top panel), specific growth rates (centre panel), and biomass productivities (bottom panel) of Amphora sp. MUR 258 (preliminary study) grown under different temperatures (20, 25 and 35oC) and salinities (6% NaCl (circle), 9% NaCl (triangle) and 12% NaCl (square). Values represent mean ± range (n=3). There is no significant difference in the specific growth rate and biomass productivity between treatments (One Way ANOVA, P> 0.05)

85
After the establishment of the monoculture, the experiment was repeated.
The growth of Amphora sp. MUR 258 cultured at 25±1oC and 35±1oC and
various salinities (7, 9 and 12% w/v NaCl) was tested (Figure 8). In all
culture conditions tested, no lag phases were observed following initial
inoculation, showing that the cells were well adapted to their new
environments. Amphora sp. MUR 258 showed positive growth in the first
week of culturing except for the cultures grown at 9% salinity and 25°C
and at 12% salinity and 35oC which showed negative/no growth after
reaching their maximum cell density on day 4. All the cultures grown at
the higher temperature (35oC) grew rapidly in the first 2 days, reaching
their maximum cell density at around 39-41x104 cells.mL-1 by day 6, except
for the cultures grown at 12% salinity and 35oC which reached maximum
cell density (32x104 cells.mL-1) by day 4. It is important to note that the
cultures grown at 9% salinity and 25oC reached their maximum cell
density (41x104 cells.mL-1) two days earlier than the other cultures.
There was no significant difference in the specific growth among different
treatments (One Way ANOVA, P> 0.05). The average specific growth rate
ranged from 0.29 d-1 (12% salinity and 25oC) to 0.35 d-1 (9% salinity and
25oC) (Figure 8).
The biomass yield (g.L-1) of Amphora was not affected over the temperature
and salinity ranges tested (One Way ANOVA, p > 0.05). However, cell
weight (pg) was significantly affected by temperature and salinity (Holm-
Sidak, P < 0.05). The highest cell weight (AFDW) at exponential phase
was achieved by the cultures grown at 9% salinity and 25oC, and the
lowest cell weight was at 6% salinity and 35oC (Figure 9). At stationary
phase, the cultures grown at 12% salinity and 35oC had the highest cell
weight and the ones cultured at 9% salinity and 25oC had the lowest

86
(Holm-Sidak, P<0.05). It is important to note that the biomass per cell at
12% and 35oC increased by nearly two fold at stationary phase (Figure 9).
Figure 8. Growth curves (top panel) and specific growth rates (bottom panel) of Amphora sp MUR 258 growing under different temperatures (25 and 35oC) and salinities (6% NaCl (circle), 9% NaCl (triangle), 12% NaCl (square). Values represent mean±range (n=3). There is no significant difference in the specific growth rate between different treatments (One Way ANOVA, p > 0.05)
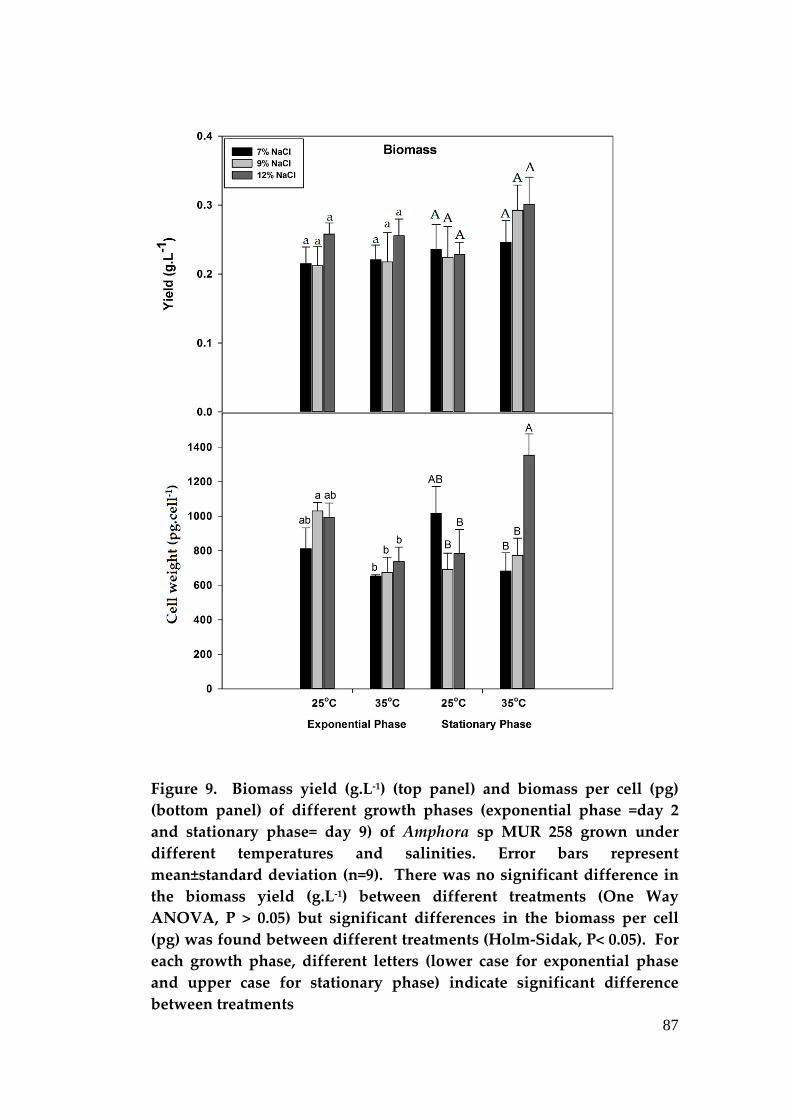
87
Figure 9. Biomass yield (g.L-1) (top panel) and biomass per cell (pg) (bottom panel) of different growth phases (exponential phase =day 2 and stationary phase= day 9) of Amphora sp MUR 258 grown under different temperatures and salinities. Error bars represent mean±standard deviation (n=9). There was no significant difference in the biomass yield (g.L-1) between different treatments (One Way ANOVA, P > 0.05) but significant differences in the biomass per cell (pg) was found between different treatments (Holm-Sidak, P< 0.05). For each growth phase, different letters (lower case for exponential phase and upper case for stationary phase) indicate significant difference between treatments

88
The biomass productivities (mg AFDW.L-1.d-1) were not affected by the
temperatures or salinities tested (One Way ANOVA, P>0.05). The average
biomass productivities ranged from 63 to 75.3 mg AFDW.L-1.d-1 (Table 12).
Table 12. Biomass productivity of Amphora sp. MUR 258 growing under different salinities and temperatures. There was no significant different in biomass productivity between treatments (One Way ANOVA, p>0.05). The numbers in the brackets indicate the range of values
Temp (oC) Salinity (%
NaCl) Biomass productivity
(mg AFDW.L-1.d-1) 25 7
9
12
67.7 (63-72)
73.6 (71.4-77.2)
75.3 (73.1-79.4)
35 7
9
12
72.1(65.1-76.3)
63 (57.8-66.8)
74.1(71.9-77.6)
Lipid content
Determination of the total lipid content of the preliminary experiment was
only performed on the samples with minor contaminants (less than 5%)
(Cultures at 20±1oC and 35±1oC, both at 9% salinity). The results showed
that the total lipid content of the Amphora sp. MUR 258 was higher at
exponential phase than that at stationary phase.Growth temperatures did
not affect the lipid content at exponential phase, however, a significant
difference in the lipid content was observed at stationary phase (Figure
10).

89
Figure 10. Total lipid content (% AFDW) of Amphora sp. MUR 258 (preliminary experiment) at different growth phases grown at 9% salinity with two different temperatures (20±1oC and 35±1oC). Error bars represent mean ± standard deviation (n=6)
The total lipid content of Amphora sp. MUR 258 (monoculture) was higher
at lower temperature (25oC) than at higher temperature (35oC) (Figure11).
The lipid content was higher in log phase than in stationary phase, except
for the cultures grown at 12% salinity at both 25 and 35oC, in which the
lipid content increased at stationary phase. The cultures grown at 7%
salinity and 25oC had the highest lipid content at exponential phase, and
the lowest lipid content was obtained at 12% salinity and 35oC (Holm-
Sidak, P < 0.05). The highest cellular lipid content was obtained when
grown at 25oC with 9% salinity. At stationary phase, the cultures grown at
12% salinity and 35oC had the highest lipid yield and cellular lipid content
whereas the lowest one was obtained from the cultures grown at 9%
salinity and 35oC (Holm-Sidak, P < 0.05). It is important to note that the

90
cellular lipid content of the cultures grown at 12% salinity and 35oC was
more than double in stationary phase, whereas their counterparts grown
at 12% salinity and 25oC showed only a slight increase. On the other hand,
the cellular lipid content of the cultures grown at 9% salinity and 25oC
decreased dramatically in the stationary phase, whereas their counterparts
grown at 9% and 35oC showed only a small decrease in stationary phase
(Figure11).
The lipid productivity of Amphora sp. MUR 258 was significantly affected
by temperature and salinity (Table13). The highest lipid productivity was
achieved at 25oC at 9% salinity and the lowest one was at 35oC and 12%
salinity (Holm-Sidak, P < 0.05).

91
Figure 11. Lipid content of Amphora sp. MUR 258 growing under different temperatures (oC) and salinities (%NaCl) at different growth phases (■ exponential phase = day 2 and □ stationary phase = day 9). Error bars represented mean±standard deviation (n=9). There was a statistically significant difference in lipid yield (g.L-1) and lipid content per cell (pg.cell-1) between the different treatments (Holm-Sidak, P<0.05). For each growth phase (lower case for exponential phase, upper case for stationary phase), different letters indicate significant differences between treatments

92
Table 13. Lipid productivity of the Amphora sp. MUR 258 growing atdifferent salinities and temperatures. There was a significant difference in lipid productivity between different treatments (Holm-Sidak, P<0.05). Different superscripts indicate statistically significant differences among treatments
Temp (oC)
Salinity (% NaCl)
Lipid productivity (mg.L-1.d-1)
25 7
9
12
39.1 (35-42.9) a
41.5 (39.5-44.9) a
31 (30.5-31.3) b
35 7
9
12
30.8 (28.1-33.5) b
27 (24.9-28.9) b
25.7(23.3-27.4) b
Fatty acid composition
The fatty acid composition of Amphora sp. MUR 258 grown at different
temperatures (25 and 35oC) and salinities (7, 9 and 12% NaCl) was
analysed during exponential and stationary phases (Table 14). The fatty
acid profiles of Amphora sp MUR 258 consisted of saturated fatty acids
(SFAs) (67.2-79.5% of total FAMEs), monounsaturated fatty acids
(MUFAs) (17.3-28.3% of FAMEs) and polyunsaturated fatty acids (PUFAs)
(3-4.5% FAMEs). The total SFAs tended to decrease as the temperature
increased from 25 to 350C, whereas total MUFAs and PUFAs were higher
at the higher temperature (Table 14).
Irrespective of temperature, salinity, and growth phase, the predominant
fatty acids of Amphora sp. MUR were palmitic acid C16:0 (35.8-42.1% of
total FAMEs), followed by stearic acid C18:0 (21.6-32.2% of total FAMEs),
palmitoleic acid C16:1 (6.4-18.9% of total FAMEs) and oleic acid C18:1 (7.8-

93
10.2% of total FAMEs). In addition, the contents of the major fatty acids
were higher at exponential phase than in stationary phase, with the
exception of palmitoleic acid (C16:1), myristic acid (C14:0) and EPA
(C20:5) whose content was higher at the stationary phase. It is noted that
the EPA (C20:5) content of Amphora sp MUR 258 cultured at 9% salinity at
35oC increased nearly threefold, from 0.6% at exponential phase to 1.7% of
total FAMEs at stationary phase, whereas the EPA content of the cultures
grown at 25oC remained the same at around 0.5% at both exponential and
stationary phase.

94
Table 14. Fatty acid profiles (% of total FAMEs) of Amphora sp MUR 258 sp growing under different temperatures (oC), salinities (%NaCl) at different growth phases (exponential phase (EP) and stationary phase (SP)
Fatty acids
Temperature (25±1oC) Temperature (35±1oC)
7% NaCl 9% NaCl 12% NaCl 7% NaCl 9% NaCl 12% NaCl
EP SP EP SP EP SP EP SP EP SP EP SP
Saturated fatty acids (SFAs) Methyl Laurate (C12:0)
Methyl Myristate (C14:0)
Methyl Pentadecanoate (C15:0)
Methyl Palmitate (C16:0)
Methyl Stearate (C18:0)
Arachnic acid methl ester (C20:0)
Methyl Lignocerate (C24:0)
Total SFA
Monounsaturated fatty acids MUFAs)
Methyl Palmitoleate (C16:1)
Methyl Oleate (C18:1)
Methyl Eicosanoate (C20:1)
Methyl Erucate (C22:1)
Total MFAs
Polyunsaturated fatty acids (PUFAs)
Methyl Linoleate (C18:2)
Methyl 5,8,11,14,17 eicosapatene (C20:5)
Total PUFAs Total FAs
0.6
4.2
0.6
40.3
32.2
0.0
0.5
78.4
7.7
9.1
0.8
1.1
18.7
2.8
0.2
3
100
0.5
4.4
1.0
37.6
30.3
0.0
0.6
74.4
12.6
8.4
0.7
1.0
22.7
2.5
0.4
2.9
100
0.7
4.4
0.7
42.1
31.6
0.0
0.0
79.5
7.2
8.5
0.8
0.8
17.3
2.8
0.5
3.3
100
0.5
4.8
0.8
40.0
28.9
0.0
0.3
75.3
12.1
7.9
0.7
1.1
21.8
2.5
0.5
3
100
0.7
4.2
0.3
39.9
32.0
0.0
0.0
77.1
6.4
10.2
1.0
2.3
19.9
3
0.0
3
100
0.5
5.0
0.8
37.7
29.1
0.0
0.5
73.6
12.6
8.3
0.7
1.0
22.6
2.7
1.0
3.7
100
0.0
4.8
0.8
39.1
27.8
0.0
0.0
72.5
14.1
8.7
0.0
1.1
23.9
2.7
0.9
3.6
100
0.5
5.2
1.7
35.8
26.0
0.4
0.5
70
16.7
7.9
0.5
0.8
25.9
2.7
1.5
4.2
100
0.7
4.4
0.4
37.0
29.7
0.0
0.0
72.2
12.5
9.5
0.8
1.4
24.2
3.2
0.6
3.8
100
0.5
5.6
1.8
37.4
21.6
0.0
0.3
67.2
18.9
7.8
0.6
1.0
28.3
2.8
1.7
4.5
100
0.7
4.2
0.4
38.2
29.4
0.0
0.0
72.9
11.2
9.9
0.7
1.1
22.9
3.4
0.9
4.3
100
0.5
5.2
1.6
37.5
23.1
0.0
0.0
67.9
18.2
8.0
0.5
1.0
27.7
2.9
1.5
4.4
100

95
4.3.1.2 Effects of different nitrogen to phosphorous ratios on the
growth of Amphora sp. MUR 258
Growth
The effects of different N and P ratios on the growth of the Amphora sp
MUR 258 are shown in Figure 10. The Amphora sp. MUR 258 grew well at
all N:P ratios tested. The highest cell density (87 x 104 cells.mL-1) was
achieved from the cultures grown at the lowest nutrient concentration
ratio (1N:1P) (Figure 12). The specific growth rates were affected by the
N:P ratios tested (One Way ANOVA, P < 0.05). The highest specific
growth rate was achieved from the culture grown at the highest N
concentration (3N:1P) whereas the lowest specific growth rate was
obtained from the cultures grown at the highest P concentration (1N:2P).
Figure 12. 1Growth curves and specific growth rates (d-1) of Amphora sp. MUR 258 growing under different N: P ratios (values represent mean±range, n=2). There was a significant difference in the specific growth rate among different conditions (One Way ANOVA, p < 0.05)

96
The highest biomass yield (g AFDW.L-1) at exponential phase was
obtained from the cultures grown with 2N:1P and the lowest was achieved
from the cultures grown at 1N:2P (Holm-Sidak, P < 0.05) (Figure 13).
Interestingly, the cultures grown at 2N:1P had lowest biomass yield at
stationary phase compared to other cultures (Holm-Sidak, P < 0.05).
There was no significant difference in the cell weight (pg AFDW cell-1)
among different treatments at logarithmic phase (One Way ANOVA,
P>0.05). However, a significant difference was observed between
treatments at stationary phase (One Way ANOVA, P<0.05). The highest
cell weight was in the cultures grown with 2N:1P and 3N:1P, whereas the
lowest cellular weight was observed in the cultures with IN:1P (Figure 13).

97
Figure 13. 2AFDW biomass yield (g.L-1) and cell weight (pg cell-1) of Amphora sp. MUR 258 grown under different N and P ratios (exponential phase = day 2 and stationary phase = day 11). Error bars represent mean±standard deviation, n=2. There was a significant difference between different treatments (Holm-Sidak, P < 0.05). For each growth phase (lower case for exponential phase and upper case for stationary phase), different letters indicate significant differences between treatments

98
In terms of biomass productivity, no significant difference was observed
among different treatments (One Way ANOVA, P<0.05). The average
biomass productivity ranged from 54.9 (1N:2P) to 84.78 (1N:1P) (Table 15).
Table 15. Biomass productivity of Amphora sp. MUR 258 cultured under different N:P ratios. Values represent mean (n=2) with the range in brackets. There was no statistically significant difference in the biomass productivity between different treatments (One Way ANOVA, P > 0.05)
N & P ratios Biomass Productivity (mg.L-1.d-1) 1N:1P 2N:1P 3N:1P 1N:2P
84.78 (78.91-90.63) 84.66 (78.1-90.67)
75.45 (70.28-80.61) 54.9(61.1-48.74)
Lipid content
When grown under different N:P ratios, significant differences in the lipid
content of Amphora sp. MUR 258 were observed at exponential phase
(Figure 14). The highest lipid content (% AFDW) was observed in the
cultures grown at the highest nitrogen concentration (3N:1P), and the
lowest lipid content was obtained at the highest phosphorus concentration
(1N:2P) (Holm-Sidak, P < 0.05). However, at stationary phase, no
significant differences in the lipid yield (g AFDW.L-1) and lipid content (%
AFDW) was observed, but a significant difference was observed in the
lipid content per cell (pg cell-1). The highest lipid content per cell was
found at 2N:1P whereas the lowest lipid was observed at 1N:1P (Holm-
Sidak, P < 0.05).

99
Figure 14. Lipid yield (top panel) and content (lower two panels) of Amphora sp. MUR 258 growing at different N:P ratios (■ exponential phase = day 4 and □ stationary phase = day 11). Error bars represente mean±standard deviation (n=6). There was a statistically significant difference in lipid content among different treatments (Holm-Sidak, p<0.05) except for the lipid yield in g.L-1 and content in % AFDW at exponential phase. For each growth phase (lower case for exponential phase and upper case for stationary phase), different letters indicate significant differences between treatments

100
The lipid productivity of Amphora sp MUR 258 was not affected by the N:P
ratio tested. The highest lipid productivity was achieved at the highest N
concentration (3N:1P) and the lowest one was obtained at the highest P
concentration (1N:2P) (Table 16)
Tabel 16. Lipid productivity (n=2) of Amphora sp. MUR 258 growing at different N:P ratios. There was no significant different in lipid productivity (One Way ANOVA, p>0.05) between different treatments
N and P ratio Lipid productivity (mg.L-1.d-1)
1N:1P
2N:1P
3N:1P
1N:2P
36.3 (31.8-40.8)
29.6 (25.7-33.6)
41 (38.9-43.2)
20 (18-22)
4.3.1.3 Effects of different nitrogen sources on the growth, lipid and
fatty acid composition of Amphora sp. MUR 258
Growth
To study the effect of different nitrogen sources on the growth of Amphora
sp. MUR 258, four different N sources were used namely sodium nitrate
(NaNO3), ammonium nitrate (NH4NO3), ammonium chloride (NH4Cl) and
urea. The results showed that the Amphora sp. MUR 258 was able to grow
on all culture medium tested (Figure 15).
Cultures with NaNO3 reached their maximum cell density at around
46x104 cells.mL-1 on day 9. When Amphora was grown using NH4Cl and
NH4NO3, the culture reached maximum cell density on day 7 at around

101
39x104 cells.mL-1. Interestingly, the cultures with urea entered early
stationary phase later on day 9 (Figure 15).
Statistically, the specific growth rate of Amphora sp. MUR 258 was not
significantly affected by different N sources tested (One Way ANOVA, P >
0.05) (Figure 15).
Days
0 2 4 6 8 10 12
cell
dens
ity (1
04 c
ells
.mL-
1 )
10
100
NH4ClNaNO3NH4NO3 Urea
N Sources
Spe
cific
gro
wth
rat
e (d
-1)
0,24
0,26
0,28
0,30
0,32
0,34
NH4Cl NaNO3 NH4NO3 Urea
Figure 15. Growth curves andspecific growth rate (d-1) of Amphora sp. MUR 258 grown under different N sources (values represent mean±range, n=2). There was no significant difference in the specific growth rate between different treatments (One Way ANOVA, p > 0.05)
The yield of Amphora sp. MUR 258 was significantly affected by the
different N sources tested. The cultures grown in ammonium nitrate had
the highest yield at exponential phase and the lowest one was obtained
from the cultures grown with ammonium chloride (Holm-Sidak, P< 0.05).
At stationary phase, the highest yield was achieved in urea medium and
the lowest one was obtained from the cultures grown with ammonium
chloride (Holm-Sidak, P< 0.05) (Figure 16).

102
There were no significant different in cell weight (pg cell-1) of the Amphora
sp. MUR 258 at exponential phase when grown under different N sources
(One Way ANOVA, P>0.05). However, significant different in the cell
weight was observed at stationary phase. The cultures grown in
ammonium chloride had the highest cell weight and the lowest one was
achieved from the cultures grown with urea (One Way ANOVA, P<0.05)
(Figure 16).
Figure 16. Biomass of Amphora sp. MUR 258 at different growth phases under different N sources (Error bars represent mean ± standard deviation, n=2). There was a statistically significant difference among different treatments (p < 0.05). For each growth phase (lower case for exponential phase and upper case for stationary phase), different letters indicate significant difference between treatments
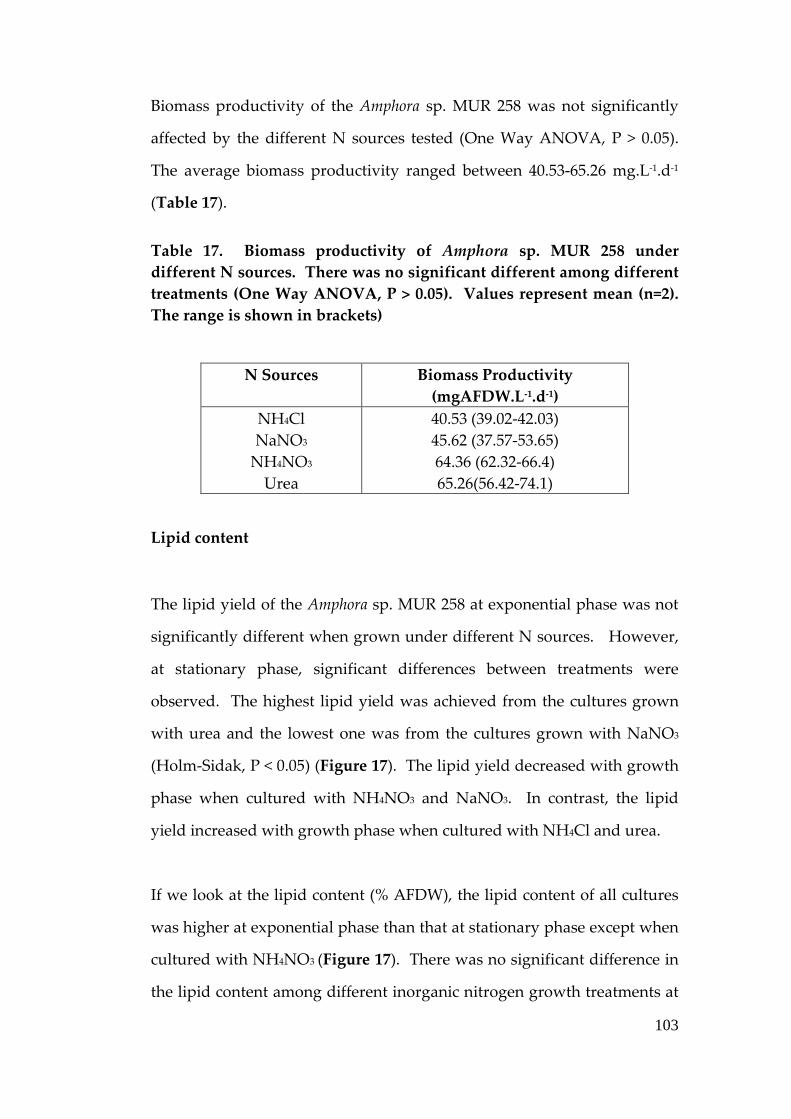
103
Biomass productivity of the Amphora sp. MUR 258 was not significantly
affected by the different N sources tested (One Way ANOVA, P > 0.05).
The average biomass productivity ranged between 40.53-65.26 mg.L-1.d-1
(Table 17).
Table 17. Biomass productivity of Amphora sp. MUR 258 under different N sources. There was no significant different among different treatments (One Way ANOVA, P > 0.05). Values represent mean (n=2). The range is shown in brackets)
N Sources Biomass Productivity
(mgAFDW.L-1.d-1) NH4Cl NaNO3
NH4NO3 Urea
40.53 (39.02-42.03) 45.62 (37.57-53.65) 64.36 (62.32-66.4) 65.26(56.42-74.1)
Lipid content
The lipid yield of the Amphora sp. MUR 258 at exponential phase was not
significantly different when grown under different N sources. However,
at stationary phase, significant differences between treatments were
observed. The highest lipid yield was achieved from the cultures grown
with urea and the lowest one was from the cultures grown with NaNO3
(Holm-Sidak, P < 0.05) (Figure 17). The lipid yield decreased with growth
phase when cultured with NH4NO3 and NaNO3. In contrast, the lipid
yield increased with growth phase when cultured with NH4Cl and urea.
If we look at the lipid content (% AFDW), the lipid content of all cultures
was higher at exponential phase than that at stationary phase except when
cultured with NH4NO3 (Figure 17). There was no significant difference in
the lipid content among different inorganic nitrogen growth treatments at

104
exponential phase (One Way ANOVA, P > 0.05. However, at stationary
phase, a significant difference in the lipid content was observed (Holm-
Sidak, P < 0.05). The highest lipid content was achieved when grown with
NH4NO3 and the lowest lipid content was obtained with NaNO3 (Figure
17).
Amphora cellular lipid content (pg.cell-1) followed similar pattern as lipid
content in % AFDW in which the cellular lipid content of all cultures was
higher at exponential phase than at stationary phase except when cultured
with NH4NO3 (Figure 17). There was no significant difference in the
cellular lipid content and lipid content in % AFDW among treatments at
exponential phase but significant difference was observed at stationary
phase. The highest cellular lipid content was achieved in the cultures
grown with ammonium nitrate and the lowest lipid content in % AFDW
was obtained with urea (Holm-Sidak, P<0.05).
The lipid productivity of Amphora sp. MUR 258 was not affected by the
different N sources tested. The lipid productivity ranged from 23.69 –
36.83 mg.L-1.d-1) (Table 18).

105
Figure 17. Lipid content of Amphora sp. MUR 258 growing under differentN sources(■ exponential phase = day 4 and □ stationary phase = day 11). Error bars represente mean±standard deviation (n=6). There was a statistically significant difference in lipid content at stationary phase among different treatments (Holm-Sidak, P<0.05). For each growth phase (lower case for exponential phase and upper case for stationary phase), different letters and superscripts indicate significant difference between treatments
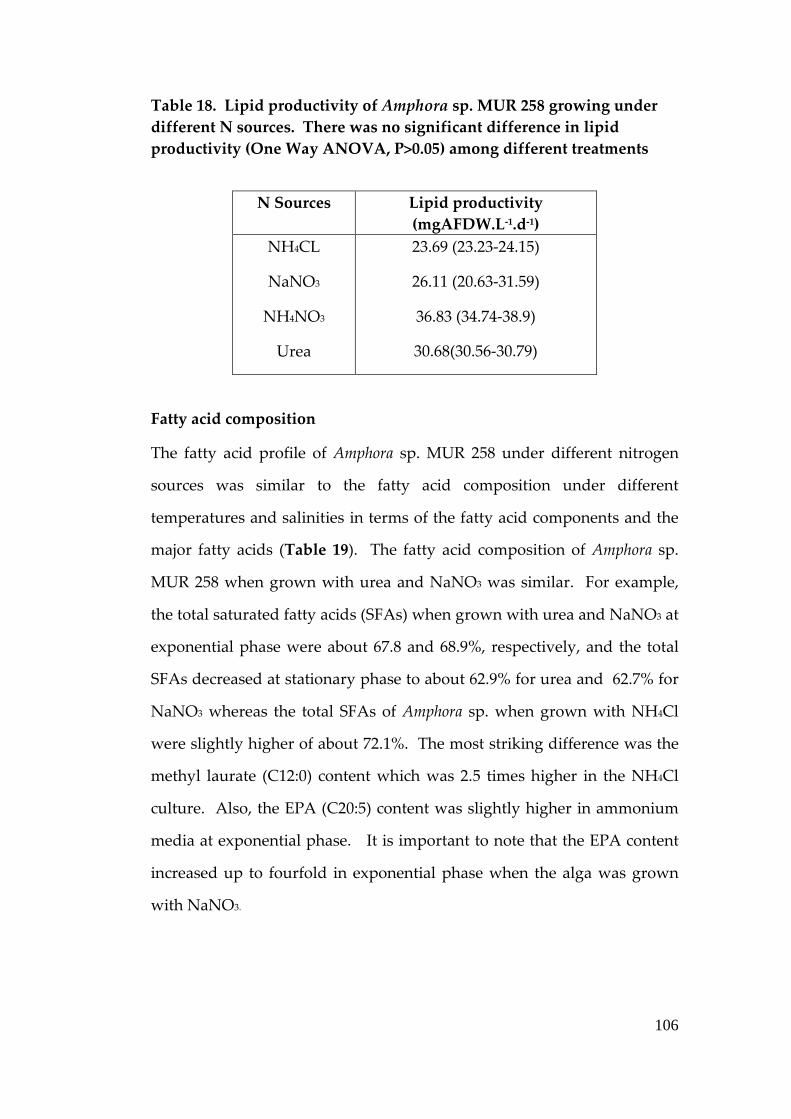
106
Table 18. Lipid productivity of Amphora sp. MUR 258 growing under different N sources. There was no significant difference in lipid productivity (One Way ANOVA, P>0.05) among different treatments
N Sources Lipid productivity (mgAFDW.L-1.d-1)
NH4CL
NaNO3
NH4NO3
Urea
23.69 (23.23-24.15)
26.11 (20.63-31.59)
36.83 (34.74-38.9)
30.68(30.56-30.79)
Fatty acid composition
The fatty acid profile of Amphora sp. MUR 258 under different nitrogen
sources was similar to the fatty acid composition under different
temperatures and salinities in terms of the fatty acid components and the
major fatty acids (Table 19). The fatty acid composition of Amphora sp.
MUR 258 when grown with urea and NaNO3 was similar. For example,
the total saturated fatty acids (SFAs) when grown with urea and NaNO3 at
exponential phase were about 67.8 and 68.9%, respectively, and the total
SFAs decreased at stationary phase to about 62.9% for urea and 62.7% for
NaNO3 whereas the total SFAs of Amphora sp. when grown with NH4Cl
were slightly higher of about 72.1%. The most striking difference was the
methyl laurate (C12:0) content which was 2.5 times higher in the NH4Cl
culture. Also, the EPA (C20:5) content was slightly higher in ammonium
media at exponential phase. It is important to note that the EPA content
increased up to fourfold in exponential phase when the alga was grown
with NaNO3.

107
Table 19. Fatty acid profiles (% FAMEs) of Amphora sp. MUR 258 growing under different N Sources (Exponential phase = day 5, Stationary phase = day 12)
Fatty acids
Urea NaNO3 NH4Cl Exp phase
Stat phase
Exp phase
Stat phase
Exp phase
Saturated Fatty Acids (SFAs) Methyl Laurate (C12:0) Methyl Myristate (C14:0) Methyl Pentadecanoate (C15:0) Methyl Palmitate (C16:0) Methyl Stearate (C18:0) Arachnic acid methl ester (C20:0) Tetacosanic methyl ester (C24:0) Total SFAs Monounsaturated Fatty Acids (MUFAs) Methyl Palmitoleate (C16:1) Methyl Oleate (C18:1) Methyl Eicosanoate (C20:1) Methyl Erucate (C22:1) Total MUFAs Polyunsaturated Fatty acids (PUFAs) Methyl Linoleate (C18:2) Methyl 5,8,11,14,17 eicosapatene (C20:5) Total PUFAs
0.4 7.2 1.8 33.9 23.7 0.2 0.6 67.8 16.6 10.8 0.6 0.6 28.6 2.4 1.1 3.5
0.4 8.5 1.7 35.1 16.8 0.4 0.0 62.9 25.1 7.4 0.3 0.4 33.2 2.5 1.5 4.0
0.4 6.2 1.8 32.4 27.5 0.0 0.6 68.9 17.5 9.7 0.3 0.7 28.2 2.3 0.6 2.9
0.4 7.7 1.7 34.0 18.5 0.4 0.0 62.7 24.3 7.0 0.5 0.5 32.3 2.7 2.4 5.1
1 6.4 0.9 34.1 28.3 0.7 0.7 72.1 14.1 8.6 0.6 0.5 23.8 2.9 1.3 4.2
4.3.2 Outdoor Studies
4.3.2.1 The long-term growth of the Amphora sp. MUR 258 in a 1m2
outdoor raceway pond
Growth and productivity
Following the successful culture of Amphora sp. MUR 258 under controlled
conditions indoors, coupled with the understanding of some of its limits
to growth (i.e. temperatures, salinity and nutrient requirements), the next
step was to test if the alga can be grown reliably in outdoor for long

108
periods with good productivity. The results of this study showed that
semicontinuous Amphora sp. MUR 258 culture could be grown reliably
outdoor using raceway pondsfor over one year period between 5/Dec/2011
and 8/Jan/2013 (Figure 18e).
The culture was operated under conditions prevailing outdoors with the
daily solar irradiance ranging between 2.5 MJ m-2.d-1 (on a cloudy day in
early winter) to 34 MJ m-2.d-1 (on a clear sunny day in summer) (Figure
18a). The daily air temperature ranged from -0.7 oC in winter (July 2012)
to 42.2oC in summer (December 2012) (Figure 18b). The highest (134.4
mm) and lowest (0.0 mm) monthly total rainfalls were observed in June
and March 2012, respectively (Figure 18c). Salinity range of the culture
was between 8.6-14.9%. The salinity was adjusted to about 10% after each
harvest. However, the salinity dropped to below 9% due to dilution on
rainy days and increased to over 14% on hot sunny days during summer
due to evaporation. It is to be noted that the use of seawater for replacing
the evaporation losses resulting in increase in the salinity (Figure 18d).
The culture was initially operated in batch mode for about two weeks
until the culture reached maximum cell density (160x104 cells.mL-1) before
initiating the regular operation under semicontinuous regime(Figure 18e).
Amphora sp. MUR 258 grew over the whole cultivation period although its
growth was very slow during winter (June-August). The cell density was
higher in summer except for the short period from 17/Jan/12 to 10/Feb/12
(summer). During this 23 days period, the culture was operated at a very
low cell density (30±20x104 cells.mL-1) in order to study how Amphora sp
MUR 258 responds to elevation in light intensity. From 13/Feb/2012, the
culture was operated at higher cell density and the harvesting rate was

109
adjusted to maintain a constant cell density of about 50x104 cells.mL-1.With
the advent of winter, the maximum cell density decreased from about
60x104 cell.mL-1 on 5/June/2012 to just below 10x104 cells.mL-1 on
7/Sep/2012. However, the cell density increased gradually and again
reached its maximum at 167x104 cells.mL-1 in the following summer (early
January 2013).
Dry weight, ash-free dry weight and lipid content per cell of Amphora sp.
MUR 258 throughout the year showed a similar trend reaching the highest
values in winter (Figure 19). The highest dry weight and ash free-dry
weight of 3.6 and 2 ng.cell-1, respectively were achieved on 30/July/2012,
whereas lipid content was highest at 0.45 ng.cell-1 (49.39% of ash-free dry
weight) on 13/August/2012.
Overall, the specific growth rates, biomass and lipid productivities
showed the same patterns being higher in summer and lower in winter
(Figure 20). The highest monthly average specific growth rate (0.279 ±
0.015 d-1), biomass productivity (18.018 ± 5.895 g.m-2.d-1) and lipid
productivity (5.9 ± 0.9 g.m-2.d-1) were achieved in summer (December
2011) and the lowest monthly average specific growth rate (0.015 ± 0.012 d-
1), biomass (0.778 ± 0.612 g.m-2.d-1) and lipid productivity (0.195 ± 0.143
g.m-2.d-1) occurred in winter (July 2012). The annual average biomass and
lipid productivity were 6.99 and 2.21 g ash-free dry weight.m-2.d-1,
respectively.

110
Figure 18. Environmental conditions and growth characteristics of Amphora sp. MUR 258 cultured in a 1m2 paddle-wheel driven outdoor raceway pond over one year period : (a). Daily solar exposure ; (b). temperature; (c). Daily rainfall; (d). Salinity ; (e). Cell density of Amphora sp MUR 258 and (f). Cell density of contaminants

111
Figure 19. Cell weight (dry weight and ash free dry weight)and lipid content of Amphora sp. MUR 258 cultured in a 1m2 outdoor fibreglass paddlewheel-driven raceway pond over one year period (December 2011-January 2013)

112
Figure 20. Monthly average of specific growth rate, biomass and lipid productivity of Amphora sp. MUR 258 cultured in a 1m2 outdoor fibreglass paddle wheel-driven raceway pond over one year period (December 2011-January 2013). Values represent mean ± SD

113
The specific growth rate of Amphora sp. was positively correlated with
temperature and irradiance (Figure 21).
Figure 21. Correlation of mean temperature and solar irradiance with the specific growth rate of Amphora sp. MUR 258 cultured in a 1m2 outdoor raceway pond over one year period (December 2011-January 2013)

114
Contaminants
There was no contamination by foreign organisms during the first 3
months of Amphora sp cultivation, but after this contamination by other
algae (D. salina, Tetraselmis and a pennate diatom, Navicula sp) was
observed (Figure 18f). Very minor contamination by protozoans was also
observed (winter months). In parallel with the Amphora sp culture, D.
salina and Tetraselmis sp were being grown in adjacent ponds. Therefore,
cross contamination is more likely to have occurred. Contamination by
Dunaliella was first recorded on 1/Mar/2012, followed by the Tetraselmis sp
on 16/Mar/2012. The highest Dunaliella sp cell density was 6x10⁴ cells.mL-1
(about 5% of the Amphora population) recorded on 7/May/2012. From
15/June/2012 onwards, Dunaliella cell density decreased to below 1x10⁴
cells.mL-1 before it completely disappeared by the end of
August.Tetraselmis sp reached its highest cell density at 16.8x10⁴ cells.mL-1
(28% of theAmphora population) on 25/Jun/2012. This was the time when
the salinity dropped to below 10% due to heavy rainfall periods. From
30/Aug/2012 onwards, the Tetraselmis sp concentration decreased to below
5x10⁴ cells.mL-1 before completely disappearing in mid of October toward
the end of the period (culture salinity between 11-13%). Another
contaminant, Navicula sp, started to appear at the end of July (23/Jul/2012)
and reached its highest cell density of 61x104 cells.mL-1 (about 75% of the
total population) on 20/9/2012. Interestingly, with the presence of the
latter, the growth of the former contaminants continued to decrease before
completely disappearing by mid October 2012. However, as the summer
approached, Navicula sp cell density gradually decreased whereas the
Amphora sp population continued to increase and again dominated the
culture. By the end of the culture period, Navicula sp cell density was
about 37x104 cells.mL-1 (22% of the Amphora sp. population).

115
Fatty acids composition
Table 20 displays the fatty acids profile of Amphora sp. MUR 258 in
different seasons when cultured in outdoors. The total SFAs were higher
in summer and autumn than that in winter and spring, whereas the total
MUFAs and PUFAs were higher in winter and spring. The fatty acid
components and the predominant fatty acid under outdoor condition
were consistent with the previous results in indoor cultures under
different temperature and salinity (Table 14) and nitrogen sources (Table
19), but the amount of each fatty acid at different seasons varied
considerably. For example, methyl myristate (C14:0) was two times
higher in summer than that in autumn and methyl sterate (C18:0) was
three times higher in autumn than that in spring. Methyl oleate and
methyl linoleate were higher in winter and methyl palmitoleate (C16:1)
was nearly 5 fold higher in spring than in autumn. Similarly, much higher
EPA (more than 5 fold) was observed in spring than in autumn.

116
Table 20.Fatty acids composition of Amphora sp. MUR cultured in a 1m2
raceway pond at different seasons (values represent mean ±SD)
Fatty acids Summer Autumn Winter Spring Saturated Fatty Acids (SFAs) Methyl Laurate (C12:0) Methyl Myristate (C14:0) Methyl Pentadecanoate (C15:0) Methyl Palmitate (C16:0) Methyl Sterate (C18:0) Arachnic acid methyl ester (C20:0) Methyl lignocerate (C24:0) Total SFAs Monounsaturated Fatty Acids (MUFAs) Methyl Palmitoleate (C16:1) Methyl Oleate (C18:1) Methyl Eicosanoate (C20:1) Methyl Erucate (C22:1) Total MUFAs Polyunsaturated Fatty Acids (PUFAs) Methyl Linoleate (C18:2) Methyl 5,8,11,14,17 eicosapatene(C20:5) Total PUFAs
0.5 ± 0.00 7.7 ± 0.03 1.5 ± 0.01 34.6± 0.04 25.7 ± 0.06 0.4 ± 0.01 0.6 ± 0.00 71 16.2 ± 0.07 7.0 ± 0.01 0.8 ± 0.00 0.6 ± 0.00 24.6 2.0 ± 0.01 2.4 ± 0.03 4.4
0.6 ± 0.00 3.8 ± 0.01 0.7 ± 0.00 40.1± 0.00 36.6±0.00 0.1 ± 0.00 0.2 ± 0.00 82.1 6.0 ± 0.01 7.4 ± 0.02 0.8 ± 0.00 0.5 ± 0.00 14.7 1.9 ± 0.00 1.2 ± 0.00 3.1
0.9 ± 0.01 6.4 ± 0.03 1.3 ± 0.01 36.6± 0.01 19.9± 0.06 0.003±0.00 0.3 ± 0.00 65.4 11.5± 0.04 15.1± 0.02 0.5 ± 0.00 0.7 ± 0.01 27.8 3.0 ± 0.00 3.7 ± 0.01 6.7
0.4 ± 0.00 4.9 ± 0.01 1.2 ± 0.00 34.6± 0.04 12.5± 0.02 0.2 ± 0.00 0.2 ± 0.00 54 28.7± 0.04 8.3 ± 0.02 0.3 ± 0.00 0.5 ± 0.00 37.8 1.7 ± 0.00 6.4 ± 0.02 8.1
4.3.2.2 Effect of different pond depth on the growth of Amphora sp.
MUR 258
The growth of Amphora sp. MUR 258 at two different depths, 15 cm and 20
cm was studied in outdoor paddle wheel-driven raceway ponds under
semicontinuous culture operation (Figure 22). This study was run at the
end of Autumn/early winter in order to determine the optimum depth
during the period with consideration that the irradiance is very low
during that time. Overall, the culture grown at 20 cm grew better than

117
that at 15 cm depth, except after the last harvest in which the growth of the
culture at 15 cm depth continued to increase whereas the one at 20 cm
depth decreased before increasing again at the end of the experiment.
Figure 22. The growth of Amphora sp MUR 258 cultured in 1 m2 outdoor raceway ponds at two different depths (● 15 cm and ○ 20 cm)
The specific growth rates, biomass yield and biomass productivity of
Amphora sp. MUR 258 grown in 1m2 outdoor raceway ponds were not
affected by the two different depths tested (Wilcoxon signed-rank test, P >
0.05) (Figure 23). The specific growth rate of the culture grown at 15 cm
depth ranged from 0.088-0.124 d-1 and the specific growth rate at 20 cm
depth ranged from 0.088-0.141 d-1. The biomass yield at 15 and 20 cm
depth ranged between 0.24-0.722 g.L-1 and 0.237-0.666 g.L-1, respectively,
whereas the biomass productivity of the culture at 15 cm depth ranged
between 8.27-10.83 g.m-2.d-1 and the biomass productivity at 20 cm depth
ranged between 9.04-13.24 g.m-2.d-1.

118
Spec
ific
grow
th ra
te
(d-1
)
-0,02
0,00
0,02
0,04
0,06
0,08
0,10
0,12
0,14
0,16
Date
15/5/12 16/5/12
17/5/12 18/5/12
19/5/12 20/5/12
21/5/12 22/5/12
23/5/12 24/5/12
25/5/12 26/5/12
Bio
mas
s pr
oduc
tivity
(g
.m-2
.d-1
)
-5
0
5
10
15
20
Bio
mas
s Yi
eld
(g.L
-1)
0,2
0,3
0,4
0,5
0,6
0,7
a
b
c
Figure 233. Specific growth rate (a) Biomass yield (b) and biomass productivity (c) of Amphora sp. MUR 258 cultured in 1 m2 outdoor raceway ponds at two different depths (● 15 cm and ○ 20 cm)

119
4.3.2.3 Effect of heated and unheated ponds on the growth of Amphora
sp. MUR 258
The cultures of the Amphora sp. MUR 258 under heated and unheated
conditions were compared in outdoor using 1 m2 raceway ponds during
winter months. The cultures were operated under semi-continuous
regimes for about 4 weeks. The early morning temperature during the
cultivation period of the unheated pond ranged from 2.9-16oC and the
morning temperature of the heated pond was about 9-11oC higher than
that of the unheated pond (Figure 24).
The growth pattern of the Amphora sp. MUR 258 under heated and
unheated condition followed the same pattern except in the first and the
last weeks when the cell density of the heated culture was higher than that
of the unheated culture (Figure 24).
The specific growth rates and biomass productivity of Amphora sp. MUR
258 were not affected by the two different condition tested (heated and
unheated culture) (Wilcoxon signed-rank test, P > 0.05). However,
significant difference was observed in the biomass yield (Wilcoxon signed-
rank test, P < 0.05) (Figure 25).

120
Figure 24. Effect of early morning temperature of the ponds (9.00 am) and the growth of Amphora sp. MUR 258 in 1 m2 outdoor raceway ponds in unheated (●) and heated pond (o)

121
Figure 25. Specific growth rate (a) biomass yield (b) and the biomass productivity (c) of Amphora sp. MUR 258 in 1 m2 outdoor raceway ponds under heated (○) and unheated (●) conditions. There was no significant difference in the specific growth rates and biomass productivity between treatments (Wilcoxon signed-rank test, P > 0.05) but significant difference was observed in the biomass yield (Wilcoxon signed-rank test, P<0.05).

122
4.3.2.4 Effect of intermittent mixing on the growth of Amphora sp.
MUR 258
The performance of the culture with 24 hours mixing and mixing only
during the day was compared with the assumption that the cultures do
not need mixing at night as they do not photosynthesise at night so that
energy used for mixing can be greatly reduced by not mixing during the
night. The culture grown under 24 hours mixing grew better compared to
the one mixed only during the day. The continuously mixed culture grew
rapidly following initial inoculation, reaching the maximum cell density at
around 68x104 cells.mL-1 on day 2, whereas the culture grown with only
daytime mixing showed only slight increase in cell density on day 1 at
around 53x104 cells.mL-1. Afterwards, the cell density of the intermittently
mixed culture continued to decrease due very low solar irradiance before
increasing gradually on day 7 (28/May/12). After partial harvesting on
day 15 (6/June/12), both cultures showed a similar pattern where the cell
density decreased due to heavy rainfall before increasing again on
11/June/12. The cell density continued to decrease again due to a further
period of rainfall until day 29 (19/June/12) before increasing again at the
end of the culture period. Overall, the continuously mixed pond
performed better than the intermittently mixed pond, even with rain
(Figure 26).

123
Figure 26. The growth of Amphora sp. MUR 258 in 1 m2 outdoor raceway ponds under mixed (○) and un-mixed (●) conditions
The specific growth rates of the Amphora sp cultures were affected by
mixing. The specific growth rates were higher with continuous mixing
than with intermittent mixing (Wilcoxon signed-rank test, P < 0.05).
However, there was no statistically significant difference in the biomass
yield and biomass productivity between the treatments (Wilcoxon signed-
rank test, P > 0.05) (Figure 27).

124
Figure 27. Specific growth rate (a) biomass yield (b) and the biomass productivity (c) of Amphora sp. MUR 258 in 1 m2 outdoor raceway ponds with continuous mixing (○) and daytime mixing (●)

125
4.4 Discussion
4.4.1 Indoor Studies
4.4.1.1 Growth and biomass productivity of Amphora sp. MUR 258
under different growth conditions
Temperature
Temperature is one of the key environmental factors affecting the growth
of algae (Borowitzka 2013c). Considering the environmental changes
outdoor, the ability to tolerate a wide range of temperatures is a
prerequisite characteristic of microalgae to be successfully cultured
outdoors. In this study, it was found that Amphora sp. MUR 258 can grow
well over a wide range of temperatures (19-36oC). However, some
differences were observed between the first and the second experiment.
These differences can be attributed to the different source of the starter
cultures. In the first experiment, the inoculum cultures came from the
outdoor pond which had adapted to varying temperatures (especially
high temperatures) and the light intensity encountered outdoors. It is to
be noted that the Amphora sp. was originally isolated when it had taken
over a D. salina culture in an outdoor raceway pond in February-March
2011 (summer conditions). In the second experiment, the inoculum
cultures came from a single colony that had been gradually scaled-up
indoors under constant temperature (25oC) and light intensity (60-80 µmol
photons.m-2.s-1). Therefore, the outdoor inoculum culture had already
been adapted to high temperature whereas the indoor inoculum was no
longer adapted to varying and high temperatures and irradiances. This
study clearly showed that the optimum growth temperature of Amphora
sp. MUR 258 can be associated with the origin and the temperature range

126
from which the inoculum culture was obtained. In addition, the much
higher maximum cell density achieved in the first experiment can be
attributed to the fact that the culture had already adapted to varying light
intensity outdoors so that the cells grew very well to a very dense culture,
even at a very low irradiance (65±5 µmol photons.m-2.s-1). As pointed out
by Rivkin and Putt (1987), benthic diatoms can efficiently utilize low
irradiance for inorganic assimilation and have distinct photoadaptations
to enhance their growth (Morris 1981). In addition, the ability of diatoms
to grow and photosynthesize over a wide range of light intensity is most
likely due to the presence of specific light sensing and acclimation
mechanisms which are now beginning to be elucidated at the molecular
level (Bowler et al. 2010; Zhu and Green 2010). De la Pena (2007) also
studied an Amphora sp isolated from abalone hatchery tanks and found
that this species attained its highest specific growth rate (0.3 d-1) and a
higher cell density at a lower photosynthetic photon flux density (11.4
µmol photons. m-2.s-1).
The capability to grow at higher temperature up to 36oC is unusual for
many diatoms (McGinnis et al. 1997). High temperature tolerance has
been reported only in a few diatoms including Chaetoceros muelleri (up to
35oC) with the optimum growth occurring at 30oC (McGinnis et al. 1997).
Coscinodiscus granii also achieved the maximum growth rate and cell yield
at 30oC (Fukao et al. 2012). In this study, it was found that Amphora sp.
MUR 258 can grow very well at much higher temperatures up to 36oC.
Yun et al. (2010) studied the photosynthetic activity of benthic diatoms in
response to different temperatures and they found that small diatom cells
which have large surface area per volume (SA/V) ratios can be
disadvantaged under extreme conditions (high temperature and light

127
intensity), whereas larger cells with smaller SA/V ratios are less vulnerable
to higher temperature. However, our results showed that the Amphora sp.
MUR 258 which has relatively small cells can grow well at higher
temperature. Although the diatom Amphora sp. can grow well at high
temperature, long-term exposure to constant warm temperature for 24
hours during two weeks of culturing, as observed in the second
experiment, had a detrimental effect on the cultures. The most affected
were the ones at 12% salinity in which no growth observed after day 4.
Apart from adaptation issues, this lack of growth can also be attributed to
the fact that CO2 is less soluble at high temperatures and high salt
concentrations (Duan et al. 2006), so that deficiency of CO2 at high
temperature might be a cause of additional stress. Furthermore, long-term
exposure to high temperature affects photosynthetic processes due to the
low recovery rates at high temperature (Salleh and McMinn 2011). In
addition, when encountering extreme temperature, the enzymes or
proteins involved in the recovery process may not function properly or
may have been damaged. Salleh and McMinn (2011) also found that long-
term exposure of the two temperate benthic diatoms, Amphora coffeaeformis
and Cocconeis sublittoralis, to high temperature affected their
photosynthetic processes due to the low recovery rates at high
temperature (30oC). Another possible reason for reduced growth may be
that high temperature affects the dark respiration rate which increases
exponentially with temperature (Richmond 1986a). Thus, when
temperature is high at night, the cultures will experience intensive
respiration which in turn leads to biomass loss (Grobbelaar and Soeder
1985). The result may differ if the temperature is decreased at night to
mimic the ambient temperatures in outdoors where temperature at night

128
is much lower than temperature during the day so that the cultures have a
chance to recover and the biomass loss can be minimised.
Temperature also seems to affect the morphology of the Amphora cells.
After one week of culturing, an interesting feature was observed in the
cultures growing at 35oC. The cells were noticeably bigger than their
counterparts growing at 20 and 25oC. Also, many of the cells were nearly
round in shape. These characteristics were quite similar to auxospores, a
sexual reproduction stage of diatoms (Trobajo et al. 2006; Mouget et al.
2009). This may explain the bigger size of the cells found at high
temperature as the cells size of the diatom returns to the normal size
following sexual reproduction. Montagnes and Franklin (2001) also
observed an enlargement of diatom size with increasing temperature. The
big and round cells are also similar to dormant resting cells which have
been observed in many algae including diatoms under unfavourable
conditions (Ishikawa et al. 2011). However, further studies are still needed
to see whether high temperature did indeed trigger sexual reproduction in
Amphora sp. MUR 258.
Salinity
In this study, the newly isolated diatom Amphorasp.MUR 258 showed its
capability to grow well over a very wide range of high salinities (6-12%
NaCl) indicating that it is a hypersaline alga requiring a hypersaline
environment with salt concentration higher than seawater of at least 6% of
NaCl for optimum growth.
Salinity is an important factor influencing the growth of marine
microalgae. Microalgae respond to salinity fluctuation morphologically
and physiologically (Al-Hasan et al. 1987; Aizdaicher and Markina 2010).
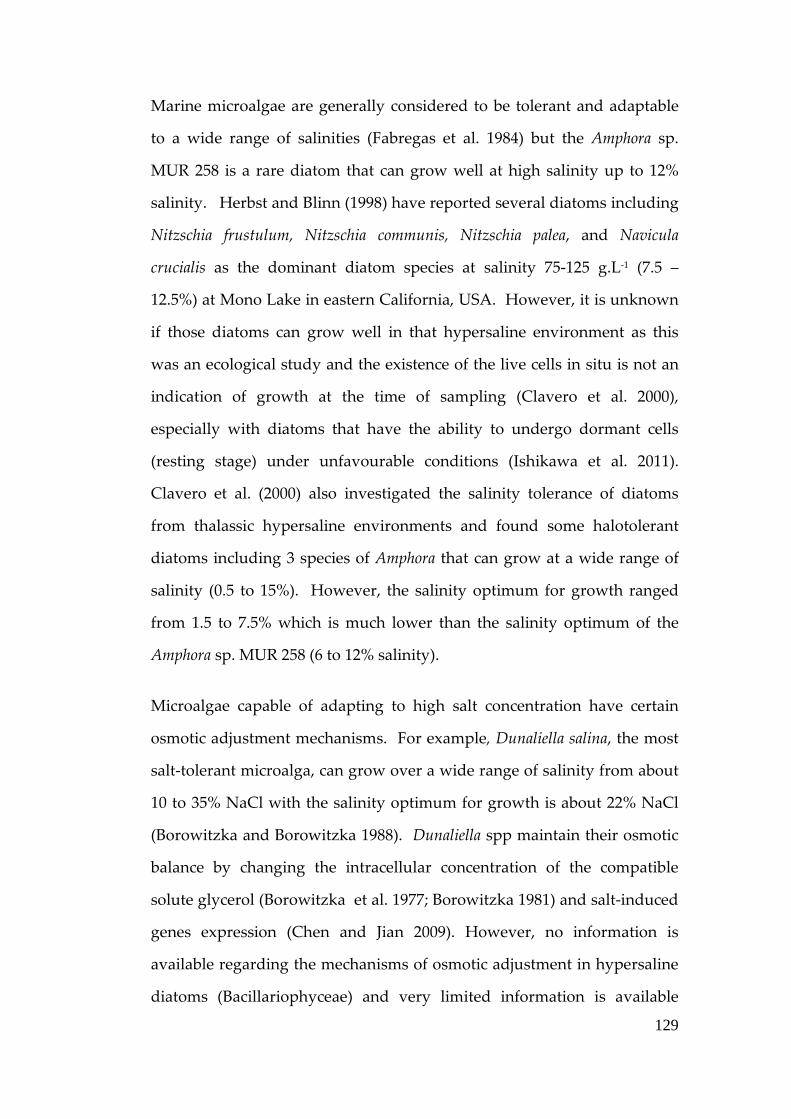
129
Marine microalgae are generally considered to be tolerant and adaptable
to a wide range of salinities (Fabregas et al. 1984) but the Amphora sp.
MUR 258 is a rare diatom that can grow well at high salinity up to 12%
salinity. Herbst and Blinn (1998) have reported several diatoms including
Nitzschia frustulum, Nitzschia communis, Nitzschia palea, and Navicula
crucialis as the dominant diatom species at salinity 75-125 g.L-1 (7.5 –
12.5%) at Mono Lake in eastern California, USA. However, it is unknown
if those diatoms can grow well in that hypersaline environment as this
was an ecological study and the existence of the live cells in situ is not an
indication of growth at the time of sampling (Clavero et al. 2000),
especially with diatoms that have the ability to undergo dormant cells
(resting stage) under unfavourable conditions (Ishikawa et al. 2011).
Clavero et al. (2000) also investigated the salinity tolerance of diatoms
from thalassic hypersaline environments and found some halotolerant
diatoms including 3 species of Amphora that can grow at a wide range of
salinity (0.5 to 15%). However, the salinity optimum for growth ranged
from 1.5 to 7.5% which is much lower than the salinity optimum of the
Amphora sp. MUR 258 (6 to 12% salinity).
Microalgae capable of adapting to high salt concentration have certain
osmotic adjustment mechanisms. For example, Dunaliella salina, the most
salt-tolerant microalga, can grow over a wide range of salinity from about
10 to 35% NaCl with the salinity optimum for growth is about 22% NaCl
(Borowitzka and Borowitzka 1988). Dunaliella spp maintain their osmotic
balance by changing the intracellular concentration of the compatible
solute glycerol (Borowitzka et al. 1977; Borowitzka 1981) and salt-induced
genes expression (Chen and Jian 2009). However, no information is
available regarding the mechanisms of osmotic adjustment in hypersaline
diatoms (Bacillariophyceae) and very limited information is available

130
regarding the mechanisms of osmotic adjustment of diatoms overall (Ben-
Amotz and Avron 1983). For example, the diatoms Cyclotella cryptica and
Cyclotella meneghiniana respond to high and low osmotic changes by
producing and eliminating proline (Schobert 1974; Liu and Hellebust
1975). In Cylindrotheca fusiformis, mannose is produced to balance its
internal osmotic environment (Peterfi and Manton 1968) whereas in
Navicula sp, proline and an oligosaccharide play an important role in
osmotic adaptation (Ben-Amotz and Avron 1983). Therefore, studies on
the mechanisms of osmoregulation of Amphorasp.MUR 258 are needed in
order to better understand its ability to thrive under high salinity
conditions.
Nutrients
Nitrogen and phosphorus are the major limiting nutrients for algal
growth. Both nutrients are used as a sink for the photosynthetically fixed
organic carbon in anabolic reactions and to provide building blocks for
cell components (Wilhelm et al. 2006). In addition, the requirements of
structural N:P ratio of phytoplankton is species-specific (Klausmeier et al.
2004) depending on nutrient uptake kinetics, assimilation and storage
capacities of species (Tilman et al. 1982).
In the present study, it was found that Amphora sp. MUR 258 achieved its
highest cell density, ash-free dry weight and biomass productivity at the
lowest nutrient concentration (1N:1P ratio of f-based medium). Increasing
the nitrate concentration caused no further improvement in the ash-free
dry weight and biomass productivity. In addition, Amphora grew poorly
in the medium with higher phosphorus concentration (1N:2P). This study
suggests that high phosphorus concentration was more detrimental to
growth of Amphora sp. MUR 258 than high nitrate concentration.

131
Nutrient requirements can also be correlated to cell size. Algae with large
cell size need more nutrients for growth due the fact that relatively low
surface to ratios of diatoms limit an exploitation of low nutrient
concentrations (Wilhelm et al. 2006). The diatom Thalassiosira weissflogii
with large cell volume of 1362 µm3 was strongly affected with nitrogen
deprivation in contrast to the chlorophyte Dunaliella tertiolecta with a cell
volume of 391 µm3(Atkinson et al. 2003). In agreement with this study,
Amphora sp. with a relatively small size of about 10-20 µm grew better at
the lowest nutrient concentrations tested.
Less nutrients requirement for optimum growth of Amphora sp. offers a
competitive advantage for its mass cultivation in outdoor since spending
on nutrients contribute to the significant portion of the production cost. In
addition, the ability to efficiently use phosphorous at low concentration is
an important issue since phosphorous is a non-renewable resource that is
predicted to be depleted within 50-100 years (Steen 1998; Cordell et al.
2009).
Nitrate is commonly used as the sole nitrogen source for growing algae
due to the fact that pH shift in the medium is less likely to occur than with
of other N sources (Yongmanitchai and Ward 1991). However, compared
to ammonium, nitrate requires more energy to assimilate and majority of
the algae utilize nitrate only when ammonium has been depleted because
nitrate needs to be transformed into ammonium prior to utilization (Flores
et al. 1980). As the cultures grown on different N sources were not
buffered, the pH tended to increase in the cultures grown on nitrate and
urea and it tended to decrease in the cultures grown on both ammonium
nitrate and ammonium chloride.

132
The capability of the diatom Amphora sp.MUR 258 to grow well under
different N sources (ammonium, nitrate and urea) indicated that this alga
can utilize and assimilate all of these N sources. The diatoms
Phaeodactylum tricornutum and Skeletonema costatum were also able to grow
on all three different N sources and no significant effect of N source on the
growth of the cultures was detected (Laurenco et al. 2002).
Although the Amphora sp. MUR 258 can grow well using different N
sources, it seems to grow best when using urea as nitrogen source. The
ability of the Amphora sp. MUR 258 to grow well using urea is a positive
outcome when considering that this species is to be mass-cultivated in
large-scale outdoor ponds. The production cost can be greatly reduced
due to the fact that urea is the cheapest form of N commonly used for
growing algae (Zhou et al. 2013). However, the choice of N source should
be considered carefully depending on the purposes and the products of
interest due to the fact that the chemical form of N source also affects the
proximate composition of the alga (Laurenco et al. 2002) and the pH of the
medium (Xu et al. 2001). Therefore, information on biochemical
composition of a particular alga species growing under different N
sources need to be determined before choosing N sources for growing the
alga.
4.4.1.2 Lipid and Fatty acids composition of Amphora sp. MUR 258
under different growth conditions
It is important to determine lipid and fatty acids composition of algae
when considering them as aquaculture feeds, nutraceuticals and biodiesel
feedstocks. Many studies have evaluated the lipid and fatty acids
compositions of algae but almost no information available regarding fatty

133
acids profiles of hypersaline diatoms. The lipid content of the Amphora sp.
MUR 258 ranged between 23-67% AFDW or 0.05-0.132 g.L-1 which is
comparable with other diatoms reported in the literatures as summarized
in Table 1 and also with other two microalgal species considered as
potential species for biodiesel, namely Botryococcus braunii with the lipid
content ranging from 25-75%dry weight and Nannochloropsis with lipid
content ranging between 31-68% dry weight (Chisti 2007). In terms of
fatty acid composition, the fatty acids profile of the Amphora sp. MUR 258
is unique. Unlike the fatty acids profiles of other diatoms as summarized
in Table 2, the fatty acids of the Amphora sp. MUR 258 contains
remarkably high saturated fatty acids accounted for about 62.7-82% of
total fatty acids and very low PUFAs ranging from 2.9-8.1% of total fatty
acids. It is well known that the fatty acids composition of microalgae is
species specific and it is affected by the growing conditions. It is possible
that the unique fatty acid composition of the Amphora is related to its
physiological adaptation to the hypersaline environment. The quantity
and quality of microalgal lipids are influenced by environmental
conditions including temperature (McGinnis et al. 1997; Renaud et al.
2002; Chen 2012) and salinity (Al-Hasan et al. 1990; Khatoon et al. 2010).
In the present study, the lipid content of Amphora sp MUR 258 was
significantly decreased at higher growth temperatures which is in
agreement with previous studies on other diatoms; i.e. Chaetoceros
calcitrans and C. simplex (Thompson et al. 1992), Nitzschia spp. (Renaud et
al. 1995) and Chaetoceros sp (Renaud et al. 2002). In relation to salinity, the
only real comparison of the present study is the study done by Al-Hasan
et al. (1990) who studied the effect of different salinity (0.5, 1.7 and 2.5 M)
on the lipids and fatty acids composition of marine diatom Navicula sp.
They found that the lipid content increased with increasing salinity from

134
0.5 M or 2.9% NaCl (5.3 % of DW) to 1.7 M or 9.9% NaCl (13.4% of DW)
but then declined at 2.5 M or 14.5% NaCl (4.3% DW). The lipid content of
the Amphora sp. MUR 258 in the present study was very high up to 67%
AFDW) with the tendency to decrease as salinity increases.
Unlike many studies reported high lipid accumulation in the stationary
phase (Ong et al. 2010; Su et al. 2011), the results of this study suggested
that the Amphora sp. MUR 258 accumulated more lipids during
exponential phase when grown at lower salinity (7 and 9%) and at lower
temperature (25oC). However, when grown at higher salinity (12% NaCl)
and higher temperature (35oC), the cells accumulated more lipids at
stationary phase. Long-term continuous exposure to high salinity and to
constant high temperature negatively affected the growth of the
Amphorasp which in turn led to the stimulation and formation of the
lipids. As pointed out by Hu et al. (2008b), many algae modify their lipid
biosynthetic pathways towards neutral lipid accumulation that serve as a
storage material under unfavourable conditions for growth. Besides
strains and growth condition variations, another possible explanation for
the discrepancy is due to the complex evolutionary history of diatoms that
differ substantially from many other photosynthetic organisms in terms of
intracellular compartmentation and organization of carbon partitioning
pathways that play a substantial role in the regulation of carbon flux into
lipid/fatty acids biosynthesis (Smith et al. 2012). However, the exact
mechanisms underlying the lipid pathways under combination of two
stressors (temperature and salinity) in Amphora sp. MUR 258 are
unknown.
This is a very positive outcome considering that high lipid content at the
exponential phase will lead to the high lipid productivity and that the

135
lipids content can be further increased through manipulation of the
culture conditions. In the case of Amphora sp., this is potentially useful as
the culture conditions can be manipulated to optimize lipid productivity
by employing a temperature and/or salinity shift strategy. A possible
strategy is outlined in the following steps; first, the alga is grown at 9%
NaCl and 25oC to achieve the maximum growth rate and the highest lipid
content in the exponential phase. Secondly, when Amphora sp. enters the
stationary phase the salinity should be increased to 12% NaCl and the
temperature to 35oC for continuing lipid accumulation within the cells. By
this two stage method, we could possibly increase the lipid productivity
up to twofold based on the fact that the lipid content increased more than
two fold at stationary phase when the alga grew at high salinity and
temperature. However, the above strategy is difficult to do in a large-scale
pond although a change in salinity is theoretically possible, but it is
possibly a good strategy for small-scale cultures indoors (i.e. for
hatchery/aquaculture purposes). Takagi et al. (2006) reported that the
lipid content of Dunaliella increased from 60 to 67% when the salinity
increased from 0.5 M (2.9% NaCl) to 1 M (5.8% NaCl) and a further
increase to 70% after the addition of 0.5 or 1 M NaCl at mid or end of the
log phase with initial NaCl concentration of 1 M. Similarly, Zhou et al.
(2013) found that the lipid content of Chlorella sp. (FACHB-1748) increased
with increasing salt concentration. However, the exact mechanisms of the
increase in lipid content of Amphora sp. MUR 258 at high NaCl
concentration is unknown, but it may be related to the adaptive response
of the alga to high salt concentration
In terms of the fatty acid composition, the types and the predominant fatty
acids of Amphora sp. MUR 258 were similar irrespective of the growing
conditions. However, the amount of individual fatty acids varied between

136
treatments. It has been observed in many microalgae that saturated fatty
acids increase with increasing temperature and unsaturated fatty acids
increase with decreasing temperature (Chapman et al. 1983; Raison and
Orr 1986; Renaud et al. 2002; Rousch et al. 2003). Furthermore, at low
temperature, algae tend to produce more PUFAs to maintain membrane
fluidity in a state necessary for biological functioning (Richmond 1986a).
Contrary to their findings, the total saturated fatty acids of Amphora sp.
MUR 258 tended to decrease as the temperature increased, whereas the
unsaturated fatty acids, both mono- and polyunsaturated fatty acids,
increased as the temperature increased. This may be attributed to the fact
that lipid modification and fatty acid content of microalgae growing under
different temperatures are species-specific and vary depending on their
habitats (Harwood and Jones 1989; Chen 2012). For instance, subtropical
diatom species tended to accumulate PUFAs at lower temperature and
SFAs at higher temperature, whereas temperate diatom species showed
opposite trends (Chen 2012). Polar diatoms contain high levels of PUFAs
to help maintain membrane fluidity at low temperatures (Ramachandra et
al. 2009). Also, the temperature range employed in this study (25-35oC) is
still within the optimum temperature for the growth of the alga as the
statistical analysis showed no significant difference in the growth rate of
the Amphora sp MUR 258 under different temperature tested (see section
3.2.1.2). As pointed out by Piepho et al. (2012), changes in biochemical
composition of microalgae are less likely to occur under optimum growth
conditions. Renaud et al (2002) also studied the effect of temperature on
the fatty acids composition of Australian tropical microalgae and found
that there was no significant difference in the fatty acids composition of
diatom Chaetoceros sp. over the range of temperature tested (25-35oC). The
Chaetoceros sp. is a tropical alga and the temperature tested was the typical

137
temperature range encountered in outdoors in tropical areas so that the
temperatures tested were possibly still within the optimum temperature
range for growth. The story would probably be different if the
temperature dropped too far below the optimum temperature for its
growth i.e. less than 10oC. Jiang and Chen (2000) reported that changing
the temperature from 25°C (for 48 h) to 15°C (for 24 h) resulted in an 19.9%
increase in cellular DHA content and 6.5% increase in productivity of
Crypthecodinium cohnii compared to that maintained at 25°C (for 72 h).
Rousch et al (2003) also studied the effect of heat stress on the fatty acid
composition of a thermo-intolerant (Phaeodactylum tricornutum) and a
thermo-tolerant (Chaetoceros muelleri) marine diatom under laboratory
conditions. They found that both short duration (2 h) and long duration
heat-treatments (24 h) affected the levels of fatty acids to a greater degree
in C. muelleri than P. tricornutum. In addition, irrespective of the
treatments, saturated fatty acids of both diatom species increased with
increasing temperature whereas the polyunsaturated fatty acids decreased
with increasing temperature.
It is well known that nutrient status affects the quantity and quality of
microalgal lipid fractions (Harrison et al. 1977; Enright et al. 1986) and
among nutrients, the source and concentration of nitrogen has a strong
influence on lipid and fatty acid metabolism in microalgae (Piorreck et al.
1984; Fidalgo et al. 1995). Changes in cellular composition (e.g. lipids and
fatty acids) in response to difference N sources have also been reported in
some microalgae including Phaeodactylum tricornutum (Fidalgo et al. 1995),
Isochrysis galbana (Fidalgo et al. 1998) and Dunaliella tertiolecta (Fa´bregas et
al. 1989). Wen and Chen (2001) investigated the effects of various N
sources on the fatty acids composition of Nitzschia laevis and found no
differences in the fatty acids composition of all cultures except slightly

138
large proportion of saturated fatty acids (C14:0 and C16:0) and smaller
proportion of PUFAs (C20:4 and C20:5) in ammonium media. In the
present study, Amphora sp. MUR 258 grown in urea, nitrate and
ammonium media showed very similar fatty acid composition except
higher amount of saturated fatty acids (C14:0 and C18:0) and PUFAs in
ammonium media. This study suggests that ammonium could be a good
source of nitrogen for culturing Amphora sp. MUR 258 to maximise PUFAs
production. This information is particularly important if the alga is to be
used for aquaculture purposes or for the production of high value PUFAs.
However, if we considered the alga for lipid production, urea is probably
the best choice due to the fact that Amphora sp. MUR 258 achieved its
highest biomass and lipid productivity when grown in urea media and
also urea is the cheapest N source for growing microalgae (Fidalgo et al.
1998).
In this study, it was found that C16 and C18 were the predominant fatty
acids of Amphora sp, with the C16:0 and C18:0 accounting for a maximum
of 42.1 % and 32.2% of total fatty acids, respectively. This is in agreement
with the previous studies on diatoms. For example, Al-Hasan et al. (1990)
reported the fatty acid compositions of halophyte diatom, Navicula sp
which contained predominantly palmitoleic acid (C16:1) (26.7-30.1% of
total fatty acids) and palmitic acid (C16:0) (15.8-26.0 %). Laurenco et al.
(2002) reported the predominant fatty acids of Skeletonema costatum were
oleic, palmitic and palmitoleic acid. The main fatty acids in Navicula
gregaria were palmitic and palmitoleic acids and the main ones in
Skeletonema costatum were myristic, palmitic, palmitoleic and oleic acids
(Popovich et al. 2012). In addition, the Amphora sp. MUR 258 contains
greater amount of palmitic (35.8-42.1%) and stearic acids (21.6-32.2%) than

139
soybeans which contain 10-11% and 4-5%, respectively but relatively has
the same amount of palmitic acid of palm oil (40-47%) (Knothe 2008).
Diatoms are well known as potential sources for polyunsaturated fatty
acids (PUFAs) especially eicosapentaenoic acid (EPA) (Renaud and Parry
1994). Some diatoms are known to produce high amount of EPA
including Chaetoceros calcitrans (11.1%), Thalassiosira pseudonana (19.3%)
(Volkman et al. 1989), Navicula sp (7.9-9.3% of total fatty acids) (Al-Hasan
et al. 1990), Phaeodactylum tricornutum (28.4 mg.g-1 of dry weight) (Patil et
al. 2007), Skeletonema costatum (15.4%), Chaetoceros muelleri (12.8%),
Chaetoceros constrictus (18.8%) (Zhukova and Aizdaicher 1995). In this
study, it was found that the Amphora sp MUR 258 produced a small
amount of EPA (maximum 2.4 % of total fatty acids under indoor
condition) compared to other diatoms. However, when grown outdoors,
Amphora sp. MUR 258 produced more EPA (up to 6.4% of total fatty acids)
during winter and spring (see section 4.3.2.1.3), adding to its potential for
EPA production outdoors . High variation in the EPA content in diatoms
can be attributed to several factors including silica availability, light,
temperature and culture age (Mortensen et al. 1988; Zhukova and
Aizdaicher 1995). Therefore, there is still room for optimization of EPA
production of Amphora sp. MUR 258.
The fact that C16 and C18 were the major fatty acids in Amphora sp. MUR
258 which is similar to that of vegetable oils, coupled with a low amount
of PUFAs, it is therefore reasonably to consider the Amphora sp. MUR 258
as a biodiesel feedstock since these kinds of fatty acids are recognized as
the most common fatty acids contained in biodiesel (Knothe 2008). In
addition, this strain can produce high biomass and lipid in a short time
due to its high growth rate and lipid content at exponential phase.

140
Moreover, the hypersaline Amphora sp. has another competitive advantage
in limiting contaminants since not many microorganisms can tolerate high
salt concentration (Ben-Amotz and Avron 1983) making it potential for
outdoor cultivation. However, more studies are still needed before
commercialisation of this alga as a biodiesel feedstock or PUFAs
production. Optimisations of the biomass and lipid productivity as well
as the suitability of the Amphora sp. fatty acids to suit its purposes still
need to be improved. For example, shifts of temperature and salinity
strategies are worth to be explored to maximize the productivity and to
tailor the desired fatty acids compositions.
4.4.2 Outdoor Studies
4.4.2.1 The long-term culture of the Amphora sp. MUR 258 in a 1m2
outdoor raceway pond
The ability of microalgae to grow in a continuous or semi-continuous
culture for long periods is the most important aspect of commercially
successful microalgal culture (Moheimani and Borowitzka 2006). The
present study has shown that the newly isolated hypersaline Amphorasp
can be grown reliably under outdoor conditions for a period of at least 13
months (December 2011 to January 2013). To my knowledge, this is the
first study on the long-term growth of a hypersaline diatom under
outdoor conditions.
To grow in open ponds outdoors, microalgae must be able to tolerate a
wide range of environmental conditions. Temperature and light are
environmental factors to which the alga respond continuously and these
factors are changing throughout the day and along the seasons (Richmond
1986b). Amphora sp MUR 258 is considered to be a mesophilic strain that
could tolerate a wide range of temperatures prevailing outdoor conditions

141
throughout summer and winter seasons and its optimum temperature for
growth is relatively high. When grown outdoors, an increase in air
temperature up to 42oC in hot sunny days during summer did not cause
any harmful effects to the culture. Amphora sp achieved its maximum cell
density, specific growth rate and biomass productivity in summer.
Amphora sp is not the only alga able to grow at high temperatures. Some
diatoms are also known to thrive at high temperature. For instance,
Chaetoceros muelleri showed its capacity to grow over a wide range of
temperature up to 35oC on a thermal gradient plate (McGinnis et al. 1997),
Chaetoceros muelleri, Seminavis gracilenta and Cylindrotheca sp also grew
well in a summer greenhouse cultured in 20-L transparent plastic carboys
where the temperature reached up to 38oC at noon (Chen 2012).
In response to light, Amphora sp seems to adapt well to high light intensity
based on the fact that there was no lag phase observed when the culture
was operated under low cell density for about three weeks during
summer and the specific growth rates of the alga during this period were
still high.It seems that the Amphora sp has high light intensity saturation
coefficient. As pointed out by Fon Sing et al. (2013) microalgae with a high
intensity saturation coefficient are less likely to experience photoinhibition
when exposed to high irradiance and this is one of the desirable
characteristics of strains best suited to be cultured commercially on a large
scale outdoors. The reason for this can be attributed to the fact that the
Amphora sp has already adapted to high light intensity considering that
the culture had been exposed to high irradiance for about two months
during summer.
The results also indicated that the culture of Amphora sp was better to
operate at higher cell density during summer and autumn resulted in

142
higher biomass and lipid productivity. During winter, the maximum cell
density of the Amphora sp was about three times or more less than that in
summer, so that the specific growth rate and biomass productivity were
greatly reduced. Maintaining the culture at cell density around 30-50x104
cells.mL-1 with dilution rate of about 20-25% still showed good growth.
However, as the cell density dropped to below 20x104 cells.mL-1 from the
end of July, the growth of Amphora sp slowed due to a combination of the
effects of low light, heavy rainfall, short days and very cold temperatures.
Amphora sp MUR 258 is considered as a euryhaline and hypersaline alga
due to its ability to tolerate wide range of high salt concentration. Some
species of diatoms can also be found in hypersaline environments
including Amphora coffeaeformis, Nitzschia and Navicula species (DasSarma
and Arora 2001). However, no information is available regarding their
growth performance over a wide range of hypersaline conditions.
In terms of salinity tolerance, the culture of Amphora sp MUR 258 in
outdoors could grow up to 15% NaCl. In a separate study indoors (data
not shown), Amphora sp showed no growth at a salinity of 14% NaCl. This
suggests that long-term exposure to high salinity has led to adaptation
allowing the Amphora to grow at higher salinity. In addition, outdoor
conditions are a complex environment in which many factors interact
simultaneously at any one time. The interaction between various factors
including temperature, salinity, and irradiance are changing
simultaneously from time to time and how this interaction affected the
growth of the Amphora sp are still not well understood. Therefore, more
studies are required to better understand the adaptation mechanisms of

143
Amphora sp MUR 258 in response to salinity changes as well as the
interaction between salinity and other factors limiting growth. .
Long-term data on productivity of microalgae cultured in open ponds are
very limited (Borowitzka and Moheimani 2013b). Among them are the
productivity of Pleurochrysis carterae cultured in 1m2 raceway ponds in
Perth, Australia over 12 months period ranged from 16 to 33.5 g dry
weight.m-2.d-1 (Moheimani and Borowitzka 2006). Tetraselmis sp cultured
in a raceway pond in Japan for 12 months period achieved the
productivity range of 5-40 g dry weight.m-2.d-1(Matsumoto et al. 1995). An
annual average productivity of 15 g dry weight.m-2.d-1 of Scenedesmus
obliquus was achieved in a raceway pond in Bangkok, Thailand (Payer et
al. 1978). In the present study, the productivity ranged from 3-24 g
AFDW.m-2.d-1 (annual average of 7 g ash free dry weight.m-2.d-1). It is to be
noted that that in here I aimed to study the reliability of Amphora long-
term cultivation under real outdoors conditions. No CO2 was added to the
culture for the duration of the cultivation. If CO2 was added, the
productivity can potentially be increased as observed by Moheimani and
Borowitzka (2011) who studied the effects of increased CO2 on the growth
of Pleurochrysis carterae in open raceway pond and found that CO2
addition increased the biomass productivity.
Based on this study, high growth and productivity of the Amphora sp
culture can be consistently maintained throughout the year if the alga is
developed in the best suited areas (note that the average biomass and lipid
productivity during summer excluding the three weeks period when the
culture was run at very low cell density were about 18.3 g ash-free dry
weight.m-2.d-1 and 4.5 g ash-free dry.m-2.d-1, respectively). Since the
specific growth rate of Amphora sp was positively correlated with both

144
temperature and solar irradiance, it is therefore important to consider
developing the alga in places with high average solar irradiance and high
daily air temperature. There are some locations in Australia with these
conditions (i.e. Karratha in North of Western Australia) (Moheimani 2013;
Boruff et al. 2015). If we develop this alga in Karratha, the biomass
productivity could possibly be increased to over 20 g ash-free dry
weight.m-2.d-1 considering that the solar irradiance and daily air
temperature in this area are higher and relatively stable throughout the
year compared to Perth. Furthermore, regular harvesting every 1-2 days
with removal rate of 50% will maximize the productivity considering that
the doubling time of the alga is about two days and the higher
productivity is achieved at that renewal rate in summer.
One of the major challenge of algal cultivation in outdoor open system is
maintaining monoalgal culture (Borowitzka and Moheimani 2013a).
Contamination by other algae, bacteria, protozoa, zooplankton and fungi
is unavoidable and may reduce the yield/productivity. In the worst case
scenario, contaminants may take over the culture and become the
dominant species or cause culture collapse (Richmond 1986b). The main
reason for the absence of the contaminants in the first three months of the
cultivation was that the culture conditions during summer (high
temperature and irradiance) appear to be optimal for Amphora sp. MUR
258. Contamination by Dunaliella sp and Tetraselmis was unavoidable
because the two species were cultured at the neighbouring ponds
whereas, another contaminant, Navicula sp seems to favour winter
conditions. Interestingly, in the presence of the latter, the growth of
Dunaliella sp and Tetraselmis decreased gradually before they were
completely eliminated by the end of October 2012. The Navicula sp seems
to out-compete the other species in terms of low temperature tolerance
145
and ability to optimize use of low light. It is also possible that the Navicula
sp might release inhibitory substances/toxins that inhibit the growth of
other microalgae. Some algae are known to produce inhibitory substances
including P. carterae (Moheimani and Borowitzka 2006), Nitzschia palea
(Jorgensen 1956) and, Skeletonema costatum (Imada et al. 1991).
Some strategies were applied to control the contaminants. Maintaining
the salinity in the pond at around salinity optimum for the Amphora sp
(10±1% NaCl) but sub-optimal for the growth of the Dunaliella and
Tetraselmis was successful to inhibit/supress the growth these
contaminants. Also, with a fast growing alga like Amphora sp, regular
harvesting washed out the contaminants from the pond. However, the
presence of a cold-loving contaminant (Navicula sp) that appeared to have
similar salinity optimum with Amphora sp changed the whole story.
Navicula sp became the dominant species for about two months before the
Amphora sp recovered by the end of October 2012.
Although contamination by other algae is a problem, it can also be a good
starting point for future studies. The ability of a contaminant to dominate
an algal culture show its superiority over the target species and if the
superior characteristics are combined with other desirable characteristics
for commercial applications (i.e. high lipid content and PUFAs); the
contaminant can be a considered as a potential candidate for future
development. Furthermore, understanding the contaminants will help
dealing with their reoccurrence. We decided to isolate the Navicula sp
contaminant with the consideration that the species grew fast in the cold
weather at low irradiance. Most importantly, it is a hypersaline alga that
can grow up to at 15% NaCl with relatively high lipid content making it a
potential candidate to be developed in outdoor open pond system in the

146
places with low daily air temperature and irradiance. Alternatively, the
Amphora sp and Navicula sp can be co-cultivated so that the annual
productivity can be maximized consistently throughout the year.
Lipids are the main storage product in diatoms due to the fact that oil
droplets are present in the cells (Lewin and Guillard 1963). Diatoms also
use the polysaccharide chrysolaminarin as a sometimes significant
storage product (instead of starch) (Myklestad 1977). Diatom lipid
accumulation is affected by numerous factors including salinity (Khatoon
et al. 2010), silicon deficiency (Roessler 1990), nitrogen depletion (Collyer
and Fogg 1955; Badour and Gergis 1965), drying or desiccation (Evans
1958), culture age (Lombardi and Wangersky 1995; Popovich et al. 2012).
In the present study, I found that the Amphora sp lipid content per cell was
higher in winter than summer. On the other hand, very low specific
growth rate and biomass yield contributed to the low lipid productivity of
Amphora in winter. Higher lipid accumulation within the cells resulted
from the continued accumulation of the lipids as the storage products
while cell division was inhibited during winter when the temperatures
dropped far below the optimal temperature range for growth. As pointed
out by Ramachandra et al. (2009), storage lipids are used for long-term
survival under unfavourable environmental conditions.
The fatty acid composition of the Amphora sp. MUR 258 under outdoor
conditions is similar to that for the alga grown indoors. However, the
amount of the each fatty acid varied between seasons. That differences
can be attributed to the varying environmental conditions (i.e.
temperature, salinity and light intensity) encountered outdoors.
According to Chen (2012), diatoms response to their environmental
changes by changing their lipid/fatty acids composition. A study done by

147
De la Pena (2007) also found that the lipid and fatty acids composition of
Amphora sp did not vary between indoor and outdoor except for the SFA
which was higher under outdoor condition.
In summary, Amphora sp. MUR 258 showed an ability to grow in outdoors
over one year period (13 months). The highest cell density, specific
growth rate and biomass and lipid productivity were achieved in summer.
Biomass and lipid productivities can be further increased since the
growing conditions of the alga in this study have not been optimized.
Therefore, further studies aiming to maximize the productivities are
needed including CO2 addition, determination of optimum depth and
harvesting rate at different seasons as well as interaction of limits to
growth factors.
4.4.2.2 Effect of different pond depth on the growth of Amphora sp.
MUR 258
One of the important parameters affecting the productivity of raceway
ponds in outdoors is pond depth (Abeliovich 1980; Azov et al. 1980). At
very dense cultures in ponds outdoors, light can only penetrate up to a
depth of about 5 cm (Oswald 1988) and to no more than 7 cm in less dense
cultures (Richmond 1986b). In this study it was found that the alga had
higher specific growth rate and biomass productivity at 20 cm depth than
at 15 cm. This suggest that Amphora sp MUR 258 has the ability to
optimise the use of light at low irradiance in winter so that higher
productivity can still be achieved even at a higher depth which is also in
agreement with the indoor studies in which the cells grew very well to a
very dense culture (maximum cell density 291x104 cells.mL-1) at a very
low irradiance (65±5 µmol photons.m-2.s-1) (see section 4.4.1.1).

148
Higher growth rate and biomass productivity at the beginning of the
culture period can be attributed to the relatively higher irradiance,
temperature and no rainfall. However, lower growth rate and
productivity recorded at the end of the culture period possibly due
combination effects of much lower irradiance and temperature during that
time. Based on this study, the biomass productivity can potentially be
increased during summer at much higher pond depth (>20 cm).
Moheimani and Borowitzka (2007) studied the effect of different pond
depth on the productivity of Pleurochrysis carterae under semi-continuous
mode during autumn and summer. They found that the productivity was
markedly higher in summer than autumn and the maximum productivity
in autumn was achieved at 16 cm, whereas in summer the maximum
productivity was achieved at 21 cm depth. Based on the previous study at
the same location (Algae R and D centre at Murdoch University) and
considering the variation of irradiance throughout the year, it is therefore
important to further study the optimum pond depth for optimum growth
of the Amphora sp MUR 258 in outdoor raceway pond at different seasons
so that maximum productivity can be achieved throughout the year by
managing the pond depth.
4.4.2.3 Effect of heated and unheated ponds on the growth of Amphora
sp. MUR 258
This experiment was done in winter due to the fact the Amphora sp. MUR
258 grow better at high temperatures and thus heating up the cultures
would be expected to show a greater effect on productivity. In this study,
it was found that the heated culture performed better than the unheated
culture. Lower productivity at both conditions in the early culture period
coincided with very low temperatures during the first few days of
culturing (3.7-5.3oC, Bureau of Meteorology data 2012). Heating the

149
culture resulted in an average 10oC increase in temperature which in turn
supported the growth of the Amphora culture. Low morning temperature
has been shown to decrease the productivity of Spirulina and Chlorella up
to 30% (Richmond et al. 1980). Laws et al. (1988) found a significant
increase in the yield of Chlorella grown in outdoor raceway pond when the
culture temperature was increased by 10-15oC during winter. Vonshak et
al (2001) reported a larger decrease in almost all photosynthetic
parameters when cultures exposed to suboptimal low temperature even
for a short time. They found a large increase (60%) in productivity of the
heated culture compared to that of the unheated one. Moheimani and
Borowitzka (2006) also observed a significant increase in the daily biomass
production of Pleurochrysis carterae by 11 – 21% and the lipid productivity
by 14-25% when the morning temperature was increased artificially (3-
5oC) by adding pre-heated medium to a pond compared to an unheated
culture during winter.
4.4.2.4 Effect of intermittent mixing on the growth of Amphora sp.
MUR 258
In this study it was found that the growth of Amphora sp. MUR 258 was
greatly improved under continuous mixing although biomass yield and
biomass productivity showed no significant difference between
treatments. This study suggest that continuous mixing is required to get
the optimum growth especially with the Amphora sp. MUR 258 which has
a tendency to sink under unmixed condition due to heavy silicified cell
walls. The development of nutritional, gaseous and thermal gradients can
also be minimised through mixing by reducing the boundary layer around
the cells which in turn leads to better nutrient and cellular metabolites (i.e.
oxygen) mass transfer (Grobbelaar 1994). Moreover, continuous mixing
also reduces cell sticking and the formation of biofilms on the pond’s wall.

150
A similar study done by Cuello et al. (2015) investigated the growth of
halophilic green alga Tetraselmis suecica in outdoor raceway ponds under
three different mixing regimes (continuous mixing, stopped overnight and
restarted 1 h after sunrise, and stopped overnight and restarted 1 h before
sunrise). They found that there was no significant different in the growth
rate, biomass productivity and cell weight between treatments hence
saving power (37%) and energy-related cost by up to 33%.
It is noted that this experiment was run in winter when the Amphora sp.
MUR 258 has a tendency to stick to a substrate under the suboptimal
temperature during winter. Therefore, mixing continuously is required
for optimum growth during winter months. The results will probably
different if the experiment is run in summer/spring/autumn (optimum
growth condition for the Amphora sp. MUR 258) as the algal cells do not
stick to a substrate at higher temperatures. However, time limitation
precluded similar studies in other seasons. Therefore, further study is
needed to test the same experiment at different seasons.
4.5 Conclusion
It is evident that the newly isolated halophilic diatom, the Amphora sp.
MUR 258, is a very potential strain to be mass cultivated outdoors as lipid
producer due to its ability to accumulate high lipid content at exponential
phase allowing high lipid productivity, its ability to grow well over a wide
range of temperatures, its ability to grow on seawater at hypersaline
condition with minimal/no dilution with freshwater, its efficient use of
nutrients, its unusual non-sticky behavior allowing growth in raceway
ponds and thus being suitable for large-scale production and most
importantly its ability to grow reliably in outdoors for long period.
Moreover, this diatom has a fatty acid profile potentially suitable for

151
biodiesel. However, further studies are still needed to optimise the
culture conditions in order to maximise biomass and lipid productivity
and possibly also to tailor the fatty acid composition to best suit a
particular application (i.e biodiesel feedstock, aquaculture feeds, PUFAs
production etc).

152
CHAPTER 5. BOTRYOCOCCUS BRAUNII 807/2 – A CAROTENOID PRODUCER
5.1 Introduction
Carotenoids are one of the potential high-value products from microalgae
and also the focused of my study. As one of the newly isolated species
(the coccoid red) which was isolated from a hypersaline pond and initially
considered as potential species for carotenoid production failed to meet
the basic criteria (see section 3.1.3), I then went through our culture
collection at Algae R & D centre to search for a potential strain as
carotenoid producer. Another potential candidate for carotenoid
production identified was Botryococcus braunii 807/2. A very interesting
feature of this strain was that the colour of the culture changes from green
to deep red/orange under certain conditions (i.e. high light, stationary
phase). Some very old cultures (more than one year old) still preserved
their bright red/orange colours. Preliminary investigation on the
carotenoids content using TLC identified some orange and yellow
pigments as β-carotene, echinenone, lutein, canthaxanthin and
astaxanthin. In addition, the B. braunii strain 807/2 has been studied
intensively at the Murdoch University Algae R&D Centre in relation to its
hydrocarbon production. For example, Ngoon (2011) studied the B.
braunii strain 807/2 for its potential for biofuel production and concluded
that this strain is a potential strain for biofuel production due its
remarkably high hydrocarbon content. Moheimani et al (2013b) studied
the possibility to extract the external hydrocarbon of the B. braunii strain
807/2 using non-destructive methods and found that the external
hydrocarbon can be non-destructively extracted and recovered almost all
the hydrocarbon produced. Zhang (2015) had also studied the B. braunii
807/2. He particularly focused on the long-term reliable cultivation of the
strain in both open ponds and closed photobioreactors and also on the

153
limits to growth factors of the strain. He found that this strains could be
grown reliably in outdoor raceway ponds for over 5 months (the longest
cultivation period reported for this strain) compared to that of biocoil
which was difficult to manage due to biofilm formation. Hence, we have
lots of important information about the strain specifically related to its
limits to growth factors making the cultivation processes easy. Therefore,
the aim of the experiments reported in this chapter was to analyse
carotenoid types and the rate of carotenoid production of B. braunii 807/2
under different growth conditions. The carotenoid composition between
green, intermediately pigmented and red B. braunii grown under different
growth conditions was also examined
5.2 Materials and methods
5.2.1 The source of the strain
Botryococcus braunii CCAP 807/2 which was isolated by Jaworski in 1984
from lake Grasmere, Cumbria, England (Hilton et al. 1988) was obtained
from the Culture Collection of Algae and Protozoa (CCAP) and
maintained at the Murdoch University Algae R&D Centre.
5.2.2 Carotenoid production of B. braunii 807/2 under different growing
conditions
5.2.2.1 Culture conditions
Botryococcus braunii 807/2 was cultured in 6 x 1 L Schott bottles containing
750 mL of medium. The cultures were grown at two different light
intensities (100 and 500 µmol photons m-2 s-1) and three different media
compositions: a) control with complete modified CHU 13 medium (see
section 2.1 for more details), b) modified CHU 13 without N, and c)
modified CHU13 without N + 2Fe). The inoculum was centrifuged and

154
the supernatant was discarded before adding the fresh medium (CHU 13
with N, CHU 13 without N and CHU 13 without N+2fe). All cultures
were grown at 25oC with 12h: 12h light:dark cycle and were mixed with
magnetic stirrers. The experiment was run in batch mode for 5 weeks.
5.2.2.2 Sampling
Sampling for DW/AFDW, lipids, chlorophyll and carotenoids was carried
out on weekly basis (see section 2.2 for more details).
5.2.2.3 Carotenoid analysis using quantitative Thin Layer
Chromatography (TLC)
5 mL of the cultures were filtered through GF/C (Whatman) filters. The
filters containing cells were put in 4 mL glass test tubes. About 1 table
spoon of liquid N2 was added into each of the tube and incubated for 30
min. The cells were then crushed with a glass rod until a smooth red paste
of about 0.5 mL was obtained. 1 mL of 90% ice-cold acetone was added
into the tubes, homogenized well with a glass rod and then transferred in
a plastic centrifuge tube with screw cap. Another 1 mL of acetone was
added into the glass tube to wash and clean all the remaining cell debris
which was also transferred into the centrifuge tubes and then centrifuged
at 1107xg for 10 minutes. After centrifugation, the supernatant was
transferred to a 10 mL graduated glass centrifuge tube. For the second
and third extraction, 2 mL of acetone were added to pellet in the
centrifuge tube, vortexed to resuspend the pellets and then centrifuged
again at 1107xg for 10 minutes. The supernatants were combined in the
glass tube. The samples were then evaporated with a stream of N2 gas to
about 2 mL. The same amount of petroleum spirit (boiling range point 40-
60oC) (about 2 mL) was added and then left for partition to occur. The top
phase was transferred into a vial and evaporated to complete dryness

155
under a stream of N2 gas. The dried pigment was stored in a freezer in a
tightly sealed container until further analysis.
The separation of the carotenoids in the extract was performed using thin
layer chromatography. The dried pigment was dissolved in 1 mL acetone.
The pigment extract was applied/loaded as a 150 mm wide band to an
activated silica gel plate (standard 20x20 cm aluminium-backed TLC
plate/Merck TLC Silica Gel 60F254). Activation of the plate was done by
heating the plate for 1 h at 120oC. The loaded TLC plate was transferred
into a saturated developing chamber containing 100 mLsolvent mixture of
acetone: hexane: petroleum spirit (boiling point range 40-60oC) (20 mL: 10
mL: 70 mL). The plate was then removed and dried once the
chromatogram was complete. The pigment bands were identified based
on the calculated Rf values and then compared them with the Rf values in
literatures. The pigment bands with yellow, red and orange colours were
recovered by carefully scraping off using a plastic blade. Each individual
pigment powder was eluted with 2 mLethanol and then centrifuged at
1107xg for 10 minutes. The volume of the samples/supernatant was
recorded and then the absorption spectrum was measured between 400-
700 nm. Concentration of the carotenoids was calculated according to the
below equation(Howieson 2001):
𝑪 =𝑨 × 𝟏𝟐𝑬𝟏 𝑷𝒎𝟏%
Where:
C = concentration of carotenoid in mg.mL-1
A = measured absorbance at wavelength of maximum absorbance
E1%1cm = 2600 for β-carotene
E1%1cm= 2500 for xanthophyll (zeaxanthin, lutein, violaxanthin,
neoxanthin)

156
E1%1cm = 2200 for keto-carotenoids (astaxanthin, canthaxanthin)
The total carotenoid content was determined by summing all the
individual carotenoid concentrations. As a general precaution, all the
processes were done under dim light and the pigment extracts were kept
cool at all times by placing them in a cool box on ice.
5.2.3 Comparison of carotenoid composition of green, intermediate and
red cells of B. braunii 807/2 cultured in indoors and outdoors
5.2.3.1 Sample collection
For indoor cultures, the green/intermediate green cells were collected from
a 2 months culture grown at 25oC, 150-200 µmol photons m-2 s-1 in a 20 L
carboy containing about 15 L culture. The intermediate red and red cells
grown at 25oC, 150-200 µmol photons m-2 s-1 in several 1L flasks containing
about 500 mL culture per flask were collected from old cultures about 6
and 8 months old, respectively. The cells were collected by filtering the
culture throughWhatman GF/C filter papers.
For the outdoor cultures, the green/intermediate green cells of B. braunii
collected from a 1m2 raceway pond (2-3 months old) were concentrated by
first settling the cultures in a bucket, decanting the water then filtering the
colonies throughWhatman GF/C filter papers. The intermediate half green
and half red cells were collected from a 1m2 raceway pond (about 6
months old). To obtain the red cells, the intermediate half green and half
red culture from the 1 m2 raceway pond was transferred into a 10 m2
raceway pond and then topped up the pond with tap water only. The
culture turned red after 1-2 weeks (note that this occurred in summer).
The red cells were harvested by just scraping them off the wall of the pond

157
as these cells stick to the pond’s wall. The samples were then lyophilized
and stored in the freezer until further analysis.
5.2.3.2 Carotenoid determination by HPLC
In the previous experiment (section 5.2.2), I aimed to determine the rate of
carotenoid production under different conditions quantitatively using
TLC. This experiment was then carried out to obtain more detailed
information about the types and the amount of individual pigments by the
means of HPLC and to see how these pigments change as the cells change
from the green to the red stage. This experiment was done in
collaboration with Prof. Einar Skarstad Egeland from Dobo University
College (Norway).
To obtain the best possible extraction solvent/procedure, several extraction
methods were tested. All extractions were performed at room
temperature in darkness (wrapped in a thick black cloth). A tip of a
spatula with red or green cells was transferred into separate test tubes
(test tubes with screw cap). Approximately 2 mL of solvent was added
into the tube and then flushed with nitrogen gas to prevent oxidation. The
following solvents or solvent mixtures were tested:
A. 30 % methanol, 70 % acetone (Grung et al. 1994a; 1994b)
B. benzene
C. methanol
D. ethanol
E. ethyl acetate
F. acetonitrile
G. acetone
H. 90 % acetone, 10 % water
I. isopropyl acetate
158
J. pyridine
K. chloroform
L. 50 % chloroform, 50 % methanol
M. hexane
N. the freeze dried cells were first moisturised by addition of a few drops
of DI water and after 5 minutes approx. 2 mL of a mixture of 50 %
chloroform, 50 % methanol was added
Upon comparison of the extraction methods, the treatment L and N
showed the best results, although still a bit of colour was seen in the cells
indicating that not all pigments were completely extracted from the cells.
Treatment N was efficient for green cells. For red cells, treatment L was
better. Because some samples contained a mixture of red and green cells,
extraction method N was selected for the analysis of all samples. The
lyophilised cells were soaked in solvent for three days at room
temperature under nitrogen in darkness. After extraction, the cells were
filtered and the residue flushed with a small amount of acetone followed
by evaporation to dryness under reduced pressure with some absolute
ethanol added before evaporation to remove the water. The dried
pigments were immediately re- dissolved in acetone (approximately 1 mL)
and analysed by HPLC. For all the above treatments, the cells with
solvent were kept in a refrigerator, in darkness at approx. 2°C.
The HPLC separation was performed using an Agilent 1100 HPLC
instrument with vacuum degasser, thermostatted autosampler with
enlarged injection loop, quaternary pump, thermostatted column
compartment, and diode array detector on a reversed phase C18 column
(ACE 5 C18 part no. ACE-121-2546, 4.6_250 mm each, with 5 mm packing)

159
as describe in Egeland (2012). The identity of the pigments was checked on
a normal phase silica column (Grung et al. 1994a). All pigments were
identified on the basis of retention time compared with an external
standard and their visible spectra. Quantification was done on the basis of
the calibration performed just before analyzing the samples. Pigments
used for calibration were either donated or purchased from a commercial
entity (CaroteNature, DHI, DSM, Sigma-Aldrich, and VWR), or isolated
from a known source. The HPLC was calibrated for chlorophylls and
carotenoids using the absorption coefficients (Egeland 2011; Egeland
2012).
5.3 Results
5.3.1 Carotenoid production of B. braunii 807/2 under different growth
conditions
5.3.1.1 Growth
The growth of B. braunii was followed by determining its biomass because
it was difficult to follow the growth based on the cell numbers as this
strain was colonial. This study showed that the alga grew very slow. The
biomass of the cultures grown at low light intensity increased gradually
from 0.35-0.4 g.L-1 on day 2 to 0.55-0.6 g.L-1 on day 30. The cultures grown
without N and without N with 2 x Fe concentration had higher biomass
and continued to increase towards the end of the culture period, whereas
the biomass of the control remained steady after day 23. On the other
hand, the biomass of the cultures grown at high light increased from 0.4
g.L-1 on day 2 to a maximum of about 0.6 g.L-1 on day 16 and entered
stationary phase towards the end of the culture period, except for the
control culture which continued to increase to around 0.7 g.L-1 on day 30
(Figure28).

160
Figure 28. Biomass of B. braunii at low light (100 µmol photons m-2 s-1) and high light (500 µmol photons m-2 s-1) under different growing conditions (● = control, ○ = without nitrogen and ▼= without nitrogen+2Fe). Data represent mean±range, n=3
5.3.1.2 Lipid content
The total lipid yield of B. braunii grown under different condition showed
a different pattern. In low light, the lipid content on day 2 and 30 was
about the same, whereas in high light there seems to be a gradual increase
in lipid over time (Figure29).
Figure 29. Total lipid yield of B.braunii at low light (100 µmol photons m-2 s-1) and high light (500 µmol photons m-2 s-1) under different growth conditions. Data represent mean±range, n=3

161
5.3.1.3 Chlorophyll and carotenoid content
The culture colour changed greatly with culture age, especially at high
light intensity. The culture grown without nitrogen and with two times
iron showed a dramatic change from green to yellow-orange colour on
day 2 and stayed the same colour until about day 16 before changing
colour to pale yellow. The culture grown without nitrogen also changed
from green to yellowish colour on day 5, whereas the control culture
remained green. In low light, the colour of the cultures did not change
very much. The cultures grown under nitrogen limitation changed colour
from green to brownish/yellowish after one week of culturing whereas the
control culture stayed green over the whole culture period (Figure30).
A
B
Figure 30. The colour of the B. braunii cultures (A). Cultures at low light (100 µmol photons m-2 s-1) after one week; control, without N, without N+2Fe. (B) Cultures at high light (500 µmol photons m-2 s-1) after one week; control (CHU 13), without N (-N), without N+2Fe (-N+2xFe).

162
Chlorophyll a and b content of B. braunii grown under low and high light
is shown in Figure 31. The chlorophyll a content of the control cultures
under low and high light followed a similar upward trend reaching a
maximum on day 23. The chlorophyll a content of the nitrogen limited
cultures was remained stable at around 4-6 mg.L-1 under low light,
whereas under high light, the chlorophyll a content of nitrogen limited
cultures decreased to below 2 mg.L-1 from day 9. The chlorophyll b
content of the control cultures under low and high light reached
maximum on day 9 at around 3 mg.L-1. The chlorophyll b content of
nitrogen limited cultures at low light remained steady at around 2 mg.L-1
whereas their counterparts at high light decreased with time, reaching
about 0.3 mg.L-1 on day 30.
Figure 31. Chlorophyll a and b content of B. braunii at low light (100 µmol photons m-2 s-1)and high light (500 µmol photons m-2 s-1) in three different media. Data represent mean±range, n=3

163
The carotenoid production of B. braunii 807/2 at high light intensity was
faster than that al low light intensity. After two days of cultivation, the
cultures grown under high light had 50-100% more carotenoids than their
counterparts grown at low light (Figure 32). Irrespective of the growth
conditions, the maximum carotenoid content at low light was achieved on
day 9. At high light, the highest total carotenoid was also achieved on day
9 from the culture grown without N and with 2xFe concentration whereas
the control culture and the one without N had about 50% less carotenoid
content than the one cultured with 2xFe concentration. From the results
presented in Figure 32, the total carotenoid productivity and the total
carotenoid content in % AFDW were calculated. The carotenoid content of
B. braunii 807/2 ranged from 0.03-0.12% AFDW and the productivity of
total carotenoid ranged from 0.01-0.04 mg.L-1.d-1.
Figure 32. Total carotenoid content of B. braunii at low light (100 µmol photons m-2 s-1) and high light (500 µmol photons m-2 s-1) in three different media

164
Botryococcus braunii 807/2 grown in three different media displayed
different pigment bands (Figure 33). At low light intensity, several
pigment bands appeared including yellow pigments (β-carotene and
lutein), olive green pigment (pheophytin), red/orange pigments
(canthaxanthin and neoxanthin) and the most prominent green pigments
(chl a and b). However, at high light intensity, more yellow/red/orange
pigments appeared as the culture age with no more chlorophylls observed
on day 16 from N-free medium and medium with extra iron.

165
A (Low Light, day 2) B (Low Light, day 16)
C (High Light, day 2) D (High Light, day 16)
Lane 1 2 3 1 2 3
Figure 33. TLC of the pigment extracts of B. braunii under low light (100 µmol photons m-2 s-1) on day 2 (A), day 16 (B) and under high light (500 µmol photons m-2 s-1) on day 2 (C) and day 16 (D). Lane 1, 2 and 3 represent control, without N and without N+2Fe, respectively. Labels represent a (β-carotene), b (canthaxanthin), c (pheophytin), d (neoxanthin), e (Chl a), f (chl b), g (lutein), h (keto-carotenoids)

166
5.3.2 Comparison of carotenoid composition of green, intermediate and
red cells of Botryococcus braunii807/2 cultured indoors and outdoors
The carotenoid composition of green, intermediate and red cells of indoor
and outdoor cultures was compared to see how the carotenoid
composition changes over time. The green cells represented actively
growing cells under optimal condition (i.e. nutrient sufficient). The
intermediate cells were the cells that started to change colour from green
to red. These types of cells were mostly found at late stationary phase
whereas red cells were the cells that accumulated high amount of
carotenoids accompanied by chlorophyll breakdown. The results for each
pigment could not be given on a cell basis, only as % of total carotenoids
as even the best extraction methods gave no complete extraction (see
section 4.2 for more details).
The results showed that B. braunii 807/2 accumulates lutein, canthaxanthin
and astaxanthin as the main carotenoids. Whilst lutein was the major
carotenoids of the green/intermediate cells, canthaxanthin and astaxanthin
were the predominant carotenoid of the red cells under indoor and
outdoor culture, respectively (Figure 34). As the cells change from the
green to the red stage, major changes of some carotenoids were observed.
The most striking feature was the changes in lutein and astaxanthin
content. The lutein content of intermediate cells decreased dramatically
from 55% to 12% in the outdoor culture and from 43% to 5% in the indoor
culture. In contrast, astaxanthin content increased significantly from
undetected in the green cells (both indoor and outdoor) to about 7%
(indoor) and 28% (outdoor) (Table21).

167
Figure 34. The HPLC histograms of the green cells (top panel), the red cells indoor (centrepanel), and the cells outdoor (bottom panel)

168
Table 21. Carotenoid composition of green, intermediate and red cells of B. braunii807/2 grown indoors and outdoors
% of total carotenoids
Types of carotenoids
Green/ intermediate
cells (outdoor)
Green/ intermediate green cells
(indoor)
Intermediate half red and
half green cells (outdoor)
Intermediate red cells (indoor)
Red cells
(indoor)
Red cells
(outdoor)
β,ε-carotene 0.5 0.6 - 0.2 0.2 0.1 Lutein 55 43 33 30 5 12 β, β-Carotene 7 8 2.1 2.9 4 0.9 Violaxanthin 1.8 3.7 1.1 2.0 0.4 0.6 Neoxanthin (cis+trans)
10 9 5 2.1 0.5 2.3
Echinenone 1.2 1.7 0.7 2.1 9 0.7 Canthaxanthin 3.4 3.2 6 17 16 13 Adonixanthin 0.8 1.2 6 6 7 13 Idoxanthin 0.1 3.6 0.8 - 7 0.3 Astaxanthin - - 9 3.2 7 28 Total carotenoids with known identity (%)
79.8 74 63.7 65.5 56.1 70.9
Total of minor+degraded + unknown carotenoids (%)
20.2 26 36.3 34.5 43.9 29.1
Not all carotenoids could be identified. The total of minor, degraded and
unknown carotenoids ranged from 20.2% (green cells indoor) to 43.9%
(red cells indoor). The inability to accurately identify all the carotenoids
was due limitation of available reference standards. For example, we did
not have available botryoxanthins or braunixanthins as reference
standards, so we could not indicate their presence in the algal cells.
However, if they are present, they are only present in minor amounts.
Some minor pigments could also be 3/3’/4’-hydroxyechinenone and
adonirubin (metabolic intermediates in the biosynthesis of astaxanthin), as
also here, no reference standard was available. Many of the minor
carotenoids were assumed to be cis isomers, often present in extracts of

169
lyophilised cells, despite not being present in intact cells (Egeland, pers
communication).
5.4 Discussion
5.4.1 Carotenoid production of Botryococcus braunii 807/2 under
different growing conditions
5.4.1.1 Growth
Botryococcus braunii is a slow growing alga (Wolf 1983). In the present
study, it took about 16 days for the cultures to double their biomass under
high light intensity and over 30 days under low light intensity. The slow
growth rate of B. braunii can be attributed to its unusual morphology. As
suggested by Belcher (1968), the slow growth may be due to the colonial
matrix of the alga that hinders cellular gas exchange and also due to the
ability of the alga to direct metabolism into metabolically expensive lipids.
Another possible explanation as pointed out by Murray and Thomson
(1977) is that the abundance of the carotenoid matrix reduced the light
reaching the chloroplasts of the cells.
Zhang (2015) also studied the same strain of B. braunii 807/2 and found
that the highest specific growth rate was about 0.45 d-1 between day 0 and
2 but afterwards, the specific growth rate declined to an average of
0.04±0.03 d-1 or doubling time of about 17 days. Largeau et al. (1980)
reported the generation time of B. braunii grown in unshaken and
unaerated batch cultures at 20oC was about 1 week on average. However,
when the cultures were grown with shaking and aeration with 1% CO2
and by increasing the temperature to 26oC, the generation time was
reduced to about 2.5 d-1. Li and Qin (2005) reported the specific growth
rate of B. braunii NIES-836 (0.09 d-1), B. braunii UK 807-2 (0.18 d-1) and B.
braunii CHN 357 (0.2 d-1). The specific growth rate of B. braunii LB-257 was

170
0.07 d-1(Ranga Rao et al. 2007b), 0.13 d-1 for B. braunii 765 (Ge et al. 2011),
0.15 d-1 for B. braunii IPE 001 (Xu et al. 2012) and 0.17 d-1 for B. braunii B70
(Tanoi et al. 2011).
At higher irradiance the cultures grew better. The control culture
continued to grow towards the end of the culture period presumably as
nutrients were still available to support cell growth, whereas the growth
of the nutrient limited cultures remained steady day 16 concomitant with
the decrease in chlorophyll and carotenoid content. In the nutrient
limited cultures (-N and –N+2Fe), the biomass continued to increase
possibly due to accumulation of lipids in response to nutrient limitation as
the nutrient limited cultures had a higher lipid content than the control
culture from day 23 onwards. An enhancement in the lipid content under
nitrogen limitation in Botryococcus braunii has also been observed by Choi
et al. (2011) and Zhila et al. (2005).
5.4.1.2 Lipid content
Carotenoids are hydrophobic compounds that are dissolved in oil.
Therefore, accumulated lipid/fatty acids may serve as a matrix to
solubilize the pigments allowing astaxanthin esters to float accumulate in
the cytoplasm (Santos and Mesquita 1984).Boussiba and Vonshak (1991)
observed an increase in lipid content of Haematococcus pluvialis correlated
with the pigment accumulation as the pigments need to be accommodated
in the lipid globules. Ben-Amotz et al. (1982) also observed the same
phenomenon with Dunaliella bardawil (= D. salina). In the present study
with B. braunii 807/2, the correlation between lipid and carotenoid
accumulation was not clear as under low light irrespective of the culture
conditions, the lipid content followed the same trend as the carotenoid
content until day 16, but afterwards the lipid content increased more than

171
the carotenoid content. Under high light, the lipid content showed an
upward trend whereas the carotenoids content showed tendency to
decrease at the end of the culture period. This can be attributed to the
complexity of the fatty acids and carotenoid biosynthesis of microalgae
which are species-specific.
5.4.1.3 Chlorophyll and carotenoid content
The pigment composition of B. braunii was examined under different
growth conditions. The reason for using N-free medium and medium
with extra iron was because these conditions are known to induce
carotenogenesis in several algae species (Kobayashi et al. 1991; Boussiba et
al. 1999; Pirastru et al. 2012; Wang et al. 2013). In this study, B. braunii
807/2 synthesized chlorophyll a and b as well as primary carotenoids (i.e.
β-carotene, lutein, neoxanthin) under favourable conditions (nutrient
sufficient and low light). However, under unfavourable condition
(nutrient limitation, extra iron and high light intensity), the strain
accumulated more secondary carotenoids e.g. canthaxanthin and
astaxanthin, concomitant with reduced chlorophylls and primary
carotenoids. Grung et al. (1994b) also found that carotenoid production of
B. braunii is enhanced at high light intensity and nitrogen deficiency.
Pirastru et al. (2012) discovered that Scenedesmus sp accumulated high
amounts of carotenoids, including astaxanthin and canthaxanthin, when
exposed to low concentration of nitrogen, whereas Chlorella zofingiensis
increased its astaxanthin levels at high irradiance (Del Campo et al. 2004).
Iron can also trigger the synthesis of carotenoids. Wang et al. (2013)
reported that Fe2+ played a strong role in promoting astaxanthin formation
in Chromochloris zofingiensis. Similarly, Choi et al. (2002) and Kobayashi et
al. (1991) reported enhancement of astaxanthin production in

172
Haematococcus pluvialis with the addition of Fe2+ plus acetate. Fe2+ can
work as hydroxyl radial (HO.) generator through the Fenton reaction to
enhance carotenogenesis in cyst cells of H. pluvialis (Kobayashi et al. 1991).
In addition, carotenogenesis is a complicated metabolism network in
which various co-factors of the related enzymes such as Fe2+, Mg2+ and
Mn2+ are essential for regulation of gene expression in higher plants and
some algae (Raman and Ravi 2011). Misawa et al. (1995) pointed out that
Fe2+ is a cofactor involved in the catalysis performed by hydroxylases and
oxidases required for astaxanthin synthesis. In agreement with these
previous studies, this study also found that high iron concentration
stimulates carotenoid accumulation in B. braunii 807/2.
The total carotenoid content of the B. braunii 807/2 presented in this study
was relatively low (0.17-0.6 mg.L-1 or 0.3-1.2 mg.g-1AFDW or 0.03-0.12%
AFDW) compared to other studies on carotenoid production of B. braunii
or other microalgal species. For example, Ranga Rao et al. (2010) reported
the total carotenoid content of B. braunii CFTRI-K was about 0.35±0.06%
biomass. The carotenoid content of Nannochloropsis gaditana ranged from
0.8-6.9 µg.mg-1 dry weight, Synechococcus sp ranged from 0.3-3.3 µg.mg-1
dry weight and Dunaliella salina ranged from 0.5-27.7 µg.mg-1(Macias-
Sanchez et al. 2008). Besides strain and growth conditions, the
methodology used for carotenoid determination can also be responsible
for the diversity of results. For example, Ranga Rao et al. (2010) analysed
Botryococcus braunii (CFTRI-K) using HPLC and LC-MS and found much
higher carotenoids content than that of the B. braunii 807/2. In this study,
the total carotenoid content was determined from chlorophyll-free
samples by determining carotenoid content of each individual carotenoid
recovered from TLC using UV-vis spectrophotometry and then
summarising them all as total carotenoid content. This method seems to

173
be more reliable in terms of the accuracy by excluding all chlorophylls that
interfere with carotenoids absorbance when using UV spectrophotometry.
However, the calculated values were probably much lower compared to
other fast methods i.e. HPLC or UV spectrophotometry. This was because
the method employed in this study took longer time to get into the final
results. The samples had to follow series steps from pigment extraction,
partition, evaporation, separation on a TLC followed by quantification of
the individual carotenoid pigment using UV spectrophotometry which
took about 4-5 hours to complete depending on the number of samples.
During the long process, the pigments are potentially exposed to oxidation
which would gradually degrade the pigments which in turn led to the
much lower values. Macias-Sanchez et al. (2008)also found that different
extraction methods and extraction condition i.e. temperature and pressure
affected the yield of carotenoids and chlorophylls of three species of
microalgae (Nannochloropsis gaditana, Synechococcus sp. and Dunaliella
salina).
5.4.2 Comparison of carotenoid composition of green, intermediate and
red cells of Botryococcus braunii 807/2 cultured indoors and outdoors
Microalgae are one of the main sources of natural carotenoids. They
combine the fast and easy growth of bacteria and other unicellular
microorganisms with an active isoprenoid metabolism, which ensures
enough precursors for the carotenogenic pathway, and adequate storage
capacity. All these reasons make microalgae ideal cell factories for the
biotechnological production of high added-value carotenoids (Leon et al.
2004).
The carotenoid composition of B. braunii in this study is comparable with
the results of an early study of B. braunii in terms of the main carotenoids

174
under optimum growing conditions i.e. low light and nutrient sufficiency
in which lutein as the predominant carotenoid of the green cells. For
example, B. braunii Kawaguchi-1 synthesized 76.2% of lutein of the total
carotenoids(Tonegawa et al. 1998). Similarly, both B. braunii race B and
race L synthesised lutein as the major carotenoid in the linear phase of
growth (Grung et al. 1989). However, B. braunii BOT-20 is different from
other B. braunii strains in terms of the main carotenoid and the colour of
the cells. It produced echinenone as the predominant carotenoid (73% of
total carotenoids) and instead of green, the cells appeared dark red during
linear phase of growth (Matsuura et al. 2012).
The red cells of B. braunii 807/2 contained keto-carotenoids as major
pigments. The bright red colouration of the cells was due to a masking of
the chlorophylls by the astaxanthin/canthaxanthin accumulation or may in
part due to chlorophyll breakdown after long exposure to high light
intensity under N-limitation. Interestingly, there was a major difference in
the carotenoids between the indoor and outdoor red cultures. Compared
to other B. braunii strains (Grung et al. 1989; Tonegawa et al. 1998;
Matsuura et al. 2012), the carotenoid composition of B. braunii 807/2 is
unique since astaxanthin is the major carotenoid (28% of total carotenoids)
of the red cells grown outdoors, whereas the red cells grown indoors
contained predominantly canthaxanthin (16% of total carotenoids). It
appears that the much higher irradiance outdoors stimulates massive
accumulation of astaxanthin.
The biosynthesis of astaxanthin in B. braunii 807/2 is apparently similar to
Haematococcus pluvialis due to the presence of β-carotene, echinenone and
canthaxanthin which are the preferred route in astaxanthin biosynthesis in
H. pluvialis (Margalith 1999). However, Grung et al. (1989) found that

175
canthaxanthin and echinenone were the dominating carotenoids in the
stationary phase of B. braunii race B (originating from Martinique)and
race L (isolated from Ivory coast) with no trace of astaxanthin.
Lutein and astaxanthin are pigments with commercial interests (Pulz and
Gross 2004; Del Campo et al. 2007; Borowitzka 2013b). The fact that
Botryococcus braunii 807/2 accumulate these pigments under different
culture conditions means the production of either carotenoid can be
achieved through the management of culture conditions.
5.5 Conclusion
Botryococcus braunii 807/2 can be considered as a potential candidate for
carotenoid production of lutein and/or astaxanthin. It showed its
capability to accumulate high amount of carotenoids under nitrogen
limitation, high iron concentration and high light intensity. It accumulates
a high amount of lutein when grown under optimum conditions and a
relatively high amount of astaxanthin when grown under sub-optimum
conditions (i.e. nutrient deficiency and high light intensity) outdoors.
Most importantly, B. braunii can be cultured outdoors. However, the main
problem is the slow grow growth and low carotenoid productivity of B.
braunii compared to carotenoid producer algae such as Dunaliella salina
and Haematococcus pluvialis. Therefore, further studies are still needed to
optimise the production of the potential carotenoids (i.e. lutein and
astaxanthin) including determination of the best growing conditions
(indoor and outdoor), the best harvesting time and the best extraction
method for optimum production of the carotenoids. The possibility of co-
production of carotenoids and hydrocarbon especially in combination
with hydrocarbon production by milking (Moheimani et al. 2013b) is also

176
worth exploring -i.e. the ‘old’ biomass after several round of ‘milking’
might be a source of carotenoids.

177
CHAPTER 6. GENERAL CONCLUSIONS AND FUTURE
DIRECTIONS
Microalgae have gained enormous attention from researchers, industries
and governments across the globe due their ability to produce a wide
range of important chemicals with various potential applications.
Moreover, microalgae with a great diversity serve as untapped resources
waiting to be discovered for more new exciting compounds. To date only
a limited number of microalgae such as Dunaliella, Spirulina, Chlorella and
Haematococcus have been successfully produced commercially (Barclay
and Apt 2013; Borowitzka 2013b). Bioprospecting and screening of a
potential new species for a producing a targeted compound is thus an
important aspect of any potential future microalgae industry. This study
focused on bioprospecting for new microalgae species/strains with
commercial potential, with the main interests being in algae suitable for
the production of lipids/fatty acids and carotenoids. Following series
tasks including species isolation and strain selection, characterization of
microalgae products, limits to the growth studies, and outdoor studies
(long-term growth and growth optimization), two commercial potential
microalgae strains namely Amphora sp. MUR 258 and B. braunii 807/2 and
Amphora sp MUR 258 and are recommended for lipid and carotenoid
production, respectively.
The Amphora sp. MUR 258 has the greatest potential for future commercial
applications of all the strains studied. The Amphora sp. MUR 258 is
considered to be a commercial potential strain for lipid production for
several reasons. It is a hypersaline diatom that can tolerate a wide range
of salinity (3-15% NaCl) and grow well at a wide range of hypersaline
conditions (6-12% NaCl). This is a very desirable characteristic when
178
considering the species to be mass produced in outdoor system
(Borowitzka 2013c). Species that can grow at hypersaline environment
are less likely to be over grown by other algae/contaminants as not many
microorganisms can tolerate hypersaline conditions thus enhancing the
reliability of long-term outdoor culture.
Amphora sp. MUR 258 is tolerant to a wide range of temperatures from
about 5-42oC, and prefers warm temperatures. This is also a very
important criterion when considering the alga to be commercially grown
outdoors in a location with high solar irradiance and high daily air
temperature (i.e. Karratha in North of Western Australia). Furthermore,
indoor and outdoor study showed that the optimum growth temperature
ranged from 25-35oC. This is important because that temperature range is
mostly encountered in outdoors during day time.
The Amphora sp. MUR 258 is a lipid-rich microalgal strain contained up to
60% lipid (as % ash-free dry weight). Moreover, unlike many algae that
accumulate high level of lipid at stationary phase, this alga has the ability
to accumulate high amount of lipids/fatty acids in the exponential phase
when grown under optimum conditions. This is important because high
lipid content in the exponential phase will lead to the high lipid
productivity. The lipids content can be further increased through further
manipulation of the culture conditions.
Another important finding is that this pennate diatom does not normally
stick to surfaces as almost all pennates do, thus allowing the high
productivity culture in raceway ponds. To the best of our knowledge,
only two pennate diatoms have been studied for large-scale cultivation
outdoors. One is the hypersaline Amphora coffeaeformis MUR158 studied
by Mercz (1994) and Fon-Sing and Borowitzka (2016). However, the

179
newly isolated hypersaline Amphora sp. MUR 258 in this study grows
better at even much higher salinity and sticks even less. The other species
is Phaeodactylum tricornutum which grows very well outdoors at seawater
salinity, but it is not a hypersaline species (Raymont and Adams 1958;
Ansell et al. 1963; Acién Fernández et al. 2003).
The Amphora sp. MUR 258 is reliable for long-term culture in outdoor
open pond systems (raceway ponds). The ability of the alga to be
cultured in outdoor open-air system for long periods is one of the most
important aspect of commercially successful alga culture as it minimises
capital and labour costs (Borowitzka 1999b; Moheimani and Borowitzka
2006). Moreover, most current commercially produced microalgae use
open-air culture systems (Borowitzka and Moheimani 2013a).
In addition, this strain grew best at lower nutrient concentration and when
using urea as N-source (cheapest form of nitrogen sources). Therefore, it
is more economical to grow because nutrient costs represents a major cost
for microalgae cultivation (Borowitzka 2013d). Furthermore, it is more
sustainable to grow as it requires saline/hypersaline water which is
abundant, compared to the use of freshwater which is a limited resource
around the globe (Borowitzka and Moheimani 2013b).
The fatty acid profile of this alga indicated its suitability as a source of
lipids for biodiesel production. The high content of C16 and C18 of the
Amphora sp. MUR 258 is similar to that of vegetable oils and it is the most
common fatty acids contained in biodiesel (Knothe 2008). The low PUFAs
of the Amphora is an advantage as it is less susceptible to oxidation during
storage thus improving the acceptability as biodiesel (Sing et al. 2011).
However, more studies are still needed to optimise the productivity of the
biomass and product of interest. This includes growth optimization

180
especially in outdoor culture (i.e. CO2 addition, the best harvesting rate
and harvesting time, optimum depth at different seasons, and interaction
between limits to growth factors).
This alga also has potential to be used as aquaculture feed especially for
abalone larvae due its small cell size which is suitable for the
larvae(Norman-Boudreau et al. 1986), its higher level of saturated fatty
acids which provide extra energy for growing larvae (Thompson et al.
1993) and its ability to stick to a substrate (at low temperature) making it
more accessible for the abalone larva. For this purpose, studies on feeding
trials on abalones are needed.
Another potential uses/application of this alga is for saline wastewater
treatment. Saline effluents generated by seafood processing industries,
aquaculture and tourism activities are conventionally treated through
costly physico-chemical treatments as biological treatment is difficult to
carry out due to salt-inhibition (Intrasungkha et al. 1999; Cristovao et al.
2015; Ferrer-Polonio et al. 2015; Jemly et al. 2015). Therefore, the use of
salt-tolerant microorganisms (i.e. halophilic microalgae) is one of the
potential options for treating hypersaline effluents.
Yet another commercial potential of Amphora sp. MUR 258 that need to be
further explored is as a fucoxanthin producer. Diatoms are well known
as good sources of fucoxanthin (Kim et al. 2012b; Xia et al. 2013; Foo et al.
2015) compared to that of microalgae(Xia et al. 2013). The fact that the
Amphora sp MUR 258 can be grown reliably in outdoor for long period
make this strain a promising candidate for commercial production of
fucoxanthin at a low cost production system i.e. raceway ponds.
Moreover, if this alga is considered as lipids/biofuel feedstocks,

181
fucoxanthin can be produced as a co-product so that the production costs
will be greatly reduced.
The second most potential strain studied for commercial application is the
Botryococcus braunii 807/2, a potential strain as a carotenoid producer. To
the best of our knowledge, this is the first study on carotenoid production
of B.braunii 807/2 focusing on the rate of the carotenoid production under
different growing conditions (i.e. nitrogen deprivation, high iron
concentration and different light intensity) and the carotenoid
composition of green, intermediate and red cells of B. braunii.
This study found that the rate of carotenoid production of B. braunii 807/2
was faster under nitrogen deprivation, high iron concentration at high
light intensity than other growing conditions. One of the important
finding is that this strain accumulated high value carotenoids such as
lutein and astaxanthin which are commercial interest (Borowitzka 2013b).
Lutein was the major carotenoid of the green cells whereas astaxanthin
was the major carotenoids of the red cells grown outdoors. However, the
carotenoid content reported herein was rather low compared to that of
other carotenoid producers (i.e. Dunaliella salina for β-carotene and
Haematococcus pluvialis for astaxanthin). Therefore, more studies are still
needed to optimise the productivity of the carotenoids.
Despite the low astaxanthin productivity of the B.braunii 807/2, the
astaxanthin might be a suitable co-product of the hydrocarbon production.
If using the ‘milking’ strategy (Moheimani et al. 2013b; Moheimani et al.
2014) then the ‘old’ colonies following extended milking could also be
used to extract the astaxanthin which have a much higher value than the
algal oils.

182
The other two halophilic species studied, the coccoid cyanobacteria and
the Navicula sp., are also potential strains for commercial applications.
The coccoid cyanobacteria showed potential as a phycoerythrin producer.
However, as the focus of the study was on lipid/fatty acids and
carotenoids, this strain was precluded for detailed study. With the
Navicula sp, this strain also showed promise as a lipid/fatty acid producer
but time limitation hindered further studies of this strain.
Finally, while the outcomes of this study indicate the potential of the
Amphora sp. MUR 258 for large-scale production of lipids and B. Braunii
807/2 for the production of carotenoids, substantially more work needs to
be done to optimise the productivity of the product of interest as well as
further investigation of other potential uses/application of the strains.
Microalgae are untapped resources for unlimited potent biologically active
compounds and for various uses/application and therefore screening for
new species with commercial potential is one of the useful approaches for
the successful development of algae-based technologies.

183
REFERENCES
Abeliovich A (1980) Factors limiting algal growth in high rate oxidation ponds. In: Shelef G, Soeder CJ (eds) Algae biomass. Elsevier North-Holland Biomedical Press, Amsterdam, pp 205-216
Achitouv E, Metzger P, Rager M-N, Largeau C (2004) C31-C34 methylated squalenes from a Bolivian strain of Botryococcus braunii. Phytochemistry 65:3159-3165
Acién Fernández FG, Hall DO, Cañizares Guerrero E, Krishna Rao K, Molina Grima E (2003) Outdoor production of Phaeodactylum tricornutum biomass in a helical reactor. J Biotechnol 103:137-152
Ahmad AL, Mat Yasin NH, Derek CJC, Lim JK (2011) Microalgae as a sustainable energy source for biodiesel production: A review. Renew Sust Energ Rev 15:584-593
Aizdaicher N, Markina ZV (2010) The effect of decrease in salinity on the dynamic of abundance and the cell size of Corethron hystrix (Bacillariophyta) in laboratory culture. Ocean Sci J 45:1-5
Al-Hasan RH, Ali AM, Hana H, Radwan SS (1990) Effect of salinity on the lipid and fatty acid composition of the halophyte Navicula sp.: potential in mariculture. J Appl Phycol 2:215-222
Al-Hasan RH, Ghannoum MA, Sallal AK, Abuelteen KH, Radwan SS (1987) Correlative changes of growth, pigmentation and lipid composition of Dunaliella salina in response to halostress. J General Microbiol 133:2607-2616
Allen MB (1959) Studies with Cyanidium coldarium, an anomalously pigmented chlorophyte. Arch Microbiol 32:270-277
Alonso DL, Belarbi E-H, Rodriguez-Ruiz J, Segura CI, Gimenez A (1998) Acyl lipids of three microalgae. Phytochemistry 47:1473-1481
Alonso DL, Belarbi EH, Fernández-Sevilla JM, Rodríguez-Ruiz J, E.M. G (2000) Acyl lipid composition variation related to culture age and nitrogen concentration in continuous culture of the microalga Phaeodactylum tricornutum. Phytochemistry 54:461-471
Andersen RA (2013) The microalgal cell. In: Richmond A, Hu Q (eds) Handbook of microalgal culture: applied phycology and biotechnology. Wiley Blackwell, UK, pp 3-20
Andersen RA, Kawachi M (2005) Traditional microalgae isolation techniques. In: Andersen RA (ed) Algal culturing techniques. Elseviser Academic Press, London, pp 83-100
Ansell AD, Raymont JEG, Lauder KF, Crowley E, Shackley P (1963) Studies on the mass culture of Phaeodactylum. II. The growth of Phaeodactylum and other species in outdoor tanks. Limnol Oceanogr 8:184-206

184
Arzul G, Seguel M, Guzman L, Erard-Le Denn E (1999) Comparison of allelopathic properties in three toxic Alexandrium species. J Exp Mar Bio Ecol 232:285-295
Asada K, Takahashi M (1987) Production and scavenging of active oxygen in photosynthesis. In: Baker NR, Bowyer JR (eds) Photoinhibition of photosynthesis: From molecular mechanisms to the field. Bios Scientific Publisher, Oxford, UK, pp 227-288
Atkinson D, Ciotti BJ, Montagnes DJS (2003) Protists decrease in size linearly with temperature: ca. 2.5% oC-1. Proc R Soc London B 270 (1533):2605—2611
Azov Y, Shelef G, Moraine R, Levy A (1980) Controlling algal genera in high rate wastewater oxidation ponds. In: Shelef G, Soeder CJ (eds) Algal biomass. Elsevier North-Holland Biomedical Press, Amsterdam, pp 245-254
Badour SS, Gergis MS (1965) Cell division and fat accumulation in Nitzschia sp grown in continuously illuminated mass cultures. Arch Microbiol 51 (1):94-102
Baker JT (1984) Seaweeds in pharmaceutical studies and applications. Hydrobiologia 116:29-40
Barclay W, Apt K (2013) Strategies for bioprospecting microalgae for potential commercial applications. In: Richmond A, Hu Q (eds) Handbook of microalgal culture: applied phycology and biotechnology. Wiley-Blackwell, UK, pp 69-79
Beardall J, Quigg A, Raven JA (2003) Oxygen consumption: Photorespiration and chlororespiration. In: Larkum AWD, Douglas SE, Raven JA (eds) Photosynthesis in algae. Kluwer Academic Publishers, Dordrecht, pp 157-181
Becker EW (1986) Nutritional properties of microalgae: Potentials and constraints. In: Richmond A (ed) Handbook of microalgal mass culture. CRC Press. Inc., Florida, pp 339-419
Becker EW (1994) Microalgae: Biotechnology and Microbiology. Cambridge University Press, Cambridge
Becker EW (2007) Micro-algae as a source of protein. Biotechnol Adv 25:207-210
Belay A (2013) Biology and industrial production of Arthrospira (Spirulina). In: Richmond A, Hu Q (eds) Handbook of microalgal culture: applied phycology and biotechnology. Wiley-Blackwell, UK, pp 339-358
Belcher J (1968) Notes on the physiology of Botryococcus braunii Kützing. Arch Microbiol 61:335-346

185
Ben-Amotz A, Avron M (1983) Accumulation of metabolites by halotolerant algae and its industrial potential. Ann Rev Microbiol 37:95-119
Ben-Amotz A, Avron M (1990) The biotechnology of cultivating the halotolerant alga Dunaliella. Trends Biotechnol 8:121-125
Ben-Amotz A, Katz A, Avron M (1982) Accumulation of β-carotene in halotolerant algae: Purification and characterization of β-carotene rich globules from Dunaliella bardawil (Chlorophyceae). J Phycol 18:529-537
Ben-Amotz A, Tornabene TG, Thomas WH (1985) Chemical profiles of selected species of microalgae with emphasise on lipids. J Phycol 21:72-81
Bigogno C, Khozin-Goldberg I, Boussiba S, Vonshak A, Cohen Z (2002) Lipid and fatty acid composition of the green oleaginous alga Parietochloris incisa, the richest plant source of arachidonic acid. Phytochemistry 60:497-503
Blanken W, Cuaresma M, Wijffels RH, Janssen M (2013) Cultivation of microalgae on artificial light comes at a cost. Algal Res 2:333-340
Bligh EG, Dyer WJ (1959) A rapid method of total lipid extraction and purification. Can J Biochem Physiol 37:911-917
Borowitzka LJ (1981) The microflora. Adaptation to life in extremely saline lakes. Hydrobiologia 81:33-46
Borowitzka LJ, Kessly DS, Brown AD (1977) The salt relations in Dunaliella: further observation on glycerol production and its regulation. Arch Microbiol 113:131-138
Borowitzka MA (1995) Microalgae as sources of pharmaceuticals and other biologically active compounds. J Appl Phycol 7:3-15
Borowitzka MA (1997) Microalgae for aquaculture: Opportunities and constraints. J Appl Phycol 9:393-401
Borowitzka MA (1999a) Commercial production of microalgae: ponds, tanks, tubes and fermenters. J Biotechnol 70:313-321
Borowitzka MA (1999b) Economic evaluation of microalgal processes and products. In: Cohen Z (ed) Chemicals from microalgae. Taylor & Francis, London, pp 387-410
Borowitzka MA (2012) Phycology. eLS. doi:10.1002/9780470015902.a0000334.pub3
Borowitzka MA (2013a) Dunaliella: biology, production, and markets. In: Richmond A, Hu Q (eds) Handbook of microalgal culture: applied phycology and biotechnology. Wiley-Blackwell, UK, pp 359-368
Borowitzka MA (2013b) High-value products from microalgae-their development and commercialisation. J Appl Phycol 25 (3):743-756
186
Borowitzka MA (2013c) Species and strain selection. In: Borowitzka MA, Moheimani NR (eds) Algae for biofuels and energy. Springer, Dordrecht, pp 77-89
Borowitzka MA (2013d) Techno-economic modelling for biofuels from microalgae. In: Borowitzka MA, Moheimani NR (eds) Algae for biofuels and energy. Springer, Dordrecht, pp 255-264
Borowitzka MA (2016) Algal physiology and large-scale outdoor cultures of microalgae. In: Borowitzka MA, Beardall J, Raven JA (eds) The physiology of microalgae. Springer, Dordrecht, pp 601-652
Borowitzka MA, Borowitzka LJ (1988) Dunaliella. In: Borowitzka MA, Borowitzka LJ (eds) Micro-algal Biotechnology. Cambridge University Press, Cambridge, pp 27-58
Borowitzka MA, Moheimani NR (2013a) Open pond culture systems. In: Borowitzka MA, Moheimani NR (eds) Algae for biofuels and energy. Springer, Dordrecht, pp 133-152
Borowitzka MA, Moheimani NR (2013b) Sustainable biofuels from algae. Mitig Adapt Strateg Glob Change 18 (1):13-25
Boruff BJ, Moheimani NR, Borowitzka MA (2015) Identifying locations for large-scale microalgae cultivation in Western Australia: A GIS approach. Appl Energy 149:379-391
Botham PA, Ratledge C (1979) A biochemical explanation for lipid accumulation in Candida 107 and other oleaginous microorganisms. J Gen Microbiol 114:361-375
Boussiba S, Bing W, Yuan JP, Zarka A, Chen F (1999) Changes in pigments profile in the green alga Haematococcus pluvialis exposed to environmental stress. Biotechnol Lett 21:601-604
Boussiba S, Vonshak A (1991) Astaxanthin accumulation in the green alga Haematococcus pluvialis. Plant Cell Physiol 32:1077-1082
Bowler C, Martino A, Falciatore A (2010) Diatom cell division in an environmental context. Curr Opin in Plant Biol 13:623-630
Brennan L, Owende P (2013) Biofuels from microalgae: towards meeting advanced fuel standards. In: Lee JW (ed) Advanced biofuels and bioproducts. Springer, New York, pp 553-599
Brenner A, Abeliovich A (2013) Water purification: Algae in wastewater oxidation ponds. In: Richmond A, Hu Q (eds) Handbook of microalgal culture: applied phycology and biotechnology. Wiley Blackwell, UK, pp 595-601
Brinda BR, Sarada R, Sandesh Kamath B, Ravishankar GA (2004) Accumulation of astaxanthin in flagellated cells of Haematococcus pluvialis – cultural and regulatory aspects. Current Science 87 (9):1290-1295

187
Broady PA (1996) Diversity, distribution and dispersal of Antarctic terrestrial algae. Biodivers Conserv 5:1307-1335
Brown MR, Dunstan GA, Norwood SJ, Miller KA (1996) Effects of harvest stage and light on the biochemical composition of the diatom Thalassiosira pseudonana. J Phycol 32:64-73
Bunning E, Herdtle H (1946) Physiologische untersuchungen an thermophilen Blaualgen. Z Naturforsch 1:93-99
Camacho FG, Gomez AC, Sobczuck M, Grima EM (2000) Effects of mechanical and hydrodynamic stress in agitated, sparged cultures of Porphydium cruentum. Process Biochem 35:1045-1050
Camacho Rubio F, Acién- Fernández FG, Sánchez Pérez JA, García Camacho F, Molina Grima E (1999) Prediction of dissolved oxygen and carbon dioxide concentration profiles in tubular photobioreactors for microalgal cultures. Biotech Bioeng 62:71-86
Canovas S, Picot B, Casellas C, Zulkifi H, Dubois A, Bontoux J (1996) Seasonal development ofphytoplankton and zooplankton in a high-rate algal pond. Water Sci Technol 33:199-206
Carvalho AP, Meireles LA, Malcata FX (2006) Microalgal reactors: a review of enclosed system designs and performances. Biotechnol Prog 22:1490-1506
Chacon-Lee TL, Gonzales-Marino GE (2010) Microalgae for "healthy" foods-possibilities and challenges. Comp Rev Food Sci Food Safety 9:655-674
Chapman DJ, De-Felice J, Barber J (1983) Growth temperature effects on thylakoid membrane lipid and protein content of pea chloroplasts. Plant Physiol 72 (1):225-228
Chen G-Q, Jiang Y, Chen F (2008) Variation of lipid class composition in Nitzschia laevis as a response to growth temperature change. Food Chemistry 109:88-94
Chen H, Jian J (2009) Osmitic responses of Dunaliella to the changes of salinity. J Cellular Physiol 219:251-258
Chen YC (2012) The biomass and total lipid content and composition of twelve species of marine diatoms cultured under various environments. Food Chemistry 131:211-219
Chen Z, He C, Hu H (2012) Temperature responses of growth, photosynthesis, fatty acid and nitrate reductase in Antarctic and temperate Stichococcus. Extremophiles 16:127-133
Cheng-Wu Z, Odi Zmora O, Kopel R, Richmond A (2001) An industrial-size flat plate glass reactor for mass production of Nannochloropsis sp. (Eustigmatophyceae). Aquaculture 195:35-49
Chi Z, Su CD, Lu WD (2007) A new exopolysaccharide produced by marine Cyanothece sp. 113. Bioresour Technol 98:1329-1332

188
Chisti Y (2007) Biodiesel from microalgae. Biotechnol Adv 25 (3):294-306 Choi GG, Kim BH, Ahn CY, Oh HM (2011) Effect of nitrogen limitation on
oleic acid biosynthesis in Botryococcus braunii. J Appl Phycol 23:1031-1037
Choi YE, Yun YS, Park JM (2002) Evaluation of factors promoting astaxanthin production by a unicelullar green alga, Haematococcus pluvialis, with factorial design. Biotechnol Progr 18:1170-1175
Christie WW (1989) Gas Chromatography and Lipids: A Practical Guide. The Oily Press Ltd, UK
Chung T-W, Choi H-J, Lee J-Y, Jeong H-S, Kim C-H, Joo M, Choi J-Y, Han C-W, Kim S-Y, Choi J-S, Ha K-T (2013) Marine algal fucoxanthin inhibits the metastatic potential of cancer cells. Biochem Biophys Res Commun 439:580-585
Clavero E, Hernandez-Marine M, Grimalt GO, Garcia-Pichel F (2000) Salinity tolerance of diatom from thalassic hypersaline environments. J Phycol 36:1021-1034
Cohen Z, Vonshak A, Richmond A (1987) Fatty acid composition of Spirulina strains grown under various environmental conditions. Phytochemistry 26:2255-2258
Coleman JR, Colman B (1981) Inorganic carbon accumulation and photosynthesis in a blue-green alga as a function of external pH. J Phycol 27:2-8
Collyer DM, Fogg GE (1955) Studies on fat accumulation by algae. J Exp Bot 6 (2):256-275
Conde E, Moure A, Domínguez H (2015) Supercritical CO2 extraction of fatty acids, phenolics and fucoxanthin from freeze-dried Sargassum muticum. J App Phycol 27:957-964
Cordell D, Drangert JO, White S (2009) The story of phosphorous: global food security and food for thought. Glob Environ Change 19:292-305
Coutteau P (1996) Micro-algae. In: Lavens P, Sorgeloos P (eds) Manual on the production and use of live food for aquaculture. FAO, Rome, pp 7-48
Craggs R, Sutherland D, Campbell H (2012) Hectare-scale demonstration of high rate algal ponds for enhanced wastewater treatment and biofuel production. J Appl Phycol 24:329-337
Cristovao RO, Botelho CM, Martins RJE, Laureiro JM, Boaventura RAR (2015) Fish canning industry wastewater treatment for water reuse - a case study. J Cleaner Production 87:603-612
Cuello MC, Cosgrove JJ, Randhir A, Vadiveloo A, Moheimani NR (2015) Comparison of continuous and day time only mixing on Tetraselmis

189
suecica (Chlorophyta) in outdoor raceway ponds. J Appl Phycol 27:1783-1791
D´Souza FML, Kelly GJ (2000) Effects of a diet of a nitrogen-limited alga (Tetraselmis suecica) on growth, survival and biochemical composition of tiger prawn (Penaeus semisulcatus) larvae. Aquaculture 181:311-329
DasSarma S, Arora P (2001) Halophiles. Encyclopedia of Life Sciences. John Wiley & Sons,
De la Pena MR (2007) Cell growth and nutritive value of the tropical benthic diatom, Amphora sp., at varying levels of nutrients and light intensity, and different culture locations. J Appl Phycol 19:647-655
De Philippis R, Sili C, Paperi R, Vincenzini M (2001) Exopolysaccharide-producing cyanobacteria and their possible exploitation: a review. J Appl Phycol 13:293-299
De Swaaf ME, De Rijk TC, Eggink G, Sijtsma L (1999) Optimisation of docosahexaenoic acid production in batch cultivation by Crypthecodinium cohnii. J Biotechnol 70:185-192
Del Campo JA, Garcia-Gonzalez M, Guerrero MG (2007) Outdoor cultivation of microalgae for carotenoid production: current state and perspectives. Appl Microbiol Biotechnol 74 (6):1163-1174
Del Campo JA, Moreno J, Rodrı´guez H, Vargas MA, Rivas JR, Guerrero MG (2000) Carotenoid content of chlorophycean microalgae: factors determining lutein accumulation in Muriellopsis sp. (Chlorophyta). J Biotechnol 76:51-59
Del Campo JA, Rodriguez H, Moreno J, Vargas MA, Rivas J, Guerrero MG (2004) Accumulation of astaxanthin and lutein in Chlorella zofingiensis (Chlorophyta). Appl Microbiol Biotechnol 64 (6):848-854
Del Campo JA, Rodriquez H, Moreno J, Vargas MA, Rivas J, Guerrero MG (2001) Lutein production by Muriellopsis sp. in an outdoor tubular photobioreactor. J Biotechnol 81:289-295
Dembinska-Kiec A (2005) Carotenoids: risk or benefit for health. BBA—Mol Basis Dis 1740 (2):93-94
Demming-Adams B, Adams WWI (2002) Antioxidants in photosynthesis and human nutrition. Science 298:2149-2153
Doresey TE, McDonald P, Roels OA (1978) Measurements of phytoplankton-protein content with the heated biuret-folin assay. J Phycol 14:167-171
Duan Z, Sun R, Zhu C, Chou I-M (2006) An improved model for the calculation of CO2 solubility in aqueous solutions containing Na+, K+, Ca2+, Mg2+, Cl-, and SO42- Mar Chem 98:131-139
Dwyer JH, Navab M, Dwyer KM, Hassan K, Sun P, Shircore A, Hama-Levy S, Hough G, Wang X, Drake T, Merz NB, Fogelman AM (2001)
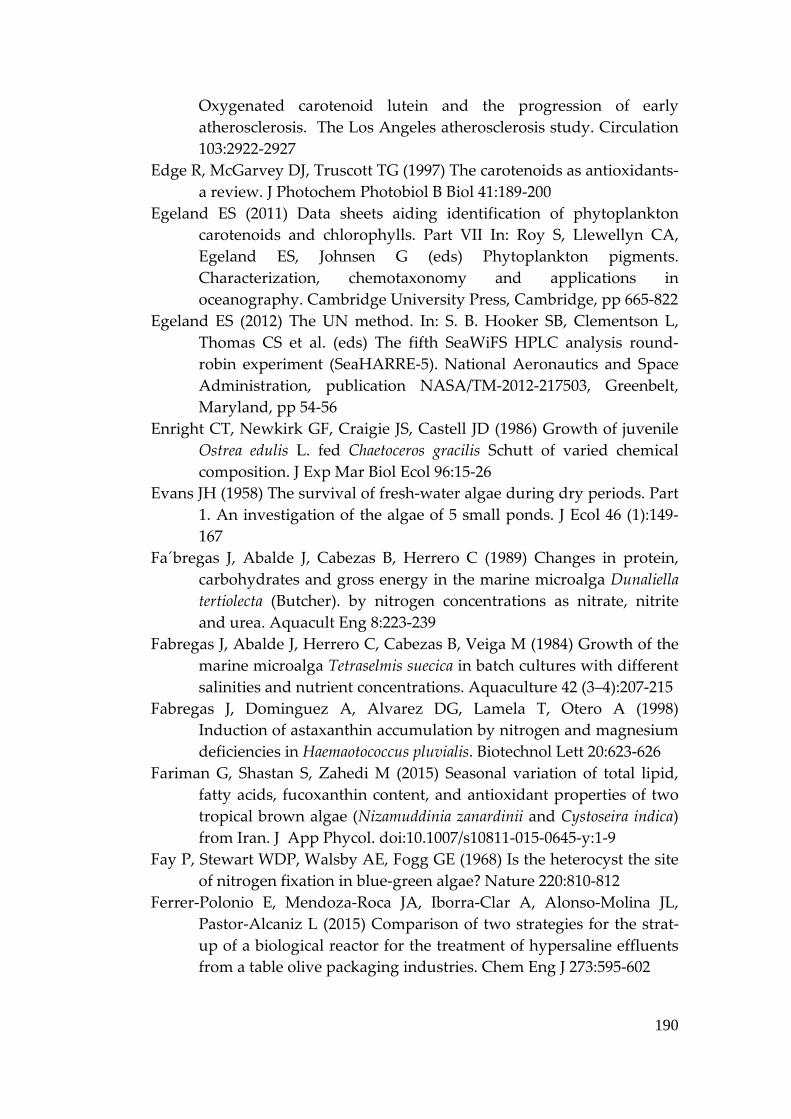
190
Oxygenated carotenoid lutein and the progression of early atherosclerosis. The Los Angeles atherosclerosis study. Circulation 103:2922-2927
Edge R, McGarvey DJ, Truscott TG (1997) The carotenoids as antioxidants-a review. J Photochem Photobiol B Biol 41:189-200
Egeland ES (2011) Data sheets aiding identification of phytoplankton carotenoids and chlorophylls. Part VII In: Roy S, Llewellyn CA, Egeland ES, Johnsen G (eds) Phytoplankton pigments. Characterization, chemotaxonomy and applications in oceanography. Cambridge University Press, Cambridge, pp 665-822
Egeland ES (2012) The UN method. In: S. B. Hooker SB, Clementson L, Thomas CS et al. (eds) The fifth SeaWiFS HPLC analysis round-robin experiment (SeaHARRE-5). National Aeronautics and Space Administration, publication NASA/TM-2012-217503, Greenbelt, Maryland, pp 54-56
Enright CT, Newkirk GF, Craigie JS, Castell JD (1986) Growth of juvenile Ostrea edulis L. fed Chaetoceros gracilis Schutt of varied chemical composition. J Exp Mar Biol Ecol 96:15-26
Evans JH (1958) The survival of fresh-water algae during dry periods. Part 1. An investigation of the algae of 5 small ponds. J Ecol 46 (1):149-167
Fa´bregas J, Abalde J, Cabezas B, Herrero C (1989) Changes in protein, carbohydrates and gross energy in the marine microalga Dunaliella tertiolecta (Butcher). by nitrogen concentrations as nitrate, nitrite and urea. Aquacult Eng 8:223-239
Fabregas J, Abalde J, Herrero C, Cabezas B, Veiga M (1984) Growth of the marine microalga Tetraselmis suecica in batch cultures with different salinities and nutrient concentrations. Aquaculture 42 (3–4):207-215
Fabregas J, Dominguez A, Alvarez DG, Lamela T, Otero A (1998) Induction of astaxanthin accumulation by nitrogen and magnesium deficiencies in Haemaotococcus pluvialis. Biotechnol Lett 20:623-626
Fariman G, Shastan S, Zahedi M (2015) Seasonal variation of total lipid, fatty acids, fucoxanthin content, and antioxidant properties of two tropical brown algae (Nizamuddinia zanardinii and Cystoseira indica) from Iran. J App Phycol. doi:10.1007/s10811-015-0645-y:1-9
Fay P, Stewart WDP, Walsby AE, Fogg GE (1968) Is the heterocyst the site of nitrogen fixation in blue-green algae? Nature 220:810-812
Ferrer-Polonio E, Mendoza-Roca JA, Iborra-Clar A, Alonso-Molina JL, Pastor-Alcaniz L (2015) Comparison of two strategies for the strat-up of a biological reactor for the treatment of hypersaline effluents from a table olive packaging industries. Chem Eng J 273:595-602

191
Fidalgo JP, Cid A, Abalde J, Herrero C (1995) Culture of the marine diatom Phaeodactylum tricornutum with different nitrogen sources: growth, nutrient conversion and biochemical composition. Cah Biol Mar 36:165-173
Fidalgo JP, Cid A, Torres A, Sukenik A, Herrero C (1998) Effects of nitrogen source and growth phase on proximate biochemical composition, lipid classes and fatty acid profile of the marine microalga Isochrysis galbana. Aquaculture 166:105-116
Flores E, Guerrero MG, Losadh M (1980) Short term ammonium inhibition of nitrate utilization in Anacystis nidulans and other cyanobateria. Arch Microbiol 128:137–140
Fon-Sing S, Borowitzka MA (2016) Isolation and screening of euryhaline Tetraselmis spp. suitable for large-scale outdoor culture in hypersaline media for biofuels. J Appl Phycol 28:1-14
Fon Sing MSD (2010) Strain selection and outdoor cultivation of halophilic microalgae with potential for large scale biodiesel production. Murdoch University, Western Australia
Fon Sing S, Idepsky A, Borowitzka MA, Moheimani NR (2013) Production of biofuels from microalgae. Mitig Adapt Strateg Glob Change 18:47-72
Foo SC, Yusoff FM, Ismail M, Basri M, Chan KW, Khong NMH, Yau SK (2015) Production of fucoxanthin-rich fraction (FxRF) from a diatom, Chaetoceros calcitrans (Paulsen) Takano 1968. Algal Res 12:26-32
Fritsch FE (1935) The structure and reproduction of the algae, vol 1. Cambridge Univ. Press, London and New York
Frost, Sullivan (2010) Frost & Sullivan and the Global Organisation for EPA and DHA omega-3 global overview of the marine and algal oil EPA and DHA omega-3 ingredients market. Chicago
Fujii S, Nishimoto N, Notoya A, Hellebust JA (1995) Growth and osmoregulation of Chaetoceros muelleri in relation to salinity. Plant Cell Physiol 36:759-764
Fukao T, Kimoto K, Kotani Y (2012) Effect of temperature on cell growth and production of transparent exopolymer particles by the diatom Coscinodiscus granii isolated from marine mucilage. J Appl Phycol 24:181-186
Fung A, Hamid N, Lu J (2013) Fucoxanthin content and antioxidant properties of Undaria pinnatifida. Food Chem 136:1055-1062
Ganuza E, Anderson AJ, Ratledge C (2008) High-cell-density cultivation of Schizochytrium sp. in an ammonium/pH-auxostat fed-batch system. Biotechnol lett 30:1559-1564

192
Garbayo I, Torronteras R, Forjan E, Cuaresma M, Casal C, Mogedas B, Ruiz-Domınguez MC, Marquez C, Vaquero I, Fuentes-Cordero JL, Fuentes R, Gonzalez-del-Valle M, Vılchez C (2012) Identification and physiological aspects of a novel carotenoid-enriched, metal-resistant microalga isolated from an acidic river in Huelva (Spain). J Phycol 48:607-614
Ge Y, Liu J, Tian G (2011) Growth characteristics of Botryococcus braunii 765 under high CO2 concentration in photobioreactor. Bioresour Technol 102:130-134
George SB, Lawrence JM, Lawrence AL, Smiley J, Plank L (2001) Carotenoids in the adult diet enhance egg and juvenile production in the sea urchin Lytechinus variegatus. Aquaculture 199:353-369
Giordano M, Beardall J, Raven JA (2005) CO2 concentrating mechanisms in algae: mechanisms, environmental modulation, and evolution. Annu Rev Plant Biol 56:99-131
Gladue RM, Maxey JE (1994) Microalgal feeds for aquaculture. J Appl Phycol 6:131-141
Glazer A (1999) Phycobiliproteins. In: Cohen Z (ed) Chemicals from microalgae. Taylor and Francis, London, pp 261-280
Glazer AN, Stryer L (1984) Phycofluor probes. Trends Biochem Sci 9:423-427
Gleason FK, Case DE, Siprell KD, Magnuson TS (1986) Effect of the natural algicide, cyanobacterin, on a herbicide-resistant mutant of anacyctis nidulans R2. Plant Sci 46:5-10
Glover HE (1977) Effects of iron deficiency on Isochrysis galbana (Crysophyceae) and Phaeodactylum cornutum (Bacillariophyceae). J Phycol 13:208-212
Gomez PI, Gonzalez MA (2005) The effect of temperature and irradiances on the growth and carotenogenic capacity of seven strains of Dunaliella salina (Chlorophyta) cultivated under laboratory conditions. Biol Res 38:151-162
Gong Y, Hu H, Gao Y, Xu XH, Gao H (2011) Microalgae as platforms for production of recombinant proteins and valuable compounds:progress and prospects. J Ind Microbiol Biot 38:1879-1890
Gong Y, Jiang M (2011) Biodiesel production with microalgae as feedstock: from strains to biodiesel. Biotechnol Lett 33:1269-1284
Goodwin TW (1980) The biochemistry of carotenoids, vol 1. Plants. 2 edn. Chapman and Hall, London
Gordon JM, Polle JE (2007) Ultrahigh bioproductivity from algae. Appl Microbiol Biotechnol 76:969-975

193
Greenspan P, Mayer EP, Fowler SD (1985) Nile red: a selective fluorescent stain for intracellular lipid droplets. J Cell Biol 100:965-973
Grobbelaar JU (2013) Inorganic algal nutrition. In: Richmond A, Hu Q (eds) Handbook of microalgal culture. Wiley Blackwell, UK, pp 123-133
Grobbelaar JU, Soeder CJ (1985) Respiration losses in planktonic green algae cultivated in raceway ponds. J Plankton Res 7:497-506
Grung M, Kreimer G, Calenberg M, Melkonian M, Liaaen-Jensen S (1994a) Carotenoids in the eyespot apparatus of the flagellate green alga Spermatozopsis similis: adaption to the retinal-based photoreceptor. Planta 193:38-43
Grung M, Metzger P, Berkaloff C, Liaaen-Jensen S (1994b) Studies on the formation and localization of primary and secondary carotenoids in the green alga Botryococcus braunii, including the regreening process. Comp Biochem Physiol B 107:265-272
Grung M, Metzger P, Liaaen-Jensen S (1989) Primary and secondary carotenoids in two races of the green alga Botryococcus braunii. Biochem Syst Ecol 17:263-269
Gu N, Lin Q, Li G, Qin G, Lin J, Huang LM (2012) Effect of salinity on biomass and biochemical composition of Nannochloropsis oculata. J World Aquaculture Society 43 (1):97-106
Guerrini F, Cangini M, Boni L, Trost P, Pistocchi R (2000) Metabolic responses of the diatom Achnanthes brevipes to nutrient limitation. J Phycol 36:882-890
Guikema JA, Sherman LA (1984) Influence of iron deprivation on the membrane composition of Anacystis nidulans. Plant Physiol 74:90-95
Guillard RRL, Ryther JH ( 1962 ) Studies of marine planktonic diatoms. I. Cyclotella nana Hustedt and Detonula confervacea (Cleve) Gran. Can J Microbiol 8:229-238
Gurr MI, Harwood JL, Frayn KN (2002) Lipid biochemistry. An introduction. 5th edn. Blackwell, Oxford
Guschina IA, Harwood JL (2013) Algal lipids and their metabolism. In: Borowitzka MA, Moheimani NR (eds) Algae for biofuels and energy. Springer, Dordrecht, pp 17-36
Hamamoto T, Takata N, Kudo T, Horikoshi K (1994) Effect of temperature and growth phase on fatty acid composition of the Psychrophilic Vibrio sp. strain no. 5710 FEMS Microbiol Lett 119:77-82
Hanagata N (1999) Secondary carotenoid accumulation in Scenedesmus komareckii (Chlorophyceae, Chlorophyta). J Phycol 35:960-966
Hanagata N, Takeuchi T, Fukuju Y, Barnes DJ, Karube I (1992) Tolerance of microalgae to high CO2 and high temperature. Phytochemistry 31 (10):3345-3348

194
Harris DO (1970) An autoinhibitory substance produced by Platydorina caudata. Plant Physiol 45:210-214
Harrison PJ, Conway HL, Holmes RW, Davis C (1977) Marine diatoms grown in chemostats under silicate or ammonium limitation. III. Cellular chemical composition and morphology of Chaetoceros debilis, Sceletonema costatum and Thalassiosira gravida. Mar Biol 43:19-31
Hartig P, Grobbelaar J, Soeder C, Groeneweg J (1988) On the mass culture of microalgae: Areal density as an important factor for achieving maximal productivity. Biomass 15:211-221
Harun R, Danquah MK, Forde Gareth M (2010) Microalgal biomass as a fermentation feedstock for bioethanol production. J Chem Technol Biotechnol 85:199-203
Harwood JL, Guschina IA (2009) The versatility of algae and their lipid metabolism. Biochimie 91:1-6
Harwood JL, Jones AL (1989) Lipid metabolism in algae. Adv Bot Res 16:1-53
Hellebust JA (1974) Extracellular products. In: Stewart WDP (ed) Algal physiology and biochemistry. University of California Press, Oxford, pp 838-863
Heo S-J, Ko S-C, Kang S-M, Kang H-S, Kim J-P, Kim S-H, Lee K-W, Cho M-G, Jeon Y-J (2008) Cytoprotective effect of fucoxanthin isolated from brown algae Sargassum siliquastrum against H2O2-induced cell damage. Eur Food Res Technol 228:145-151
Heocha CO (1962) Phycobilins. In: Lewin RA (ed) Physiology and Biochemistry of Algae. Academic Press, New York pp 421-435
Herbst DB, Blinn DW (1998) Experimental mesocosm studies of salinity effects on the benthic algal community of a saline lake. J Phycol 34:772-778
Higuera-Ciapara I, Felix-Valenzuela L, Goycoolea FM (2006) Astaxanthin: a review of its chemistry and applications. Crit Rev Food Sci Nutr 46:185-196
Hildebrand M, Dahlin K, Volcani BE (1998) Characterization of a silicon transporter gene family in Cylindrotheca fusiformis: sequences, expression analysis, and identification of homologs in other diatoms. Mol Gen Genet 260:480-486
Hildebrand M, Volcani BE, Gassmann W, Schroeder JI (1997) A gene family of silicon transporters. Nature 385:68-89
Hilton J, Rigg E, Jaworski G (1988) In vivo algal fluorescence, spectral change due to light intensity changes and the automatic characterization of algae. Freshwater Biol 20 (3):375-382

195
Holm-Nielsen JB, Al Seadi T, Oleskowicz-Popiel P (2009) The future of anaerobic digestion and biogas utilization. Bioresour Technol 100:5478-5484
Howieson J (2001) Nutrition and carotenogenesis in the Chlorophyte Haematococcus pluvialis. PhD Thesis. Murdoch University, Western Australia
Hu C, Li M, Li J, Zhu Q, Liu Z (2008a) Variation of lipid and fatty acid compositions of the marine microalga Pavlova viridis (Prymnesiophyceae) under laboratory and outdoor culture conditions. World J Microbiol Biotechnol 24:1209-1214
Hu Q (2004) Environmental effects on cell composition In: Richmond A (ed) Handbook of microalgal culture, biotechnology and applied phycology. Blackwell, Oxford, pp 83-94
Hu Q, Guterman H, Richmond A (1996) Physiological characteristics of Spirulina platensis (Cyanobacteria) cultured at ultrahigh cel density. J Phycol 32:1066-1073
Hu Q, Richmond A (1994) Optimising the population density in Isochrysis galbana grown outdoors in a glass column photobioreactor. J Appl Phycol 6:391-393
Hu Q, Sommerfeld M, Jarvis E, Ghirardi M, Posewitz M, Seibert M, Darzins A (2008b) Microalgal triacylglycerols as feedstocks for biofuel production: perspectives and advances. Plant J 54:621-639
Hu Q, Zarmi Y, Richmond A (1998) combined effects of light intensity, light-path and culture density on output rate of Spirulina platensis (Cyanobacteria). Eur J Phycol 33:165-171
Huang X, Huang Z, Wen W, Yan J (2012) Effects of nitrogen supplementation of the culture medium on the growth, total lipid content and fatty acid profiles of three microalgae (Tetraselmis subcordiformis, Nannochloropsis oculata and Pavlova viridis). J Appl Phycol. doi:10.1007/s10811-012-9846-9
Huang XX, Zhou HQ, Yuan CD, Sun M (2003) The effects of nitrogen source and concentration on the nutritional value of Nannochloropsis oculata. J Shanghai Fish Univ 12:113-116
Hughes KA (2006) Solar UV-B radiation, associated with ozone depletion, inhibits the Antarctic terrestrial microalga, Stichococcus bacillaris. Polar Biol 29:327-336
Iida I, Nakahara T, Yokochi T, Kamisaka Y, Yagi H, Yamaoka M (1996) Improvement of docosahexaenoic acid production in a culture of Thraustochytrium aureum by medium optimization. J Ferment Bioeng 81:76-78

196
Illman AM, Scragg AH, Shales SW (2000) Increase in Chlorella strains calorific values when grown in low nitrogen medium. Enzyme and Microbial Technol 27:631-635
Imada N, Kobayachi K, Tahara K (1991) Production of an autoinhibitor by Skeletonema costatum and its effect on the growth of other phytoplankton. Nippon Suisan Gakk 57:2285-2290
Imamoglu E, Dalay MC, Sukan FV (2009) Influences of different stress media and high light intensity on accumulation of astaxanthin in the green alga Haematococcus pluvialis. New Biotechnology 26:199-204
Intrasungkha N, Keller J, Blackall LL (1999) Biological nutrient removal efficiency in treatment of saline wastewater. Water Sci Technol 30 (6):183-190
Ishikawa A, Kitami S, Ishii KI, Nakamura T, Imaii I (2011) Resting stage cells of diatoms in deep waters in Kumano-Nada, central part of Japan. Plankton Benthos Res 6 (4):206-209
Jeffrey S, Humphrey G (1975) New spectrometric equations for the determining chlorophylls a, b, c1, c2 in algae, phytoplankton and higher plants. Biochem Physiol Pfl 167:191-194
Jemly M, Karray F, Feki F, Loukil S, Mhiri N, Aloui F, Sayadi S (2015) Biological treatment of fish processing wastewater: A case study from Sfax city (Southeastern Tunisia). J Env Sci 30:102-112
Jiang H, Gao K (2004) Effects of lowering temperature during culture on the production of polyunsaturated fatty acids in the marine diatom Phaeodactylum tricornutum (Bacillariophyceae). J Phycol 40:651-654
Jiang XM (2002) Effects of temperatures, light intensity and nitrogen concentrations on the growth and fatty acid composition of Nannochloropsis oculata. Mar Science 26:9-12
Jiang Y, Chen F (2000) Effects of Temperature and Temperature Shift on Docosahexaenoic Acid Production by the Marine Microalga Crypthecodinium cohnii. JAOCS 77:613-617
Jin E, Feth B, Melis A (2003) a mutant of the green alga Dunaliella salina constitutively accumulates zeaxanthin under all growth conditions. Biotechnol Bioeng 81:115-124
John J (2012a) A beginner's guide to diatoms. A.R.G. Gantner, Ruggel, Liechtenstein,
John J (2012b) Diatoms in the Swan River Estuary, Western Australia: Taxonomy and Ecology. Koeltz Scientific Books, Germany
Jorgensen EG (1956) Growth-inhibiting substances formed by algae. Physiologia Plantarum 7:712-726
Kanwisher J (1957) Freezing and drying in intertidal algae. Biol Bull 113:275-285

197
Kaplan D, Richmond AE, Dubinsky Z, Aaronson S (1986) Algal nutrition. In: Richmond A (ed) Handbook of microalgal mass culture. CRC Press, Boca Raton, pp 147-198
Kates M, Volcani BE (1966) Lipid components of diatoms. Biochim Biophys Acta 116:264-278
Kawachi M, Inouye I, Honda D, O’kelly CJ, Bailey JC, Bidigare RR, Andersen RA (2002) The Pinguiophyceae classis nova, a new class of chromophyte algae whose members produce large amounts of omega-3 fatty acids. Phycol Res 50:31-47
Kaya K, Nakazawa A, Matsuura H, Honda D, Inouye I, Watanabe MM (2011) Thraustochytrid Aurantiochytrium sp. 18W-13a accummulates high amounts of squalene. . Biosci Biotechnol Biochem 75:2246-2248
Khatoon H, Banerjee S, Yusoff FM, Shariff M (2010) Effects of salinity on the growth and proximate composition of selected tropical marine periphyric diatoms and cyanobacteria. Aquaculture Res 41:1348-1355
Kim SM, Jung YJ, Kwon ON, Cha KH, Um BH, Chung D, Pan CH (2012a) A potential commercial source of fucoxanthin extracted from the microalga Phaeodactylum tricornutum. Appl Biochem Biotechnol 166:1843-1855
Kim SM, Kang S-W, Kwon O-N, Chung D, Pan C-H (2012b) Fucoxanthin as a major carotenoid in Isochrysis aff. galbana: Characterization of extraction for commercial application. J the Korean Society for Appl Biol Chem 55:477-483
Kitano M, Matsukawa R, Karube I (1997) Changes in eicosapentaenoic acid content of Navicula saprophila, Rhodomonas salina and Nitzschia sp. under mixotrophic condition. J Appl Phycol 9:559-563
Klausmeier CA, Litchman E, Daufresne T, Levin SA (2004) Optimal nitrogen-to-phosphorus stoichiometry of phytoplankton. Nature 429:171-174
Knothe G (2008) ‘‘Designer” biodiesel: optimizing fatty ester composition to improve fuel properties. Energy Fuels 22:1358-1364
Kobayashi M, Kakizono T, Nagai S (1991) Astaxanthin production by a green alga, Haematococcus pluvialis accompanied with morphological changes in acetate media. J Ferment Bioeng 71:335-339
Kochert G (1978) Carbonydrate determination by the phenol-sulfuric acid method. In: Hellebust JA, James SC (eds) Handbook of Phycological Methods Cambridge University Press, London, pp 95-97
Kodama M, Ikemoto H, Miyachi S (1993) A new species of highly CO2-tolerant fast-growing marine microalga suitable for high-density culture. J Mar Biotechnol 1:21-25

198
Koh HH, Murray IJ, Nolan D, Carden D, Feather J, Beatty S (2004) Plasma and macular responses to lutein supplement in subjects with and without age-related maculopathy: a pilot study. Exp Eye Res 79:21-27
Korb RE, Saville PJ, Johnston AM, Raven J (1997) Sources of inorganic carbon for photosynthesis by three species of marine diatoms. J Phycol 33:433-440
Kronick MN, Grossman AR (1983) Immunoassay techniques with fluorescent phycobiliprotein conjugates. Clin Chem 29:1582-1586
Kumar HD (1990) Introductory Phycology. Affiliated East-West Press Pvt Ltd, New Delhi
Kunjapur AM, Eldridge RB (2010) Photobioreactor design for commercial biofuel production from microalgae. Ind Eng Chem Res 49:3516-3526
Lamers PP, van de Laak CCW, Kaasenbrood PS, Jeroen Lorier J, Janssen M, De Vos RCH, Bino RJ, Wijffels RH (2010) Carotenoid and Fatty Acid Metabolism in Light-Stressed Dunaliella salina. Biotech Bioeng 106:638-648
Lara-Gil JA, Álvarez MM, Pacheco A (2014) Toxicity of flue gas components from cement plants in microalgae CO2 mitigation systems. J App Phycol 26:357-368
Largeau C, Casadevall E, Berkaloff C, Dhamelincourt P (1980) Sites of accumulation and composition of hydrocarbons in Botryococcus braunii. Phytochemistry 19:1043-1051
Larkum AWD, Ross IL, Kruse O, Hankamer B (2012) Selection, breeding and engineering of microalgae for bioenergy and biofuel production. Trends Biotechnol 30 (4):198-205
Laurenco SO, Barbarino E, Manchini-Filho J, Schinke KP, Aidar E (2002) Effects of different nitrogen sources on the growth and biochemical profile of 10 microalgae in batch culture: an evaluation for aquaculture. Phycologia 41 (2):158-168
Lavens P, Sorgeloos P (1996) Manual on the production and use of live food for aquaculture. FAO Rome
Laws EA, Taguchi S, Hirata J, Pang L (1988) Optimization of microalgal production in a shallow outdoor flume. Biotech Bioeng 32:140-147
Lee YK (1997) Commercial prodution of microalgae in the Asia-Pasific rim. J Appl Phycol 9:403-411
Lee YK (2001) Microalgal mass culture systems and methods: Their limitation and potential. J Appl Phycol 13:307-315
Lee YK, Ding SY, Low CS, Chang YC, Forday WL, Chew PC (1995) Design and performance of an alpha-type tubular photobioreactor for mass cultivation of microalgae. J Appl Phycol 7:47-51

199
Lee YK, Pirt SJ (1984) CO2 absorption rate in an algal culture: Effect of pH. Plant Physiol 67:917-921
Leon R, Gonzalez D, Galvan A, Fernandez E (2004) Transgenic microalgae as green cell factories. Trends Biotechnol 22:45-52
Levitt J (1956) The hardiness of plants. Academic Press, New York Lewin JC, Guillard RR (1963) Diatoms. Annu Rev Microbil 17:373-414 Li Y, Horsman M, Wang B, Wu N, Lan CQ (2008) Effects of nitrogen
sources on cell growth and lipid accumulation of green alga Neochloris oleoabundans. Appl Microbiol Biotechnol 81:629-636
Li Y, Qin J (2005) Comparison of growth and lipid content in three Botryococcus braunii strains. J Appl Phycol 17:551-556
Liaaen-Jensen S, Egeland ES (1999) Microalgal carotenoids. In: Cohen Z (ed) Chemicals from microalgae. Taylor & Francis, UK, pp 145-172
Liang K, Zhang Q, Gu M, Cong W (2012) Effect of phosphorus on lipid accumulation in freshwater microalga Chlorella sp. J Appl Phycol. doi:10.1007/s10811-012-9865-6
Liu CP, Lin LP (2001) Ultrastructural study and lipid formation of Isochrysis sp CCMP1324. Bot Bull Acad Sin 42:207-214
Liu J, Hu Q (2013) Chlorella: industrial production of cell mass and chemicals. In: Richmond A, Hu Q (eds) Handbook of microalgal culture: applied phycology and biotechnology. Wiley-Blackwell, UK, pp 329-338
Liu MS, Hellebust JA (1975) Effects of salinity changes on growth and metabolism of the marine centric diatom Cyclotella cryptica. Can J Bot 54:930-937
Liu Y, Liu M, Zhang X, Chen Q, Chen H, Sun L, Liu G (2015) Protective effect of fucoxanthin Isolated from Laminaria japonica against visible light-induced retinal damage both in vitro and in vivo. J Agric Food Chem doi:10.1021/acs.jafc.5b05436
Liu Z-Y, Wang G-C, Zhou B-C (2008) Effect of iron on growth and lipid accumulation in Chlorella vulgaris. Bioresour Technol 99:4717-4722
Lombardi AT, Wangersky PJ (1995) Particulate lipid class composition of three marine phytoplankters Chaetoceros gracilis, Isochrysis galbana (Tahiti) and Dunaliella tertiolecta grown in batch culture. Hydrobiologia 306:1-6
Lorenz RT, Cysewski GR (2000) Commercial potential for Haematococcus microalgae as a natural source of astaxanthin. Trends Biotechnol 18:160-167
Lund JWG (1965) The ecology of the freshwater phytoplankton. Biol Rev 40:231-293
Lupi FM, Fernandes HML, Tomé MM, Sá-Correia I, Novais JM (1994) Influence of nitrogen source and photoperiod on exopolysaccharide

200
synthesis by the microalga Botryococcus braunii UC 58. Enzyme Microb Technol 16:546-550
MacColl R, Guard-Friar D (1987) Phycobiliproteins. CRC Press, Boca Raton
Macias-Sanchez MD, Serrano CM, Rodriguez M, de la Ossa EM, Lubian LM, Montero O (2008) Extraction of carotenoids and chlorophyll from microalgae with supercritical carbon dioxide and ethanol as co solvent. J Sep Sci 31 (8):1352-1362
Mares-Perlman JA, Millen AE, Ficek TL, Hankinson SE (2002) The body of evidence to support a protective role for lutein and zeaxanthin in delaying chronic disease. Overview. J Nutr 132:5185-5245
Margalith PZ (1999) Production of ketocarotenoids by microalgae. Appl Biochem Biotechnol 51:431-438
Markou G, Chatzipavlidis I, Georgakakis D (2012) Effects of phosphorus concentration and light intensity on the biomass composition of Arthrospira (Spirulina) platensis. World J Microbiol Biotechnol 28:2661–2670
Markou G, Nerantzis E (2013) Microalgae for high-value compounds and biofuels production: A review with focus on cultivation under stress conditions. Biotechnol Adv 31:1532-1542
Marre E (1962) Temperature. In: Lewin RA (ed) Physiology and biochemistry of algae. Academic Press, New York and London, pp 541-549
Martin LJ (2015) Fucoxanthin and its metabolite fucoxanthinol in cancer prevention and treatment. Mar Drugs 13:4784-4798
Masojidek J, Kopecky J, Giannelli L, Torzillo G (2011) Productivity correlated to photobiochemical performance of Chlorella mass cultures grown outdoors in thin layer cascades. J Ind Microbiol Biotechnol 38:307-317
Masojídek J, Torzillo G, Koblizek M (2013) Photosynthesis in microalgae. In: Richmond A, Hu Q (eds) Handbook of microalgal culture: applied phycology and biotechnology. Second edn. John Wiley & Sons, Chichester, pp 21-36
Mata TM, Martins AA, Caetano NS (2010) Microalgae for biodiesel production and other applications: A review. Renew Sust Energy Rev 14 (1):217-232
Matsumoto H, Shiroji N, Hamasaki A, Ikuta Y, Fukuda Y, Sato M, Endo N, Tsukamoto. (1995) Carbon dioxide fixation by microalgae photosynthesis using actual flue gas discharge from a boiler. Appl Biochem Biotechnol 51 (52):681-692

201
Matsuura H, Watanabe MM, Kaya K (2012) Echinenone production of a dark red-coloured strain of Botryococcus braunii. J Appl Phycol 24 (4):973-977
McCracken MD, Middaugh RE, Middaugh RS (1980) A chemical characterization of an algal inhibitor obtained from Chlamydomonas. Hydrobiologia 70:271-276
McGinnis KM, Dempster TA, Sommerfeld. (1997) Characterization of the growth and lipid content of the diatom Chaetoceros Muelleri. J Appl Phycol 9:19-24
McLarnon-Riches CJ, Rolph CE, Greeway DLA, Robinson PK (1998) Effects of environmental factors and metals on Selenastrum capricornutum. Phytochemistry 49
Meireles LA, Guedes AC, Malcata FX (2003) Lipid class composition of the microalga Pavlova lutheri: eicosapentaenoic and docosahexaenoic acids. J Agric Food Chem 51:2237-2241
Mercz TI (1994) A study of high lipid yielding microalgae with potential for large-scale production of lipids and polyunsaturated fatty acids. Murdoch University, Perth, Australia
Milledge JJ (2011) Commercial application of microalgae other than as biofuels: a brief review. Rev Environ Sci Bio-Technol 10 (1):31-41
Misawa N, Satomi Y, Kondo K, Yokoyama A, Kajiwara S, Saito T, Ohtani A (1995) Structure and functional analysis of a marine bacterial carotenoid biosynthesis gene cluster and astaxanthin biosynthesis pathway proposed at the gene level. J Bacteriol 177:6575-6584
Mishra A, Jha B (2009) Isolation and characterization of extracellular polymeric substances from micro-algae Dunaliella salina under salt stress. Bioresour Technol 100:3382-3386
Miyake J, Miyake M, Asada Y (1999) Biotechnological hydrogen production: research for efficient light energy conversion. J Biotechnol 70:89-101
Moheimani NR (2013) Long-term outdoor growth and lipid productivity of Tetraselmis suecica, Dunaliella tertiolecta and Chlorella sp (Chlorophyta) in bag photobioreactors. J Appl Phycol 25 (1):167-176
Moheimani NR, Borowitzka MA (2006) The long-term culture of the coccolithophore Pleurochrysis carterae (Haptophyta) in outdoor raceway ponds. J Appl Phycol 18 (6):703-712
Moheimani NR, Borowitzka MA (2007) Limits to productivity of the alga Pleurochrysis carterae (Haptophyta) grown in outdoor raceway ponds. Biotechnology and Bioengineering 96 (1):27-36
Moheimani NR, Borowitzka MA (2011) Increased CO2 and the effect of pH on growth and calcification of Pleurochrysis carterae and Emiliania

202
huxleyi (Haptophyta) in semicontinuous cultures. Appl Microbiol Biotechnol 90 (4):1399-1407
Moheimani NR, Borowitzka MA, Isdepsky A, Fon Sing S (2013a) Standard methods for measuring growth of algae and their composition. In: Borowitzka MA, Moheimani NR (eds) Algae for biofuels and energy. Springer, Dordrecht, pp 265-284
Moheimani NR, Cord-Ruwisch R, Raes E, Borowitzka MA (2013b) Non-destructive oil extraction from Botryococcus braunii (Chlorophyta). J Appl Phycol 25:1653-1661
Moheimani NR, Isdepsky A, Lisec J, Raes E, Borowitzka MA (2011) Coccolithophorid algae culture in closed photobioreactors. Biotechnol Bioeng 108 (9):2078-2087
Moheimani NR, Matsuura H, Watanabe MM, Borowitzka MA (2014) Non-destructive hydrocarbon extraction from Botryococcus braunii BOT-22 (race B). J Appl Phycol 26:1453-1464
Moheimani NR, Webb JP, Borowitzka MA (2012) Bioremediation and other potential applications of coccolithophorid algae: A review. Algal Res 1:120-133
Molina Grima E, Belarbi EH, Fernandes FGA, Robles M, Chisti Y (2003) Recovery of microalgal biomass and metabolites: proses options and economics. Biotechnol Adv 20:491-515
Montagnes DJS, Franklin DJ (2001) Effect of temperature on diatom volume, growth rate, and carbon and nitrogen content : reconsidering some paradigms. Limnol Oceanogr 46:2008-2018
Morris I (1981) Photosynthesis products, physiological state and phytoplankton growth Can Bull Fish Aquatic Sci 210:83-102
Mortensen SH, Borsheim KY, Rainuzzo JR, Knutsen G (1988) Fatty acid and elemental composition of the marine diatom Chaetoceros gracilis Schutt. Effects of silicate deprivation, temperature and light intensity. J Exp Mar Biol Ecol 122:173-185
Mouget JL, Gastineau R, Olga D, Gaudin P, Davidovich N (2009) Light is a key factor in triggering sexual reproduction in the pennate diatom Hasle ostrearia. FEMS Microbiol Ecol 69:194-201
Mulders KJM, Lamers PP, Martens DE, Wijffels RH (2014) Phototrophic pigment production with microalgae: biological constraints and opportunities J Phycol 50 (2):229-242
Muradian K, Vaiserman A, Min KJ, Fraifeld VE (2015) Fucoxanthin and lipid metabolism: A minireview. Nutrition, Metabolism and Cardiovascular Diseases 25:891-897
Muradyan EA, Klyachko-Gurvich GL, Tsoglin LN, Sergeyenko TV, Pronina NA (2004) Changes in lipid metaboilsm during adaptation

203
of the Dunaliella salina photosynthetic apparatus to high CO2 concentration. Russ J Plant Physiol 51:53-62
Murray J, Thomson A (1977) Hydrocarbon production in Anacystis montana and Botryococcus braunii. Phytochemistry 16:465-468
Mutanda T, Ramesh D, Karthikeyan S, Kumari S, Anandraj A, Bux F (2011) Bioprospecting for hyper-lipid producing microalgal strains for sustainable biofuel production. Bioresour Technol 102:57-70
Myklestad S (1977) Production of carbohydrates by marine planktonic diatoms. II. Influence of the NP ratio in the growth medium on the assimilation ratio, growth rate, and production of cellular and extracellular carbohydrates by Chaetoceros affinis var. willei (Gran) Hustedt and Skeletonema costatum (Grev.) Cleve. J Exp Mar Biol Ecol 29:161-179
Nagaraja S, Arulmurugana P, Rajarama MG, Sundararajb R, Rengasamya R (2012) Enhanced production of astaxanthin at different physico-chemical parameters in the green alga Haematococcus pluvialis Flotow. Phykos 42 (1):59-71
Nakayama TOM (1962) Carotenoids. In: Lewin RA (ed) Physiology and biochemistry of algae. Academic Press, New York and London, pp 409-420
Napolitano GE (1994) The relationship of lipid with light and chlorophyll measurement in freshwater algae and periphyton. J Phycol 30:943-950
Ndimba BK, Ndimba RJ, Johnsond TS, Waditee-Sirisatthae R, Baba M, Sirisatthah S, Shiraiwaf Y, Agrawali GK, Rakwali R (2013) Biofuels as a sustainable energy source: An update of the applications of proteomics in bioenergy crops and algae. J Proteomics 93:234-244
Nedbal L, Trtilek M, Cerveny J, Komarek O, Pakrasi HB (2008) A photobioreactor system for precision cultivation of photoatotrophic microorganisms and for high-content analysis of suspension dynamics. Biotechnol Bioeng 100:902-910
Negro JJ, Garrido-Fernandez J (2000) Astaxanthin is the major carotenoid in tissues of white storks (Ciconia ciconia) feeding on introduced crayfish (Procambarus clarkii). Comp Biochem Physiol Part B Biochem Mol Biol 126:347-352
Ngoon R (2011) Culturing of Botryococcus braunii for potential biofuel production. Honours Thesis. Murdoch University, Perth, Western Australia
Nieman C (1954) Influence of trace amounts of fatty acids on the growth of microorganisms. Bact Rev 18:147-163
Nomura M, Kamogawa H, Susanto E, Kawagoe C, Yasui H, Saga N, Hosokawa M, Miyashita K (2013) Seasonal variations of total lipids,

204
fatty acid composition, and fucoxanthin contents of Sargassum horneri (Turner) and Cystoseira hakodatensis (Yendo) from the northern seashore of Japan. J Appl Phycol 25:1159-1169
Norman-Boudreau K, Burns D, Coke CA, Austin A (1986) A simple technique for detection of feeding in newly metamorphosed abalone. Aquaculture 51:313-317
Okamoto T, Katoh S (1977) Linolenic acid binding by chloroplasts. Plant Cell Physiol 18:539-550
Okuzumi J, Nishino H, Murakoshi M, Iwashima A, Tanaka Y, Yamane T, Fujita Y, Takahashi T (1990) Inhibitory effects of fucoxanthin, a natural carotenoid, on N-myc expression and cell cycle progression in human malignant tumor cells. Cancer Lett 55:75-81
Olaizola M (2003) Commercial development of microalgal biotechnology : from test tube to the marketplace. Biomol Eng 20:459-466
Olaizola M, Huntley ME (2003) Recent advances in commercial production of astaxanthin from microalgae. In: Fingerman M, Nagabhushanam R (eds) Biomaterials and bioprocessing. Enfield Science Publishers, pp 143-164
Olmedilla B, Granado F, Blanco I, Vaquero M (2003) Lutein, but not alpha-tocoherol, supplementation improves visual function in patients with age-related cataracts: a 2-y double blind, placebo controlled pilot study. Nutrition 19:21-24
Ong SC, Kao CY, Chiu SY, Tsai MT, Lin CS (2010) Characterization of the thermal-tolerant mutants of Chlorella sp. with high growth rate and application in outdoor photobioreactor cultivation. Bioresour Technol 101:2880-2883
Oswald WJ (1988) Large-scale algal culture systems (engineering aspects). In: Borowitzka MA, Borowitzka LJ (eds) Micro-algal biotechnology. Cambridge University Press, Cambridge, pp 357-394
Owens OHV, Esaias W (1976) Physiological responses of phytoplankton to major environmental factors. Ann Rev Plant Physiol 27:461-483
Packer M (2009) Algal capture of carbon dioxide; biomass generation as a tool for greenhouse gas mitigation with reference to New Zealand energy strategy and policy Energy Policy 37:3428-3437
Pal D, Khozin-Goldberg I, Cohen Z, Boussiba S (2011) The effect of light, salinity, and nitrogen availability on lipid production by Nannochloropsis sp. Appl Microbiol Biotechnol 90 (4):1429-1441
Park KC, Whitney C, McNichol JC, Dickinson KE, MacQuarrie S, Skrupski BP (2012) Mixotrophic and photoautotrophic cultivation of 14 microalgae isolates from Saskatchewan, Canada: potential applications for wastewater remediation for biofuel production. J Appl Phycol 24:339-348

205
Parmar A, Singh NK, Pandey A, Gnansounou E, Madamwar D (2011) Cyanobacteria and microalgae: a positive prospect for biofuels. Bioresour Technol 102:10163–10172
Patil V, Ka¨ llqvist T, Olsen E, Vogt G, Hans R, Gislerød HR (2007) Fatty acid composition of 12 microalgae for possible use in aquaculture feed. Aquacult Int 15:1-9
Payer HD, Pithakpol B, Nguitragool M, Prabharaksa C, Thananunkul D, Chavana S (1978) Major results of the Thai-German microalgae project at Bangkok. Arch Hydrobiol Beih 11:41-55
Perez E, Martin DE, Padilla M (1999) Rate of production of APONINs by Nannochloris oculata. Biomed Lett 59:88-91
Peterfi LS, Manton I (1968) Observations with the electron microscope on Asteromonas gracilis Artari emend (Stephanoptera gracilis (Artari) Wisl.). With some comparative observations on Dunaliella sp. Br phycol Bull 3:423-440
Philippis R, Margheri M, Pelosi E, Ventura S (1993) Exopolysaccharide production by a unicellular cyanobacterium isolated from a hypersaline habitat. J Appl Phycol 5:387-394
Piccaglia R, Marotti M, Grandi S (1998) Lutein and lutein ester content in different types of Tagetes patula and T. erecta. Ind Crops Prod 8:45-51
Piepho M, Arts MT, Wacker A (2012) Species-specific variation in fatty acid concentrations of phytoplankton species: Does phosphorus supply influence the effect of light intensity or temperature? J Phycol 48:64-73
Piorreck M, Baasch KH, Pohl P (1984) Biomass production, total protein, chlorophylls, lipids and fatty acids of freshwater green and blue-green algae under different nitrogen regimes. Phytochemistry 23 (2):207-216
Pirastru L, Darwish M, Chu FL, Perreault F, Sirois L, Sleno L, Popovic R (2012) Carotenoid production and change of photosynthetis function in Scenedesmus sp. exposed to nitrogen limitation and acetate treatment. J Appl Phycol 24:117-124
Pirt SJ, Lee YK, Walach MR, Pirt MW, Balyuzi HHM, Bazin MJ (1983) A tubular bioreactor for photosynthetic production of biomass from carbon dioxide: design and performance. J Chem Tech Biotechnol 33:35-58
Popovich CA, Damiani C, Constenla D, Leonardi PI (2012) Lipid quality of the diatom Skeletonema costatum and Navicula gregaria from the South Atlantic Coast (Argentina): evaluation of its suitability as biodiesel feedstock. J Appl Phycol 24:1-10

206
Powell N, Shilton AN, Pratt S, Chisti Y (2008) Factors influencing luxury uptake of phosphorus by microalgae in waste stabilization ponds. Environ Sci Technol 42:5958-5962
Pratt R (1942) Studies on Chlorella vulgaris. V . Some of the properties of the growth inhibitors formed by Chlorella cells. Amer J But 29:142-148
Praveenkumar R, Shameera K, Mahalakshmi G, Akbarsha MA, Thajuddin N (2012) Influence of nutrient deprivations on lipid accumulation in a dominant indigenous microalga Chlorella sp., bum11008: Evaluation for biodiesel production. Biomass Bioenerg 37:60-66
Prieto A, Pedro Canˇavate JP, Garcia-Gonzalez M (2011) Assessment of carotenoid production by Dunaliella salina in different culture systems and operation regimes. J Biotechnol 151:180-185
Proctor VW (1957) Studies of algal antibiosis using Haematococcus and Chlamydomonas. Limnol Oceanog 2:126-139
Pronina NA, Rogova NB, Furnadzhieva S, Klyachko-Gurvich GL (1998) Effect of CO2 concentration on the fatty acid composition of lipids in Chlamydomonas reinhardtii cia-3, a mutant deficient in CO2-concentrating mechanism. Russ J Plant Physiol 45:447-455
Pulz O (2001) Photobioreactors: production systems for phototrophic microorganisms. Appl Microbiol Biotechnol 57:287-293
Pulz O, Gross W (2004) Valuable products from biotechnology of microalgae. Appl Microbiol Biotechnol 65:635-648
Pulz O, Scheinbenbogen K (1998) Photobireactors: design and performance with respect to light energy input. Adv Biochem Eng Biot 59:123-152
Raison JK, Orr GR (1986) Phase transitions in liposomes formed from the polar lipids of mitochondria from chilling-sensitive plants. Plant Physiol 81 (3):807-811
Raja R, Hemaiswarya S, Ashok Kumar N, Sridhar S, Rengasami R (2008) A perspective on biotechnological potential of microalgae. Crit Rev Microbiol 34:34-77
Rajauria G, Abu-Ghannam N (2013) Isolation and Partial Characterization of Bioactive Fucoxanthin from Himanthalia elongata Brown Seaweed: A TLC-Based Approach. International J Analytical Chem 6:1-6
Ramachandra TV, Mahapatra DM, Karthick B (2009) Milking diatoms for sustainable energy: Biochemical engineering versus gasoline-secreting diatom solar panels. Ind Eng Chem Res 48:8769-8788
Raman V, Ravi S (2011) Effect of salicylic acid and methyl jasmonate on antioxidant systems of Haematococcus pluvialis. Acta Physiol Plant 33:1043-1049

207
Ranga Rao A, Dayananda C, Sarada R, Shamala TR, Ravishankar GA (2007a) Effect of salinity on growth of green alga Botryococcus braunii and its constituents. Bioresour Technol 98 (3):560-564
Ranga Rao A, Raghunath Reddy RL, Baskaran V, Sarada R, Ravishankar GA (2010) Characterization of microalgal carotenoids by mass spectrometry and their bioavailability and antioxidant properties elucidated in rat model. J Agric Food Chem 58:8553-8559
Ranga Rao A, Sarada R, Ravishankar GA (2007b) Influence of CO2 on growth and hydrocarbon production in Botryococcus braunii. J Microbiol Biotechnol 17:414-419
Raymont JEG, Adams NE (1958) Studies on the mass culture of Phaeodactylum. Limnol Oceanogr 3:119-136
Rebolloso-Fuentes MM, Acien Fernandez GG, Sanchez Perez JA, Guil Guerrero JL (2000) Biomass nutrient profiles of the microalga Porphyridium cruentum. Food Chem 70:345-353
Rebolloso-Fuentes MM, Navarro-Perez A, Garcia C, F., Ramos-Miras JJ, Guil-Guerrero JL (2001) Biomass nutrient profiles of the microalga Nannochloropsis. J Agric Food Chem 49:2966-2972
Reddy CRK, Jha B, Fujita Y, Ohno M (2008) Seaweed micropropagation techniques and their potentials: an overview. J App Phycol 20:609-617
Reinfelder JR, Kraepiel AM, Morel FM (2000) Unicellular C4 photosynthesis in a marine diatom. Nature 407:996-999
Reitan KI, Rainuzzo JR, Olsen Y (1994) Effect of nutrient limitation on fatty acid and lipid content of marine microalgae. J Phycol 30:372-379
Renaud SM, Parry DL (1994) Microalgae for use in tropical aquaculture II: effect of salinity on growth, gross chemical composition and fatty acid composition of three species of marine microalgae. J Appl Phycol 6:347-356
Renaud SM, Thinh L-V, Lambrinidis G, Parry DL (2002) Effect of temperature on growth, chemical composition and fatty acid composition of tropical Australian microalgae grown in batch cultures. Aquaculture 211:195-214
Renaud SM, Zhou HC, Parry DL, Loung-Van T, Woo KC (1995) Effect of temperature on the growth, total lipid content and fatty acid composition of recently isolated tropical microalgae Isochrysis sp., Nitzschia closterium, Nitzschia paleacea, and commercial species Isochrysis sp., (clone T.ISO). J Appl Phycol 7:595-602
Reuter W, Muller C (1993) Adaptation of the photosynthetic apparatus of cyanobacteria to light and CO2. J Photochem Biol 21:3-27
Reynolds C (2006) Ecology of phytoplankton. Cambridge University Press, Cambridge

208
Richmond A (1986a) Cell response to environmental factors. In: A R (ed) Handbook of microalgal mass culture. CRC Press, Boca Raton, pp 69-99
Richmond A (1986b) Ourdoor mass cultures of microalgae. In: Richmond A (ed) Handbook of microalgal mass culture. CRC Press, Boca Raton, pp 285-330
Richmond A (2004) Principles for attaining maximal microalgal productivity in photobioreactors: an overview. Hydrobiologia 512 (1-3):33-37
Richmond A (2013) Biological principles of mass cultivation of photoautotrophic microalgae. In: Richmond A, Hu Q (eds) Handbook of microalgal culture: applied phycology and biotechnology. Wiley-Blackwell, UK, pp 171-204
Richmond A, Vonshak A, Arad S (1980) Environmental limitation in outdoor production of algal biomass. In: Shelef G, Soeder CJ (eds) Algae biomass. Elsevier North-Holland Biomedical Press, Amsterdam, pp 65-72
Richmond A, Wu ZC (2001) Optimization of a flat plate glass reactor for mass production of Nannochloropsis sp. outdoors. J Biotechnol 85:259-269
Rince Y, Robert JM (1983) Evolution des peuplements de diatomees planctoniques et benthiques d’un marais salant lors des variations printanieres de salinitite. Cryptogamie Algol 4:73-87
Rito-Palomares M, Nuñez L, Amador D (2001) Practical application of aqueous two-phase systems for the development of a prototype process for c-phycocyanin recovery from Spirulina maxima. Chem Technol Biotechnol 76:1273-1280
Rivkin R, Putt M (1987) Photosynthesis and cell division by the Antarctic microalgae: comparison of benthic, planktonic and ice algae. J Phycol 23:223-229
Rodolfi L, Zittelli GC, Bassi N, Padovani G, Biondi N, Bonini G, Tredici MR (2009) Microalgae for oil: Strain selection, induction of lipid synthesis and outdoor mass cultivation in a low-cost photobioreactor. Biotech Bioeng 102 (1):100-112
Roessler PG (1990) Environmental control of glycerolipid metabolism in microalgae: Commercial implications and future research directions. J Phycol 26:393-399
Round FE (1965) The biology of the algae. Edward Arnold, London Rousch JM, Bingham SE, Sommerfeld MR (2003) Changes in fatty acid
profiles of thermo-intolerant and thermo-tolerant marine diatoms during temperature stress. J Exp Mar Biol Ecol 295:145-156

209
Rowan KS (1989) Photosynthetic pigments of algae. Cambridge University Press, Cambridge
Salleh S, McMinn A (2011) The effects of temperature on the photosynthetic parameters and recovery of two temperate benthic microalgae, Amphora cf coffeaeformis and Cocconeis cf. sublittoralis (Bacillariophyceae). J Phycol 47:1413-1424
Sanchez JF, Fernandez JM, Acien FG, Rueda A, Perez-Parra J, Molina E (2008) Influence of culture conditions on the productivity and lutein content of the new strain Scenedesmus almeriensis. Process Biochem 43 (4):398-405
Santos FM, Mesquita JF (1984) Ultrastructural study of Haematococcus lacustris (Girod) Rostafinski (Volvocales). 1. Some aspects of carotenogenesis. Cytologia 49:215-228
Satyanarayana KG, Mariano AB, Vargas JVC (2011) A review on microalgae, a versatile source for sustainable energy and materials. Int J Energy Res 35:291-311
Schobert B (1974) The influence of water stress on the metabolism of diatoms. I. Osmotic resistance and proline accumulation in Cyclotella meneghiniana. Z Pflanzenphysiol 74:106-120
Sharma KK, Schumann H, Schenk PM (2012) High lipid induction in microalgae for biodiesel production. Energies 5:1532-1553
Shi X, Zhengyun W, Chen F (2006) Kinetic model of lutein production by heterotrophic Chlorella at various pH and temperature. Mol Nutr Food Res 50:763-768
Sieracki M, Poulton N, Crosbie N (2005) Automated isolation techniques for microalgae. In: Andersen RA (ed) Algal culturing tehniques. Elsevier Academic Press, London, pp 101-116
Sing A, Nigam PS, Murphy JD (2011) Mechanism and challenges in commercialisation of algal biofuels. Bioresour Technol 102:26-34
Sing DP, Sing N, Verma K (1995) Phooxidative damage to the cyanobacterium Arthrospira platensis mediated by singlet oxygen. Curr Microbiol 31:44-48
Sing J, Gu S (2010) Commercialization potential of microalgae for biofuels production. Renew Sust Energy Rev 14:2596-2610
Singh S, Arad S, Richmond A (2000) Extracellular polysaccharide production in outdoor mass cultures of Porphyridium sp in flat plate glass reactors. J Appl Phycol 12:269-275
Singh S, Kate BN, Banerjee UC (2005) Bioactive compounds from cyanobacteria and microalgae: An overview. Crit Rev Biotechnol 25:73-95
Sirenko LA, Kirpenko YA, Kirpenko NI (1999) Influence of metabolites of certain algae on human animal cell cultures. Int J Algae 1:122-126

210
Smith SR, Abbriano RM, Hildebrand M (2012) Comparative analysis of diatom genomes reveals substantial differences in the organization of carbon partitioning pathways. Algal Res 1:2-16
Søgaard DH, Hansen PJ, Rysgaard S, Glud RN (2011) Growth limitation of three Arctic sea ice algal species: effects of salinity, pH, and inorganic carbon availability. Polar Biol 34:1157-1165
Spanova M, Daum G (2011) Squalene—biochemistry, molecular biology, process biotechnology, and applications. Eur J Lipid Sci Technol 113:1299-1320
Spiller SC, Castelfranco AM, Castelfranco PA (1982) Effects of iron and oxygen on chlorophyll biosynthesis. I. In vivo observation on iron-and oxygen-deficient plants. Plant Physiol 69:107-111
Spolaore P, Joannis-Cassan C, Duran E, Isambert A (2006) Commercial application of microalgae. J Biosci Bioeng 101:87-96
Steen L (1998) Phosphorous availability in the 21st Century: management of a non-renewable resource. Phosphorous Potassium 217:25-31
Su CH, Chien LJ, Gomes J, Lin YS, Yu YK, Liou JS, Syu RJ (2011) Factors affecting lipid accumulation by Nannochloropsis oculata in a two-stage cultivation process. J Appl Phycol 23:903-908
Suh IS, Lee CG (2003) Photobioreactor engineering: design and performance. Biotechnol Bioprocess Eng 8 (6):313-321
Sulivan JM, Swift E (2003) Effects of small scale turbulence on net growth rate and size of ten species of marine dinoflagellates. J Phycol 39:83-94
Sulivan JM, Swift E, Donaghy PL, Rines JEN (2003) Small scale turbulence affects the division rate and morphology of two red-tide dinoflagellates. Harmful Algae 2:183-199
Sun Y, Wang C, Chen J (2008) Growth inhibition of the eight species of microalgae by growth inhibitor from the culture of Isochrysis galbana and its isolation and identification. J Appl Phycol 20:315-321
Sun YN, Yin MY, Liu JG (2001) Auto-signals in Haematococcus pluvialis. Transactions Oceanol Limnol 3:22-28
Sung KD, Lee JS, Shin CS, Park SC (1998) Isolation of a new highly CO2 tolerant fresh water Microalgae Chlorella sp. KR-1. Korean J Chem Eng 15:449-450
Swift DG (1980) Vitamins and phytoplankton growth. In: Morris I (ed) The physiological ecology of phytoplankton. Blackwell Scientific Publications, Oxford, pp 329-368
Sydney EB, da Silva TE, Tokarski A, Novak AC, de Carvalho JC, Woiciecohwski AL (2011) Screening of microalgae with potential for biodiesel production and nutrient removal from treated domestic sewage. Appl Energy 88:3291-3294

211
Takagi M, Karseno., Yoshida T (2006) Effect of salt concentration on intracellular accumulation of lipids and triacylglyceride in marine microalgae Dunaliella cells. J Biosci Bioeng 101 (3):223-226
Takagi M, Watanabe K, Yamaberi K, Yoshida Y (2000) Limited feeding of potassium nitrate for intracellular lipid and triglyceride accumulation of Nannochloris sp. UTEX LB1999 Appl Microbiol Biotechnol 54:112-117
Tang H, Chen M, Garcia MED, Abunasser N, Simon NKY, Salley SO (2011) Culture of microalgae Chlorella minutissima for biodiesel feedstock production. Biotechnol Bioeng 108:2280-2287
Tanoi T, Kawachi M, Watanabe MM (2011) Effects of carbon source on growth and morphology of Botryococcus braunii. J Appl Phycol 23:25-33
Thomas WH, Gibson CH (1990) Quantified small-scale turbulence inhibits a red tide dinoflagellate, Gonyaulax polyedra Stein. Deep Sea Res 37:1583-1593
Thomas WH, Vernet M, Gibson CH (1995) Effects of small-scale turbulence on photosynthesis, pigmentation, cell division, and cell size in the marine dinoplagellate Gonyaulax polyedra (Dinophycea). J Phycol 31:50-59
Thompson GA (1996) Lipids and membrane function in green algae. Biochem Biophys Acta 1302:17-45
Thompson PA, Guo M, Harrison PJ (1992) Effects of variation of temperature: I. On the biochemical composition of eight species of marine phytoplankton. J Phycol 28:481-188
Thompson PA, Guo M, Harrison PJ (1993) The influence of irradiance on the biochemical composition of three phytoplankton species and their nutritional value for larvae of the Pacific oyster (Crassostrea gigas). Mar Biol 117:259-268
Tilman D, Kilham SS, Kilham P (1982) Phytoplankton community ecology: the role of limiting nutrients Ann Rev Ecolog Syst 13:349–372
Tokusoglu O, Unal MK (2003) Biomass nutrient profiles of three microalgae: Spirulina platensis, Chlorella vulgaris, and Isochrysis galbana. J Food Sci 68:1144-1148
Tonegawa I, Okada S, Murakami M, Yamaguchi K (1998) Pigment composition of the green microalga Botryococcus braunii Kawaguchi-1. Fish Sci 64 (2):305-308
Tonon T, Larson TR, Graham IA (2002) Long chain polyunsaturated fatty acid production and partitioning to triacylglycerols in four microalgae. Phytochemistry 61:15-24
Tortell PD, Reinfelder JR, Mortel FMM (1997) Active uptake of bicarbonate by diatoms. Nature 390:243-244

212
Torzillo G, Giovannetti L, Bocci F, Materassi R (1984) Effect of oxygen concentration on the protein content of Arthrospira biomass. Biotechnol Bioeng 26:1134-1135
Tredici MR (2004) Mass production of microalgae: photobioreactors. In: Richmond A (ed) Handbook of microalgal cultures, biotechnology and applied phycology. Blackwell, Oxford, pp 178-214
Tredici MR (2010) Photobiology of microalgae mass cultures: understanding the tools for the next green revolution. Biofuels 1:143-162
Tredici MR, Materassi R (1992) From open ponds to vertical alveolar panels-The Italian experience in the development of reactors for the mass cultivation of photoautotrophic microorganisms. J Appl Phycol 4:221-231
Tredici MR, Zittelli GC, Rodolfi L (2010) Photobioreactors. Encyclopedia of Industrial Biotechnology, Bioprocess, Bioseparation, and Cell Technology vol 6. John Wiley & Sons, Hoboken
Trobajo R, Mann DG, Chepurnov VA, Clavero E, Cox EJ (2006) Taxonomy, life cycle, and auxosporulation of Nitzschia fonticola (Bacillariophyta). J Phycol 42:1353-1372
Ueda R, Hirayama S, Sugata K, Nakayama H (1996) Process for the production of ethanol from microalgae. US Patent 5,578,472,
Ugwu CU, Ogbonna JC, Tanaka H (2002) Improvement of mass transfer characteristics and productivities of inclined tubular photobioreactors by installation of internal static mixers. Appl Microbiol Biotechnol 58:600-607
Venkataraman LV, Becker EW (1982) Biotechnology and utilization of algae. The Indian experience. Department of Science and Technology and Central Food Technology Research Institute, Mangalore
Volkman JK, Jeffrey SW, Nichols PD, Rogers GI, Garland CD (1989) Fatty acid and lipid composition of 10 species of microalgae used in mariculture. J Exp Mar Biol Ecol 128:219-240
Walker TL, Purton S, Becker DK, Collet C (2005) Microalgae as bioreactors. Plant Cell Rep 24:629-641
Wang Y, Liu Z, Qin S (2013) Effects of iron on fatty acid and astaxanthin accumulation in mixotrophic Chromochloris zofingiensis. Biotechnol Lett 35:351-357
Weissman JC, Tillet DM, Goebel RP (1989) Design and operation of an outdoor microalgae test facility. Final subcontractors report. , vol SERI/STR-232-3569. Solar Energy Research Institute, Golden, Colorado

213
Wen Z-Y, Chen F (2001) Optimization of nitrogen sources for heterotrophic production of eicosapentaenoic acid by the diatom Nitzschia laevis. Enzyme and Microbial Technol 29:341–347
Wilhelm SW, Bullerjahn GS, Eldridge ML, Rinta-Kanto JM, Poorvin L, Bourbonniere RA (2006) Seasonal hypoxia and the genetic diversity of prokaryote populations in the central basin hypolimnion of Lake Erie: Evidence for abundant cyanobacteria and photosynthesis. J Great Lakes Res 32:657-671
Wolf FR (1983) Botryococcus braunii an unusual hydrocarbon-producing alga. Appl Biochem Biotechnol 8:249-260
Wu TT, Kuo-Huang LL, Lee J (1998) Algicidal effect of Peridinium bipes on Microcystis aeruginosa. Current Micobiol 37:256-261
Wu YH, Hu HY, Yu Y, Zhang TY, Zhu SF, Zhuang LL, Zhang X, Lu Y (2014) Microalgal species for sustainable biomass/lipid production using waste water as resource: A review. Renew Sust Energy Rev 33:675-688
Wynn J, Behrens P, A. S, Hansen J, Apt K (2010) Production of single cell oils by dinoflagellates. In: Cohen Z, Ratledge C (eds) Single Cell Oils: Microbial and algal oils. 2nd edn. AOCS Press, Champaign, IL, pp 115-130
Xia S, Wang K, Wan L, Li A, Hu Q, Zhang C (2013) Production, characterization, and antioxidant activity of fucoxanthin from the marine diatom Odontella aurita. Mar Drugs 11:2667-2681
Xin L, Hong-Yin H, Ke G, Ying-Xue S (2010) Effects of different nitrogen and phosphorus concentrations on the growth, nutrient uptake, and lipid accumulation of a freshwater microalga Scenedesmus sp. Bioresour Technol 101:5494–5500
Xu L, Wang F, Guo C, Liu CZ (2012) Improved algal oil production from Botryococcus braunii by feeding nitrate and phosphate in an airlift bioreactor. Eng Life Sci 12:171-177
Xu N, Zhang X, Fan X, Han L, Zeng C (2001) Effects of nitrogen source and concentration on growth rate and fatty acid composition of Ellipsoidion sp. (Eustigmatophyta). J Appl Phycol 13:463-469
Yaguchi T, Tanaka S, Yokochi T, Nakahara T, Higashihara T (1997) Production of high yield of docosahexaenoic acid by Schizochytrium sp. strain SR21. J Am Oil Chem Soc 74:1431-1434
Yamaguchi K, Nakano H, Murakami M, Konosu S, Nakayama O, Kanda M, Nakamura A, Iwamoto H (1987) Lipid composition of a green alga, Botryococcus braunii. Agr Biol Chem Tokyo 51 (2):493-498
Yeh KL, Chang JS (2011) Nitrogen starvation strategies and photobioreactor design for enhancing lipid production of a newly

214
isolated microalga Chlorella vulgaris esp-31: Implications for biofuels. Biotechnol J 6:1358-1366
Yongmanitchai W, Ward OP (1991) Growth of and omega-3 fatty acid production by Phaeodactylum tricornutum under different culture conditions. Appl Environ Micobiol 57 (2):419-425
Yun MS, Lee SH, Chung IK (2010) Photosynthetic activity of bentic diatoms in response to different temperatures. J Appl Phycol 22:559-562
Zeiler KG, Heacox DA, Toon ST, Kadam KL, Brown LM (1995) Use of microalgae for assimilation and utilization of carbon dioxide from fossil fuel-fired power plant flue gas. Energy Conv Manag 36:707-712
Zhang CW, Richmond A (2003) Sustainable, high-yielding outdoor mass cultures of Chaetoceros muelleri var. subsalsum and Isochrysis galbana in vertical plate reactors. Mar Biotechnol 5 (3):302-310
Zhang J (2015) Culture of Botryococcus braunii. Masters Thesis. Murdoch University, Perth, Western Australia
Zhila N, Kalacheva G, Volova T (2005) Effect of nitrogen limitation on the growth and lipid composition of the green alga Botryococcus braunii Kutz IPPAS H-252. Russian J Plant Physiol 52:311-319
Zhou XP, Xia L, Ge HM, Zhang DL, Hu CX (2013) Feasibility of biodiesel production by microalgae Chlorella sp. (FACHB-1748) under outdoor conditions. Bioresour Technol 138:131-135
Zhu SH, Green BR (2010) Photoprotection in the diatom Thalassiosira pseudonana: Role of L1818-like protein in response to high light stress. Biochim Biophys Acta 1797:1449-1457
Zhukova NV, Aizdaicher NA (1995) Fatty acid composition of 15 species of marine microalgae. Phytochemistry 39 (2):351-356
Zittelli CG, Pastorelli R, Tredici MR (2000) A modular flat panel photobioreactor (MFPP) for indoor mass cultivation of Nannochloropsis sp. under artificial illumination. J Appl Phycol 12:521-526
Zittelli GC, Biondi N, Rodolfi L, Tredici MR (2013) Photobioreactors for mass production of microalgae. In: Richmond A, Hu Q (eds) Handbook of microalgal culture, applied phycology and biotechnology. Wiley Blackwell, UK, pp 225-266


![Industrial application of microalgae in the circular ... · Industrial application of microalgae in the circular bioeconomy Dorinde Kleinegris [Applied Biotechnology / Microalgae]](https://img.dokumen.tips/doc/110x75/5ead3c152d0239422909016e/industrial-application-of-microalgae-in-the-circular-industrial-application.jpg)