Embed Size (px)
DESCRIPTION
ISL244E Macroeconomics Problem Session- 8. by Research Assistant Serkan Değirmenci D202/02-04 .0 4 .201 2. Today. GNH (2009), Macroeconomics in Context - Chapter 7 : Employment and Unemployment: (btw pages: 149-170) Review Questions (RQ): 1-9 (Page: 168-169) - PowerPoint PPT Presentation
Citation preview

ISL244EMacroeconomics
Problem Session-8by
Research Assistant Serkan Değirmenci
D202/02-04.04.2012
Today• GNH (2009), Macroeconomics in Context
- Chapter 7: Employment and Unemployment: (btw pages: 149-170)
Review Questions (RQ): 1-9 (Page: 168-169) Exercises (E): 1-2-6 (Page: 169-170)• BLANCHARD (2009), Macroeconomics
- Chapter 6: The Labor Market: (btw pages: 135-156)
Quick Check (QC): 1-2 (Page: 153)
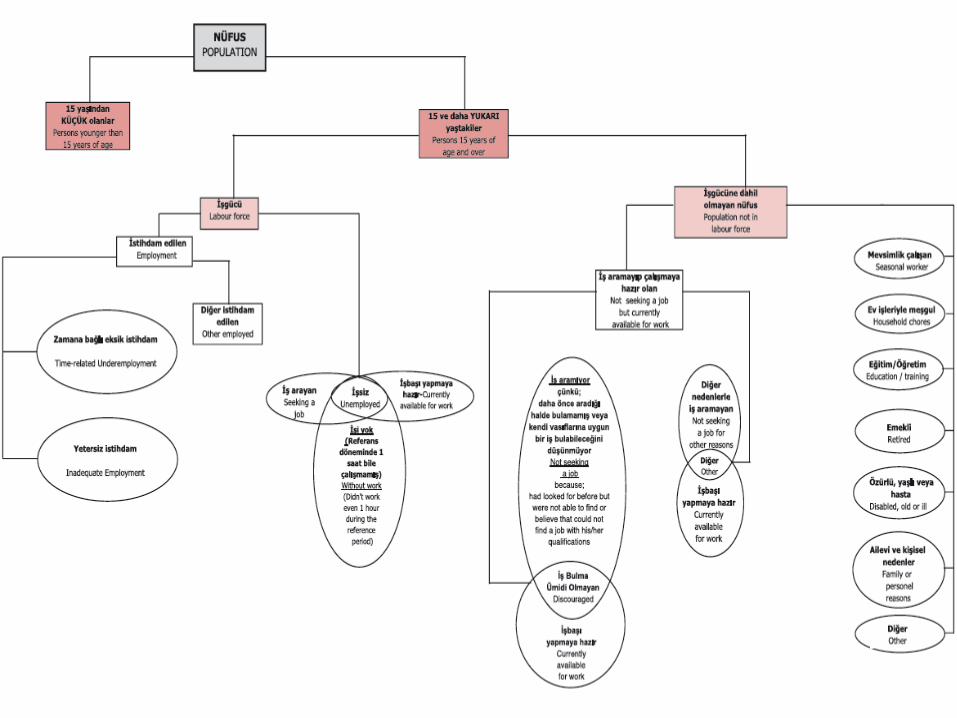
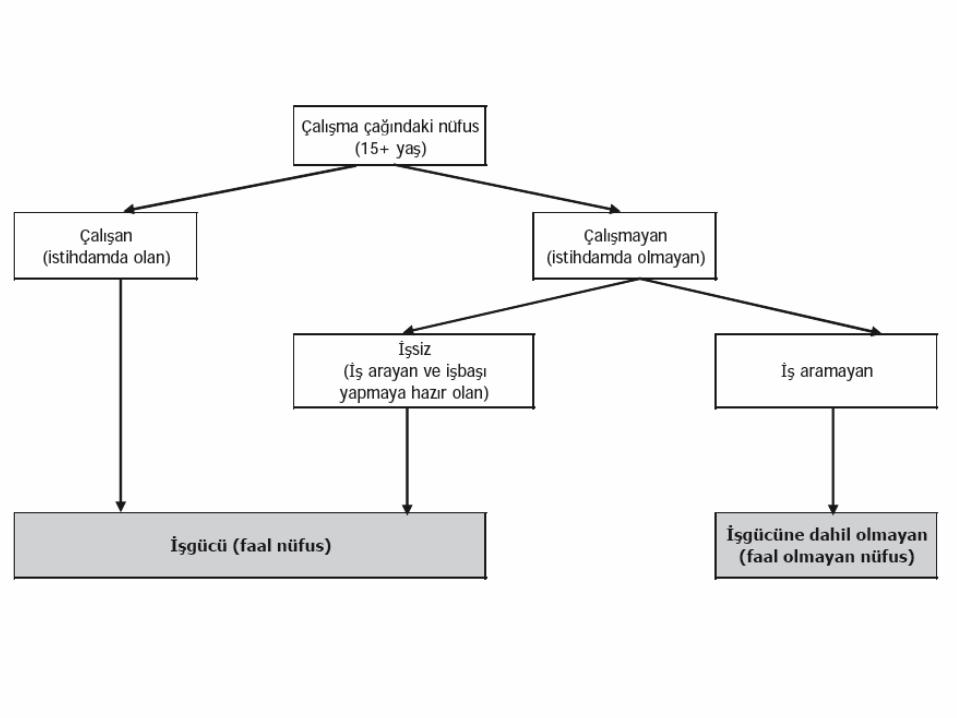
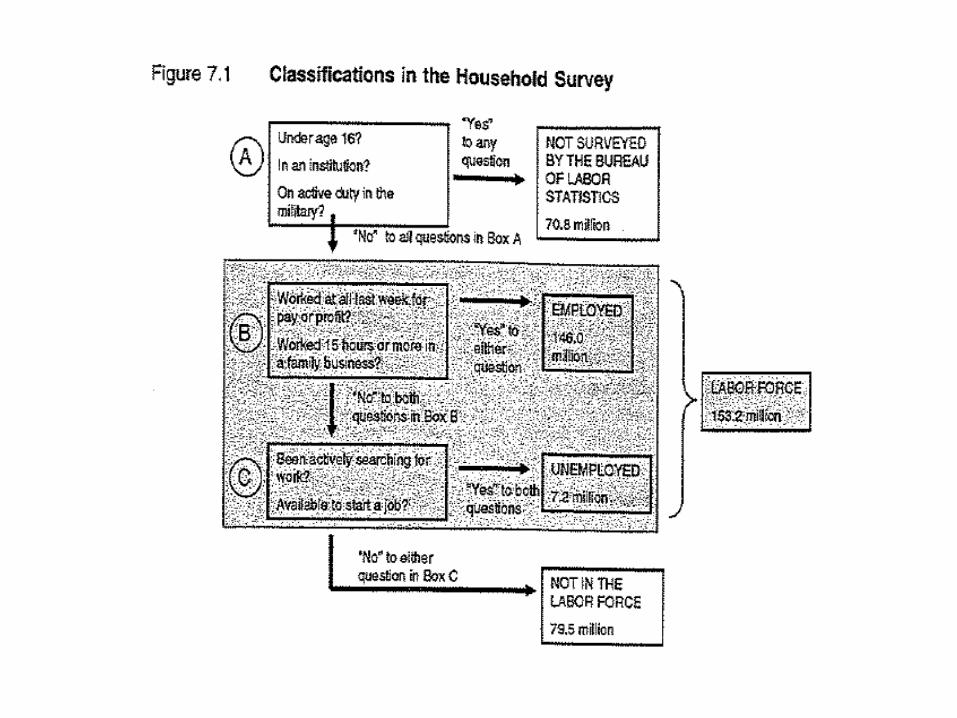
Chapter-7-RQ-1 (Page: 168)• What population is included in the official household survey that
measures employment and unemployment?ANSWER:
• Age 16 or over, • non-institutionalized, • non-military.
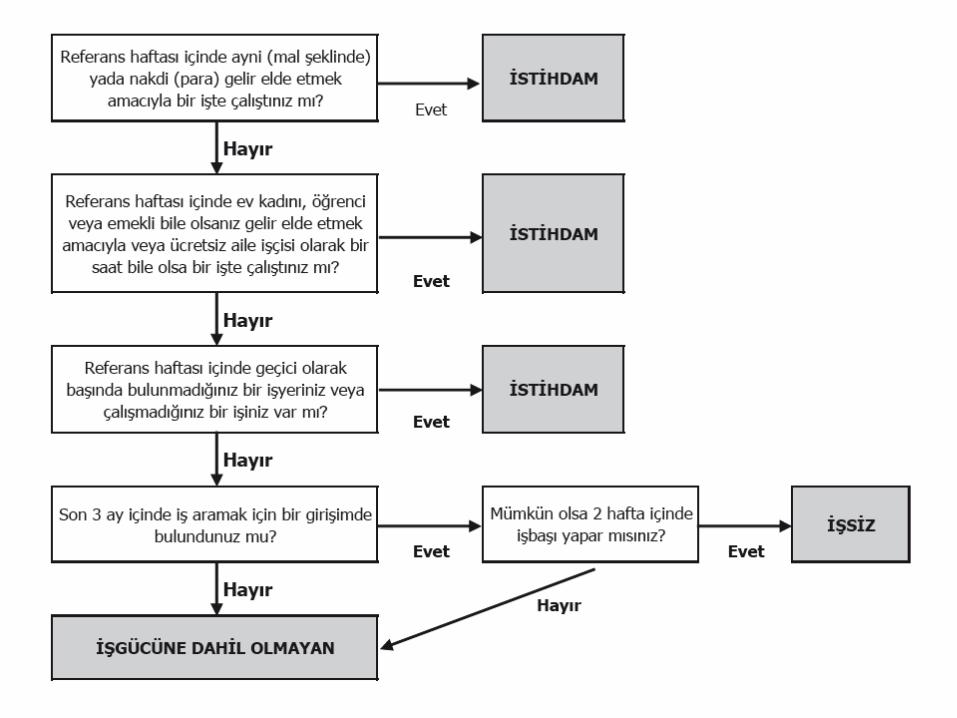
Chapter-7-RQ-2 (Page: 168)• What questions are asked to determine if someone is
“employed”?ANSWER:
• “Last week, did you do any work for pay or profit?” is the main question.
• People are also asked about work in a family business (or more than 15 hours) or
• if they were sick, on vacation, or on leave from a job.
Chapter-7-RQ-3 (Page: 168)• What makes a person count as “unemployed”?
ANSWER:• Not employed, • but actively searching for • and available for work.
Chapter-7-RQ-4 (Page: 168)• How is the unemployment rate calculated?
ANSWER:• unemployment rate = number of unemployed / number in
labor force ×100
Chapter-7-RQ-5 (Page: 168)• What groups tend to have particularly high unemployment
rates? Particularly low rates?ANSWER:
• Blacks, teenagers, and high school drop-outs tend to have higher unemployment rates.
• Whites and people with college degrees tend to have lower rates.
Chapter-7-RQ-6 (Page: 169)• List four ways a person may enter unemployment.
ANSWER:• Lose a job, • leave a job, • re-enter the work force, • enter the work force.
Chapter-7-RQ-7 (Page: 169)• What are “discouraged workers,” and why are they of concern?
ANSWER:• Someone who desires and is available for a job, but gives
discouragement as the reason for no longer looking. Unemployment figures may underestimate peoples’ need for jobs.
Chapter-7-RQ-8 (Page: 169)• List the three types of unemployment, and describe them.
ANSWER:• Frictional: due to transitions between jobs. • Structural: mismatch between available jobs and people’s
skills, experience, education and location. • Cyclical: due to macroeconomic fluctuations.
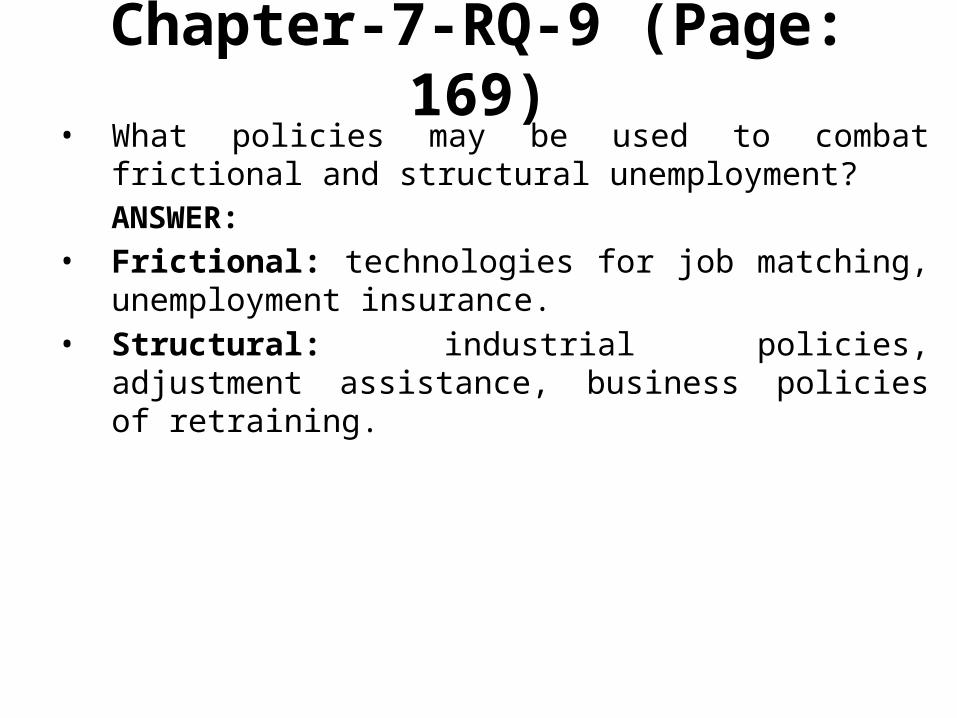
Chapter-7-RQ-9 (Page: 169)• What policies may be used to combat frictional and structural
unemployment?ANSWER:
• Frictional: technologies for job matching, unemployment insurance.
• Structural: industrial policies, adjustment assistance, business policies of retraining.
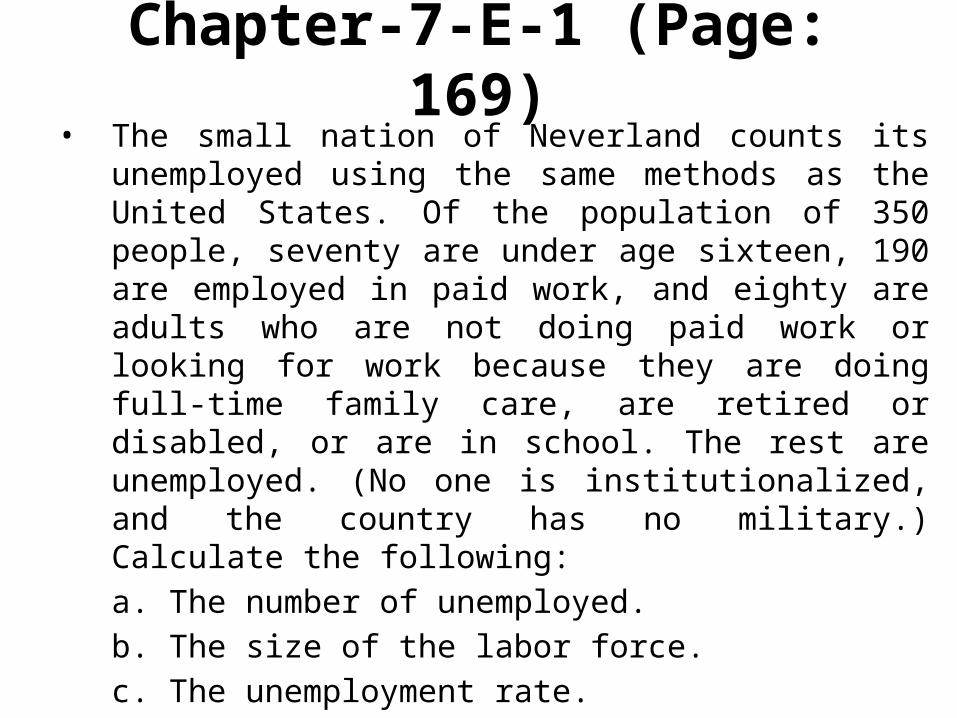
Chapter-7-E-1 (Page: 169)• The small nation of Neverland counts its unemployed using the
same methods as the United States. Of the population of 350 people, seventy are under age sixteen, 190 are employed in paid work, and eighty are adults who are not doing paid work or looking for work because they are doing full-time family care, are retired or disabled, or are in school. The rest are unemployed. (No one is institutionalized, and the country has no military.) Calculate the following:a. The number of unemployed.b. The size of the labor force.c. The unemployment rate.d. The labor force participation rate (overall, for both sexes)

Chapter-7-E-1 (Page: 169)Under Age 16 70 LF= 200Employed 190 Unemp. Rate 5.0Not in the Labor Force 80 LFP overall 71.4Unemployed 10Population 350Adult Population 280
ANSWER:a. 10 (= population − under age 16 − employed −not in labor force = 350
− 70 − 190 − 80) b. 200 (= employed + unemployed = 190 + 10) c. 5.0% (= unemployed/labor force = 10/200 ×100) d. 71.4% (= labor force/adult population × 100= (200/(350 − 70)) × 100)
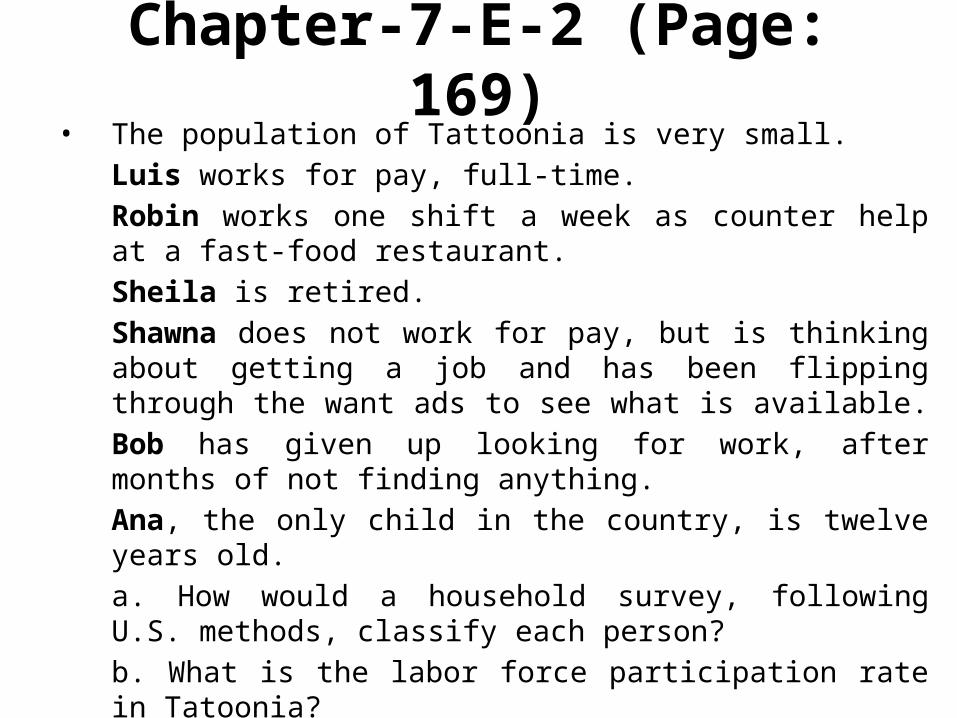
Chapter-7-E-2 (Page: 169)• The population of Tattoonia is very small.
Luis works for pay, full-time. Robin works one shift a week as counter help at a fast-food restaurant. Sheila is retired. Shawna does not work for pay, but is thinking about getting a job and has been flipping through the want ads to see what is available. Bob has given up looking for work, after months of not finding anything.Ana, the only child in the country, is twelve years old.a. How would a household survey, following U.S. methods, classify each person?b. What is the labor force participation rate in Tatoonia?c. What is the unemployment rate in Tatoonia?
Chapter-7-E-2 (Page: 169)
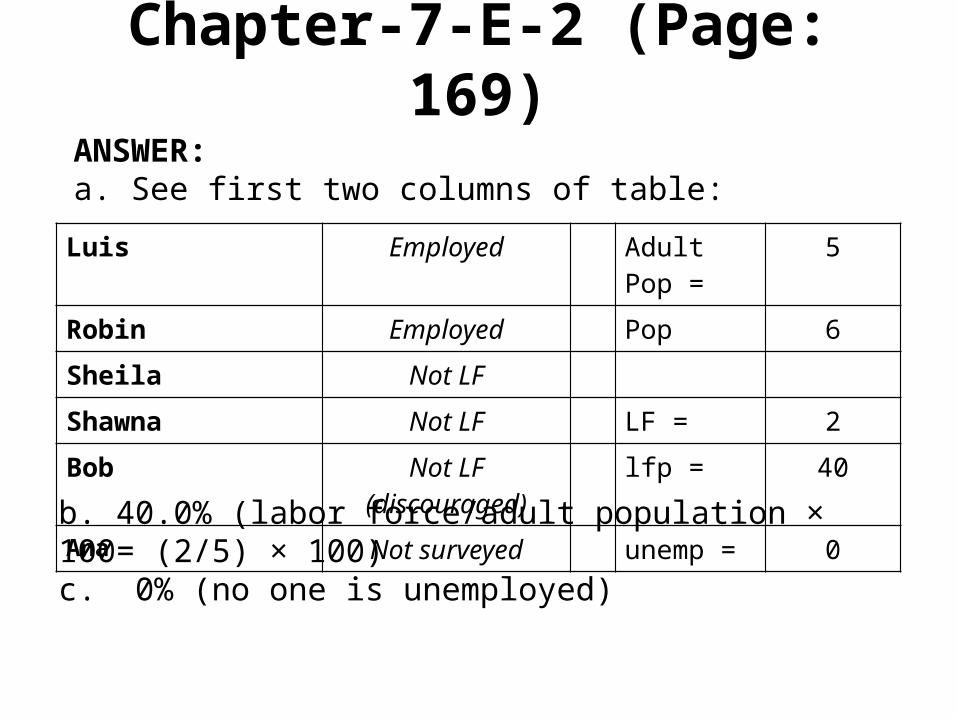
Luis Employed Adult Pop = 5Robin Employed Pop 6Sheila Not LFShawna Not LF LF = 2Bob Not LF (discouraged) lfp = 40Ana Not surveyed unemp = 0
ANSWER:a. See first two columns of table:
b. 40.0% (labor force/adult population × 100= (2/5) × 100) c. 0% (no one is unemployed)
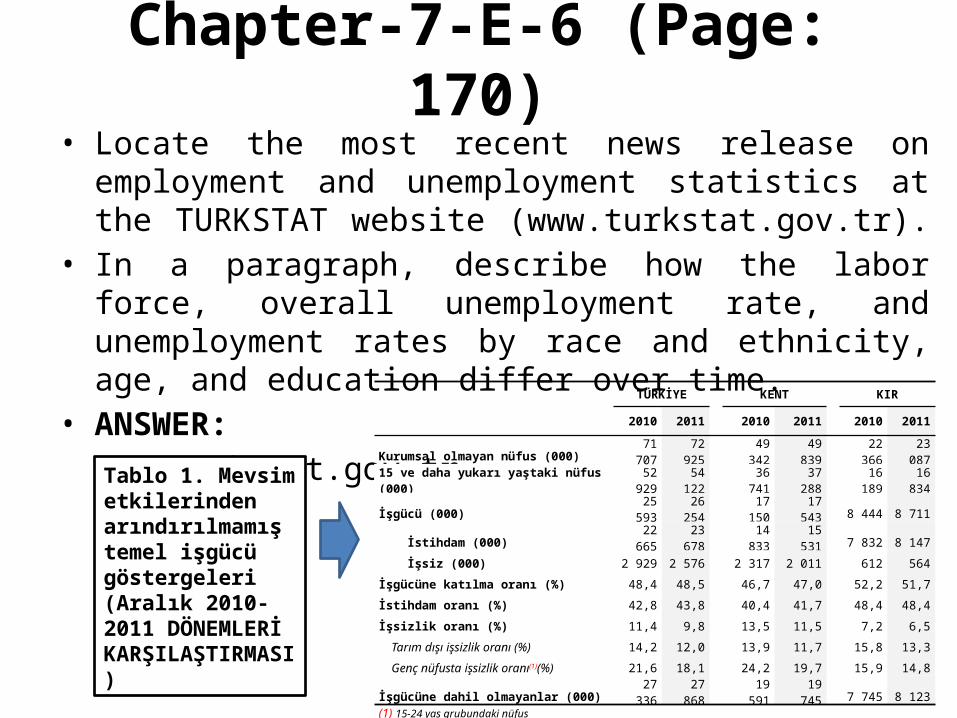
Chapter-7-E-6 (Page: 170)• Locate the most recent news release on employment and
unemployment statistics at the TURKSTAT website (www.turkstat.gov.tr).
• In a paragraph, describe how the labor force, overall unemployment rate, and unemployment rates by race and ethnicity, age, and education differ over time.
• ANSWER:www.turkstat.gov.trTablo 1. Mevsim etkilerinden arındırılmamış temel işgücü göstergeleri (Aralık 2010-2011 DÖNEMLERİ KARŞILAŞTIRMASI)
TÜRKİYE
KENT
KIR
2010 2011 2010 2011 2010 2011
Kurumsal olmayan nüfus (000) 71 707 72 925 49 342 49 839 22 366 23 087
15 ve daha yukarı yaştaki nüfus (000) 52 929 54 122 36 741 37 288 16 189 16 834
İşgücü (000) 25 593 26 254 17 150 17 543 8 444 8 711
İstihdam (000) 22 665 23 678 14 833 15 531 7 832 8 147
İşsiz (000) 2 929 2 576 2 317 2 011 612 564
İşgücüne katılma oranı (%) 48,4 48,5 46,7 47,0 52,2 51,7
İstihdam oranı (%) 42,8 43,8 40,4 41,7 48,4 48,4
İşsizlik oranı (%) 11,4 9,8 13,5 11,5 7,2 6,5
Tarım dışı işsizlik oranı (%) 14,2 12,0 13,9 11,7 15,8 13,3
Genç nüfusta işsizlik oranı(1)(%) 21,6 18,1 24,2 19,7 15,9 14,8
İşgücüne dahil olmayanlar (000) 27 336 27 868 19 591 19 745 7 745 8 123(1) 15-24 yaş grubundaki nüfus Not: Rakamlar yuvarlamadan dolayı toplamı vermeyebilir.
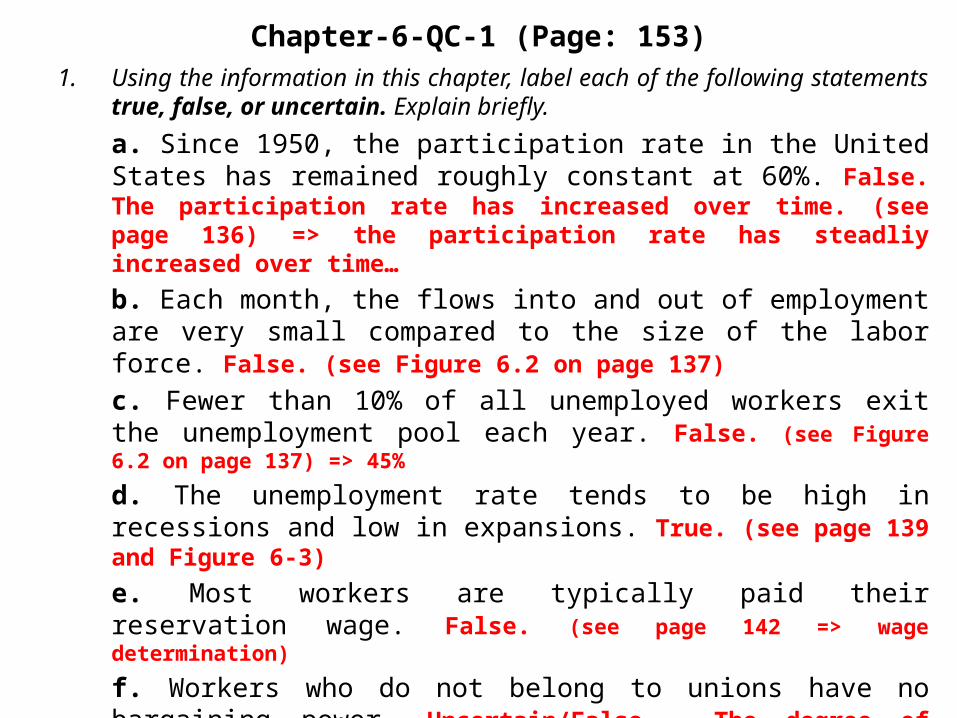
Chapter-6-QC-1 (Page: 153)1. Using the information in this chapter, label each of the following statements true,
false, or uncertain. Explain briefly.
a. Since 1950, the participation rate in the United States has remained roughly constant at 60%. False. The participation rate has increased over time. (see page 136) => the participation rate has steadliy increased over time…b. Each month, the flows into and out of employment are very small compared to the size of the labor force. False. (see Figure 6.2 on page 137)c. Fewer than 10% of all unemployed workers exit the unemployment pool each year. False. (see Figure 6.2 on page 137) => 45%
d. The unemployment rate tends to be high in recessions and low in expansions. True. (see page 139 and Figure 6-3)e. Most workers are typically paid their reservation wage. False. (see page 142 => wage determination)
f. Workers who do not belong to unions have no bargaining power. Uncertain/False. The degree of bargaining power depends on the nature of the job and the employee’s skills. (see page 142 => wage determination)g. It may be in the best interest of employers to pay wages higher than their workers’ reservation wage. True. (see page 143 => efficiency wages) h. The natural rate of unemployment is unaffected by policy changes. False. (see page 149)
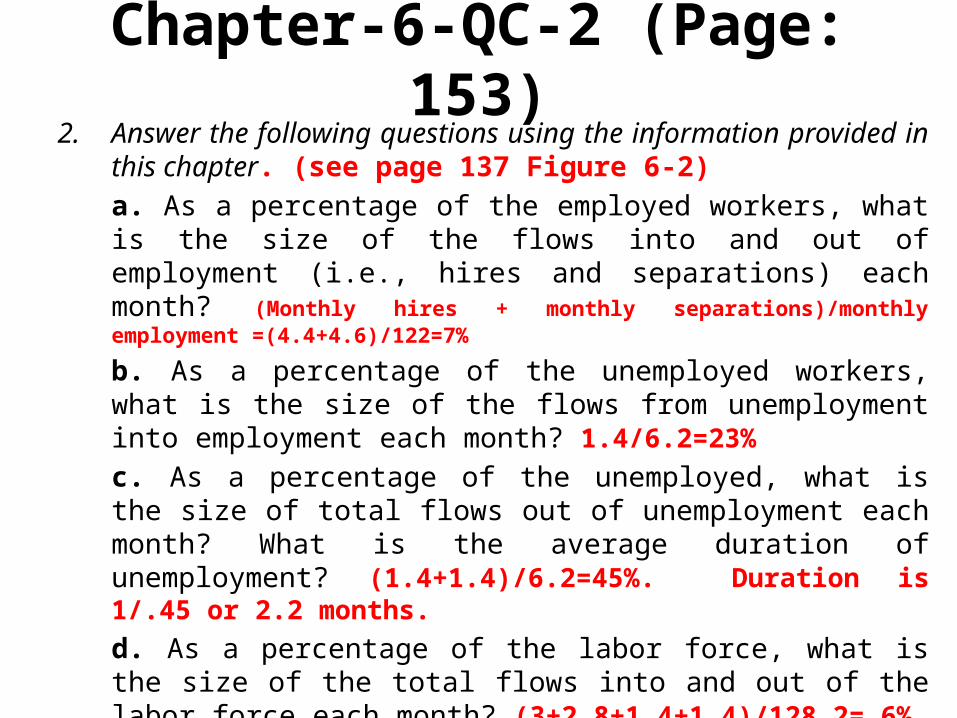
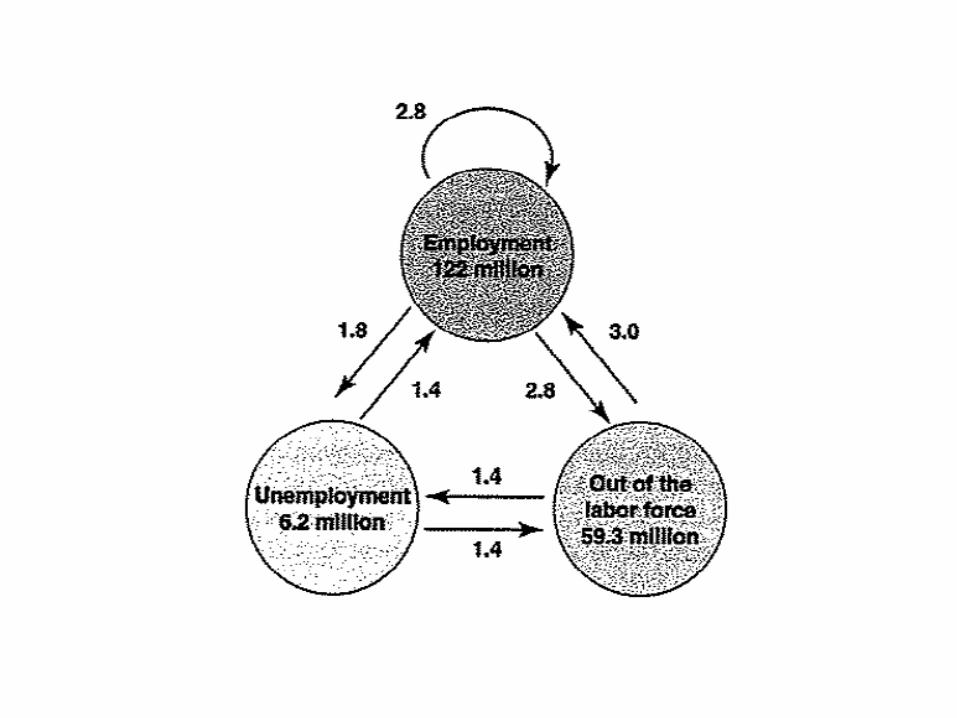
Chapter-6-QC-2 (Page: 153)2. Answer the following questions using the information provided in this
chapter. (see page 137 Figure 6-2)a. As a percentage of the employed workers, what is the size of the flows into and out of employment (i.e., hires and separations) each month? (Monthly hires + monthly separations)/monthly employment =(4.4+4.6)/122=7%
b. As a percentage of the unemployed workers, what is the size of the flows from unemployment into employment each month? 1.4/6.2=23%c. As a percentage of the unemployed, what is the size of total flows out of unemployment each month? What is the average duration of unemployment? (1.4+1.4)/6.2=45%. Duration is 1/.45 or 2.2 months.d. As a percentage of the labor force, what is the size of the total flows into and out of the labor force each month? (3+2.8+1.4+1.4)/128.2= 6%.e. What percentage of flows into the labor force do new workers entering the labor force constitute? new workers: 0.4/(3+1.4)=9%.

to be continued…