Embed Size (px)
Citation preview

Intelligent InvestorPO Box Q744 Queen Vic. Bldg NSW 1230T 02 8305 6000 F 02 9387 [email protected] www.intelligentinvestor.com.au
Is there still acase for oil?
OppOrtunItIes In the OIl sectOr specIal repOrt | PuBliShed decemBer 2012

Intelligent Investor
2
cOntents page
is there still a case for oil? 3Origin energy under siege? Pt 1 5Origin energy under siege? Pt 2 6Santos blows costs, market blows up 8AWe’s shale transformation 10Tap Oil upgraded 12Antares energy: Shale we dance? 13
A letter from the analyst
Dear Member,
Like tragedies and miracles, revolutions are often proclaimed but seldom transpire. One exception
is in energy where the last five years has yielded a genuine revolutionary change.
The words ‘peak oil’ used to provoke fear and worry. Now they are forgotten. The difference is
because of two technological breakthroughs in the US; horizontal drilling and hydraulic fracturing.
Both technologies, when used in tandem, have dramatically increased the potential supply of both
oil and gas in North America. Gas markets have already responded to the new world, falling from peaks of almost US$15 a
gigajoule to lows of US$2 a gj this year. According to many commentators, including the International
Energy Agency, a similar fate awaits oil markets. This is no mere hypothesis; increased supplies of
oil are already being pumped now. Thanks to shale oil, the US has arrested the 40 year decline in
domestic production. Texas and North Dakota are clocking 20-year production records. The revolution
that began in gas is spreading to oil. In light of these developments, oil bulls need to re-examine
the case for oil.This report is an attempt to do just that. It not only argues the case for oil, it highlights five ASX
listed stocks that are worth buying now. The case for oil has been altered by the shale revolution
but it still exists. Yours sincerely,
Gaurav SodhiResources analyst

Special report | Is there still a case for oil?
3
Feature article | First published 29 Nov 2012
Is there still a case for oil?
The shale revolution and new offshore discoveries will produce bountiful new oil supplies. What does that mean for oil bulls, asks Gaurav Sodhi?
When Alexander Bell, inventor of the telephone, offered to sell his patent to Western Union for the equivalent of $100,000 today, the reply was curt: ‘This ‘telephone’ has too many shortcomings to be seriously considered as a means of communication … The device is inherently of no value to us’.
The lessons from predictions fall mostly to the prognosticators; do it with care and humility. Predictions easily made are frequently wrong, and nowhere are they more treacherous than in predicting future oil prices.
In 1999, after years of grindingly low oil prices that approached US$10 a barrel, The Economist famously argued that prices would head to US$5 in the years to come. Instead, the next decade bought the most astonishing bull market in the commodity’s history. Prices peaked at close to US$150 a barrel (see Chart 1).
Despite a recession in the US, stagnation in Japan, a slowdown in China and financial Armageddon in Europe, oil prices remain stubbornly above US$100 a barrel.
On 27 Oct 09 In The case for oil, we made our own bullish call on the commodity, saying that the world’s cheap oil reserves had been exhausted and the era of cheap oil was over. That was but three years ago.
Since then, the advent of shale resources has changed the energy landscape. Some predict that America, still the world’s second largest consumer of oil, may become the world’s largest oil producer as it achieves energy independence for the first time in a century.
America isn’t alone. The International Energy Agency (IEA) has argued that Iran, Iraq, Africa, and Brazil can all potentially increase oil supply dramatically, potentially undoing the boom of the last decade. Is there still a case for oil?
shale of the century
Shale oil (see Shoptalk) isn’t a phrase that has garnered as much attention as shale gas, but its impact could be every bit as revolutionary. The technology that allows gas to be liberated from tight shale formations can also be used to extract liquid oil. It’s already happening. Oil production, which has been falling since the ‘70s, is now growing again (see Chart 2).
This could be just the beginning. The IEA forecasts that America could become the world’s largest oil producer by 2020, overtaking Saudi Arabia and Russia, producing more than 11m barrels of oil a day (bopd). It may even by self-sufficient in energy by 2035. Currently, the US exports a little bit of gas but it still imports most of its oil needs.
In 2005, the US imported over 60% of consumption; today it imports 42%. Texas and North Dakota, for example, are pumping more oil than they have in 20 years. Oil imports have fallen dramatically as a result. All this is possible because of shale oil.
America is only one source of bountiful new supply. Iraq, Iran, Canada and Brazil are singled out by the IEA as additional sources. The words ‘peak oil’, which filled the world with dread only a few years ago, are now forgotten as the world contemplates an age of plenty. Surely this dents the bull case for oil?
tougher than it looks
Our original case wasn’t about shortages of supply but the cost of extraction. The oil age will likely end not because oil runs out but because it becomes too expensive to extract. The important metric isn’t the absolute level of oil output but the cost of production and the reliability of supply. Taking those factors into account additional supply doesn’t appear as assured.
Iraq, Iran and Africa are all unreliable sources of new supply. Almost half of new oil supply between now and 2035 is expected to come from Iraq yet both regional and central government’s claim resource ownership.
Key pOInts
New sources of oil have altered the bull case
The costs of oil production are still rising
High prices still likely
shOptalK
shale oil and gas create the same product as conventional oil and gas. The difference is in the production. Conventional oil and gas is produced from permeable reservoirs like limestone or sandstone. Wells are drilled and oil and gas escapes. To produce from shales requires a mixture of water, sand and chemicals to explode open tight shale rocks, a process known as fracking. Once open, oil and gas can flow. The process has been improved with the aid of horizontal drilling to access larger swathes of shale.
Source: BP Statistical review of energy, 2012
$US
0
20
40
60
80
100
120
140
201119861961193619111886
chart 1: crude OIl prIces, 1861–2011

Intelligent Investor
4
A paucity of infrastructure and water and an excess of violence, bureaucracy and graft make the notional production target of over 8m bopd far from assured. The situation is even worse in Iran and Africa. Iran can at least extract oil cheaply. Offshore Africa remains one of the most expensive places in the world to produce oil.
Vast supplies of oil sands (different to shale oil) ensure Canada has the world’s largest oil reserves but production is difficult, expensive and inefficient. Rocks are mined deep underground and then burned to release oil. By some estimates, the process consumes three times the energy it releases and is really an exercise in energy arbitrage rather than a genuine technological innovation.
With the marginal cost of production estimated at between US$80–US$100 a barrel, producers of oil sands require an oil price around the current level to remain profitable. With over 400bn barrels of oil, Canadian resources tower above anyone else yet they produce just 3.5m bopd compared with over 10m bopd in Russia and Saudi Arabia.
Most of Canada’s oil is simply too costly and inefficient to exploit. Suncor, a large Canadian producer, has recently joined others in aborting growth projects because Canadian oil sands require about US$50bn per year in capital expenditure. That leaves America, the source of current jubilation, as the real threat to oil prices. Here the threat is serious and current.
costly shale
Shale oil is already producing valuable liquids. In the Bakken shale in North Dakota, for example, production has increased fourfold from 2005 to 2011. A similar story is being repeated in shale basins across North America forcing oil bulls to re-examine old predictions.
Yet more output doesn’t necessarily mean lower prices. Again, it’s the cost of production that matters. Whereas traditional oil reservoirs will decline in a fairly consistent fashion at about 5% per year, shale reservoirs will register an average decline of 40% in the first year with a steadier decline to follow.
To maintain production rates, plenty of wells have to be drilled and each new additional well will decline swiftly. Costs are consequently high. In the Bakken formation, for example, the marginal cost of production is estimated to be between US$80-90 a barrel.
As more wells are drilled, new difficulties emerge, too. As the most productive wells are picked over and exhausted, drillers move to more marginal locations. Higher prices will be needed to access new wells to keep output steady.
The sheer number of necessary wells tends to hit other limits. Rigs, skilled labour and water are all used heavily and, as has happened in Australia, costs tend to rise with demand. Add in higher capital costs and a likely rate of return and the marginal cost of production could easily reach US$100 a barrel.
not so high
Shale oil has altered the bull case for oil but it hasn’t eliminated it. By placing a ceiling on how high prices can go before an enormous new supply becomes viable, oil bulls should temper expectations for the oil price. A collapse in prices, however, to US$50-60 a barrel, for example, is unlikely. But so is a price of US$200 a barrel which, just a few years ago, were the norm.
There is no shortage of oil and those prophesising the end of the oil age will probably be proven wrong. Yet that is not an argument for falling prices because the new identified supply remains expensive and requires high prices in order for it to be exploited. Last year, for example, the marginal cost of conventional oil production was $92 a barrel, according to consultancy Bernstein Research.
For investors, production costs remain paramount. It is not enough to assume that prices will march higher—you have to select producers that remain profitable at more conservative prices. Our favoured stocks in the sector; Santos, Origin energy, Oil Search, AWe, Tap Oil and Antares energy, are well placed for a less enthused bull market.
Note: The Growth portfolio owns shares in Tap Oil and AWE.
Disclosure: The author, Gaurav Sodhi, owns shares in AWE, Tap Oil and Antares Energy. First published online 29 Nov 2012.
Source: BP Statistical review of energy, 2012
Kbopd
6,000
8,000
10,000
12,000
20112001199119811971
chart 2: us OIl prOductIOn, 1965–2011
There is no shortage of oil and those prophesising the end of the oil age will probably be proven wrong. Yet that is not an argument for falling prices.

Special report | Is there still a case for oil?
5
Blue chip resources | First published 13 Nov 2012
Part 1
Origin Energy under siege?
After 12 years of unbroken growth, important industry changes have rocked Origin. is the investment case under threat?
For a dozen years, Origin Energy’s chief executive Grant King has basked in the glory of ever growing profits; earnings per share growth has averaged 16% per year since the company was spun out of the Boral empire in 2000. That run is coming to an end. For the first time ever, Origin will announce falling operating profits this financial year.
Instead of rising 10% as previously foreshadowed by management, earnings before interest, tax, depreciation and amortisation (EBITDA) is likely to rise just 5% for the year ended 30 June 2013 , leading to a fall in net profit after tax of between 5–10%. The most surprising part of the downgrade is that it has nothing to do with the controversial LNG project and everything to do with changes in the retail energy division.
Energy retailing used to be a stable business. The most important costs—relating to the purchase of wholesale electricity and transmission to end user—are both regulated. When costs increase, Origin is permitted to pass them on to customers via higher retail prices. Despite stiff competition, retail margins are therefore relatively stable.
Two major changes have rocked this cosy arrangement. Regulators are becoming stingier on allowing retailers to recoup higher costs, and the demand for power is falling. Here, we’ll deal with the regulatory changes buffeting the industry. Next week, we’ll delve into important changes affecting power consumption.
power of the sun
If forced to identify the immediate cause of its woes, management would have all fingers pointed at the sun.
Subsidised rooftop solar panels have been more popular than anyone could have imagined. Their combined electrical output has exceeded all expectations and Origin is being forced to buy this pricey power in order to meet its renewable energy targets. That itself is not the problem; that Origin can’t recover higher costs is.
Apart from Victoria, states regulate the retail price of electricity (and gas). The regulatory process is supposed to take account of all costs, allowing retailers to pass on uncontrollable costs to customers. One such cost is the price of renewable power that retailers are forced to buy.
Origin’s energy costs have soared as it has bought output from rooftop solar panels but some state regulators haven’t allowed it to recover those costs from customers. For the time being, Origin is going to have to wear the difference, a shortfall to net profit of about $40m for 2012/13.
Ordinarily, that shortfall would be recovered in subsequent regulatory rulings. So profits lost today will probably be recouped in the future. That’s what happened in the past. Whether it happens again depends, however, on rational regulation.
Irregular regulation
Regulators in South Australia and Queensland have already made changes to the way they allow retailers to recover costs. As a result, AGl and Origin have stopped competing in Queensland altogether; discounts have ceased and neither is now prepared to invest in new generation capacity. New South Wales, the largest energy market, is expected to make a regulatory ruling in March next year.
The low share price reflects a growing fear of regulatory risk. That is no idle threat. Origin’s business depends on sensible regulation and several recent decisions call that into question.
Almost everyone involved in the industry agrees that the regulatory regime needs reform. One of the key problems is that costs and regulations are imposed from different parties. Although the Commonwealth imposes costs on Origin, the only way for the company to recoup them is through regulators controlled by state governments.
Key pOInts
Regulatory changes have caused a profit fall
Regulator rationality is being questioned
At current prices, Origin appears cheap
OrIgIn energy | ORG
prIce at 11 dec 2012 $11.20
revIew date 13 Nov 2012
marKet cap. $12.2bn
12 mth prIce range $10.04—$15.02
BusIness rIsK Med–High
share prIce rIsK Med–High
max. pOrtfOlIO weIghtIng 4%
Our vIew lOng term Buy
Intelligent Investor
6
With both intent on lowering energy prices, that spells trouble. Fear may be driving the share price lower, but it is a rational fear.
The Commonwealth government has released a White Paper on power that aims to correct the systemic flaws responsible for today’s uncertainty. It is a clear path for improvement and, if followed, should be beneficial to Origin over time.
worth buying
Regulation remains a key risk to the business and a good reason to keep a portfolio limit of 4%. But it’s also the reason why an opportunity exits today. Without the fear created by regulatory uncertainty, the stock wouldn’t be as cheap as it is. Origin’s assets are worth more than the market is imputing.
If we conservatively value the equity in APLNG at $3.80 a share (see The temptations of Origin Energy on 15 Oct 12 (Long Term Buy—11.47)), and the 50% stake in listed subsidiary Contact Energy at $1.90 a share (after applying a 30% discount to the valuation on the New Zealand stock exchange), then the equity in the energy retail business is being priced at just over $5 a share. Add another $2.20 per share for the liabilities (mostly debt) of the retailing business to arrive at an enterprise value of $7.20 per Origin share. In practice, the figure is likely to be even lower but Origin doesn’t separate debt from other liabilities at the divisional level. That energy business earned underlying EBIT of $1.3bn last year, or about $1.18 per share.
It may not earn that sum again for some time but a fairly dire outcome for profits is already priced in, even though an unfavourable regulatory outcome is not assured.
There is one more trend that could rock the business; falling energy consumption. We’ll turn our attention to what is driving that trend, how it might impact the industry and whether Origin should be upgraded next week. We’re chopping the top end of our recommendation guide to account for lower profits until 2015 but, at current prices, we’re closer to upgrading to a Buy than downgrading to Hold. With the share price up marginally since 9 Nov 12 (Long Term Buy—$10.47), Origin remains a lONG Term BuY.
Blue chip resources | First published 27 Nov 2012
Part 2
Origin Energy under siege?
higher retail electricity prices and the rise of solar power are changing what used to be a stable, predictable business. What does that mean for Origin energy, asks Gaurav Sodhi?
One of the few certainties offered by economics is that electricity consumption rises with population and income. The theory is obvious enough to pass as cliché; more people consume more power and wealthier people buy ever more gadgets, widgets and doodahs that consume more power.
In Australia, that law has ruled for a generation. It was assumed by all, including your analyst, to continue undisrupted and undisputed. Yet, as Francis Bacon reminds us, if a man begins with certainty, he will end in doubt. The old law is no more.
For the first time in living memory, electricity consumption in Australia is falling. If the trend continues, it has significant implications for energy retailers like Origin Energy and AGl.
In Part 1 of this series, we examined the regulatory risks that have frightened the market and argued that, although the risks were real, it had been factored into share prices. Now we turn to the causes, and the consequences, of this new twist. Why are we buying less power?
Org recOmmendatIOn guIde
lOng term Buy Below $15.00
hOld Up to $20.00
sell Above $20.00
a capItal raIsIng?
Origin has taken on substantial debt to fund its share of APLNG costs but it’s also relying on free cashflow from the retailing business. With profits falling, some have argued that a capital raising is imminent.
We disagree. Origin’s credit rating may be threatened in the worst case scenario but that is not the same as a cash shortage. On our numbers, Origin appears funded for APLNG costs. Selling part of APLNG will remove any lingering doubt.
At the annual meeting, management restated its intention to sell down a tranche of APLNG equity. The stake could be highly sought. BG recently sold part of its stake in a fellow CSG LNG development to a Chinese company. It’s clear buyers haven’t been spooked by higher costs.
Key pOInts
Solar panel adoption and price rises causing energy demand to fall
Price more than reflects these risks
Sticking with Long Term Buy
OrIgIn energy | ORG
prIce at 11 dec 2012 $11.20
revIew date 27 Nov 2012
12 mth prIce range $9.84—$15.02
fundamental rIsK Med–High
share prIce rIsK Med–High
max. pOrtfOlIO weIghtIng 4%
Our vIew lOng term Buy

Special report | Is there still a case for oil?
7
economics works
The answer to that question is partly cyclical. Economic growth in Australia is flattered by high mineral prices and an unprecedented mining investment boom. Industrial production, however, has fared less well, falling almost 10% since 2008. Energy demand may rebound as the non-resources economy does.
A larger part of the explanation, however, has to do with dramatic increases in electricity retail prices which have, on average, doubled in six years. Higher prices aren’t by themselves a problem for retailers. They can pass on higher costs to consumers, although, as we saw in Part 1, it can be harder in some states than others. The larger problem comes from how consumers respond to higher prices; they look for substitutes and buy less. Who would have thought it?
Rooftop solar panels (heavily subsidised, of course), have created a power supply beyond Origin’s grip. The number of installations is staggering (see Chart 1). More than 850,000 homes now boast solar panels with an installed capacity of 2.3 gigawatts. According to the IEA, last year more residential solar panels were built in Australia than anywhere else in the world.
Every watt of electricity harnessed from these panels is a watt not purchased through traditional channels. Worse, (as explained in Part 1), the South Australian and Queensland regulators don’t allow Origin to recover the full cost solar panels impose on the system. They are a powerful headwind for the company. As subsidies taper away, growth in solar installations will slow but panel costs are falling dramatically sans subsidies. Solar remains a long term threat.
Households are also pursuing efficiency gains with more rigour than ever before; they are responding to higher prices exactly as one would expect. The combined effects of solar and high retail prices are clear in Chart 2. Consumption per customer has fallen 2.5% in each of the last two years.
Solar panels and the pursuit of efficiency are wonderful things for the environment but hurt the revenues of Origin and AGL. Origin’s recent profit warning focused on regulatory risk but, according to our numbers, more than half the downgrade due to lower electricity demand.
As long as electricity prices stay high, the pursuit of efficiency is unlikely to go away. Origin charges customers much more for power but it certainly isn’t keeping the extra cash. So who does?
Build it and they will profit
Electricity network businesses, like Spark infrastructure and its unlisted peers in other states are the prime beneficiaries. They receive a regulated return on every dollar they invest, creating a strong incentive to, politely, keep investments up to date. The critics call it gold plating.
That’s no easy job. The National Electricity Market, into which Origin sells surplus power and from which it buys deficit power, is monstrous. Over 300 generators feed a network that covers 90% of the Australian population via 40,000km of high voltage transmission wires and 750,000km of low voltage wires.
Most important of all are the 1,500km of interconnectors that allow for trade between states on the east coast. The network consumes colossal levels of capital that must come from a relatively small population. The UK, for example, uses half the transmission wiring to service three times the population.
Network costs have been responsible for almost all the increase in retail prices because electrical capacity is built to handle peak demand rather than absolute consumption.
When the weather is very hot or cold, air conditioners fire up, driving up short term consumption time. The network is built to handle such a ‘peak’ event and the peak has been rising even as absolute consumption has been falling. More than half of all network capital expenditure is to maintain demand on the 40 most used hours of the year.
Retailers may have nothing to do with causing higher prices, but they do bear a financial burden through lower demand. The energy retail business isn’t as stable as once thought.
how cheap?
That stability becomes important because Origin relies on cashflow from the retail business to fund its foray into LNG. Lower profits mean cash must come from elsewhere. It’s a key reason why concern about a capital raising persists.
Such concerns are genuinely important, but they need to be weighed against today’s
Source: Clean Energy Australia, 2012
MW
0
100
200
300
400
500
600
2011*200820052002
chart 1: Installed sOlar capacIty In australIa, 2001–2011
Source: AER, 2012
TW/h
160
180
Tasmanian entry
200
99–00
01–02
03–04
05–06
07–08
09–10
11–12
220
chart 2: nem electrIcIty cOnsumptIOn, 1999–2011
Out of favour it may be, and maligned it may remain, but for the first time in a decade Origin appears genuinely cheap.

Intelligent Investor
8
share price, which represents a 20% discount to book value. The stock appears even cheaper when you consider that the retail division houses $12.9bn of assets and $2.4bn of liabilities for implied equity of $10.5bn.
With a market capitalisation of $12.2bn, Origin is trading at just above the equity in the retail division alone. The stakes in APLNG, Contact Energy and the oil and gas division are all valued at cheaply.
Of course, that’s only true if the assets in the retail division are justly represented by book value. We can’t know for sure, but we can look at the division’s return on assets (ROA) to glean if they are being fairly valued.
Out of favour
Last year, the energy retail division earned ROA (measured by EBITDA/Assets) of 12%, which sounds reasonable. By comparison, AGL earns 10% from its generation assets. If Origin were overstating asset values on its balance sheet, returns would look slimmer than they do.
It’s possible that APLNG has a negative value but unlikely. A huge cost blowout or a sustained collapse in the oil price to about US$50 a barrel would be needed for that. There are concerns, such as a changing regulatory environment, falling demand for conventional electricity and worry about the economics of the massive APLNG project that will probably keep the share price low for some time.
For patient investors, it shouldn’t matter. Out of favour it may be, and maligned it may remain, but for the first time in a decade Origin appears genuinely cheap. While the stock is close to being upgraded to an outright Buy, for now, with the share price up 9% since Origin Energy under siege part 1 (Long Term Buy—$10.25), we’re sticking with lONG Term BuY.
Blue chip resource | First published 2 Jul 2012
Santos blows costs, market blows up
The Santos blowout is more about a lack of gas than a cost increase. Gaurav Sodhi investigates whether the original case to buy remains intact.
It’s become a rite of passage. Before completing vast new LNG facilities, producers announce a large increase in costs. So it is with Santos. The company recently said it would spend an additional US$2.5bn at its Gladstone LNG project (GLNG). Capital costs due to be spent before the 2015 completion date will increase from US$16bn to US$18.5bn, a rise of 16%.
Chief executive David Knox insists that this extra spending is not a cost increase.Strictly speaking, this is true. As the additional spending is being brought forward, the
timing of cashflows has changed but the absolute quantity of expenditure hasn’t. That’s the official line anyway.
Unofficially, there are two concerns raised by the news; the first is whether capital costs are actually increasing. If they are, rates of return from GLNG will be lower. The second is gas volume.
up or not?
About 10% of the additional US$2.5bn is due to cost increases for the construction of GLNG. The remainder, according to Santos, is to expand the company’s drilling program by 300 wells. That’s because new wells are needed to keep enough gas flowing to feed the huge and hungry liquefaction (or freezing) facility.
capItal raIsIng redux
As the share price falls, the costs of raising equity rises. Yet even if Origin were to raise money, it wouldn’t alter the buy case. If Origin raises an additional $1bn at $8 a share, including an additional 125m shares today, the company would still be trading at a 10% discount to book value.
Org recOmmendatIOn guIde
lOng term Buy Below $15.00
hOld Up to $20.00
sell Above $20.00
Key pOInts
An extra US$2.5bn to be spent on GLNG before 2015
Santos is short on gas for GLNG
Remains a Long Term Buy
Special report | Is there still a case for oil?
9
The additional US$250m is a modest amount and compares favourably with industry trends. Woodside’s Pluto LNG project, for example, was to cost less than US$12bn but will be delivered late and cost US$16bn.
The cost increases have been significant enough to alter the economics of the project. Pluto will probably generate a rate of return of 5–7% and Woodside will barely make any money from it. Queensland coal seam gas (CSG) rival BG Group also announced cost increases of US$5bn.
Santos faces no such calamity. So why did investors treat the news with such disdain?Let’s assume that, as Santos claims, the US$2bn is being spent drilling an additional
300 wells. That’s over $US7m per well, an extraordinary sum for CSG drilling. Even allowing for additional piping, water treatment and pressurisation, Santos’s costs appear overly high. Shale gas producers require as much money to drill thousands of metres below the surface and set off dozens of underground explosions. Simply drilling a few hundred metres to access CSG should be much cheaper.
Perhaps there is a contingency or an unrevealed cost but, as the company has structured a high proportion of its construction as fixed price contracts, it’s less of a concern than the second issue.
gas volume concerns
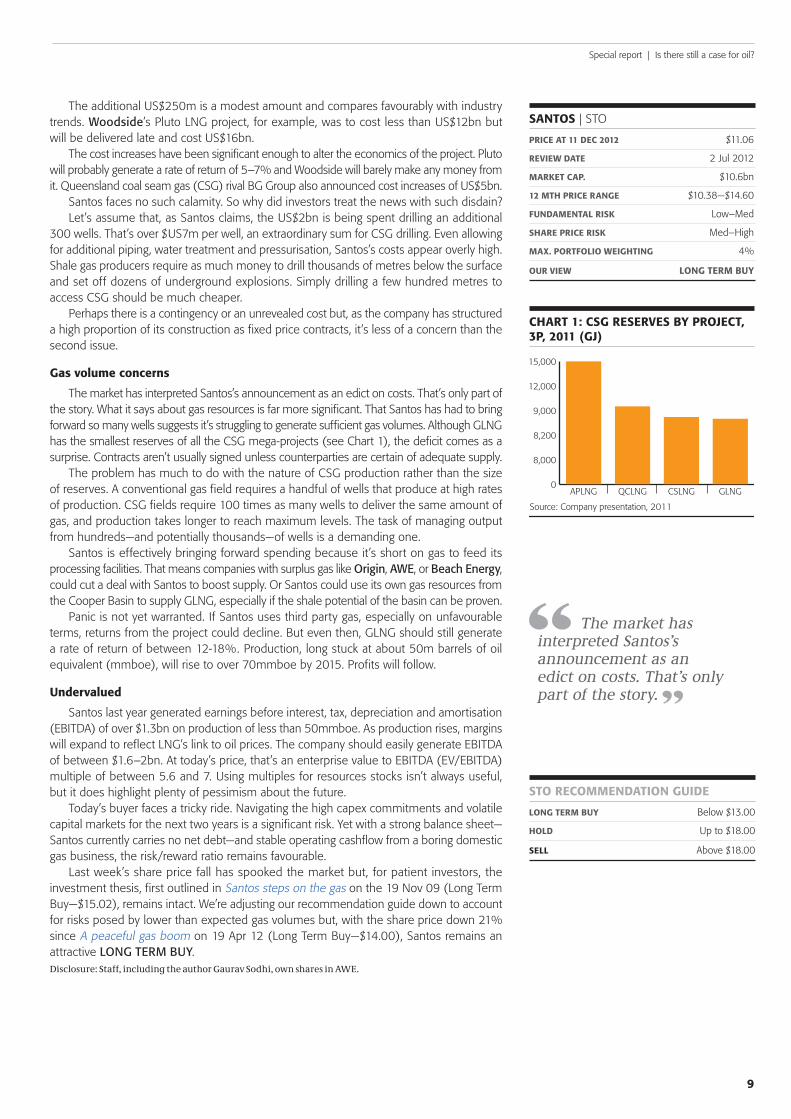
The market has interpreted Santos’s announcement as an edict on costs. That’s only part of the story. What it says about gas resources is far more significant. That Santos has had to bring forward so many wells suggests it’s struggling to generate sufficient gas volumes. Although GLNG has the smallest reserves of all the CSG mega-projects (see Chart 1), the deficit comes as a surprise. Contracts aren’t usually signed unless counterparties are certain of adequate supply.
The problem has much to do with the nature of CSG production rather than the size of reserves. A conventional gas field requires a handful of wells that produce at high rates of production. CSG fields require 100 times as many wells to deliver the same amount of gas, and production takes longer to reach maximum levels. The task of managing output from hundreds—and potentially thousands—of wells is a demanding one.
Santos is effectively bringing forward spending because it’s short on gas to feed its processing facilities. That means companies with surplus gas like Origin, AWe, or Beach energy, could cut a deal with Santos to boost supply. Or Santos could use its own gas resources from the Cooper Basin to supply GLNG, especially if the shale potential of the basin can be proven.
Panic is not yet warranted. If Santos uses third party gas, especially on unfavourable terms, returns from the project could decline. But even then, GLNG should still generate a rate of return of between 12-18%. Production, long stuck at about 50m barrels of oil equivalent (mmboe), will rise to over 70mmboe by 2015. Profits will follow.
undervalued
Santos last year generated earnings before interest, tax, depreciation and amortisation (EBITDA) of over $1.3bn on production of less than 50mmboe. As production rises, margins will expand to reflect LNG’s link to oil prices. The company should easily generate EBITDA of between $1.6–2bn. At today’s price, that’s an enterprise value to EBITDA (EV/EBITDA) multiple of between 5.6 and 7. Using multiples for resources stocks isn’t always useful, but it does highlight plenty of pessimism about the future.
Today’s buyer faces a tricky ride. Navigating the high capex commitments and volatile capital markets for the next two years is a significant risk. Yet with a strong balance sheet—Santos currently carries no net debt—and stable operating cashflow from a boring domestic gas business, the risk/reward ratio remains favourable.
Last week’s share price fall has spooked the market but, for patient investors, the investment thesis, first outlined in Santos steps on the gas on the 19 Nov 09 (Long Term Buy—$15.02), remains intact. We’re adjusting our recommendation guide down to account for risks posed by lower than expected gas volumes but, with the share price down 21% since A peaceful gas boom on 19 Apr 12 (Long Term Buy—$14.00), Santos remains an attractive lONG Term BuY. Disclosure: Staff, including the author Gaurav Sodhi, own shares in AWE.
santOs | STO
prIce at 11 dec 2012 $11.06
revIew date 2 Jul 2012
marKet cap. $10.6bn
12 mth prIce range $10.38—$14.60
fundamental rIsK Low–Med
share prIce rIsK Med–High
max. pOrtfOlIO weIghtIng 4%
Our vIew lOng term Buy
0
8,000
8,200
9,000
12,000
15,000
GLNGCSLNGQCLNGAPLNG
Source: Company presentation, 2011
chart 1: csg reserves By prOject, 3p, 2011 (gj)
The market has interpreted Santos’s announcement as an edict on costs. That’s only part of the story.
stO recOmmendatIOn guIde
lOng term Buy Below $13.00
hOld Up to $18.00
sell Above $18.00

Intelligent Investor
10
Second line resource | First published 4 Aug 2011
AWE’s shale transformation
The revolution that has transformed the American energy market has reached AWe. Shale gas is here, AWe has it and no one has noticed.
There used to be a crisis in American energy. As recently as 2007, North America fretted about waning energy supplies. Oil production had been declining since the 1970s and although gas was an alternative with many qualities, abundance wasn’t one of them. Gas prices approached $15 a gigajoule (gj) in 2007, breaching record highs. Soldiers were sent to protect foreign oil supplies and billions were spent on alternatives like biofuels.
High gas prices, it turned out, offered a solution that soldiers and dollars couldn’t. New technology allowed once dormant supplies of gas trapped within shale formations to be commercialised.
Today, gas prices in the US have fallen to less than $5 a gj and gas from unconventional sources accounts for about half of domestic production. If all of America’s energy needs were assigned to gas alone, current reserves would last a century. A crisis has ended in revolution.
As with America, AWE has found itself embroiled in crisis, struggling to find resources and suffering from a lack of confidence from investors fretting about production. Shale gas, however, is transforming AWE in much the same way as it has changed American energy supply.
a new hope
The decision, in AWE: The sequel begins (Speculative Buy—$2.74), to recommend AWE was straightforward enough. Having built a billion dollar business, the company boasted technical success and a fine exploration record. There was $300m cash in the bank and no debt. And the largest exploration effort in the company’s history was about to get under way in a familiar locale, with promising data.
If buying then was the right decision, it produced the wrong result. Drilling one disappointing duster after another, AWE ended the most exciting time in its history with nothing but an empty wallet. The share price has tumbled and the reputation of this once virtuous explorer has been crushed. Ambition, once exulted, is now seen as hubris, prior skill dismissed as luck, and the scent of opportunity lost.
The share price has fallen a hefty 56% since our original recommendation. And yet we’re still recommending the stock as a Speculative Buy, although for very different reasons.
AWE is no longer the company it was two years ago. Instead of betting on conventional oil and gas, the bulk of its growth will come from shales buried deep beneath the Perth Basin in Western Australia.
gas (dis)charge
A series of innovations were needed before liberating gas from tight shales became possible. The two most important were horizontal drilling and hydraulic fracturing, known as ‘fracking’. Horizontal drilling grants access to vast swathes of buried shales, allowing these rocks to be targeted for hydraulic fracturing, where a mixture of sand, water and chemicals are blasted at rocks at high pressure to force them to crack open. This makes previously tight rock formations permeable—perfect for gas to flow through.
The infrastructure needed to make this process successful is vast and complex. Whereas conventional drilling requires a simple rig that can be attached to the back of a ute, a fleet of perhaps 20 or more trucks supplying water, sand, propellants and explosives are needed to frack.
Price therefore isn’t the only constraint; a sophisticated oil and gas industry able to supply support services is also vital. Little wonder that the US, where both price and infrastructure were favourable, was the birthplace of shale gas extraction. Two additional factors will affect the economics of shale gas extraction. The first is the rate of production, the second the amount of liquids that can be produced alongside gas. Both are vital determinants of economic success.
awe | AWE
prIce at 11 dec 2012 $1.24
revIew date 4 Aug 2011
marKet cap. $647m
12 mth prIce range $1.18—$1.89
fundamental rIsK Med–High
share prIce rIsK Med–HIgh
max. pOrtfOlIO weIghtIng 2%
Our vIew speculatIve Buy
Key pOInts
Shale gas has transformed the American energy market
AWE has changed from the company it was
Unfamiliarity with shale gas has resulted in a possible mispricing
Special report | Is there still a case for oil?
11
Unlike conventional gas wells, shale gas demands low upfront capital, but the rates of output decline are markedly higher. Producers must keep punching holes and fracking to maintain output, making it a more capital intensive business where production rates are determined by gas prices and how much oil and condensate accompanies gas output. If prices are high, so are margins. Similarly, the higher the liquids content, the higher the margins.
how awe stacks up
The most attractive part of AWE’s shale story is not the size of the resources but its location. In Western Australia, gas prices hover around $8 a gj and threaten to go higher. On the east coast of Australia, they’re half that. AWE, should it achieve technical success, will be selling in the most attractive gas market in the country. Unlike so many other shale gas upstarts, the economics aren’t in question.
But two key pieces of information are still missing; the liquids content in AWE’s resource is still unknown but, more importantly, the technical success of fracking in the Perth Basin hasn’t been proven. AWE has run several tests and the results are now being investigated. Early feedback is good but there’s no certainty that large scale production can take place.
Beach energy recently announced successful fracking in the Cooper Basin on Australia’s east coast. Like the Cooper Basin, the Perth Basin is endowed with infrastructure and pricing is far more favourable. The probabilities run in AWE’s favour and the payoff could be huge. A resource of about 4 trillion cubic feet, or about the same size of Woodside’s Pluto field, beckons. Best of all, however, there is zero value imputed in the share price. In fact, AWE’s conventional oil and gas alone is probably worth more than the current market price.
assets still cheap
Production from the Perth Basin, the Tui oilfields and US shales is relatively small but highly lucrative; high gas prices in Western Australia, high quality oil from Tui and cheap, liquid heavy output from the Eagle Ford Shale all contribute to strong cashflow. These projects are valued at $0.50 per share. Along with BassGas, production from these areas should continue to contribute about $200m in operating cashflow each year, for years on end.
The development of the large but low quality Ande Ande Lamut oilfield could substantially lift that sum. AWE has already booked 43m barrels of fresh oil reserves, which we’ve valued at less than cost. Successful development, however, will increase that sum markedly.
In the Perth Basin, AWE’s experiment with shale gas could also be large and lucrative. Test results from fracking have not yet concluded so it’s impossible to judge how valuable the project could be, but high gas prices and nearby pipelines suggest large numbers. We’ve currently assigned no value to this shale potential.
AWE has been a poor speculation since we first recommended it on 24 Dec 09 (see AWE: The sequel begins (Speculative Buy—$2.71)). Exploration dusters, reserve downgrades and depleting production have all contributed to a poor performance. Today’s low share price owes much to past misdeeds, but it also undervalues tomorrow’s potential.
Oil and gas in the ground conservatively valued at around $1.60 per share is available today for $1.24. Significant blue sky is possible for the patient, although risks remain, especially surrounding oil prices and development costs, which is why we’re keeping the portfolio limits to 2%. We’ve also lowered our recommendation guide slightly to account for the cost increase at BassGas. But today’s price is cheap enough to maintain a SPeculATiVe BuY.
Note: The Growth portfolio owns shares in AWE.
Disclosure: The author, Gaurav Sodhi, owns shares in AWE.
In the rush to punish failure, the market has dramatically mispriced AWE.
awe recOmmendatIOn guIde
speculatIve Buy Below $1.60
hOld Up to $2.70
sell Above $2.70
taBle 1: awe’s estImated value, $/share
Bassgas 0.49
perth BasIn 0.14
tuI 0.20
efs 0.16
IndOnesIa 0.43
cash 0.32
cOrpOrate cOsts -0.15
tOtal 1.59
Intelligent Investor
12
High stakes resource | First published 18 May 2012
Tap Oil upgraded
Falling commodity prices have prompted an upgrade, right on the brink of a possible change in its fortunes.
Falling commodity prices and rising fear have seen commodity stocks, from gold and nickel to zinc and energy, mercilessly sold off. In many cases, this is entirely justified. In others, a lower share price offers an opportunity. Tap Oil is one such case.
Tap’s share price has fallen 31% in less than a month, a time during which the company has seen setbacks and progress. The hotly anticipated Tallaganda well returned inconclusive results. As reported on 24 Apr 12 (Hold—$0.78), gas was discovered but well operator BhP Billiton is yet to determine flow rates. Testing will take some months but we don’t anticipate a favourable outcome.
Tap’s asset base has changed dramatically. The company has sold its stake in the declining Harriet Joint Venture, including an attached insurance liability and shutdown costs. The company also offloaded a 10% stake in the Finucane oil discovery. With its primary producing assets now sold, fixed price gas contracts will be the sole generator of cash for the next two years.
ts sold and production all but halted, why buy Tap today? As always, the decision comes down to issues of price and value.
asset valuation
Table 1 tallies up what Tap’s remaining assets might be worth. Gas contracts will generate about $30m a year for another two and a half years. We value these at around 25 cents per share. Tap’s main asset, the Manora oilfield in Thailand, should start to produce in 2014. Having established 6m barrels of proven and probable oil reserves, we value the undeveloped project at about 20 cents per share with the $90m of net cash valued at 32 cents per share.
For valuation purposes, cash should be treated with caution. It’s included in this case because we’ve valued Manora as an undeveloped asset. Over the next two years, cash will be spent developing it, depleting the current cash holding but, assuming all goes well, increasing the value of the oilfield as it starts production.
The Zola gas discovery is valued at 20 cents per share but could be worth far more. Tap and its partners will drill ‘look-a-like’ structures nearby that hold the promise of more gas. Fresh drilling in 2013 will confirm the ultimate size of the gas field, with a decent chance it could double.
If so, development options are likely to involve one of several nearby LNG projects. The cost and timing of such a development will probably mean Tap will sell its Zola stake long before it enters production. A larger Zola could be worth far more than the value ascribed to it in Table 1.
an intelligent speculation
Tap also holds promising tenements in offshore Ghana, where a string of new discoveries have been made. As a drilling partner is still needed, we won’t ascribe any value yet. Corporate costs of 16c per share also need to be deducted from the total valuation.
Totting up those assets and costs results in an estimated value of about 80 cents per share. Today’s price of 64.5 cents, then, makes a compelling case, especially considering the conservative value ascribed to Manora and Zola.
Tap remains a speculative situation. Development needs to progress successfully and some luck with the drill bit wouldn’t hurt either. But at current prices, investors are being well compensated for those risks and the upside remains large. Tap offers exactly the kind of asymmetry that should delight intelligent speculators. Consider the portfolio limit of 2% but Tap Oil is once again a SPeculATiVe BuY.
Note: The Growth portfolio owns shares in Tap Oil.Disclosure: The author, Gaurav Sodhi, owns shares in Tap Oil.
Key pOInts
Price has fallen in market sell-off
Asset base has changed for the better
Upgraded to Speculative Buy
taBle 1: asset valuatIOn Of tap OIlasset est. value ($)
cash 0.32
gas cOntracts 0.25
manOra OIl prOject 0.20
ZOla 0.20
cOrpOrate cOsts –0.16
tOtal ($ per share) 0.81
tap OIl | TAP
prIce at 11 dec 2012 $0.64
revIew date 18 May 2012
marKet cap. $154m
12 mth prIce range $0.56—$0.9
fundamental rIsK Very High
share prIce rIsK Very High
max. pOrtfOlIO weIghtIng 2%
Our vIew speculatIve Buy
tap recOmmendatIOn guIde
speculatIve Buy Below $0.80
hOld Up to $1.50
sell Above $1.50
Special report | Is there still a case for oil?
13
High stakes resource | First published 24 Sep 2012
Antares Energy: Shale we dance?
At today’s low uS gas price, this shale gas business makes money. if gas prices rise, it will make far more. Gaurav Sodhi introduces a new Speculative Buy.
American gas producers once trumpeted technology that allowed gas to be produced from impermeable shale rocks. Now, as a glut of supply forces prices lower, fracking (see Shoptalk) and horizontal drilling are no longer solutions; they have become the problem.
As supply explodes, US gas prices are at generational lows. Gas is so cheap that it is displacing coal as a generation fuel; it has silenced calls for nuclear power, rejuvenated the chemicals business and, some say, may bring manufacturing back to America. Bulls even suggest that, with cheap energy, costs of production in America now approach those of inflation prone China.
The enthusiasm is understandable but probably misplaced. It’s true that gas prices are low but they’re unlikely to stay that way. Gas producers are bleeding cash, continuing to drill only because lease contracts prevent them from doing anything more sensible, like slowing activity. Already, new demand is hungrily devouring available supply and prices are starting to rise.
Thus the argument for US shale stocks, a contrarian play if ever there was one. We’ve had an eye on Antares energy for some time; your analyst picked it as one of his top three stocks for three years and it was introduced briefly in a Friday Fishing article on 27 April 12. Now, we’re making the case to buy it.
location, location
Antares is no stranger to shale gas. In 2004, the company started drilling sections of the Eagle Ford Shale in Texas where, although it found plenty of gas, falling prices resulted in low rates of return. Realising that dry gas—gas free from associated oil, condensate or other liquids—would struggle to earn a return if gas prices stayed low, the company sold the asset to industry giant Chesapeake Energy in 2010.
The asset was poor but Antares did well enough from it. After buying its tenements for US$200 an acre, it sold them for over US$8,000 an acre, collecting US$200m.
Antares bought its next asset with lessons from the Eagle Ford experience in mind. Only projects producing liquids (either oil, condensate or natural gas liquids) would do. The purchase of 30,000 net acres in the Permian Basin, also in Texas, met these strict conditions; it was undeveloped, cheap and liquids rich.
Since 1959, the Permian has produced more than a billion barrels of oil, mostly from conventional reservoirs. Today, it’s the hottest shale basin in North America. Two characteristics make it particularly attractive; shales are stacked thickly and sections are rich in oil.
taBle 1: charactertIcs Of shale BasIns In nOrth amerIca permIan eagle fOrd Barnett nIOBrara BaKKen
thIcKness (ft) 600–1,100 50–350 200–400 250–600 25–125
OIp/sectIOn (mmBBl) 50–100 30–90 70–90 20–40 10–20
Table 1 compares the thickness of shale sequences and the oil in place (OIP) per section of shale between the major shale basins. The Permian is a standout.
Thick shales stacked on top of each other mean vertical rather than horizontal wells can be drilled. That’s a crucial difference. Vertical wells cost just 20% of a typical horizontal well. The high productivity of shales also means more oil can be recovered (5%–10% of the total in place) compared with other basins (which average 3%–5%).
Without a doubt, the Permian is the best place to be hunting for oil and gas from shales. With liquids providing 90% of revenue and 70% of output, Antares is protected from low gas prices but set to profit should they rise. For investors seeking exposure to the bombed out US shale gas price, it’s ideal.
Key pOInts
US gas prices are unsustainably low
Permian Basin holds the most attractive shales in the US
Antares’s asset value will increase with drilling
antares energy | aZZ
prIce at 11 dec 2012 $0.55
revIew date 24 Sep 2012
marKet cap. $141m
12 mth prIce range $0.36—$0.52
fundamental rIsK Very High
share prIce rIsK Very High
max. pOrtfOlIO weIghtIng 2%
Our vIew speculatIve Buy
shOptalK
fracking or, more accurately, hydraulic fracturing is used to improve flow rates from impermeable rocks. A mixture of water, sand and chemicals are blasted into rock at high pressure, causing shale to rupture and creating pathways for previously trapped oil and gas to migrate to the surface.
Intelligent Investor
14
production goes up
Best of all, Antares looks underpriced. A comparison between Permain Basin producers (see Table 2) shows that Antares is, in fact, amongst the cheapest when valued on an acreage basis.
On a reserves basis, it’s also cheap, trading on an enterprise value to proven reserves (EV/1P) of just US$9 a barrel. Including proven and probable reserves, that figure falls to about US$5 a barrel. With reserves highly reliable and likely to rise, Antares looks cheaper than it should be.
taBle 2: antares vs permIan BasIn shale prOducers enterprIse value net 1p ev/1p ev/acre (us$m) acreage (mmBBl) (us$/BBl) (us$)
antares 140 30,000 15 9 4,667
claytOn wIllIams 1,200 200,000 51 24 6,000
apprOach resOurces 1,000 134,500 60 17 7,435
pIOneer 15,000 810,000 987 15 18,519
cOnchO 11,500 375,000 323 36 30,667
lInn energy 13,600 102,000 88 155 133,333
Why might the market be discounting it? To increase the value of its Permian assets, the company must drill continuously to extract oil and gas. It will drill 100 wells over the next three years to lift production from 2,000 barrels of oil equivalent per day (boepd) to over 5,000 boepd. To pay for that drilling, it will take on debt.
macquarie Group has provided an attractively priced debt package (LIBOR+4%) of US$200m, significantly more than the company’s current market capitalisation. By our estimates, debt will peak at US$120m before subsiding. While the company will book profits, continuous drilling means that free cashflow is still several years away, assuming today’s prices.
If oil prices suddenly halved, debt repayments start to become a problem. The presence of debt means that this speculation could go to zero. That means Antares is only for members that accept the case for sustained higher oil prices (see The case for oil).
So why take the risk? Management has an excellent track record, the asset quality is high and, so far, the company has done exactly as it said it would. As production levels increase, the value of the Permian Basin assets will rise. This is a play on asset values more than cashflow.
Table 3 models our best guess scenario for how the company might look over the next three years. We’ve assumed oil prices of $90 a barrel, gas prices of US$3.50gj and natural gas liquids prices of US$45 a barrel. As drilling increases, production rates will steadily climb.
Each well drilled will cost about US$2m and, on average, pay back costs within a year. Although production levels fall away after the first 12 months, wells will continue to produce gas for years and Antares should make generous returns on each well it drills.
The plan to drill 100 wells is fully funded and production rates to date are exceeding expectations. The probability of Antares meeting its production goals is higher than the market’s valuation for the business suggests.
US gas prices don’t need to rise for Antares to be a success but if they do, it will be the icing on an oily cake. The investment case is built on the asset value of Antares’s ground increasing with production rates. It is a tale of higher asset prices rather than one of higher commodity prices.
This is a risky situation but we’re betting the market hasn’t priced the probability of success correctly. For 2% of a risk tolerant portfolio, we’re recommending Antares Energy as a SPeculATiVe BuY.
Disclosure: The author, Gaurav Sodhi, owns shares in Antares Energy.
aZZ recOmmendatIOn guIde
speculatIve Buy Below $0.50
hOld Up to $0.85
sell Above $0.85
taBle 3: antares energy’s estImated cashflOw, 2012–2015casflOw, us$m 2012 2013 2014 2015
OIl revenue 39.4 52.6 68.9 85.4
gas revenue 3.8 6.4 8.9 12.8
ngl revenue 7.1 11.9 16.7 23.8
tOtal revenue 50.4 70.9 94.6 122.0
rOyalty (25%) –12.6 –17.7 –23.6 –30.5
OperatIng cOst –0.9 –1.6 –2.3 –2.9
tax, state (7.5%) –2.8 –3.9 –5.1 –6.6
cOrpOrate cOsts –3.0 –3.0 –3.0 –3.0
OperatIng cashflOw 31.1 44.7 60.5 78.9
Interest –2.9 –4.3 –5.3 –7.2
tax (30%) –8.5 –12.1 –16.6 –21.5
npat 19.8 28.3 38.6 50.2
eps (c) 0.08 0.11 0.15 0.19
capex –60.0 –48.0 –48.0 –40.0
free cashflOw –40.2 –19.7 –9.4 10.2
US gas prices don’t need to rise for Antares to be a success but if they do, it will be the icing on an oily cake.

Special report | Is there still a case for oil?
15
ImpOrtant InfOrmatIOn
intelligent investor Share AdvisorPO Box Q744Queen Vic. Bldg NSW 1230T 1800 620 414 F (02) 9387 [email protected] www.intelligentinvestor.com.au
PerFOrmANce Past performance isn’t a reliable indicator of future results. Our performance figures are hypothetical and come from the recommendations made by The Intelligent Investor. Transaction costs haven’t been included. We encourage you to think of investing as a long-term pursuit, as stocks can fall and you can lose money on the stockmarket. To read our performance report, go to www.intelligentinvestor.com.au.WArNiNG This publication is general information only, which means it does not take into account your investment objectives, financial situation or needs. You should therefore consider whether a particular recommendation is appropriate for your needs before acting on it, seeking advice from a financial adviser or stockbroker if necessary. Not all investments are appropriate for all people.diSclAimer This publication has been prepared from a wide variety of sources, which The Intelligent Investor Publishing Pty Ltd, to the best of its knowledge and belief, considers accurate. You should make your own enquiries about the investments and we strongly suggest you seek advice before acting upon any recommendation.cOPYriGhT© The Intelligent Investor Publishing Pty Ltd 2012. Intelligent Investor and associated websites and publications are published by The Intelligent Investor Publishing Pty Ltd ABN 12 108 915 233 (AFSL No. 282288). PO Box Q744 Queen Victoria Building NSW 1230. Ph: (02) 8305 6000, Fax: (02) 9387 8674.diSclOSure As at 12 December 2012, in-house staff of Intelligent Investor held the following listed securities or managed investment schemes: AIQ, ARP, ASX, AWC, AWE, AZZ, BAO, BBG, BER, BRG, CBA, CIF, CPU, CRC, CSL, EBT, EGG, FKP, IFM, IGR, KRM, MAU, MCE, MFG, MQG, NWS, PAG, PTM, QBE, RCU, RMD, RNY, SEK, SKI, SRV, STW, SYD, TAP, TAU, TGP, UXC, VMS, VRL, WDC, WES, WHG and WRT. This is not a recommendation.dATe OF PuBlicATiON 12 December 2012