Embed Size (px)
Citation preview

Research ArticleIs Neutrophil-to-Lymphocyte Ratio a Predictor ofCoronary Artery Disease in Western Indians?
Kamal Sharma,1 Alap K. Patel,1 Komal H. Shah,2 and Ashwati Konat2
1Department of Cardiology, U. N. Mehta Institute of Cardiology and Research Centre, Ahmedabad, Gujarat, India2Department of Research, U. N. Mehta Institute of Cardiology and Research Centre, Ahmedabad, Gujarat, India
Correspondence should be addressed to Kamal Sharma; [email protected]
Received 28 January 2017; Revised 20 May 2017; Accepted 22 June 2017; Published 24 July 2017
Academic Editor: Marla R. Wolfson
Copyright © 2017 Kamal Sharma et al. This is an open access article distributed under the Creative Commons Attribution License,which permits unrestricted use, distribution, and reproduction in any medium, provided the original work is properly cited.
Introduction. The current study was designed to evaluate the association of neutrophil-to-lymphocyte ratio (NLR) with coronaryartery disease (CAD) presence. We also aimed to propose a suitable cut-off of NLR for diagnosis of CAD in Western Indians.Methods. Total 324 patients undergoing coronary angiography were enrolled and were subdivided into two groups: group 1 (𝑛 = 99;population without CAD) and group 2 (𝑛 = 225; population with CAD). Results. The results indicated significant (𝑝 < 0.05)positive association between elevated levels of WBC, neutrophil, monocyte, NLR, hs-CRP, CPK-MB, and troponin I and diseasepresence. According to subgroup analysis, the association wasmore profound inmale and older population. Among all themarkersNLR showed the strongest predictive potential for CAD with highest odds ratio (1.495; 95% CI: 0.942–2.371; 𝑝 < 0.048). Optimumcut-off of NLR for diagnosis of CAD was 2.13 (AUC-0.823; 𝑝 < 0.001; sensitivity: 83.64%; specificity: 63.46%). Association of NLRwith other biochemical markers such as hs-CRP, CPK-MB, and troponin I was also observed in quartile analysis. Conclusion. NLRis a simple indicator that could be effectively used for the diagnosis of CAD with a cut-off of 2.13 in Western Indian population.
1. Introduction
The relationship between various inflammatory markers andcoronary artery disease (CAD) has been established longago [1]. Among them, white blood cell (WBC) subtypeshave immerged as a community of inflammatory markersplaying a crucial role in the pathogenesis of atherogenesisand atherothrombosis [2]. Neutrophil-to-lymphocyte ratio(NLR)—a new addition to the long list of markers—isan inexpensive, easy to obtain, widely available marker ofinflammation, which can aid in the risk stratification ofpatients with various cardiovascular diseases in addition tothe traditionally used markers. Ample research databasesfrom Indian subcontinents have supported a potential ofNLR as a prognostic and diagnostic index of coronary arterydisease (CAD) and disease associated mortality [3–5]. Anelevated NLR, irrespective of other biomarker levels, inde-pendently indicates an increased long term risk of mortalitynot only in patients with stable CAD but also in acutecoronary syndrome (ACS) patients [6, 7].
These studies substantiate the negative impact of elevatedNLR, and hence effort had been made to propose a suitablecut-off of it with effective clinical usage in various patientpopulation. However the reference values for NLR vary withage and ethnicity. Misumida et al. in 2015 had also demon-strated an independent association between race and NLR inpatientswithNSTEMI, suggesting that a tailored cut-off valueaccording to race would provide more precise prognosticinformation. These variations need to be considered whileusing NLR for predictive and prognostic purposes and beforeproposing a diagnostic cut-off in particular race. While somestudies categorized their patients according to NLR intervals(e.g., tertiles, quartiles, and quintiles) [8–10], other studiesused definite NLR cut-off points (e.g., NLR ≥ 2.5, NLR ≥ 2.7,NLR ≥ 3, NLR ≥ 4), and others used NLR ≥ 5 [11–16]. In fact,studies report different timing for the collection of blood usedto calculateNLR; some collect the blood sample on admission[7], and others use preoperative NLR [17], maximum NLRduring hospitalization [18], or average NLR of three readingsduring hospitalization [19].
HindawiInternational Journal of InflammationVolume 2017, Article ID 4136126, 8 pageshttps://doi.org/10.1155/2017/4136126

2 International Journal of Inflammation
Herewith we aim to investigate the association of NLRwith CAD and establish it as a useful diagnostic and prognos-tic tool for CAD inWestern Indians. We also seek to proposea suitable cut-off of NLR with effective clinical usage in thispopulation.
2. Materials and Method
2.1. Study Population. This prospective study was conductedat U. N. Mehta Institute of Cardiology and Research Centreandwas approved by institutional ethics committee. Total 324individuals of both genders were enrolled from March 2014to January 2016. The patients admitted for coronary angiog-raphy (CAG), hospitalized with first-time chest pain, havingmyocardial infarction, and with ECG showing changes andpatients admitted in emergency were included in this study.Exclusion criteria of the study were as follows: patients takingany lipid lowering drug (statin), recent major surgery, andrheumatic heart disease. All patients were evaluated by takingdetailed history and physical examination. The variablesincluded in the study were age, sex, hypertension (HTN),diabetes mellitus (DM), smoking, cardiac biomarkers (tro-ponin I, CK-MB), hs-CRP andwhite blood cell (WBC) count,differential count, mean platelet volume (MPV), red celldistribution width (RDW), and erythrocyte sedimentationrate (ESR). Hypertensionwas defined as the active use of anti-hypertensive drugs or documentation of blood pressuremorethan 140/90mmHg, and diabetes mellitus was defined asfasting plasma glucose (FPG) levels over 126mg/dl or randomplasma glucose level over 200mg/dl or active use of antidi-abetic treatment. Smoking was defined as current smokingstatus of an individual. Complete blood count and biochem-ical values were evaluated from blood samples obtained byantecubital vein puncture. The study population was dividedinto two groups based on angiographic findings: group 1 (𝑛 =99; population without CAD – no/nonsignificant CAD) andgroup 2 (𝑛 = 225; population with CAD - stenosis >70%).
2.2. Biochemical Estimations. Blood samples for laboratoryassessment were collected upon first point of patient contactto refrain from bias. Total leucocyte count and its subtypesincluding neutrophil and lymphocyte platelet count andMPV and RDW were analysed using an automated bloodcell counter, CELLDYN Ruby (Abott). Troponin I, CPK-MB, and hs-CRP were analysed using counter ARCHITECTPLUS (ci 4100) (Abott). Erythrocytes sedimentation rate wasassessed using E-VACC disposable ESR pipettes (matrix) at1 hr. Troponin I, CPK-MB, hs-CRP, CBC, and ESR wereassessed from the same sample.
2.3. Statistical Analysis. All statistical studies were carried outusing SPSS program version 20. Neutrophil-to-lymphocyteratio (NLR), WBC-to-platelet ratio (WBCPR), and platelet-to-lymphocyte ratio (PLR) were automatically calculatedby loading all the data to the statistical program used.Quantitative variables were expressed as the mean ± stan-dard deviation and qualitative variables were expressed aspercentage (%). Univariate statistics between two groups
were calculated using the 𝑡-test or Mann–Whitney 𝑈 testwhichever is applicable. Categorical variables were comparedusing the chi-square test. A correlation between the variableswas determined by using Pearson’s correlation test. Strengthof an association of the markers with disease presencewas assessed using logistic regression for the parametersshowing association with disease presence on univariateanalysis (𝑝 < 0.05). Receiver operating characteristics (ROC)curves were constructed and the most discriminating cut-offvalues were determined to assess the predictive value of theNLR. Distribution of NLR values in the quartile ranges ofestablished cardiac biomarkers were also calculated. A levelof significance was accepted as a two-tailed 𝑝 value < 0.05.
3. Results
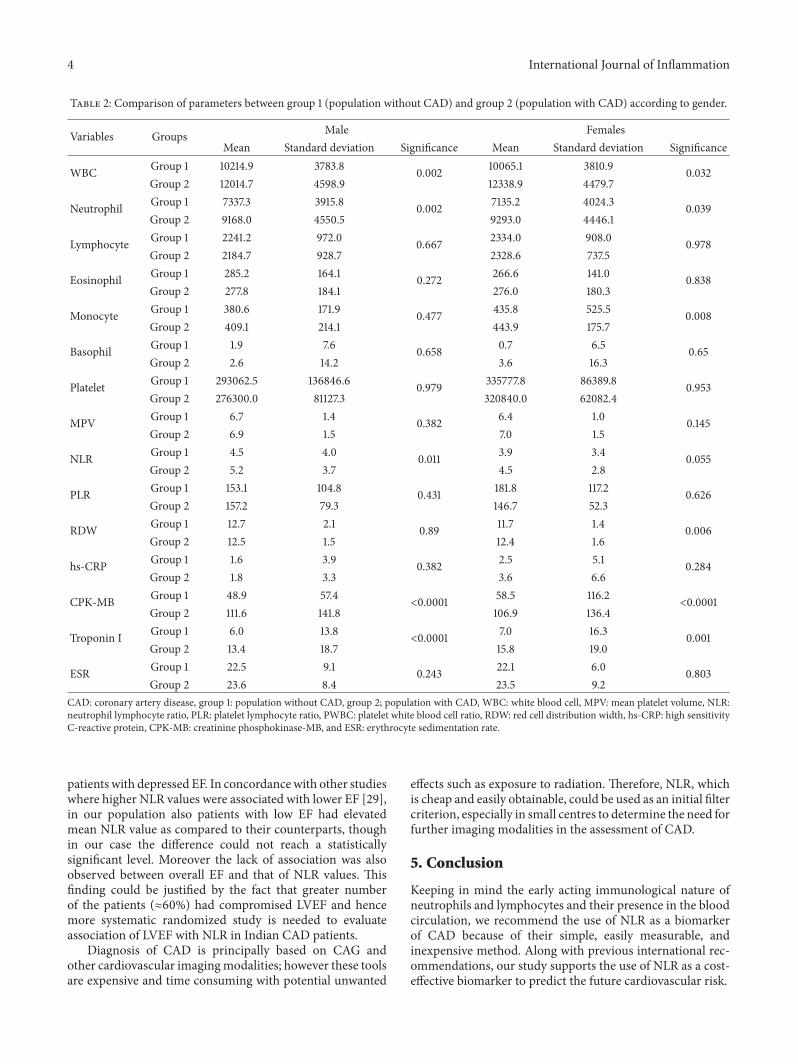
The comparative baseline details of all the biochemicalparameters between the two groups are presented in Table 1.Elevated levels of WBC count and neutrophil and monocytecountwere observed in group 2 patients as compared to group1 population. Significantly (𝑝 < 0.05) low level of NLR wasfound in group 1 (4.3 ± 3.8) in contrast to group 2 (5.6 ± 4.5).Patients with significant CAD had higher RDW (12.9 ± 1.6)as compared to patients without CAD (12.4 ± 2). Raised hs-CRP (3.3±4.3 versus 1.8±4.2), CPK-MB (116.4±152.5 versus51.4±76.7), and troponin I (14±18.8 versus 6.3±14.4) levelswere also found in group 2 patients as compared to group1 subjects. The relationship between CAD and biochemicalmarkers according to age and gender are presented in Tables2 and 3. NLR showed a significant association with CADin male and comparatively older (>40 years) population.Nonsignificantly (𝑝 = 0.333) highmeanNLR value was foundin patients with ejection fraction (EF) of <50% (5.55 ± 5.04)as compared to patients with EF of≥50% (4.75± 3.19) in CADpositive group.
Figure 1 shows correlation analysis of various mark-ers with disease presence. Strong positive correlation wasobserved between increasing values of WBC, neutrophil,monocyte, NLR, and troponin I and CAD occurrence. Thestrength of association of themarkers with CADwas assessedusing regression analysis and is presented in Table 4. Amongall the studied variables NLR was found to be the strongestpredictor of CAD showing an odds ratio of 1.495 (95%CI: 0.942–2.371; 𝑝 = 0.048). Following this the diagnosticpotency of the significantly associated markers were inves-tigated using ROC analysis (Table 5). As indicated NLRexhibited highest area under curve (AUC-0.823; 𝑝 = 0.0001;95% CI; 0.712–0.931), closely followed by neutrophil count(AUC-0.821; 𝑝 = 0.0001; 95% CI; 0.714–0.932) and troponinI (AUC-0.820; 𝑝 = 0.0001; 95% CI; 0.716–0.935). Based onROC a suitable cut-off of NLR was found to be 2.13 showingsensitivity and specificity of 83.64% and 63.46%, respectively(Table 6). According to quartile analysis, as indicated inTable 7 with increasing quartile of ACS markers there is anincrease in NLR mean value. The association between NLRand left ventricle ejection fraction (LVEF) was assessed usingPearson’s correlation analysis in CAD patients and resultsshowed that there is no significant correlation between bothparameters (coefficient of correlation: −0.086; 𝑝 = 0.234).

International Journal of Inflammation 3
Table 1: Comparison of parameters between group 1 (populationwithout CAD) and group 2 (population with CAD).
Variables Groups Mean Standarddeviation Significance
WBC Group 1 10175.6 3772.0 0.034Group 2 12045.8 4596.6
Neutrophil Group 1 7284.2 3924.9 0.041Group 2 9184.2 4532.9
Lymphocyte Group 1 2265.6 951.9 0.507Group 2 2191.0 922.6
Eosinophil Group 1 257.4 169.3 0.391Group 2 254.8 190.2
Monocyte Group 1 370.1 304.5 0.0001Group 2 476.9 209.1
Basophil Group 1 0.7 6.5 0.404Group 2 1.3 13.9
Platelet Group 1 308440.0 120954.6 0.818Group 2 318787.4 159314.1
MPV Group 1 6.6 1.3 0.150Group 2 6.9 1.5
NLR Group 1 4.3 3.8 0.001Group 2 5.6 4.5
PLR Group 1 163.4 107.9 0.751Group 2 190.8 266.4
RDW Group 1 12.4 2.0 0.002Group 2 12.9 1.6
hs-CRP Group 1 1.8 4.2<0.0001
Group 2 3.3 4.3
CPK-MB Group 1 51.4 76.7<0.0001
Group 2 116.4 152.5
Troponin I Group 1 6.3 14.4<0.0001
Group 2 14.0 18.8
ESR Group 1 22.4 8.3 0.227Group 2 23.6 8.5
CAD: coronary artery disease, Group 1: population without CAD, group2; population with CAD, WBC: white blood cell, MPV: mean plateletvolume, NLR: neutrophil-to-lymphocyte ratio, PLR: platelet-to-lymphocyteratio, PWBC: platelet white blood cell ratio, RDW: red cell distributionwidth, hs-CRP: high sensitivity C-reactive protein, CPK-MB: creatininephosphokinase-MB, and ESR: erythrocyte sedimentation rate.
4. Discussion
To our knowledge, this study is the first to propose clini-cally most relevant cut-off of NLR with considerably highsensitivity and specificity of CAD in Western Indians. Weherewith demonstrate that patients with abnormal CAG hadsignificantly higher NLR compared to patients with normalCAG.
The NLR test, which can be derived from the WBCcount, is a common, cheap, and reproducible test world-wide. Previous studies have shown that NLR is associ-ated with poor clinical outcomes in various cardiovasculardiseases [8, 20–22]. Through entire spectrum of CAD andits associated diseases, the role of NLR has been extensivelystudied in order to provide a cheap and easily accessiblefor screening of population at risk. Following global trend,from India too various studies have proposed NLR cut-offfor diagnosis of CAD. Fernando et al. (2015) had studied therelation of NLR with CAD in diabetic population and found≥ 2.26 as the best suitable cut-off to identify the presence ofCAD in diabetic patients [4]. Among immune-inflammatorymarkers in non-ST-elevation acute coronary syndrome andstable angina patients also, neutrophil counts and NLR weresignificantly correlated with noncalcified plaques, suggestingthe potency of these easily measured biomarkers in reflectingthe burden of vulnerable plaques in CAD. Numerous imag-ing modalities such as invasive coronary angiography andcalcium scoring by multidetector CT have also confirmedthe role of NLR in the presence, severity, and progressionof coronary atherosclerosis [23, 24]. Parallel to us Sari etal. (2015) have also reported that from all other systemicinflammatory markers only NLR is the predictor of CADshowing a strong odds ratio (1.576, confidence interval:1.198–2.072, 𝑝 = 0.001) [25]. Even in geriatric population too,the patients with CAD had higher NLR, where the cut-offof 1.96 was reported with 66.5% of sensitivity and 48.8%of specificity (AUC = 0.575) [26]. In addition, higher NLRhas also been associated with increased cardiac mortalityin clinically stable patients with CAD compared with totalWBCs count [27]. In patients with chronic coronary totalocclusion (CTO), the NLRwas significantly higher showing apositive correlation with SYNTAX score. The cut-off identifyfor CTO disease by NLR was 2.09 with a sensitivity andspecificity of 61% and 69.3%, respectively. Similarly in thisstudy NLR was found to be the strongest predictor of CADwith highest odds ratio; however we are able to achievegreater degree of sensitivity and specificity as compared toprevious reported studies. The improvement in sensitivitycould be obtained by lowering the cut-off; however in thatcase we were compromising on specificity and hence thecurrent cut-off of 2.13 was found to be most suitable forWestern Indians.
The main role of neutrophilia in CAD may be explainedby secretion of various inflammatory mediators such as elas-tase, myeloperoxidase, and oxygen free radicals which causestissue damage. The probable cause of lymphopenia includedecreased production as a result of increased steroid leveldue to CAD induced stress and increased apoptosis triggeredby increased inflammation thereby resulting in elevated NLRin CAD (+) group [2, 28]. Increased number of neutrophilsand decreased lymphocytes are risk indicators for futurecardiovascular events.Therefore, elevated NLR integrates thepredictive risk of the two leukocyte subtypes into a single riskfactor. As the biomarkers used in this study predicted cardiacmyocyte damage, the possibility of their association withLVEF was also evaluated in order to differentiate betweenheart failure patients with preserved EF and heart failure
4 International Journal of Inflammation
Table 2: Comparison of parameters between group 1 (population without CAD) and group 2 (population with CAD) according to gender.
Variables Groups Male FemalesMean Standard deviation Significance Mean Standard deviation Significance
WBC Group 1 10214.9 3783.8 0.002 10065.1 3810.9 0.032Group 2 12014.7 4598.9 12338.9 4479.7
Neutrophil Group 1 7337.3 3915.8 0.002 7135.2 4024.3 0.039Group 2 9168.0 4550.5 9293.0 4446.1
Lymphocyte Group 1 2241.2 972.0 0.667 2334.0 908.0 0.978Group 2 2184.7 928.7 2328.6 737.5
Eosinophil Group 1 285.2 164.1 0.272 266.6 141.0 0.838Group 2 277.8 184.1 276.0 180.3
Monocyte Group 1 380.6 171.9 0.477 435.8 525.5 0.008Group 2 409.1 214.1 443.9 175.7
Basophil Group 1 1.9 7.6 0.658 0.7 6.5 0.65Group 2 2.6 14.2 3.6 16.3
Platelet Group 1 293062.5 136846.6 0.979 335777.8 86389.8 0.953Group 2 276300.0 81127.3 320840.0 62082.4
MPV Group 1 6.7 1.4 0.382 6.4 1.0 0.145Group 2 6.9 1.5 7.0 1.5
NLR Group 1 4.5 4.0 0.011 3.9 3.4 0.055Group 2 5.2 3.7 4.5 2.8
PLR Group 1 153.1 104.8 0.431 181.8 117.2 0.626Group 2 157.2 79.3 146.7 52.3
RDW Group 1 12.7 2.1 0.89 11.7 1.4 0.006Group 2 12.5 1.5 12.4 1.6
hs-CRP Group 1 1.6 3.9 0.382 2.5 5.1 0.284Group 2 1.8 3.3 3.6 6.6
CPK-MB Group 1 48.9 57.4<0.0001 58.5 116.2
<0.0001Group 2 111.6 141.8 106.9 136.4
Troponin I Group 1 6.0 13.8<0.0001 7.0 16.3 0.001
Group 2 13.4 18.7 15.8 19.0
ESR Group 1 22.5 9.1 0.243 22.1 6.0 0.803Group 2 23.6 8.4 23.5 9.2
CAD: coronary artery disease, group 1: population without CAD, group 2; population with CAD, WBC: white blood cell, MPV: mean platelet volume, NLR:neutrophil lymphocyte ratio, PLR: platelet lymphocyte ratio, PWBC: platelet white blood cell ratio, RDW: red cell distribution width, hs-CRP: high sensitivityC-reactive protein, CPK-MB: creatinine phosphokinase-MB, and ESR: erythrocyte sedimentation rate.
patients with depressed EF. In concordancewith other studieswhere higher NLR values were associated with lower EF [29],in our population also patients with low EF had elevatedmean NLR value as compared to their counterparts, thoughin our case the difference could not reach a statisticallysignificant level. Moreover the lack of association was alsoobserved between overall EF and that of NLR values. Thisfinding could be justified by the fact that greater numberof the patients (≈60%) had compromised LVEF and hencemore systematic randomized study is needed to evaluateassociation of LVEF with NLR in Indian CAD patients.
Diagnosis of CAD is principally based on CAG andother cardiovascular imagingmodalities; however these toolsare expensive and time consuming with potential unwanted
effects such as exposure to radiation. Therefore, NLR, whichis cheap and easily obtainable, could be used as an initial filtercriterion, especially in small centres to determine the need forfurther imaging modalities in the assessment of CAD.
5. Conclusion
Keeping in mind the early acting immunological nature ofneutrophils and lymphocytes and their presence in the bloodcirculation, we recommend the use of NLR as a biomarkerof CAD because of their simple, easily measurable, andinexpensive method. Along with previous international rec-ommendations, our study supports the use of NLR as a cost-effective biomarker to predict the future cardiovascular risk.

International Journal of Inflammation 5
Table 3: Comparison of parameters between group 1 (population without CAD) and group 2 (population with CAD) according to age.
Variables Groups ≤40 years >40 yearsMean Standard deviation Significance Mean Standard deviation Significance
WBC Group 1 8795.7 2103.3 0.17 10280.6 3856.5<0.0001
Group 2 10804.9 3617.9 12267.8 4665.6
Neutrophil Group 1 5921.5 2256.7 0.168 7387.9 4012.5<0.0001
Group 2 7896.2 3511.4 9381.9 4623.7
Lymphocyte Group 1 2378.6 1018.8 0.889 2257.0 952.0 0.619Group 2 2316.5 1055.6 2200.6 868.1
Eosinophil Group 1 202.8 84.8 0.282 286.5 160.7 0.195Group 2 304.6 239.0 273.8 174.6
Monocyte Group 1 292.8 62.8 0.454 402.9 314.3 0.058Group 2 343.1 171.3 427.2 209.5
Basophil Group 1 0 0 1.2 12.7 0.653Group 2 9.8 37.6 3.9 56.9
Platelet Group 1 358000.0 141421.4 0.532 304130.4 121689.0 0.972Group 2 314909.1 79353.0 286001.4 77884.5
MPV Group 1 5.9 0.8 0.045 6.7 1.3 0.256Group 2 6.9 1.7 6.9 1.5
NLR Group 1 3.3 2.5 0.375 4.4 3.9 0.002Group 2 4.3 3.5 5.1 3.5
PLR Group 1 141.4 54.5 0.468 165.3 111.9 0.601Group 2 133.9 41.5 157.1 75.3
RDW Group 1 12.6 1.6 0.804 12.4 2.0 0.129Group 2 12.7 1.4 12.5 1.5
hs-CRP Group 1 0.3 0.5 0.011 2.0 4.4 0.382Group 2 2.2 4.2 2.2 4.3
CPK-MB Group 1 33.4 17.3 0.194 52.8 79.3<0.0001
Group 2 102.1 154.1 111.8 138.6
Troponin I Group 1 3.4 8.3 0.032 6.5 14.8<0.0001
Group 2 14.7 20.6 13.8 18.6
ESR Group 1 18.1 6.2 0.404 22.7 8.4 0.206Group 2 19.6 7.2 24.1 8.6
CAD: coronary artery disease, group 1: population without CAD, group 2; population with CAD, WBC: white blood cell, MPV: mean platelet volume, NLR:neutrophil-to-lymphocyte ratio, PLR: platelet-to-lymphocyte ratio, PWBC: platelet white blood cell ratio, RDW: red cell distribution width, hs-CRP: highsensitivity C-reactive protein, CPK-MB: creatinine phosphokinase-MB, and ESR: erythrocyte sedimentation rate.
Table 4: Multivariate logistic regression analysis for coronary artery disease presence by various biochemical markers.
Variables exp(𝐵) Significance 95% CI for exp(𝐵)Lower Upper
WBC 1.000 0.030 1.000 1.000Neutrophil 1.044 0.436 0.936 1.165Monocyte 1.101 0.133 0.971 1.249NLR 1.495 0.048 0.942 2.371RDW 1.116 0.186 0.948 1.314hs-CRP 1.031 0.399 0.960 1.109CPK-MB 0.993 0.034 0.986 0.999Troponin I 0.994 0.669 0.966 1.022Constant 0.001 0.219exp(𝐵): exponentiation of the coefficients/odds ratios of the predictors, CI: confidence interval, WBC: white blood cell, NLR: neutrophil-to-lymphocyte ratio,RDW: red cell distribution width, hs-CRP: high sensitivity C-reactive protein, CPK-MB: creatinine phosphokinase-MB, and ESR: erythrocyte sedimentationrate.

6 International Journal of Inflammation
Table 5: Receiver operative curve analysis of biochemical markers for CAD diagnosis.
Test result variable(s) Area Std. Errora Asymptotic Sig.b Asymptotic Sig.b
Lower bound Upper boundWBC 0.809 0.062 0.000 0.687 0.931Neutrophil 0.821 0.056 0.000 0.714 0.932Monocyte 0.697 0.064 0.022 0.572 0.823NLR 0.823 0.056 0.000 0.712 0.931RDW 0.713 0.064 0.014 0.587 0.839hs-CRP 0.648 0.072 0.086 0.506 0.790Troponin I 0.820 0.035 0.000 0.816 0.951CAD: coronary artery disease, WBC: white blood cell, NLR: neutrophil-to-lymphocyte ratio, RDW: red cell distribution width, hs-CRP: high sensitivity C-reactive protein, CPK-MB: creatinine phosphokinase-MB, and ESR: erythrocyte sedimentation rate. aUnder the nonparametric assumption. bNull hypothesis:true area = 0.5.
Table 6: Receiver operative curve analysis of NLR cut-off (2.13) for CAD diagnosis.
Statistic Value 95% CISensitivity 83.64% 78.67% to 87.86%Specificity 63.46% 55.39% to 71.02%Positive predictive value 79.79% 76.13% to 83.01%Negative predictive value 69.23% 62.61% to 75.14%CI: confidence interval.
Table 7: Association of acute coronary syndrome biomarkers with NLR.
Quartiles hs-CRP Mean NLR inhs-CRP quartile CPK-MB
Mean NLR inCPK-MBquartile
Troponin IMean NLR introponin Iquartile
1st quartile 0.175 3.58 24 2.9 0.007 2.622nd quartile 0.45 4.88 40 4.07 0.974 4.313rd quartile 2.1 6.06 115 5.8 19.75 6.87NLR, neutrophil-to-lymphocyte ratio; hs-CRP, high sensitivity C-reactive protein; CPK-MB, creatine phosphokinase-MB.
Variables
WBC0
0.05
0.1
0.15
0.2
0.25
0.3
0.35
0.4
Cor
relat
ion
coe�
cien
t
0.254Neutrophil
0.268Monocyte
0.118NLR0.224
RDW0.114
hs-CRP0.122
Troponin I0.3888
∗∗
∗∗
∗∗
∗∗
∗∗
∗∗
Series 1
Figure 1: Correlation of biochemical markers with disease presence. ∗∗Correlation is significant at the 0.01 level (2-tailed). ∗Correlation issignificant at the 0.05 level (2-tailed). WBC: white blood cell, NLR: neutrophil-to-lymphocyte ratio, RDW: red cell distribution width, andhs-CRP: high sensitivity C-reactive protein.

International Journal of Inflammation 7
Conflicts of Interest
The authors declared no potential conflicts of interest withrespect to the research, authorship, and/or publication of thisarticle.
References
[1] A. H. Ates, U. Canpolat, H. Yorgun et al., “Total white bloodcell count is associated with the presence, severity and extentof coronary atherosclerosis detected by dual-source multi-slice computed tomographic coronary angiography,”CardiologyJournal, vol. 18, no. 4, pp. 371–377, 2011.
[2] B. D. Horne, J. L. Anderson, J. M. John et al., “Which whiteblood cell subtypes predict increased cardiovascular risk?”Journal of the American College of Cardiology, vol. 45, no. 10,pp. 1638–1643, 2005.
[3] R. S. Allichandi and S. M. Khilari, “Association betweenneutrophil to lymphocyte ratio with presence and severity ofcoronary artery disease,” IOSR Journal of Dental and MedicalSciences, vol. 15, no. 6, pp. 11–13, 2016.
[4] M. L. Fernando, S. Silambanan, and J. Malar, “Neutrophil tolymphocyte ratio as an indicator of presence of coronary arterydisease in diabetic patients,” International Journal of ClinicalBiochemistry and Research, vol. 2, no. 3, pp. 143–147, 2015.
[5] J. H. Prajapati, S. Sahoo, T. Nikam, K. H. Shah, B.Maheriya, andM.Parmar, “Association of high density lipoproteinwith plateletto lymphocyte and neutrophil to lymphocyte ratios in coronaryartery disease patients,” Journal of Lipids, vol. 2014, Article ID686791, 8 pages, 2014.
[6] A. Papa, M. Emdin, C. Passino, C. Michelassi, D. Battaglia, andF. Cocci, “Predictive value of elevated neutrophil-lymphocyteratio on cardiacmortality in patients with stable coronary arterydisease,” Clinica Chimica Acta, vol. 395, no. 1-2, pp. 27–31, 2008.
[7] J. Nunez, E. Nunez, V. Bodı et al., “Usefulness of the neutrophilto lymphocyte ratio in predicting long-term mortality in stsegment elevation myocardial infarction,” American Journal ofCardiology, vol. 101, no. 6, pp. 747–752, 2008.
[8] S. Uthamalingam, E. A. Patvardhan, S. Subramanian et al.,“Utility of the neutrophil to lymphocyte ratio in predictinglong-term outcomes in acute decompensated heart failure,”TheAmerican Journal of Cardiology, vol. 107, no. 3, pp. 433–438, 2011.
[9] B. Azab, V. R. Bhatt, J. Phookan et al., “Usefulness of theneutrophil-to-lymphocyte ratio in predicting short- and long-term mortality in breast cancer patients,” Annals of SurgicalOncology, vol. 19, no. 1, pp. 217–224, 2012.
[10] T. Yamanaka, S. Matsumoto, S. Teramukai, R. Ishiwata, Y.Nagai, and M. Fukushima, “The baseline ratio of neutrophils tolymphocytes is associated with patient prognosis in advancedgastric cancer,” Oncology, vol. 73, no. 3-4, pp. 215–220, 2008.
[11] Y. Ohno, J. Nakashima,M. Ohori, T. Hatano, andM. Tachibana,“Pretreatment neutrophil-to-lymphocyte ratio as an indepen-dent predictor of recurrence in patients with nonmetastaticrenal cell carcinoma,” Journal of Urology, vol. 184, no. 3, pp. 873–878, 2010.
[12] I. Bhatti, O. Peacock, G. Lloyd, M. Larvin, and R. I. Hall,“Preoperative hematologic markers as independent predictorsof prognosis in resected pancreatic ductal adenocarcinoma:neutrophil-lymphocyte versus platelet-lymphocyte ratio,” TheAmerican Journal of Surgery, vol. 200, no. 2, pp. 197–203, 2010.
[13] P. Ding, X. An, R. Zhang et al., “Elevated preoperative neu-trophil to lymphocyte ratio predicts risk of recurrence following
curative resection for stage IIA colon cancer,” InternationalJournal of Colorectal Disease, vol. 25, no. 12, pp. 1427–1433, 2010.
[14] Y. Kishi, S. Kopetz, Y. S. Chun,M. Palavecino, E. K. Abdalla, andJ.-N. Vauthey, “Blood neutrophil-to-lymphocyte ratio predictssurvival in patients with colorectal liver metastases treated withsystemic chemotherapy,” Annals of Surgical Oncology, vol. 16,no. 3, pp. 614–622, 2009.
[15] K. J. Halazun,M. A. Hardy, and A. A. Rana, “Negative impact ofneutrophil-lymphocyte ratio on outcome after liver transplan-tation for hepatocellular carcinoma,”Annals of Surgery, vol. 250,no. 1, pp. 141–151, 2009.
[16] M. Aliustaoglu, A. Bilici,M. Seker et al., “The association of pre-treatment peripheral blood markers with survival in patientswith pancreatic cancer,” Hepato-Gastroenterology, vol. 57, no.99-100, pp. 640–645, 2010.
[17] U. U. Tamhane, S. Aneja, D. Montgomery, E.-K. Rogers, K.A. Eagle, and H. S. Gurm, “Association between admissionneutrophil to lymphocyte ratio and outcomes in patients withacute coronary syndrome,”American Journal of Cardiology, vol.102, no. 6, pp. 653–657, 2008.
[18] B. Azab,M. A. Shariff, R. Bachir, J. P. Nabagiez, and J. T.McGinnJr., “Elevated preoperative neutrophil/lymphocyte ratio as apredictor of increased long-term survival in minimal invasivecoronary artery bypass surgery compared to sternotomy,” Jour-nal of Cardiothoracic Surgery, vol. 8, no. 193, pp. 1–11, 2013.
[19] B. Azab, M. Zaher, K. F. Weiserbs et al., “Usefulness ofneutrophil to lymphocyte ratio in predicting short-and long-term mortality after NonST-elevation myocardial infarction,”American Journal of Cardiology, vol. 106, no. 4, pp. 470–476,2010.
[20] O. Sonmez, G. Ertas, A. Bacaksiz et al., “Relation of neu-trophil -to- lymphocyte ratio with the presence and complexityof coronary artery disease: an observational study,” AnadoluKardiyoloji Dergisi, vol. 13, no. 7, pp. 662–667, 2013.
[21] L. Guasti, F. Dentali, L. Castiglioni et al., “Neutrophils andclinical outcomes in patients with acute coronary syndromesand/or cardiac revascularisation. A systematic review on morethan 34,000 subjects,”Thrombosis and Haemostasis, vol. 106, no.4, pp. 591–599, 2011.
[22] M. Sunbul, F. Gerin, E. Durmus et al., “Neutrophil to lympho-cyte and platelet to lymphocyte ratio in patients with dipperversus non-dipper hypertension,” Clinical and ExperimentalHypertension, vol. 36, no. 4, pp. 217–221, 2014.
[23] Y. Arbel, A. Finkelstein, A. Halkin et al., “Neutrophil/lympho-cyte ratio is related to the severity of coronary artery diseaseand clinical outcome in patients undergoing angiography,”Atherosclerosis, vol. 225, no. 2, pp. 456–460, 2012.
[24] B.-J. Park, J.-Y. Shim, H.-R. Lee et al., “Relationship ofneutrophil-lymphocyte ratio with arterial stiffness and coro-nary calcium score,”Clinica Chimica Acta, vol. 412, no. 11-12, pp.925–929, 2011.
[25] I. Sari, M. Sunbul, C.Mammadov et al., “Relation of neutrophil-to-lymphocyte and platelet-to-lymphocyte ratio with coronaryartery disease severity in patients undergoing coronary angiog-raphy,” Kardiologia Polska, vol. 73, no. 12, pp. 1310–1316, 2015.
[26] K. C. Muhammet, K. E. Mehmet, K. K. Mustafa et al., “Neu-trophil to lymphocyte ratio may predict coronary artery diseasein geriatric patients,” Acta Medica, vol. 4, pp. 58–63, 2015.
[27] C. D. Lee, A. R. Folsom, F. J. Nieto, L. E. Chambless, E.Shahar, and D. A.Wolfe, “White blood cell count and incidenceof coronary heart disease and ischemic stroke and mortality

8 International Journal of Inflammation
from cardiovascular disease in African-American and Whitemen and women: atherosclerosis risk in communities study,”American Journal of Epidemiology, vol. 154, no. 8, pp. 758–764,2001.
[28] M. Hoffman, A. Blum, R. Baruch, E. Kaplan, and M. Benjamin,“Leukocytes and coronary heart disease,” Atherosclerosis, vol.172, no. 1, pp. 1–6, 2004.
[29] O. Dogdu, M. Akpek, M. Yarlıoglues et al., “Relationshipbetween hematologic parameters and left ventricular systolicdysfunction in stable patients with multi-vessel coronary arterydisease,” Turk Kardiyoloji Dernegi arsivi : Turk KardiyolojiDerneginin yayın organıdır, vol. 40, no. 8, pp. 706–713, 2012.

Submit your manuscripts athttps://www.hindawi.com
Stem CellsInternational
Hindawi Publishing Corporationhttp://www.hindawi.com Volume 2014
Hindawi Publishing Corporationhttp://www.hindawi.com Volume 2014
MEDIATORSINFLAMMATION
of
Hindawi Publishing Corporationhttp://www.hindawi.com Volume 2014
Behavioural Neurology
EndocrinologyInternational Journal of
Hindawi Publishing Corporationhttp://www.hindawi.com Volume 2014
Hindawi Publishing Corporationhttp://www.hindawi.com Volume 2014
Disease Markers
Hindawi Publishing Corporationhttp://www.hindawi.com Volume 2014
BioMed Research International
OncologyJournal of
Hindawi Publishing Corporationhttp://www.hindawi.com Volume 2014
Hindawi Publishing Corporationhttp://www.hindawi.com Volume 2014
Oxidative Medicine and Cellular Longevity
Hindawi Publishing Corporationhttp://www.hindawi.com Volume 2014
PPAR Research
The Scientific World JournalHindawi Publishing Corporation http://www.hindawi.com Volume 2014
Immunology ResearchHindawi Publishing Corporationhttp://www.hindawi.com Volume 2014
Journal of
ObesityJournal of
Hindawi Publishing Corporationhttp://www.hindawi.com Volume 2014
Hindawi Publishing Corporationhttp://www.hindawi.com Volume 2014
Computational and Mathematical Methods in Medicine
OphthalmologyJournal of
Hindawi Publishing Corporationhttp://www.hindawi.com Volume 2014
Diabetes ResearchJournal of
Hindawi Publishing Corporationhttp://www.hindawi.com Volume 2014
Hindawi Publishing Corporationhttp://www.hindawi.com Volume 2014
Research and TreatmentAIDS
Hindawi Publishing Corporationhttp://www.hindawi.com Volume 2014
Gastroenterology Research and Practice
Hindawi Publishing Corporationhttp://www.hindawi.com Volume 2014
Parkinson’s Disease
Evidence-Based Complementary and Alternative Medicine
Volume 2014Hindawi Publishing Corporationhttp://www.hindawi.com


![Retrospective Cohort Study Absolute monocyte and lymphocyte count … · platelet volume (MPV)[8], absolute neutrophil count (ANC) [9], absolute monocyte counts (AMC) , absolute lymphocyte](https://img.dokumen.tips/doc/110x75/5ea05036c63dd366f76addb5/retrospective-cohort-study-absolute-monocyte-and-lymphocyte-count-platelet-volume.jpg)