Embed Size (px)
Citation preview

J Labor Res (2010) 31:285–306DOI 10.1007/s12122-010-9093-2
Is Any Job Better than No Job? Life Satisfactionand Re-employment
Carola Grün · Wolfgang Hauser · Thomas Rhein
Published online: 10 July 2010© The Author(s) 2010. This article is published with open access at Springerlink.com
Abstract Using data for West Germany from the German Socio-EconomicPanel, we analyse the impact of transitions from unemployment to full-timeemployment on life satisfaction, with special focus on the influence of jobquality. We apply various indicators of job quality (self-reported job satisfac-tion, wages, type of contract, and indicators of the fit between the worker andjob requirements). We control for the influence of income changes and otherfactors affecting life satisfaction, using a conditional logit estimator. Resultssuggest that job quality only matters to some extent, and often people in badjobs are still better off than those who remain unemployed. This effect isstatistically significant for most indicators of job quality, except for workerswith low job satisfaction and for those whose new job is much worse than theirpre-unemployment job.
We would like to thank Gesine Stephan, conference participants at the ISQOLS conference2007 in San Diego, USA and the 2008 meeting of the IARIW in Portoroz, Slovenia, as well asseminar participants in Nuremberg, Göttingen and Vienna and three anonymous referees forvaluable comments and suggestions on earlier versions. All remaining errors are ours.
C. Grün (B)Faculty of Economic Sciences, Göttingen University,Platz der Göttinger Sieben 3,37073 Göttingen, Germanye-mail: [email protected]
W. HauserZIRN - Interdisciplinary Research Unit on Risk Governanceand Sustainable Technology Development,University of Stuttgart, Stuttgart, Germany
T. RheinInstitute for Employment Research (IAB),Nuremberg, Germany

286 J Labor Res (2010) 31:285–306
Keywords Unemployment · Re-employment · Job quality · Life satisfaction
JEL Classification I31 · J28
Introduction
There is well-established evidence that unemployment has a strong negativeimpact on life satisfaction. This has been shown in cross-sectional comparisonsof satisfaction levels between employed and unemployed persons (Clark andOswald 1994). The evidence has been confirmed by longitudinal studies thatfollow the same individuals over time (Winkelmann and Winkelmann 1998;Kassenboehmer and Haisken-DeNew 2009), thus avoiding problems of inter-personal comparability of subjective well-being, inherent in cross-sectionalstudies. Persons who lose their job report, on average, a sharp drop in lifesatisfaction, which seems to be caused only to a minor degree by income losses.This drop in life satisfaction can be conceived as the psychological cost ofunemployment. There are also a lot of psychological case studies with the sameconclusion (for a review of this literature, see McKee Ryan et al. 2005).
Correspondingly, one should expect a rise of life satisfaction when unem-ployed people take up a new job. On average, this is the case indeed, but, as willbe shown later, many of the previously unemployed report either unchangedor lower levels of life satisfaction after finding a new job. Of course, factorsnot related to the employment situation could be responsible. However, itcould also be caused by unsatisfying, ‘bad’ jobs of low quality. This is themain question we will address in this paper: Are there in fact jobs which suchlow quality that remaining unemployed may be better, or at least no worsefor the overall level of well-being? Is it possible to single out particular jobcharacteristics, such as low wages, or a particular combination of job featuresthat would constitute ‘bad’ jobs?
It is obvious that this question is important for labor market policies.Layard (2004), in his paper on ‘Good jobs and bad jobs’, claims that “humanhappiness1 is more affected by whether or not one has a job than by what kindof job it is”, and concludes: “Thus, when jobs are at hand, we should insistthat unemployed people take them. This involves a much more pro-activeplacement service and clearer conditionality than applies in many countries.”However, this conclusion is still disputed, as is the empirical evidence. Previouscase studies, reviewed below, were based on relatively few observations, whichrestricts the application of appropriate econometric techniques. Furthermore,most studies use a relatively narrow and somewhat arbitrary concept of jobquality.
1Layard (2004) does not distinguish between ‘happiness’ and ‘life satisfaction’.

J Labor Res (2010) 31:285–306 287
We try to contribute to this debate by utilizing a large representative panelsurvey for Germany. Since 1984, the German Socio-Economic Panel (GSOEP)has continuously collected self-reported life satisfaction scores of participantsand contains information on various job and worker characteristics, allowingto define job quality in alternative ways. We make use of the panel structureof the data and follow individuals over time, which allows us to control forunobserved, time-invariant individual effects. From the GSOEP we selectpersons observed as unemployed in a given year t0 between 1990 and 2006 inWest Germany. For this group, we analyze life satisfaction scores the followingyear t1 depending on whether people are still unemployed or have found a(full-time) job. In the latter case, the role of job quality is investigated. Weonly consider transitions to full-time jobs, since in this case the impact on lifesatisfaction is expected to be more clear-cut than in the case of commencingpart-time employment. We also expect gender differences to be less importantwhen focusing on full-time jobs, which allows us two analyze both sexes jointlyin a multivariate setting.
Our main result is that we cannot identify a single job feature, nor a com-bination of such features that constitute such low quality jobs that remainingunemployed would be the better choice for the individual. On the contrary,the bulk of our evidence shows that even low quality jobs are associatedwith higher life satisfaction, and this effect is statistically significant for mostspecifications of ‘bad’ jobs.
The observed increase in life satisfaction could also partly be the result ofself-selection, as some unemployed may have a stronger preference for workthan others and consequently gain more from starting a job. We cannot fullyexclude this possibility, but will present evidence that self-selection seemsto play only a minor role for the results and that the observed rise in lifesatisfaction is by and large a causal effect of re-employment.
Moreover, we follow people over 2 years to see whether there is adap-tation or habituation to employment. Adaptation, defined as “reduction inthe affective intensity of favorable or unfavorable circumstances” (Frederickand Loewenstein 1999), has already been investigated in some studies withregard to unemployment (for a recent survey, see Clark 2006). The underlyinghypothesis of these studies is that with longer unemployment duration thenegative effects on well-being could decrease, because people learn how to livewith unemployment. Similarly, people could adapt to their new job: At first,they may feel relieved to have successfully escaped unemployment, but overtime they may become more and more aware of the unpleasant circumstancesof their job.2 We test this hypothesis by comparing life satisfaction scoresbetween t0 and t2 for those who have found employment in t1 and are stillemployed in t2 and examine whether higher satisfaction levels are likely topersist. We find no evidence for habituation.
2Evidence of habituation has been found in the case of other events which usually raise happinesslevels, such as marriage or a sudden rise in income.
288 J Labor Res (2010) 31:285–306
The paper is structured as follows: In Section “Job Quality—Dimensionsand Indicators” we discuss dimensions and indicators for job quality andpropose alternative approaches to measure job quality. Section “TheoreticalConsiderations and Previous Evidence” reviews existing theory and em-pirical evidence. Section “Data and Methodology” discusses the data andour estimation approach. In Section “Results” we present our results andSection “Conclusions” concludes.
Job Quality—Dimensions and Indicators
A crucial question for our analysis is: What describes a good or bad job?Unfortunately, job quality is not a clearly defined concept, and hence, it isdifficult to quantify and measure. Obviously, many aspects of an employmentrelationship matter. The European Commission (2001), which highlights theimportance of job quality as part of the European Employment Strategy(“more and better jobs!”), defines job quality as “a relative concept regardinga job–worker-relationship, which takes into account both objective character-istics related to the job and the match between worker characteristics [. . . ]and job requirements [. . . ]. It also involves subjective evaluation of thesecharacteristics by the respective worker.”
This broad definition permits us to distinguish between an objective anda subjective dimension of job quality. The former is mirrored by observablecharacteristics, such as wages, job security, working time arrangements, and bythe fit between acquired and required human capital; the latter is mirrored bythe subjective perception of these characteristics.
To start with objective features, our data provide a number of job-relatedinformation, e.g. on pay, working hours as well as basic contract terms. Sincethe provision of a secure income is considered as the main “manifest” functionof work (Jahoda 1982), we put particular emphasis on wages and job security,and classify jobs with respect to the type of employment contract (permanentor fixed term contract) and whether or not jobs are low paid. According to thetheory of compensating wage differentials, high-wage jobs are not necessarilybetter in terms of job quality and resulting welfare levels, since higher wagesare paid to compensate for any unpleasant or hazardous working conditions.3
In line with traditional labor economics, low-wage jobs should be no worsethan better-paid jobs in terms of resulting welfare levels. However, the theoryof labor market segmentation, introduced by Doeringer and Piore (1971),challenges the neo-classical labor market model and assumes the existenceof at least two distinct labor market segments with rather different employ-ment characteristics and allocation mechanisms: A primary (or core) segmentof ‘good jobs’ with relatively high wages and employment security, and a
3For a comprehensive discussion of compensating wage differentials, see Rosen (1986).

J Labor Res (2010) 31:285–306 289
secondary segment of ‘bad jobs’, mostly insecure and low-paid.4 According tothis approach, wages and job quality are expected to be positively correlated,and this view also prevails in recent studies on job quality (Cabral Vieira et al.2005; Diaz-Serrano and Cabral Vieira 2005; Howell and Okatenko 2008).
Regarding the subjective perception of job quality, we follow the approachby Leontaridi and Sloane (2001), Clark (2005) and a number of case studiescarried out by psychologists (see review in McKee-Ryan et al. 2005) where jobsatisfaction scores are used as a proxy for job quality. Objective (observable)features of the current job and job satisfaction can be expected to be stronglycorrelated. Therefore, we do not estimate the effects of wages and employmentsecurity jointly with job satisfaction, but separately. Moreover, job qualityas a ‘relative concept’ (European Commission 2001) is also influenced bythe match between the worker characteristics and job requirements. Closelyrelated to the job match is the influence of the employment history of anindividual before she became unemployed. More specifically, we expect thatthe characteristics of the pre-unemployment job, provided there was such ajob, will influence the perception of the current job—a comparison effect. Togive an example: Commencing a low wage job out of unemployment may bemore dissatisfying for someone who had a better paid job before. We relyon various aspects of the current and the previous job, explained in moredetail in Section “The Role of Job Quality”, to investigate the relevance ofthis comparison effect.
Theoretical Considerations and Previous Evidence
The psychological well-being of the unemployed compared to the well-being ofthose employed in ‘bad’ and ‘good’ jobs, however specified, has already beeninvestigated in a number of studies. As to theoretical considerations, there isthe influential approach of Jahoda (1982). She distinguished between “man-ifest” functions of work (mainly provision of income) and “latent” functionssuch as social interaction, time structuring and personal identity. Jahoda (1982)claimed that the latent functions are much more important for the mental well-being than the manifest functions. Even in insecure low paid jobs workers canparticipate in these latent benefits. From this perspective, any job is better thanno job.
Jahoda’s views were challenged by other researchers. Liem (1992) claimedthat the psychological costs of accepting an unsatisfactory job are often greaterthan those incurred by remaining unemployed, because the worker gives uppersonal control and incurs damage to his or her sense of self. Fryer’s agencytheory argues that the mental well-being suffers from a restriction of personal
4The segmentation approach also distinguishes between internal and external markets. Thisdistinction partly coincides with the distinction between a primary and a secondary sector, butallows for further segmentation within the primary sector (e.g. firm-specific or occupation-specificlabor markets).

290 J Labor Res (2010) 31:285–306
agency caused by financial deprivation, which prevents affected workers fromplanning a meaningful future (Fryer 1986). In this perspective, the transitionto a low wage job is only preferable to unemployment if it provides moreincome.
The empirical evidence concerning the debate is mixed. First, there isevidence from cross-sectional studies. A case study, carried out in Australia,compared 193 unemployed people and 206 low wage earners and concludedthat the latter are significantly better off than the former in terms of lifesatisfaction and other dimensions of mental well-being (Hassall et al. 2004).Theodossiou (1998) obtained similar results for Britain with a larger sampledrawn from the 1992 wave of the British Household Panel Survey (BHPS). Incontrast, a study based on the first wave on the Australian household panelHILDA focused on reported job satisfaction as indicator for employmentquality and found “that being in employment but in a job in which one haslow job satisfaction has an even greater detrimental effect on reported lifesatisfaction than unemployment” (Dockery 2003).
However, in cross-sectional comparisons it cannot be excluded that thejobless differ systematically from the employed in unobserved characteristicsthat may in turn influence life satisfaction. Hence, longitudinal studies whichfollow the same individuals over time may be more revealing. Such studieshave been carried out by psychologists and sociologists. Leana and Feldmann(1995) surveyed 59 male laid-off workers in the US immediately after jobloss and one year later. They show that, on average, the still unemployedshowed greater psychological distress than the re-employed, but also find greatdifferences in life satisfaction between satisfactorily and unsatisfactorily re-employed workers. Wanberg (1995) carried out a longitudinal study on 129unemployed people and finds that both persons who remained unemployedand those who found a dissatisfying job reported no changes in mental health.In larger case studies, O’Brien and Feather (1990) and Winefield et al. (1993)surveyed two panels of Australian school-leavers in the 1980’s; both studiesfound that those who had found ‘good’ jobs were clearly more satisfied thanthose who were unsatisfactorily employed, whereas the latter were not betteroff than those who were unemployed, in terms of life satisfaction and otherindicators of psychological well-being. In any case, the focus of these twostudies is on transitions between school and working life, and not betweenunemployment and ‘good’ respectively ‘bad’ jobs, which is the focus of thispaper.
Data and Methodology
The empirical analysis is based upon the German Socio-Economic Panel(GSOEP) which is a representative longitudinal survey of private householdssince 1984. All household members aged 16 and above are interviewed onan annual basis. A multitude of topics are covered, among them individual

J Labor Res (2010) 31:285–306 291
employment histories, earnings and various satisfaction dimensions, e.g. life,job and health status.5
Our main analysis will be based on a sample consisting of people agedbetween 20 and 60 years and residing in West Germany6 who reported to beunemployed at the time of the interview in a particular year t0 and were eitherfull-time employed or still unemployed the following year t1. Individuals whocommenced part-time jobs, started their own business or became economicallyinactive after the unemployment spell have been excluded from the mainanalysis.7
Pooling all valid observations across the years 1990 to 2006 yields a samplesize of 9,954 person-year observations. In a second step, we will also look atmedium-term effects. We therefore construct a second sample which followsindividuals over 2 years and consists of 9,066 person-year observations.8
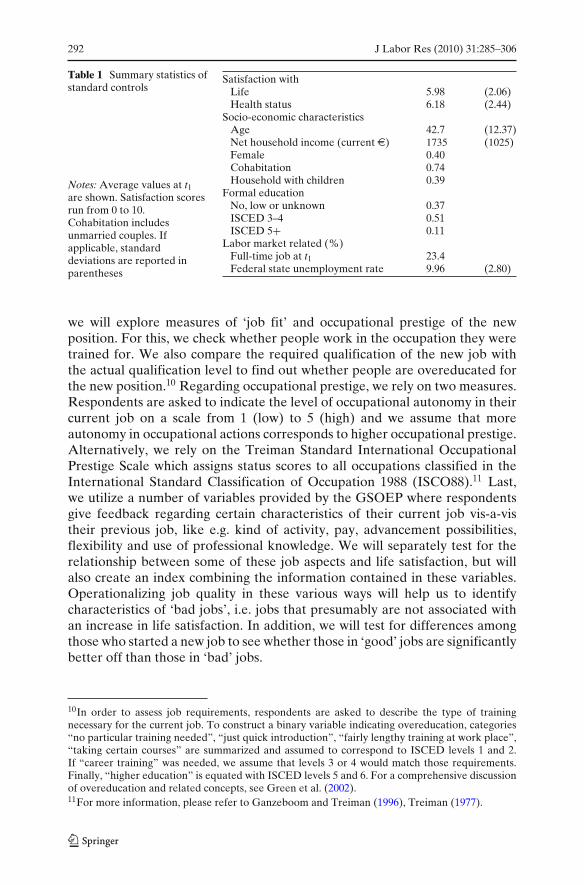
Table 1 presents summary statistics of variables typically used in happinessregressions and which will enter our empirical models as standard controls.Satisfaction levels with life and health are measured on a scale ranging fromzero to ten. Respondents are asked to answer questions like: ‘How dissatisf iedor satisf ied are you with your life overall?’ where zero indicates completedissatisfaction and ten complete satisfaction. In our sample, average life sat-isfaction is around 6 and satisfaction with health is somewhat higher (6.2).We will consider standard control variables like age, education, householdincome and certain household characteristics in all our regressions. To captureeconomic conditions at a regional level, we add state-specific unemploymentrates obtained from the Federal Employment Office. Table 1 also reveals thatthe majority of people in our sample will remain unemployed since only 23%are full-time employees the following year.
Various approaches of measuring the concept of job quality are discussed inthe literature and we will pursue some of these suggestions in our empiricalanalysis. First, we use information on self-reported job satisfaction as anindicator of job quality. Second, jobs are classified according to their type ofcontract, i.e. permanent or fixed-term, and whether jobs are low paid.9 Thisway, we hope to assess the quality of a new job in a more impartial way. Third,
5For further information on the GSOEP, see Haisken-DeNew and Frick (2005). The dataused in this paper was extracted using the Add-On package PanelWhiz for Stata� . PanelWhiz(http://www.PanelWhiz.eu) was written by Dr. John P. Haisken-DeNew ([email protected]).See Haisken-DeNew and Hahn (2006) for details. The PanelWhiz generated DO file to retrievethe data used here is available from the authors upon request. Any data or computational errorsin this paper are our own.6Residents of East Germany have been excluded since the East German economy and labormarket underwent radical structural changes throughout the 1990’s.7As shown later, the respective number of observations was relatively low and basic summary sta-tistics suggest that people who leave unemployment to work part-time or to become economicallyinactive differ systematically from other labor market participants.8Most of our analysis will rely on the sample which traces individuals for one year only.9If wages fell below two thirds of the median wage of all full-time employees in a given year theyare considered low pay.
292 J Labor Res (2010) 31:285–306
Table 1 Summary statistics ofstandard controls
Notes: Average values at t1are shown. Satisfaction scoresrun from 0 to 10.Cohabitation includesunmarried couples. Ifapplicable, standarddeviations are reported inparentheses
Satisfaction withLife 5.98 (2.06)Health status 6.18 (2.44)
Socio-economic characteristicsAge 42.7 (12.37)Net household income (current e) 1735 (1025)Female 0.40Cohabitation 0.74Household with children 0.39
Formal educationNo, low or unknown 0.37ISCED 3–4 0.51ISCED 5+ 0.11
Labor market related (%)Full-time job at t1 23.4Federal state unemployment rate 9.96 (2.80)
we will explore measures of ‘job fit’ and occupational prestige of the newposition. For this, we check whether people work in the occupation they weretrained for. We also compare the required qualification of the new job withthe actual qualification level to find out whether people are overeducated forthe new position.10 Regarding occupational prestige, we rely on two measures.Respondents are asked to indicate the level of occupational autonomy in theircurrent job on a scale from 1 (low) to 5 (high) and we assume that moreautonomy in occupational actions corresponds to higher occupational prestige.Alternatively, we rely on the Treiman Standard International OccupationalPrestige Scale which assigns status scores to all occupations classified in theInternational Standard Classification of Occupation 1988 (ISCO88).11 Last,we utilize a number of variables provided by the GSOEP where respondentsgive feedback regarding certain characteristics of their current job vis-a-vistheir previous job, like e.g. kind of activity, pay, advancement possibilities,flexibility and use of professional knowledge. We will separately test for therelationship between some of these job aspects and life satisfaction, but willalso create an index combining the information contained in these variables.Operationalizing job quality in these various ways will help us to identifycharacteristics of ‘bad jobs’, i.e. jobs that presumably are not associated withan increase in life satisfaction. In addition, we will test for differences amongthose who started a new job to see whether those in ‘good’ jobs are significantlybetter off than those in ‘bad’ jobs.
10In order to assess job requirements, respondents are asked to describe the type of trainingnecessary for the current job. To construct a binary variable indicating overeducation, categories“no particular training needed”, “just quick introduction”, “fairly lengthy training at work place”,“taking certain courses” are summarized and assumed to correspond to ISCED levels 1 and 2.If “career training” was needed, we assume that levels 3 or 4 would match those requirements.Finally, “higher education” is equated with ISCED levels 5 and 6. For a comprehensive discussionof overeducation and related concepts, see Green et al. (2002).11For more information, please refer to Ganzeboom and Treiman (1996), Treiman (1977).

J Labor Res (2010) 31:285–306 293
Table 2 illustrates the distributions of various job characteristics amongthose employed at t1. Self-reported ’ is also measured on a zero to ten scale.Scores between 0 and 4 correspond to low, 5–7 to medium and 8–10 tohigh levels of job satisfaction. Around a third of all jobs commenced afterunemployment were on a fixed term basis. Regarding earnings, almost 40%of jobs following an unemployment spell fell below the low pay thresholdand 17% of all jobs combined these two ‘bad’ job properties. Next, weturn to our indicators of potential job mismatch. Only around 40% will
Table 2 Distribution of jobcharacteristics amongfull-time employees
aIndicates smaller number ofobservations due to itemnon-response. At most,sample size is reduced byaround 20% when looking atthe comparisons betweencurrent and previous job
Number of full-time employees at t1 1,167
Self-reported job satisfactionHigh 0.49Medium 0.37Low 0.14
Type of contract, payFixed term 0.35Low pay 0.39Fixed term and low pay 0.17
Job fita
Work in occupation trained for 0.42Overeducated 0.36
Level of autonomyHigh 0.57Low 0.43
Treiman scorea
High 0.32Medium 0.36Low 0.32
Comparison of current and previous job regarding:a
Kind of activityImproved 0.43Same 0.41Worse 0.16
EarningsImproved 0.41Same 0.28Less 0.31
Advancement possibilitiesImproved 0.25Same 0.55Worse 0.20
WorkloadImproved 0.25Same 0.48Worse 0.26
Working hours regulationsImproved 0.30Same 0.47Worse 0.23
Use of professional knowledgeImproved 0.27Same 0.49Less 0.24

294 J Labor Res (2010) 31:285–306
Table 3 Life satisfaction and labor market status
Labor market status at t1: Full-time Unemployed Part-time Out ofjob job labor force
Life satisfaction at t0Mean 5.79 5.81 6.31 6.43Standard error 0.06 0.03 0.11 0.08N 1167 3810 344 715
Change in life satisfaction from t0 to t1Mean +0.92 −0.05 +0.34 −0.05Standard error 0.06 0.03 0.11 0.07N 1167 3810 344 715
Change in life satisfaction from t1 to t2... if employed at t2
Mean +0.08 +0.94 – –Standard error 0.07 0.12N 623 313
... if unemployed at t2Mean −1.01 +0.02 – –Standard error 0.17 0.05N 175 1911
get employed in the same occupation they were trained for; hence, for themajority of the unemployed the new job probably demands a different set ofskills. We are particularly interested whether people resent the fact of being‘underemployed’, i.e. the acquired level of education and training exceeds therequired qualification level. In our sample, more than a third report beingoverqualified for their new position. Regarding our measures of occupationalprestige, we find that 43% report a low level of occupational autonomy whichwe will equate with lower levels of occupational prestige. When relying onthe Treiman prestige scale, jobs are almost evenly distributed across the threecategories indicating low, medium or high occupational prestige.12 Finally,looking at the comparisons between current and previous job characteristics,there seems to be a great deal of stability (except for earnings), but the shareof people reporting positive or negative changes remains substantial.
Before turning to the empirical approach and results of the multivariateanalysis, we briefly discuss some more descriptive results. Table 3 confirms thewell-known differences in life satisfaction among labor force participants. Thefirst panel reports the level of life satisfaction at year t0 (i.e. when everyoneis unemployed), broken down by labor market status the following year.At t0, there are no systematic differences in life satisfaction scores betweenpeople who will be full-time employed at t1 and people who will remainunemployed. However, people with part-time jobs and those who will beout of the labor force seem to be less affected by unemployment as their
12Our assumption that low levels of autonomy correspond to low occupational prestige is sup-ported by a correlation coefficient of 0.67 between these two variables.
J Labor Res (2010) 31:285–306 295
average life satisfaction scores are significantly higher at t0. It is interesting tonote that for these two groups the share of women is around 80%, whereasamong other groups of labor market participants the gender ratio is morebalanced. Also, the number of observations is substantially smaller. Lookingat the changes in life satisfaction between t0 and t1, only finding a job isassociated with a significant rise and the increase is much bigger for those infull-time employment. Again, these results indicate that certain groups are lessattached to the labor market and hence are likely to respond differently to thequality of available jobs. In order to obtain robust and significant results, themain empirical analysis will only consider individuals who are either full-timeemployed or still unemployed at t1.
When following people over 2 years (results shown in second panel), weobserve a similar increase in life satisfaction for those who find full-timeemployment in t2. Being continuously employed seems to further increase lifesatisfaction although not significantly in a statistical sense. On the other hand,people who become unemployed again in t2 realize a pronounced decline intheir satisfaction level and those who have never been employed while beingobserved in our sample report on average rather stable life satisfaction levels.
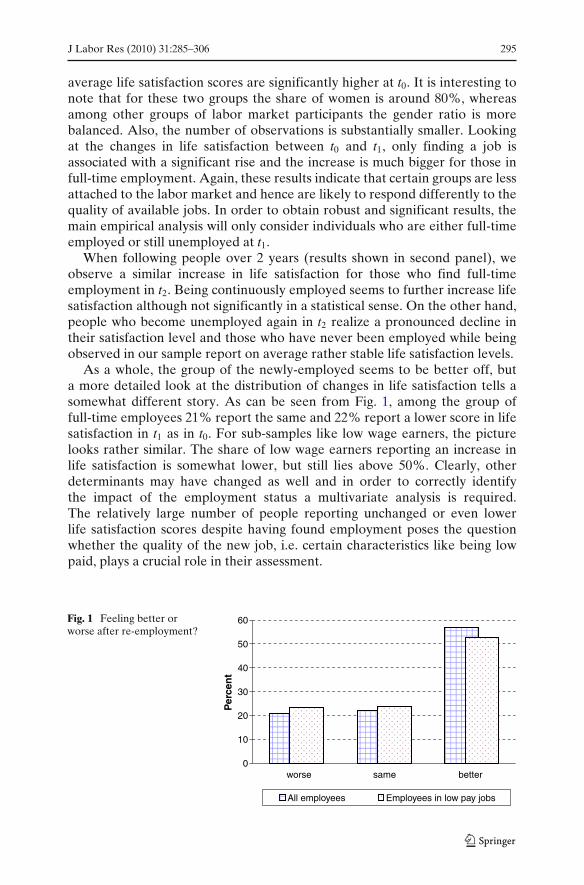
As a whole, the group of the newly-employed seems to be better off, buta more detailed look at the distribution of changes in life satisfaction tells asomewhat different story. As can be seen from Fig. 1, among the group offull-time employees 21% report the same and 22% report a lower score in lifesatisfaction in t1 as in t0. For sub-samples like low wage earners, the picturelooks rather similar. The share of low wage earners reporting an increase inlife satisfaction is somewhat lower, but still lies above 50%. Clearly, otherdeterminants may have changed as well and in order to correctly identifythe impact of the employment status a multivariate analysis is required.The relatively large number of people reporting unchanged or even lowerlife satisfaction scores despite having found employment poses the questionwhether the quality of the new job, i.e. certain characteristics like being lowpaid, plays a crucial role in their assessment.
Fig. 1 Feeling better orworse after re-employment?
0
10
20
30
40
50
60
worse same better
Per
cen
t
All employees Employees in low pay jobs

296 J Labor Res (2010) 31:285–306
As outlined above, self-reported satisfaction levels regarding current em-ployment, health or life overall are reported on a scale running from zeroto ten. Hence, individual satisfaction scores can be ranked from low to highand the acquired information has an ordinal structure. Despite this, cardinalmodels like OLS and fixed effects panel estimators are frequently appliedto this kind of data. From a theoretical point of view, strong assumptionsregarding interpersonal comparability are necessary to support a cardinalinterpretation of subjective well-being data. Previous research has shown thatin order to attain unbiased estimates it is of less importance whether resultshave been obtained from cardinal or ordinal models but whether the prob-lem of unobserved heterogeneity has been addressed appropriately (Ferrer-i-Carbonell and Frijters 2004). Since any subjective assessment may mirrorinherent personality traits that cannot be observed and do not change overtime, it seems sufficient to address individual time-invariant unobservables toarrive at unbiased estimates.
In the context of life satisfaction being measured on an ordinal scale,discrete choice models allowing for fixed effects seem the most appropriatechoice. Few studies built on the conditional logit model by Chamberlain (1980)and developed an algorithm to estimate ordered logit models with fixed orrandom effects (e.g. Das and van Soest 1999; Ferrer-i-Carbonell and Frijters2004).13 A computationally less laborious method which also follows the logicof Chamberlain’s estimator has been applied by e.g. Booth and van Ours(2008) and Kassenboehmer and Haisken-DeNew (2009) and we will mainlyfollow their approach. For this, we transform individual life satisfaction scoresYit into a binary variable which equals one when a person’s life satisfactionscore at time t is above the individual average and zero otherwise:14
yit ={
0 i f Yit ≤ Yi
1 i f Yit > Yi
with Yi =∑
Yit/T.
We will regress the binary variable yit indicating improvements in life satis-faction on the set of standard controls and indicators of job quality to findout whether certain job characteristics are likely to attenuate the otherwisepositive effect of having found new employment. The fixed effects logit modelcan be written as
Prob(yit = 1 |xit) = eαi+x′itβ
1 + eαi+x′itβ
.
13For an application of the estimators on determinants of job satisfaction, see D’Addio et al.(2007).14The average level of individual life satisfaction Yi was calculated from satisfaction scoresreported between 1985 and 2007.

J Labor Res (2010) 31:285–306 297
The unconditional maximum likelihood estimates for αi and, hence, β willbe inconsistent due to the incidental parameters problem (Greene 2008).Chamberlain’s estimator is based on the conditional likelihood function whichdoes no longer depend on the incidental parameters αi and allows for anunbiased estimation of the coefficients β. The model is identified by thoseindividuals who realize a change in their dependent variable over time, e.g.yi,1990 = 0, yi,1991 = 1, but individuals with no change in the dependent variablewill not contribute to the likelihood function and will not be included in theestimation.15
Results
Re-employment and Life Satisfaction
Table 4 illustrates the results obtained from the conditional logit estimatorusing the standard set of control variables. The strong and positive correlationbetween finding a job and life satisfaction shown in Table 3 persists in amultivariate setting, both for the whole sample and when tested separately formen and women.16
One concern regarding the reliability of this result could be the underlyingsample structure. Since we have pooled across individuals regardless how manytimes (and years) they have been unemployed between 1990 and 2006, peoplewho are unemployed for several years will enter the sample more than once.This also means that long-term unemployed and people who repeatedly losttheir job are overrepresented in our sample. To test whether this particulardata structure is likely to influence our results, we re-run all regressionson randomly drawn samples with only one (t0, t1) sequence per individual.Although the share of the unemployed in t1 declines from 76% to around67%, the main results remain remarkable stable as can be seen from Table 4,column 4.17
Another related aspect of the relationship between life satisfaction and re-employment is the potential bias due to self-selection into employment. Peoplehave heterogeneous preferences regarding employment and those with strong
15To see whether our results are sensitive to the loss of information due to transforming lifesatisfaction scores into a binary variable and the loss of observations related to applying aconditional logit estimator, we have re-run all regressions applying a traditional fixed effects panelestimator. Results are very similar to the ones reported here and available on request. For a moredetailed discussion on the conditional logit estimator, please refer to Chamberlain (1980) andGreene (2008).16Since the gender-specific results for the overall employment effect as well as applied job qualityindicators are very similar, we decided to only report results obtained from the pooled sample.The gender-specific results are available on request.17Since our initial regression did control for individual fixed effects, we probably could alreadyaccount for the bulk of unobserved heterogeneity.

298 J Labor Res (2010) 31:285–306
Table 4 Determinants of life satisfaction
(1) All (2) Women (3) Men (4) Random sample
Age −0.044∗∗∗ (0.017) −0.038 (0.027) −0.046∗∗ (0.022) −0.050 (0.083)ISCED 3–4 0.163 (0.235) −0.007 (0.470) 0.208 (0.268) 0.050 (0.588)ISCED 5+ −0.460 (0.537) −0.263 (0.827) −0.618 (0.734) −0.349 (0.848)Cohabitation 0.188 (0.166) 0.147 (0.251) 0.285 (0.223) −0.110 (0.263)Household with 0.078 (0.178) 0.325 (0.258) −0.045 (0.232) 0.221 (0.319)
childrenLog net household 0.452∗∗∗ (0.112) 0.418∗∗ (0.178) 0.462∗∗∗ (0.144) 0.430∗∗∗ (0.180)
income (current e)Health status 0.320∗∗∗ (0.026) 0.454∗∗∗ (0.044) 0.250∗∗∗ (0.032) 0.280∗∗∗ (0.034)State unemployment −0.127∗∗∗ (0.034) −0.096∗ (0.050) −0.143∗∗∗ (0.045) −0.106∗∗ (0.063)
rateFull-time employed 1.094∗∗∗ (0.099) 1.103∗∗∗ (0.178) 1.103∗∗∗ (0.118) 1.111∗∗∗ (0.157)Observations 7382 2864 4518 –Pseudo-R2 0.103 0.134 0.091 –
Notes: Coefficients of conditional logit regressions are shown. Standard errors (corrected forrepeated observations) are shown in parentheses. Reference categories: Single, no children livingin household, no, low or unknown level of education, still unemployed. The results shown incolumn 4 have been obtained from a Monte Carlo simulation based on 1,000 replications∗ p < 0.1; ∗∗ p < 0.05; ∗∗∗ p < 0.01
preferences for work are more likely to find and accept a job—even one oflow quality. For the same reason, they may gain more from taking any job (i.e.realise and report higher welfare levels) than those with weak preferences forwork. Hence, the observed increase in life satisfaction among the re-employedcould simply reflect different preferences.
Given the data at hand, we cannot directly control for self-selection andisolate its potential effect. However, we can put forward some empiricalevidence suggesting that the effect is unlikely to be very pronounced. If itwere, we would expect that those with strong work preferences will be over-represented among the re-employed who in turn should have been particularlyunhappy while being unemployed. As shown in Table 3, this is not the case: att0 there is only a small, statistically insignificant difference between ‘movers’(employed at t1) and ‘stayers’ (unemployed at t1). Admittedly, this argumentcannot fully rule out any potential selection bias since it is based on a cross-sectional comparison of satisfaction levels, but it indicates that self-selectiononly seems to play a minor role and higher life satisfaction is largely a causaleffect of re-employment.
Regarding other covariates, we find that age has a negative effect, but isonly significant among men. Probably due to little variation between years,for some of the standard controls like educational level, being in a stablerelationship and whether children live in the household we cannot identify sig-nificant effects. On the other hand, higher household net incomes and higherhealth satisfaction levels have positive effects on life satisfaction, however,the magnitude of the effects are somewhat different for men and women.Overall labor market conditions are proxied by federal unemployment rates

J Labor Res (2010) 31:285–306 299
and results suggest that higher levels of regional unemployment lower theprobability of life satisfaction improvements, especially for men.18
The Role of Job Quality
In order to gain a better understanding of the role job quality plays forlife satisfaction, we will turn to the results presented in Table 5.19 Panel Ashows the results when using self-reported job satisfaction levels, earningsand type of contract as an indicator of job quality. Regarding job satisfactionscores, the coefficients for categories low, medium and high are all positiveindicating that the probability of being better off increases with the level of jobsatisfaction, but the effect is insignificant for the lowest category. Hence, thoseleast satisfied with their new position are not likely to be better off than theunemployed. We then test whether certain employment conditions allow usto again identify a group of workers that will not be better off than the unem-ployed. As can be seen from columns 2–4, we can reject the hypothesis that lowwage jobs or temporary employment contracts are associated with lower lifesatisfaction scores. On the contrary, people employed under these conditionsstill have significantly better chances of improvements in life satisfaction thanthe unemployed. Even for the group of workers with temporary low wage jobs(i.e. combining both dimensions) we still find a significant positive effect onlife satisfaction. This suggests that other job characteristics, if any, result in lowlevels of job satisfaction.
Testing for differences among full-time employees reveals that only thosein higher wage jobs are significantly better off than those in low wage jobs.For all other sub-samples of workers shown in Panel A the coefficients are notstatistically different from each other.
Next, we turn to the measures of job match and occupational prestige(Panel B). People who work in professions which obtained low prestigescores according to the Treiman scale or report low levels of autonomy inoccupational actions are still significantly better off than the unemployed(columns 1 and 2). The picture remains much the same when looking at jobfit measures, despite the fact that the professional mismatch in our sampleseems substantial: More than a third report that they feel overqualified for thenew position and around 40% do not find work in the occupation they weretrained for. As shown in columns 3 and 4, even these groups of workers aremore likely to realize an increase in life satisfaction. Comparing the differencesamong full-time employees, we observe larger coefficients for the presumablybetter categories in three cases, however, most of these differences are not
18We also used individual unemployment duration as an explanatory variable, but results werenever significant in a fixed effects setting.19Since our main focus is on the role of job quality on life satisfaction, we do not report thecoefficients of the standard control variables. We have also split the sample by gender and runall regressions for men and women separately. Results with regard to job quality are often verysimilar.

300 J Labor Res (2010) 31:285–306
Tab
le5
Lif
esa
tisf
acti
onan
djo
bqu
alit
y
(1)
(2)
(3)
(4)
Pan
elA
:Job
sati
sfac
tion
,ear
ning
s,co
ntra
ctty
peSe
lf-r
epor
ted
job
Low
-wag
ejo
b:T
ype
ofco
ntra
ct:
sati
sfac
tion
:H
igh
1.37
6***
(0.1
41)
Yes
0.88
9***
(0.1
48)
Fix
ed-t
erm
cont
ract
1.11
5***
(0.1
56)
Med
ium
1.05
3***
(0.1
52)
No
1.23
6***
(0.1
25)
Per
man
entc
ontr
act
1.08
3***
(0.1
18)
Low
0.27
3(0
.244
)F
ixed
-ter
m&
low
wag
e0.
836*
**(0
.213
)A
llot
her
jobs
1.15
2***
(0.1
09)
Obs
erva
tion
s73
8273
8273
8273
82P
seud
o-R
20.
106
0.10
40.
103
0.10
3
Pan
elB
:Job
mat
chan
doc
cupa
tion
alpr
esti
geT
reim
ansc
ore:
Lev
elof
auto
nom
y:Jo
bfi
t:H
igh
1.44
4***
(0.1
93)
Hig
h1.
165*
**(0
.128
)O
vere
duca
ted
1.06
1***
(0.1
71)
Med
ium
1.10
9***
(0.1
56)
Low
1.01
1***
(0.1
41)
Not
over
educ
ated
1.22
6***
(0.1
25)
Low
0.97
4***
(0.1
71)
Inoc
cupa
tion
trai
ned
for
1.00
9***
(0.1
42)
Not
inoc
cupa
tion
trai
ned
for
1.21
3***
(0.1
37)
Obs
erva
tion
s69
5373
8272
4773
21P
seud
o-R
20.
106
0.10
30.
106
0.10
4
Pan
elC
:Com
pari
son
ofcu
rren
tand
prev
ious
job
(1)
Kin
dof
acti
vity
:E
arni
ngs:
Adv
ance
men
tpos
sibi
litie
s:W
orkl
oad:
Impr
oved
1.62
1***
(0.1
71)
Impr
oved
1.51
3***
(0.1
70)
Impr
oved
1.25
3***
(0.2
14)
Les
s1.
765*
**(0
.222
)Sa
me
1.02
3***
(0.1
68)
Sam
e1.
160*
**(0
.198
)Sa
me
1.30
7***
(0.1
48)
Sam
e1.
178*
**(0
.151
)W
orse
0.63
6***
(0.2
41)
Les
s0.
851*
**(0
.172
)W
orse
0.72
4***
(0.2
17)
Mor
e0.
752*
**(0
.198
)O
bser
vati
ons
7107
7106
7088
7096
Pse
udo-
R2
0.10
60.
105
0.10
30.
106
Not
es:C
oeff
icie
nts
ofco
ndit
iona
llog
itre
gres
sion
sar
esh
own.
Stan
dard
erro
rs(c
orre
cted
for
repe
ated
obse
rvat
ions
)ar
esh
own
inpa
rent
hese
s.St
anda
rdco
ntro
lsfo
red
ucat
ion,
sex,
coha
bita
tion
,hea
lth
stat
us,h
ouse
hold
inco
me,
age
and
child
ren
livin
gin
hous
ehol
dha
vebe
enin
clud
ed∗ p
<0.
1;∗∗
p<
0.05
;∗∗∗
p<
0.01

J Labor Res (2010) 31:285–306 301
statistically significant. Only when comparing jobs with high and low Treimanprestige scores we can detect a significant difference.
Our final approach to operationalizing job quality rests upon a comparisonof certain aspects of the current job versus the previous job. Respondents areasked to indicate whether e.g. earnings, kind of activity, workload and careerprospects have improved, worsened or are about the same.20 Table 5, Panel C,shows the results when testing separately for the relationship between someof these assessments and life satisfaction. As one would expect, improvedor similar working conditions are positively correlated with life satisfaction.When people encounter a worse work environment, they are still significantlybetter off than the unemployed, but significantly less so than respondents withimproved working conditions.
Testing for different aspects of the new position separately may not be theappropriate way to identify ‘bad’ jobs. In order to control for a number ofrelevant criteria simultaneously, we construct an index which combines theinformation of six variables comparing the current with previous the job. Inparticular, we will rely on comparative data regarding the kind of activity,earnings, advancement possibilities, workload, working hours regulations anduse of professional knowledge (see also Table 2). Applying multiple corre-spondence analysis allows us to map 58% of the variables’ principal inertia inone dimension. To adequately represent the distribution of the index scores,we rather consider deciles than one continuous variable reflecting the averageindex value in the empirical analysis. Table 6 presents the results. As indicatedby the coefficients obtained for the deciles controls, the index does not havea linear effect on life satisfaction such as that being in a higher decile wouldcorrespond to a higher probability of improvements in life satisfaction. Rather,our results suggest a certain threshold effect, since relatively low scores are stillassociated with higher levels of life satisfaction. Only for the lowest decile, i.e.where the current job is worse than the previous one in many respects, thecoefficient remains insignificant, indicating that the positive effect of findingnew employment is fully offset by much worse working conditions.
A similar result can be obtained when simply calculating the sum scoreacross all six variables used to construct the index. A sum score of at least 4will assure that there is no positive significant effect anymore (Table 6, column2). In other words, if the new position was rated worse in four or more aspects,the positive impact on life satisfaction disappears. However, since only 12%of all jobs in our sample have negative ratings in 4 or more aspects, this resultneeds to be interpreted with caution.
In a final step, we attempt to identify dimensions for which a joint deterio-ration will be of particular importance for overall life satisfaction. Combiningthe ‘worse/less’ outcomes of all six comparison variables yields 15 pairs of
20In total, respondents are asked to provide feedback regarding nine aspects. Based on resultsobtained from a multiple correspondence analysis, we decided on six variables to be used in ourempirical analysis.

302 J Labor Res (2010) 31:285–306
Table 6 Life satisfaction and job quality: comparison of current and previous job (2)
(1) (2) (3) (4)
Highest decile 1.559*** (0.331)9th decile 1.738*** (0.338)8th decile 2.179*** (0.427)7th decile 0.679** (0.312)6th decile 1.180*** (0.328)5th decile 1.101*** (0.296)4th decile 1.115*** (0.349)3rd decile 1.454*** (0.363)2nd decile 0.902*** (0.307)Lowest decile 0.250 (0.298)All other jobs 1.290*** (0.120) 1.301*** (0.117) 1.299*** (0.121)Any four or more aspects 0.404 (0.279)
worse than in previous jobWorse workload and worse 0.373 (0.292)
working hour regulationsWorse kind of activity 0.330 (0.276)
and less earningsObservations 7078 7078 7078 7078Pseudo-R2 0.107 0.103 0.104 0.104
Notes: See Table 5
job characteristics (e.g. worse kind of activity and less use of professionalknowledge). Although the number of jobs sharing any of these negativeassessments sometimes falls below 100, we are able to identify combinationsof bad job assessments that still have a significant positive effect on lifesatisfaction. In case of eight combinations, however, the coefficient remainsinsignificant.21 We take this as an indicator of job aspects that are particularlyimportant and, if deteriorating jointly, will equalize the positive effect of beingfull-time employed. Columns 3 and 4 of Table 6 show the results for two ofthose combinations.
Job Quality and Medium Term Effects
Closely related to studying determinants of subjective well-being is the ques-tion whether or not people adapt to a changed economic or social environment.Also using GSOEP data, Clark et al. (2008) analyze the degree of anticipationand adaptation to six labor market and family events. Controlling for unob-served heterogeneity, they find strong evidence of both lead and lag effectson current levels of life satisfaction suggesting that after some time subjectivewell-being indicators tend to return to a particular baseline level. Of particularrelevance to our study are their results with respect to unemployment. In
21In particular, combining worse kind of activity with either less earnings or worse workload, orcombining worse working hour regulations with either less earnings, worse career options, worseworkload, less use of professional knowledge or worse kind of activity and, finally, combiningworse career options with worse workload will lead to insignificant results.
J Labor Res (2010) 31:285–306 303
Table 7 Life satisfaction and job quality: Medium term effects
(1) (2) (3) (4) (5)
Employed at yeart1 and t2 1.121***
(0.132)t1 only 0.009
(0.192)t2 only 1.038***
(0.162)Low job satisfaction at t1 and t2
Yes −0.016(0.441)
No 1.265***(0.150)
Low wage job at t1 and t2Yes 0.774***
(0.249)No 1.310***
(0.168)Overeducated at t1 and t2
Yes 1.084***(0.254)
No 1.300***(0.178)
Low autonomy in occupationalactions at t1 and t2
Yes 1.025***(0.238)
No 1.228***(0.162)
Observations 4696 3742 3742 3630 3742Pseudo-R2 0.104 0.107 0.105 0.104 0.104
Notes: See Table 5
general, there is only little evidence of adaptation to unemployment withina time span of 5 years and the authors conclude that unemployment has long-lasting effects.
So far, our results have shown that within a year of commencing a newjob, the quality of this job matters little for overall life satisfaction. For mostof our analysis, people employed under adverse working conditions are stillbetter off than those who remain unemployed. Furthermore, differences in theprobability to experiencing higher levels of well-being are often not statisticallysignificant between workers in low quality and higher quality jobs.
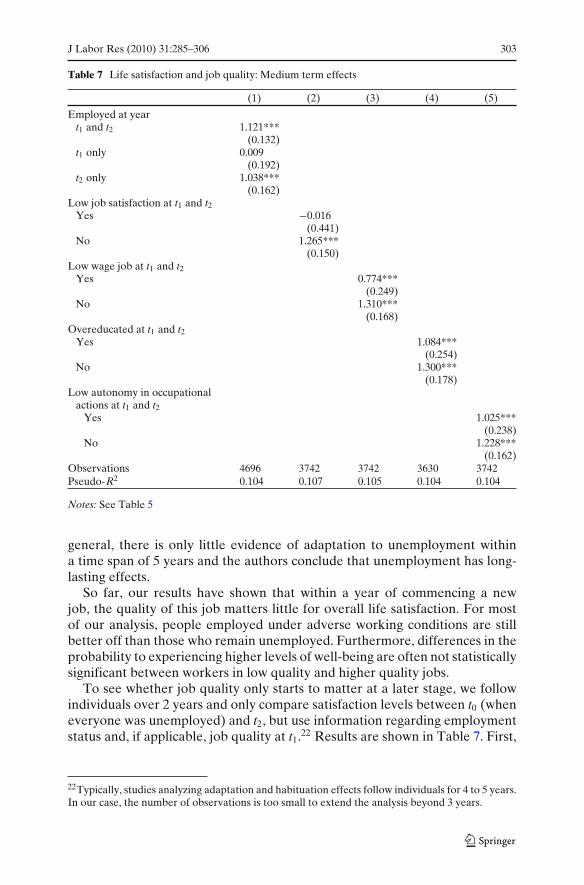
To see whether job quality only starts to matter at a later stage, we followindividuals over 2 years and only compare satisfaction levels between t0 (wheneveryone was unemployed) and t2, but use information regarding employmentstatus and, if applicable, job quality at t1.22 Results are shown in Table 7. First,
22Typically, studies analyzing adaptation and habituation effects follow individuals for 4 to 5 years.In our case, the number of observations is too small to extend the analysis beyond 3 years.

304 J Labor Res (2010) 31:285–306
we simply control for the employment effect on life satisfaction. As can be seenfrom column 1, people who have been employed in both years enjoy higherlevels of life satisfaction as do people who eventually found employment int2. Those who became unemployed again in t2 report similar satisfaction levelsthan the long-time unemployed.
In columns 2–5, the underlying sample consists of people who are eitheremployed at t1 and t2 or remain unemployed in all years. Somewhat restrictedby data availability, we select four indicators of job quality and sort peopleaccording to the number of years they have been employed under unfavorableconditions. As can be seen from Table 7, results from this approach are verysimilar to those discussed earlier. For people reporting low job satisfactionlevels in two consecutive years there is no significant relationship with lifesatisfaction.23 Regarding other indicators of presumably low quality jobs,results suggest that being employed in low wage jobs, feeling overqualifiedor having only little occupational autonomy for 2 years is not detrimentalto life satisfaction. Hence, within a time span of 2 years, we cannot identifyany negative effects of working under less favorable conditions that wouldattenuate or even outweigh the significant positive effect of commencing a full-time job after an unemployment spell.
Conclusions
People taking up a new job out of unemployment are, on average, moresatisfied with life than those remaining in unemployment. This has been foundin previous studies and has also been confirmed by our results. This papertakes the discussion a bit further, asking what role does the quality of the newjob play for life satisfaction. In particular, we are interested in identifying jobcharacteristics that would potentially outweigh the positive effect of findingfull-time employment, so that remaining unemployed would be either betteror at least no worse for life satisfaction. Previous evidence on this question isbased on small case studies and on relatively narrow definitions of job quality.We have tried to overcome these shortcomings by using a large panel datasetwith rich information on job- and worker-related characteristics. We analyzedthe influence of job quality in the framework of a conditional logit model andcontrolled for the influence of other factors known to affect life satisfaction.Furthermore, we applied alternative indicators to cover various dimensions ofjob quality including subjective perceptions of the job, wages and job security,the match between workers’ characteristics and job requirements, and featuresof the new job compared to the pre-unemployment job.
Our results can be summarized as follows: We could not find any singlejob feature, nor any combination of such features, that make jobs so bad that
23This result needs to be interpreted with caution since the number of observations is well below100 for this category. Regarding the alternative specifications of adverse working conditions shownin Table 7, the number of observations is between 300 and 388.

J Labor Res (2010) 31:285–306 305
remaining in unemployment would be the better choice. On the contrary,the bulk of our evidence suggests that even low quality jobs are preferableto unemployment, although they may rise life satisfaction less than highquality jobs. This positive effect continues to persist in the second year of re-employment, and we find no sign of ‘negative adaptation’.
Overall, we conclude that subjective measures of job quality are moreinfluential on life satisfaction than objective ones for full-time employees. Ourresults obtained from the analysis of objective job quality measures suggestthat the manifest function of work is fulfilled and hence, life satisfactionis likely to increase. Nevertheless, there are several subjective measures ofjob quality that can counter the positive effect of re-employment—like lowjob satisfaction or a perceived worsening in several job dimensions whencompared to the previous job. This points to the fact that even if the manifestfunction of work was assured, its effect on life satisfaction can be cancelled outif the latent function was not fulfilled.
Some important research questions remain. For example, why do unem-ployed people sometimes reject job offers, even though these jobs may makethem more content? One explanation could be that they simply do notanticipate the gain in life satisfaction provided even by a low quality job.Alternatively, it could be a rational strategy to reject the ‘bad’ job and waitfor a better offer which will increase life satisfaction even more. Questions likethis need to be addressed within a search and decision model where counter-factual scenarios can be estimated appropriately.
Open Access This article is distributed under the terms of the Creative Commons AttributionNoncommercial License which permits any noncommercial use, distribution, and reproduction inany medium, provided the original author(s) and source are credited.
References
Booth A, van Ours J (2008) Job satisfaction and family happiness: the part-time work puzzle. EconJ 118:F77–F99
Cabral Vieira J, Menezes A, Gabriel P (2005) Low pay, higher pay and job quality: empiricalevidence for Portugal. Appl Econ Lett 12:505–511
Chamberlain G (1980) Analysis of covariance with qualitative data. Rev Econ Stud 47:225–238Clark A (2005) Your money or your life: changing job quality in OECD countries. Br J Ind Relat
43:377–400Clark A (2006) Unhappiness and unemployment duration. Appl Econ Q 52:291–308Clark A, Diener E, Georgellis Y, Lucas R (2008) Lags and leads in life: a test of the baseline
hypothesis. Econ J 118:222–243Clark A, Oswald A (1994) Unhappiness and unemployment. Econ J 104:648–659D’Addio AC, Eriksson T, Frijters P (2007) An analysis of the determinants of job satisfaction
when individuals’ baseline satisfaction levels may differ. Appl Econ 39:2413–2423Das M, van Soest A (1999) A panel data model for subjective information on household income
growth. J Econ Behav Organ 40:409–426Diaz-Serrano L, Cabral Vieira J (2005) Low pay, higher pay and job satisfaction within the
European Union: empirical evidence from fourteen countries. IZA discussion paper 1558

306 J Labor Res (2010) 31:285–306
Dockery A (2003) Happiness, life satisfaction and the role of work: evidence from two Australiansurveys. In: 5th path to full employment conference/10th national conference on unemploy-ment. University of Newcastle
Doeringer P, Piore M (1971) Internal labour markets and manpower analysis. Lexington: HeathLexington
European Commission (2001) Employment in Europe. Office for Official Publications of theEuropean Communities, Luxembourg
Ferrer-i-Carbonell A, Frijters P (2004) How important is methodology for the estimates of thedeterminants of happiness? Econ J 114:641–659
Frederick S, Loewenstein G (1999) Hedonic adaptation. In: Diener E, Kahnemann D, Schwarz N(eds) Well-being: the foundations of hedonic psychology. Russel Sage Foundation, New York
Fryer D (1986) Employment deprivation and personal agency during unemployment. Soc BehavInt J Appl Soc Psychol 1:3–23
Ganzeboom HBG, Treiman DJ (1996) Internationally comparable measures of occupationalstatus for the 1988 international standard classification of occupations. Soc Sci Res 25:201–239
Green F, McIntosh S, Vignoles, A (2002) ‘Overeducation’ and skills—clarifying the concepts.Manch Sch 70:792–811
Greene WH (2008) Econometric analysis, 6th edn. Pearson Prentice Hall, Upper Saddle RiverHaisken-DeNew J, Frick J (2005) Desk top companion to the German Socio-Economic Panel
(GSOEP) Version 8.0. Deutsches Institut für Wirtschaftsforschung, BerlinHaisken-DeNew J, Hahn M (2006) PanelWhiz: a flexible modularized Stata interface for accessing
large-scale panel data setsHassall E, Muller J, Hassall SL (2004) Working towards ill health? An investigation of psycholog-
ical well-being in unemployed and employed low-wage earners. Int J Employ Stud 12:73–101Howell D, Okatenko A (2008) By what measure? A comparison of French and U.S. labor market
performance. With new indicators of employment adequacy. SCEPA working paper 2008-02Jahoda M (1982) Employment and unemployment: a social-psychological analysis. Cambridge
University Press, CambridgeKassenboehmer S, Haisken-DeNew J (2009) You’re fired! The causal negative effect of entry
unemployment on life satisfaction. Econ J 119:448–462Layard R (2004) Good jobs and bad jobs. CEP Discussion Papers 19. London School of Economics
and Political Science, Centre for Economic Performance, LSE,Leana C, Feldmann D (1995) Finding new jobs after a plant closing: antecedents and outcomes of
the occurrence and quality of reemployment. Hum Relat 48:1381–1401Leontaridi R, Sloane P (2001) Measuring the quality of jobs. LoWER Working Papers 7Liem R (1992) Unemployed workers and their families: social victims or social critics? In:
Voydanoff P, Majka L (eds) Families and economic distress. Sage, Beverly HillsMcKee-Ryan FM, Song Z, Wanberg CR, Kinicki A (2005) Psychological and physical well-being
during unemployment: a meta-analytic study. J Appl Psychol 90:53–76O’Brien GE, Feather NT (1990) The relative effects of unemployment and of employment on the
affect, work values and personal control of adolescents. J Occup Psychol 63:151–165Rosen S (1986) The theory of equalizing differences. In: Ashenfelter O, Card D (eds) Handbook
of labor economics, vol 1. Elsevier, Amsterdam, pp 641–92Theodossiou I (1998) The effects of low pay and unemployment on psychological well-being: a
logistic regression approach. J Health Econ 17:85–104Treiman DJ (1977) Occupational prestige in comparative perspective. Academic, New YorkWanberg C (1995) A longitudinal study of the effects of unemployment and quality of reemploy-
ment. J Vocat Behav 46:40–54Winefield A, Tiggemann M, Winefield H, Goldney D (1993) Growing up with unemployment: a
longitudinal study of its psychological impact. Routledge, LondonWinkelmann L, Winkelmann R (1998) Why are the unemployed so unhappy? Evidence from
panel data. Economica 65:1–15