Embed Size (px)
Citation preview

UNIVERSITI PUTRA MALAYSIA
IRANIAN COTTONSEED MEAL VARIETIES AS SUBSTITUTE FOR SOYBEAN MEAL IN RAINBOW TROUT
(Oncorhynchus mykiss) FEEDS
SHAHRAM DADGAR
FP 2009 16

IRANIAN COTTONSEED MEAL VARIETIES AS SUBSTITUTE
FOR SOYBEAN MEAL IN RAINBOW TROUT
(Oncorhynchus mykiss) FEEDS
By
SHAHRAM DADGAR
Thesis submitted to the school of graduate studies, Universiti Putra Malaysia, in
Fulfilment of the Requirements for the degree of Doctor of Philosophy
July 2009

Dedication
“THE END DEPENDS UPON THE BEGINNING”
This Thesis Is Dedicated To My Family and My Late Father Manouchehr Dadgar
ii

Abstract of thesis presented to the Senate of Universiti Putra Malaysia in fulfilment of the requirement for the degree of Doctor of Philosophy
Iranian Cottonseed Meal varieties as Substitute for Soybean Meal in Rainbow Trout (Oncorhynchus mykiss) Feeds
By
SHAHRAM DADGAR
Chairman: Associate Profesor Che Roos Bin Saad, PhD
Faculty: Agriculture
This study was set up to investigate the nutritional value and the optimum inclusion
level of several Iranian cottonseed meals i.e. var. Pak, Sahel and Akra (CSMP, CSMS,
and CSMA) as a substitute for soybean meal (SBM) in rainbow trout (Oncorhynchus
mykiss) feed. Apparent digestibility coefficients (ADC) were calculated in experiment
1 by using an indigestible marker. At the end of this experiment, the ADCs of CSMP,
CSMS, CSMA and SBM were measured. Results showed that ADC values for most
nutrients of CSMP, CSMS, and CSMA were different from those of SBM and when
the varities were compared; ADC values for CSMP (62.7% from DM and 82.4% for
CP and 66.6% for crude fat) were higher than the two other CSM varieties i.e. CSMS
and CSMA. Three separate studies were carried out to investigate the nutritional value
of each Iranian cottonseed meal varieties ( CSM) as soybean meal substitute in quality
low cost rainbow trout feeds. Six formulated feeds consisting different substitution
levels (0, 20, 40, 60, 80, 100%) of SBM with CSMP, CSMS, and CSMA, respectively,
were fed to a total of 540 rainbow trout with initial mean body weight of 50 ± 5 g.
Fish were randomly stocked into eighteen 100 L. fiberglass tanks with 30 fish per tank
and 3 tanks per diet and fed to apparent satiation 3 times a day and 7 days per week for
iii

iv

Abstrak tesis yang dikemukakan kepack Senat Universiti Putra Malaysia sebagai memenuli keperluan untuk ijazah Doktor Falsafah
Penggantian Pelbagai Mil bijikapas Iran bagi Mil Kacang Soya untuk Makanan
Ikan Rainbow Trout (Oncorhynchus mykiss)
Oleh
SHAHRAM DADGAR
Pengerusi: Profesor Che Roos Bin Saad, PhD
Fakulti: Pertanian
Penilaian untuk Pekali Penghadaman Nyata (ADC) bagi pelbagai jenis biji kapas Iran
(CSMP, CSMS dan CSMA) dalam kajian 1 telah dikira dengan penggunaan kromik
oksida (Cr2O3) dalam diet sebagai penanda yang tidak boleh dihadamkan. Kajian 2, 3,
dan 4 telah dijalankan untuk mencari nilai pemakanan bagi setiap jenis mil biji kapas
(CSM) sebagai pengganti kepada mil kacang soya (SBM) dalam perumusan makanan
berkualiti tetapi harga yang rendah bagi ikan trout (Oncorhyncus mykiss). Dalam
kajian ini, enam jenis formulasi makanan mengandungi pelbagai tahap CSMP, CSMS,
dan CSMA (0, 20, 40, 60, 80 dan 100%) menggantikan kandungan SBM dan diberi
makan kepada 540 ekor ikan trout yang mempunya min berat badan 50+5 g. Ikan–
ikan dimasukkan secara rawak kedalam 18 tangki (100 L) fiber, setiap tangki
mengandungi 30 ekor ikan dan setiap formulasi makanan disediakankan untuk 3
tangki dan ikan diberikan makan 3 kali sehari setiap hari selama 60 hari. ADC untuk
CSMP, CSMS, CSMA dan SBM dikirakan. Selepas 8 minggu kajian, purata
pertambahan berat badan, nisbah pertukaran makanan (FCR) untuk ikan yang
diberikan 6 jenis makanan dikirakan. Bagi setiap rawatan, peratus kemandirian adalah
v

melebihi 98%. Nilai ADC bagi CSMP, CSMS, dan CSMA adalah berbeza dari SBM.
Pertambahan berat badan dan peratus kemandirian adalah tidak bererti (P>0.05) bagi
kumpulan ikan yang diberi makanan CSMP jika dibandingkan dengan ikan yang
menerima makanan kawalan, tetapi perbezaan FCR, nisbah pertumbuhan spesifik
(SGR), dan pertambahan berat badan harian (DWG) adalah bererti antara ikan yang
mendapat pelbagai diet (P<0.05). Dalam kajian kesesuian, penggantian sepenuhnya
SBM oleh CSMP dan penggantian separa SBM dengan CSMS dan 20% CSMA
menunjukkan ianya lebih menguntungkan dan berasaskan analisis gossypol dan
jumlah gossypol menunjukkan ianya tidak memberi kesan keracunan keatas hati ikan
oleh semua jenis bijikapas Iran (CSMP, CSMS dan CSMA).
vi

Acknowledgements
I would like to express my deep appreciation to Assoc. Prof. Dr. Che Roos Bin Saad,
the chairman of my supervisory committee, for providing me with a wonderful
opportunity to complete my doctorial studies under his guidance. This work would not
have been possible without his help, constant encouragement and more than anything
else, his friendship during my entire stay in Malaysia. In addition to his support in the
academic area, Dr. Che Roos also enabled me to gain valuable knowledge on the
diverse culture and splendid natural beauty of Malaysia and Malaysian society.
My sincere appreciation goes to Professor Dr. Abdul Razak Alimon , Mohd. Salleh
Kamarudin and Associate Professor Dr. Mahmoud Nafisi, members of my
Supervisory committee, for their extraordinary help and devotion on guidance and
correction of my thesis.
I would also like to thank Iranian Fisheries Research Organization (IFRO) for their
partial financial support; the staffs of Cold Water Fishes Research Center in
Tonekabon-Iran specially; Mr. Rezaikhah, Mr. Bahramian, Mr. Aghaie and Mr.
Farzanfar; Mr. Akbar for his valuable assistance; Dr. Alijanpour, Dr. Alizade, and Mr.
Sarshar for their critical reviews, helpful comments and suggestions; Dr. Siamak
Yoosefi, Dr. Motalebi, Dr. Sharif Rohani and Mr. Seyed Meisam Mazaheri for their
help and friendship. Moreover, I deeply thank anybody who has helped me with
continuing my study, from the first day of school until now. The last but not the least,
I owe thanks to my family for their never-ending support.
vii
I certify that an Examination Committee has met on 16 June 2009 to conduct the final examination of Shahram Dadgar on his degree thesis entitled “Iranian Cottonseed Meal Varieties as a Substitute for Soybean Meal in Rainbow Trout (Oncorhynchus mykiss) Feeds“in accordance with Universiti Pertanian Malaysia (Higher Degree) Act 1980 and Universiti Pertanian Malaysia (Higher Degree) Regulations 1981. The Committee recommends that the candidate be awarded the relevant degree. Members of the Examination Committee are as follows:
Chairman, PhD
Professor Madya Dr.Aziz Arshad Faculty of Agriculture Universiti Putra Malaysia (Chairman)
Examiner 1, PhD Professor Madya Dr. Sharr Azni Harmin Faculty of Agriculture Universiti Putra Malaysia (Internal Examiner)
Examiner 2, PhD Dr. Mustafa Kamal Abd. Satar Faculty of Agriculture Universiti Putra Malaysia (Internal Examiner)
External 1, PhD Professor Dr. Roshada Hashim Dekan Institut Pengajian Siswazah Universiti Sains Malaysia (External Examiner)
Bujang Kim Huat, PhD Professor/Deputy Dean
School of Graduate Studies Universiti Putra Malaysia
Date:
viii

This thesis submitted to the Senate of Universiti Putra Malaysia and has been accepted as fulfilment of the requirement for the degree of Doctor of Philosophy. The members of the Supervisory Committee were as follows:
Che Roos Bin Saad, PhD
Associated Professor Faculty of Agriculture Universiti Putra Malaysia (Chairman)
Abdul Razak Alimon, PhD
Professor Faculty of Agriculture Universiti Putra Malaysia (Member)
Mohd. Salleh Kamarudin, PhD
Associated Professor Faculty of Agriculture Universiti Putra Malaysia (Member)
HASANAH MOHD. GHAZALI, PhD Professor/Dean School of Graduate Studies Universiti Putra Malaysia
Date: 16 October 2009
ix
x
Declaration
I hereby declare that the thesis is based on my original work except for quotations and citation which have been duly acknowledged. I also declare that it has not been previously or concurrently submitted for any other degree at UPM or other institutions.
SHAHRAM DADGAR Date: 22 July 2008

TABLE OF CONTENTS
Page
DEDICATION ii ABSTRACT iii ABSTRAK v ACKNOWLEDGEMENTS vii APPROVAL viii DECLARATION x LIST OF TABLES xiv LIST OF FIGURES xvi LIST OF ABBREVIATIONS xix CHAPTER 1 1 Introduction 1
1.1 Background of study 1 1.2 Statement of problem 3 1.3 Significance of study 5 1.4 Objectives of the study 6
CHAPTER 2 7 Literature Review 7
2.1 Rainbow trout (Oncorhynchus mykiss) 7
2.2 Rainbow trout culture in Iran 11
2.3 Environmental requirements 13 2.3.1 Temperature 13 2.3.2 Oxygen 14 2.3.3 Salinity 14 2.3.4 pH 15 2.3.5 Water quality requirement 15 2.3.6 Feeding rate 17
2.4 Nutrition of Salmonids 17 2.4.1 Protein and amino acids requirements of rainbow trout 18
2.5 Cottonseed meal (CSM) 21
2.6 Gossypol 26
xi

CHAPTER 3 29 General Methodology 29
3.1 Location of study 29
3.2 Preparation of tanks 30
3.3 Proximate analyses 31 3.3.1 Determination of dry matter (DM) 31 3.3.2 Determination of crude protein (CP) 32 3.3.3 Determination of crude fat 32 3.3.4 Determination of crude fiber 33 3.3.5 Determination of Ash 34 3.3.6 Gross energy determination 34
3.4 Extraction of oil from cottonseed 35
3.5 Water quality monitoring 35
3.6 Feed Preparation 35
3.7 Apparent protein and dry matter digestibility 36
3.8 Determination of Chromic oxide (Cr2O3) 36
3.9 Determination of Gossypol 37
3.10 Calculations of the growth and feed utilization parameters 39
3.11 Experimental design 40
3.12 Data collection 40
3.13 Statistical analyses 40 CHAPTER 4 42 Nutritional Value of Cottonseed Meal Varieties, Soybean Meal and other ingridients
4.1 Introduction 42
4.2 Materials and methods 43 4.2.1 Determination of proximate composition 43 4.2.2 Digestibility study 43
4.4 Results 46 4.4.1 Free and total gossypol contents 47 4.4.2 Proximate composition content of the test diets 47 4.4.3 Apparent protein digestibility 48
4.5 Discussion 49 CHAPTER 5 51 The Effect of Substituting SBM with Different Iranian Varieties of CSM on Growth and Feed Utilization of the Rainbow Trout (Oncorhynchus mykiss) 51
5.1 Introduction 51
xii
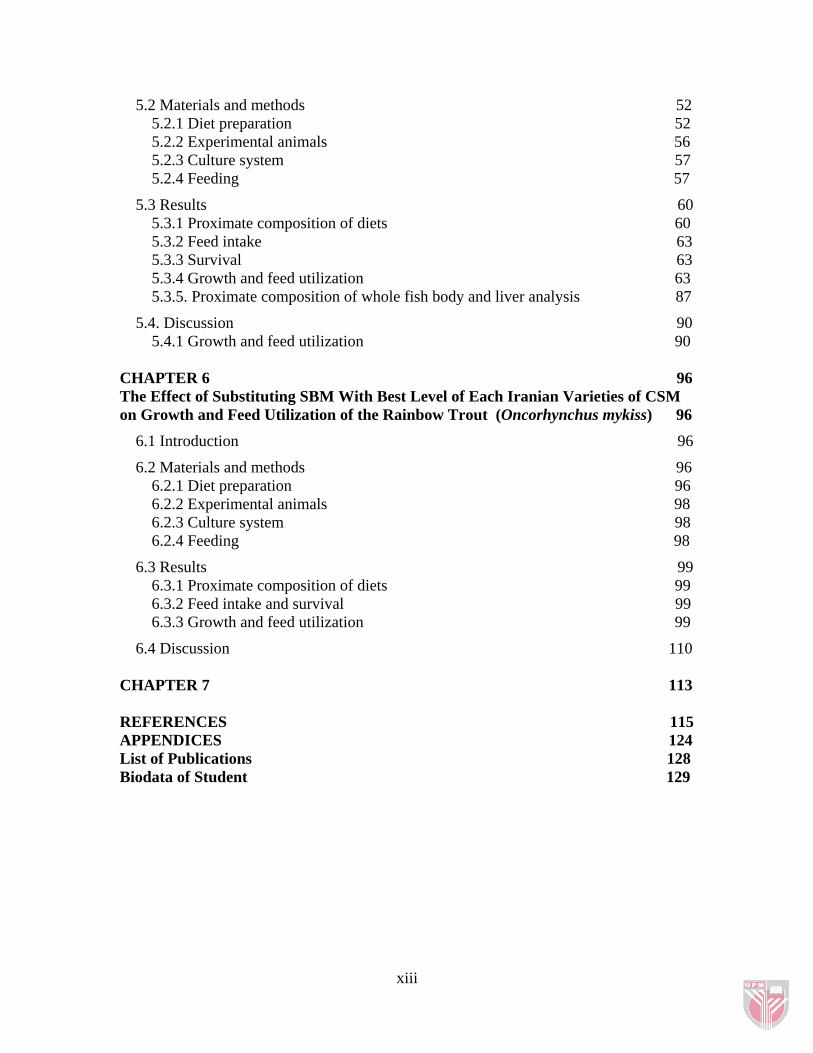
5.2 Materials and methods 52 5.2.1 Diet preparation 52 5.2.2 Experimental animals 56 5.2.3 Culture system 57 5.2.4 Feeding 57
5.3 Results 60 5.3.1 Proximate composition of diets 60 5.3.2 Feed intake 63 5.3.3 Survival 63 5.3.4 Growth and feed utilization 63 5.3.5. Proximate composition of whole fish body and liver analysis 87
5.4. Discussion 90 5.4.1 Growth and feed utilization 90
CHAPTER 6 96 The Effect of Substituting SBM With Best Level of Each Iranian Varieties of CSM on Growth and Feed Utilization of the Rainbow Trout (Oncorhynchus mykiss) 96
6.1 Introduction 96
6.2 Materials and methods 96 6.2.1 Diet preparation 96 6.2.2 Experimental animals 98 6.2.3 Culture system 98 6.2.4 Feeding 98
6.3 Results 99 6.3.1 Proximate composition of diets 99 6.3.2 Feed intake and survival 99 6.3.3 Growth and feed utilization 99
6.4 Discussion 110 CHAPTER 7 113 REFERENCES 115 APPENDICES 124 List of Publications 128 Biodata of Student 129
xiii
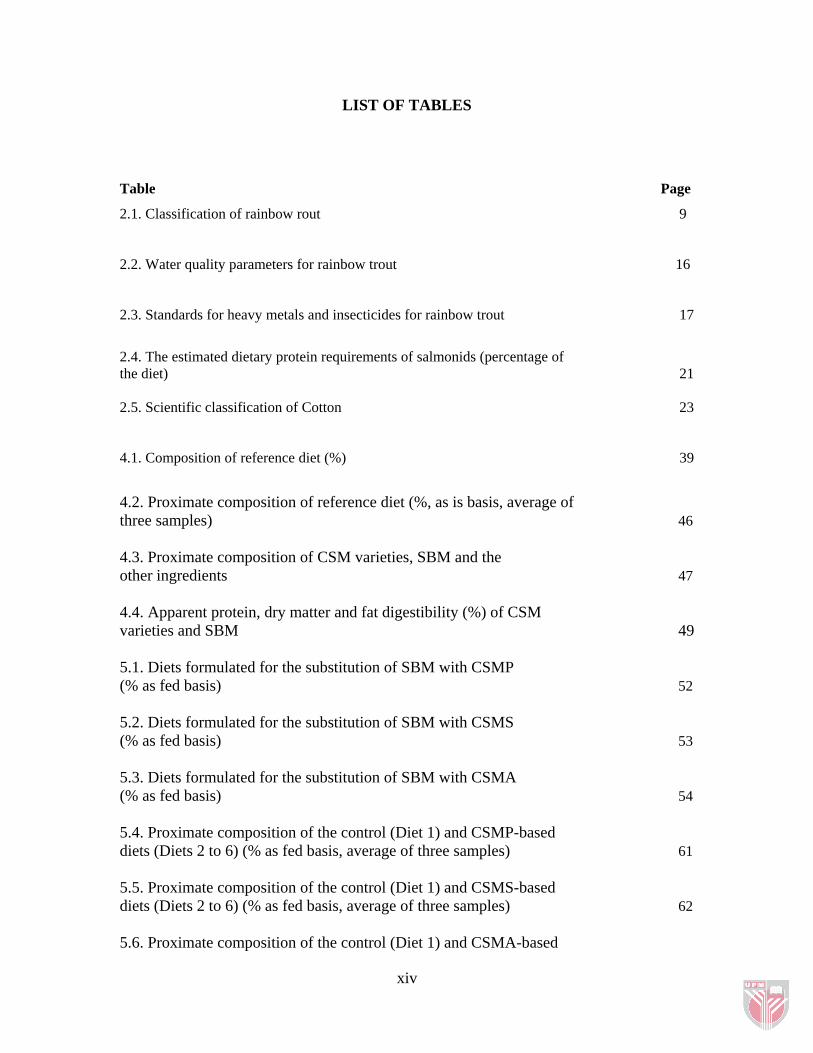
LIST OF TABLES
Table Page
2.1. Classification of rainbow rout 9
2.2. Water quality parameters for rainbow trout 16
2.3. Standards for heavy metals and insecticides for rainbow trout 17
2.4. The estimated dietary protein requirements of salmonids (percentage of the diet) 21 2.5. Scientific classification of Cotton 23
4.1. Composition of reference diet (%) 39
4.2. Proximate composition of reference diet (%, as is basis, average of three samples) 46 4.3. Proximate composition of CSM varieties, SBM and the other ingredients 47 4.4. Apparent protein, dry matter and fat digestibility (%) of CSM varieties and SBM 49 5.1. Diets formulated for the substitution of SBM with CSMP (% as fed basis) 52 5.2. Diets formulated for the substitution of SBM with CSMS (% as fed basis) 53 5.3. Diets formulated for the substitution of SBM with CSMA (% as fed basis) 54 5.4. Proximate composition of the control (Diet 1) and CSMP-based diets (Diets 2 to 6) (% as fed basis, average of three samples) 61 5.5. Proximate composition of the control (Diet 1) and CSMS-based diets (Diets 2 to 6) (% as fed basis, average of three samples) 62 5.6. Proximate composition of the control (Diet 1) and CSMA-based
xiv

diets (Diets 2 to 6) (% as fed basis, average of three samples) 63 5.7. Average initial weight, final weight, weight gain, total length, FCR, SGR, PER, DWG, PWG, CF and survival percentage for rainbow trout fed with different CSMP-based diets for a period of 8 weeks 65 5.8. Average initial weight, final weight, weight gain, total length, FCR, SGR, PER, DWG, PWG, CF and survival percentage for rainbow trout fed with different CSMS-based diets for a period of 8 weeks 74 5.9. Average initial weight, final weight, weight gain, total length, FCR, SGR, PER, DWG, PWG, CF and survival percentage for rainbow trout fed different diets for 2 months 82 5.10: Proximate composition of whole fish body (%, as net weight basis) 91 5.11. Proximate composition of whole fish body (%, as net weight basis) 91 5.12. Chemical analysis of whole fish body (%, as net weight basis) 92 6.1. Diets formulated for the substitution of SBM with the best levels of CSM varieties (% as fed basis) 98 6.2. Proximate composition of diets (% as fed basis, average of three samples) 101 6.3. Average initial weight, final weight, weight gain, total length, FCR, SGR, PER, DWG, PWG, CF and survival percentage for rainbow trout fed with different diets for a period of 8 weeks 102 6.4. Proximate composition of whole fish body (%, as net weight basis) 110
xv

LIST OF FIGURES
Figure Page 2.1. A picture showing a Rainbow trout (Oncorhynchus mykiss) 8 2.2. The map of Iran showing major rainbow trout producing region 12 2.3. A diagram showing the chemical structure of Gossypol 22 3.1. The map indicates the location of the study in the North of Iran 25 3.2. The fiberglass tank used for studying the effect of SBM substitution by different Iranian CSM varieties 26 4.1. The experimental pellets for digestibility study with Chromic oxide 39 4.2. A typical arrangement for flow-through digestibility tank 40 5.1. CSM varieties (from left to right): CSMP, CSMS, and CSMA 55 5.2. The eighteen fiberglass tanks used for each experiment 57 5.3. The method used for the measurement of the total length of fish 57 5.4 Fish from each treatment were sacrificed and pooled for body composition and liver analysis 58 5.5. Liver sample of sacrificed fish for gossypol analysis 59 5.6. Relationship between fish final weight and CSMP-based diets 66 5.7. Relationship between fish total length and CSMP-based diets 67 5.8. Relationship between FCR and CSMP-based diets 68 5.9. Relationship between SGR and CSMP-based diets 69 5.10. Relationship between PER and CSMP-based diets 70 5.11. Relationship between DWG and CSMP-based diets 71 5.12. Relationship between PWG and CSMP-based diets 72
xvi

5.13. Relationship between CF and CSMP-based diets 73 5.14. Relationship between fish final weight and CSMS-based diets 75 5.15. Relationship between fish total length and CSMS-based diets 76 5.16. Relationship between FCR and CSMS-based diets 77 5.17. Relationship between SGR and CSMS-based diets 78 5.18. Relationship between PER and CSMS-based diets 79 5.19. Relationship between DWG and CSMS-based diets 80 5. 20. Relationship between PWG and CSMS-based diets 80 5.21. Relationship between CF and CSMS-based diets 81 5.22. Relationship between fish final weight and CSMA-based diets 83 5.23. Relationship between fish total length and CSMA-based diets 84 5.24. Relationship between FCR and CSMA-based diets 85 5.25. Relationship between SGR and CSMA-based diets 86 5.26. Relationship between PER and CSMA-based diets 87 5.27. Relationship between DWG and CSMA-based diets 88 5.28. Relationship between PWG and CSMA-based diets 88 5.29. Relationship between CF and CSMA-based diets 89 6.1. Relationship between fish final weight and different diets 93 6.2. Relationship between fish total length and different diets 94 6.3. Relationship between FCR and different diets 95 6.4. Relationship between SGR and different diets 96 6.5. Relationship between PER and different diets 97 6.6. Relationship between DWG and different diets 98
xvii

6.7. Relationship between PWG and different diets 98 6.8. Relationship between CF and different diets 99
xviii

List of Abbreviations
ADC Apparent Digestibility Coefficient
ANFs Anti-Nutritional Factors
AOAC Association of Official Analytical Chemists
AOCS American Oil Chemists Society
APD Apparent Protein Digestibility
CF Condition Factor
CP Crude Protein
CRD Completely Randomized Design
CSM Cottonseed Meal
CSMA Cottonseed Meal Akra
CSMP Cottonseed Meal Pak
CSMS Cottonseed Meal Sahel
DWG Daily Weight Gain
FAO Food and Agriculture Organization
FCR Feed Conversion Ratio
FG Free Gossypol
FM Fish Meal
GE Gross Energy
NAS National Academy of Sciences
NRC National Research Council
PER Protein Efficiency Ratio
PWG Percent Weight Gain
xix

xx
SBM Soybean Meal
SE Standard Error
SGR Specific Growth Rate
SBM Soy Bean Meal
TG Total Gossypol
WG Weight gain
CHAPTER 1
Introduction
1.1 Background of study
Fish is a cheap source of high quality animal protein in many developing
countries. According to FAO (1997), annual human demand for food fish will increase to
about 110 million tonnes by the year 2010. Consequently, total world fish production by
fisheries and aquaculture will remain very important for global food security. Today,
more attention is given to fish farming because of the fact that on one hand the capture
fisheries have long dominated the fisheries sector and over-fishing due to improper
fisheries management led to lower production, although it is believed that potential exists
in a few cases for further expansion of capture fisheries. In general, it has been
recognized that there are upward limits to further expansion of capture fisheries and for
this reason, attention has increasingly focused on the possibilities of fish farming.
World aquaculture production, including aquatic plants, reached 45.7 million tonnes by
weight and 56.5 billion USD by value in 2000 (FAO, 2002). Global aquaculture
production in 2001 showed a further increase to 48.2 million tonnes with a value of 60.9
billion USD. According to FAO (2002), total fish production reached its peak of 12.8
million tonnes in 2001; aquaculture contributes 37.5 million tonnes. Asia is by far the
most important continent for aquaculture activity with Iran having a very basic role in

2
this matter. FAO (2006) reported that Iran was the sixth country among the top ten
producers in terms of growth between the years 2002 and 2004.
In Asia and the Pacific region, aquaculture production in China and Southeast
Asian countries primarily consists of cyprinids, whiles the rest of East Asian countries
such as Japan, are mostly dependant on high-value marine fish. In global terms, some
99.8% of cultured aquatic plants, 97.5% of cyprinids, 87.4% of penaeids and 93.4% of
oysters come from Asia and the Pacific. Meanwhile, 55.6% of the world’s farmed
salmonids is produced by Western Europe, mainly the northern part of the continent.
However, carps dominate in the Central and Eastern European regions, both in quantity
and in value. Generally, in developing countries, or “The Third World”, where the
problem of overpopulation is critical, it is believed that fish farming can offer one of the
solutions for the ever-increasing food (protein) crisis (FAO, 1997; FAO, 2001).
Aquaculture contribution to global supply of fish increased from 3.9% of total
production by weight in 1970 to 27.1% in 2000 and 32.4% in 2004.
It provided 20% of global fisheries production (and 29% of food fish) in 1996, and
increased to 29.1% of global fisheries production in 2001(FAO, 2002). The share of
aquaculture in the total world food fish production is set to increase from 29.1% in 2001
to 38% by the year 2010. According to FAO (1998), aquaculture output grew
dramatically during the millennium while capture fisheries production registered a slight
increase. In fact, aquaculture has become the fastest growing food production sector of
the world, with an average annual increase of about 9.2% since 1970, compared to

3
capture fisheries with only 1.4% and 2.8% for terrestrial farmed meat production systems
(FAO, 2002). Most of the world aquaculture production is carried out predominantly by
low-income food-deficit countries (FAO, 1998).
1.2 Statement of problem
It is generally believed that a proportional increase in the production of fish feeds
or aquafeeds is required to increase fish farming practices and consequently aquaculture
production in developing countries. Aquafeed production is currently one of the fastest
expanding agricultural industries of the world with a fast annual growth of 4.5 million
tonnes in 1999 to 16.8 million tonnes in 2000 (FAO, 2002). The major bulk of
commercial quafeed, especially protein, comes from fishmeal (FM) and soybean meal
(SBM). In fact, almost one third of the 122 million tonnes of fish harvested in the year
1997 were used for fishmeal or fish oil production to be used as an animal protein source
in producing animal feeds, including quafeed (FAO, 1998). From the total global
production of fishmeal in 1996, two million tonnes were used in aquaculture, with
18.85% and 10.9% of them used for salmon and trout production respectively. FAO
(1999), estimate that about 40 percent of the total quafeed production is used for
carnivorous finfish species.
Soybean (SB) is the main plant protein source in rainbow trout diets but it has its
own drawbacks such as its increasing price in Iran (Iranian Agriculture Ministry, 2004).
Moreover, since the sugars inherently present in soybeans are water-soluble, some of
4
these sugars will naturally dissolve into the water before consumed by the fish and thus
contribute to the water pollution. SB production is rather localized in some regions of the
world such as India, China and Indonesia. FAO (2004) reported that the world production
of SB in 1994, 2001, 2002, 2003 and 2004 was 136, 176, 180, 188 and 204 million
tonnes, respectively. In Iran, the total SB consumption is about 2.3 million tonnes per
year (Iranian Agriculture Ministry, 2004) while SB production has decreased from 0.235
in 1994 to 0.135 million tonnes in 2004, which has increased the share of imported SB in
the market and consequently its market price. Besides, apart from fish diet, SB is vastly
used in the domestic animal diets as well which this competition has contributed to the
increased price of SB.
Furthermore, SB is becoming more expensive and difficult to supply in many
developing countries practicing aquaculture. Therefore, the need for alternative protein
sources to replace FM and SBM in aquafeeds is obvious. Consequently, the need for
research that can introduce technologies for producing practical, cheap and readily
available feedstuffs for fish is stressed (FAO, 1997). Hence, it seems that the quest for
low-cost practical fish diet that can enhance the development of semi-intensive
aquaculture is a worthwhile priority.
Given the current very rapid increase in the intensification of fresh water farming
in Asia, intense future competition for limited global supplies of FM and SBM is very
likely. It is predicted that strong demand in Asia for available feed resources will have a