Embed Size (px)
Citation preview
IONICS, INC. and SUBSIDIARIES QUARTERLY REPORT
For the 1st Quarter Ended March 31, 2017
(SEC Form 17-Q)
2
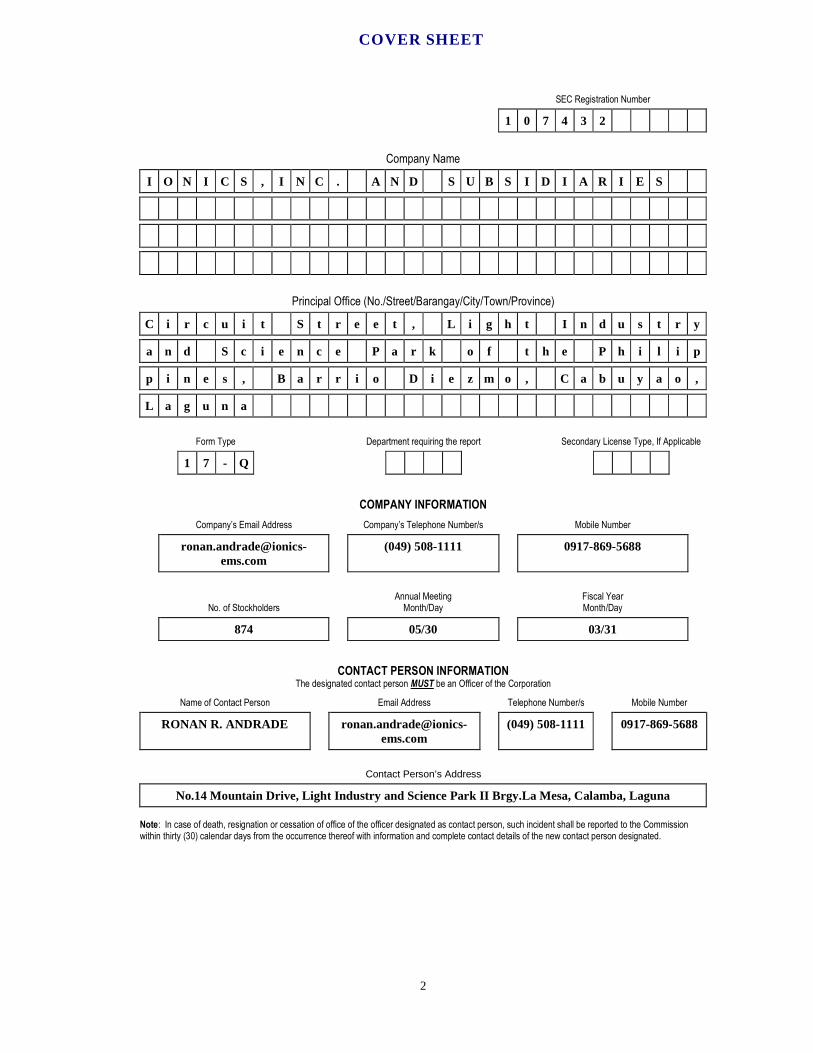
SEC Registration Number
1 0 7 4 3 2
Company Name
I O N I C S , I N C . A N D S U B S I D I A R I E S
Principal Office (No./Street/Barangay/City/Town/Province)
C i r c u i t S t r e e t , L i g h t I n d u s t r y
a n d S c i e n c e P a r k o f t h e P h i l i p
p i n e s , B a r r i o D i e z m o , C a b u y a o ,
L a g u n a
Form Type Department requiring the report Secondary License Type, If Applicable
1 7 - Q
COMPANY INFORMATION
Company’s Email Address Company’s Telephone Number/s Mobile Number
(049) 508-1111 0917-869-5688
No. of Stockholders Annual Meeting
Month/Day Fiscal Year Month/Day
874 05/30 03/31
CONTACT PERSON INFORMATION
The designated contact person MUST be an Officer of the Corporation
Name of Contact Person Email Address Telephone Number/s Mobile Number
RONAN R. ANDRADE [email protected]
(049) 508-1111 0917-869-5688
Contact Person’s Address
No.14 Mountain Drive, Light Industry and Science Park II Brgy.La Mesa, Calamba, Laguna
Note: In case of death, resignation or cessation of office of the officer designated as contact person, such incident shall be reported to the Commission within thirty (30) calendar days from the occurrence thereof with information and complete contact details of the new contact person designated.
COVER SHEET
3
SEC Number: 107432 File Number: ________
IONICS, INC. AND SUBSIDIARIES ________________________________________
(Company’s Full Name)
Circuit Street, Light Industry and Science Park of the Philippines, Barrio Diezmo,Cabuyao, Laguna
________________________________________ (Company’s Address)
(049) 508 - 1111 _________________________________________
(Telephone Number)
March 31, 2017 _________________________________________
(Fiscal Year Ending) (month & day)
Quarterly Interim Condensed Financial Statements (SEC Form 17-Q)
________________________________________________ Form Type
________________________________________________
Amendment Designation (if applicable)
_________________________________________ Period Ended Date
__________________________________________
Secondary License Type and File Number
4
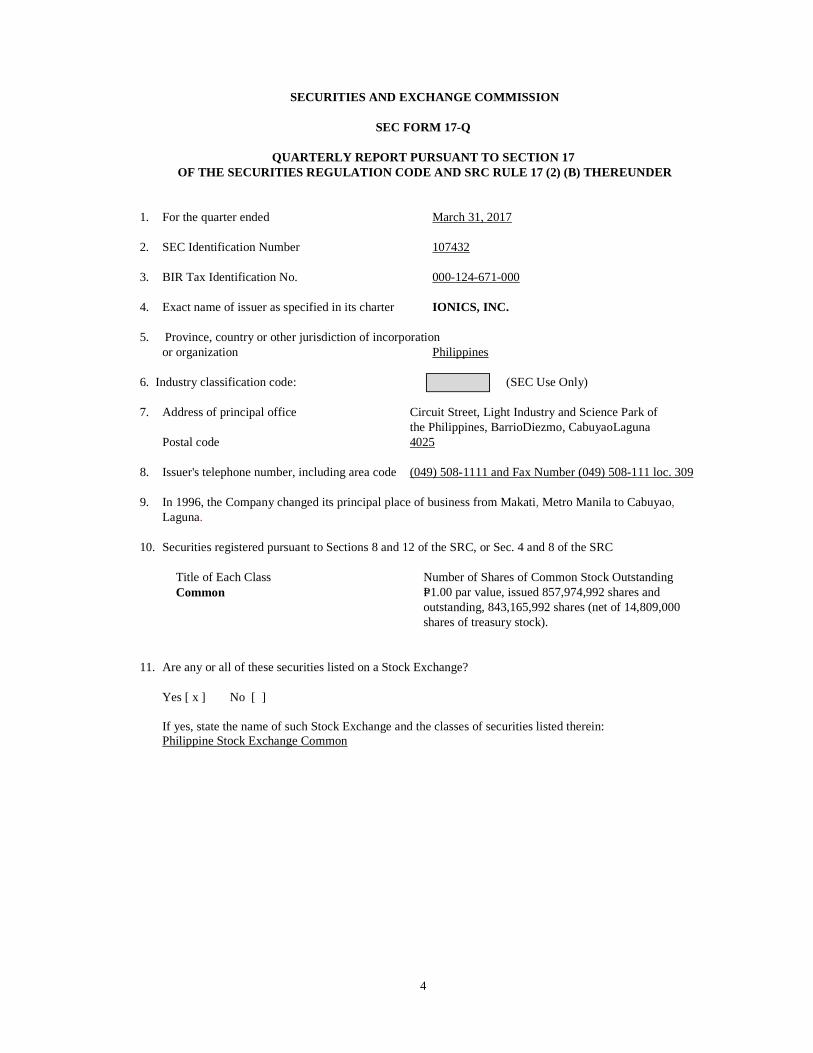
SECURITIES AND EXCHANGE COMMISSION
SEC FORM 17-Q
QUARTERLY REPORT PURSUANT TO SECTION 17 OF THE SECURITIES REGULATION CODE AND SRC RULE 17 (2) (B) THEREUNDER
1. For the quarter ended March 31, 2017
2. SEC Identification Number 107432 3. BIR Tax Identification No. 000-124-671-000 4. Exact name of issuer as specified in its charter IONICS, INC. 5. Province, country or other jurisdiction of incorporation or organization Philippines 6. Industry classification code: (SEC Use Only) 7. Address of principal office Circuit Street, Light Industry and Science Park of
the Philippines, BarrioDiezmo, CabuyaoLaguna Postal code 4025 8. Issuer's telephone number, including area code (049) 508-1111 and Fax Number (049) 508-111 loc. 309 9. In 1996, the Company changed its principal place of business from Makati, Metro Manila to Cabuyao,
Laguna. 10. Securities registered pursuant to Sections 8 and 12 of the SRC, or Sec. 4 and 8 of the SRC
Title of Each Class Number of Shares of Common Stock Outstanding Common P=1.00 par value, issued 857,974,992 shares and
outstanding, 843,165,992 shares (net of 14,809,000 shares of treasury stock).
11. Are any or all of these securities listed on a Stock Exchange? Yes [ x ] No [ ]
If yes, state the name of such Stock Exchange and the classes of securities listed therein: Philippine Stock Exchange Common
5
12. Check whether the issuer:
(a) has filed all reports required to be filed by Section 17 of the SRC and SRC Rule 17 thereunder or Section 11 of the SRC and SRC Rule 11(a)-1 thereunder, and Sections 26 and 141 of The Corporation Code of the Philippines during the preceding twelve (12) months (or for such shorter period that the registrant was required to file such reports);
Yes [ x ] No [ ]
(b) has been subject to such filing requirements for the past ninety (90) days. Yes [ x ] No [ ]

6
PART I – FINANCIAL INFORMATION
ITEM 1.Unaudited Interim Condensed Consolidated Financial Statements
The unaudited interim condensed consolidated financial statements including notes thereto are filed as part of this report (pages 12-33). These unaudited interim condensed consolidated financial statements include the accounts of the Parent Company and its wholly owned subsidiaries, Ionics Properties, Inc. (IPI), Synertronix, Inc. (SI), Ionics Circuits Limited (ICL), Iomni Precision, Inc. (Iomni), Ionics Products Solutions, Inc. (IPSI) and the 97% owned Ionics EMS, Inc. (EMS) and a Subsidiary(EMS-USA). Material intercompany balances have been eliminated in the consolidation.
ITEM 2.Management’s Discussion and Analysis of Financial Condition and Results of Operations Below are the Consolidated Key Financial Ratios for the period ended March 31, 2017 and for the year ended December 31, 2016:
March 31,
2017 December 31,
2016 Revenue Decline (12.09%) (23.01%) Gross Profit Margin 13.43% 13.32% Net Income Margin 4.44% 5.59% Return on Equity 1.14% 6.69% Current Ratio 2.42:1 3.04:1 Leverage Ratio (0.02:1) (0.10:1) Debt to Equity Ratio 0.45:1 0.37:1 Asset to Equity Ratio 1.45:1 1.37:1 Interest Rate Coverage Ratio 22.37:1 25.62:1
1. Revenue Growth
Revenue growth is computed from current revenue less revenue of the prior period divided by revenue of the prior period. The result is expressed in percentage.
2. Gross Profit Margin
Gross profit margin reflects the management’s policies related to pricing and production efficiency. This is computed by dividing gross profit by the sum of net sales and rental income. The result is expressed in percentage.
3. Net Income Margin
Net income margin is the ratio of the Group’s net income for a given period. This is computed by dividing net income by the sum of net sales and rental income. The result is expressed in percentage.
4. Return on Equity
Return on equity ratio is the ratio of the Group’s net income to equity. This measures the management’s ability to generate returns on their investments. This is computed by dividing net income by total equity.
5. Current Ratio
Current ratio is the ratio of the Group’s current resources and its current obligation. This is computed by dividing current assets by current liabilities.
6. Leverage Ratio
Leverage ratio determines the Group’s cost mix and its effects on the operating income. This is computed by dividing net debt by the sum of total equity and net debt.
7
7. Debt to Equity Ratio The debt to equity ratio is used to measure the Group’s financial standing and ability to repay its obligations.This is computed by dividing total liabilities by equity.
8. Asset to Equity Ratio The asset to equity ratio shows the relationship of the total assets of the Group to the portion owned by shareholders. This indicates the company’s leverage (debt) used to finance the Group. This is computed by dividing total assets by equity.
9. Interest Rate Coverage Ratio Interest coverage ratio is the ratio of the Group’s ability to meet its interest payment. This is computed by dividing the sum of income before income taxes and finance costs by the finance costs.
As of the filing date, the management of the Group is not aware of:
a) any known trends, demands, commitments, events or uncertainties that will have a material impact on the issuer’s liquidity;
b) any events that will trigger direct or contingent financial obligation that is material to the Group, including any default or acceleration of an obligation;
c) all material off-balance sheet transactions, arrangements, obligations (including contingent obligations), and other relationships of the Group with unconsolidated entities or other persons created during the reporting period;
d) any material commitments for capital expenditures, the general purpose of such commitments and the expected sources of funds for such expenditures;
e) any known trends, events or uncertainties that have had or that are reasonably expected to have a material favorable or unfavorable impact on net sales/ revenues/ income from continuing operations;
f) any significant elements of income or loss that did not arise from the issuer’s continuing operations; and
g) any seasonal aspects that had a material effect on the financial condition or results of operations.
The causes for any material change from period to period, which shall include vertical and horizontal analyses of any material item, were disclosed in page number 7 to 10 of this report.
CONSOLIDATED FINANCIAL POSITION As of March 31, 2017, the consolidated assets of the Group amounted to US$61.65 million which is US$3.27 million higher than the US$58.38 million as of December 31, 2016. The increase in the Group’s total assets was due to the increase in inventories, property, plant and equipment and advance payment to suppliers reported under prepayments and other current assets.
Current ratio decreased from 3.04:1 as of December 31, 2016 to 2.42:1 as of March 31, 2016 due to increase in accounts payable and accrued expenses. Likewise, the Group’s debt to equity ratio decreased from 0.45:1 as of December 31, 2016 to 0.37:1 as of March 31, 2017.

8
Below is the summary of Balance Sheet Accounts with more than 5% increase (decrease):
Percentage increase (decrease) March 31, 2017 vs. December 31, 2016 vs December 31, 2016 December 31, 2015 ASSETS Cash and cash equivalents N/A 28 Receivables (12) (19) Inventories 30 (30) Prepayments and other current assets 80 (21) Available-for-sale investments (9) N/A Property, plant and equipment 11 18 Goodwill N/A (100) Deferred tax asset
7 9
LIABILITIES Accounts payable and accrued expenses 46 (35) Advances from customers 8 (20) Bank and finance lease (15) 38 Income tax payable 85 (14) Security deposits N/A (62)
As of March 31, 2017 (03.31.17 vs 12.31.16) The decrease in receivables was due to lower customer demand. Inventories increased due to anticipation of increase in customer order for the next quarter. The increase in prepayments and other current assets was attributable to advance payment made to suppliers. AFS investments decrease due to impairment of investment in Pacific Synergies IV. Property, plant and equipment increased due to additional acquisition of machineries and equipment. Deferred tax assets increase due to tax adjustments. Accounts payable and accrued expenses increased was attributed to the increase in property and equipment and purchases of raw materials. The increase in advances from customer was due to additional advanced payment of customer. Bank loans decreased due to payment made during the period. The increase in income tax was a result of the provisions for income tax set-up for the quarter. As of December 31, 2016 (12.31.16 vs 12.31.15) Cash and cash equivalents increased due to cash flows generated from operations. Decrease in receivables was due to significant collections from customers and lower customer demands. The decreased in inventories was attributable to the decline in the forecasted sales of turnkey accounts which results to lower inventory purchases. Decrease in Prepayments and other current assets was due to decrease in advances to suppliers which are also related to decline in turnkey projects. Property, plant and equipment increased due to additional acquisition of machineries and equipment. Deferred tax asset increase due to tax adjustments. Goodwill decreased due to the impairment loss recognized during the year. Accounts payable and accrued expenses decreased due to controlled purchases in response to lower turnkey projects. Bank and finance lease increased due to availment of equipment loan during the year. Advances from customers decreased due to lower sales volume for the year. The decrease in security deposits was due to reclassification to unearned rent income account.

9
CONSOLIDATED RESULTS OF OPERATIONS The summarized revenues and net income (losses) of the Group for the three months ended March 31, 2017 and 2016 are presented as follows (amounts in US Dollars):
March 31, 2017 (3 months)
March 31, 2016 (3 months)
REVENUE
Operating Expense
NET INCOME (LOSS)*
REVENUE
Operating Expense
NET INCOME (LOSS)* COMPANY Sales
Rent income and
Other income Total Sales
Rent income and Other
income Total Parent − 123,699 123,699 90,214 (5,274) − 111,224 111,224 94,206 (23,830) EMS and a Subsidiary 9,552,375 4,600 9,556,975 609,869 152,558 11,112,664 38,783 11,151,447 614,900 71,005 IPI − 627,612 627,612 26,482 479,859 − 617,937 617,937 15,775 492,226 ICL − 18,424 18,424 139,747 (121,377) − − − 3,569 (28,144) Iomni 768,133 39,961 808,094 48,758 (2,293) 678,662 30,957 709,619 46,351 (51,562) Synertronix − 1 1 520 (519) − 1 1 108 (108) IonicsProducts Solutions, Inc. - 36 36 13,114 (14,234)
− − − − −
TOTAL 10,320,508 814,332 11,134,840 928,704 488,720 11,791,326 798,902 12,590,228 774,909 459,587 Eliminations (48,201) (144,899) (193,100) (43,460) (3,926) (549) (133,233) (133,782) (93,813) (3,578) Consolidated 10,272,307 669,433 10,941,740 885,245 484,794 11,790,777 665,669 12,456,446 681,096 456,009
*Net income (loss) attributable to equity holders of the Parent Company.
The Group’s sales in 2017 decreased by US$1.52 million or by 13% from US$11.79 million for the three months of 2016 to US$10.27 million in the same period of 2017. Despite the decrease in sales, the gross profit increased by US$0.16 million from US$1.32 million in 2016 to US$1.48 million in the same period of 2017.
Operating expenses increased by US$0.20 million from US$0.68 million in 2016 to US$0.88 million in 2017 due to provision for impairment of AFS investments during the period. Finance cost and other expenses decreased by US$0.08 million from US$0.12 million to US$0.04 million.
Group posted an income before income tax of US$0.57 million and US$0.53 million for the three months ended March 31, 2017 and 2016, respectively.
With the foregoing, the Group reported a consolidated net income attributable to equity holders of the Parent Company amounting to US$0.48 million and US$0.46 million for the three months ended March 31, 2017 and 2016, respectively. INDIVIDUAL RESULT OF OPERATIONS Ionics, Inc. The Parent Company reported a net loss of US$0.005 million and US$0.02 million for the three months ended March 31, 2017 and 2016, respectively. There was no dividend income receive during the period.
The individual performances of the subsidiaries for the nine months ended March 31, 2017 are as follows: Ionics EMS, Inc. and a Subsidiary Consistent with the 2016 trend, turnkey sales decreased by US$2.56 million while consignment business increased by US$1.00 million or net decrease of US$1.56 million from US$11.11 million for the three months ended March 31, 2016 to US$9.55 million in the same period of 2017. As a result on increase mix of consignment business, despite the net decrease in the sale the gross profit increased by US$0.03 million from US$0.81 million in 2016 to US$0.84 million in the same period of 2017. Operating expense, finance cost and other expenses decreased by US$0.05 million from US$0.70 million to US$0.65 million. With the foregoing, the Group reported a net income of US$0.15 million for the three months ended March 31, 2017 from a net income of US$0.07 million in the same period of 2016.

10
Ionics Properties, Inc. (IPI)
IPI contributed rent income of US$0.63 million in 2017 and US$0.62 million in 2016. Net income amounted to US$0.48 million and US$0.49 million for the three months ended March 31, 2017 and 2016, respectively. Ionics Circuits, Ltd. (ICL) ICL reported a net loss amounting to US$0.12 million and US$0.03 for the three months ended March 31, 2017 and 2016, respectively. This was due to impairment of investments in Pacific Synergies IV. Synertronix, Inc. (SI) Synertronix’ reported a net loss amounting to US$0.001 million for the three months ended March 31, 2017 and 2016. Iomni Precision, Inc. (Iomni) Iomni’s sales in the first three months of 2017 increased to US$0.77 million from US$0.68 million in 2016 due to increase in customer order. Iomni reported a gross income of US$0.05 million in 2017 as compared to a gross loss of US$0.001 million in 2016. Operating expenses amounted to US$0.05 million in March 31, 2017 and 2016.
With the foregoing, the Company’s performance resulted to a net loss of US$0.002 million and US$0.05 million in 2017 and 2016, respectively. Ionics Products Solutions, Inc. (IPSI) IPSI reported a net loss amounting to US$0.014 million for the three months ended March 31, 2017. ITEM 3. Additional Requirements Financial Soundness Indicator Below are the financial ratios that are relevant to the Group for two comparative periods:
a. Liquidity Ratio
March 31,
2017 December 31,
2016 Currentratio Current ratio 2.42:1 3.04:1 Quick asset ratio 1.59:1 2.22:1 Debt-to-equity ratio 0.45:1 0.37:1 Asset-to-equity ratio 1.45:1 1.37:1
b. Profitability Ratio
March 31,
2017 March 31,
2016 Interest rate coverage ratio 22.37:1 38.00:1 Profitability ratio Gross profit margin 13.43% 10.65% Operating margin 5.32% 5.17% Net income margin 4.44% 3.69% Revenue decline (12.09%) (21.86%)
11
PART II - OTHER INFORMATION As of the period ended March 31, 2017, the Group: a) has not experienced any suspension of its operations; b) has no contract of merger, consolidation or joint venture, contract of management,
licensing, marketing, distributorship or similar agreement was signed; c) has no offering of right, granting of stock options and corresponding plans; and d) has not done any transfer of assets during the quarter.
SIGNATURE
Pursuant to the requirements of the Securities Regulation Code, the issuer has duly caused this report to be signed on its behalf by the undersigned thereunto duly authorized.
ISSUER : IONICS, INC.
__ 05.15.2017____ RONAN R. ANDRADE Date VP - Finance
__05.15.2017____ LAWRENCE C. QUA Date
12
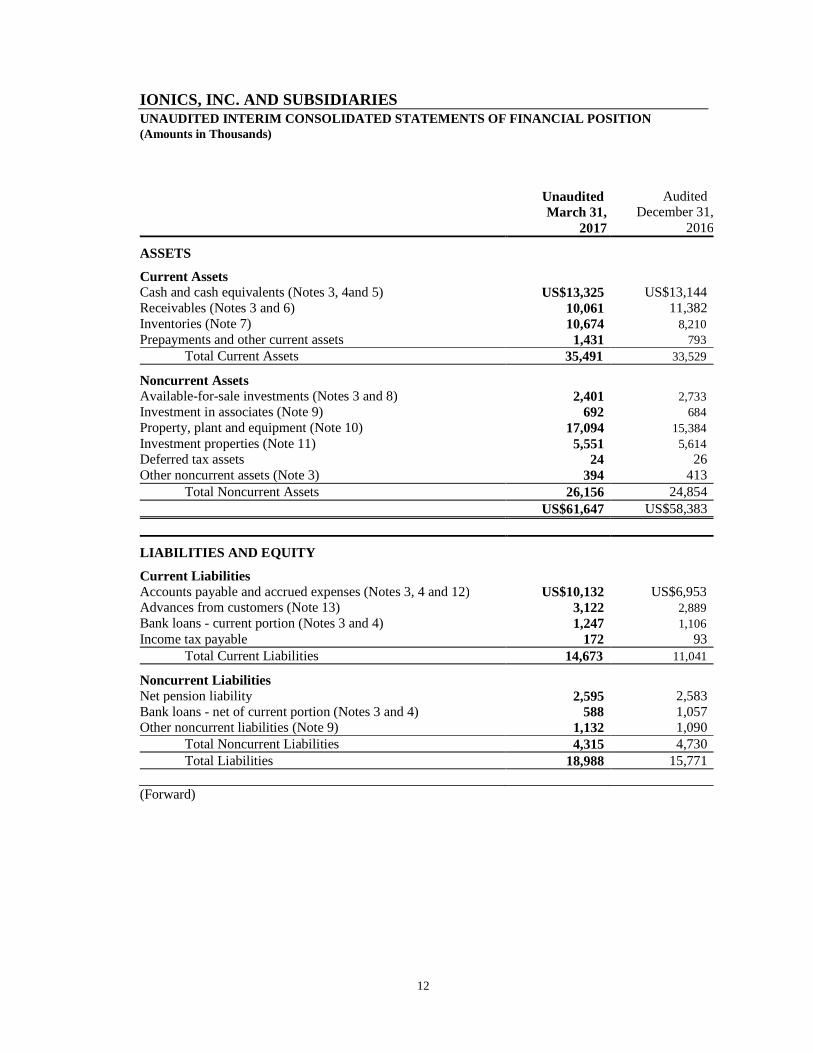
IONICS, INC. AND SUBSIDIARIES UNAUDITED INTERIM CONSOLIDATED STATEMENTS OF FINANC IAL POSITION (Amounts in Thousands)
Unaudited March 31,
2017
Audited December 31,
2016
ASSETS
Current Assets Cash and cash equivalents (Notes 3, 4and 5) US$13,325 US$13,144 Receivables (Notes 3 and 6) 10,061 11,382 Inventories (Note 7) 10,674 8,210 Prepayments and other current assets 1,431 793 Total Current Assets 35,491 33,529
Noncurrent Assets Available-for-sale investments (Notes 3 and 8) 2,401 2,733 Investment in associates (Note 9) 692 684 Property, plant and equipment (Note 10) 17,094 15,384 Investment properties (Note 11) 5,551 5,614 Deferred tax assets 24 26 Other noncurrent assets (Note 3) 394 413 Total Noncurrent Assets 26,156 24,854 US$61,647 US$58,383
LIABILITIES AND EQUITY
Current Liabilities Accounts payable and accrued expenses (Notes 3, 4 and 12) US$10,132 US$6,953 Advances from customers (Note 13) 3,122 2,889 Bank loans - current portion (Notes 3 and 4) 1,247 1,106 Income tax payable 172 93 Total Current Liabilities 14,673 11,041
Noncurrent Liabilities Net pension liability 2,595 2,583 Bank loans - net of current portion (Notes 3 and 4) 588 1,057 Other noncurrent liabilities (Note 9) 1,132 1,090 Total Noncurrent Liabilities 4,315 4,730 Total Liabilities 18,988 15,771
(Forward)
13
IONICS, INC. AND SUBSIDIARIES UNAUDITED INTERIM CONSOLIDATED STATEMENTS OF FINANC IAL POSITION (Amounts in Thousands)
Unaudited March 31,
2017
Audited December 31,
2016
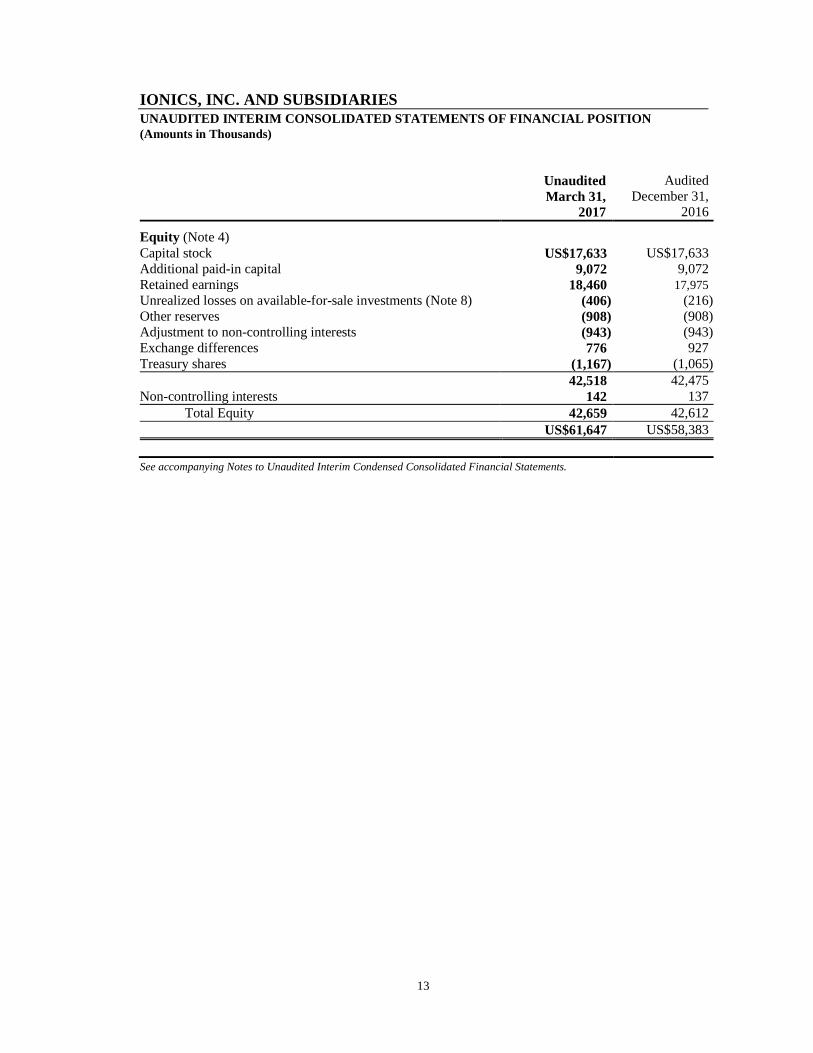
Equity (Note 4) Capital stock US$17,633 US$17,633 Additional paid-in capital 9,072 9,072 Retained earnings 18,460 17,975 Unrealized losses on available-for-sale investments (Note 8) (406) (216) Other reserves (908) (908) Adjustment to non-controlling interests (943) (943) Exchange differences 776 927 Treasury shares (1,167) (1,065) 42,518 42,475 Non-controlling interests 142 137 Total Equity 42,659 42,612 US$61,647 US$58,383 See accompanying Notes to Unaudited Interim Condensed Consolidated Financial Statements.
14
IONICS, INC. AND SUBSIDIARIES UNAUDITED INTERIM CONSOLIDATED STATEMENTS OF COMPRE HENSIVE INCOME (Amounts in Thousands, Except Loss per Share) 2017 2016
January to March
(3 months)
January to March
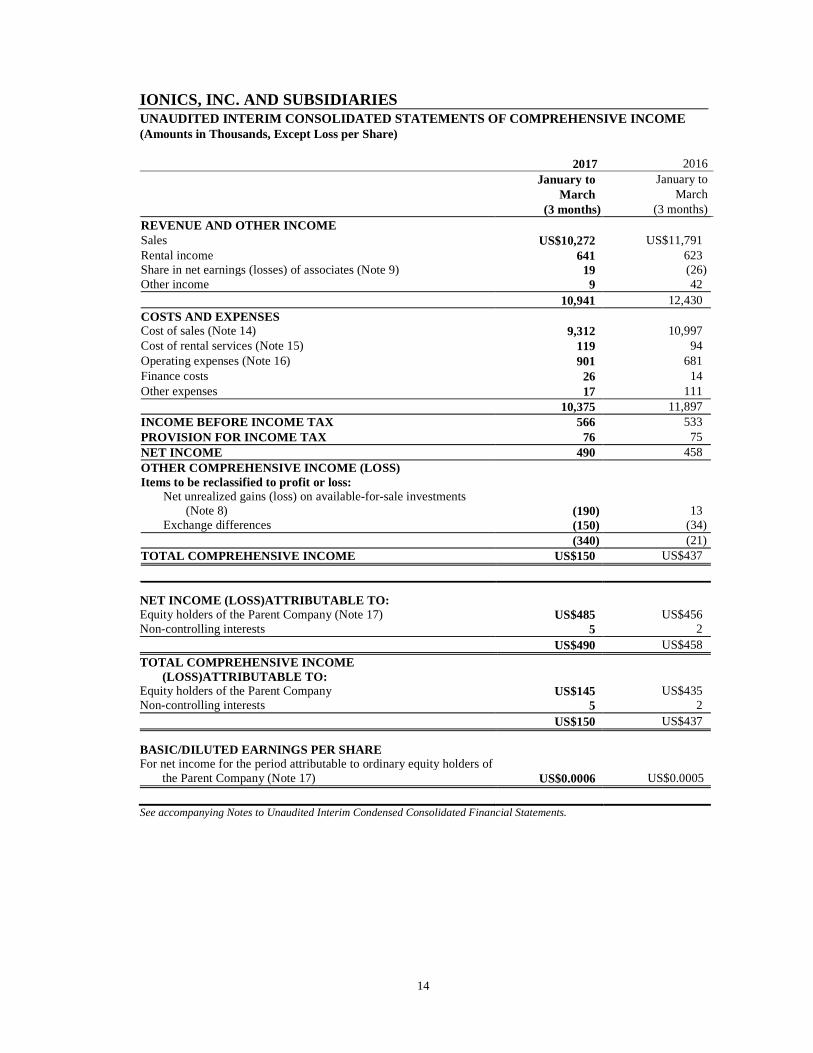
(3 months) REVENUE AND OTHER INCOME Sales US$10,272 US$11,791 Rental income 641 623 Share in net earnings (losses) of associates (Note 9) 19 (26) Other income 9 42 10,941 12,430 COSTS AND EXPENSES Cost of sales (Note 14) 9,312 10,997 Cost of rental services (Note 15) 119 94 Operating expenses (Note 16) 901 681 Finance costs 26 14 Other expenses 17 111 10,375 11,897 INCOME BEFORE INCOME TAX 566 533 PROVISION FOR INCOME TAX 76 75 NET INCOME 490 458 OTHER COMPREHENSIVE INCOME (LOSS) Items to be reclassified to profit or loss: Net unrealized gains (loss) on available-for-sale investments (Note 8) (190) 13 Exchange differences (150) (34) (340) (21) TOTAL COMPREHENSIVE INCOME US$150 US$437
NET INCOME (LOSS)ATTRIBUTABLE TO: Equity holders of the Parent Company (Note 17) US$485 US$456 Non-controlling interests 5 2 US$490 US$458
TOTAL COMPREHENSIVE INCOME (LOSS)ATTRIBUTABLE TO:
Equity holders of the Parent Company US$145 US$435 Non-controlling interests 5 2 US$150 US$437
BASIC/DILUTED EARNINGS PER SHARE For net income for the period attributable to ordinary equity holders of
the Parent Company (Note 17) US$0.0006 US$0.0005
See accompanying Notes to Unaudited Interim Condensed Consolidated Financial Statements.
15
IONICS, INC. AND SUBSIDIARIES UNAUDITED INTERIM CONSOLIDATED STATEMENTS CHANGES I N EQUITY (Amounts in Thousands)
Attributable to the Equity Holders of the Parent Company
Capital
Stock
Additional Paid-in Capital
Retained Earnings
Unrealized Gains/
(Losses) on
Available- for-Sale
Instrument (Note 8)
Other Reserves
Adjustment to Non-
Controlling Interest
Exchange Difference
Treasury Shares Totals
Non- Controlling
Interest Total
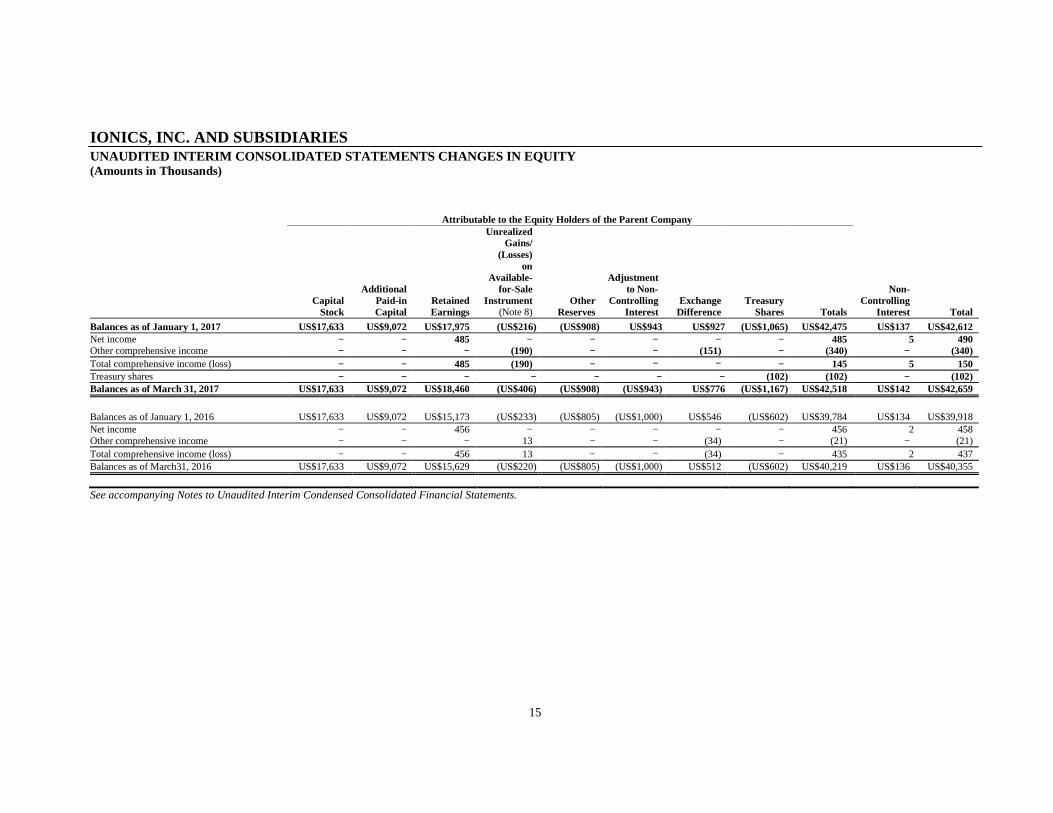
Balances as of January 1, 2017 US$17,633 US$9,072 US$17,975 (US$216) (US$908) US$943 US$927 (US$1,065) US$42,475 US$137 US$42,612 Net income − − 485 − − − − − 485 5 490 Other comprehensive income − − − (190) − − (151) − (340) − (340) Total comprehensive income (loss) − − 485 (190) − − − − 145 5 150 Treasury shares − − − − − − − (102) (102) − (102) Balances as of March 31, 2017 US$17,633 US$9,072 US$18,460 (US$406) (US$908) (US$943) US$776 (US$1,167) US$42,518 US$142 US$42,659 Balances as of January 1, 2016 US$17,633 US$9,072 US$15,173 (US$233) (US$805) (US$1,000) US$546 (US$602) US$39,784 US$134 US$39,918 Net income − − 456 − − − − − 456 2 458 Other comprehensive income − − − 13 − − (34) − (21) − (21) Total comprehensive income (loss) − − 456 13 − − (34) − 435 2 437 Balances as of March31, 2016 US$17,633 US$9,072 US$15,629 (US$220) (US$805) (US$1,000) US$512 (US$602) US$40,219 US$136 US$40,355
See accompanying Notes to Unaudited Interim Condensed Consolidated Financial Statements.
16
IONICS, INC. AND SUBSIDIARIES
UNAUDITED INTERIM CONSOLIDATED STATEMENTS OF CASH F LOWS (Amounts in Thousands)
For the Period Ended March 31 2017 2016
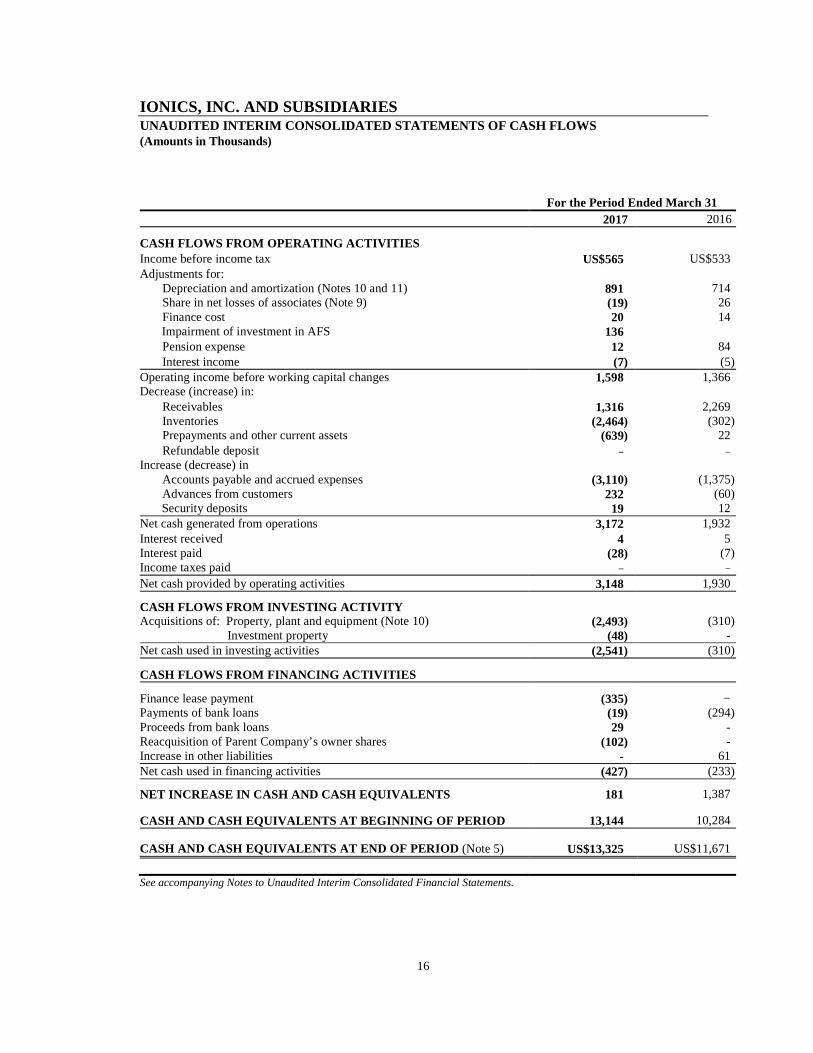
CASH FLOWS FROM OPERATING ACTIVITIES Income before income tax US$565 US$533 Adjustments for: Depreciation and amortization (Notes 10 and 11) 891 714 Share in net losses of associates (Note 9) (19) 26 Finance cost 20 14 Impairment of investment in AFS 136 Pension expense 12 84 Interest income (7) (5) Operating income before working capital changes 1,598 1,366 Decrease (increase) in: Receivables 1,316 2,269 Inventories (2,464) (302) Prepayments and other current assets (639) 22 Refundable deposit − − Increase (decrease) in Accounts payable and accrued expenses (3,110) (1,375) Advances from customers 232 (60) Security deposits 19 12 Net cash generated from operations 3,172 1,932 Interest received 4 5 Interest paid (28) (7) Income taxes paid − − Net cash provided by operating activities 3,148 1,930
CASH FLOWS FROM INVESTING ACTIVITY Acquisitions of: Property, plant and equipment (Note 10) (2,493) (310) Investment property (48) - Net cash used in investing activities (2,541) (310)
CASH FLOWS FROM FINANCING ACTIVITIES
Finance lease payment (335) − Payments of bank loans (19) (294) Proceeds from bank loans 29 - Reacquisition of Parent Company’s owner shares (102) - Increase in other liabilities - 61 Net cash used in financing activities (427) (233)
NET INCREASE IN CASH AND CASH EQUIVALENTS 181 1,387
CASH AND CASH EQUIVALENTS AT BEGINNING OF PERIOD 13 ,144 10,284
CASH AND CASH EQUIVALENTS AT END OF PERIOD (Note 5) US$13,325 US$11,671
See accompanying Notes to Unaudited Interim Consolidated Financial Statements.
17
IONICS, INC. AND SUBSIDIARIES NOTES TO UNAUDITED INTERIM CONDENSED CONSOLIDATED F INANCIAL STATEMENTS (Amounts in Thousands, Except Par Value per Share and Loss per Share) 1. Corporate Information
Ionics, Inc. (the Parent Company) is a domestic corporation incorporated under the laws of the Philippines and registered with the Securities and Exchange Commission (SEC) in September 1982. The Parent Company started commercial operations in July 1987 to engage in electronic manufacturing services business. In September 1999, the Parent Company transferred its primary manufacturing business to a majority owned subsidiary, Ionics EMS, Inc. (EMS), which was subsequently listed in the Singapore Exchange Securities Trading Limited (Singapore Exchange). Consequently, the Parent Company’s primary purpose was amended from a manufacturing company to a holding company. The registered office address of the Group is Circuit Street, Light Industry and Science Park of the Philippines, Barrio Diezmo, Cabuyao, Laguna.
The Parent Company is listed in the Philippine Stock Exchange. The unaudited interim consolidated financial statements were approved and authorized for issue by the Board of Directors (BOD) on May 10, 2017.
2. Summary of Significant Accounting Policies
Basis of Preparation The unaudited interim condensed consolidated financial statements of the Group have been prepared in accordance with Philippine Accounting Standards (PAS) 34, Interim Financial Reporting.
The unaudited interim consolidated financial statements do not include all the information and disclosures required in the annual financial statements, and should be read in conjunction with the Group’s annual financial statements as at December 31, 2016.
The unaudited interim condensed consolidated financial statements are presented in United States (US) Dollar, which is also the Group’s functional currency. All values are rounded to the nearest thousand (US$000) except when otherwise indicated.
18
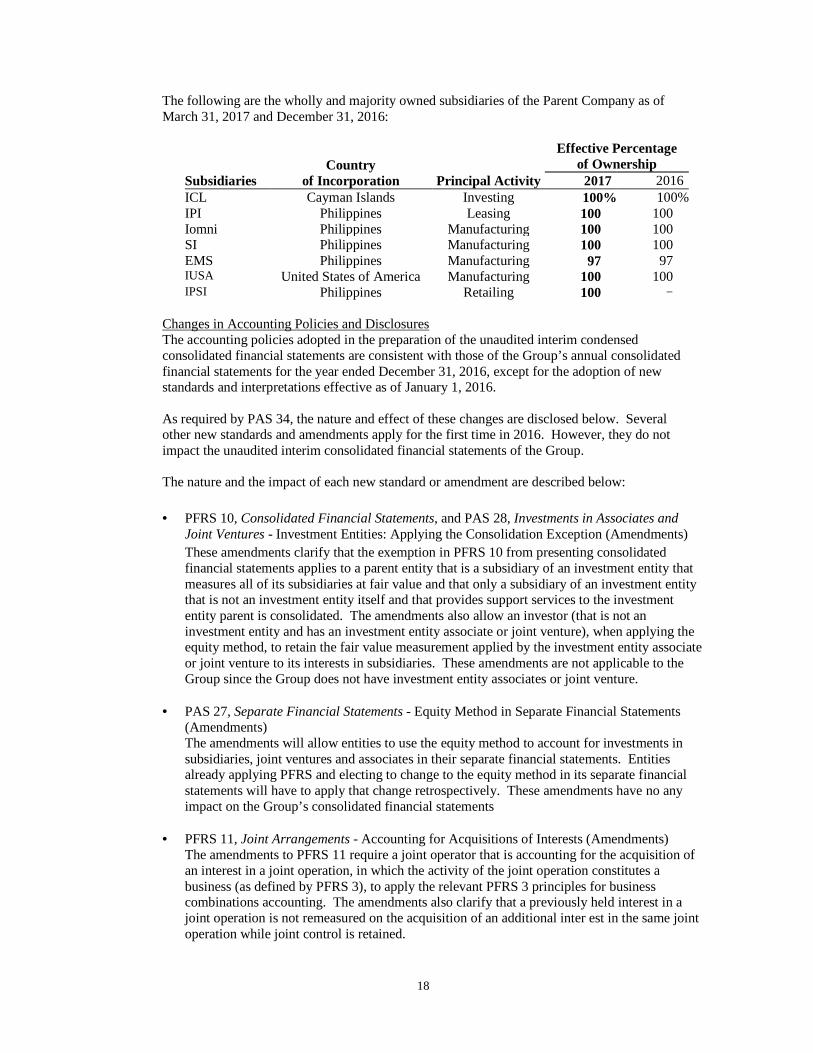
The following are the wholly and majority owned subsidiaries of the Parent Company as of March 31, 2017 and December 31, 2016:
Subsidiaries Country
of Incorporation Principal Activity
Effective Percentage of Ownership 2017 2016
ICL Cayman Islands Investing 100% 100%IPI Philippines Leasing 100 100 Iomni Philippines Manufacturing 100 100 SI Philippines Manufacturing 100 100 EMS Philippines Manufacturing 97 97 IUSA United States of America Manufacturing 100 100 IPSI Philippines Retailing 100 −
Changes in Accounting Policies and Disclosures The accounting policies adopted in the preparation of the unaudited interim condensed consolidated financial statements are consistent with those of the Group’s annual consolidated financial statements for the year ended December 31, 2016, except for the adoption of new standards and interpretations effective as of January 1, 2016. As required by PAS 34, the nature and effect of these changes are disclosed below. Several other new standards and amendments apply for the first time in 2016. However, they do not impact the unaudited interim consolidated financial statements of the Group. The nature and the impact of each new standard or amendment are described below:
• PFRS 10, Consolidated Financial Statements, and PAS 28, Investments in Associates and
Joint Ventures - Investment Entities: Applying the Consolidation Exception (Amendments)
These amendments clarify that the exemption in PFRS 10 from presenting consolidated financial statements applies to a parent entity that is a subsidiary of an investment entity that measures all of its subsidiaries at fair value and that only a subsidiary of an investment entity that is not an investment entity itself and that provides support services to the investment entity parent is consolidated. The amendments also allow an investor (that is not an investment entity and has an investment entity associate or joint venture), when applying the equity method, to retain the fair value measurement applied by the investment entity associate or joint venture to its interests in subsidiaries. These amendments are not applicable to the Group since the Group does not have investment entity associates or joint venture.
• PAS 27, Separate Financial Statements - Equity Method in Separate Financial Statements (Amendments) The amendments will allow entities to use the equity method to account for investments in subsidiaries, joint ventures and associates in their separate financial statements. Entities already applying PFRS and electing to change to the equity method in its separate financial statements will have to apply that change retrospectively. These amendments have no any impact on the Group’s consolidated financial statements
• PFRS 11, Joint Arrangements - Accounting for Acquisitions of Interests (Amendments) The amendments to PFRS 11 require a joint operator that is accounting for the acquisition of an interest in a joint operation, in which the activity of the joint operation constitutes a business (as defined by PFRS 3), to apply the relevant PFRS 3 principles for business combinations accounting. The amendments also clarify that a previously held interest in a joint operation is not remeasured on the acquisition of an additional inter est in the same joint operation while joint control is retained.
19
In addition, a scope exclusion has been added to PFRS 11 to specify that the amendments do not apply when the parties sharing joint control, including the reporting entity, are under common control of the same ultimate controlling party. The amendments apply to both the acquisition of the initial interest in a joint operation and the acquisition of any additional interests in the same joint operation. These amendments did not have any impact to the Group.
• PAS 1, Presentation of Financial Statements - Disclosure Initiative (Amendments) The amendments are intended to assist entities in applying judgment when meeting the presentation and disclosure requirements in PFRS. They clarify the following: a. That entities shall not reduce the understandability of their financial statements by either
obscuring material information with immaterial information; or aggregating material items that have different natures or functions
b. That specific line items in the statement of income and OCI and the statement of financial position may be disaggregated
c. That entities have flexibility as to the order in which they present the notes to financial statements
d. That the share of OCI of associates and joint ventures accounted for using the equity method must be presented in aggregate as a single line item, and classified between those items that will or will not be subsequently reclassified to profit or loss.
These amendments have no significant impact to the Group’s consolidated financial statements.
• PAS 16, Property, Plant and Equipment, and PAS 38, Intangible Assets - Clarification of Acceptable Methods of Depreciation and Amortization (Amendments) The amendments clarify the principle in PAS 16 and PAS 38 that revenue reflects a pattern of economic benefits that are generated from operating a business (of which the asset is part) rather than the economic benefits that are consumed through use of the asset. As a result, a revenue-based method cannot be used to depreciate property, plant and equipment and may only be used in very limited circumstances to amortize intangible assets. These amendments have no impact to the Group given that the Group has not used a revenue-based method to depreciate its non-current assets.
Annual Improvements to PFRSs (2012-2014 cycle)
The Annual Improvements to PFRSs (2012-2014 cycle) are effective for annual periods beginning on or after January 1, 2016 and did not have any material impact on the Group. They include:
• PFRS 5, Non-current Assets Held for Sale and Discontinued Operations – Changes in Methods of Disposal
• PFRS 7, Financial Instruments: Disclosures - Servicing Contracts • PFRS 7 - Applicability of the Amendments to PFRS 7 to Condensed Interim Financial
Statements • PAS 19, Employee Benefits - regional market issue regarding discount rate • PAS 34, Interim Financial Reporting - disclosure of information ‘elsewhere in the interim
financial report’
20
3. Financial Risk Management Objectives and Policies Risk Management Structure All policy directions, business strategies and management initiatives emanate from the BOD which strives to provide the most effective leadership for the Group. The BOD endeavors to remain steadfast in its commitment to provide leadership, direction and strategy by regularly reviewing the Group’s performance. For this purpose, the BOD convenes in quarterly meetings and in addition, is available to meet in the interim should the need arise. The Group has adopted internal guidelines setting forth matters that require BOD approval. Under the guidelines, all new investments, any increase in investment in business and subsidiary and any divestments require BOD approval.
The normal course of the Group’s business exposes it to a variety of financial risks such as credit risk, liquidity risk and market risks which include interest rate risk, equity price risk and foreign currency risk exposures.
The Group has various financial assets such as cash and cash equivalents, trade and non-trade receivables, AFS investments and refundable deposits. The Group’s principal financial liabilities consist of accounts payable and accrued expenses, bank loans, and security deposits. The main purpose of these financial liabilities is to raise funds for the Group’s operations.
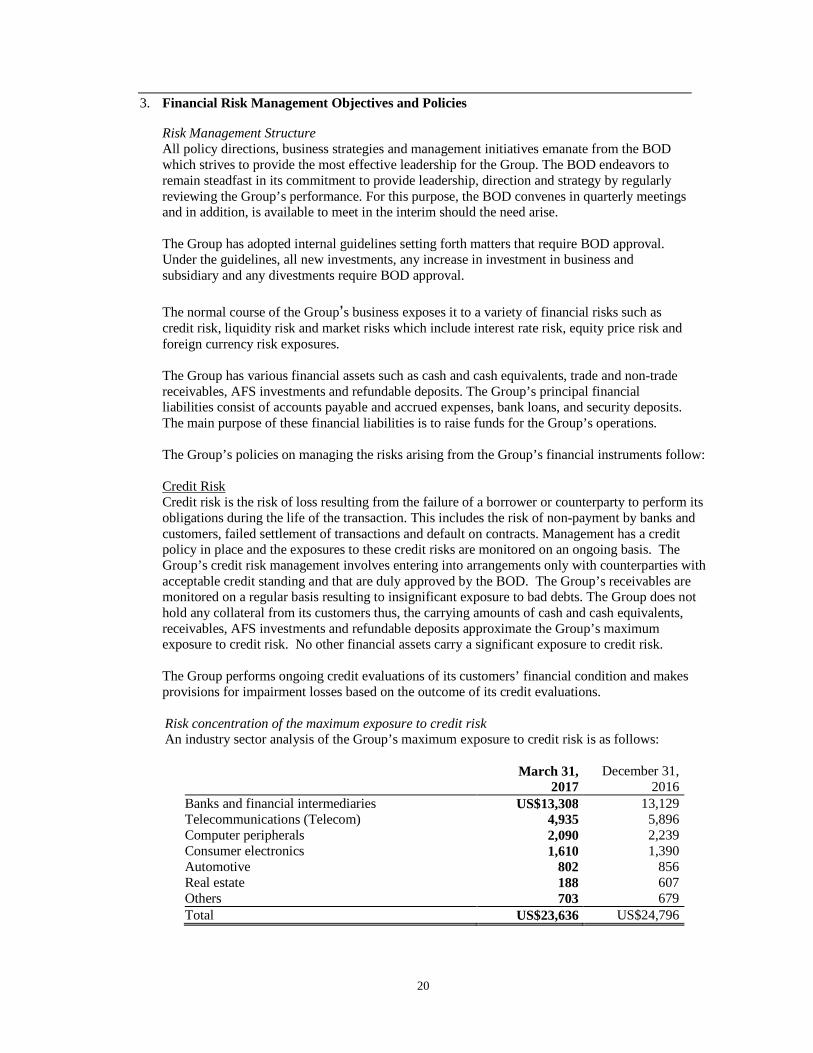
The Group’s policies on managing the risks arising from the Group’s financial instruments follow: Credit Risk Credit risk is the risk of loss resulting from the failure of a borrower or counterparty to perform its obligations during the life of the transaction. This includes the risk of non-payment by banks and customers, failed settlement of transactions and default on contracts. Management has a credit policy in place and the exposures to these credit risks are monitored on an ongoing basis. The Group’s credit risk management involves entering into arrangements only with counterparties with acceptable credit standing and that are duly approved by the BOD. The Group’s receivables are monitored on a regular basis resulting to insignificant exposure to bad debts. The Group does not hold any collateral from its customers thus, the carrying amounts of cash and cash equivalents, receivables, AFS investments and refundable deposits approximate the Group’s maximum exposure to credit risk. No other financial assets carry a significant exposure to credit risk. The Group performs ongoing credit evaluations of its customers’ financial condition and makes provisions for impairment losses based on the outcome of its credit evaluations. Risk concentration of the maximum exposure to credit risk An industry sector analysis of the Group’s maximum exposure to credit risk is as follows:
March 31, December 31, 2017 2016
Banks and financial intermediaries US$13,308 13,129 Telecommunications (Telecom) 4,935 5,896 Computer peripherals 2,090 2,239 Consumer electronics 1,610 1,390 Automotive 802 856 Real estate 188 607 Others 703 679 Total US$23,636 US$24,796
21
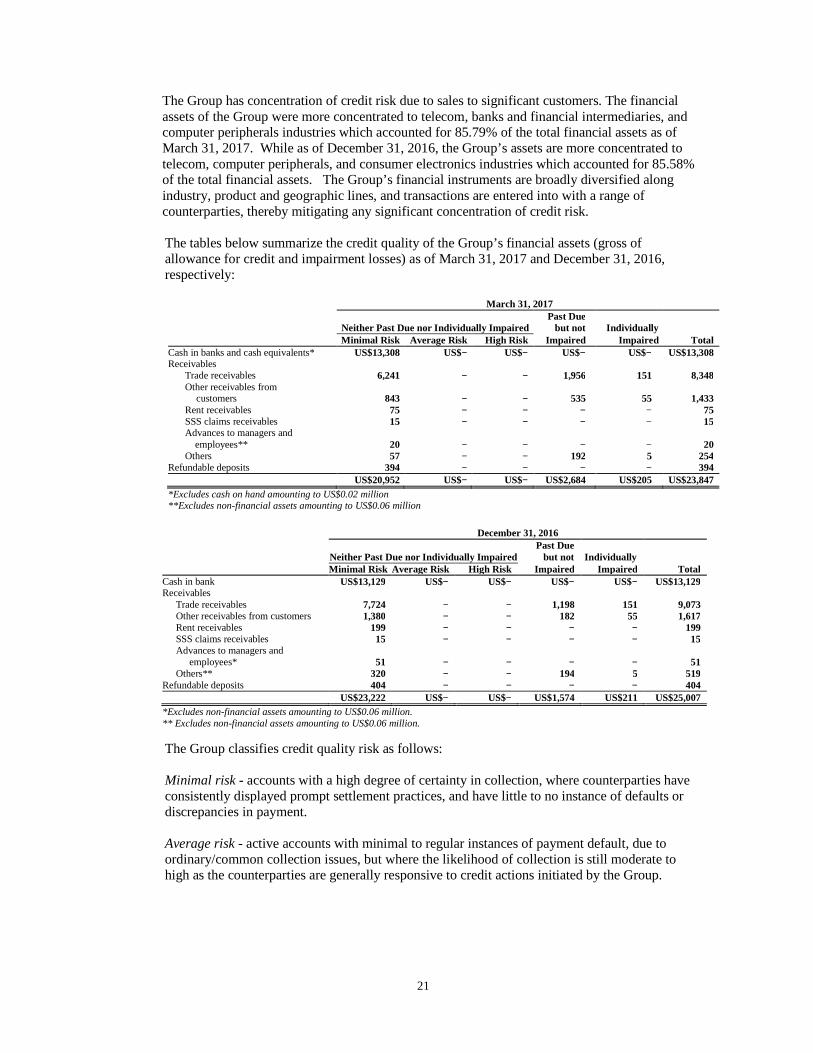
The Group has concentration of credit risk due to sales to significant customers. The financial assets of the Group were more concentrated to telecom, banks and financial intermediaries, and computer peripherals industries which accounted for 85.79% of the total financial assets as of March 31, 2017. While as of December 31, 2016, the Group’s assets are more concentrated to telecom, computer peripherals, and consumer electronics industries which accounted for 85.58% of the total financial assets. The Group’s financial instruments are broadly diversified along industry, product and geographic lines, and transactions are entered into with a range of counterparties, thereby mitigating any significant concentration of credit risk. The tables below summarize the credit quality of the Group’s financial assets (gross of allowance for credit and impairment losses) as of March 31, 2017 and December 31, 2016, respectively:
March 31, 2017
Neither Past Due nor Individually Impaired Past Due
but not Individually Minimal Risk Average Risk High Risk Impaired Impaired Total Cash in banks and cash equivalents* US$13,308 US$− US$− US$− US$− US$13,308 Receivables Trade receivables 6,241 − − 1,956 151 8,348 Other receivables from customers 843 − − 535 55 1,433 Rent receivables 75 − − − − 75 SSS claims receivables 15 − − − − 15 Advances to managers and employees** 20 − − − − 20 Others 57 − − 192 5 254 Refundable deposits 394 − − − − 394 US$20,952 US$− US$− US$2,684 US$205 US$23,847 *Excludes cash on hand amounting to US$0.02 million **Excludes non-financial assets amounting to US$0.06 million
December 31, 2016
Neither Past Due nor Individually Impaired Past Due
but not Individually Minimal Risk Average Risk High Risk Impaired Impaired Total Cash in bank US$13,129 US$− US$− US$− US$− US$13,129 Receivables Trade receivables 7,724 − − 1,198 151 9,073 Other receivables from customers 1,380 − − 182 55 1,617 Rent receivables 199 − − − − 199 SSS claims receivables 15 − − − − 15 Advances to managers and employees* 51 − − − − 51 Others** 320 − − 194 5 519 Refundable deposits 404 − − − − 404 US$23,222 US$− US$− US$1,574 US$211 US$25,007 *Excludes non-financial assets amounting to US$0.06 million. ** Excludes non-financial assets amounting to US$0.06 million.
The Group classifies credit quality risk as follows: Minimal risk - accounts with a high degree of certainty in collection, where counterparties have consistently displayed prompt settlement practices, and have little to no instance of defaults or discrepancies in payment.
Average risk - active accounts with minimal to regular instances of payment default, due to ordinary/common collection issues, but where the likelihood of collection is still moderate to high as the counterparties are generally responsive to credit actions initiated by the Group.

22
High risk - accounts with a low probability of collection and can be considered impaired based on historical experience, where counterparties exhibit a recurring tendency to default despite constant reminder and communication, or even extended payment terms. The Group maintains cash and cash equivalents with various financial institutions that management believes to be of high credit quality. The Group’s policy is to invest with financial institution from which it has outstanding loans and loan facilities.
Liquidity Risk Liquidity risk is the risk of not being able to meet funding obligations such as the repayment of liabilities or payment of asset purchases. Short-term funding is obtained to finance cash requirements for capital expenditures and operations. Amount of credit lines are obtained from designated banks duly approved by the BOD. Surplus funds are placed with reputable banks to which the Group has outstanding loans and loan facilities. The Group’s policy is to regularly monitor its liquidity requirements and its compliance with lending covenants, to ensure that it maintains sufficient reserves of cash and highly liquid marketable securities and adequate committed lines of funding from major financial institutions to meet the short and longer term liquidity requirements of the Group.
The tables below show the maturity profile of the financial assets and liabilities, based on its internal methodology that manages liquidity based on remaining contractual maturities:
March 31, 2017
On demand Less than 3 months
3 to 12 months
1 to 5 years Total
Financial assets Cash and cash equivalents US$13,125 US$− US$− US$− US$11,196 Receivables* 2,790 7,023 185 − 10,953 16,115 7,023 185 − 22,149 Financial liabilities Accounts payable and accrued
expenses** 2,621 7,419 20 14 10,074 Bank loans*** − 388 907 588 1,883 Security deposits**** − − − 437 437 565 7,807 927 1,039 12,394 Liquidity gap US$13,494 (US$784) (US$742) (US$1,039) US$10,929 *Excluding nonfinancial asset amounting to US$0.063 million. **Excluding cash advances from an investee for future dividend declaration amounting to US$0.06 million.
***Including future interest payable amounting to US$0.067 million ****Excluding future interest amounting to US$0.049 million
December 31, 2016
On demand Less than 3 months
3 to 12 months
1 to 5 years Total
Financial assets Cash US$13,144 US$− US$− US$− US$13,144 Receivables 1,778 9,345 139 − 11,262 14,922 9,345 139 − 24,406 Financial liabilities Accounts payable and other
liabilities * US$1,931 US$4,669 US$236 US$− US$6,836 Bank loans and finance lease
liabilities ** − 250 750 1,218 2,218 Security deposits − − − 438 438 1,931 4,919 986 1,656 9,492 Liquidity gap US$12,991 US$4,426 (US$847) (US$1,656) US$14,914
*Excluding cash advances from an investee for future dividend income amounting to US$0.06 million. **Including future interest payable amounting to US$0.06 million
23
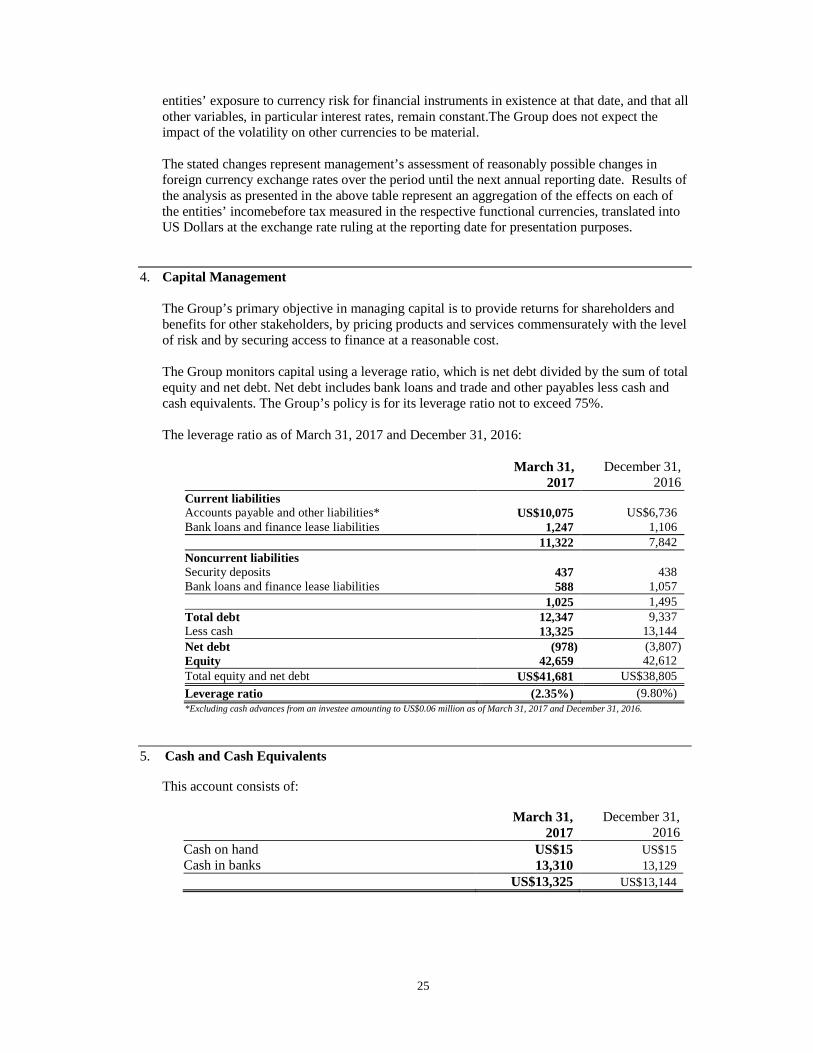
The Group finances its cash requirements by tapping its available credit lines.
Market Risk Market risk is the risk of loss to future earnings, to fair value or future cash flows of a financial instrument as a result of changes in its price, caused by changes in interest rates, equity prices and foreign currency exchange rates and other market factors.
Interest rate risk Interest rate risk is the risk that the value of a financial instrument will fluctuate because of changes in interest rates. The Group follows a prudent policy in managing its assets and liabilities so as to ensure that exposure to fluctuation in interest rates are kept within acceptable limits. The Group does not perform sensitivity analysis on its cash and cash equivalents and bank loans since the Group expects that the effect of the change in interest rates will have insignificant effect on the Group’s operations.
Equity price risk The Group’s equity price risk exposure at period-end relates to financial assets whose values will fluctuate as a result of changes in market prices, principally, quoted equity securities classified as AFS investments.
Quoted AFS investments are subject to price risk due to changes in market values of instruments arising either from factors specific to individual instruments or their issuers or factors affecting all instruments traded in the market.
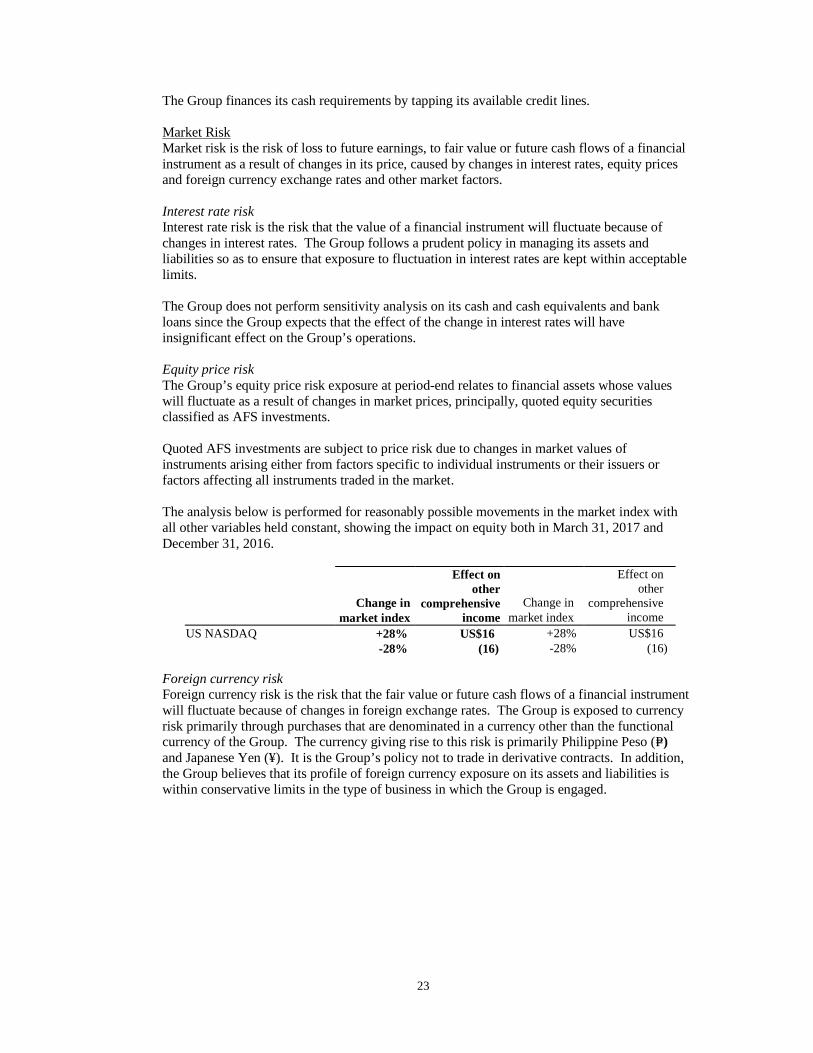
The analysis below is performed for reasonably possible movements in the market index with all other variables held constant, showing the impact on equity both in March 31, 2017 and December 31, 2016.
Change in
market index
Effect on other
comprehensive income
Change in market index
Effect on other
comprehensive income
US NASDAQ +28% US$16 +28% US$16 -28% (16) -28% (16)
Foreign currency risk Foreign currency risk is the risk that the fair value or future cash flows of a financial instrument will fluctuate because of changes in foreign exchange rates. The Group is exposed to currency risk primarily through purchases that are denominated in a currency other than the functional currency of the Group. The currency giving rise to this risk is primarily Philippine Peso (P=) and Japanese Yen (¥). It is the Group’s policy not to trade in derivative contracts. In addition, the Group believes that its profile of foreign currency exposure on its assets and liabilities is within conservative limits in the type of business in which the Group is engaged.
24
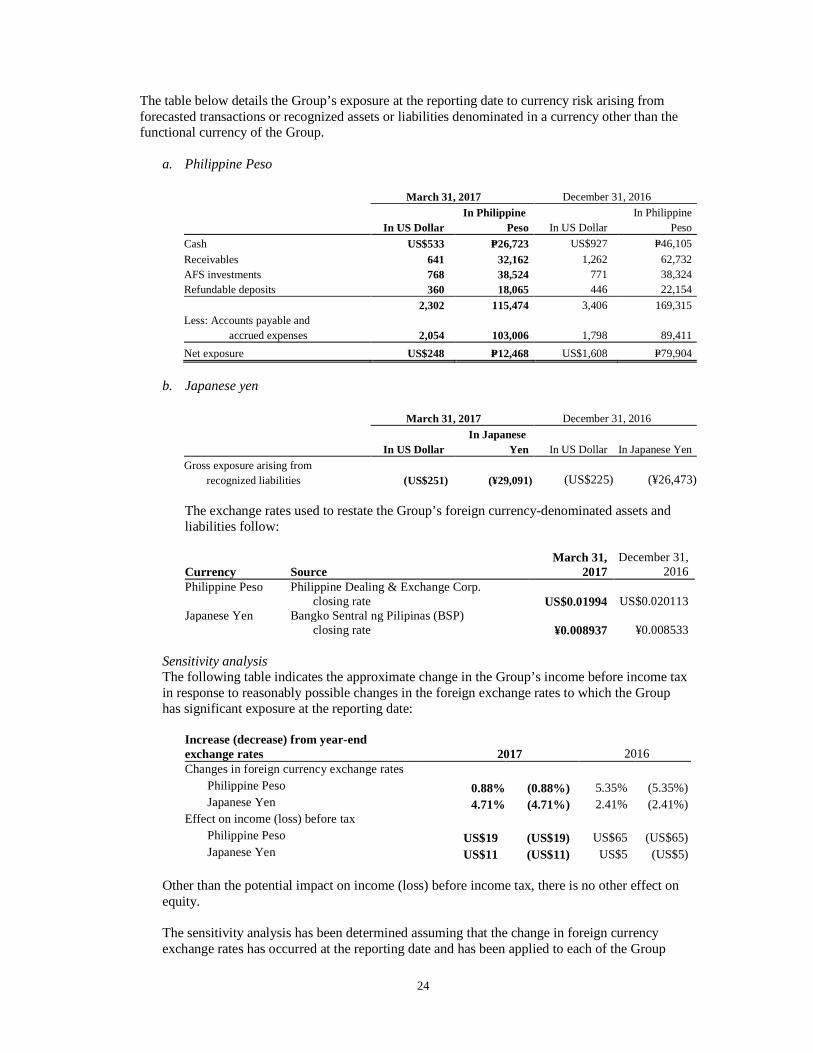
The table below details the Group’s exposure at the reporting date to currency risk arising from forecasted transactions or recognized assets or liabilities denominated in a currency other than the functional currency of the Group.
a. Philippine Peso
March 31, 2017 December 31, 2016
In US Dollar
In Philippine Peso In US Dollar
In Philippine Peso
Cash US$533 P=26,723 US$927 P=46,105
Receivables 641 32,162 1,262 62,732 AFS investments 768 38,524 771 38,324 Refundable deposits 360 18,065 446 22,154
2,302 115,474 3,406 169,315 Less: Accounts payable and accrued expenses 2,054 103,006 1,798 89,411
Net exposure US$248 P=12,468 US$1,608 P=79,904
b. Japanese yen
March 31, 2017 December 31, 2016
In US Dollar
In Japanese Yen In US Dollar In Japanese Yen
Gross exposure arising from recognized liabilities (US$251) (¥29,091) (US$225) (¥26,473)
The exchange rates used to restate the Group’s foreign currency-denominated assets and liabilities follow:
Currency Source March 31,
2017 December 31,
2016 Philippine Peso Philippine Dealing & Exchange Corp.
closing rate US$0.01994 US$0.020113 Japanese Yen Bangko Sentral ng Pilipinas (BSP)
closing rate ¥0.008937
¥0.008533 Sensitivity analysis The following table indicates the approximate change in the Group’s income before income tax in response to reasonably possible changes in the foreign exchange rates to which the Group has significant exposure at the reporting date:
Increase (decrease) from year-end exchange rates 2017 2016 Changes in foreign currency exchange rates Philippine Peso 0.88% (0.88%) 5.35% (5.35%) Japanese Yen 4.71% (4.71%) 2.41% (2.41%) Effect on income (loss) before tax Philippine Peso US$19 (US$19) US$65 (US$65) Japanese Yen US$11 (US$11) US$5 (US$5)
Other than the potential impact on income (loss) before income tax, there is no other effect on equity.
The sensitivity analysis has been determined assuming that the change in foreign currency exchange rates has occurred at the reporting date and has been applied to each of the Group
25
entities’ exposure to currency risk for financial instruments in existence at that date, and that all other variables, in particular interest rates, remain constant.The Group does not expect the impact of the volatility on other currencies to be material.
The stated changes represent management’s assessment of reasonably possible changes in foreign currency exchange rates over the period until the next annual reporting date. Results of the analysis as presented in the above table represent an aggregation of the effects on each of the entities’ incomebefore tax measured in the respective functional currencies, translated into US Dollars at the exchange rate ruling at the reporting date for presentation purposes.
4. Capital Management
The Group’s primary objective in managing capital is to provide returns for shareholders and benefits for other stakeholders, by pricing products and services commensurately with the level of risk and by securing access to finance at a reasonable cost. The Group monitors capital using a leverage ratio, which is net debt divided by the sum of total equity and net debt. Net debt includes bank loans and trade and other payables less cash and cash equivalents. The Group’s policy is for its leverage ratio not to exceed 75%.
The leverage ratio as of March 31, 2017 and December 31, 2016:
March 31,
2017 December 31,
2016 Current liabilities Accounts payable and other liabilities* US$10,075 US$6,736 Bank loans and finance lease liabilities 1,247 1,106 11,322 7,842 Noncurrent liabilities Security deposits 437 438 Bank loans and finance lease liabilities 588 1,057 1,025 1,495 Total debt 12,347 9,337 Less cash 13,325 13,144 Net debt (978) (3,807) Equity 42,659 42,612 Total equity and net debt US$41,681 US$38,805
Leverage ratio (2.35%) (9.80%) *Excluding cash advances from an investee amounting to US$0.06 million as of March 31, 2017 and December 31, 2016. 5. Cash and Cash Equivalents
This account consists of:
March 31,
2017 December 31,
2016 Cash on hand US$15 US$15 Cash in banks 13,310 13,129 US$13,325 US$13,144
26
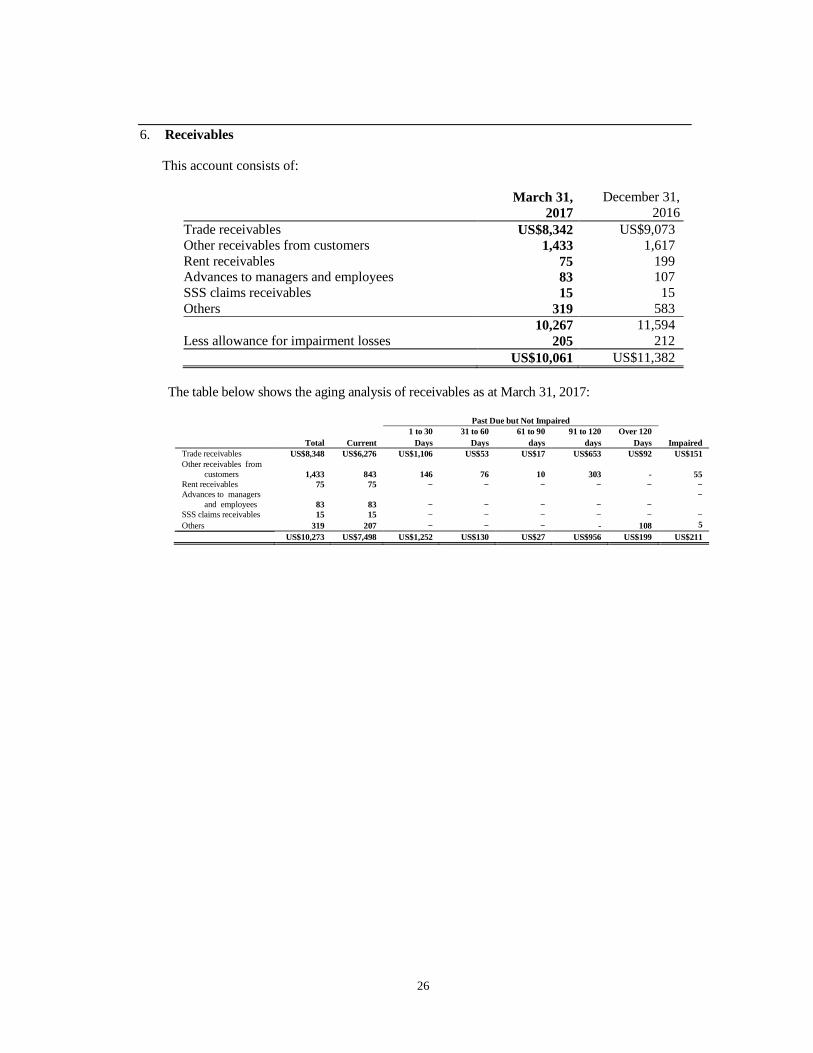
6. Receivables
This account consists of:
March 31,
2017 December 31,
2016 Trade receivables US$8,342 US$9,073 Other receivables from customers 1,433 1,617 Rent receivables 75 199 Advances to managers and employees 83 107 SSS claims receivables 15 15 Others 319 583 10,267 11,594 Less allowance for impairment losses 205 212 US$10,061 US$11,382
The table below shows the aging analysis of receivables as at March 31, 2017:
Past Due but Not Impaired
1 to 30 31 to 60 61 to 90 91 to 120 Over 120 Total Current Days Days days days Days Impaired
Trade receivables US$8,348 US$6,276 US$1,106 US$53 US$17 US$653 US$92 US$151 Other receivables from customers 1,433 843 146 76 10 303 - 55 Rent receivables 75 75 − − − − − − Advances to managers and employees 83 83 − − − − −
−
SSS claims receivables 15 15 − − − − − − Others 319 207 − − − - 108 5 US$10,273 US$7,498 US$1,252 US$130 US$27 US$956 US$199 US$211

27
7. Inventories This account consist of:
March 31,
2017 December 31,
2016 At NRV: Raw materials US$- US$− Finished goods (Note 14) 326 127 Work-in-process (Note 14) 386 296 712 423 At cost: Raw materials 9,077 7,041 Spare parts and supplies 885 746 9,962 7,787 US$10,674 US$8,210
8. Available-for-Sale Investments
March 31,
2017 December 31,
2016 Quoted US$82 US$83 Unquoted 2,319 2,650 US$2,401 US$2,733
Quoted AFS investments are listed in the Philippines Stock Exchange, aside from Rovi which is listed in the US NASDAQ stock market.
The movements in net unrealized losses on AFS investments follow:
March 31,
2017 December 31,
2016 Balances at beginning of period (US$216) (US$233)Fair value changes on AFS investments
reclassified to profit or loss (325) (39)Impairment loss on available-for-sale
investments 135 56Balances at end of period (US$406) (US$216)
28
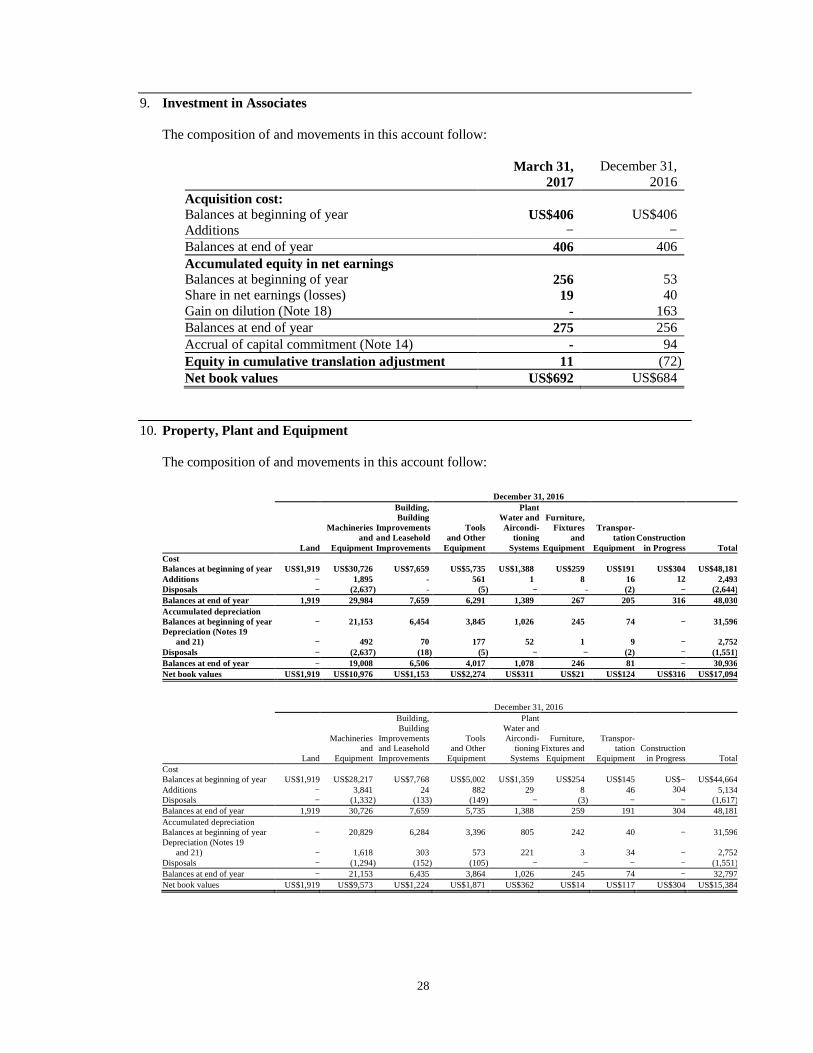
9. Investment in Associates
The composition of and movements in this account follow:
March 31,
2017 December 31,
2016 Acquisition cost: Balances at beginning of year US$406 US$406 Additions − − Balances at end of year 406 406 Accumulated equity in net earnings Balances at beginning of year 256 53 Share in net earnings (losses) 19 40 Gain on dilution (Note 18) - 163 Balances at end of year 275 256 Accrual of capital commitment (Note 14) - 94 Equity in cumulative translation adjustment 11 (72) Net book values US$692 US$684
10. Property, Plant and Equipment The composition of and movements in this account follow:
December 31, 2016
Land
Machineries and
Equipment
Building, Building
Improvements and Leasehold Improvements
Tools and Other
Equipment
PlantWater andAircondi-
tioningSystems
Furniture, Fixtures
and Equipment
Transpor-tation
EquipmentConstruction
in Progress TotalCost Balances at beginning of year US$1,919 US$30,726 US$7,659 US$5,735 US$1,388 US$259 US$191 US$304US$48,181Additions − 1,895 - 561 1 8 16 12 2,493Disposals − (2,637) - (5) − - (2) − (2,644)Balances at end of year 1,919 29,984 7,659 6,291 1,389 267 205 316 48,030Accumulated depreciation Balances at beginning of year − 21,153 6,454 3,845 1,026 245 74 − 31,596Depreciation (Notes 19
and 21) − 492 70 177 52 1 9 − 2,752Disposals − (2,637) (18) (5) − − (2) − (1,551)Balances at end of year − 19,008 6,506 4,017 1,078 246 81 − 30,936Net book values US$1,919 US$10,976 US$1,153 US$2,274 US$311 US$21 US$124 US$316US$17,094
December 31, 2016
Land
Machineries and
Equipment
Building, Building
Improvements and Leasehold Improvements
Tools and Other
Equipment
PlantWater andAircondi-
tioningSystems
Furniture, Fixtures and
Equipment
Transpor-tation
EquipmentConstruction
in Progress TotalCost Balances at beginning of year US$1,919 US$28,217 US$7,768 US$5,002 US$1,359 US$254 US$145 US$−US$44,664Additions − 3,841 24 882 29 8 46 304 5,134Disposals − (1,332) (133) (149) − (3) − − (1,617)Balances at end of year 1,919 30,726 7,659 5,735 1,388 259 191 304 48,181Accumulated depreciation Balances at beginning of year − 20,829 6,284 3,396 805 242 40 − 31,596Depreciation (Notes 19
and 21) − 1,618 303 573 221 3 34 − 2,752Disposals − (1,294) (152) (105) − − − − (1,551)Balances at end of year − 21,153 6,435 3,864 1,026 245 74 − 32,797Net book values US$1,919 US$9,573 US$1,224 US$1,871 US$362 US$14 US$117 US$304US$15,384

29
11. Investment Properties The composition of and movements in this account follow:
March 31, 2017
Land Building Building
Improvements Total Cost Balances at beginning and end of year US$2,390 US$5,295 US$3,905 US$11,218 Addition 49 − − 49 Balance at the end of the year 2,439 5,295 3,905 11,639 Accumulated Depreciation and
Amortization Balances at beginning of year − 2,619 3,353 5,972 Depreciation and amortization
(Notes 14, 15 and 16) − 45 47 91 Balances at end of year − 2,664 3,400 6,122 Exchange Reserves (25) - − (4) Net Book Values US$2,414 US$2,606 US$505 US$5,551 December 31, 2016
Land Building Building
Improvements Total Cost Balances at beginning of year US$2,353 US$5,295 US$3,570 US$11,218 Additions 37 − 335 372 Balances at end of year 2,390 5,295 3,905 11,590 Accumulated Depreciation Balances at beginning of year − 2,440 3,209 5,649 Depreciation (Notes 20 and 21) − 179 144 323 Balances at end of year − 2,619 3,353 5,972 Exchange Reserves (4) − − (4) Net Book Values US$2,386 US$2,676 US$552 US$5,614
12. Accounts Payable and Accrued Expenses This account consists of:
March 31,
2017 December 31,
2016 Trade payables US$7,259 US$4,299 Accrued expenses 1,769 1,721 Non-trade payables - 132 Unearned rent income 695 695 Security deposit 437 438 Others 1,063 758 11,224 8,043 Less noncurrent portion of unearned rent and security deposits 1,090 1,090 US$10,134 US$6,953

30
Accrued expenses consist of:
March 31,
2017 December 31,
2016 Accrued rent US$107 US$51 Accrued salaries, wages and other benefits 785 428 Accrued utilities 292 355 Accrued sales commission 137 110 Accrued professional fees 128 95 Accrued handling charges 128 95 Accrued capital commitment (Note 11) - 94 Accrued direct materials 10 10 Others 183 483 1,769 US$1,721
13. Advances from Customers
The account represents advanced payments for raw material purchases, amounting to US$3.12 million and US$2.89 million as of March 31, 2017 and December 31, 2016, respectively.
14. Cost of Sales
This account consists of:
March 31, 2017
(3 months)
March 31, 2016
(3 months) Raw materials and supplies used US$5,810 US$7,891 Salaries, wages and benefits 2,014 1,751 Occupancy cost and utilities 807 784 Depreciation and amortization (Notes 10 and 11) 794 647 Handling and freight charges 116 136 Other expenses 59 149 Total manufacturing cost 9,601 11,358 Work-in-process (Note 7) Beginning 295 254 Ending (386) (199)Cost of goods manufactured 9,511 11,413 Finished goods (Note 7) Beginning 127 159 Ending (326) (575) US$9,312 US$10,997
31
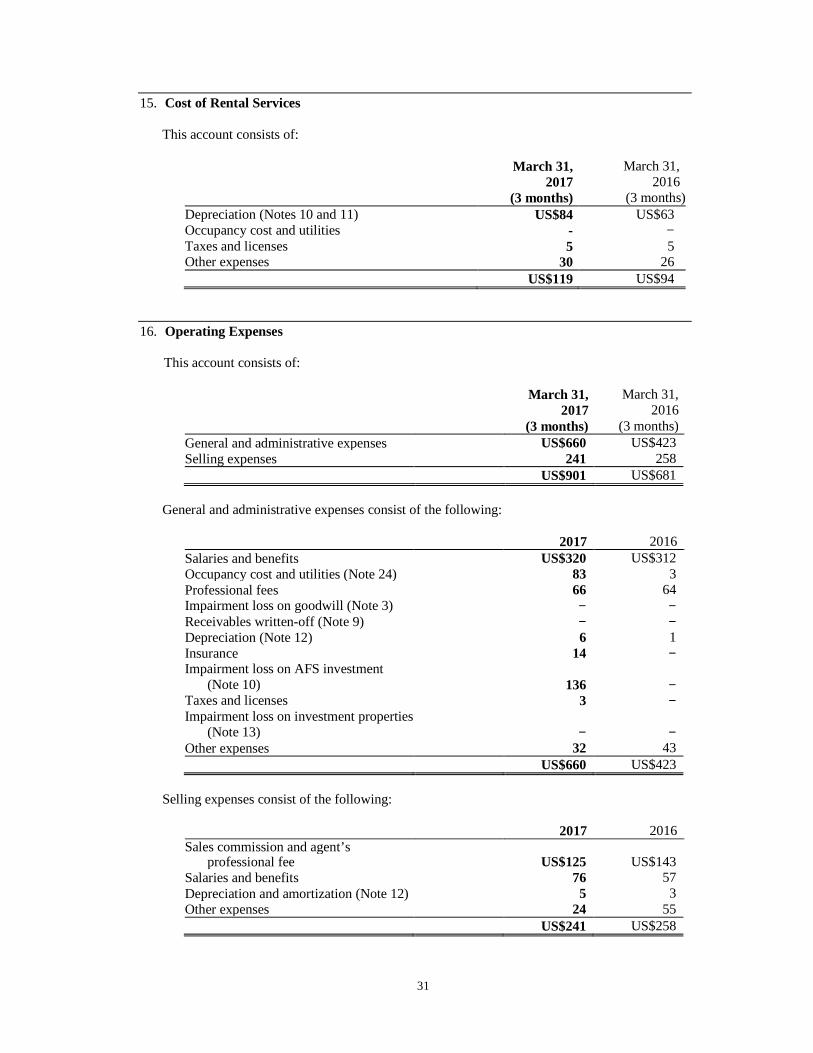
15. Cost of Rental Services
This account consists of:
March 31, 2017
(3 months)
March 31, 2016
(3 months)Depreciation (Notes 10 and 11) US$84 US$63 Occupancy cost and utilities - − Taxes and licenses 5 5 Other expenses 30 26 US$119 US$94
16. Operating Expenses This account consists of:
March 31, 2017
(3 months)
March 31, 2016
(3 months) General and administrative expenses US$660 US$423 Selling expenses 241 258
US$901 US$681
General and administrative expenses consist of the following:
2017 2016 Salaries and benefits US$320 US$312 Occupancy cost and utilities (Note 24) 83 3 Professional fees 66 64 Impairment loss on goodwill (Note 3) − − Receivables written-off (Note 9) − − Depreciation (Note 12) 6 1 Insurance 14 − Impairment loss on AFS investment
(Note 10) 136 − Taxes and licenses 3 − Impairment loss on investment properties
(Note 13) − − Other expenses 32 43
US$660 US$423 Selling expenses consist of the following:
2017 2016 Sales commission and agent’s
professional fee US$125 US$143 Salaries and benefits 76 57 Depreciation and amortization (Note 12) 5 3 Other expenses 24 55
US$241 US$258
32
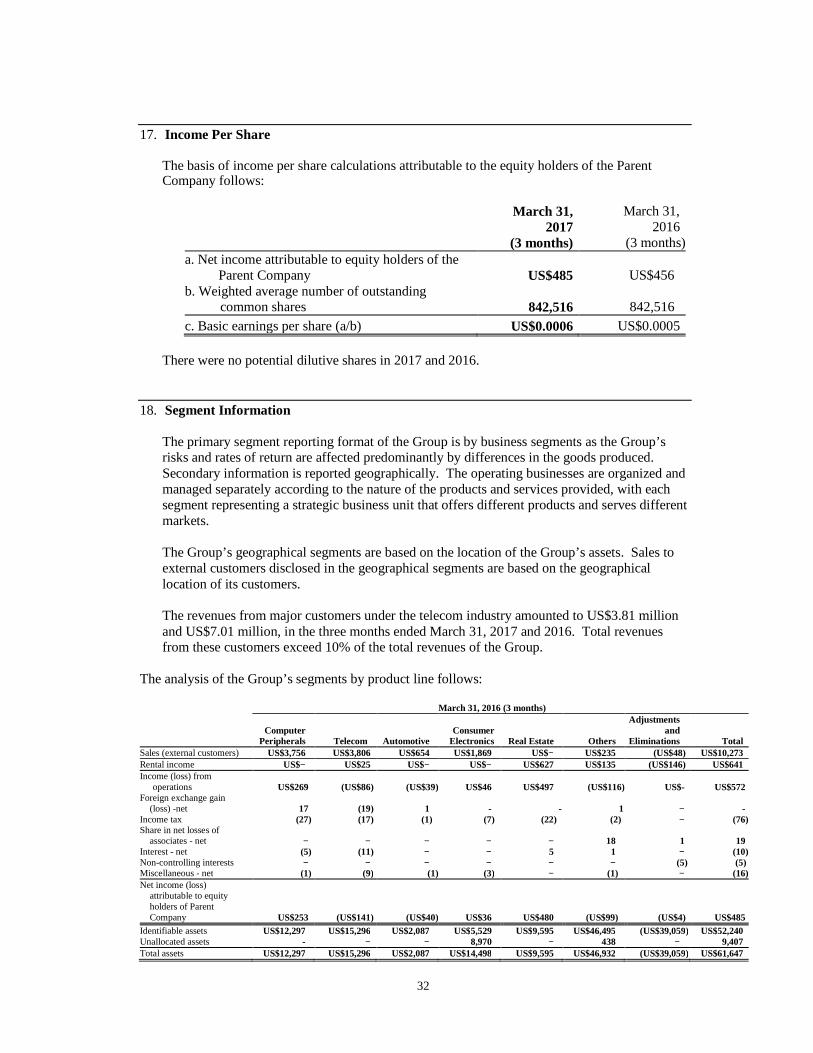
17. Income Per Share
The basis of income per share calculations attributable to the equity holders of the Parent Company follows:
March 31, 2017
(3 months)
March 31, 2016
(3 months)a. Net income attributable to equity holders of the Parent Company US$485 US$456 b. Weighted average number of outstanding common shares 842,516 842,516 c. Basic earnings per share (a/b) US$0.0006 US$0.0005
There were no potential dilutive shares in 2017 and 2016.
18. Segment Information The primary segment reporting format of the Group is by business segments as the Group’s
risks and rates of return are affected predominantly by differences in the goods produced. Secondary information is reported geographically. The operating businesses are organized and managed separately according to the nature of the products and services provided, with each segment representing a strategic business unit that offers different products and serves different markets.
The Group’s geographical segments are based on the location of the Group’s assets. Sales to
external customers disclosed in the geographical segments are based on the geographical location of its customers.
The revenues from major customers under the telecom industry amounted to US$3.81 million
and US$7.01 million, in the three months ended March 31, 2017 and 2016. Total revenues from these customers exceed 10% of the total revenues of the Group.
The analysis of the Group’s segments by product line follows: March 31, 2016 (3 months)
Computer
Peripherals Telecom Automotive Consumer
Electronics Real Estate Others
Adjustments and
Eliminations Total Sales (external customers) US$3,756 US$3,806 US$654 US$1,869 US$− US$235 (US$48) US$10,273 Rental income US$− US$25 US$− US$− US$627 US$135 (US$146) US$641 Income (loss) from operations US$269 (US$86) (US$39) US$46 US$497 (US$116) US$- US$572 Foreign exchange gain (loss) -net 17 (19) 1 - - 1 − - Income tax (27) (17) (1) (7) (22) (2) − (76) Share in net losses of associates - net − − − − − 18 1 19 Interest - net (5) (11) − − 5 1 − (10) Non-controlling interests − − − − − − (5) (5) Miscellaneous - net (1) (9) (1) (3) − (1) − (16) Net income (loss) attributable to equity holders of Parent Company US$253 (US$141) (US$40) US$36 US$480 (US$99) (US$4) US$485 Identifiable assets US$12,297 US$15,296 US$2,087 US$5,529 US$9,595 US$46,495 (US$39,059) US$52,240 Unallocated assets - − − 8,970 − 438 − 9,407 Total assets US$12,297 US$15,296 US$2,087 US$14,498 US$9,595 US$46,932 (US$39,059) US$61,647
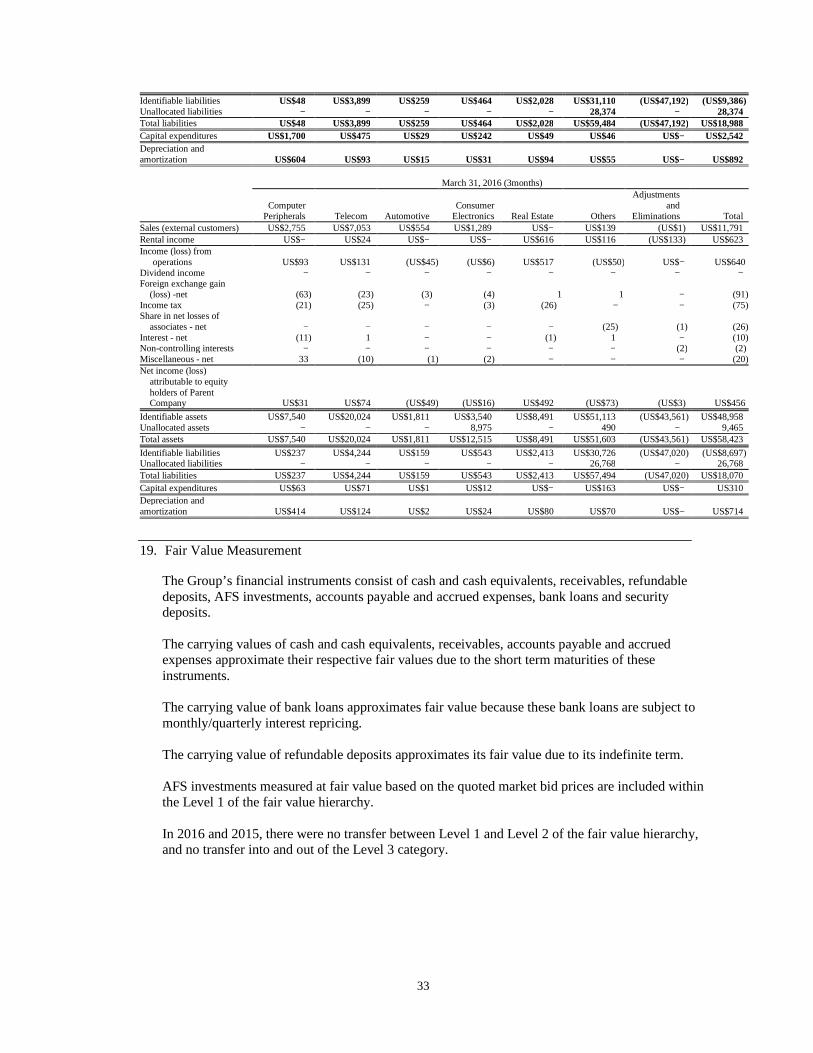
33
Identifiable liabilities US$48 US$3,899 US$259 US$464 US$2,028 US$31,110 (US$47,192) (US$9,386) Unallocated liabilities − − − − − 28,374 − 28,374 Total liabilities US$48 US$3,899 US$259 US$464 US$2,028 US$59,484 (US$47,192) US$18,988 Capital expenditures US$1,700 US$475 US$29 US$242 US$49 US$46 US$− US$2,542 Depreciation and amortization US$604 US$93 US$15 US$31 US$94 US$55 US$− US$892 March 31, 2016 (3months)
Computer
Peripherals Telecom Automotive Consumer
Electronics Real Estate Others
Adjustments and
Eliminations Total Sales (external customers) US$2,755 US$7,053 US$554 US$1,289 US$− US$139 (US$1) US$11,791 Rental income US$− US$24 US$− US$− US$616 US$116 (US$133) US$623 Income (loss) from operations US$93 US$131 (US$45) (US$6) US$517 (US$50) US$− US$640 Dividend income − − − − − − − − Foreign exchange gain (loss) -net (63) (23) (3) (4) 1 1 − (91) Income tax (21) (25) − (3) (26) − − (75) Share in net losses of associates - net − − − − − (25) (1) (26) Interest - net (11) 1 − − (1) 1 − (10) Non-controlling interests − − − − − − (2) (2) Miscellaneous - net 33 (10) (1) (2) − − − (20) Net income (loss) attributable to equity holders of Parent Company US$31 US$74 (US$49) (US$16) US$492 (US$73) (US$3) US$456
Identifiable assets US$7,540 US$20,024 US$1,811 US$3,540 US$8,491 US$51,113 (US$43,561) US$48,958 Unallocated assets − − − 8,975 − 490 − 9,465 Total assets US$7,540 US$20,024 US$1,811 US$12,515 US$8,491 US$51,603 (US$43,561) US$58,423
Identifiable liabilities US$237 US$4,244 US$159 US$543 US$2,413 US$30,726 (US$47,020) (US$8,697) Unallocated liabilities − − − − − 26,768 − 26,768 Total liabilities US$237 US$4,244 US$159 US$543 US$2,413 US$57,494 (US47,020) US$18,070 Capital expenditures US$63 US$71 US$1 US$12 US$− US$163 US$− US310 Depreciation and amortization US$414 US$124 US$2 US$24 US$80 US$70 US$− US$714
19. Fair Value Measurement The Group’s financial instruments consist of cash and cash equivalents, receivables, refundable deposits, AFS investments, accounts payable and accrued expenses, bank loans and security deposits. The carrying values of cash and cash equivalents, receivables, accounts payable and accrued expenses approximate their respective fair values due to the short term maturities of these instruments.
The carrying value of bank loans approximates fair value because these bank loans are subject to monthly/quarterly interest repricing.
The carrying value of refundable deposits approximates its fair value due to its indefinite term.
AFS investments measured at fair value based on the quoted market bid prices are included within the Level 1 of the fair value hierarchy. In 2016 and 2015, there were no transfer between Level 1 and Level 2 of the fair value hierarchy, and no transfer into and out of the Level 3 category.