Embed Size (px)
Citation preview

Universidade de Aveiro 2003
Departamento de Química
Iola Melissa Fernandes Duarte
Application of Nuclear Magnetic Resonance Spectroscopy and Vibrational Spectroscopy for the Characterisation of Fruit Products and Beverages
Aplicação de Espectroscopia de Ressonância Magnética Nuclear e Espectroscopia Vibracional para a Caracterização de Frutos e Bebidas

i
Universidade de Aveiro 2003
Departamento de Química
Iola Melissa Fernandes Duarte
Application of Nuclear Magnetic Resonance Spectroscopy and Vibrational Spectroscopy for the Characterisation of Fruit Products and Beverages
Aplicação de Espectroscopia de Ressonância Magnética Nuclear e Espectroscopia Vibracional para a Caracterização de Frutos e Bebidas
Dissertação apresentada à Universidade de Aveiro para cumprimento dos requisitos necessários à obtenção do grau de Doutor em Química, realizada sob a orientação científica da Doutora Ana Maria Pissarra Coelho Gil e da Doutora Ivonne Delgadillo, Professoras Associadas do Departamento de Química da Universidade de Aveiro Trabalho realizado com o apoio financeiro da Fundação para a Ciência e a Tecnologia através da Bolsa Praxis XXI/BD/15666/98

ii

iii
O Júri
Presidente Doutor Joaquim José Borges Gouveia Professor Catedrático do Departamento de Economia, Gestão e Engenharia Industrial da Universidade de Aveiro
Doutor John Christopher Lindon Senior Research Investigator and Visiting Professor, Biological Chemistry, Biomedical Sciences Division, Faculty of Medicine, Imperial College of Science, Technology and Medicine, U.K.
Doutora Maria Helena Santos Professora Associada da Faculdade de Ciências e Tecnologia da Universidade Nova de Lisboa
Doutora Cristina Luísa Miranda Silva Professora Auxiliar da Escola Superior de Biotecnologia da Universidade Católica Portuguesa do Porto
Doutora Ana Maria Pissarra Coelho Gil (orientadora) Professora Associada do Departamento de Química da Universidade de Aveiro
Doutora Ivonne Delgadillo (co-orientadora) Professora Associada do Departamento de Química da Universidade de Aveiro

iv
Acknowledgements
I would like to express my sincere gratitude to my supervisors Dr. Ana Gil and Dr. Ivonne Delgadillo, who early stimulated my interest for scientific research and, in particular, for the field of NMR spectroscopy. I thank them for the many useful and refreshing discussions about my work, for their continuous guidance and help and for the critical reading and correction of this thesis.
I would also like to especially acknowledge Dr. Manfred Spraul, Dr. Eberhard Humpfer, Dr. Markus Godejohann and Dr. Ulrich Braumann, who kindly received me in the Bruker site of Silberstreifen (Germany) and allowed me to use the NMR and HPLC-NMR/MS instruments and to take advantage of the latest technical developments. I deeply thank their indispensable technical support and help.
My work has also benefited from the collaboration and helpful advice of Dr. Ian Colquhoun, who assisted me during my stay at the Institute of Food Research (IFR) in Norwich (U.K.), and of Dr. Peter Belton from the University of East Anglia, Norwich (U.K.).
I would like to acknowledge the fundamental contribution to this thesis of Dr. António Barros from the Chemistry Department of the University of Aveiro for assisting me in the multivariate analysis of my data. I am also indebted to Dr. Brian Goodfellow for his assistance with the NMR equipment and to Cláudia Almeida for her help in the laboratory. My thanks go also to Dr. Pablo Pereira from the National Institute of Engineering and Industrial Technology (INETI), in Lisbon, for providing one of the moulds used in this work, and to Dr. Marcelo Maraschin from the University of Santa Catarina, Florianopolis (Brazil), for providing the grape juice and the wine phenolic extract samples.
I whish to acknowledge the Portuguese Foundation for Science and Technology (FCT) for their financial support through the grant Praxis XXI/BD/15666/98. I also thank the Chemistry Department of the University of Aveiro for providing the physical conditions for this work.
Finally, I deeply thank my mother and father for their love and continuous encouragement, and my husband Paulo for his constant patience, understanding and support. Also, I express my sincere gratitude to my parents in law and to all my family and friends for being with me always, in good and difficult moments!

v
Resumo
O trabalho apresentado nesta tese pretendeu desenvolver e aplicar métodos espectroscópicos, em especial espectroscopia de ressonância magnética nuclear e técnicas acopladas, e também espectroscopia de infravermelho, para estudar a composição e a bioquímica de frutos e bebidas. No Capítulo I, apresenta-se o estado do conhecimento sobre a composição e bioquímica dos alimentos em análise neste trabalho, evidenciando-se os aspectos que justificam o seu estudo mais aprofundado e completo, para o qual a presente tese pretende contribuir. O Capítulo II descreve, de forma resumida, os fundamentos das técnicas analíticas utilizadas, focando nomeadamente a espectroscopia de RMN de estado líquido e de estado sólido, o acoplamento da RMN com cromatografia líquida e espectrometria de massa (HPLC-RMN/MS) e a espectroscopia de infravermelho. Os métodos de análise multivariada usados encontram-se também sumariamente descritos neste Capítulo.
No Capítulo III, descreve-se a aplicação de técnicas de RMN de alta resolução para caracterizar a composição de sumo e polpa de manga. O espectro de RMN-1H do sumo (600 MHz) apresenta elevada complexidade e contém informação sobre uma vasta gama de compostos. Recorrendo a espectros bidimensionais, conseguem identificar-se cerca de 50 compostos, incluindo vários açúcares, ácidos orgânicos e aminoácidos. O fruto intacto (polpa) é estudado directamente e de forma não-invasiva por RMN de estado sólido (400 e 500 MHz), utilizando a técnica de rotação segundo o ângulo mágico (MAS) e uma sonda de alta resolução (HR-MAS). A técnica de HR-MAS permite obter espectros com uma resolução seis vezes maior do que a obtida com MAS, sendo possível registar espectros 2D e caracterizar detalhadamente a composição da polpa. Comparando os espectros da polpa e do sumo respectivo, encontram-se algumas diferenças na composição em lípidos e pectinas, que se encontram em maior abundância no fruto intacto, demonstrando que a usual extrapolação da composição do sumo como composição global do fruto pode não ser totalmente aplicável.
No Capítulo IV apresenta-se um estudo sistemático do processo de amadurecimento da manga (cv. Tommy Atkins), levado a cabo através de medições físico-químicas e de espectroscopia de RMN-1H de alta resolução aplicada a sumos e polpas. A quantificação de alguns componentes do sumo é efectuada por integração dos sinais de RMN, usando uma referência interna (TSP). As principais alterações de composição com o amadurecimento consistem no aumento dos teores de sacarose, alguns aminoácidos (ex. valina, alanina, ácido ?-aminobutírico), constituintes pécticos e polifenóis e na diminuição dos teores de glucose, ácido cítrico, ácido xiquímico, arginina, tirosina e fenilalanina. Uma segunda variedade estudada (cv. Haden) apresenta diferenças no processo de amadurecimento sobretudo ao nível da variação de alguns aminoácidos e compostos aromáticos. Ainda neste capítulo, um estudo preliminar sobre o efeito da refrigeração mostra que a maior parte das alterações indicadas acima são retardadas ou não ocorrem a baixa temperatura, daí resultando frutos com baixa qualidade organoléptica.
O Capítulo V descreve a quantificação dos três principais açúcares do sumo de manga em função do amadurecimento, usando regressão parcial dos mínimos quadrados (PLS) aplicada a espectros de infravermelho (FTIR-ATR) e de RMN-1H. A calibração é efectuada com base em soluções padrão de glucose, frutose e sacarose, seguindo um desenho experimental triangular, com seis níveis de concentração para cada açúcar. O método de PLS-FTIR permite prever a concentração dos três açúcares com elevada exactidão, excepto no caso da glucose quando, nos últimos estágios de amadurecimento,
vi
esta atinge teores abaixo da gama de concentrações usada na calibração. Por outro lado, a aplicação de PLS aos espectros de RMN das soluções padrão e dos sumos de manga apresenta erros elevados, cuja magnitude parece depender do alinhamento dos espectros, necessitando este método de optimização.
No Capítulo VI, a espectroscopia de RMN-1H de alta resolução é usada para monitorizar e identificar alterações de composição em sumos de manga sujeitos a degradação natural, aquecimento e contaminação microbiológica. Permitindo identificar muitos dos compostos que se alteram em função destes efeitos, de forma rápida e simultânea, e seguir a sua variação ao longo do tempo, a técnica de RMN revela-se promissora para a detecção de indicadores de degradação/contaminação do sumo, sendo potencialmente útil para fins de controlo de qualidade.
No Capítulo VII, alguns componentes minoritários de sumo de manga, sumo de uva e vinho são investigados através do acoplamento das técnicas de RMN, cromatografia líquida e espectrometria de massa (HPLC-RMN/MS). Em particular, o sumo de manga é analisado com vista ao estudo dos hidratos de carbono menos abundantes, tendo-se alcançado uma melhor caracterização da fracção péctica. A análise de sumo de uva e vinho (extracto fenólico) destina-se a caracterizar os constituintes aromáticos destas amostras, tendo-se conseguido identificar vários compostos fenólicos de difícil atribuição só com base na análise directa por RMN. Os compostos identificados na uva incluem o ácido gálico e vários ácidos cinâmicos (ex. p-cumárico, trans-cutárico e trans-caftárico), enquanto que no vinho se detectam catequina e epicatequina, trans-resveratrol, tirosol e ácido cafeico.
O Capítulo VIII centra-se na caracterização da composição química da cerveja através das técnicas de RMN e de HPLC-RMN/MS. A análise directa por RMN uni- e bidemsional (500 MHz) permite a identificação de cerca de 30 compostos, entre os quais vários ácidos orgânicos, aminoácidos e álcoois. Os oligossacarídeos de maltose (dextrinas) dão origem aos sinais mais largos e intensos do espectro, mas o elevado grau de sobreposição impede a sua caracterização estrutural. A identificação de dextrinas de diferentes tamanhos é conseguida através da análise da cerveja por HPLC-RMN/MS, que requer apenas a desgaseificação da amostra. A análise por HPLC-RMN/MS permite também confirmar a presença de vários compostos aromáticos e revelar outros não identificados só com base na análise por RMN, tais como os álcoois aromáticos 2-feniletanol, tirosol e triptofol.
Finalmente, no Capítulo IX, descreve-se a análise de componentes principais (PCA) dos espectros de RMN-1H e de FTIR-ATR de um conjunto de 50 cervejas de diferentes marcas, tipos e países de origem. Por PCA dos espectros de RM N as cervejas são separadas de acordo com a sua composição em hidratos de carbono, embora alguns componentes minoritários (em particular compostos aromáticos) também contribuam para a distinção das amostras, nomeadamente em termos dos dois tipos principais ‘ale’ e ‘lager’. A aplicação de PCA aos espectros de FTIR origina a distinção das cervejas com base no seu teor alcoólico e na sua composição em hidratos de carbono. A análise canónica de correlação (CCA) entre os espectros de RMN e de FTIR mostra uma correlação elevada entre os dois domínios, permitindo identificar os sinais que variam no mesmo sentido.

vii
Abstract
The work reported in this thesis aimed at developing and applying spectroscopic methods, principally nuclear magnetic resonance (NMR) spectroscopy and hyphenated techniques (HPLC-NMR and HPLC-NMR/MS), along with infrared spectroscopy, for studying the complex composition and biochemistry of different fruit products and beverages. Chapter I summarises some of the present knowledge about the food systems studied, giving particular emphasis to the aspects that frame the problems investigated in this thesis. The fundamentals of the analytical methods employed are shortly presented in Chapter II, focusing on the principles underlying the experiments that have been carried out in this work, namely solution and solid state high resolution 1H NMR spectroscopy, HPLC-NMR/(MS) and Fourier-transform infrared spectroscopy. The multivariate analysis methods that have been applied to the spectroscopic data are also briefly presented.
In Chapter III, the application of high resolution NMR to characterise the composition of mango juice and intact pulp is described. The high field (600 MHz) 1H spectra of juices show a high degree of complexity, revealing the potential of the technique for the simultaneous detection of a wide range of components. Spectral assignment is carried out with basis on 1D and 2D spectra, resulting in the identification of about 50 components, including several sugars, organic acids and amino acids. Mango pulps are studied directly and non-invasively by techniques derived from solid state NMR, namely 1H HR-MAS NMR (400 and 500 MHz), which results in a six-fold resolution improvement compared to standard 1H MAS. HR-MAS enables 2D experiments to be carried out, thus allowing for the pulp composition to be thoroughly characterised. The pulp is found to have a richer composition in lipids and pectins than the corresponding juice, showing that the composition of the liquid phase is not fully representative of the composition of the whole fruit as usually assumed.
Chapter IV presents a systematic study of the ripening process of mango (cv. Tommy Atkins), monitored by physicochemical parameters and by high resolution 1H NMR of both juices and pulps. Some juice components are quantified by integration of NMR signals, using an internal reference (TSP). Mango ripening is found to be characterised by increases in the contents of sucrose, some amino acids (e.g. valine, alanine, GABA), pectic constituents and polyphenols, and by decreases in the contents of glucose, citric acid, shikimic acid, arginine, tyrosine and phenylalanine, reflecting the complex biochemistry of ripening. The other cultivar studied (cv. Haden) is found to differ mainly in the variation patterns of some amino acids and aromatic compounds. Furthermore, a preliminary study of the effect of refrigeration on ripening shows that most changes indicated above do not occur under low temperature, resulting in fruits with poor edible quality.
In Chapter V, partial least squares (PLS1) regression is applied to FTIR-ATR and to 1H NMR data in order to quantify the three main sugars in mango juices as a function of ripening. Calibration is based on standard solutions of glucose, fructose and sucrose, following a triangular experimental design with six concentration levels for each sugar. The PLS -FTIR method shows good predictive ability, although the accuracy of glucose determination decreases at later ripening stages, when concentrations fall below the lower limit of the concentration range used for calibration. The PLS -NMR method shows much higher prediction errors, which seem to depend on spectral alignment, and needs further optimisation.

viii
In Chapter VI, the application of high resolution NMR to monitor the complex compositional changes of mango juices subject to natural degradation, heat treatment and microbial contamination is described. Enabling the identification of many compounds undergoing changes upon these effects, in a rapid and simultaneous manner, and their variations to be followed throughout time, the NMR technique may be regarded as a sensitive and powerful tool for detecting indicators of spoilage/contamination, being potentially useful for quality control purposes.
Chapter VII describes the application of hyphenated NMR methods (HPLC-NMR and HPLC-NMR/MS) to investigate minor components in mango juice, grape juice and wine. In particular, the carbohydrate composition of mango juice is investigated and further advances in the characterisation of the pectic fraction achieved. The analysis of grape juice and wine (phenolic extract) aims at characterising their complex aromatic composition and results in the identification of several phenolic compounds, overcoming the difficulties found when using standard NMR. Gallic acid and several cinnamic acids (e.g. p-coumaric, trans-coutaric and trans-caftaric) are identified in grape juice, whereas catechin, epicatechin, trans -resveratrol, tyrosol and caffeic acid are found in the wine phenolic extract.
Chapter VIII is focused on the characterisation of beer chemical composition by high resolution NMR and HPLC-NMR/MS. Direct analysis of beer by 1D and 2D NMR (500 MHz) is shown to enable the identification of about 30 components, such as several organic acids, amino acids and alcohols. Malto-oligosaccharides (dextrins) give rise to the broadest and most intense signals in the spectrum, but the strong spectral overlap hinders their structural characterisation. The identification of dextrins of different sizes is achieved by HPLC-NMR/MS of beer, preceded only by degassing of the sample. In addition, HPLC-NMR/MS is shown to be useful for confirming the identity of some aromatic compounds previously assigned by NMR alone, and for revealing new ones, such as the aromatic alcohols 2-phenylethanol, tyrosol and tryptophol.
Finally, in Chapter IX, principal component analysis (PCA) is applied to the 1H NMR spectra and to the FTIR-ATR spectra of a set of 50 beers differing in label, type and country of origin. PCA of NMR data results in the separation of beers mainly according to their carbohydrate composition, although minor components (aromatic compounds in particular) are also found to contribute for the distinction of beers, namely in terms of the two main types ale and lager. PCA of FTIR data separates beers with basis on differences in their alcoholic content and carbohydrate composition. Canonical correlation analysis of NMR and FTIR spectra shows a high correlation between the two domains, enabling the identification of the spectral features varying in the same direction.

ix
Accounts of some of the work reported here are given in: 1. Gil, A.M.; Duarte, I.F.; Delgadillo, I.; Colquhoun, I.J.; Casuscelli, J.; Humpfer, E.; Spraul, M. Study of the compositional changes of mango during ripening by use of nuclear magnetic resonance spectroscopy. Journal of Agricultural and Food Chemistry 2000, 48, 1524-1536. 2. Duarte, I.F.; Delgadillo, I.; Spraul, M.; Humpfer, E.; Gil, A.M. An NMR study of the biochemistry of mango: the effects of ripening, processing and microbial growth. In Magnetic Resonance in Food Science - a View to the Future; Webb, G.A, Belton, P.S., Gil, A.M., Delgadillo,I., Eds.; The Royal Society of Chemistry: Cambridge, 2001; 259-266. 3. Duarte, I.F.; Barros, A.; Belton, P.S.; Righelato, R.; Spraul, M.; Humpfer, E.; Gil, A.M. High resolution NMR spectroscopy and multivariate analysis for the characterisation of beer. Journal of Agricultural and Food Chemistry 2002, 50, 2475-2481. 4. Duarte, I.F.; Barros, A.; Delgadillo, I.; Almeida, C.; Gil, A.M. Application of FTIR spectroscopy for the quantification of sugars in mango juice as a function of ripening. Journal of Agricultural and Food Chemistry 2002, 50, 3104-3111. 5. Duarte, I.F.; Spraul, M.; Godejohann, M.; Gil, A.M. Application of NMR and hyphenated NMR spectroscopy for the study of beer components. Magnetic Resonance in Food Science - Latest Developments; Webb, G.A., Belton, P.S., Gil, A.M., Rutledge, D.N., Eds. (in press). 6. Duarte, I.F.; Godejohann, M.; Braumann, U.; Spraul, M.; Gil, A.M. Application of NMR spectroscopy and LC-NMR/MS to the identification of carbohydrates in beer (submitted). 7. Gil, A.M.; Duarte, I.F.; Godejohann, M.; Braumann, U.; Spraul, M. Characterisation of the aromatic composition of some liquid foods by NMR spectroscopy and LC-NMR/MS (submitted). In preparation: Duarte, I.; Barros, A.; Almeida, C.; Spraul, M.; Gil, A.M. Multivariate analysis of NMR and FTIR data of beer as a potential tool for its quality control.

x

xi
Contents
Chapter I. Compositional and Biochemical Aspects of the Food Systems Studied I.1. Mango Fruit………………………………………………………………………….. I.1.1. General Chemical Composition……………………………………………….. I.1.2. The Ripening Process of Mango Fruit…………………………………………. I.1.2.1. Changes in Composition and Organoleptic Properties………………….. I.1.2.2. Respiration Pattern………………………………………………………. I.1.2.3. Fruit Maturity at Harvest and Postharvest Problems……………………. I.2. Grape and Wine…………………………………………………………………….... I.2.1. General Chemical Composition………………………………………..………. I.2.2. Phenolic Constituents and Their Functionality………………………………… I.3. Beer: Brewing Process and Chemical Composition…………………………………. References…………………………………………………………………………….…..
224489
1111131825
Chapter II. Fundamentals of the Analytical Methods Employed II.1. High Resolution Nuclear Magnetic Resonance (NMR) Spectroscopy of Liquids….
II.1.1 Principles of NMR Spectroscopy……………………………………………… II.1.2. NMR Spectral Parameters: Chemical Shift, Spin-Spin Coupling and Signal Area…………………………………………………………………………... II.1.3. Two-Dimensional (2D) NMR Spectroscopy………………………………….
II.2. NMR Spectroscopy of Solids……………………………………………………….. II.2.1. Nuclear Spin Interactions in Solids…………………………………………… II.2.2. High Resolution Solid-State NMR Techniques……………………………….
II.3. Hyphenated NMR Methods (HPLC-NMR and HPLC-NMR/MS)…………………. II.4. Fourier Transform Infrared (FTIR) Spectroscopy………………………………….. II.5. Some Multivariate Analysis Methods……………………………………………….
II.5.1. Principal Components Analysis (PCA)……………………………………….. II.5.2. Partial Least Squares (PLS) Regression ……………………………………… II.5.3. Canonical Correlation Analysis (CCA)……………………………………….
References………………………………………………………………………………...
3434
394250505153565960616262
Chapter III. Study of the Composition of Mango by NMR III.1. Introduction………………………………………………………………………… III.2. Materials and Methods……………………………………………………………..
III.2.1. Sample Preparation…………………………………………………………... III.2.2 NMR Measurements…………………………………………………………..
III.3. High Resolution NMR Study of Mango Juice……...…………………………….... III.3.1. Spectral Assignment…………………………………………………………. III.3.2. Compositional Differences Within and Between Cultivars………………….
III.4. NMR Study of Mango Pulp………………………………………………………... III.4.1. Standard Magic Angle Spinning (MAS) NMR.……………………………... III.4.2. High Resolution Magic Angle Spinning (HR-MAS) NMR…………………. III.4.3. Compositional Differences Between Pulp and Juice…………………………
III.5. Conclusions………………………………………………………………………… References………………………………………………………………………………...
66676768707080838385909394

xii
Chapter IV. Study of the Ripening Process of Mango: Physical and Biochemical Changes IV.1. Introduction………………………………………………………………………... IV.2. Materials and Methods……………………………………………………………..
IV.2.1. Sample Preparation………………………………………………………….. IV.2.2. Texture, pH, Soluble Solids and Enzymatic Determinations………………..
IV.2.3. NMR Measurements………………………………………………………… IV.3. Compositional Changes of Mango During Ripening………………………………
IV.3.1. Changes in Texture, pH and Soluble Solids………………………………… IV.3.2. Changes Assessed by NMR………………………………………………….
IV.3.2.1. Qualitative Changes in the Composition of Juices……………………. IV.3.2.2. Quantitative Analysis of Juices and Pulps……………………………..
IV.4. Preliminary Study of the Effect of Refrigeration on Mango Ripening….………… IV.4.1. Changes in Texture, pH and Soluble Solids………………………………… IV.4.2. Changes Assessed by NMR………………………………………………….
IV.5. Conclusions………………………………………………………………………... References………………………………………………………………………………..
98100100101102102102104104108115115117119120
Chapter V. Sugar Quantification in Mango Juice by Multivariate Analysis of FTIR and NMR Data V.1. Introduction………………………………………………………………………… V.2. Materials and Methods………………...…………………………………………… V.2.1. Sample Preparation…………………………………………………………... V.2.2. FTIR Measurements…………………………………………………………..
V.2.3. NMR Measurements…………………………………………………………. V.2.4. Enzymatic Determinations…………………………………………………...
V.2.5. Multivariate Analysis………………………………………………………… V.3. Sugar Quantification by Partial Least Squares (PLS)-FTIR………………………..
V.3.1. Application to Sugar Standard Solutions…………………………………….. V.3.2. Application to Mango Juices as a Function of Ripening……………………..
V.4. Sugar Quantification by Partial Least Squares (PLS)-NMR……………………….. V.4.1. Application to Sugar Standard Solutions…………………………………….. V.4.2. Application to Mango Juices as a Function of Ripening……………………..
V.5. Conclusions………………………………………………………………………… References………………………………………………………………………………..
126128128130130130131131131135138138142144144
Chapter VI. Study of Spoilage, Heat Treatment and Microbial Contamination in Mango Juices by NMR Spectroscopy VI.1 Introduction………………………………………………………………………… VI.2. Materials and Methods……………………………………………………………..
VI.2.1. Sample Preparation………………………………………………………….. VI.2.1.1. Culture of Microorganisms……………………………………………. VI.2.1.2. Preparation of Spores Suspensions……………………………………. VI.2.1.3. Preparation and Inoculation of Juices…………………………………. VI.2.2. Soluble Solids, pH and Enzymatic Determinations…………………………. VI.2.3. NMR Measurements…………………………………………………………
148150150150150151152152

xiii
VI.3. Natural Mango Juice: Changes Upon Spoilage, Heat Treatment and Microbial Contamination………………………………………………………………...
VI.3.1. Changes Assessed by Soluble Solids and pH……………………………….. VI.3.2. Changes Assessed by NMR Spectroscopy…………………………………..
VI.3.2.1. Effect of Natural Spoilage…………………………………………….. VI.3.2.2. Effect of Heat Treatment……………………………………………… VI.3.2.3. Effect of Inoculation with Penicillium expansum……………………..
VI.4. Commercial Mango Juice: Changes Upon Microbial Contamination…………….. VI.4.1. Changes Assessed by Soluble Solids and pH……………………………….. VI.4.2. Changes Assessed by NMR Spectroscopy…………………………………..
VI.4.2.1. Effect of Inoculation with Penicillium expansum……………………... VI.4.2.2. Effect of Inoculation with Neosartorya fischeri……………………….
VI.5 Conclusions………………………………………………………………………… References………………………………………………………………………………..
153153154154163164170171172172177181183
Chapter VII. Application of Hyphenated NMR (HPLC-NMR and HPLC-NMR/MS) for the Detection of Minor Components in Fruit Juices and Wine VII.1. Introduction………………………………………………………………………. VII.2. Materials and Methods…………………………………………………………… VII.2.1. Sample Preparation………………….……………………………………... VII.2.2. Instrumentation and Measurements……………………………….……….. VII.3. Characterisation of Carbohydrates in Mango Juice………………………………. VII.3.1. Application to Fresh Mango Juices..………………………………..……… VII.3.2. Application to Spoiled and Contaminated Mango Juices….………..……… VII.4. Characterisation of Aromatic Compounds in Grape Juice……………………….. VII.5. Characterisation of Aromatic Compounds in a Wine Phenolic Extract………….. VII.6. Conclusions………………………………………………………………………. References………………………………………………………………………………..
186 187 187 187 190 190 196 200 212 216 217
Chapter VIII. Characterisation of Beer Composition by NMR and Hyphenated NMR (HPLC-NMR/MS) VIII.1. Introduction……………………………………………………………………… VIII.2. Materials and Methods…………………………………………………………... VIII.2.1. Sample Preparation……………………………………………………. VIII.2.2. NMR and HPLC-NMR/MS Measurements…………………………… VIII.3. Characterisation of Beer Composition by High Resolution NMR ……………… VIII.4. Characterisation of Beer Composition by HPLC-NMR/MS…………………….. VIII.4.1. Application to Carbohydrates………………………………………….. VIII.4.2. Application to Aromatic Compounds…………………………………. VIII.5. Conclusions……………………………………………………………………… References………………………………………………………………………………..
222 223 223 223 226 233 233 240 244 244

xiv
Chapter IX. Multivariate Analysis of NMR and FTIR of Beer as a Potential Tool for Beer Quality Control IX.1. Introduction………………………………………………………………………... IX.2. Materials and Methods……………………………………………………………..
IX.2.1. Sample Preparation………………………………………………………... IX.2.2. Spectroscopic Measurements……………………………………………… IX.2.3. Multivariate Analysis………………………………………………………
IX.3. Principal Components Analysis (PCA) of NMR Data……………………………. IX.4. Principal Components Analysis (PCA) of FTIR Data…………………………….. IX.5. Canonical Correlation Analysis (CCA) of NMR and FTIR Data…………………. IX.6. Conclusions………………………………………………………………………... References………………………………………………………………………………...
248 249 249 249 251 251 261 263 265 266
Chapter X. Final Conclusions and Future Work……………………………………….. 270
Appendix NMR Pulse Programs Used in This Work…..…………………………………….…….. 278

xv
Abbreviations & Symbols ? chemical shift (in ppm) ? ?1/2 line width at half height ATR attenuated total reflectance CCA canonical correlation analysis CV canonical variate COSY correlation spectroscopy DAD diode array detector FID free induction decay FT Fourier transform FTIR Fourier transform infrared (spectroscopy) HMQC heteronuclear multiple quantum correlation HPLC high-performance liquid chromatography HR-MAS high resolution-magic angle spinning HSQC heteronuclear single quantum correlation J coupling constant LB line broadening m/z mass over charge MAS magic angle spinning MLEV-17 Malcom Levitt’s composite-pulse decoupling sequence Mw molecular weight MS mass spectrometry NMR nuclear magnetic resonance PC principal component PCA principal component analysis PDA potato dextrose agar PLS partial least squares (regression) ppm parts per million r.f. radiofrequency RMSECV root mean square error of cross validation RMSEP root mean square error of prediction RT retention time S/N signal-to-noise SR spinning rate SS soluble solids SSB spinning side band T1 longitudinal (spin- lattice) relaxation time T2 transverse (spin-spin) relaxation time TA titratable acidity TIC total ion current TOCSY total correlation spectroscopy TSP sodium 3-(trimethylsilyl)-propionate UV ultraviolet

xvi

I. COMPOSITIONAL AND BIOCHEMICAL ASPECTS OF THE FOOD SYSTEMS
STUDIED
I.1. Mango Fruit…………………………………………………………………………..
I.1.1. General Chemical Composition………………………………………………..
I.1.2. The Ripening Process of Mango Fruit………………………………………….
I.1.2.1. Changes in Composition and Organoleptic Properties…………………..
I.1.2.2. Respiration Pattern……………………………………………………….
I.1.2.3. Fruit Maturity at Harvest and Postharvest Problems…………………….
I.2. Grape and Wine……………………………………………………………………....
I.2.1. General Chemical Composition………………………………………..……….
I.2.2. Phenolic Constituents and Their Functionality…………………………………
I.3. Beer: Brewing Process and Chemical Composition………………………………….
References…………………………………………………………………………….…..
2
2
4
4
8
9
11
11
13
18
25
Chapter I
2
I.1. Mango Fruit
Mango fruit, or the fruit of Mangifera indica L. of the family Anacardiaceae, is one
of the world’s most important fruit crops in terms of production, acreage and popularity.
The world production of mangoes in 1996 was 19.2 million tons, 75% of which were
produced in Asian countries (Belitz and Grosch, 1999). European countries do not produce
mango and import it from countries like India (the major producer), Thailand, Brazil and
Venezuela. Among the hundreds of cultivars grown all over the world, only a few are
grown commercially, some of the most often found in the European market being the
Alphonso, Haden, Kent, Keitt and Tommy Atkins cultivars.
I.1.1. General Chemical Composition
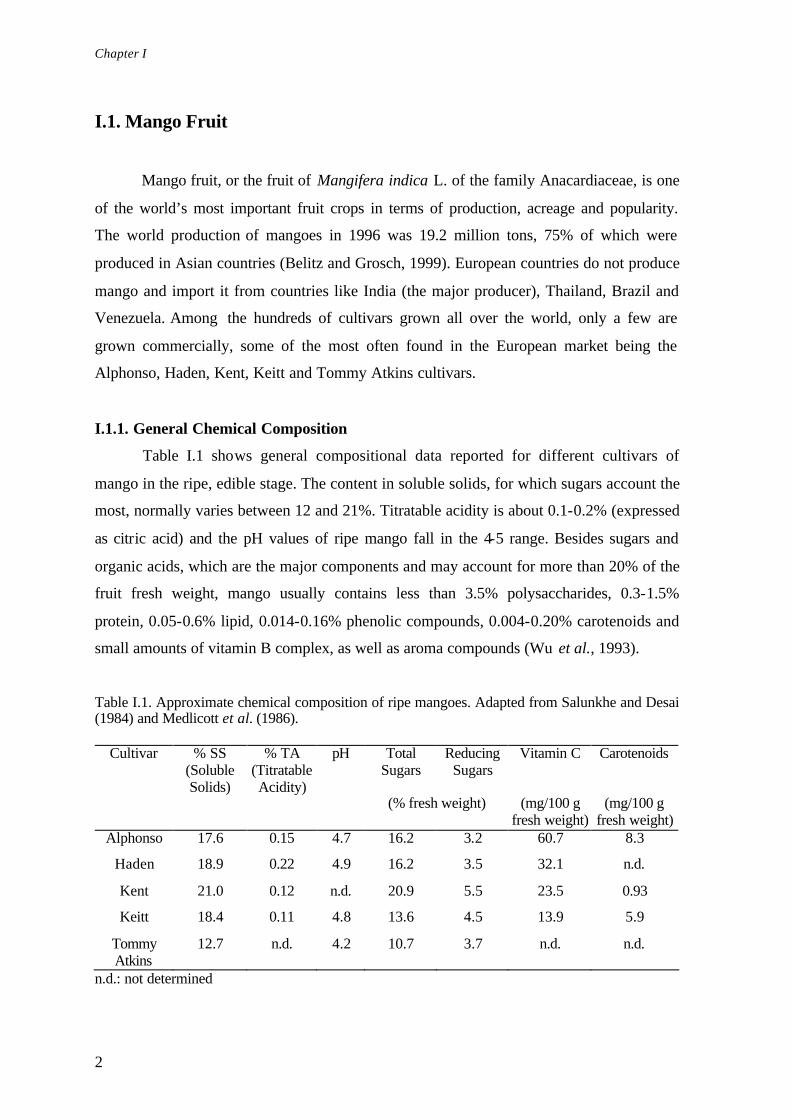
Table I.1 shows general compositional data reported for different cultivars of
mango in the ripe, edible stage. The content in soluble solids, for which sugars account the
most, normally varies between 12 and 21%. Titratable acidity is about 0.1-0.2% (expressed
as citric acid) and the pH values of ripe mango fall in the 4-5 range. Besides sugars and
organic acids, which are the major components and may account for more than 20% of the
fruit fresh weight, mango usually contains less than 3.5% polysaccharides, 0.3-1.5%
protein, 0.05-0.6% lipid, 0.014-0.16% phenolic compounds, 0.004-0.20% carotenoids and
small amounts of vitamin B complex, as well as aroma compounds (Wu et al., 1993).
Table I.1. Approximate chemical composition of ripe mangoes. Adapted from Salunkhe and Desai (1984) and Medlicott et al. (1986).
Cultivar % SS (Soluble Solids)
% TA (Titratable Acidity)
pH Total Sugars
Reducing Sugars
Vitamin C
Carotenoids
(% fresh weight) (mg/100 g fresh weight)
(mg/100 g fresh weight)
Alphonso 17.6 0.15 4.7 16.2 3.2 60.7 8.3
Haden 18.9 0.22 4.9 16.2 3.5 32.1 n.d.
Kent 21.0 0.12 n.d. 20.9 5.5 23.5 0.93
Keitt 18.4 0.11 4.8 13.6 4.5 13.9 5.9
Tommy Atkins
12.7 n.d. 4.2 10.7 3.7 n.d. n.d.
n.d.: not determined

Compositional and Biochemical Aspects of the Food Systems Studied
3
The principal sugars present in mango are glucose, fructose and sucrose, reported to
occur in the ripe fruits of different cultivars at 1.0-3.2%, 4.0-5.6%, and 6.3-9.6% of fresh
weight, respectively (Wu et al., 1993). Small amounts of xylose, arabinose and heptulose
have also been detected. In what concerns polysaccharides, mango usually contains 1.0 to
3.5% of alcohol- insoluble solids (AIS), which include residual starch, pectin, cellulose and
hemicellulose (Wu et al., 1993).
Citric acid is usually the predominant organic acid in mango, malic and succinic
acids being also found in significant quantities (Lizada, 1993). The minor organic acids
which have been identified in ripe mango pulp include oxalic, malonic, tartaric, pyruvic,
glucuronic, galacturonic, ? -ketoglutaric and ascorbic acids (Hulme, 1971; Wu et al.,
1993). Mango is a good source of ascorbic acid (vitamin C), the reported values per 100 g
of ripe mango pulp varying between 1.5 and 175 mg (Wu et al., 1993). Differences in
cultivar and postharvest storage conditions may account for this large variation. Besides
the acids indicated above, quinic and shikimic acids are also found in mango, as shown in
this work (Chapter III) for the first time to our knowledge.
Like the majority of fruits, mango is a poor source of protein, the total content for
most cultivars falling within the range of 0.5 to 1.5% of fresh weight. The free amino acid
profile differs significantly among cultivars and stages of maturity. Nevertheless, alanine,
glutamic acid, serine and aspartic acid are usually among the major free amino acids (Wu
et al., 1993; Kalra et al., 1995).
Lipids are found in low contents in mango (0.05-0.6% of fresh weight). The oil
extracted from ripe “Alphonso” fruit has been seen to contain mostly triglycerides, while
monoglycerides, diglycerides and phospholipids were present in small amounts. Myristic,
palmitic, palmitoleic, stearic, oleic, linoleic and linolenic acids (some of which are shown
in Figure I.1a) are commonly among the fatty acids found in ripe mangoes of several
cultivars, although with different quantitative distributions (Wu et al., 1993). The amount
and proportion of these compounds are thought to influence the flavour of mango pulp. In
particular, it has been reported that the cultivars with stronger aroma had lower
palmitic/palmitoleic ratios (Wu et al., 1993).
Phenolic compounds also make an important contribution to the flavour of mango
fruit, namely with respect to the astringency of green pulp, even though they are present in
very small quantities (0.014-0.16% of fresh weight). There is not much data on the identity

Chapter I
4
of the phenolics present in mango, as the analysis of these compounds is hindered by their
low concentrations and by their physical/chemical interactions with other components (e.g.
polysaccharides). Gallic acid, m-digallic acid, m-trigallic acid, mangiferin and ellagic acid
are the main phenolic compounds identified (Wu et al., 1993), some of which are shown in
Figure I.1b.
Mango contains some vitamins of the B complex, namely thiamine (B1), riboflavin
(B2) and niacin (Figure I.1c). The ranges found for the amounts of these vitamins in ripe
mangoes are, respectively, 0.06-0.08, 0.07-0.09 and 0.06-0.9 mg/100 g of pulp, niacin
being the most abundant (Wu et al., 1993).
Mango is a rich source of carotenoid pigments capable of being converted by the
human body into vitamin A. In most cultivars, more than half of the total carotenoid
content consists of ? -carotene (Wu et al., 1993; Lizada, 1993). Other carotenoids in fresh
mango pulp, recently identified by HPLC and mass spectrometry, include ? -cryptoxanthin,
zeaxanthin, luteoxanthin, neoxanthin and violaxanthin (Mercadante et al., 1997). The
structures of some of these pigments are shown in Figure I.1d. The carotenoid composition
of mango may, however, change significantly during processing. For instance, Cano and
Ancos (1994) verified that the pigment pattern of fresh mango fruit changed slightly upon
freezing and drastically upon canning of mango slices into syrup, which showed a dark
orange colour, different from that of the fresh fruit.
The aroma of mango varies markedly between cultivars and is related to the
complex volatile composition of the fruit. More than a hundred volatile components have
been identified in ripe mango, the major ones being terpenes, although several other
hydrocarbon esters and alcohols were also found to be present (MacLeod and Pieris, 1984;
Idstein and Schreir, 1985; Wilson et al., 1986; Wu et al., 1993). Cis-ocimene, myrcene,
car-3-ene, limonene and ? -terpinolene are among the most important aroma compounds
(some structures are shown in Figure I.1e). More recently, mango glycosidically bound
volatile compounds have also been characterised (Sakho et al., 1997).
I.1.2. The Ripening Process of Mango Fruit
I.1.2.1. Changes in Composition and Organoleptic Properties
Ripening may be defined as the process through which the fruit attains edible
quality, involving drastic changes in flavour, colour and texture properties. The flavour of

Compositional and Biochemical Aspects of the Food Systems Studied
5
a) Fatty acids Stearic acid 18:0
COOH
Oleic acid 18:1 (9)
COOH Linoleic acid 18:2 (9, 12)
COOH b) Phenolic compounds Gallic acid
OH
OH
HO COOH
Ellagic acid O
O
HO
HO OH
OH
O
O c) Vitamins L-Ascorbic acid
O
CH2 -OH
H OH
HO OH
O
Thiamine
N
N
NH2
H3C
N
S
CH3
CH 2 - CH2OH
Niacin
N
COOH
Riboflavin
N
N
N
NH
O
O
H3C
H3C
CH2
H OH
H OH
CH2OH
H OH
d) Pigments
e) Aroma Compounds (terpenes)
?-Carotene
cis-Ocimene
Zeaxanthin
HO
OH
Myrcene
Limonene
Figure I.1. Examples of some compounds found in low abundance in mango fruit.

Chapter I
6
the fruit depends on the complex interaction of sugars, organic acids, phenolic compounds
and more specialised flavour compounds, including a wide range of volatiles. The colour
changes are determined by the degradation and synthesis of different pigments, while the
variations in texture reflect changes in cell wall composition and structure. The variations
of those compounds during mango fruit ripening are briefly described in the next few
paragraphs.
Most starch that has accumulated in the mature green fruit (which can be as high as
13%) is hydrolysed during ripening and the ripe fruit usually contains negligible levels of
this polysaccharide (Salunkhe and Desai, 1984; Selvaraj et al., 1989). As a consequence of
starch hydrolysis, associated with the activity of the enzyme amylase, total sugars increase
during ripening, although a net loss may occur at late stages, probably due to the
intensification of respiration and lack of starch reserves to replenish the sugars being
metabolised (Lizada, 1993; Medlicott and Thompson, 1985). In addition, it is possible that
some gluconeogenesis, that is the biosynthesis of glucose from noncarbohydrate precursors
such as organic acids, can also occur during ripening, although this is expected to account
for only a small percentage of the sugar accumulating in the fruit (Tucker, 1993). Sucrose
usually registers the largest increase, remaining the predominant sugar throughout
ripening. Fructose has also been reported to increase, while glucose has shown a
decreasing trend in some cultivars (Medlicott and Thompson, 1985; Medlicott et al., 1986).
Similarly to other fruits, the total acidity has been consistently observed to decrease
during mango ripening (and the pH values to increase from about 3.0 to 5.0), probably due
to the utilization of organic acids as respiratory substrates. Citric acid declines in all mango
cultivars examined (from 125-500 mg/100g in unripe fruit to 54-123 mg/100g in ripe fruit,
according to Selvaraj et al., 1989), but malic acid exhibits different patterns of changes in
different cultivars (Medlicott et al., 1986; Selvaraj et al., 1989). Little information is
available on the variations of minor organic acids and amino acids. Selvaraj et al. (1989)
registered no significant changes in the concentration of total soluble amino acids during
ripening, although the total amount present at different ripening stages varied significantly
between different cultivars. In addition, the levels of arginine, phenylalanine, aspartate,
glutamate, lysine, threonine and serine have been found to decline in some mango
cultivars, while the levels of alanine, valine, leucine, isoleucine, ?-aminobutyric acid and
proline were seen to increase upon ripening (Kalra et al., 1995).

Compositional and Biochemical Aspects of the Food Systems Studied
7
The progressive loss of astringency of some mango cultivars has been associated
with the total phenolic content decrease (particularly in the levels of tannins). However,
there are non-astringent cultivars for which the phenolics were not seen to decrease in the
course of ripening (Lizada, 1993), which indicates that astringency is determined not only
by the total phenolic content, but also by the specific phenolic compounds present and their
interaction with other components, as observed for other fruits (Spanos and Wrolstad,
1992).
The content and composition of lipids vary throughout ripening and are related to
mango aroma (Lizada, 1993). Total lipids, unsaponifiables and total fatty acids have been
seen to increase during mango ripening, whereas free fatty acids and phospholipids were
seen to decrease (Selvaraj et al., 1989). The decreasing pattern of free fatty acids is related
to their role as a potential source for the synthesis of other metabolites, including aroma
compounds, such as alcohols, esters, and terpenes.
The most common variation in the peel colour of mango during ripening is from
green to yellow/orange due to chlorophyll degradation and carotenoids synthesis. There are
also cultivars that develop a reddish blush, which has been attributed to anthocyanins,
while others retain most of the green colour, even at the full ripe stage. The pulp usually
develops a more intense yellow colour, due to the continuous increase in the levels of
carotenoids (Lizada, 1993). The rate and magnitude of carotenoids accumulation increase
with the ripening temperature, in the range 12-37ºC, as shown by Medlicott et al. (1986).
The fruit texture is an important quality attribute since it is directly related to shelf
life, susceptibility to bruising and consumer appeal. Mango ripening is accompanied by
pronounced softening, which strongly limits its marketable life. Therefore, there has been a
lot of interest in studying the changes in cell-wall components and the enzymes that are
thought to be associated with tissue softening (Tucker and Seymour, 1991; Aina and
Oladunjoye, 1993; El-Zoghbi, 1994; Muda et al., 1995; Labib et al., 1995). These changes
are often more apparent in the pectic components of the cell wall and usually involve an
increase in pectin solubility, a decrease in pectin molecular weight and a loss of pectic
neutral sugars (such as arabinose and galactose) from the cell wall into the liquid phase.
The exact biochemical mechanisms which are responsible for these events are not clear,
but it is likely that some of these wall modifications are brought about by pectolytic
enzymes such as polygalacturonase, pectinesterase or galactosidase.

Chapter I
8
I.1.2.2. Respiration Pattern
The ripening process requires the synthesis of novel proteins and nucleic acids, as
well as new pigments and flavour compounds. These anabolic processes require both
energy and a supply of carbon skeleton building blocks which in fruit, just as in other
tissues, are supplied by respiration.
The two major respiratory substrates in fruits are sugars and organic acids. They are
both found largely sequestered within the vacuole, and form a major contribution to the
overall flavour of the fruit. However, they are presumably also released in a controlled
manner from the vacuole, or alternatively a separate pool is maintained, and hence are
available for respiration (Tucker, 1993). The respiratory pathways utilised by the fruit for
the oxidation of sugars are those common to all plant tissues namely glycolysis, oxidative
pentose phosphate pathway (OPP) and the tricarboxylic acid (TCA) pathway (Voet and
Voet, 1990). In what regards organic acids, citrate and succinate can feed directly into the
TCA cycle, while malate is first decarboxylated to pyruvate, which can then be fed into the
TCA cycle. However, the control and utilization of these metabolic pathways during fruit
ripening is still poorly understood.
Fruits in general can be classified as either climateric or nonclimateric on the basis
of their respiration pattern during ripening. Mango fruit is of the climateric type (similarly
to apple, banana, peach, etc.) meaning that it displays a characteristic peak of respiratory
activity during ripening. Moreover, there is an increase in the production of ethylene, a
plant growth regulator that promotes ripening. In contrast, non-climateric fruit (e.g. citrus,
grape, pineapple) simply exhibit a gradual decline in their respiration during ripening and
the endogenous levels of ethylene remain low (Tucker, 1993). The role of the climateric
peak in ripening is still unclear. Increased levels of ATP may be required to drive ripening
events such as starch breakdown, or nucleic acid, protein and pigment synthesis. However,
the calculated energy demand in most fruit during ripening is much less than that produced
during the climateric period, and non-climateric fruit ripen without any increase in
respiration. Thus, it is thought that respiration is neither dependent on, nor integrated with,
the other ripening events. It is possible that respiratory increases result simply as a general
response to the ethylene produced by climateric fruit (Tucker, 1993).

Compositional and Biochemical Aspects of the Food Systems Studied
9
I.1.2.3. Fruit Maturity at Harvest and Postharvest Problems
The stage of maturity at harvest is an important factor determining mango fruit
quality, especially when the fruit is being exported to distant market places. Mangoes
harvested immature fail to ripen properly and, conversely, ripe mangoes are highly
susceptible to bruising and mechanical damage during handling and transport, and will
decay rapidly during storage. Therefore, mangoes to be exported should be harvested in the
physiologically mature, hard, green condition.
The common indices utilised to assess mango fruit maturity comprise several
physical parameters such as size, shape, weight, peel and pulp colour, specific gravity, and
other measurements such as firmness, total soluble solids, acidity, total carotenoids and
phenolics (Kalra et al., 1995). Moreover, in recent years, methods to estimate the maturity
of mango in a non-destructive way have been investigated. Guthrie and Walsh (1997)
measured the NIR spectra of intact mango fruit and showed that the spectral features
correlated well with mango pulp dry matter; Barcelon et al. (1999) used an X-ray scanner
and found high correlations between this non- invasive measurement and some
physicochemical properties, namely density, moisture content, soluble solids, titratable
acidity and pH; and Mizrach et al. (1999) established relationships between ultrasonic
measurements and storage time, firmness, sugar content and acidity.
The recommended conditions for ripening mangoes are 80-90% relative humidity
and temperatures in the 20-30ºC range. Higher temperatures may result in ripe fruit with
low, undesirable sugar/acid ratios, off- flavours and pitting of the peel. Initiation,
synchronisation and acceleration of ripening may be achieved by exposure to ethylene gas.
Ripening may also be promoted by other
chemicals, such as abscisic acid (Figure I.2),
ethrel (2-chloroethylphosphoric acid) and
acetylene gas liberated from calcium carbide in
water (Wu et al., 1993).
OCOOH
Figure I.2. Structure of abscisic acid.
The major causes of postharvest losses in mango fruit are mechanical damage
(which may be avoided by careful handling), microbial infection and fast ripening.
Anthracnose, caused by fungal infection with Glomerella cingulata, and stem-end-rot,
caused by Gloeosporium magiferae, are some of the most important diseases affecting
Chapter I
10
mango trees and fruit. Their incidence can be reduced by good orchard management,
preharvest cultural practices, appropriate handling of the fruit and postharvest treatment
procedures, such as hot-water treatments (Jacobi and Giles, 1997; Nyanjage et al., 1998).
Microbial infection may also take place during storage and processing of mango fruit, and
detection of contamination is critical for efficient quality control and safety assurance.
Mango ripening may be delayed by storage at temperatures lower than 20ºC, which
reduces the respiration rate and possib ly lowers the production of ethylene (Kalra et al.,
1995). However, the lowest safe temperature is 10-13ºC, since storage below this
temperature range results in chilling injury, leading to a drastic reduction in fruit quality
and increased spoilage. The symptoms of chilling injury include pitting, greyish scald- like
discolouration of the skin, increased water loss, poor development of pulp colour and
flavour, higher acidity with lower sugar content, and reduced resistance to pathogens
(Salunkhe and Desai, 1984; Wu et al., 1993).
There are other postharvest technologies which may be employed to delay ripening,
although none is well established in the case of mango. Some success has been achieved
with experiments on controlled atmosphere storage (relatively low O2 and high CO2
concentration), currently used for the major temperate fruit crops. However, flavour
problems due to anaerobic respiration and increased ethanol production have been reported
to limit the application of this technology to mango fruit (Wu et al., 1993). More recently,
precooling treatments, namely water cooling (Puttaraju and Reddy, 1997) and modified
atmosphere storage techniques, such as plastic bagging (Pesis et al., 2000) and skin coating
(Baldwin et al., 1999), have shown promising results in the extension of mango fruit shelf
life.
Solutions to the postharvest problems of mango fruit, which are particularly
relevant for importing markets like European countries, may come from a better
understanding of the chemical and biochemical changes occurring during the processes
affecting fruit quality, namely ripening and microbial decay. Mango fruit has thus been
chosen for the investigation presented in this thesis (Chapters III to VI), concerning
composition, ripening and microbial contamination studies, conducted by means of the
modern and powerful spectroscopic techniques that nuclear magnetic resonance
spectroscopy and infrared spectroscopy are.

Compositional and Biochemical Aspects of the Food Systems Studied
11
I.2. Grape and Wine
I.2.1. General Chemical Composition
Grapevine belongs to the genus Vitis (family Ampelidaceae), which includes
several species, the species of European origin Vitis vinifera being, by far, the one with
higher economical importance. The major components of grapes are carbohydrates,
organic acids and amino acids, whereas a wide range of phenolics and volatiles are present
at much lower levels (Table I.2).
Table I.2. Major components of grape juice and their corresponding quality attributes (McLellan and Race, 1995).
Chemical class Concentration (g/100 ml)
Quality attribute
Carbohydrates 20 Sweetness
Acids 1 Sourness Phenolics 0.1 Colour and astringency
Volatiles 0.0001 Aroma
Glucose and fructose account for 99% or more of the carbohydrates in grape juice
and for 12 to 27% of the fresh weight of the mature berry, constituting a large proportion
of the total soluble solids. In unripe grapes, glucose accounts for 85% of the sugar content,
while in ripe grapes there is generally a slight excess of fructose (Peynaud and Ribéreau-
Gayon, 1971). Minor sugars identified in grapes inc lude arabinose, xylose, sucrose (less
than 0.1% in ripe berries), raffinose, stachyose, melibiose, maltose and galactose (Kanellis
and Roubelakis-Angelakis, 1993).
The acid fraction of grape consists mainly of tartaric and malic acids, which
account for about 90% of the total acidity. Other acids found in minor amounts are citric
(5-10% of total acidity), isocitric, succinic, fumaric, acetic, pyruvic, glycolic, lactic,
aconitic, quinic, shikimic and mandelic acids. The resulting pH of grape juice typically
ranges from 3 to 4. Proline, threonine and glutamic acid are usually the most abundant
amino acids, with concentrations typically ranging from 170 to 330 mg/L but many other
amino acids are present, the total amount ranging from 2 to 8 g/L (Kanellis and
Roubelakis-Angelakis, 1993).
Grapes, especially black grapes, contain a wide range of phenolic compounds,
including benzoic acids, cinnamic acids, flavonols, anthocyanins, as well as various

Chapter I
12
flavans which constitute the tannin precursors. The presence and importance of these
compounds in grapes in further discussed in the next section, since their detection and
identification in grape juice is one of the subjects investigated in this thesis.
Aroma is a significant and complex character of grape quality, distinctive of the
different fruit varieties. It consists of a natural blend of several hundred chemically
different compounds, which are synthesised during ripening and localised mainly in the
skin of the berries. In general, the most abundant aroma compounds in grapes are the
monoterpenes linalool and geraniol. Certain alcohols such as benzyl and 2-phenylethyl
alcohols, as well as several esters and aldehydes are also among the compounds
responsible for grape aroma (Kanellis and Roubelakis-Angelakis, 1993).
The largest percentage of the world’s grape production is used for wine making.
Resulting from the fermentation of the juice of grapes, wine is a complex mixture of
compounds, which are derived from grapes, produced or metabolised by yeast during
fermentation, extracted from oak, and formed from chemical reactions that occur during
processing and ageing. The typical gross composition of table wines is given in Table I.3.
Table I.3. Typical gross composition (% by weight) of white and red wines. Adapted from Ebeler (1997).
Component White wine Red Wine
Water 87 87 Ethanol 10 10
Other volatiles 0.04 0.04 Glycerol and related 1.10 1.10
Sugar 0.05 0.05
Pectin and related 0.30 0.30 Acids 0.70 0.60
Amino acids and related 0.25 0.25
Phenolic compounds 0.01 0.02 Vitamins and other micronutrients 0.01 0.01
Lipids 0.01 0.02
Ash 0.20 0.20
Among the alcohols present in wine, ethanol is, naturally, the most abundant, with
amounts varying between 55 and 110 g/L (Belitz and Grosch, 1999). Methanol (38-200

Compositional and Biochemical Aspects of the Food Systems Studied
13
mg/L) and higher alcohols such as propyl, butyl and amyl alcohols are also present. There
are hundreds of other volatile compounds, namely terpenes and esters, which are present in
small quantities, and originate both from the grapes and from fermentation. Polyols form
another class of compounds with relevant contribution to the flavour of wine, glycerol (6-
10 g/L) often being the third major wine component after water and ethanol. Other polyols
include 2,3-butanediol, derived from diacetyl by yeast fermentation and usually present at
0.4-0.7 g/L, sorbitol, found in very low amounts, and mannitol, which is not present in
healthy wines bur may reach levels up to 35 g/L in spoiled, bacteria- infected wines (Belitz
and Grosch, 1999).
Sugars are present in highly variable concentrations, glucose and fructose being the
most abundant. The average ratio of glucose to fructose is 0.6:1.0 but it varies to a great
extent. Other sugars present in wine include rhamnose and the nonfermentable pentoses
arabinose, xylose and ribose (Belitz and Grosch, 1999).
Wine acids originally present in grapes are tartaric (which is the most abundant),
malic and citric acids, whereas the major acids resulting from fermentation are succinic,
lactic, acetic and carbonic (carbon dioxide) acids (Belitz and Grosch, 1999). Amino acids
are present in concentrations of about hundreds of milligrams per litre, with the exception
of proline, which can reach very high amounts (3.5 g/L).
Phenolic compounds play a decisive role in the make-up of a wine’s character,
especially of red wines. Some originate from the grapes and others are formed in the
maturation process. The phenolic composition of wine will be addressed with more detail
in the following section.
I.2.2. Phenolic Constituents and Their Functionality
Phenolic compounds constitute one of the most numerous and ubiquitous groups of
plant metabolites, ranging from simple molecules to highly polymerised compounds with
molecular weights greater than 30000 Da (Bravo, 1998). They are generally important with
respect to various sensory qualities of plant foods and beverages, such as colour, bitterness
and astringency. Moreover, interest in food phenolics has increased greatly in recent years,
owing to their antioxidant capacity (free radical scavenging and metal chelating activities)
and their possible beneficial implications in human health, such as in the treatment and
prevention of cancer, cardiovascular disease and other pathologies. In this regard, the

Chapter I
14
‘French paradox’ is often cited, referring to the lower prevalence of heart attacks in France
than in other countries where the consumption of saturated fat is similar, and ascribing the
difference to red wine in French diet. The nutritional effects of the main groups of phenolic
compounds, including their metabolism, effects on nutrient bioavailability, and antioxidant
activity have been recently reviewed by Bravo (1998). The purpose of this section is
simply to acquaint the reader with the main phenolic compounds found in grape and wine,
and the methods commonly employed for their analytical determination.
Figure I.3 illustrates the structures of phenolic compounds commonly occurring in
grape and wine. Table I.4 presents quantitative data reported for some of these substances
in white and red wines.
Benzoic (C7) and cinnamic acids (C6-C3) belong to the group of phenolic acids
(Figures I.3a and I.3b) and usually occur in combination with other compounds, namely in
the form of esters. Compared to other free benzoic acids, such as gentisic and vanillic
acids, gallic acid has been consistently observed to predominate in several white and red
wines (Soleas et al., 1997). Among the free cinnamic acids (e.g. caffeic, coumaric, ferulic),
caffeic has been found to be the most abundant (Soleas et al., 1997). These acids may also
be esterified with several compounds, such as glucose, tartaric, quinic, shikimic and malic
acids. The most common combination in grapes is with tartaric acid, trans-caffeoyltartaric
acid (caftaric acid) and p-coumaroyltartaric acid (coutaric acid) being the most abundant
(Spanos and Wrolstad, 1992).
The other main group of phenolic compounds is the group of flavonoids, which are
built upon a diphenylpropane skeleton (C6-C3-C6) in which the three-carbon bridge
between the phenyl groups is usually cyclized with oxygen. The different classes within
the group differ in the number of substituent hydroxyl groups, degree of unsaturation, and
degree of oxidation of the three-carbon segment. Flavonols (Figure I.3c) occur mostly as
glycosides. The flavonols identified in grapes and wines include 3-glucosides of quercetin,
myricetin and kaempferol, quercetin-3-rhamnoside, kaempferol-3-galactoside and
quecetin-3-glucoronide (Kanellis and Roubelakis-Angelakis, 1993). Anthocyanins are the
major pigments of grapes and impart the characteristic colour of red wine. They are present
as the anthocyanidins (Figure I.3d) modified by attachment of a glucose molecule at the 3-
OH position, or by attachment of glucose at both the 3 and 5 positions. Further
complication can result from the esterification of the glucose OH groups with cinnamic

Compositional and Biochemical Aspects of the Food Systems Studied
15
Phenolic Acids
a) Benzoic acids
R1
R2
HO
H
H
COOH
R1=R2=H: p-hydroxybenzoic R1=R2=OH: gallic R1=OH, R2=H: protocatechuic R1=OCH3, R2=H: vanillic
H
R
H
OH
H
COOH
R=OH: gentisic acid R=H: salicylic acid
b) Cinnamic acids
CH COOHCH
R1
R2
HO
H
H
R1=R2=H: p-coumaric acid R1=OH, R2=H: caffeic acid R1= OCH3, R2=H: ferulic acid
Flavonoids
c) Flavonols
O
O
OH
R1
R2
OH
OH
HO
R1=R2=H: kaempferol R1=OH, R2=H: quercetin R1=R2=OH: myricetin
d) Anthocyanidins
R1
R2
OH
OH
HO O+
OH
R1=OH, R2=H: cyanidin R1=OCH3, R2=H: poenidin R1=R2=OH: delphinidin R1=OCH3, R2=OH: petunidin R1=R2=OCH3: malvidin
e) Proanthocyanidins (flavan-3-ol oligomers)
O
R1R2
OH
OH
R3
OH
HO
Procyanidin monomers: R1=OH, R2=R3=H: epicatechin R1=H, R2=OH, R3=H: catechin R1=gallic acid ester, R2=R3=H: epicatechin gallate R1=H, R2=gallic acid ester, R3=H: catechin gallate Prodelphinidin monomers: R1=OH, R2=H, R3=OH: epigallocatechin R1=H, R2=OH, R3=OH: gallocatechin R1= gallic acid ester, R2=H, R3=OH: epigallocatechin gallate R1=H, R2=gallic acid ester, R3=OH: gallocatechin gallate
Figure I.3. Structures of some phenolic compounds commonly present in grape and wine. Adapted from Peynaud and Ribéreau-Gayon (1971).

Chapter I
16
acids (e.g. caffeic, p-coumaric) and acetic acid. The 3-glucosides of malvidin, delphinidin,
cyanidin, petunidin and peonidin have been identified in grape and wine extracts, as well
as some p-coumaroyl and caffeoyl derivatives, and some diglucosidic derivatives (Baldi et
al., 1995; Wang and Sporns, 1999). Proanthocyanidins (also called condensed tannins) are
oligomers of flavan-3-ol monomer units (Figure I.3e). The most common classes are the
procyanidins, which are chains of catechins, epicatechins and their gallic acid esters, and
the prodelphinidins, which consist of gallocatechin, epigallocatechin and their galloylated
derivatives as the monomeric units. In grapes, the bulk of the polymeric flavan-3-ols is
found in the seeds, although they are also distributed through the skin and pulp of the fruit.
In wines, the normal flavan-3-ol concentration is about 10-50 mg/L in white wine, and 800
mg/L in red wine, although these values significantly depend on many factors such as
grape variety, environmental conditions and fermentation practises (Thorngate, 1993). The
identification of monomers, dimers, trimers and higher oligomers in grape and wine has
been recently carried out by several workers, by coupling liquid chromatography with
mass spectrometry (Lazarus et al., 1999; Pascual-Teresa et al., 2000).
Table I.4. Concentration ranges (mg/L) of some phenolics found in white and red wines. Adapted from Goldberg et al. (1996), Soleas et al. (1997) and Viñas et al. (2000).
Phenolic compound White wine Red Wine
Gallic acid <1-2.80 13.08-30.67 Gentisic acid 0.05-0.38 0.44-0.46
Vanillic acid 0.09-0.21 2.3-3.7 Caffeic acid 1.51-5.20 3.15-12.95
p-Coumaric acid 1.57-3.21 2.61-4.5
Ferulic acid <1-4.42 <1-2.86 Catechin 3.80-4.20 50-213
Epicatechin 1.70-3.80 25-82
Quercetin n.d. 0.50-5.26 cis-Resveratrol <0.10 0.27-0.88
trans-Resveratrol <0.26 0.71-2.50
There is a wide range of methods reported in the literature for the determination of
the different phenolic classes described above. The most widely used is high performance
liquid chromatography (HPLC), typically performed after some extraction procedure to
concentrate the phenolic compounds of interest and free them from others that could

Compositional and Biochemical Aspects of the Food Systems Studied
17
adversely affect the chromatographic resolution (Goldberg and Soleas, 1999). However,
besides being laborious and time-consuming, extraction procedures can modify the
phenolic composition of samples, due to oxidation, hydrolysis of esters, ethers and
glycosidic bonds, and even isomerisation. Therefore, there has been some effort to develop
methods that allow direct injection of filtered samples into an HPLC system, usually
equipped with a diode array detector (DAD) in the UV/VIS region. Several workers have
reported the application of HPLC-DAD to the identification and quantification of low
molecular weight wine phenols (Goldberg et al., 1996; Revilla and Ryan, 2000; Viñas et
al., 2000; López et al., 2001). Although the method has recognised success, it has,
however, some important limitations. A major one is that UV-Vis detection is not very
structure specific and the identification of sample compounds relies on the comparison
with standard compounds, resulting in ambiguous identification. Moreover, standards are
often not available commercially or are very expensive. These problems are especially
visible in the case of polymeric compounds with a large structural diversity.
The use of powerful structure elucidation techniques, such as mass spectrometry
(MS) and NMR spectroscopy, for characterising the polyphenolic fraction of grape
products has also been widely reported. Most studies involve some kind of
extraction/purification procedure of the compounds of interest prior to MS and/or NMR
analysis. There are several examples regarding the identification of wine pigments, namely
anthocyanins and derivatives (Bakker et al., 1997; Wang and Sporns, 1999; Giusti et al.,
1999; Mateus et al., 2002). NMR data are also reported for several phenolic acids and
flavonoids isolated from grape pomace (Lu and Foo, 1999), whereas Stobiecki (2000)
recently reviewed the application of MS techniques to the structural characterisation of
flavonoid glycosides. In recent years, the coupling of HPLC to MS and/or NMR has
opened new perspectives by combining the advantages of avoiding lengthy sample
preparation procedures and providing detailed structural information. HPLC-MS has
become a routine technique and has shown to be of great value in the determination of
phenolic compounds in grape and wine. Some examples regard the determination of low
molecular mass phenols (Pérez-Magariño et al., 1999), anthocyanins (Baldi et al., 1995)
and proanthocyanidins (Lazarus et al., 1999; Fulcrand et al., 1999; Pascual-Teresa et al.,
2000). The coupling of HPLC to NMR is not as widely used as HPLC-MS, and so far its
major applications are in the field of biofluids analysis and drug metabolism. Nevertheless,

Chapter I
18
there are already a few studies showing the great possibilities of HPLC-NMR and HPLC-
NMR/MS in the structure elucidation of plant constituents such as flavonoids (Hansen et
al., 1999; Lommen et al., 2000).
In this work, the application of HPLC-NMR/MS to investigate the aromatic
composition of grape juice and wine is explored and presented in Chapter VII. These
samples have been chosen for analysis since, as briefly described above, they are expected
to be rich natural sources of phenolic compounds with important sensorial and health-
related properties.
I.3. Beer: Brewing Process and Chemical Composition
Beer is a fermented beverage made from malted grains (usually barley), hops, yeast
and water (Hughes and Baxter, 2001). In addition to malt from barley, other starch- and/or
sugar-containing raw materials may be used, such as wheat malt, unmalted cereals called
adjuncts, starch flour and fermentable sugars. Fruits, herbs and spices may also be added to
give beer a particular character. The beer making process involves several steps that are
schematically represented in Figure I.4 and briefly described in the following paragraphs
(Belitz and Grosch, 1999; Hughes and Baxter, 2001).
a) b)
Figure I.4. Simplified flow diagram of the a) malting and b) brewing processes. Adapted from Hughes and Baxter (2001).
Crushed malt Mashing Water
Mash Lautering
Sweet wort
Bitter wort
Hops
Green beer
Yeast Fermentation
Maturation Filtration
Barley
Water Steeping
Steeped barley
Germination
Green malt
Kilning
Malt
Beer
Malt Grinding

Compositional and Biochemical Aspects of the Food Systems Studied
19
In the first step, the malt preparation, the barley is steeped to raise the water content
from about 12% to 42-45%, and allowed to germinate for a few days (15-20ºC). During
this process, the cell walls are digested, part of the high molecular weight, insoluble
protein is broken down into smaller fragments, and amylolytic enzymes are synthesised.
Most of the starch remains intact. The ‘green’ malt is then dried in a kiln to prevent further
enzyme activity and to produce a stable material (2-3% moisture), which can be safely
stored until needed for brewing. The kilning process also forms the colour and roasted
aroma of the malt by Maillard reactions.
The wort preparation step involves grinding the malt in a mill, mashing and lautering.
During mashing, the malt meal is made into a paste with brewing water and partially
degraded and solubilised by malt enzymes (amylases), which break down the starch into
fermentable sugars. Cereal starch consists of approximately 75% amylopectin and 25%
amylose. Amylopectin is a very large, branched molecule made of glucose units linked by
? (1-4) bonds (which give linear chains) and ? (1-6) bonds (which give branch points).
Amylose, on the other hand, is a linear molecule made up of glucose units linked by ? (1-4)
bonds only. The enzymes ? - and ? -amylase reduce amylose to maltotriose, maltose and
glucose, and amylopectin to many small branched dextrins which cannot be further broken
down during mashing. The result of the mashing stage is a sweet syrupy liquid known as
wort, which is then separated from insoluble remains of the malt in a lauter tun. The wort
contains mainly maltose and glucose, which are fermentable, together with significant
quantities of small branched dextrins and also some larger straight-chain dextrins.
In the next step, hops or hop extracts are added and the wort is boiled vigorously, so
that much of the soluble protein is coagulated and can be separated, and the hops ? -acids
are extracted into the wort and isomerised into iso-? -acids, which provide the
characteristic bitter taste of beer. After boiling, the coagulated protein and the spent hops
are removed (clarification), and the bitter wort is cooled to fermentation temperature.
The fermentation step consists of mixing the cooled wort with yeast (strains of
Saccharomyces), which takes up amino acids, used for cell growth, and sugars, which are
metabolised to ethanol and carbon dioxide. Yeast also produces a number of flavour-active
volatile compounds, namely higher alcohols and esters, which vary from strain to strain
and give each beer a unique character. There are two main types of fermenting yeasts: top-
fermenting and bottom-fermenting. The former are used in the production of ale beers, for

Chapter I
20
which fermentation is carried out at 16-25ºC, and the latter are used for producing lager
beers, which are fermented at 6-13ºC.
Once the yeast has fermented the available sugars, metabolism slows down and yeast
cells flocculate and are removed from the fresh beer. This freshly produced or ‘green’ beer
still contains undesirable flavour compounds, which are eliminated by conditioning.
During this time, the small proportion of yeast that remains in contact with the beer
produces more carbon dioxide, purging the beer of unwanted volatile compounds.
Moreover, the yeast chemically removes certain other flavour-active components. In
particular, it catalyses the reduction of vicinal diketones, such as diacetyl, to diols, which
are not flavour-active.
After conditioning, the beer may be centrifuged to remove the remaining yeast, then
chilled, filtered and packaged in bottles or cans.
The different combinations of ingredients and production processes give rise to an
enormous variety of beers, ales and lagers being defined as the two main types according
to their fermentation processes (Hughes and Baxter, 2001). As already mentioned, ales are
brewed with top-fermenting yeasts at close to room temperatures over some days, and
encompass the broadest range of styles, including bitters, porters, stouts, trappist and
lambic. Lagers undergo longer and cooler fermentation and tend to be less alcoholic than
ales. Bocks and pilsners belong to this type. The alcohol- free and diet beers constitute
special types of beer, the production of which involves the application of suitable
technology. Alcohol- free beers may be produced in different ways, such as throttling of
fermentation and use of special yeasts, reduction of the stemwort content, and elimination
of the alcohol formed (distillation, ultracentrifugation). Diet beers are produced by special
fermentation processes, in order to contain almost no carbohydrates.
The main constituents of beer are listed in Table I.5 and their typical levels compared
to those commonly found in wine and in carbonated soft drinks. It is apparent that beer
contains more of some main nutrients (proteins, vitamins, fibre) than other beverages, and
thus, can make an important contribution to the diet.

Compositional and Biochemical Aspects of the Food Systems Studied
21
Table I.5. Typical beer composition compared to wine and carbonated soft drinks (Hughes and Baxter, 2001).
Typical level (g/100 ml) Beer Wine Carbonated soft drinks
Water 92-95 85-91 89 Alcohol 2.5-3.5 9-14 0
Total carbohydrates of which free sugars
1.5-3 <0.2
0.1-6.0 0.02
10 10
Fibre 0.3-1.0 negligible negligible
Total proteins, peptides and amino acids
0.2-0.6 0.02 negligible
Lipids negligible negligible 0
Vitamins and other micronutrients
0.002 0.0003 0
Polyphenols and hop compounds
0.002-0.06 0.03-0.074 0
The ethanol content of most beers is between 3.1 and 4.3 (% by volume), but it may
range from less than 0.05% in alcohol- free beers to 12.5% in very strong beers. Ethanol
contributes directly to the flavour of beer and also plays a role in the flavour perception of
other beer components. Thus, the production of low- or non-alcoholic beers is not simply a
matter of removal or prevention of the formation of ethanol, but rather requires some form
of modification to adjust for the lack of ethanol. Glycerol is the second major alcohol, with
concentrations ranging from 1.2 to 2.0 g/L. Other alcohols, such as 1-propanol, 2-
methylbutanol, 3-methylbutabol, 2-phenylethanol and tyrosol may be present in small
quantities. These alcohols are produced by yeast, mainly as secondary metabolites of
amino acid metabolism, and are the immediate precursors of the more flavour-active esters
(Hughes and Baxter, 2001).
Besides water and ethanol, carbohydrates are the major components of beer with
amounts typically ranging from 1.5 to 3 g/100 ml. These carbohydrates comprise mainly
fermentable sugars (e.g. glucose, maltose, maltotriose, fructose, sucrose) and dextrins
which are glucose oligosaccharides with varying degrees of polymerisation (DP) and
branching patterns. Sugars directly contribute to the sweetness of beer, whereas
carbohydrates with more than four glycosyl units possess little sweetness. However, these
oligosaccharides can be beneficial to the perception of beer in that they contribute to body
or mouthfeel by increasing the viscosity. The amounts of sugars and dextrins vary with the
type of beer, as shown in Table I.6. Lagers are usually more fully fermented than ales and

Chapter I
22
contain less residual carbohydrates. Some beers also contain additional sugars (primings)
which are added after fermentation to give a sweeter product or sometimes to balance
excessive bitterness from high levels of hops. On the other hand, low carbohydrate beers
(‘lite beers’) contain less carbohydrate due to the digestion and fermentation of dextrins by
a combination of techniques, e.g. by using lightly kilned malts, which contain higher levels
of debranching enzyme, and special yeasts, which can digest a wider range of dextrins.
Several workers have reported the presence of different sugars and dextrins with up to 10
glucose units in the finished beer, by means of chromatographic analysis of degassed,
diluted beer (Uchida et al., 1991; Corradini et al., 1997; Déséveaux et al., 1997).
Vinogradov and Bock (1998) identified dextrins up to DP 19 and studied their branching
and substitution patterns, by using chromatographic separation techniques to obtain beer
fractions containing different carbohydrates, followed by the application of sophisticated
structure elucidation tools for analysing those fractions, namely NMR spectroscopy and
MALDI-TOF mass spectrometry.
Table I.6. Carbohydrates found in different types of beer (Hughes and Baxter, 2001).
Carbohydrate (g/100 ml) Beer type Sugars
(including maltotriose) Higher dextrins Total
Ales 0.5-3.0 1-4 1.5-6 Lagers 0.1-0.7 1-2 1-3
Primed beers 1.3-3.6 1-4 2-7
‘Lite’ beers 0.1-0.6 0.1-0.3 0.2-0.9
The non-starch polysaccharide fraction (dietary fibre) of malt and beer has also been
recently investigated using GC and GC-MS methods (Han, 2000). On average, beer
contains 0.3-1 g/100 ml of fibre, which is related to beer viscosity and is beneficial for
human health because it contributes to the healthy functioning of the large intestine and
can lower the levels of cholesterol in the blood serum (Hughes and Baxter, 2001).
Beer typically contains between 0.2 and 0.6 g/100 ml of protein-derived material,
mainly originating from the malted barley. Most of this material is in the form of peptides
and polypeptides, since the larger proteins are precipitated and removed during the wort
boiling stage, and most of the free amino acids in wort are taken up by the yeast during
fermentation. Nevertheless, most beers contain all the essential amino acids, at levels

Compositional and Biochemical Aspects of the Food Systems Studied
23
generally between 5 and 10 mg/100 g (Hughes and Baxter, 2001). Proline is the most
abundant amino acid present since it cannot be assimilated by yeast, and the amounts of
other amino acids vary significantly with the beer type (Klampfl, 1999).
Lipids are present in beer in trace levels, mainly in the form of medium chain fatty
acids (e.g. butyric, isovaleric, hexanoic, octanoic and decanoic) (Hawthorne et al., 1986).
These acids normally contribute to the characteristic beer flavour, but if present in
excessive concentrations have deleterious effects on both flavour and foam.
Beer is a good source of a number of vitamins, niacin, riboflavin, pyridoxine and
pantothenic acid being generally the most abundant, as shown in Table I.7. The presence of
riboflavin is particularly important with respect to the detrimental effect of light on the
aroma of beer, since it acts as a photosensitizer, thereby initiating degradation of beer
components and causing the formation of the so-called sunstruck flavour (Andrés-Lacueva
et al., 1998; Duyvis et al., 2002).
Table I.7. Vitamin contents in beer (Hughes and Baxter, 2001).
Vitamins Range (mg/L)
Niacin 3-20 Riboflavin 0.07-1.3
Pyridoxine (B6) 0.13-1.7 Foliates 0.03-0.10
Biotin 0.007-0.018
B12 0.09-0.14 Pantothenic acid 0.5-2.7
Thiamine 0.002-0.14
In what regards the phenolic composition, beer contains a wide range of phenolic
compounds, derived both from the hops and the malt. Table I.8 shows the typical levels of
some phenolics found in beer. These compounds have an important role in the physical
stability and flavour of beer, as they are involved in the formation of haze on storage, and
influence the flavour properties of mouthfeel, astringency and bitterness. Moreover,
phenolic compounds are known to possess antioxidant activity, potentially beneficial to
human health. Therefore, there has been a lot of interest in determining the phenolic
composition of foods and beverages containing these substances, including beer (Pascual-
Teresa et al., 1998; Whittle et al., 1999; Stevens et al., 1999; Gorinstein et al., 2000).

Chapter I
24
Table I.8. Phenolic composition of beer (Hughes and Baxter , 2001).
Phenolic compounds Example in beer Typical concentration (mg/L)
Monophenols 10-30 phenolic alcohols tyrosol phenolic acids ferulic acid phenolic amines and amino acids hordenine, tyrosine Monomeric Polyphenols 1-23 flavan-3-ols catechin, epicatechin flavan-3,4-diols leucocyanidin flavonols quercetin Condensed Polyphenols 20-140 dimeric and polymeric catechin proanthocyanidins procyanidin B3 prodelphinidins delphinidin B3
The characteristic bitterness of beer is largely attributable to a group of compounds
called the iso-? -acids, which result from the isomerisation of hop ? -acids during wort
boiling. The general structures of these compounds are shown in Figure I.5. Typical levels
of native iso-? -acids in beers are 10-60 mg/L, although extremes do exist outside this
range (Hughes and Baxter, 2001). Their determination is a major issue in the brewing
industry, but the instability and the similarity in structure of the bitter acids create
problems in their analysis. Recently, Pusecker et al. (1999) have demonstrated the
applicability of the HPLC-NMR coupling for identifying these compounds in various hop
products.
? -acids
OH
R
OHOHO
iso-? -acids O
OHHO
CO
R
Figure I.5. Structure of hop bitter acids.
R = COCH2CH(CH3)2: Humulone R = COCH(CH3)2: Cohumulone R = COCH(CH3)CH2CH3: Adhumulone

Compositional and Biochemical Aspects of the Food Systems Studied
25
Other components play very important roles in the taste and aroma of beer. For
instance, organic acids are responsible for the sour taste of beer. The major acids found in
beer include acetic, lactic, pyruvic and succinic, with amounts varying between 15 and 200
mg/L (Hughes and Baxter, 2001). Citric and pyroglutamic acids have also been found in
significant amounts in some beers (Klampfl, 1999). In respect to aroma, besides the
alcohols already mentioned, a wide range of esters, vicinal diketones and sulfur
compounds make important contributions. The most abundant ester is usually ethyl acetate
(typical levels 10-60 mg/L), but many others are present (e.g. isoamyl acetate, ethyl
hexaoate, 2-phenylethyl acetate, etc.). Unlike alcohols and esters, vicinal diketones, of
which 2,3-butanedione (diacetyl) is the most abundant, have a negative impact on beer
flavour and their elimination is desirable.
The sum and interaction of all the components described above makes beer a very
complex mixture, the composition and sensory properties of which vary widely according
to the different combinations of ingredients and production processes. In this thesis, the
complex composition of beer is tackled by high-resolution NMR and HPLC-NMR/MS, as
described in Chapter VIII. Moreover, in Chapter IX, the variability among beers of
different labels is investigated by multivariate analysis of NMR and FTIR data.
References
Aina, J.O.; Oladunjoye, O.O. Respiration, pectolytic activity and textural changes in ripening african mango (Irvingia gabonensis) fruits. Journal of the Science of Food and Agriculture 1993, 63, 451-454. Andrés-Lacueva C.; Mattivi, F.; Tonon, D. Determination of riboflavn, flavin mononucleotid and flavin-adenin dinucleotide in wine and other beverages by high-performance liquid chromatography with fluorescence detection. Journal of Chromatography A 1998, 823, 355-363. Bakker, J.; Bridle, P.; Honda, T.; Kuwano, H.; Saito, N.; Terahara, N.; Timberlake, C.F. Identification of anthocyanin occurring in some red wines. Phytochemistry 1997, 44, 1375-1382. Baldi, A.; Romani, A.; Mulinacci, N.; Vincieri, F.F.; Casetta, B. HPLC/MS application to anthocyanins of Vitis vinifera L. Journal of Agricultural and Food Chemistry 1995, 43, 2104-2109.

Chapter I
26
Baldwin, E.A.; Burns, J.K.; Kazokas, W.; Brecht, J.K.; Hagenmaier, R.D.; Bender, R.J.; Pesis, E. Effect of two edible coatings with different permeability characteristics on mango (Mangifera indica L.) ripening during storage. Postharvest Biology and Technology 1999, 17, 215-226. Barcelon, E.G.; Tojo, S.; Watanabe, K. Relating X-ray absorption and some quality characteristics of mango fruit (Mangifera indica L.). Journal of Agricultural and Food Chemistry 1999, 47, 3822-3825. Belitz, H.-D.; Grosch, W. Food Chemistry; 2nd Ed.; Springer-Verlag: Berlin, 1999. Bravo, L. Polyphenols: chemistry, dietary sources, metabolism and nutritional significance. Nutrition Reviews 1998, 56, 317-333. Cano, M. P.; Ancos, B. Carotenoid and carotenoid ester composition in mango fruit as influenced by processing method. Journal of Agricultural and Food Chemistry 1994, 42, 2737-2742. Corradini, C; Canali, G. Nicoletti, I. Application of HPAEC-PAD to carbohydrate analysis in food products and fruit juices. Seminars in Food Analysis 1997, 2, 99-111. Désévaux, S; Daems, V.; Delvaux, F.; Derdelinckx, G. Analysis of fermentable sugars and dextrins in beer by anion exchange chromatography with electrochemical detection. Seminars in Food Analysis 1997, 2, 113-117. Duyvis, M.G.; Hilhorst, R.; Laane, C.; Evans, D.J.; Schmedding, D.J.M. Role of riboflavin in beer flavor instability: determination of levels of riboflavin and its origin in beer by fluorimetric apoprotein titration. Journal of Agricultural and Food Chemistry 2002, 50, 1548-1552. Ebeler, S.E. Phytochemicals and wine flavor. In Functionality of Food Phytochemicals; Johns, T., Romeo, J.T., Eds.; Plenum Press: New York, 1997; 155-178. El-Zoghbi, M. Biochemical changes in some tropical fruits during ripening. Food Chemistry 1994, 49, 33-37. Fulcrand, H.; Remy, S.; Souquet, J.-M.; Cheynier, V.; Moutounet, M. Study of wine tannin oligomers by on- line liquid chromatography electrospray ionization mass spectrometry. Journal of Agricultural and Food Chemistry 1999, 47, 1023-1028. Giusti, M.M.; Rodríguez-Saona, L.E.; Griffin, D.; Wrolstad, R.E. Electrospray and tandem mass spectroscopy as tools for anthocyanin characterization. Journal of Agricultural and Food Chemistry 1999, 47, 4657-4664. Goldberg, D.M.; Tsang, E.; Karumanchiri, A.; Diamandis, E.P.; Soleas, G.; Ng, E. Method to assay the concentrations of phenolic constituents of biological interest in wines. Analytical Chemistry 1996, 68, 1688-1694.

Compositional and Biochemical Aspects of the Food Systems Studied
27
Goldberg, D.M.; Soleas, G.J. Analysis of antioxidant wine polyphenols by high-performance liquid chromatography. Methods in Enzymology 1999, 299, 122-137. Gorinstein, S.; Caspi, A.; Zemser, M.; Trakhtenberg, S. Comparative contents of some phenolics in beer, red wine and white whines. Nutrition Research 2000, 20, 131-139. Guthrie, J.; Walsh, K. Non-invasive assessment of pineapple and mango fruit quality using near infra-red spectroscopy. Australian Journal of Experimental Agriculture 1997, 37, 253-263. Han, J.-Y. Structural characteristics of arabinoxylan in barley, malt and beer. Food Chemistry 2000, 70, 131-138. Hansen, S.H.; Jensen, A.G.; Cornett, C.; Bjornsdottir, I.; Taylor, S.; Wright, B.; Wilson, I.D. High-performance liquid chromatography on- line coupled to high-field NMR and mass spectrometry for structure elucidation of constituents of Hypericum perforatum L. Analytical Chemistry 1999, 71, 5235-5241. Hawthorne, D.B.; Jones, R.D.; Barrett, P.A.; Kavanagh, T.E.; Clarke, B.J. Methods for the analysis of C4 to C10 fatty acids in beer, wort and carbohydrate syrups. Journal of the Institute of Brewing 1986, 92, 181-184. Hughes, P. S.; Baxter, E. D. Beer Quality, Safety and Nutritional Aspects; The Royal Society of Chemistry: Cambridge, 2001. Hulme, A.C. The mango. In The Biochemistry of Fruits and Their Products; Hulme, A.C., Ed.; Academic Press: London, 1971; 233-254. Idstein, H.; Shreier, P. Volatile constituents of Alphonso mango (Mangifera indica). Phytochemistry 1985, 24, 2313-2316. Jacobi, K.K.; Giles, J.E. Quality of Kesington mango (Mangifera indica Linn.) fruit following combined vapour heat desinfestation and hot water disease control treatments. Postharvest Biology and Technology 1997, 12, 285-292. Kalra, S.K.; Tandon, D.K.; Singh, B.P. Mango. In Handbook of Fruit Science and Technology. Production, Composition, Storage and Processing; Salunkhe, D.K., Kadam, S.S. Eds.; Marcel Dekker Inc.: New York, 1995; 123-169. Kanellis, A.K.; Roubelakis-Angelakis, K.A. Grape. In Biochemistry of Fruit Ripening; Seymour, G.B., Taylor, J.E., Tucker, G.A., Eds.; Chapman & Hall: London, 1993; 189-234. Klampfl, C. Analysis of organic acids and inorganic anions in different types of beer using capillary zone electrophoresis. Journal of Agricultural and Food Chemistry 1999, 47, 987-990.

Chapter I
28
Labib, A.A.S.; El-Ashwah, F.A.; Omran, H.T.; Askar, A. Heat- inactivation of mango pectinesterase and polygalacturonase. Food Chemistry 1995, 53, 137-142. Lazarus, S.A.; Adamson, G.E.; Hammerstone, J.F.; Schmitz, H.H. High-performance liquid chromatography/mass spectrometry analysis of proanthocyanidins in foods and beverages. Journal of Agricultural and Food Chemistry 1999, 47, 3693-3701. Lizada, C. Mango. In Biochemistry of Fruit Ripening; Seymour, G.B., Taylor, J.E., Tucker, G.A., Eds.; Chapman & Hall: London, 1993; 255-271. Lommen, A.; Godejohann, M.; Venema, D.P.; Hollman, P.C.H.; Spraul, M. Application of directly coupled HPLC-NMR-MS to the identification and confirmation of quercetin glycosides and phloretin glycosides in apple peel. Analytical Chemistry 2000, 72, 1793-1797. López, M.; Martínez, F.; Valle, C.; Orte, C.; Miró, M. Analysis of phenolic constituents of biological interest in red wines by high-performance liquid chromatography. Journal of Chromatography A 2001, 922, 359-363. Lu, Y.; Foo, L.Y. The polyphenol constituents of grape pomace. Food Chemistry 1999, 65, 1-8. MacLeod, A.J.; Pieris, N.M. Comparison of the volatile components of some mango cultivars. Phytochemistry 1984, 23, 361-366. Mateus, N.; Silva, A.M.S.; Santos-Buelga, C.; Rivas-Gonzalo, J.C.; Freitas, V. Identification of anthocyanin-flavonol pigments in red wines by NMR and mass spectrometry. Journal of Agricultural and Food Chemistry 2002, 50, 2110-2116. McLellan, M.R.; Race, E.J. Grape juice processing. In Production and Packaging of Non-carbonated Fruit Juices and Fruit Beverages; Ashurst, P.R., Ed.; Blackie Academic & Professional: Glasgow, 1995; 89-105. Medlicott, A.P; Thompson, A.K. Analysis of sugars and organic acids in ripening mango fruits (Mangifera indica L. var Keitt) by high performance liquid chromatography. Journal of the Science of Food and Agriculture 1985, 36, 561-566. Medlicott, A.P; Reynolds, S.B.; Thompson, A.K. Effects of temperature on the ripening of mango fruit (Mangifera indica L. var Tommy Atkins). Journal of the Science of Food and Agriculture 1986, 37, 469-474. Mercadante, A.Z.; Rodriguez-Amaya, D.B.; Britton, G. HPLC and mass spectrometric analysis of carotenoids from mango. Journal of Agricultural and Food Chemistry 1997, 45, 120-123. Mizrach, A.; Flitsanov, U.; Schmilovitch, Z.; Fuchs, Y. Determination of mango physiological indices by mechanical wave analysis. Postharvest Biology and Technology 1999, 16, 179-186.

Compositional and Biochemical Aspects of the Food Systems Studied
29
Muda, P.; Seymour, G.B.; Errington, N.; Tucker, G.A. Compositional changes in cell wall polymers during mango fruit ripening. Carbohydrate Polymers 1995, 26, 255-260. Nyanjage, M.O.; Wainwright, H.; Bishop, C.F.H. The effects of hot-water treatments in combination with cooling and/or storage on the physiology and disease of mango fruits (Mangifera indica Linn.). Journal of Horticultural Science & Biotechnology 1998, 73, 589-597. Pascual-Teresa, S. ; Rivas-Gonzalo, J.C.; Santos-Buelga, C. Prodelphinidins and related flavonols in wine. International Journal of Food Science and Technology 2000, 35, 33-40. Pascual-Teresa, S.; Treutter, D.; Rivas-Gonzalo, J.C.; Santos-Buelga, C. Analysis of flavonols in beverages by high-performance liquid chromatography with chemical reaction detection. Journal of Agricultural and Food Chemistry 1999, 46, 4209-4213. Pérez-Magariño, S.; Revilla, I.; González-SanJosé, M.L.; Beltrán, S. Various applications of liquid chromatography-mass spectrometry to the analysis of phenolic compounds. Journal of Chromatography A 1999, 847, 75-81. Pesis, E.; Aharoni, D.; Aharon, Z.; Ben-Arie, R.; Aharoni, N.; Fuchs, Y. Modified atmosphere and modified humidity packaging alleviates chilling injury symptoms in mango fruit. Postharvest Biology and Technology 2000, 19, 93-101. Peynaud, E.; Ribéreau-Gayon, P. The Grape. In The Biochemistry of Fruits and Their Products; Hulme, A.C., Ed.; Academic Press: London, 1971; 171-205. Pusecker, K.; Albert, K.; Bayer, E. Investigation of hop and beer bitter acids by coupling of high-performance liquid chromatography to nuclear magnetic resonance spectroscopy. Journal of Chromatography A 1999, 836, 245-252. Puttaraju, T.B.; Reddy, T.V. Effect of precooling on the quality of mango (cv. Mallika). Journal of Food Science and Technology 1997, 34, 24-27. Revilla, E.; Ryan, J.-M. Analysis of several phenolic compounds with potential antioxidant properties in grape extracts and wines by high-performance liquid chromatography-diode array detection without sample preparation. Journal of Chromatography A 2000, 881, 461-469. Sakho, M.; Chassagne, D.; Crouzet, J. African mango glycosidically bound volatile compounds. Journal of Agricultural and Food Chemistry 1997, 45, 883-888. Salunkhe, D.K.; Desai, B.B. Postharvest Biotechnology of Fruits; CRC Press. Inc: 1984. Selvaraj, Y.; Kumar, R.; Pal, D.K. Changes in sugars, organic acids, amino acids, lipid constituents and aroma characteristics of ripening mango (Mangifera indica L.) fruit. Journal of Food Science and Technology 1989, 26, 308-313.

Chapter I
30
Soleas, G.J.; Dam, J.; Carey, M.; Goldberg, D.M. Toward the fingerprint of wines: cultivar-related patterns of polyphenolic constituents in Ontario wines. Journal of Agricultural and Food Chemistry 1997, 45, 3871-3880. Spanos, G.A.; Wrolstad, R.E. Phenolics of apple, pear and white grape juices and their changes with processing and storage – a review. Journal of Agricultural and Food Chemistry 1992, 40, 1478-1487. Stevens, J.F.; Taylor, A.W.; Deinzer, M.L. Quantitative analysis of xanthohumol and related prenylflavonoids in hops and beer by liquid chromatography-tandem mass spectrometry. Journal of Chromatography A 1999, 832, 97-107. Stobiecki, M. Application of mass spectrometry for identification and structural studies of flavonoid glycosides. Phytochemistry 2000, 54, 237-256. Thorngate, J.H. Flavan-3-ols and their polymers. In Beer and Wine Production; Gump, B.H., Pruett, D.J., Eds.; American Chemical Society: San Francisco, 1993; 51-63. Tucker, G.A. Introduction. In Biochemistry of Fruit Ripening; Seymour, G.B., Taylor, J.E., Tucker, G.A., Eds.; Chapman & Hall: London, 1993; 1-51. Tucker, G.A.; Seymour, G.B. Cell wall degradation during mango fruit ripening. Acta Horticulturae 1991, 291, 454-460. Uchida, M.; Nakatani, K.; Ono, M.; Nagami, K. Carbohydrates in brewing. I. Determination of fermentable sugars and oligosaccharides in wort and beer by partition high-performance liquid chromatography. Journal of the American Society of Brewing Chemists 1991, 49, 665-673. Viñas, P.; López-Erroz, C.; Marín-Hernández, J.J.; Hernández-Córdoba, M. Determination of phenols in wines by liquid chromatography with photodiode array and fluorescence detection. Journal of Chromatography A 2000, 871, 85-93. Vinogradov, E.; Bock, K. Structural determination of some new oligosaccharides and analysis of the branching patterns of isomaltooligosaccharides from beer. Carbohydrate Research 1998, 309, 57-64. Voet, D.; Voet, J.G. Biochemistry; John Wiley & Sons, Inc.: New York, 1990. Wang, J.; Sporns, P. Analysis of anthocyanins in red wine and fruit juice using MALDI-MS. Journal of Agricultural and Food Chemistry 1999, 47, 2009-2015. Whittle, N.; Eldridge, H.; Bartley, J. Identification of the polyphenols in barley and beer by HPLC/MS and HPLC/electrochemical detection. Journal of the Institute of Brewing 1999, 105, 89-99.

Compositional and Biochemical Aspects of the Food Systems Studied
31
Wilson, C.W.; Shaw, P.E.; Knight, R.J. Importance of selected volatile compounds to mango (Mangifera indica L.) flavor. In Proceedings of the 10th International Congress of Essential Oils, Fragrances and Flavors; Lawrence, B.M., Mookherjee, B.D., Willis, B.J. Eds.; Washington, 1986; 283-294. Wu, J.S.; Chen, H.; Fang, T. Mango juice. In Fruit Juice Processing Technology; Nagy, S., Chen, C.S., Shaw, P.E. Eds.; Agscience: Auburnadale, 1993; 620-655.

Chapter I
32

II. FUNDAMENTALS OF THE ANALYTICAL METHODS EMPLOYED
II.1. High Resolution Nuclear Magnetic Resonance (NMR) Spectroscopy of Liquids….
II.1.1 Principles of NMR Spectroscopy………………………………………………
II.1.2. NMR Spectral Parameters: Chemical Shift, Spin-Spin Coupling and
Signal Area…………………………………………………………………………...
II.1.3. Two-Dimensional (2D) NMR Spectroscopy………………………………….
II.2. NMR Spectroscopy of Solids………………………………………………………..
II.2.1. Nuclear Spin Interactions in Solids……………………………………………
II.2.2. High Resolution Solid-State NMR Techniques……………………………….
II.3. Hyphenated NMR Methods (HPLC-NMR and HPLC-NMR/MS)………………….
II.4. Fourier Transform Infrared (FTIR) Spectroscopy…………………………………..
II.5. Some Multivariate Analysis Methods……………………………………………….
II.5.1. Principal Components Analysis (PCA)…….………………………………….
II.5.2. Partial Least Squares (PLS) Regression ………………………………………
II.5.3. Canonical Correlation Analysis (CCA)……………………………………….
References………………………………………………………………………………...
34
34
39
42
50
50
51
53
56
59
60
61
62
62

Chapter II
34
II.1. High Resolution Nuclear Magnetic Resonance (NMR) Spectroscopy
of Liquids
From its initial development in the 1950s, NMR spectroscopy has seen
unprecedented growth and is now one of the most powerful and versatile analytical tools
with increasing applications in chemistry, biology, medicine and materials science. The
fundamentals and methods of NMR form a vast, complex and evolving discipline. In the
present subchapter, a short overview is given, with the purpose of acquainting the reader
with a few NMR basics that may aid interpreting the results presented in this thesis. For
more details, the books by Harris (1987), Gunther (1995) and Claridge (1999), among
many other textbooks, offer a comprehensive description of the NMR principles.
II.1.1 Principles of NMR Spectroscopy
Nuclear Magnetic Resonance (NMR) spectroscopy detects nuclear-spin
reorientation in an applied external magnetic field. For each kind of observed nuclei, the
information provided by NMR depends on the electronic environment in which the nuclei
are immersed and on the positions of nuclei within molecules. Thus, NMR is a powerful
tool for probing molecular structure and dynamics.
The nuclei observable by NMR are those with a spin quantum number I showing
positive half- integer or integer values. When such nuclei are placed under the influence of
an external magnetic field of strength B0, applied in a direction defined as z, an interaction
occurs between the magnetic moment of the nucleus, ? , and the applied magnetic field
(Zeeman interaction). In classical terms, the energy of the nucleus in this situation is
described by the vector product:
E = - ? . B0 = - ? z B0 = - (?mIh/2? ) B0 ?II.1?
where ? z is the component of ? along the direction z, ? is the magnetogyric ratio of the
nucleus, mI is the magnetic quantum number representing the different orientations of ?
relative to the applied magnetic field B0, and h is the Planck’s constant. In the absence of a
magnetic field, the energy of the nucleus is independent of the quantum number mI. In the
presence of B0, however, there are (2I + 1) non-degenerate energy levels, corresponding to
2I + 1 values of mI. For instance, for magnetic nuclei with spin I = ½ (e.g. 1H , 13C, 15N,

Fundamentals of the Analytical Methods Employed
35
19F), there will be two possible orientations of the nuclear spin with respect to the static
field (mI = ?1/2), either parallel (the ? -state) or anti-parallel (the ? -state), the former being
of lower energy (Figure II.1).
Figure II.1. Energy levels for a nucleus of spin quantum number I=1/2.
The energy difference ? E between quantised states is:
? E = ??? mIh/2? B0 ?= h? ?II.2?
Nuclear magnetic resonance occurs when the nucleus changes its spin state, driven by the
absorption of a quantum of energy, applied as electromagnetic radiation. As the selection
rule governing these transitions is ? mI = ?1, the resonance condition for NMR is given by:
? = ??/2? ?B0 ?II.3?
Another approach to the fundamentals of the magnetic resonance phenomenon
consists of describing the effect of the static field on the magnetic moment in terms of
classical mechanics, with the field imposing a torque on the moment ? and causing the
rotation (precession) of its direction in a cone with its axis along B0 (Figure II.2a). This
motion is referred to as Larmor precession and occurs at a rate ? 0 = -? B0 (rad s-1) or ? 0 = -
?/2? B0 (Hz), the direction being determined by the sign of ?. For the resonance condition
to be satisfied, the frequency of the electromagnetic radiation applied must match that of
the Larmor precession. In other words, the resonant frequency of a nucleus is simply its
Larmor frequency. At the magnetic fields currently applied (up to 21.1 T), the resonant
frequencies for protons fall within the radiofrequency region of the electromagnetic
spectrum (up to 900 MHz).
mI = -1/2 (?-state)
mI = +1/2 (? -state)
B0 = 0 B0 > 0
Energy

Chapter II
36
Now consider a collection of similar spin-half nuclei (e.g. protons) in the applied
static magnetic field. As stated, the orientation parallel to the applied field (? ) has slightly
lower energy than the anti-parallel orientation (? ), so that, at equilibrium, there will be an
excess of nuclei in the ? state, as defined by the Boltzmann distribution:
N? / N? = exp (-? E/kT) = exp (-?hB0/2?kT) ?II.4?
where N? and N? represent the spin populations in the ? and ? energy levels, k is the
Boltzmann constant and T is the temperature of the system. Due to the small value of ? E
and hence, the small population difference between the two levels, NMR has an intrinsic
low sensitivity, that is further worsened by the low natural abundance of certain nuclei
such as 13C (nat. abund. ~1%). The higher the magnetic field, the larger is the separation of
the energy levels and their population difference, and thus, the better is the signal-to-noise
ratio of the spectrum. The population excess of nuclear spins can be represented as a
collection of spins distributed randomly about the precessional cone and parallel to the z-
axis (Figure II.2b). These give rise to a resultant bulk magnetisation vector M0 along this
axis (Figure II.2c).
a) b) c)
Figure II.2. a) Precession of a magnetic nucleus caused by the applied static magnetic field B0, b) the two precessional cones for a collection of spin-half nuclei in the ? - and ?-states and c) the net spin magnetisation M0 at equilibrium.
When the sample is subject to a short pulse of radiofrequency (rf) irradiation
(tipically a few ? s), with a magnetic component B1, to excite all frequencies of a given
nucleus at a time, the net magnetisation M0 is shifted away from B0 toward the x-y plane,
where it can be detected. This rf is transmitted via a coil surrounding the sample, the
geometry of which is such that the B1 field exists in the transverse plane, perpendicular to
B0
?
x y
z
M0
x y
z
? -state
?-state

Fundamentals of the Analytical Methods Employed
37
the static field (Claridge, 1999). Figure II.3 illustrates the effect of the oscillating field B1
on the bulk magnetisation vector. This representation is simplified by using a reference
frame (x’, y’, z’) rotating at the frequency ? 0 around the z-axis (rotating frame), so that the
B1 vector appears static. The angle ? through which the magnetisation vector M turns will
be dependent on the amplitude and duration of the pulse. For instance, if the rf is turned off
just as M reaches the y-axis, this represents a 90º pulse and the maximum signal intensity
is observed. If M becomes oriented along the –z-axis, the pulse is denoted to be a 180º
pulse and no signal is observed, since only magnetisation in the x-y plane is able to induce
a signal in the detection coil.
a) b)
Figure II.3. a) The net spin magnetisation M0 under equilibrium conditions and b) the effect of a 90º and a 180º rf pulse on M0.
As soon as the r.f. irradiation is switched off, the system will adjust to re-establish
the Boltzmann equilibrium, and so the transverse magnetisation vector will gradually
disappear and simultaneously grow along the z-axis toward its initial value and direction
(M0). This return to equilibrium is referred to as relaxation and it causes the NMR signal to
decay with time, producing the observed Free Induction Decay (FID). Fourier
transformation (FT) of the accumulated time-domain signal provides the frequency-domain
NMR spectrum (Figure II.4).
Figure II.4. Fourier transformation of the Free Induction Decay (FID) to the corresponding frequency domain spectrum.
x’ y’
z’
M0
B1 B1 M
90º
x’ y’
z’
B1 M
180º
x’ y’
z’
time frequency
FT

Chapter II
38
Two relaxation processes may be distinguished: the recovery of magnetisation
along the z-axis, termed longitudinal or spin- lattice relaxation, which involves energy
transfer between the spins and the surroundings (lattice) in order to re-establish the
equilibrium populations, and the decay of magnetisation in the x-y plane, termed transverse
or spin-spin relaxation, which involves energy transfer within the magnetised spins. Both
processes are assumed to follow exponential behaviour, occurring simultaneously but at
different rates denoted by T1-1 and T2
-1, respectively. The relaxation times T1 and T2 are
closely related to molecular mobility, characterised by the correlation time ?c, which is the
average time required for a molecule to rotate through 1 radian. For nonviscous liquids,
containing rapidly tumbling molecules (short ?c), T1 and T2 are identical (Harris, 1987).
Values for protons in medium sized organic molecules tend to fall in the range 0.5-5 s
(Claridge, 1999). As mobility decreases (?c increases), T1 goes through a minimum (at ?c2
= ? 0-1, where ? 0 is the resonance frequency), but T2 continues to decrease (Figure II.5). T2
eventually reaches a limiting value when the sample is in the solid state: typical T2 values
are ~1 s for a liquid and 10-5 s for a solid (Colquhoun and Goodfellow, 1994). As the
widths of the NMR resonances are inversely proportional to T2, according to ? ? 1/2 =
1/(? T2), the signals of slowly tumbling molecules become rather broad as a result of short
T2 values.
Figure II.5. Schematic representation of the dependence of the relaxation times T1 and T2 on the molecular tumbling rates expressed by the correlation time ?c .
log (?c-1)
log (Tn) T1
T2 fast motion
slow motion
intermediate motion
(?c2 =? 0
-1)

Fundamentals of the Analytical Methods Employed
39
II.1.2. NMR Spectral Parameters: Chemical Shift, Spin-Spin Coupling and Signal
Area
There are several parameters that can be readily obtained from the NMR spectra,
providing valuable pieces of information for structure determination. These include the
chemical shift (? in ppm), spin-spin coupling pattern (multiplicity), coupling constant (J)
and signal intensity. Nuclei are surrounded by electrons, which shield them from the
applied magnetic field B0. The B0 field induces currents in these electron clouds and, thus,
the effective magnetic field experienced by the nucleus (Beff) results from the addition of
B0 and the local magnetic fields produced by the surrounding electrons:
Beff = B0 (1 - ? ) ?II.5?
where ? is a shielding constant that depends on the nature of the electron cloud around the
nucleus. Thus, in the case of proton observation for instance, protons at the various sites in
the molecule are magnetically shielded to different extents, depending on their chemical
environment (neighbouring atoms and type of chemical bonding), so that each site
experiences a slightly different magnetic field and has a different position in the NMR
spectrum. The position of an NMR signal is measured by its resonance frequency, ? sample,
expressed in Hertz (Hz). This value is proportional to the magnetic field strength,
depending directly on the operating frequency of the spectrometer. Therefore, the
resonance frequency values of a given compound differ between spectra recorded at
different field strengths. To overcome this inconvenience, the frequency scale is
normalised by using a signal from a reference compound, which for proton is usually
tetramethylsilane (TMS) or 3-(trimethylsilyl)propionate (TSP). The dimensionless quantity
obtained is the chemical shift, given in parts per million (ppm) and defined as:
where ? sample and ? ref are, respectively, the positions, in Hz, observed for the signal of
interest and for the reference compound. The chemical shift (in ppm) is thus independent
of the measuring magnetic field strength. Some typical ranges of chemical shift values for
ppm (? sample -?ref ) (Hz) x 106
? =
? ref (Hz) ?II.6?

Chapter II
40
1H and 13C nuclei in chemical groups commonly occurring in natural and biological
compounds are listed in the Table II.1.
Table II.1. Chemical shift (?) ranges for 1H and 13C in some common chemical groups (adapted from Fan, 1996).
1H chemical shifts 13C chemical shifts Chemical group ? (ppm) Chemical group ? (ppm) C-CH3 0.7-1.1 -CH3 (methyl) 8-30 =C-CH3 1.5-1.8 -CH2 (methylene) 14-55 COCH3 (acetyl) 2.0-2.5 -CH- (methine) 22-60 N-CH3 2.5-3.3 -C- (quaternary) 30-40 O-CH3 3.3-4.3 CH2=C-R 100-150 C-CH2-C 1.3-2.5 C=C-C=C-R 110-150 O-CH2-C 4.0-5.0 Heteroaromatic ring 100-165 C-CH-OH 3.3-4.0 C-OH (alcohol) 44-85 C-CH-O-ester 4.2-5.3 C-O-C (ether) 55-85 =CH-C (olefinic) 5.5-8.5 R-COOH (saturated) 165-188 Aromatic ring 6.0-9.0 R-C=C-COOH 158-174 -CHO (aldehyde) 9.0-10.2 R-COOR’ (saturated) 158-178 -COOH 10.5-13.5 R-C=C-COOR’ 152-172 C-OH (alcohol) 1.5-6.0 R-CHO (saturated) 196-220 C-OH (phenol) 6.5-18.5 R-C=C-CHO 176-195 Primary amines 1.1-1.8 Saturated ketones 195-220 Secondary amines 1.2-2.1 C-N-R2 20-70 CO-NH 5.0-6.5 R-CO-NH2 150-178
The interaction between neighbouring magnetic nuclei within a molecule is referred
to as spin-spin or scalar coupling and causes the splitting of NMR signals into multiplets.
This interaction is transmitted indirectly via the electrons in chemical bonds and arises
because the effective magnetic field of each nucleus is sensitive to the spin state of its
neighbours. The multiplicity of a signal, i.e. the number of peaks in the split signal, is
given by 2nI + 1, where n is the number of neighbouring equivalent nuclei and I the spin
quantum number. The line separations in Hz correspond to the coupling constants (J)
between the nuclei under consideration, and are independent of the magnetic field strength.
For spin-half nuclei in first-order coupling patterns, i.e. when the chemical shift differences
are much larger than the scalar coupling constants (? ? /J ? 10), the intensity of the peaks is
determined according to the probability of the spin magnetisations of the neighbours to
occur, following the binomial distribution of the Pascal triangle. For example, doublets,

Fundamentals of the Analytical Methods Employed
41
triplets and quartets with intensity ratios 1:1, 1:2:1 and 1:3:3:1 represent first-order
coupling from one, two and three chemically equivalent nuclei, respectively. As ? ? /J
becomes smaller, splitting patterns become more complex and difficult to analyse.
The coupling constant (J) associated with each multiplet is dependent on a number
of factors, including the number of intervening bonds, bond order, bond angle, bond
length, types of coupled nuclei, electronegativity of attached substituents, extent of ? -
conjugation and aromatic substituents. Therefore, this parameter is very valuable to aid
structure elucidation. nJ denotes the coupling constant between nuclei separated by n bonds
and, generally, nJ decreases as the number of bonds between the coupled nuclei increases.
For proton-proton coupling the JH-H values lie between about –20 and +20 Hz (Hesse et al.,
1997). As for the heteronuclear coupling between 1H and 13C, 1JC-H ranges from 100 to 320
Hz, while 2JC-H ranges from –20 to 70 Hz (Hesse et al., 1997). The 1H-13C coupling
originates the so-called carbon satellites in the 1H spectrum, however, due to the low
relative abundance of 13C, these peaks are often not noticeable.
For 1H spectra of isotropic liquids, the area under a signa l, measured by integration,
is proportional to the number of nuclei giving rise to that signal, provided that adequate
experimental conditions are employed. A critical factor to obtain quantitative spectra is to
allow for the spins to fully relax between pulses so that the observed signal intensities are
not diminished by incomplete recovery of the magnetisation between acquisitions. This
condition demands recycle times of at least 5T1 between pulses, where T1 is the longest
relaxation time found in the sample. The second fundamental requirement is for the data be
sufficiently well digitised for the lineshape to be defined properly, and so, adequate
spectral widths should be used. Processing of the spectra is also important to enhance the
quantification results (Martin, 1995). The use of a matched exponential window will help
to ensure sufficient digitisation and zero-filling will further assist the definition of the
lineshape. Moreover, careful phasing of the spectrum is essential, in order to minimise
deviations from pure absorption-mode lineshapes. Another potential source of error arises
from distortions of the spectrum baseline. The integral of a signal, especially of signals
with low S/N ratio, is very sensitive to small changes in the baseline of the spectrum.
Therefore, it is very important to correct for baseline offset and distortions in a consistent
way for the series of spectra to be compared. A final consideration regards the integration

Chapter II
42
limits. For a Lorentzian line, the tails extend a considerable distance from the centre and
the integral should, ideally, cover 20 times the line width each side of the peak if it is to
include 99% of it. For proton observation, this is likely to be 10-20 Hz each side (Claridge,
1999). However, in practice, this is sometimes not possible due to the proximity or even
partial overlapping of other signals.
Having taken the precautions mentioned above, integration of the 1H NMR signals
in the 1D spectrum of the sample can provide quantitative information on the sample
components. If an internal reference compound is used, then absolute quantification should
also be possible. If the area FA corresponds to nA protons of the internal reference A (as
determined by the structural formula) and the area FB similarly corresponds to nB protons
of substance B, then the molar concentrations C in the solution being measured are given
by:
CA / CB = FA nB / FB nA ?II.7?
The choice of the internal reference compound is of critical importance for the
success of NMR quantitative analysis. There are some essential prerequisites that must be
fulfilled: the reference compound must be stable at the temperature range used, soluble and
inert, showing no physical interaction or chemical reaction with the sample; moreover,
signals of the reference should not overlap with those of the sample components.
The quantitative analysis of complex mixtures, such as the food samples analysed
in this work, involves additional problems, namely the possibility of physical or chemical
interactions within the sample components and between these and the reference compound,
leading to molecular hindrance and consequent loss in the signals areas. Moreover,
overlapping of the peaks arising from the many sample components may severely hinder
integration measurements.
II.1.3. Two-Dimensional (2D) NMR Spectroscopy
The first tool generally used to assign the NMR signals of a complex mixture
consists of comparing chemical shifts, spin-spin coupling patterns (multiplicity) and
coupling constants (J) data, measured in the 1D spectrum, with data compiled in the
literature for common metabolites (Pretsch et al., 1989; Nicholson et al., 1995; Fan, 1996)
and with spectra of reference compounds that are expected to be present in the sample.

Fundamentals of the Analytical Methods Employed
43
However, the 1H spectra of such mixtures (e.g. food and biological samples) are often
rather complex and signal assignment is hindered by the high degree of spectral overlap. In
most cases, it is not possible to observe all the signals arising from one molecule and the
determination of multiplicities and coupling constants is very difficult. In addition, care
must be taken in utilizing literature values since they depend on several factors such as the
pH, the solvent and the chemical shift reference used, and these conditions are often not
reported.
Two-dimensional (2D) NMR methods provide a more valuable approach to carry
out spectral assignment, as the information is spread in two dimensions and spectral
overlap is significantly reduced. 2D methods and other multidimensional NMR methods
are continuously being developed and form a vast area of NMR spectroscopy. It is not the
purpose of this subchapter to give an exhaustive review on this subject, which can be found
in several standard textbooks (Gunther, 1995; Braun et al., 1998; Claridge, 1999), but
rather to introduce the general scheme of a 2D experiment and describe briefly the 2D
methods used in this work.
All 2D sequences have the same basic format and can be subdivided into four well
defined units termed the preparation, evolution, mixing and detection periods (Figure II.6).
The preparation and mixing periods typically comprise a pulse or a cluster of pulses and/or
fixed time periods, the details of which vary depending on the nature of the experiment.
The detection period is entirely analogous to the detection period of any 1D experiment,
during which the spectrometer collects the FID of the excited spins. It is the evolution
period that provides the key to the generation of the second dimension. The state of the
spin system after a certain time t1 is generally altered by at least one further rf pulse. The
resonance signal is then recorded during the subsequent detection time, t2. The entire
experiment is repeated with an increment evolution time t1, whereby the initial state of the
nuclear spin system during the detection period at t2 = 0 changes accordingly. After data
collection, the FIDs are transformed with respect to t2 to obtain a set of spectra in which
the peak intensities or phases are modulated as a function of the t1 delay. Fourier
transformation with respect to t1 converts the frequency modulation into peaks in the 2D
spectrum, generally represented as a contour plot.
There are essentially two classes of 2D NMR experiments: 1) correlated
experiments, in which the resonance frequency of one peak is related to those of its

Chapter II
44
neighbours and thus molecular connectivities or distances between atoms can be
determined, and 2) resolved experiments, in which the frequency axes show two different
interactions; for example, in 2D J-resolved spectra one axis contains coupling constant
information while the other has the chemical shift data. Both types of experiments have
been used in this thesis to aid spectral assignment of the complex food mixtures analysed.
The basic principles of each 2D method used are briefly presented in the next paragraphs,
starting by the simplest homonuclear correlation method employed.
Figure II.6. General scheme for a 2D experiment, showing the different steps as a function of time.
The COSY (COrrelation SpectroscopY) experiment (Aue et al., 1976a) correlates
the chemical shifts of nuclei (typically protons) that share a mutual J-coupling by utilising
the sequence shown in Figure II.7a. The basis of this experiment is the process of
coherence transfer in which magnetisation is transferred between J-coupled spins during
the mixing part of the sequence. The outcome of this process in the final COSY spectrum
may be explained as follows: consider the case of two J-coupled spins, A and X, with a
coupling constant JAX and chemical shifts offsets ? A and ? X. After the initial 90º pulse, the
magnetisation associated with spin A will precess during t1 according to its chemical shift
offset ? A. The second 90º pulse then transfers some part of this magnetisation to the
coupled X spin, whilst some remains associated with the original spin A. That which
remains with A will then precess in the detection period t2 at a frequency ? A, just as it did
during t1, so in the final spectrum it will produce a peak at ? A in both dimensions, denoted
(? A, ? A), which sits on the diagonal of the 2D spectrum. In contrast, the transferred
magnetisation will precess in t2 at the frequency of spin X, and will thus produce a peak
corresponding to two different chemical shifts in the two dimensions (? A, ? X). This peak
sits away from the diagonal, being referred to as an off-diagonal peak (or crosspeak), and
provides direct evidence of coupling between spins A and X. The same arguments apply
for the magnetisation originally associated with the X spin, giving rise to a diagonal peak
time t2
Preparation Mixing Evolution
t1

Fundamentals of the Analytical Methods Employed
45
at (? X, ? X) and a crosspeak at (? X, ? A). The COSY spectrum is thus symmetrical about the
diagonal, with cross peaks on either side of it, as schematically illustrated in Figure II.7b.
Most proton-proton couplings operate over two or three bonds, so the proton COSY
spectrum typically identifies vicinal and geminal relationships.
a) b)
Figure II.7. a) Basic COSY pulse sequence and b) COSY spectrum of a coupled AX spin system.
The TOCSY (TOtal Correlation SpectroscopY) experiment (Braunschweiler et al.,
1983) also correlates homonuclear scalar-coupled spins, but is also able to establish
correlations between protons that, although not sharing mutual coupling, reside in the same
spin-system and form a continuous chain of spin-spin coupled protons. The TOCSY
sequence (Figure II.8a) allows the magnetisation to propagate along this chain by relaying
coherence from one proton to the next. Compared to the COSY sequence already shown
(Figure II.7a), the only difference is the use of a mixing pulse sequence, referred to as the
spin-lock sequence, instead of a single mixing pulse. The purpose of this is to execute the
relayed magnetisation transfer mentioned above.
a)
b)
Figure II.8. a) Basic TOCSY pulse sequence using a continuous low-power pulse as spin-lock and b) TOCSY sequence with the MLEV-17 mixing scheme.
90º 90º
t1 t2
f2
?X
?A
?A
?X
f1
90º
t1 t2
Spin-lock y
?m
90º
t1 t2
(MLEV-17y)n SLy SLy

Chapter II
46
To understand the action of the spin- lock period in the TOCSY experiment,
consider the sequence of events during the first transient (t1 = 0). The spins are first excited
with a 90º pulse along the x-axis so that they all lie along the y-axis in the rotating frame.
At this point, the spin- lock field is applied parallel to the nuclear vectors, spin- locking
them along the y-axis. During this mixing period, all protons experience the same effective
field, so that all chemical shift differences in the rotating frame are removed, although
spin-spin couplings remain active. This corresponds to a strong coupling condition (? ? <<
J), under which there exists oscillatory exchange of coherence between protons, leading to
a propagation of magnetisation along the chain of coupled spins. This requirement for
nuclei to experience identical local fields for magnetisation transfer to occur between them
is also referred to as the Hartmann-Hann match. Since magnetisation may travel in either
dimension along a spin-chain, 2D TOCSY spectra are again symmetrical about the
diagonal. For short mixing times of about 20 ms, only single-step transfers have significant
intensity and the correlations seen are equivalent to those seen in COSY. Longer mixing
periods enable magnetisation to travel further along the coupled chain and peaks arising
from multi-steps transfers appear. However, the use of very long mixing times also leads to
sensitivity losses due to relaxation (in the rotating frame) of the spin- locked magnetisation.
Although in its simplest form the spin- lock is a continuous low-power pulse of
constant phase, in practice, this is replaced with an extended sequence of composite 180º
pulses which extend the effective bandwidth without excessive power requirements. One
of these sequences, which was used for recording the TOCSY spectra shown in this thesis,
is the so called MLEV-17 sequence (Malcom Levitt’s composite-pulse decoupling
sequence), in which an even number of cycles through the MLEV-17 sequence are used to
produce the desired total mixing period (Figure II.8b) (Bax and Davis, 1985). This
implementation also comprises the use of spin- lock trim-pulses (SL) applied for 2-3 ms
along one chosen axis, so that magnetisation not parallel to this axis is eliminated before
and after the transfer sequence. The purpose of this is to ensure the collection of
absorption-mode data, eliminating dispersive contributions to the spectrum.
Heteronuclear shift correlation methods have also been employed to establish
correlations between 1H and 13C chemical shifts. In particular, the HMQC (Heteronuclear
Multiple-Quantum Correlation) and HSQC (Heteronuclear Single-Quantum Correlation)

Fundamentals of the Analytical Methods Employed
47
methods have been used. Both experiments correlate coupled heteronuclear spins across a
single bond, hence identifying directly connected nuclei, and employ detection of the high-
sensitivity nucleus (e.g. 1H instead of 13C). This inverse detection allows a major
improvement in the sensitivity of the experiment.
Figure II.9. Basic HMQC pulse sequence and associated coherence transfer pathway (Bax et al., 1983; Claridge, 1999).
The basic HMQC sequence (Bax et al., 1983), shown in Figure II.9, comprises four
rf pulses, the operation of which is considered here for a simple 1H-13C spin pair. The
sequence starts with proton excitation followed by a period ? set to 1/(2JCH), during which
antiphase proton magnetisation develops with respect to JCH. Then, the first carbon pulse
generates proton-carbon multiple-quantum coherence, the proton magnetisation being
transferred to its directly bound carbon. This coherence is, in fact, a combination of both
heteronuclear double- and zero-quantum coherence, as represented by the coherence level
diagram shown in the Figure. In order to such coherences to evolve during the subsequent
period t1 under the influence of carbon chemical shifts only, a spin-echo is incorporated by
placing a 180º proton pulse at the midpoint of t1. In this way, at the end of the evolution
period t1, the proton shifts have refocused and thus have no influence in f1. Evolution of the
carbon shifts is unaffected by the proton pulse, so these remain to produce the desired
frequency labelling. The final carbon pulse then reconverts the multiple-quantum
90º
90º 90º
t1
180º
? ?
(Decouple)
1H
X
-1 0
+1 1H p=
X p=
-1
0 +1

Chapter II
48
coherence back to observable single-quantum proton magnetisation. To avoid cancellation
of the antiphase proton satellites, a second ? period is inserted to refocus the proton-carbon
coupling, after which the proton magnetisation is detected. When collecting the proton
FID, it is generally desirable to apply broadband decoupling of the carbon spins to remove
the JCH doublet fine structure, thus doubling the S/N ratio. Conventional quadrature
detection in f1 is implemented by incrementing the phase of the carbon pulse prior to t1,
according for instance to the TPPI procedure, to yield a phase-sensitive display. The result
is a 2D spectrum with 1H shifts in f2 and 13C shifts in f1 and crosspeaks indicating one-
bond connectivities.
The HSQC experiment (Bodenhausen and Ruben, 1980) differs from HMQC in
that only single-quantum transverse magnetisation of the heteronuclear spins evolves
during the t1 period rather than multiple-quantum coherence (Figure II.10). Consequently,
the cross peaks in the HSQC spectrum do not contain homonuclear 1H-1H couplings along
f1. This results in improved resolution in this dimension, the principal advantage of HSQC
over HMQC for small molecules. The most notable disadvantage is the greater number of
pulses it utilises, promoting intensity losses from rf inhomogeneity, pulse miscalibration or
off-resonance excitation.
Figure II.10. Basic HSQC pulse sequence and associated coherence transfer pathway (Bodenhausen and Ruben, 1980; Claridge, 1999).
(Decouple)
-1 0
+1
1H
X
1H p=
X p=
-1
0 +1
? /2 ? /2 ? /2 ? /2
t1
90º 180º 90º 180º 90º 180º

Fundamentals of the Analytical Methods Employed
49
While the correlation methods described above exploit scalar couplings to correlate
the chemical shifts of interacting spins, J-resolved spectroscopy aims to separate chemical
shifts from scalar couplings, which may be heteronuclear or homonuclear depending on the
details of the experiment. In this work, only homonuclear proton J-resolved spectroscopy
has been employed to provide direct measurement of 1H-1H coupling constants, and thus
only this experiment is described here.
As shown in Figure II.11a, the homonuclear J-resolved experiment (Aue et al.,
1976b) employs a spin-echo sequence during the evolution time t1 to make the detected
FIDs insensitive to chemical shift evolution during t1, so that the f1 dimension only
contains coupling information. Indeed, the 180º pulse at the midpoint of the evolution time
refocuses proton shifts but not homonuclear couplings, which appear in f1. On the other
hand, the f2 dimension contains both chemical shift and coupling constant informa tion,
since one cannot simultaneously broadband decouple and observe the proton spectrum. To
overcome this feature, which complicates interpretation of the 2D J-resolve spectra, post-
processing techniques are employed, namely by ‘tilting’ the multiplets through an angle of
45º about their midpoints, as illustrated schematically in Figure II.911b.
a) b) Figure II.11. a) Basic homonuclear J-resolved pulse sequence and b) schematic representation of the tilting procedure for eliminating homonuclear couplings from the f2 dimension.
90º 180º
t1/2 t1/2
0 JHH
f2 (ppm)
0 JHH
f1 (Hz)
f2 (ppm)
f1 (Hz) JHH

Chapter II
50
II.2. NMR Spectroscopy of Solids
II.2.1. Nuclear Spin Interactions in Solids
Liquid state NMR spectra are dominated by the Zeeman interaction with the
external magnetic field B0 ( ZH ), the chemical shift interaction ( CSH ), and the scalar spin-
spin interaction ( SCH ) and, thus, the Hamilton operator for a nucleus with spin I in the
liquid domain is defined by the following expression:
SCCSZ HHHH ??? ?II.8?
Due to the rapid tumbling of the molecules, these interactions are isotropic, producing
discrete average values for chemical shifts and coupling constants.
In the solid state there are additional mechanisms that have to be considered (Fyfe,
1983; Harris, 1987; Gunther, 1995). These are the anisotropy of the chemical shift
interaction ( CSH ), dipole-dipole interactions ( DH ) and quadrupolar interactions ( QH ), the
latter occurring only for nuclei with spin I>1/2 and arising from the interaction of the
nuclear electric quadrupole moment with the non spherically symmetrical electric field
gradient around the nucleus. Thus, a general Hamiltonian for the interactions experienced
by a nucleus of spin I in the solid state may be written as follows:
QDSCCSZ HHHHHH ????? ?II.9? The critical feature of these interactions is that they are anisotropic in the solid due
to the relatively fixed orientations of the molecules. Consequently, they impose a
dependence on the NMR frequency based on the molecular orientation with respect to the
main magnetic field direction, and lead to the broadening of spectral lines. The typical
magnitudes of these interactions are listed in Table II.2.
Table II.2. Typical magnitudes of nuclear spin interactions in the solid state (Fyfe, 1983).
Type of interaction Magnitude (Hz) Zeeman 106 - 109
Chemical Shift 0 – 105 Scalar Coupling 0 – 104 Dipole-dipole 0 – 105 Quadrupolar 0 – 109

Fundamentals of the Analytical Methods Employed
51
Another important source of line broadening in the spectra of solid samples is the
effect of variations in local bulk magnetic susceptibility (Belton and Gil, 1996; Eads,
1999). This is particularly relevant in heterogeneous materials, such as food and biological
samples, which contain regions of significantly different bulk magnetic susceptibilities,
thus being magnetised to different extents when subject to the applied magnetic field and
leading to spectral broadening. This effect is better understood in terms of the simplest
case of a thin liquid shell surrounding a spherical particle of higher magnetic susceptibility:
nuclear spins in liquid molecules near the surface experience an additional field and thus a
higher frequency than distant liquid nuclear spins. Therefore, the liquid NMR spectrum
becomes a sum of resonances, whose frequency distribution is given by the field
distribution. In this case, the maximum broadening may be approximated by:
? ? ? ~ 2?? ??B0 ?II.10?
where ? ? is the difference in bulk magnetic susceptibilities of particle and liquid
(dimensionless), ? is the magnetogyric ratio (Hz/tesla) of the observed nucleus and B0 is
the magnetic field strength (tesla) (Eads, 1999). This broadening may range from tens to
thousands of Hz, depending on the factors shown in equation II.10.
II.2.2. High Resolution Solid-State NMR Techniques
Particular techniques have been developed to obtain highly resolved NMR spectra
of solids, which rely on the ability to average the interactions described above on a
timescale that is rapid compared to the spectral line widths. The importance of those
interactions depends on the nucleus being observed and on the system under study, and the
experimental concepts behind the different techniques vary accordingly.
One of the most ingenious techniques especially developed for solid state NMR
spectroscopy is the Magic Angle Spinning (MAS) technique, which in this thesis has been
used to record 1H spectra of mango fruit intact pulp. The basic principle of MAS is to
simulate the effect of molecular tumbling in solution state, thus reducing the broadening
effects of chemical shift anisotropy (CSA) and dipolar interactions (Fyfe, 1983; Harris,

Chapter II
52
1987). These interactions have an angular dependence on the factor (3cos2?-1), where ? is
the angle between the internuclear vector and the direction of the static field.
The technique of MAS consists of spinning
the sample around an axis at an angle ? of
54.74º (the magic angle) to the applied
magnetic field B0 (Figure II.12). Since
3cos2?-1 = ½(3cos2? -1) (3cos2? -1), and the
factor (3cos2? -1) is zeroed for ? = 54.74º,
the effect of rotation is to average out the
CSA and dipolar interactions, as long as the
spinning rate is fast enough, thus giving one
single value of chemical shift corresponding
to the isotropic value observed in solution
state.
Figure II.12. Macroscopic sample rotation at the magic angle with B0.
The averaging of the CSA pattern to only one line by MAS requires spinning rates
(SR) of a few KHz, the typical magnitude of CSA line widths (Belton and Gil, 1993). At
lower rates, spinning side bands (SSB) are observed on either sides of the isotropic signal,
spaced at an interval equal to the SR measured in Hz. The SSB complicate spectral
interpretation and have the additional disadvantage of dispersing the intensity of the central
band, thus hindering quantitative studies; however, several solutions to this problem exist.
MAS at rates of a few KHz also averages the homonuclear dipolar interactions between
dilute spins (e.g. 13C-13C), and heteronuclear interactions between abundant and dilute
spins (e.g. 1H-13C). However, in a typical solid, to average out the stronger homonuclear
correlations between abundant spins (e.g. 1H-1H), spinning rates of several tens of KHz
must be employed.
In the case of semi-solid samples, such as the fruit pulps analysed in this work, the
fast molecular motion may significantly reduce the strength of anisotropic interactions so
that they become of the order or less than the achievable sample spinning rates, thus being
effectively averaged out by MAS. In such samples, the main factor contributing to the line
broadening is, generally, the magnetic susceptibility inhomogeneity, which in proton
?
?
rij
?
B0 Rotation axis

Fundamentals of the Analytical Methods Employed
53
spectra is typically of the order of a few tens of Hz. This magnitude can also be greatly
reduced by MAS (Belton and Gil, 1996; Eads, 1999). The reason for this is that
susceptibility inhomogeneity also has an angular dependence on the factor 3cos2?-1 and
this factor is zeroed by rotation at the magic angle, as explained above. In addition, the
spectral resolution for inherently mobile systems can be further improved by using a high
resolution probe together with MAS (HR-MAS probe). This kind of probe is designed to
perform solution type experiments and enables the use of a lock system to achieve long-
term stability of the magnetic field. As it will be shown in this work, the use of a HR-MAS
probe for studying semi-solid samples results in significant resolution enhancement,
enabling efficient solvent suppression schemes to be applied and 2D experiments to be
carried out.
II.3. Hyphenated NMR Methods (HPLC-NMR and HPLC-NMR/MS)
High-performance liquid chromatography (HPLC) is one of the techniques
routinely used for the analysis of complex mixtures, including a wide variety of food
samples (Bovanová and Brandsteterová, 2000). However, the ability to obtain structural
information on substances separated using HPLC is limited by the on- line detector systems
commonly employed, such as refractive index, UV, radiochemical, fluorescence and
electrochemical detectors. None of these systems provide detailed structural information
and there is always some vagueness as to whether detected peaks are actually those of
target compounds or others coeluted with them. This limitation has led to a growing
interest in coupling more sophisticated systems to HPLC, namely diode-array UV, IR,
mass spectrometry (MS) and, more recently, NMR spectroscopy. HPLC-MS is a
particularly well-established analytical tool, since it combines the separation capabilities of
HPLC with the ability of MS to detect and identify substances at low concentrations.
Applications in food analysis are numerous and have been recently reviewed by Careri et
al. (1998). In the last years, the new hyphenated method HPLC-NMR has also found its
way into the analytical laboratory. The first attempts to couple liquid chromatography with
NMR spectroscopy have been carried out in the late 1970s and early 1980s. However, for
several years, the technique did not gain importance mainly due to insufficient sensitivity,

Chapter II
54
the need to use expensive deuterated solvents because of dynamic range problems, and the
lack of multiple solvent suppression routines able to cope with mixed solvents and gradient
elution. In the last decade, these technical problems have largely been overcome through
the development of new specialised hardware and software (Lindon et al., 1996; Spraul et
al., 2001). A major technological advance has been the development of dedicated flow
probes, where the detection coil is directly fixed on to the outside of the NMR cell,
providing an optimal filling factor and improved sensitivity. The efficiency of solvent
suppression has also been significantly improved, namely by the introduction of new pulse
sequences that can suppress multiple solvents in an automatic fashion, thus making the use
of deuterated solvents unnecessary. In addition, HPLC-NMR has benefited from the
introduction of oversampling and digital filtering techniques into NMR acquisition
systems, which allowed gains in dynamic range and sensitivity.
A further sophistication has been achieved by the combined hyphenation of both
NMR and MS to an HPLC system. With the HPLC-NMR/MS set-up, decisions on which
LC peaks are interesting for structural analysis can be made with basis on both UV and MS
information. Another advantage is the much greater sensitivity of the mass spectrometer
compared to the NMR spectrometer, enabling compounds present at concentrations lower
than the NMR detection limit to be observed. In addition, NMR and MS data recorded for
each fraction provide complementary information which is often sufficient for the
unambiguous structural elucidation of a compound.
Figure II.13 shows a schematic representation of a typical instrumental set-up for
HPLC-NMR/MS. It includes a standard HPLC equipment, comprising the LC pump, the
column and the detector (e.g. UV, DAD, refractive index), a high-resolution NMR
spectrometer, equipped with a dedicated flow probe, and a mass spectrometer, attached to
the system via a splitter at the output of the HPLC-NMR interface. The effluent from the
HPLC column is split immediately after chromatographic detection. Given the relative
sensitivities of the two spectrometers, the ma jor proportion (95%) is directed towards the
NMR detector and the remaining (5%) to the MS. Coupling of NMR and MS is in parallel
mode, so that depending on the length of the capillary to the MS, it is possible to choose
MS detection prior to, simultaneous with, or after NMR detection. Besides the flow
splitter, the HPLC-NMR/MS interface also comprises a t-piece to allow mixing and push
solvents, a double dilutor to mix in ionisation helping agents, to do back exchange of

Fundamentals of the Analytical Methods Employed
55
H2O/D2O, or to further dilute the flow to the MS, and a special delay loop valve to adjust
transfer timing.
Figure II.13. Schematic representation of a HPLC-NMR/MS system (Hansen et al., 1999).
The heart of the system is the flow control unit, which determines the various
patterns of eluent flow. There are currently four main methods of operation which can be
employed, with both isocratic and gradient elution: 1) continuous-flow; 2) stop-flow, 3)
time-sliced stop-flow and 4) peak collection into capillary loops for posterior analysis. In
the continuous-flow mode, NMR and MS data are acquired during chromatography. This
method provides a rapid screening of the compounds separated, but the sensitivity is
limited by the short acquisition time. Moreover, if gradient elution is used, the shift in the
positions of the solvent NMR signals caused by changes in the solvent composition must
be taken into consideration for designing solvent suppression schemes. A possible
methodology is to carry out a dummy run, determine all frequencies as a function of
solvent composition and store them in a list for look-up during the chromatographic run.
Alternatively, the solvent suppression frequencies can be determined by measuring a single
exploratory scan as soon as a chromatographic peak is detected in real time during the
chromatographic run and then apply suppression irradiation at these frequencies as the
peak elutes.

Chapter II
56
In the stop-flow mode, the pump is stopped when the LC-peak has reached the
NMR flow cell and started again after the NMR measurement is finished. In this way, 1D
spectra with longer acquisition times and also 2D spectra, that may aid spectral assignment
and structure determination, can be recorded. The flow may be stopped manually or
automatically, using the time-slicing method, which consists of stopping the flow at short
intervals over the chromatogram to “time-slice” different parts of a chromatographic peak.
This method may be useful if poor chromatographic separation results, if the compounds
under study have weak UV chromophores or if the exact chromatographic retention time is
poorly defined. However, when operating in the stop-flow mode, the chromatographic
resolution is degraded due to diffusion of peaks still sitting on the column or in the transfer
capillary when a stop occurs. Furthe rmore, no MS data can be acquired because of the
interruption of the flow during the NMR measurement.
Another operation mode, which overcomes the disadvantages of the stop-flow
methods, consists of transferring the LC-peaks of interest into capillary storage loops that
retain the LC-peak shape due to small inner diameter (e.g. 0.25 mm). In this case, the flow
is not stopped during the chromatography, but only valves are switched to direct the LC-
peaks into the loops. After the chromatographic run is finished, the loop contents can be
transferred sequentially to the NMR and MS spectrometers for off- line experiments.
II.4. Fourier Transform Infrared (FTIR) Spectroscopy
Mid-infrared spectroscopy involves the absorption by molecules of radiation in the
4000 to 400 cm-1 range of the electromagnetic spectrum. The absorption arises through
transitions between vibrational energy states and rotational substates of the molecule. The
rotational substates are not quantised in liquids or in solids, and thus only vibrational
transitions are observed. For these transitions to occur, a selection rule states that the
vibration must cause a net change in the dipole moment of the molecule (Schrader, 1995;
Hesse et al., 1996). The positions of the absorption bands seen in the mid- infrared
spectrum depend on the masses of the atoms and on the force constant of the vibrating
bonds. Thus, many functional groups in organic molecules show characteristic vibrations,
which correspond to absorption bands in defined regions of the infrared spectrum, thus

Fundamentals of the Analytical Methods Employed
57
making infrared spectroscopy a reliable method for assigning a substance to a particular
class of compounds. The absorption bands that can be assigned to the individual functional
groups, corresponding to fundamental stretching and bending vibrations, lie above 1500
cm-1. For instance, the stretching vibrations of the group OH of alcohols give strong
absorption bands at 3650-3200 cm-1, of the group N-H of amines at 3500-3200 cm-1, and of
the group C=O at 1800-1650 cm-1 for carboxylic acids, 1775-1650 cm-1 for ketones, 1765-
1645 cm-1 for aldehydes, 1745-1730 cm-1 for esters and 1700-1650 cm-1 for amides
(Pretsch et al., 1989). On the other hand, the region below 1500 cm-1 contains overlapping
bands that characterise the molecule as a whole and cannot be conclusively assigned to
localised vibrations. It is in this region that the pattern of infrared peaks varies most from
compound to compound and, therefore, it is known as the fingerprint region. Besides
fundamental vibrations, overtones and combination vibrations, which correspond,
respectively, to multiple values and combinations of the fundamental vibrations
wavenumbers, also arise in this region, although they are generally much weaker than
those from fundamental vibrations (Hesse et al., 1996). Besides being useful for structure
elucidation, infrared spectroscopy may also be employed in quantitative analysis because
the intensity of the infrared absorption band is proportional to the concentration of the
absorbing species.
Most infrared spectrometric measurements today are performed with Fourier
transform infrared (FTIR) spectrometers, which have largely replaced classical scanning
instruments. The basic principle of the FTIR spectrometer is the simultaneous collection of
data at all frequencies in the infrared
spectrum, thus eliminating the time
required for scanning through the different
frequencies. The main component of the
FTIR instrument is a Michelson
interferometer, schematically represented
in Figure II.14. The infrared radiation is
led into it through a semi-transparent plate
(KBr or CsI coated with germanium)
which acts as a beam splitter. One half of
the light falls onto a fixed mirror, the other
Figure II.14. Schematic representation of a Michelson interferometer
Source
Beam splitter
Sample Detector
Movable mirror
Fixed mirror

Chapter II
58
onto a movable mirror, the distance of which from the interferometer can be varied. Both
mirrors reflect the light onto the plate, where interference (constructive or destructive)
takes place. Since the infrared radiation is polychromatic, the interferogram obtained is a
superimposition or summation of the interferograms of all the individual frequencies. The
modulated radiation is now passed through the sample, where it is selectively absorbed,
depending on the vibrations excited in the sample. The detector records the emerging
radiation as an interferogram, converts the optical signals into electrical signals and passes
them onto the data storage system. The intensity of the radiation recorded at the detector
depends on the moving mirror velocity and varies with time, such that:
P(d) = 1/2 P(? )cos2? ft ?II.11?
where P(d) is the intensity of the radiation detected as a function of d = 2L (L being the
distance to the beam splitter by which the movable mirror differs from the fixed mirror),
P(? ) is the intensity of the incident radiation as a function of ? (frequency of the incident
radiation) and f = 2V? , V being the moving mirror velocity. As many frequencies are
present in a infrared source, the interferogram is the sum of an infinite number of cosine
waves, so that:
P(d) = ???
01/2 P(? )cos2? ft ? d? ?II.12?
In order to extract the frequency information from the interferogram and produce an
interpretable band spectrum, Fourier transformation is applied. The Fourier transformation
of ?II.12? is:
P(? ) = ???
??1/2 P(t)cos2? ft ? dt ?II.13?
Where P(? ) represents the intensity of the radiation as a function of frequency, i.e., the
spectrum.

Fundamentals of the Analytical Methods Employed
59
There are many sampling methods for measuring infrared spectra of samples in
different states of matter and for different applications. The Attenuated Total Reflectance
(ATR) method has been the method employed in this thesis to measure the FTIR spectra of
mango juice and of beer. This method consists of passing infrared radiation through a high
refractive index crystal (e.g. ZnSe, Ge, diamond), coated with the sample under study
(Figure II.15). The radiation is reflected off
the crystal walls once or many times and, as
some of it is absorbed by the sample, its
intensity is attenuated. This change in the
intensity of radiation totally reflected
originates the spectrum of the sample in
contact with the crystal.
Figure II.15. Horizontal ATR sampling accessory.
The ATR method has the advantages of simplifying sample handling and avoiding
problems commonly found in transmission cells, such as filling and cleaning. Liquids,
viscous fluids and pastes can be simply poured or spread onto the surface of the ATR
accessory and then wiped off after analysis. For this reason, ATR is the sampling method
most widely used in the analysis of foods (Wilson and Goodfellow, 1994; Sedman et al.,
1998). In the case of powders or other solid samples, the use of a pressure device is
recommended to improve the optical contact between the sample and the crystal, which is
critical for the quality of the spectrum obtained.
II.5. Some Multivariate Analysis Methods
Techniques of multivariate data analysis are being increasingly applied to spectral
data in order to extract meaningful information from the complex and highly informative
spectra and address questions of classification and discrimination. In this thesis, Principal
Components Analysis (PCA) is used as a data reduction technique to visualise the main
variability aspects of NMR and FTIR data sets, Canonical Correlation Analysis (CCA) is
used to establish relationships between two domains (NMR and FTIR), and PLS regression
Sample
IR beam

Chapter II
60
is applied as a calibration technique to predict concentration values. The basic principles of
these chemometric methods are described in the following sections.
II.5.1. Principal Components Analysis (PCA)
PCA is essentially a descriptive method, often used for data reduction and
exploratory analysis on high-dimensional data sets. It helps establishing the presence of
any intrinsic class-related patterns or clusters in the data set, without any inclusion of
information concerning the classification of samples. The main goal of PCA is to reduce
the dimensions of the original data set giving a smaller space that retains the relevant
information (Jolliffe, 1986).
Consider the spectra assembled into a (n x d) matrix where n is the number of
samples (objects) and d is the number of data points (variables) per spectrum. It is
generally the case with NMR and FTIR spectra that d > n, since the number of data points
may run into many hundreds. PCA reduces the data matrix to (n x p), where p is the
number of principal components (PCs) determined, with p < n < d. The PCs are orthogonal
linear combinations of the original variables calculated in order to maximize the dispersion
of the individuals. The sample coordinates on the new PC axes are named scores. Thus,
the (n x p) matrix contains the PC scores which replace the spectral intensities of the
original (n x d) matrix. The relationship between new and old axes in expressed in a (p x d)
matrix of eigenvectors, called loadings. The decomposition of the initial matrix X(n, d) is
thus formalised by:
X(n, d) = T(n,p)L(p,d)T + E(n, d) ?II.14?
where T is the scores matrix, L the loadings matrix, E the error matrix, n is the number of
objects (samples), d is the number of variables, and p the number of principal components
used.
Successive PCs account for decreasing amounts of variance and are uncorrelated in
contrast to the original variables. Therefore, the PCA technique extracts the relevant
information (maximizing the variance explained by each new PC), removes the
redundancy (uncorrelated new variables) and reduces the dimension of the d-dimensional
space of the original variables. Plots of the scores for different pairs of PCs allow data

Fundamentals of the Analytical Methods Employed
61
patterns to be clearly visualised, since samples with similar properties appear as clusters in
the two-dimensional plot. The chemical origin of such clusters can be revealed through the
plot of the corresponding loadings, which resemble the spectra and, to some extent,
provide interpretable information.
II.5.2. Partial Least Squares (PLS) Regression
The PLS regression procedure is used to model the relationship between a set of
predictor variables X (n objects ? k variables) and a set of response variables Y (n objects
? m responses) (Geladi and Kowalski, 1986). In this thesis, PLS is used as a calibration
technique to predict the concentration of sugars in juices. There is only one response in Y
(concentration), and hence Y has (n objects ? 1 response) dimension. This method has the
advantage of accepting more variables than objects in the data and of avoiding the problem
of collinearity among variables.
The classical PLS regression method is a special case of Non-linear Iterative Partial
Least Squares (NIPALS) method, in which the information explained by each dimension is
subtracted from the X matrix in an iterative process, until all the important variance is
extracted. In other words, a PCA is performed on the X matrix by means of NIPALS,
maximizing at the same time the correlation of the extracted PCs with the response
variables vector. The relationship may be formalised as:
Y= X B + E ?II.15?
where Y is the vector of dependent variables (in this study, sugar concentration), X is the
matrix of the independent variables (spectra), B is the regression coefficients vector, and E
represents the error not accounted for by the model. The regression model is generated by
calculating the B coefficients that minimise the error matrix. The main difference between
this and other regression procedures is the way the B vector is calculated. In the PLS
procedure the information present in the Y matrix is used in the calculation of B
coefficients.

Chapter II
62
II.5.3. Canonical Correlation Analysis (CCA)
This multivariate data treatment seeks to identify and quantify the relationships
between two sets of variables or domains (X and Y) (Robert et al., 1993). The method
maximizes the correlation between the linear combination of the variables in one domain
with the linear combination of the variables in the other domain. The procedure starts by
finding the pair of linear combinations (between both domains) having the largest
correlation. Next, it seeks a pair of linear combinations having the largest correlation but
uncorrelated to the first pair of linear combinations found. This procedure is repeated until
extraction of all canonical factors has been accomplished. The pairs of linear combinations
are called canonical variables and their correlations are called canonical correlations. The
canonical correlation is a measurement of the strength between the obtained pairs of linear
combination between the two domains (X and Y). The aim of CCA is to concentrate the
information of both domains into a small number of canonical variables that should
represent almost the same information present in the initial variables. This method may be
useful to characterise one group of variables about which there is little information, by
relating it to another group of well-characterised variables.
References
Aue, W.P.; Bartholdi, E.; Ernst R.R. Two-dimensional spectroscopy. Application to nuclear magnetic resonance. Journal of Chemical Physics 1976a, 64, 2229-2246. Aue, W.P.; Karhan, J.; Ernst, R.R.J. Homonuclear broad band decoupling and two-dimensional J-resolved NMR spectroscopy. Journal of Chemical Physics 1976b, 64, 4226-4227. Bax, A.; Davis, D.G. MLEV-17 based two-dimensional homonuclear magnetization transfer spectroscopy. Journal of Magnetic Resonance 1985, 65, 355-360. Bax, A.; Griffey, R.H.; Hawkins, B.L. Correlation of proton and nitrogen-15 chemical shifted by multiple quantum NMR. Journal of Magnetic Resonance 1983, 55, 301-315. Belton, P.S.; Gil, A.M. Proton nuclear magnetic resonance lineshapes and transverse relaxation in a hydrated barley protein. Journal of the Chemical Society Faraday Transactions 1993, 89, 4203-4206. Belton, P.S.; Gil, A.M. Magic angle spinning spectra of rare and abundant nuclei in food materials. Journal of Magnetic Resonance Analysis 1996, 2, 45-52.

Fundamentals of the Analytical Methods Employed
63
Bodenhausen, G.; Ruben, D.J. Natural abundance nitrogen-15 NMR by enhanced heteronuclear spectroscopy. Chemical Physics Letters 1980, 69, 185-188. Bovanová, L.; Brandsteterová, E. Direct analysis of food samples by high-performace liquid chromatography. Journal of Chromatography A 2000, 880, 149-168. Braun, S.; Kalinowski, H.-O.; Berger, S. 150 and More Basic NMR Experiments; Wiley-VCH: Weiheim, 1998.
Braunschweiler, L.; Bodenhausen, G.; Ernst, R.R. Coherence transfer by isotropic mixing: application to proton correlation spectroscopy. Journal of Magnetic Resonance 1983, 53, 521-528. Careri, M.; Mangia, A.; Musci, M. Overview of the applications of liquid-chromatography-mass spectrometry interfacing systems in food analysis: naturally occurring substances in food. Journal of Chromatography A 1998, 794, 263-297. Claridge,T.D.W. High-Resolution NMR Techniques in Organic Chemistry; Elsevier Science: Oxford, 1999.
Colquhoun, I.J.; Goodfellow, B.J.; Nuclear magnetic resonance spectroscopy. In Spectroscopic Techniques for Food Analysis; Wilson, R.H. Ed.; VCH: New York, 1994; 87-145. Eads, T. Principles of nuclear magnetic resonance analysis of intact food materials. In Spectral Method in Food Analysis; Mossoba, M.M. Ed.; Marcel Dekker, Inc.: New York, 1999; 1-88. Fan, T.W.-M. Metabolite profiling by one- and two-dimensional NMR analysis of complex mixtures. Progress in Nuclear Magnetic Resonance Spectroscopy 1996, 28, 161-219. Fyfe, C.A. Solid State NMR for Chemists; CFC Press: Ontario, 1983. Geladi, P.; Kowalski, B.R. Partial least-squares regression: a tutorial. Analytica Chimica Acta, 1986, 185, 1-17. Gunther,H. NMR Spectroscopy: Basic Principles, Concepts, and Applications in Chemistry; 2nd Ed.; John Wiley & Sons: Chichester, 1995.
Hansen, S.H.; Jensen, A.G.; Cornett, C.; Bjornsdottir, I.; Taylor, S.; Wright, B.; Wilson, I.D. High-performance liquid chromatography on- line coupled to high-field NMR and mass spectrometry for structure elucidation of constituents of Hypericum perforatum L. Analytical Chemistry 1999, 71, 5235-5241. Harris, R.K. Nuclear Magnetic Resonance Spectroscopy; 3rd Ed.; John Wiley & Sons: New York, 1987. Hesse, M.; Meier, H.; Zeh, B. Spectroscopic Methods in Organic Chemistry; Georg Thieme Verlag: Stuttgart, 1997.

Chapter II
64
Jolliffe, I.T. Principal Component Analysis; Springer: New York, 1986. Lindon, J.C.; Nicholson, J.K.; Wilson, I.D. Direct coupling of chromatographic separations to NMR spectroscopy. Progress in Nuclear Magnetic Resonance Spectroscopy 1996, 29, 1-49. Martin, G. Analytical performance of high resolution NMR. In Magnetic Resonance in Food Science; Belton, P.S., Delgadillo, I., Gil, A.M., Webb, G.A. Eds.; The Royal Society of Chemistry: Cambridge, 1995; 105-119. Nicholson, J.K.; Foxall, P.J.D.; Spraul, M.; Farrant, R.D.; Lindon, J.C. 750 MHz 1H and 1H-13C NMR spectroscopy of human blood plasma. Analytical Chemistry 1995, 67, 793-811. Pretsch, E.; Clerc, T.; Seibl, J.; Simon, W. Spectral Data for Structure Determination of Organic Compounds; Springer-Verlag: Berlin, 1989. Robert, P.; Devaux, M.F.; Qannari, A.; Safar, M. Mid and near infrared study of carbohydrates by canonical correlation analysis. Journal of Near Infrared Spectroscopy 1993, 1, 99-108. Schrader, B. Infrared and Raman Spectroscopy: Methods and Applications; VCH: Weinheim, 1995. Sedman, J.; Van der Voort, F.R.; Ismail, A.A. Attenuated total reflectance spectroscopy: principles and applications in infrared analysis of food. In Spectral Methods in Food Analysis; Mossoba, M.M. Ed.; Marcel Dekker, Inc.: New York, 1999; 397-425. Spraul, M.; Braumann, U.; Godejohann, M.; Hofmann, M. Hyphenated methods in NMR. In Magnetic Resonance in Food Science - a View to the Future; Webb, G.A., Belton, P.S., Gil, A.M. Eds.; The Royal Society of Chemistry: Cambridge, 2001; 54-66. Wilson, R.H.; Goodfellow, B.J.; Mid- infrared spectroscopy. In Spectroscopic Techniques for Food Analysis; Wilson, R.H. Ed.; VCH: New York, 1994; 59-85.

III. STUDY OF THE COMPOSITION OF MANGO BY NMR
III.1. Introduction…………………………………………………………………………
III.2. Materials and Methods……………………………………………………………..
III.2.1. Sample Preparation…………………………………………………………...
III.2.2 NMR Measurements…………………………………………………………..
III.3. High Resolution NMR Study of Mango Juice………...…………………………....
III.3.1. Spectral Assignment………………………………………………………….
III.3.2. Compositional Differences Within and Between Cultivars………………….
III.4. NMR Study of Mango Pulp………………………………………………………...
III.4.1. Standard Magic Angle Spinning (MAS) NMR.……………………………...
III.4.2. High Resolution Magic Angle Spinning (HR-MAS) NMR………………….
III.4.3. Compositional Differences Between Pulp and Juice…………………………
III.5. Conclusions…………………………………………………………………………
References………………………………………………………………………………...
66
67
67
68
70
70
80
83
83
85
90
93
94

Chapter III
66
III.1. Introduction
The increasing trade in mango and the need to develop appropriate technologies to
enhance its marketable life and reduce post harvest losses have been accompanied by a
growing interest in studying the chemical composition of this fruit. Most data reported in
the literature (summarised in Chapter I) have involved separation of the liquid phase of the
fruit, followed by analysis by chemical or chromatographic methods. Those methods are
usually based on the study of one specific family of compounds and often require
extraction procedures to separate the compounds of interest from the complex natural
matrix, resulting in laborious and time-consuming sample preparation and analysis.
Furthermore, there is the disadvantage that the invasive separation and fractionation
methods may interfere with the fruit biochemistry.
High resolution nuclear magnetic resonance (NMR) spectroscopy has the attractive
features that structural and quantitative information can be obtained on a wide range of
compounds in a single experiment, with minimum sample preparation. In addition, NMR
measurements are non-destructive, allowing samples to be subsequently analysed by other
methods. For all these reasons, NMR has played an increasingly important role in the
compositional study of foods (Alberti et al., 2002).
Since the first attempts to measure 1H NMR spectra of fruit juices and other liquid
foods (Eads and Bryant, 1986), there have been several instrumental developments that
enabled major improvements in spectral resolution and sensitivity (Belton et al., 1998a). In
recent years, high resolution 1H NMR has been shown to be a valuable method for the
analysis of low molecular weight compounds in fruit juices, allowing the identification of
several sugars, organic acids, amino acids and other minor components such as phenolic
compounds (Vogels et al., 1996; Belton et al., 1996; Belton et al., 1997; Belton et al.,
1998b; Le Gall et al., 2001). Moreover, the application of multivariate statistics to NMR
spectra has provided promising results, concerning the classification of apple juice
according to variety (Belton et al., 1998b) and the detection of adulteration of orange juice
(Vogels et al., 1996; Le Gall et al., 2001).
Magic Angle Spinning (MAS) NMR has also been used to characterise the
composition of fruits by direct study of intact pulp (Ni and Eads, 1992; Ni and Eads,
1993a; Ni and Eads, 1993b), thus avoiding the use of extraction and separation methods.
The 1H MAS NMR spectra reported for banana enabled the identification of the three main

Study of the Composition of Mango by NMR
67
sugars present (sucrose, glucose and fructose) and their quantification at different ripening
stages (Ni and Eads, 1993b). Recent instrumental developments in MAS NMR equipment
have enabled the use of High-Resolution Magic Angle Spinning (HR-MAS) NMR leading
to a very significant resolution improvement in the spectra of solid or semi-solid food
samples (Gil et al., 1997; Sacco et al., 1998; Alberti et al., 2001) so that components other
than the main sugars may become detectable in intact fruits.
The work hereby reported, part of which has already been published (Gil et al.,
2000), aims at using liquid state and solid state NMR techniques for characterising the
chemical composition of mango juice and intact pulp, respectively. The juice is analysed
by high field 1H NMR (600 MHz) and assignment strategies based on 2D NMR methods
are employed in order to identify as much components as possible. HR-MAS (400 and 500
MHz) is used to obtain highly resolved spectra of fruit pulp, enabling 2D experiments to be
carried out. The spectral profiles of juice and pulp are compared to find out if the
composition of the juice is fully representative of the composition of the whole fruit, as
usually assumed.
III.2. Materials and Methods
III.2.1. Sample Preparation
The juice and pulp samples studied were prepared from three batches of mango
fruits: 1) cultivar Tommy Atkins grown in Brazil, 2) cultivar Haden grown in Venezuela,
and 3) cultivar Haden grown in Brazil. The nature of these sets of fruits was not chosen to
meet particular aims of this work, having been solely conditioned by the fruits found
available in the market. Each batch was obtained from a commercial source in Portugal, 3-
4 days after harvest and subsequent air shipment, and comprised 40 mature green fruits
from the same orchard. Only undamaged fruits having uniform size and colour, and free
from visible symptoms of infection, were selected for the study. As thoroughly described
in Chapter IV.2.1, these fruits were then ripened for 19-23 days, during which juice and
pulp samples were collected for analysis. In the present Chapter, only two stages of
ripeness are considered (unripe stage for mature green fruits, and ripe stage for ready-to-eat
fruits), whereas the compositional changes occurring during ripening will be discussed in
Chapter IV.

Chapter III
68
The juice was obtained by maceration of the pulp in a domestic juice extractor,
followed by centrifugation at 15000 r.p.m. dur ing 15 minutes, and filtration under vacuum
through a glass microfiber filter. In order to prevent microbial growth, sodium azide
(NaN3) was added to juices, typically prior to freezing, so that each sample contained
0.05% NaN3. The juice samples were frozen in liquid nitrogen and stored at –20ºC until
NMR analysis. As the chemical shift of many NMR signals is pH dependent, the samples
pH (initially varying from 2.9 to 5.3) was adjusted to fall in narrower ranges: the pH of
Haden juices was adjusted to 7.00 ? 0.05, by adding microlitre amounts of NaOH (0.1 M
and 1M) and HCl (0.1 M and 1M) solutions, and the pH of Tommy Atkins juices was
adjusted to 5.90 ? 0.30, by mixing 0.500 ml of 0.5 M sodium phosphate buffer with 1.5 ml
of juice. Finally, all samples were prepared to contain 7.5-10% D2O, used as the internal
lock, and 0.015-0.020% sodium 3-(trimethylsilyl)propionate (TSP), used as chemical shift
and intensity reference, and transferred to 5 mm o.d. NMR tubes.
The pulp samples were collected from the equatorial ring of the fruits, frozen in
liquid nitrogen and stored at –20ºC. The thawed pulps were then packed into 4 mm MAS
rotors and, for high-resolution NMR, a few drops of D2O containing TSP was added, in
order to provide a field frequency lock and a chemical shift reference.
III.2.2. NMR Measurements
The NMR spectra of juices were recorded at 27ºC on a Bruker Avance DRX-600
spectrometer, operating at 599.87 MHz for proton and 150.85 MHz for carbon. The
spectrometer was equipped with an automatic sample changer and the data were acquired
under an automation procedure that included temperature stabilization (5 minutes),
gradient shimming, and acquisition. The quality of the shimming was verified and
optimised when necessary so that the maximum line width at half height of the TSP signal
at 0.00 ppm was 1.5 Hz. A presaturation sequence (‘zgcppr’) was used to suppress the
water signal by applying low-power selective irradiation at the water frequency during 3 s
of the relaxation delay (Bax, 1985). Each 1H 1D spectrum consisted of 64 scans of 65536
data points with a spectral width of 12019.23 Hz, an acquisition time of 2.73 s, and a
relaxation delay of 7 s. This delay was chosen after measuring the spin- lattice relaxation
times, 1H T1, so that the recycle time was at least five times the maximum T1. In this way,
it is possible to carry out a quantitative analysis of the spectra. 1H T1 times were measured

Study of the Composition of Mango by NMR
69
using the inversion recovery sequence (180ºx-?-90ºx) with delays between pulses (?) in the
100 ms – 30 s range (15 experimental points). The FIDs were Fourier transformed with 0.3
Hz line broadening, phased and baseline corrected using the Bruker XWIN-NMR software.
The TOCSY spectra were acquired in the phase sensitive mode using time
proportional phase incrementation (TPPI), and the MLEV17 pulse sequence was used for
the spin- lock (Bax and Davis, 1985) (pulse program ‘mlevprtp’). 2048 data points with 16
transients per increment and 200 increments were acquired with a spectral width of
6613.76 Hz in both dimensions. The relaxation delay between successive pulse cycles was
2 s and the mixing time of the MLEV spin lock was 80 ms. The data were zero-filled in the
f1 dimension to 2048 data points and a sine-bell apodization function was applied prior to
FT. 1H-13C phase sensitive (echo/antiecho) heteronuclear single quantum correlation
(HSQC) spectra were recorded with inverse detection and 13C decoupling during
acquisition (Palmer et al., 1991; Schleucher et al., 1994), using the ‘invieagssi’ pulse
program. A relaxation delay of 2.2 s was used between pulses and a refocusing delay equal
to 1/41JC-H (1.75 ms) was employed. 2048 data points with 64 scans per increment and 300
increments were acquired with spectral widths of 7507.51 and 25000.00 Hz in the proton
and carbon dimensions, respectively. The FIDs were weighted using a sine-bell-squared
function in both dimensions and zero-filled in the f1 dimension to 1024 data points. 2D
homonuclear J-resolved spectra (Aue et al., 1976) with water presaturation (pulse program
‘jrespr’) were measured by acquiring 8192 data points with 16 transients per each of 128
increments, using spectral widths of 10000 Hz in the f2 dimension and 39 Hz in the f1 (J-
coupling) dimension. Prior to FT, the FIDs were weighted in both dimensions by a sine-
bell function and zero-filled in the f1 dimension to 256 data points. The spectra were tilted
by 45º to provide orthogonality of the chemical shift and coupling constant axes and
subsequently symmetrized about the f1 axis.
Standard 1H MAS NMR spectra of mango pulps (cv. Tommy Atkins) were
recorded on a Bruker MSL 400P NMR spectrometer, operating at 400 MHz for proton,
using a 4 mm double bearing MAS probe. The samples were spun at 1.0-1.2 KHz and 3-5 s
recycle delays were used. High resolution MAS experiments were carried out on Bruker
Avance DRX-400 and DRX-500 spectrometers, operating, respectively, at proton
frequencies of 400.13 and 500.13 MHz, and equipped with 4 mm HR-MAS probes.
Typically, the samples were spun at 5 KHz, but spinning rates in the range 1-15 KHz were

Chapter III
70
tried (results presented in section III.4.2). Different rotor configurations were also tested
and, preferably, zirconium oxide rotors with a fixed bottom insert and, sometimes, a
removable top insert were used. For Haden pulps, 400 MHz 1H 1D spectra were acquired,
consisting of 180 scans of 32768 data points with a spectral width of 6009.62 Hz, an
acquisition time of 2.73 s, and a relaxation delay of 6 s. Water suppression was achieved
by presaturation during 3 s of the relaxation delay. For Tommy Atkins pulps, 500 MHz 1H
1D spectra were acquired and consisted of 256/512 scans of 16384 data points with a
spectral width of 8012.82 Hz, an acquisition time of 1.02 s, and a relaxation delay of 1.5 s.
Water suppression was achieved by presaturation during the relaxation delay. All the FIDs
were zero filled to 64K data points and an exponential apodization function was applied,
corresponding to a line broadening of 0.3 Hz, before Fourier transformation. TOCSY, 1H-13C correlation and J-resolved spectra were also recorded for a few samples to aid spectral
assignment.
The pulse sequences used in the experiments described above are given in
appendix. Some experiments were recorded at the Bruker site of Silberstreifen (Germany),
within collaboration with Dr. M. Spraul and Dr. E. Humpfer.
III.3. High Resolution NMR Study of Mango Juice
III.3.1. Spectral Assignment
The 1H NMR spectrum of mango juice is shown in Figure III.1. This juice was
extracted from a ripe edible fruit (cv. Haden, Venezuela) with a soft texture and a yellow
pulp, being characterised by 15.7 % soluble solids and a pH value of 4.95. The spectrum
was recorded with presaturation of the water signal, which reduced the water peak (4.80
ppm) to below the intensity of the sugar signals, enabling minor components present at low
concentrations to be detected in all spectral regions. The high-field region (0-3 ppm) and
the low-field region (6-10 ppm) are vertically expanded in Figure III.1, showing the large
number of spectral lines, arising from the many components known to be present in mango
juice. Some of the signals were assigned with basis on the 1D spectral profile, by
comparison of chemical shifts (? in ppm), spin-spin coupling patterns (multiplicity) and
coupling constants (J in Hz) data with data compiled in the literature for other fruit juices

Study of the Composition of Mango by NMR
71
(Belton et al., 1998a) and for common metabolites found in biological samples (Nicholson
et al., 1995; Fan, 1996). Comparison with spectra of reference compounds expected to be
present in the juice has also been carried out. However, this approach is seriously hindered
by the highly complex and overlapped nature of the spectrum. Thus, in order to aid spectral
assignment, 2D NMR spectra, namely TOCSY, 1H-13C correlation and J-resolved spectra,
have been recorded for some mango juice samples. The information obtained from both 1D
and 2D spectra is compiled in Table III.1, which shows the list of compounds identified in
mango juice. 1H chemical shifts are shown in the third column of this Table, while the
fourth and fifth columns indicate, respectively, the multiplicity and coupling constants,
which could be measured either in the 1D spectrum (for non-overlapped signals) or in the
2D homonuclear J-resolved spectrum. The last column in Table III.1 provides 13C
chemical shifts for some compounds, which were measured in the 1H-13C correlation
spectrum.
Figure III.1. 600 MHz 1H NMR spectrum of ripe mango juice (cv. Haden, Venezuela); NS 64.
Figure III.2 shows the TOCSY spectrum of mango juice (same sample as in Figure
III.1). A significant number of cross-peaks are observed in all spectral regions, as clearly
illustrated by the expansions shown in Figure III.3. As explained in Chapter II.1.3, the
chemical shift coordinates of the cross-peaks correspond to the chemical shifts of scalar
coupled nuclei, either directly or through a chain of spin-spin couplings. The following
discussion will address the different spectral regions in turn.
1.01.52.02.5 ppm
9 8 7 6 5 4 3 2 1 ppm
789 ppm

Chapter III
72
Figure III.2. 600 MHz TOCSY spectrum of ripe mango juice (cv. Haden, Venezuela); NS 16 in f2, 80 ms mixing time.
The high-field region (0-3.0 ppm) shows signals arising mainly from aliphatic
groups of organic acids and amino acids (Figure III.3a). Shikimic and quinic acids are two
of the most prominent organic acids detected and, to our knowledge, this is the first time
that these acids are reported to be present in mango juice. Citric, malic and succinic acids,
which are generally referred to as the predominant acids in mango fruit (Lizada, 1993), are
also visible in the spectrum. As it will be shown later, citric acid is a major component of
unripe mango and in the spectrum of unripe juice gives rise to very intense and well-
resolved signals. In addition, spin systems for lactic, propionic and 3-hydroxybutyric acids
are also identified in the TOCSY spectrum. The structures of the major organic acids
detected in mango juice are shown in Figure III.4. In what regards the amino acids
identified, alanine is found to be the major aliphatic amino acid present in mango juice, as
previously reported for different mango cultivars (Wu et al., 1993). In addition, many other
amino acids are detected, such as valine, leucine, isoleucine, threonine, glutamine,
glutamic acid and GABA. In juice samples from different batches, shown in section III.3.2,
arginine, aspartic acid and asparagine were found to be present at significant levels.
ppm
9 8 7 6 5 4 3 2 1 ppm10
8
6
4
2

Study of the Composition of Mango by NMR
73
The presence of lipid-type compounds is also detected in the high-field region of
the juice spectrum through the TOCSY spin system comprising signals at 0.89, 1.29, 1.55
and 2.21 ppm, which may arise from one or more saturated fatty acids, such as palmitic
acid, reported to be one of the most important fatty acids in mango (Wu et al., 1993).
Unsaturated fatty acids are not detected in the juice, since correlations to 5.30 ppm, the
chemical shift expected for olefinic protons (–CH=CH–), are not observed.
In the 1.20-1.32 ppm region, there are several overlapped signals, which in the
TOCSY spectrum show correlations to resonances in the 3.4-5.2 ppm region, and may
tentatively be assigned to protons H6 of fucose (6-deoxy-galactose) and rhamnose (6-
deoxy-mannose). The spin systems identified are shown in Table III.1. In the case of ? -
rhamnose, 4 spin systems may possibly arise from this sugar, which may be free or
interspersed with galacturonic acid residues in pectic chains (Tucker, 1993). Indeed, some
of the spin systems observed are similar to those reported for rhamnose units of apple
pectin (Colquhoun et al., 1990; Schols et al., 1994). However, the high degree of spectral
overlap in the mid-field region hinders their distinction and objective assignment.
Other compounds with signals in the high-field region are acetoin, isopropanol/2,3-
butanediol and ethanol, which are typical products of fermentation processes and may
reflect some microbial activity in this particular juice. Indeed, in other juice samples,
ethanol gives rise to much weaker signals and acetoin and isopropanol/2,3-butanediol are
not detected at all.
The mid-field region (3.0-5.5 ppm) is dominated by intense and overlapped signals
of the major sugars present in mango juice: glucose, fructose and sucrose. Some of their
signals are easily recognised in the anomeric region of the 1D spectrum, namely the
doublets at 4.64, 5.23 and 5.41 ppm, arising, respectively, from ? -glucose (H1), ? -glucose
(H1) and sucrose (H1 of the glucose ring). In what regards fructose, the only signal
relatively free of overlap is seen at 4.11 ppm (H3 and H4 of ? -fructofuranose). The
complete spin systems for the three sugars have been measured in the TOCSY spectrum
and are listed in Table III.1. In addition, several weak signals are visible in the 4.5-5.5 ppm
region of the spectrum (Figure III.3b), indicating the presence of minor sugars. In
particular, some spin systems identified in the TOCSY spectrum (Table III.1) seem to be
consistent with the presence of xylose and of arabinose and/or galactose, according to 1H

Chapter III
74
a)
b)
c)
Figure III.3. Expansions of the TOCSY spectrum shown in Figure III.2: a) high-field region, b) mid-field (anomeric) region, and c) low-field region. The three-letter code is used for naming the amino acids; n.r. galA: non-reducing galacturonic acid.
? -glc suc
? -galA n.r. galA
(pectin)
ppm
1.01.52.02.53.0 ppm
1
2
3
4
5
ala
quinic
ethanol shikimic
citric
malic
TSP
val, leu, ile rha fuc
thr acetoin
GABA
f.a.
lactic
succinic GABA
ppm
4.84.95.05.15.25.35.4 ppm
3.5
4.0
4.5
ppm
6789 ppm
6
7
8
9
10
shikimic
niacin
formic gallic
tyr
phe
acetaldehyde uracil
unknown
niacin

Study of the Composition of Mango by NMR
75
NMR data reported for monosaccharides (Bock and Thøgersen, 1982). Moreover, the
relatively broad signals between 5.05 and 5.20 ppm show several couplings to signals in
the 3.7-4.3 ppm region and are thought to arise from non-reducing galacturonic acid
residues of pectic segments, namely from protons H1 of non-esterified units and from
protons H5 of units methyl-esterified at carboxylic groups (Tjan et al., 1974; Neiss et al.,
1999). However, their spin systems could not be differentiated due to the high spectral
complexity. The proton H1 of free ? -rhamnose is also expected to resonate in this region,
whereas the signals of pectic ? -rhamnose H1 protons are expected to be shifted downfield
to about 5.25 ppm, falling under the ? -glucose signal. At 5.32 ppm, another relatively
broad signal is detected and the respective spin system is consistent with reducing ? -
galacturonic acid, either free or in the reducing end of pectic segments.
Figure III.4. Structures of the major organic acids found, in this work, to be present in mango juice.
The signals situated in the low-field region (5.5-10 ppm) are the weakest in the
spectrum, the most intense signal belonging to shikimic acid (Figure III.3c). Other
compounds readily identified are tyrosine, phenylalanine, acetaldehyde and niacin, a
vitamin of group B known to occur in mango in approximate quantities of 0.06-0.9 mg per
100 g of fresh weight (Wu et al., 1993). On the other hand, many signals found in this
region show no TOCSY correlations, hindering their unambiguous identification. That is
the case of several singlets, tentatively assigned to fumaric acid (6.52 or 6.61 ppm), gallic
acid (7.03 or 7.04 ppm), adenine or adenosine systems (8.27 and 8.35 ppm) and formic
acid (8.45 ppm). Additionally, the spectra of juices from different batches (which will be
shown further ahead in Figure III.7) show two broad correlated resonances at 6.89 and 7.61
ppm that suggest the presence of polyphenolic species.
Citric acid
Malic acid
Succinic acid
Shikimic acid Quinic acid
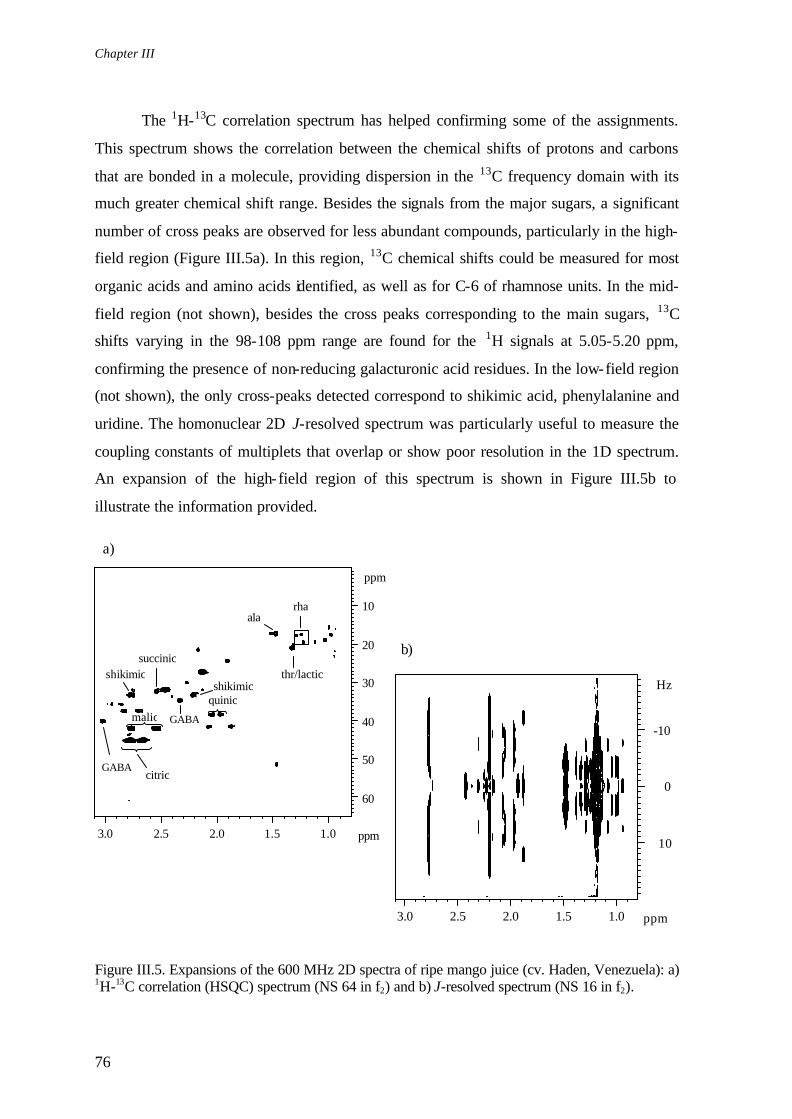
Chapter III
76
The 1H-13C correlation spectrum has helped confirming some of the assignments.
This spectrum shows the correlation between the chemical shifts of protons and carbons
that are bonded in a molecule, providing dispersion in the 13C frequency domain with its
much greater chemical shift range. Besides the signals from the major sugars, a significant
number of cross peaks are observed for less abundant compounds, particularly in the high-
field region (Figure III.5a). In this region, 13C chemical shifts could be measured for most
organic acids and amino acids identified, as well as for C-6 of rhamnose units. In the mid-
field region (not shown), besides the cross peaks corresponding to the main sugars, 13C
shifts varying in the 98-108 ppm range are found for the 1H signals at 5.05-5.20 ppm,
confirming the presence of non-reducing galacturonic acid residues. In the low-field region
(not shown), the only cross-peaks detected correspond to shikimic acid, phenylalanine and
uridine. The homonuclear 2D J-resolved spectrum was particularly useful to measure the
coupling constants of multiplets that overlap or show poor resolution in the 1D spectrum.
An expansion of the high-field region of this spectrum is shown in Figure III.5b to
illustrate the information provided.
a) b)
Figure III.5. Expansions of the 600 MHz 2D spectra of ripe mango juice (cv. Haden, Venezuela): a) 1H-13C correlation (HSQC) spectrum (NS 64 in f2) and b) J-resolved spectrum (NS 16 in f2).
GABA
malic
ppm
1.01.52.02.53.0 ppm
60
50
40
30
20
10ala
thr/lactic
rha
shikimic shikimic
quinic
GABA
citric
succinic
Hz
1.01.52.02.53.0 ppm
-10
10
0

Study of the Composition of Mango by NMR
77
Table III.1. 1H and 13C chemical shifts, 1H multiplicity and JHH for assigned compounds in mango juice; s: singlet, d: doublet, t: triplet, q: quartet, dd: doublet of doublets, m: multiplet. Most values shown have been measured in the spectra of ripe mango juice (cv. Haden, Venezuela), except those corresponding to compounds marked with (a), which have been measured in the spectra of a different juice sample (cv. Tommy Atkins, Brazil); (b) tentative identification; (c) the values in square brackets correspond to signals coupled to the 5.0-5.2 ppm signal, but the existence of coupling within them is not clear; (d) the 13C signals indicated are coupled to the 1H signals at 1.22-1.25 ppm and arise from C6H; un.: unassigned.
Compound Assignment ? 1H (ppm) Multiplicity J (Hz) ? 13C (ppm)
Acetaldehyde CH3 CH
2.24 9.68
d 3.0
Acetaldehyde hydrate
CH3, hydrate CH, hydrate
1.33 5.25
Acetate ?CH3 1.92 s Acetoin CH3
CH 1.38 4.43
d
7.0
Adenine/Adenosine (b)
C8H, ring C2H, ring
8.27 8.35
s s
Alanine ?CH3 ? CH
1.48 3.78
d
7.2
17.00 51.53
?-Aminobutyric acid (GABA)
?CH2
? CH2
?CH2
1.90 2.30 3.01
t t
7.4 7.4
24.14 34.52 40.20
? -Arabinose/ ? -Galactose (b)
C2H C3H C1H
3.80 3.90 5.30
d
3.4
?-Arabinose/ ?-Galactose/
?-Galacturonic acid/?-Fucose (b)
C1H C2H C3H
3.46, 4.55 3.52, 3.70, 4.57
3.52, 4.51
Arginine (a) ?CH2
?CH2
?CH2
1.69 1.91 3.25
m
Asparagine (a) ?CH ?’CH ? CH
2.85 2.95 4.01
dd dd
7.6;16 4.0;16
35.51
Aspartic acid (a) ?CH ?’CH ? CH
2.69 2.83 3.92
dd dd
7.6;16 3.6;16
37.29
2,3-Butanediol/ Isopropanol
CH3 CH
1.14 3.68
d 6.0
Citric acid ? , ?CH ? ’, ?’CH
2.56 2.66
d d
15.2 15.2
45.22
Ethanol CH3 CH2
1.18 3.65
t
7.1 19.20
Fatty acids (saturated)
? CH3
CH2-CH3
CH2-CH2-CH3
CH2-COOH
0.89 1.29 1.55 2.21
t 7.5

Chapter III
78
Table III.1 (cont.) Compound Assignment ? 1H (ppm) Multiplicity J (Hz) ? 13C (ppm)
Formic acid (b) HCOOH 8.45 s
Fructose (?-furanose)
C6H C5H
C3H, C4H
3.68 3.82 4.11
76.71 ? -Fucose (b) C6H
C3H/C4H C2H C5H C1H
1.20 3.66 3.76 4.22 5.21
?-Fucose (b) C6H C4H C5H
1.29 3.59 3.77
Fumaric acid (b) CH 6.52 or 6.61 s ? -Galacturonic acid
(free/pectic, reducing end) (b)
C2H C3H C4H C1H
3.88 4.00 4.31 5.32
broad
99.30 ? -Galacturonic acid
(pectic, non-reducing)/
? -Rhamnose (b), (c)
un. un. un. un. un.
5.06 ?3.98/4.09? 5.09 ?4.03/4.15/4.23? 5.12 ?4.09/4.30? 5.15 ?3.75/3.97/4.15? 5.18 ?4.00/4.12?
98.44 100.00/108.35
98.56 107.95 107.63
Gallic acid (b) C2H, C6H 7.03 or 7.04 s ? -Glucose C4H
C2H C3H
C5H, C6H C1H
3.41 3.54 3.71
3.77-3.88 5.23
d
3.6
93.42 ?-Glucose C2H
C4H C5H C3H C6H C1H
3.25 3.41 3.45 3.48
3.73, 3.90 4.65
d
8.0
76.00
97.52 Glutamic acid
? ,?’CH ?CH2
? CH
2.05 2.37 3.76
Glutamine ?CH2 ?CH2
? CH
2.13 2.35 3.76
?-Hydroxybutyric acid
?CH3
? CH
? ’CH ?CH
1.20 2.31 2.41 4.13

Study of the Composition of Mango by NMR
79
Table III.1 (cont.) Compound Assignment ? 1H (ppm) Multiplicity J (Hz) ? 13C (ppm)
Isoleucine ?CH3
?’CH3
?CH
?’CH
?CH
0.94 1.01 1.25 1.48 1.98
t d
7.3 7.0
15.40
Lactic acid ?CH3
? CH 1.32 4.10
d
7.0
20.80 69.00
Leucine ? , ?’CH3 ?CH2, ?CH
0.96 1.71
21.61, 22.89
Malic acid ?CH
?’CH
? CH
2.38 2.68 4.30
dd dd dd
7;16.5
42.07
70.31 Methanol CH3 3.36 s 49.75
Myo-inositol C5H C1H, C3H C4H, C6H
C2H
3.28 3.53 3.63 4.06
Niacin C5H C4H, C6H
C2H
8.08 8.84 9.12
s
Phenylalanine ?CH ?’CH ? CH
C3H, C5H ring C4H
C2H, C6H ring
3.12 3.28 3.97 7.33 7.38 7.43
m m m
129.93
129.74 Polyphenols (a) un.
un. 6.9 7.6
broad broad
Propionic acid ?CH3
? CH2 1.08 2.40
t 7.1
Quinic acid ? CH2/?CH2 ?CH ?CH ?CH
1.84-2.10 3.55 4.02 4.14
m dd dd dd
38.25
? -Rhamnose (free/pectic) (b), (d)
un. un. un. un.
1.22, 3.42, 3.88 1.24, 3.48, 3.58
1.25, 3.36, 3.78, 3.86, 4.03 1.29, 3.48, 3.87
16.23 17.33 19.20
?-Rhamnose (b) C6H C5H
1.31 3.40
17.45
Shikimic acid C7H C7H’ C5H C6H C4H C3H
2.19 2.77 3.70 3.98 4.40 6.44
dd dd t
m
33.15
72.10 132.30
Succinic acid ? , ?CH2 2.41 s 32.24

Chapter III
80
Table III.1 (cont.) Compound Assignment ? 1H (ppm) Multiplicity J (Hz) ? 13C (ppm)
Sucrose G4H
G2H G3H
G5H, G6H G1H F6H F5H F4H F3H
3.47 3.57 3.78 3.84 5.41 3.82 3.88 4.05 4.22
d d
3.6
8.7
93.00
75.47 Threonine ?CH3
? CH ?CH
1.32 3.61 4.26
d 5.2 20.80
Tyrosine C3H, C5H ring C2H, C6H ring
6.90 7.19
d d
8.5 8.5
Uracil C5H C6H
5.80 7.54
d d
Uridine (a) C4’H C3’H C2’H
C5H ring C1’H
C6H ring
4.11 4.21 4.38 5.88 5.89 7.85
d d
8.2
8.2
105.00 90.51
144.56 Valine ?CH3
?’CH3
?CH
0.98 1.04 2.27
d d
7.0 7.0
17.39 18.70 29.73
?-Xylose (b) C2H C3H C4H C1H
3.26 3.39 3.64 4.61
III.3.2. Compositional Differences Within and Between Cultivars
The chemical composition of mango juice is expected to be strongly dependent on
several factors such as the cultivar, cultural and climate conditions of fruit growth, ripeness
at harvest, postharvest storage conditions and processing method. The compositional
changes taking place during the ripening process are the subject of Chapter IV. The aim of
the present section is to evaluate as far as possible the compositional differences within one
same cultivar and between different cultivars. For that purpose, only the spectra of unripe
juices are compared, so that the influence of ripening and storage conditions on
composition is minimised. The similarity of ripening stages among the juices was assessed
with basis on identical firmness measurements and chemical parameters, namely the

Study of the Composition of Mango by NMR
81
amount of soluble solids (%SS) and pH, which are often used as maturity indicators. Thus,
the three juice samples compared arise from: a) cultivar Haden grown in Venezuela, 12.3
%SS and pH 3.25; b) same cultivar grown in Brazil, 12.6 %SS and pH 3.50; and c) cultivar
Tommy Atkins grown in Brazil, 13.0 %SS and pH 3.38. The differences found in the
spectra of juices a) and b) of the same cultivar and between these and the spectrum of juice
c) of a different cultivar are discussed separately in the following paragraphs.
Comparison Between Juices of the Same Mango Cultivar (Haden)
The two Haden juices compared (same cultivar, different geographical origin) show
similar proportions of the major sugars (sucrose, glucose and fructose) and organic acids
(citric, shikimic, quinic and succinic), except for malic acid which is higher in the juice
from Brazil (Figure III.6b). Regarding the composition in amino acids, there are some
differences to point out, as indicated in Figure III.6 (a and b). The juice from Brazil
(sample b) contains notably higher amounts of arginine, glutamic acid/glutamine and
aspartic acid/asparagine. The same is observed for tyrosine and phenylalanine in the low-
field region of the spectra (Figure III.7). The amount of fatty acids present also differs
between the two juices, as indicated by the higher intensity of the broad signals at 0.89,
1.29 and 1.55 ppm in the spectrum of the juice from Venezuela (Figure III.6a). In the low-
field region (Figure III.7), further differences are noted, especially in the relative
proportions of some compounds, such as uridine- and adenosine-containing compounds,
which are higher in the juice from Brazil. Moreover, two weak broad resonances at 6.89
and 7.61 ppm are noted in the spectrum of that sample (indicated with arrows in Figure
III.7b), suggesting the presence of condensed phenolic species. These signals have been
observed in the 1H NMR spectra of apple juices and their presence has been suggested to
result from exposure to air and enzymatic oxidation by polyphenoloxidase, which leads to
the formation of polymeric condensation products (Belton et al., 1997). As no particular
precautions were taken to avoid these effects during the sample preparation procedure, this
possibility must be considered. An interesting observation is that the extension of
polyphenols formation seems to depend on the ripening degree. The increasing intensity of
polyphenolic signals with ripening will be shown in Chapter IV, where the ripening
process of mango fruit is discussed. Hence, the Haden juices from Brazil and Venezuela
are found to differ mainly in the contents of some amino acids and aromatic compounds.

Chapter III
82
a) Haden Venezuela
b) Haden Brazil
c) Tommy Atkins Brazil
Figure III.6. High-field region of the 600 MHz 1H NMR spectra of mango juices from three different batches: a) cv. Haden (Venezuela); b) cv. Haden (Brazil); c) cv. Tommy Atkins (Brazil); NS 64 for all spectra.
Comparison Between Juices of Different Mango Cultivars (Haden and Tommy Atkins)
Comparing the spectra of the Haden juices discussed in the previous paragraph
(samples a and b) with the spectrum of the Tommy Atkins juice (sample c), some of the
main differences regard the relative abundances of some organic acids and amino acids.
Shikimic and succinic acids are lower in the spectrum of the Tommy Atkins juice, whereas
alanine is clearly higher (Figure III.6). On the other hand, phenylalanine is present in very
low content in this juice (Figure III.7). Further compositional differences observed in the
low-field region (Figure III.7) arise from: uridine and adenosine systems, which are not
detected in the Tommy Atkins juice; an unassigned system comprising the doublets at 7.16
and 7.87 ppm also absent in that sample; and a singlet at 7.27 ppm (unassigned) which is
much higher in Tommy Atkins than in Haden juices. On the other hand, the broad
resonances at 6.89 and 7.61 ppm, suggested to arise from polyphenols, are also detected in
the Tommy Atkins juice, similarly to the Haden juice from Brazil.
1.21.41.61.82.02.22.42.62.8 ppm
arg
shik.
ala
quinic ethanol
shik. succinic
glu/gln
asp/asn
malic
TSP
citric
fatty acids
malic

Study of the Composition of Mango by NMR
83
Hence, the results described above show that the compositional differences
between Haden and Tommy Atkins juices, which regard mainly some amino acids and
aromatic compounds, are similar in significance to those between Haden juices of distinct
geographical origins, thus demonstrating the influence of both cultivar and geographical
origin on mango composition.
a) Haden Venezuela
b) Haden Brazil
c) Tommy Atkins Brazil
Figure III.7. Low-field region of the 600 MHz 1H NMR spectra of mango juices from three different batches: a) cv. Haden (Venezuela); b) cv. Haden (Brazil); c) cv. Tommy Atkins (Brazil); NS 64 for all spectra; the arrows indicate resonances possibly arising from polyphenols; the lower S/N ratio of spectrum c is due to the larger dilution of the Tommy Atkins juice.
III.4. NMR Study of Mango Pulp Composition
III.4.1. Standard Magic Angle Spinning (MAS) NMR
Standard 1H MAS NMR spectroscopy was the first approach used to study intact
mango pulp. Figure III.8 shows the spectra of mango pulp recorded in static conditions and
by spinning the sample at 1.0 or 1.2 KHz. The static 1H NMR spectrum (Figure III.8a) is
dominated by the intense water signal at 4.7 ppm, showing also a very weak and broad
6.57.07.58.08.59.0 ppm
niacin
formic
shikimic
uridine
adenosine phe
adenosine
tyr
gallic
uridine
+ unknown
unknown

Chapter III
84
hump, situated between 3 and 4 ppm, which corresponds to the sugar resonances. The line
width at half height (? ? 1/2) of the water signal is 108 Hz, which is of the same order of
magnitude of the values of 70.9 and 75.9 Hz reported for the water line width in the 200
MHz 1H spectra of banana and grape tissues, respectively (Ni and Eads, 1993a). As
described in Chapter II.1.4, there are several effects that may contribute to the low
resolution of this spectrum, namely the anisotropic interactions typically observed in solids
due to their reduced molecular mobility, and the magnetic susceptibility differences within
the sample arising from its physical heterogeneity. The former effects (dipolar interactions
and chemical shift anisotropy) are expected to be partially averaged by the internal
molecular motion characterising the fruit pulp, which is much larger than in a rigid solid.
The susceptibility effects, typically of the order of a few tens of Hz for water, have been
shown to play an important role in the broadening of the 1H spectra of fruit tissues (Cho et
al., 1991; Ni and Eads, 1993a; Ni and Eads, 1993b). This may be explained by the
heterogeneous nature of the fruit tissues, since the different physical domains have
different bulk magnetic susceptibilities and are thus magnetised to different extents when
subjected to the strong magnetic field. The magnetised domains then produce position-
dependent magnetic field variations in the space around them, giving rise to a spread in
resonance frequencies.
Figure III.8. 400 MHz standard 1H NMR spectra of unripe (a and b) and ripe (c) mango pulp (cv. Tommy Atkins) obtained at a) 0 KHz, b) 1.0 KHz spinning rate, and c) 1.2 KHz spinning rate; *: spinning side bands; the signals indicated with arrows may reflect different water environments.
* * * * * * *
* * *
a) unripe pulp, 0 KHz
b) unripe pulp, 1.0 KHz
c) ripe pulp, 1.2 KHz

Study of the Composition of Mango by NMR
85
Spinning the same sample at the magic angle using low speeds (1.0 KHz) results in
a significant improvement of the spectral resolution (Figure III.8b), similarly to what has
been reported for other fruits (Ni and Eads, 1993a; Ni and Eads, 1993b). The bands
identified with an asterisk correspond to spinning side bands, which appear on either sides
of the isotropic chemical shift bands, spaced at an interval equal to the spinning rate. These
bands reflect the contribution of anisotropic effects, such as chemical shift anisotropy
(CSA), to line broadening. Typically, CSA line widths are in the range of a few KHz
(Belton and Gil, 1993), and the lines broadened by CSA are expected to be narrowed by
MAS rates of the same or larger magnitude. At 1 KHz spinning rate, the ? ? 1/2 of the water
signal is reduced from 108 to 48 Hz and the sugar resonances centred at 3.7 ppm show
much better resolution, compared to the broad hump observed in the static spectrum. The
signals indicated with arrows may reflect the different water environments, mostly due to
phase separation promoted by sample spinning, although an additional contribution for the
peak at 5.2 ppm may arise from sugar anomeric resonances.
Compared to the spectrum of unripe pulp, the 1H MAS spectrum of ripe pulp
obtained at similar spinning rate (1.2 KHz) shows enhanced resolution (Figure III.8c), the
? ?1/2 of the water signal being 25 Hz. This improvement is related to the softer texture of
the ripe pulp, which accounts for the higher internal molecular motion, and thus for the
partial averaging of anisotropic interactions. However, the resolution achieved in the
standard 1H MAS spectra is still not enough to enable objective assignment of the sugar
peaks to be made or efficient water suppression techniques to be employed, thus providing
limited information about the composition of mango fruit, since no peaks from non-sugar
components could be identified. In the following section, the use of a high resolution (HR-
MAS) probe to study the mango pulp in more detail is described.
III.4.2. High Resolution Magic Angle Spinning (HR-MAS) NMR
Figure III.9 shows the 1H HR-MAS spectra of ripe mango pulp, obtained in static
conditions and by spinning the sample at 1.2 KHz. Comparison with the spectra shown in
Figure III.8 demonstrates how the resolution is significantly improved by the use of a HR-
MAS probe. The nature of the probe, built so as to incorporate high resolution r.f. parts,
and the deuterium lock (by which long term stability of the magnetic field is achieved) are
responsible for this enhancement, which can be measured by taking into account the line

Chapter III
86
widths of the signals. For instance, in the standard 1H MAS spectrum of ripe pulp obtained
at 1.2 KHz (Figure III.8c), the ? ? 1/2 of the most intense sugar peak (? 3.82 ppm) is 38 Hz,
while in the 1H HR-MAS spectrum obtained at the same spinning rate (Figure III.9b) the
? ?1/2 of that signal is 6.4 Hz (about 6 times narrower).
Moreover, the efficient water suppression achieved with the HR-MAS probe
enables the detection of many signals in the whole spectrum, similarly to the juice
spectrum previously shown. Besides the major sugars, many compounds present at lower
concentrations are detected in the high-field and low-field regions of the 1H HR-MAS
spectrum, as illustrated by the inserts in Figure III.9b. It is also important to stress that the
significant resolution improvement obtained allows standard 2D high resolution
experiments to be carried out. TOCSY, 1H-13C correlation and J-resolved spectra have
been recorded and enabled the detailed pulp chemical composition to be investigated, as it
will be shown further ahead.
a) 0 KHz
b) 1.2 KHz
Figure III.9. 500 MHz HR-MAS 1H NMR spectra of ripe mango pulp (cv. Tommy Atkins): a) 0 KHz, b) 1.2 KHz. *: spinning side bands arising from the water peak.
Effect of Spinning Rate
The effect of using higher spinning rates on the spectral resolution has been
investigated by recording 1H HR-MAS spectra of ripe mango pulp at spinning rates
varying from 3.0 to 15.0 KHz, the maximum rate allowed with the probe used. A rotor
with a top spacer, conferring the sample a spherical shape and avoiding water loss during
9 8 7 6 5 4 3 2 1 ppm
1.52.02.5 ppm
*
789 ppm
*
*
1.52.02.5 ppm789 ppm

Study of the Composition of Mango by NMR
87
spinning, has been used to pack the pulp. Most signals show no significant resolution
changes with spinning rate. For instance, the values of ? ? 1/2 for the sucrose peak at 4.22
ppm are 1.96, 2.00 and 1.83 Hz at 3.0, 7.0 and 15.0 KHz, respectively (not shown). The
fact that the resolution of such signals is not improved at higher rates indicates that the
broadening factors affecting them have magnitudes smaller than 3.0 KHz (the lowest rate
used). This is consistent with sample susceptibility effects being the main broadening
mechanism, since they are expected to be of the order of only a few tens of Hz (Ni and
Eads, 1993a). On the other hand, the resolution of the signals of lipids and pectins
improves consistently with increasing spinning rates. This is illustrated in Figure III.10,
which shows the gradual resolution improvement for the signal centred at 1.28 ppm, to
which both lipids and pectic sugars (essentially rhamnose) contribute, and also for the less
intense signals at 0.89 and 1.55 ppm arising from lipids.
a) 3.0 KHz
b) 5.0 KHz
c) 7.0 KHz
d) 10.0 KHz
e) 15.0 KHz Figure III.10. High-field region of the 500 MHz HR-MAS 1H NMR spectra of ripe mango pulp (cv. Tommy Atkins), recorded at different spinning rates (NS 256); the arrows indicate the resonances of lipids and pectic sugars (the latter contributing to the largest signal only).

Chapter III
88
This result shows that these compounds are under the effect of interactions that are at least
of the order of 10-15 KHz, namely dipolar interactions. It is also worth mentioning that for
spinning rates higher than 3 KHz, the spinning side bands already have negligible intensity
and appear outside the region of interest (0-10 ppm).
An interesting observation regards the behaviour of the broad signals observed in
the aromatic region of the spectrum, tentatively assigned to polyphenolic compounds
(Figure III.11). These signals are observed at all spinning rates except at 15 KHz (Figure
III.11e), and when the spinning rate is decreased back they appear again. Obviously their
disappearance does not reflect any chemical change in the sample composition since they
a) 3.0 KHz
b) 5.0 KHz
c) 7.0 KHz
d) 10.0 KHz
e) 15.0 KHz
Figure III.11. Low-field region of the 500 MHz HR-MAS 1H NMR spectra of ripe mango pulp (cv. Tommy Atkins), recorded at different spinning rates (NS 256); the arrows indicate resonances tentatively assigned to polyphenols.
6.57.07.58.08.5 ppm

Study of the Composition of Mango by NMR
89
become visible as soon as the spinning rate is decreased. Instead, it can reflect the
interference of molecular motion with spinning rate, which results in loss of the signal
from the spectrum. This suggests that the aromatic rings of these polyphenolic compounds
may be involved in relatively slow motions of the order of 15 KHz, consistent with their
polymeric nature.
Effect of Sample Shape
The shape of the sample inside the HR-MAS rotor can be cylindrical, semi-
spherical (for rotors with one spacer) or spherical (if both bottom and top spacers are
provided). The latter rotor types improve spinning stability and reduce magnetic
susceptibility variations within the sample, thus potentially improving spectral resolution.
Moreover, it has been observed in the present study that the samples packed with spacers
generally show less extensive separation of the liquid phase upon spinning than those
packed with the cylindrical configuration.
The 1H HR-MAS spectra of ripe mango pulp obtained with the three different
sample shapes (at 5.0 KHz spinning rate) are shown in Figure III.12. The top spectrum,
corresponding to the cylindrical configuration, shows a broad hump in the water region,
which prevents the observation of signals in the 4.2-7.2 ppm range. This distortion is likely
to be related to the separation of phases seen to occur upon spinning of the cylindrical
rotor, which causes water to be present in different magnetic environments, and, hence, to
originate a broad signal difficult to suppress by selective irradiation. In what concerns the
resolution of most signals, the three spectra are similar. The alanine signal at 1.48 ppm, for
instance, shows ? ? 1/2 of 2.6, 2.3 and 2.5 Hz in the spectra corresponding to cylindrical,
semi-spherical and spherical sample shapes, respectively. On the other hand, the ? ? 1/2 of
the signal at 1.28 ppm, attributed to lipids and pectic sugars, decreases from 45.4 Hz in the
cylindrical shape, to 43.0 Hz in the semi-spherical shape and to 38.2 Hz in the spherical
shape, reflecting a slight resolution increase. This suggests that, at the spinning rate used
(5.0 KHz) residual magnetic susceptibility anisotropy contributes to the resolution of the
signals from these large molecules.

Chapter III
90
a) cylindrical shape
b) semi-spherical shape
c) spherical shape
Figure III.12. 500 MHz HR-MAS 1H NMR spectra of ripe mango pulp (cv. Tommy Atkins), packed into different rotors: a) cylindrical shape, b) semi-spherical shape, and c) spherical shape; SR 5.0 KHz, NS 256.
III.4.3. Compositional Differences Between Pulp and Juice
The high resolution achieved in the 1H HR-MAS spectra of intact mango pulp
enables the detailed study of its composition and comparison with the juice composition,
presented in section III.3. The following discussion highlights the spectral differences
between a mango pulp and the corresponding juice, reflecting the compositional
differences found between the whole fruit and the extracted liquid phase.
Figures III.13 to III.15 show different spectral regions of the 1H spectra of pulp and
juice, collected from an unripe mango (cv. Haden). As expected, the juice spectrum
contains sharper lines and an overall better resolution than the pulp spectrum. For example,
the alanine peak at 1.48 ppm shows ? ? 1/2 of 2.3 Hz in the pulp spectrum and half of this
value in the juice spectrum. The rapid isotropic motions of the molecules in the liquid
state, averaging out the anisotropic interactions that are responsible for line broadening,
account for the better resolution of the juice spectrum. In addition, the higher field strength
(B0) used for recording that spectrum may also contribute to the resolution difference
observed, since the dispersion of NMR chemical shifts is linearly related to B0. On the
9 8 7 6 5 4 3 2 1 ppm
789 ppm 1.52.02.5 ppm

Study of the Composition of Mango by NMR
91
other hand, some signals are only seen in the spectrum of pulp and not in the
corresponding juice. This is the case of the relatively broad resonances at 0.89, 1.29 and
1.55 ppm which arise from saturated fatty acids. It must be noted, however, that these
signals do appear in some juice samples, particularly in those collected from ripe mangoes,
like the one presented in section III.3. In addition, the signals of rhamnose pectic units
(overlapping in the 1.2-1.3 ppm region) are more intense in the pulp spectrum than in the
corresponding juice. Besides these differences, the TOCSY spectrum of the pulp shows a
spin system that is not present in the juice. This system, shown by the dashed lines in
Figure III.13c, comprises the resonances at 1.31, 2.02 and 5.31 ppm and possibly arises
from unsaturated fatty acids. It is interesting to note that this set of peaks has not been
identified in any juice spectrum, not even in the ripe stage, thus showing that these lipids
are preferably located in the solid phase of the fruit throughout all ripening stages.
a) Pulp c) Pulp (TOCSY)
b) Juice
Figure III.13. High-field region of the 1H NMR spectra of mango pulp (a and c) and of mango juice (b), collected from an unripe fruit (cv. Haden, Venezuela); the spin system tentatively assigned to unsaturated fatty acids (u.f.a.) is identified in the TOCSY spectrum by the dashed lines. Pulp: 400 MHz, NS 180 for 1D and NS 24 in f2 for TOCSY; Juice: 600 MHz, NS 64.
Further differences between pulp and juice are found in the sugar anomeric region
of the spectra (Figure III.14). The pulp spectrum shows a signal at 5.31 ppm arising from
the olefinic protons of unsaturated fatty acids, which is absent in the juice, as previously
noted. Moreover, the signals in the 5.05-5.20 ppm range, arising mainly from non-reducing
galacturonic acid units of pectic chains, are much more intense in the pulp spectrum,
indicating that only a small amount of pectic material is present in the unripe juice. In
addition, the TOCSY spectrum of the pulp presents one system comprising the signals at
ppm
0.81.01.21.41.61.82.02.22.4 ppm
1
2
3
4
5
6
0.80.91.01.11.21.31.41.51.61.7 ppm
f.a.
f.a. + pectic rhamnose
f.a.

Chapter III
92
3.84, 3.95, 4.10, 4.30 and 5.12 ppm (not shown), which may arise from methyl-esterified
non-reducing galacturonic acid residues and is not detected in the TOCSY of the juice.
a) Pulp
b) Juice
Figure III.14. Mid-field region of the 1H NMR spectra of a) mango pulp and b) mango juice, collected from an unripe fruit (cv. Haden, Venezuela); Pulp: 400 MHz, NS 180; Juice: 600 MHz, NS 64.
Finally, in the low-field region, besides the shifts of some signals reflecting the
different pH of the samples, there are a few differences between the pulp and juice spectra
(Figure III.15). The most significant are the much higher intensity of the unassigned singlet
at 7.26 ppm in the pulp spectrum and of the singlet at 8.45 ppm (probably arising from
formic acid) in the juice spectrum.
a) Pulp
b) Juice Figure III.15. Low-field region of the 1H NMR spectra of a) mango pulp and b) mango juice, collected from an unripe fruit (cv. Haden, Venezuela); the arrows indicate shifts due to pH differences; Pulp: 400 MHz, NS 180; Juice: 600 MHz, NS 64.
4.44.54.64.74.84.95.05.15.25.35.4 ppm
pectic galacturonic acid
pectic galacturonic acid
u.f.a.
6.57.07.58.08.59.0 ppm
formic
unknown

Study of the Composition of Mango by NMR
93
III.5. Conclusions
High resolution 1H NMR spectroscopy of mango juice has enabled the
identification of just under 50 components, including the 3 main sugars (glucose, fructose,
sucrose), 12 organic acids (among which are quinic and shikimic acids, reported for the
first time to be present in mango juice), 13 amino acids (including ala, val, leu, arg, tyr,
phe), the aliphatic alcohols methanol, ethanol and isopropanol/2,3-butanediol, the cyclic
polyalcohol myo-inositol, the vitamin niacin and several other compounds. Resonances of
lipid-type components, possibly saturated fatty acids, pectic constituents (rhamnose and
galacturonic acid) and polyphenols have also been detected. The spectral assignment was
carried out with basis on 1D and 2D NMR spectra (TOCSY, 1H-13C correlation and J-
resolved) and, besides the compounds identified, about 15 more spin systems have been
detected and remain unassigned, requiring further investigation. The main difficulties
found in spectral assignment were the low intensity of some signals arising from minor
components (particularly noticed in the aromatic region of the spectrum), the high degree
of spectral overlap hindering, for instance, the complete assignment of less abundant
sugars in the sugar region, and the ambiguity associated with the assignment of singlets
and incomplete spin systems. Still, NMR provided a fairly good survey of mango juice
components by direct analysis of the juice, requiring minimum sample preparation and
without the need of using extraction or separation procedures. The juices of different
cultivars (Haden and Tommy Atkins) and geographical origins (Venezuela and Brazil)
have been found to differ mainly in the relative abundance of some amino acids, organic
acids and aromatic compounds (namely polyphenols).
Solid state NMR techniques have enabled the direct and non- invasive study of
intact mango pulp. With a standard probe and MAS at low speeds (~1 KHz) the 1H
spectrum of the fruit tissue showed enhanced resolution compared to the spectrum
recorded in static conditions, enabling detection of the major sugars, but not of other
components present in lower amounts. By using a HR-MAS probe, a much more marked
resolution improvement has been obtained, the 1H HR-MAS spectrum showing signals six
fold narrower than the standard 1H MAS spectrum. Under such conditions, efficient water
suppression could be achieved, enabling the detection of many signals in the whole
spectral range. In addition, the spectral resolution achieved enabled 2D NMR spectra to be
recorded in order to aid spectral assignment. Interestingly, compositional differences were

Chapter III
94
found between the intact pulp and the corresponding juice, showing that the composition of
the liquid phase is not necessarily fully representative of the composition of the whole
fruit. In particular, the pulp showed the presence of fatty acids (both saturated and
unsaturated) not detected in the juice and a higher abundance of pectic material.
References
Alberti, E.; Belton, P.S.; Gil, A.M. Applications of NMR to Food Science. Annual Reports of NMR Spectroscopy 2002, 47, 110-148. Alberti, E.; Humpfer, E.; Spraul, M.; Gilbert, S.; Tatham, A.S.; Shewry, P.R.; Gil, A.M. A high resolution 1H magic angle spinning NMR study of high-Mr subunit of wheat glutenin. Biopolymers 2001, 58, 33-45. Aue, W.P.; Karhan, J.; Ernst, R.R.J. Homonuclear broad band decoupling and two-dimensional J-resolved NMR spectroscopy. Journal of Chemical Physics 1976, 64, 4226-4227. Bax, A. A spatially selective composite 90-degrees radiofrequency pulse. Journal of Magnetic Resonance 1985, 65, 142-145. Bax, A.; Davis, D.G. MLEV-17 based two-dimensional homonuclear magnetization transfer spectroscopy. Journal of Magnetic Resonanace 1985, 65, 355-360. Belton, P.S.; Delgadillo, I.; Holmes, E.; Nicholls, A.; Nicholson, J.K.; Spraul, M. Use of high-field 1H NMR spectroscopy for the analysis of liquid foods. Journal of Agricultural and Food Chemistry 1996, 44, 1483-1487. Belton, P.S.; Delgadillo, I.; Gil, A.M.; Casuscelli, F.; Colquhoun, I.J.; Dennis, M.J.; Spraul, M. High field proton NMR studies of apple juices. Magnetic Resonance in Chemistry 1997, 35, S52-S60. Belton, P.S.; Delgadillo, I.; Gil, A.M. High-field solution state proton NMR for food analysis. Seminars in Food Analysis 1998a, 3, 223-234. Belton, P.S.; Colquhoun, I.J.; Kemsley, E.K.; Delgadillo, I.; Roma, P.; Dennis, M.J.; Sharman, M.; Holmes, E.; Nicholson, J.K.; Spraul, M. Application of chemometrics to the 1H NMR spectra of apple juices: discrimination between apple varieties. Food Chemistry 1998b, 61, 207-213. Bock, K.; Thøgersen, H. Nuclear magnetic resonance spectroscopy in the study of mono- and oligosaccharides. Annual Reports on NMR Spectroscopy 1982, 13, 1-57.

Study of the Composition of Mango by NMR
95
Cho, S.I.; Bellon, V.; Eads, T.M.; Stroshine, R.L.; Krutz, G.W. Sugar content measurement in fruit tissue using water peak suppression in high resolution 1H magnetic resonance. Journal of Food Science 1991, 56, 1091-1094. Colquhoun, I.J.; de Ruiter, G.A.; Schols, A.; Voragen, G.J. Identification by NMR spectroscopy of oligosaccharides obtained by treatment of the hairy regions of apple pectin with rhamnogalacturonase. Carbohydrate Research 1990, 206, 131-144. Eads, T.M.; Bryant, R.G. High resolution proton NMR spectroscopy of milk, orange juice, and apple juice with efficient suppression of the water peak. Journal of Agricultural and Food Chemistry 1986, 34, 834-837. Fan, T.W.-M. Metabolite profiling by one- and two-dimensional NMR analysis of complex mixtures. Progress in Nuclear Magnetic Resonance Spectroscopy 1996, 28, 161-219. Gil, A.M., Alberti, E.; Tatham, A.S.; Belton, P.S.; Humpfer, E.; Spraul, M. Magic angle spinning NMR study of the hydration of the wheat seed storage protein omega-gliadins. Magnetic Resonance in Chemistry 1997, 35, S101-S111. Gil, A.M.; Duarte, I.F.; Delgadillo, I.; Colquhoun, I.J.; Casuscelli, J.; Humpfer, E.; Spraul, M. Study of the compositional changes of mango during ripening by use of nuclear magnetic resonance spectroscopy. Journal of Agricultural and Food Chemistry 2000, 48, 1524-1536. Le Gall, G., Puaud, M., Colquhoun, I.J. Discrimination between orange juice and pulp wash by 1H nuclear magnetic resonance spectroscopy: Identification of marker compounds. Journal of Agricultural and Food Chemistry 2001, 49, 580-588. Lizada, C. Mango. In Biochemistry of Fruit Ripening; Seymour, G.B., Taylor, J.E., Tucker, G.A., Eds.; Chapman & Hall: London, 1993; 255-271. Neiss, T.G.; Cheng, H.N.; Daas, P.J.H.; Schols, H.A. Compositional heterogeneity in pectic polysaccharides: NMR studies and statistical analysis. Macromolecules Symposium 1999, 140, 165-178. Ni, Q.W.; Eads, T.M. Low-speed magic-angle-spinning carbon-13 NMR of fruit tissue. Journal of Agricultural and Food Chemistry 1992, 40, 1507-1513. Ni, Q.W.; Eads, T.M. Liquid-phase composition of intact fruit tissue measured by high resolution proton NMR. Journal of Agricultural and Food Chemistry 1993a, 41, 1026-1034. Ni, Q.X.; Eads, T.M. Analysis by proton NMR of changes in liquid-phase and solid-phase components during ripening of banana. Journal of Agricultural and Food Chemistry 1993b, 41, 1035-1040.

Chapter III
96
Nicholson, J.K.; Foxall, P.J.D.; Spraul, M.; Farrant, R.D.; Lindon, J.C. 750 MHz 1H and 1H-13C NMR spectroscopy of human blood plasma. Analytical Chemistry 1995, 67, 793-811. Palmer, A. G.; Cavanagh, J.; Wright, P. E.; Rance, M. Sensitivity improvement in proton detected heteronuclear correlation experiments. Journal of Magnetic Resonance 1991, 93, 151-170. Sacco, A.; Bolsi, I.N.; Massini, R.; Spraul, M.; Humpfer, E.; Ghelli, S. Preliminary investigation on the characterization of durum wheat flours coming from some areas of south Italy by means of 1H high resolution magic angle spinning nuclear magnetic resonance. Journal of Agricultural and Food Chemistry 1998, 46, 4242-4249. Schleucher, J.; Schwendinger, M.; Sattler, M.; Schmidt, P.; Schedletzky, O. A general enhancement scheme in heteronuclear multidimensional NMR employing pulsed field gradients. Journal of Biomolecular NMR 1994, 4, 301-306. Schols, H.A.; Voragen, A.G.J.; Colquhoun, I.J. Isolation and characterization of rhamnogalacturonan oligomers, liberated during degradation of pectic hairy regions of rhamnogalacturonase. Carbohydrate Research 1994, 256, 97-111. Tjan, S.B.; Voragen, A.G.J.; Pilnik, W. Analysis of some partly and fully esterified oligogalactopyranuronic acids by p.m.r. spectrometry at 220 MHz. Carbohydrate Research 1974, 34, 15-23. Tucker, G.A. Introduction. In Biochemistry of Fruit Ripening; Seymour, G.B., Taylor, J.E., Tucker, G.A., Eds.; Chapman & Hall: London, 1993; 1-51. Vogels, J.T.W.E.; Terwel, L.; Tas, A.C.; van den Berg, F.; Dukel, F.; van der Greef, J. Detection of adulteration in orange juices by a new screening method using proton NMR spectroscopy in combination with pattern recognition techniques. Journal of Agricultural and Food Chemistry 1996, 44, 175-180. Wu, J.S.; Chen, H.; Fang, T. Mango juice. In Fruit Juice Processing Technology; Nagy, S., Chen, C.S., Shaw, P.E. Eds.; Agscience: Auburnadale, 1993; 620-655.

IV. STUDY OF THE RIPENING PROCESS OF MANGO: PHYSICAL AND
BIOCHEMICAL CHANGES
IV.1. Introduction………………………………………………………………………...
IV.2. Materials and Methods……………………………………………………………..
IV.2.1. Sample Preparation…………………………………………………………..
IV.2.2. Texture, pH, Soluble Solids and Enzymatic Determinations………………..
IV.2.3. NMR Measurements…………………………………………………………
IV.3. Compositional Changes of Mango During Ripening………………………………
IV.3.1. Changes in Texture, pH and Soluble Solids…………………………………
IV.3.2. Changes Assessed by NMR………………………………………………….
IV.3.2.1. Qualitative Changes in the Composition of Juices…………………….
IV.3.2.2. Quantitative Analysis of Juices and Pulps……………………………..
IV.4. Preliminary Study of the Effect of Refrigeration on Mango Ripening….…………
IV.4.1. Changes in Texture, pH and Soluble Solids…………………………………
IV.4.2. Changes Assessed by NMR………………………………………………….
IV.5. Conclusions………………………………………………………………………...
References………………………………………………………………………………..
98
100
100
101
102
102
102
104
104
108
115
115
117
119
120

Chapter IV
98
IV.1. Introduction
Trade in mango has been limited by the highly perishable nature of this fruit.
Ripening cannot be delayed sufficiently to allow for long-distance transport without
considerable quality decay. The fruit are also highly susceptible to disease, extremes of
temperature and physical injury. Most of the postharvest technologies are designed for
disease control and protection against injury during packaging and transport. Technologies
for longer-term storage, such as controlled or modified atmospheres, which have been used
commercially for temperate fruits, have not been applied successfully to the mango. To
improve this situation, a deeper and more detailed knowledge of the biochemistry of
ripening is required. This knowledge is also extremely relevant for the processing industry,
since the quality of the processed product strongly depends on the quality of the raw
materials, defined by a wide range of factors, including the fruit organoleptic properties,
nutritional value and safety (e.g. absence of microbial contamination). Therefore, for
producing high quality fruit products, it is of utmost importance to monitor the fresh fruit
composition and its changes upon ripening and storage, in order to choose the best raw
materials for each processing purpose.
Typically, the changes in mango fruit composition during ripening have been
followed through physicochemical measurements of firmness, colour, pH, acidity, total
solids content, total and reducing sugars (Morga et al., 1979; Krishnamurthy and Joshi,
1989) and through the determination of some individual components by chromatography,
such as sugars and organic acids (Medlicott and Thompson, 1985; Medlicott et al., 1986;
Selvaraj et al., 1989). In recent years, research has also focused on the development of
rapid and non- invasive techniques for monitoring the quality and ripening stage of mango
and other fruits. Some studies have established useful relationships between the
physicochemical parameters of mango fruit (at different degrees of ripeness) and non-
invasive measurements based on X-ray absorption (Barcelon et al., 1999), ultrasonic
properties (Mizrach et al., 1997; Mizrach et al., 1999) and near infrared (NIR)
spectroscopy (Guthrie and Walsh, 1997). Infrared spectroscopy has also been used to
determine individual sugar contents in ripening bananas (Tarkosova and Copikova, 2000),
evaluate the effects of cold storage on the lipid composition of apples and pears
(Bertoluzza et al., 1994) and follow the changes in the degree of esterification of peach
pectins during cold and normal storage (Chatjigakis et al., 1998). Magnetic resonance

Study of the Ripening Process of Mango: Physical and Biochemical Changes
99
techniques have also been increasingly used for monitoring ripening and measuring fruit
quality attributes. Magnetic resonance imaging has been applied to detect heat treatment
injury of mango fruit (Joyce et al., 1993) and has been shown to provide useful
information on the changes of the internal structure of several other intact fruits during
storage and ripening (Ishida et al., 1994; Clark and MacFall, 1996; Goodman et al., 1996;
Clark et al., 1998). On the other hand, several interesting applications have been reported
for low resolution NMR spectroscopy, such as the determination of the sugar content in
pears, cherries and grapes (Bellon et al., 1992) and in fresh prunes (Zion et al., 1995), the
sensing of the maturity of avocados (Chen et al., 1996), and the measurement of self-
diffusion coefficient of water in several fruit juices and apple tissue, which could be related
to titratable acidity, insoluble solids and Brix value (Keener et al., 1997). High resolution
NMR spectroscopy has been used to characterise the composition of some fruit juices
(Vogels et al., 1996; Belton et al., 1996; Belton et al., 1997; Belton et al., 1998; Le Gall et
al., 2001) and intact tissues (Ni and Eads, 1992; Ni and Eads, 1993a; Ni and Eads, 1993b),
but few studies have reported on the compositional changes occurring during ripening. Ni
and Eads (1993b) described the evolution of solid- like components in ripening bananas and
detected changes in sugars, lipids and organic acids by 1H MAS NMR, which also allowed
quantification of glucose, fructose and sucrose. However, this study was limited by the
relatively low resolution permitted at the time, and since then, major instrumental
developments have significantly increased the potential of high resolution NMR
techniques.
The use of high resolution NMR spectroscopy for acquiring a deeper knowledge
about the biochemistry of mango ripening is explored in this thesis. The present Chapter
describes the systematic study of changes in mango physicochemical parameters (firmness,
pH and soluble solids content) and NMR spectral profiles during storage. The high
resolution 1H spectra of juices are inspected for qualitative variations and, additionally,
some components, namely sugars, organic acids and amino acids, are quantified by
integration of the corresponding NMR signals. The intact fruit pulps are analysed by HR-
MAS 1H NMR spectroscopy and a semi-quantitative approach is used to compare the
variation of some compounds in pulps with those detected in juices. Moreover, a
preliminary study of the effect of refrigeration on mango fruit ripening, assessed by
variations in physicochemical properties and in 1H NMR spectra of juices, is presented.

Chapter IV
100
IV.2. Materials and Methods
IV.2.1. Sample Preparation
Three batches of mango fruits were used for ripening studies: 1) cultivar Tommy
Atkins grown in Brazil, 2) cultivar Haden grown in Venezuela, and 3) cultivar Haden
grown in Brazil, as these were the fruits commercially available and for which a reliable
source was known. All fruits were directly air- freighted to Portugal and obtained from a
commercial source, 3-4 days after harvest. Each batch comprised mature green fruits,
selected for uniformity of size and colour, and free from apparent infection.
For the detailed study of the ripening process, the Tommy Atkins mangoes grown
in Brazil (batch 1) were used. These fruits were ripened at 22?1ºC in natural light during
23 days. On day 1, they were characterised by high firmness, green/red peel and light
yellow pulp; on day 5, by slightly softer texture, some yellow spots on the peel and yellow
pulp; on day 9, by soft texture, yellow/red peel and intensely yellow pulp; from day 11
onwards, by all the latter properties, which gradually increased in intensity. At intervals of
two days, three fruits were randomly selected for analysis and their firmness was measured
as described in section IV.2.2. For obtaining the juice samples, the pulps of the selected
fruits were macerated separately in a domestic juice extractor, centrifuged during 15
minutes at 15000 r.p.m. and filtered through a glass microfiber filter, under vacuum.
Samples of average composition (i.e. more representative of each ripening stage) were also
prepared by mixing equal portions of the three pulps collected at each ripening day. In
order to prevent microbial growth, sodium azide (NaN3) was added, so that each sample
contained an azide concentration of 0.05%. The samples were frozen in liquid nitrogen and
stored at -20 ºC, until NMR analysis. After thawing, these juices were diluted two times, in
order to reduce the excessive viscosity, and their pH was adjusted, in order to decrease
shifts in the position of signals that are sensitive to pH. This adjustment was performed by
adding a fixed volume of sodium phosphate buffer, containing D2O and sodium 3-
(trimethylsilyl)propionate (TSP), and resulted in making the pH values (initially varying
between 3.20 to 5.30) fall in the narrower range of 5.60-6.20. The juice samples prepared
in this way contained 7.5% D2O, used as internal lock, and 0.015% TSP, used as chemical
shift and intensity reference. Pulp samples were collected from the equatorial ring of the
fruit, frozen in liquid nitrogen and stored at –20ºC. For the NMR measurements, the

Study of the Ripening Process of Mango: Physical and Biochemical Changes
101
thawed pulps were packed into 4 mm MAS rotors and a solution of D2O containing TSP
was added.
Batches 2 and 3 of mango fruits were used to investigate the effect of refrigeration
on ripening, taking into account the possible variations arising from their different
geographical origins, already discussed in Chapter III.3.2. The Haden fruits grown in
Venezuela (batch 2) were obtained in the mature green stage and left to ripen at 22?1ºC for
19 days, during which the texture became progressively softer, and the colour of the peel
developed from green to yellow-orange with some red and brown spots. At intervals of two
days, three fruits were randomly selected from the batch and their firmness measured.
Juice samples were obtained by centrifugation and filtration of the macerated pulps, as
described for batch 1, and pulp samples were collected from the equatorial ring of each
fruit. Juices and pulps were frozen in liquid nitrogen and stored at -20ºC. For the NMR
analysis, the thawed juices were prepared to contain 10% D2O, 0.02% TSP and 0.05%
NaN3, and their pH was adjusted by addition of microlitre amounts of NaOH (0.1 M and
1M) and HCl (0.1 M and 1M) solutions. The pH values of all juice samples then fell in the
range 6.95-7.05. The third batch, comprising mature green Haden mangoes grown in
Brazil, was stored at 7ºC during 23 days. Compared to the fruits of batch 2, these fruits
maintained a higher rigidity and the degreening of the peel was slower. Juice and pulp
samples were prepared using the same procedures as for batch 2.
IV.2.2. Texture, pH, Soluble Solids and Enzymatic Determinations
The changes in texture, pH and soluble solids (%SS) were systematically followed
during storage of the three batches of fruits. Firmness measurements were performed on
three fruits at each ripening stage using a Texture Analyser TA-Hdi for Tommy Atkins
fruits (batch 1) and a universal penetrometer for Haden fruits (batches 2 and 3). The
texturometer measured the compression force applied to the unpeeled fruit during 15
seconds. Taking into account the texture differences within the same fruit, this value was
recorded in 12 points along the equatorial ring of each fruit and an average value of force
(g) was calculated. In the case of the measurements with the penetrometer, a compression
force was applied to the unpeeled fruit during 1 minute, using a conical steel needle and a
100 g force gauge, and the depth of penetration (mm) was recorded. Twelve values of
firmness were measured along the equatorial ring of each fruit and an average value

Chapter IV
102
calculated. The pH was measured using a Hanna pH meter (precision ?0.01) and the %SS
was measured by refractometry, using an Atago hand refractometer (accuracy ?0.2%).
Glucose and fructose were quantified enzymatically for a selected set of samples, using the
enzymatic tests purchased from Boehringer Mannheim (cat. no. 139106).
IV.2.3. NMR Measurements
The acquisition parameters of the NMR experiments recorded for mango juices and
pulps are described in Chapter III.2.2. Regarding spectral processing, additional baseline
correction was carried out to improve integration of some signals.
IV.3. Compositional Changes of Mango During Ripening
This section is concerned with the changes occurring during ripening of mangoes of
the cultivar Tommy Atkins. The ripening process of the cultivar Haden and the effect of
refrigerated storage on these fruits composition is discussed in section IV.4.
IV.3.1. Changes in Texture, pH and Soluble Solids
The variation in firmness during ripening of Tommy Atkins mangoes is illustrated
in Figure IV.1a. As expected, there is a progressive softening of the fruits, shown by the
decrease of the pulp rupture force, which is more pronounced until day 13, the stage when
the fruit attained edible quality. The values obtained for each of the three mango fruits at
the same ripening stage (represented in the graph by open symbols) give an indication of
the firmness variability within fruits, which, in general, is lower than the overall changes
induced by ripening. These results agree with others reported in the literature for this
mango cultivar (Medlicott et al., 1986; Mizrach et al., 1997) and confirm the known fact
that tissue firmness is closely related to the stage of maturity of mango fruit.
The variations in pH and soluble solids (%SS) during ripening are shown in Figures
IV.1b and IV.1c, respectively, and follow the expected trends for most other climateric
fruits: acidity decreases and soluble solids (reflecting sugar content) increase. The pH
values do not vary much in the first 5 days of ripening (3.25-3.45) and then register a
significant increase until day 13, reaching a value of 5.0. After day 13, minimal variations
are noted. Similar pH values have been reported for this and other mango cultivars

Study of the Ripening Process of Mango: Physical and Biochemical Changes
103
(Medlicott and Thompson, 1985; Medlicott et al., 1986). The %SS increases just under
two-fold until day 9, after which small variations occur, although a slight decreasing trend
may be noted. This trend, which has been reported in other studies (Medlicott and
Thompson, 1985), may reflect a sugar content decrease during the last stages of ripening.
Sugar is constantly being metabolised and initially this would be replenished by starch
hydrolysis. At the late stages of ripening, intensification of respiration and starch depletion
may cause a net loss in sugar content. On the other hand, the decrease in the acids content,
also included in the soluble solids measured, may also contribute to this trend.
a)
b) c)
Figure IV.1. Variations in physicochemical properties of mango fruit (cv. Tommy Atkins) during ripening: a) firmness, b) pH and c) soluble solids (% SS). The open symbols correspond to the 3 individual fruits analysed each day, while the asterisk represents average values.
0.0
200.0
400.0
600.0
800.0
1000.0
1200.0
1400.0
1 3 5 7 9 11 13 15 17 19 21 23
Storage Time (days)
Forc
e (g
)
2.00
3.00
4.00
5.00
6.00
1 3 5 7 9 11 13 15 17 19 21 23
Storage Time (days)
pH
4.00
6.00
8.00
10.00
12.00
14.00
16.00
18.00
20.00
1 3 5 7 9 11 13 15 17 19 21 23
Storage Time (days)
% S
S

Chapter IV
104
IV.3.2. Changes Assessed by NMR
IV.3.2.1. Qualitative Changes in the Composition of Juices
Figures IV.2 to IV.4 show different regions of the 1H spectra of Tommy Atkins
juices, collected on days 1, 7, 13 and 19 of the storage period. It is recalled that each of
these juices was obtained from the mixed pulps of three fruits at the same ripening stage
and hence represents an average composition.
a) day 1
b) day 7
c) day 13
d) day 19
Figure IV.2. High-field region of the 600 MHz 1H NMR spectra of Tommy Atkins juices at different ripening stages; NS 64.
1.01.21.41.61.82.02.22.42.62.83.0 ppm
arg
TSP
rha fuc
citric TSP
val leu ile
glu/gln glu/gln
GABA
GABA
shikimic
quinic malic
ala

Study of the Ripening Process of Mango: Physical and Biochemical Changes
105
The high-field region (Figure IV.2) shows clear variations in the organic acids and
amino acids profile. As expected, citric acid decreases drastically during ripening,
presumably due to its utilization as a respiratory substrate (Lizada, 1993). This decrease is
especially marked after day 7, and in ripe juices (illustrated in Figure IV.2 by the two
bottom spectra) citric acid is present in small amounts, showing relatively weak and broad
signals. The lower resolution of these signals suggests hindered mobility of residual citric
acid in ripe juice, which may be due to some kind of interaction with other components, for
instance through the formation of complexes. Quinic, shikimic, malic and succinic acids,
the other major organic acids identified in mango juice, are present throughout all ripening
stages and show smaller variations, some of which are quantified in section IV.3.2.2. In
what regards the amino acids profile, the most drastic change is the decrease of arginine,
which is detected until day 9 only (spectrum not shown). On the contrary, valine, leucine,
isoleucine, alanine, glutamic acid/glutamine and ?-aminobutyric acid (GABA) are seen to
increase, as shown by the quantitative results presented in section IV.3.2.2 for some of
them. Moreover, in the 1.20-1.30 ppm region, the signals arising from the deoxy-sugars
fucose and rhamnose (both free and pectic) become more noticeable in the spectra of ripe
juices.
The spectral variations in the sugar region are shown in Figure IV.3. In what
concerns the major sugars, it is obvious that different proportions characterise different
ripening stages. This difference is easily assessed by comparing the relative intensities of
non-overlapped signals. The sucrose peaks at 4.22 and 5.41 ppm show a significant
increase relatively to glucose and fructose signals. The peaks at 3.25 and 4.64 ppm arising
from ? -glucose and the 5.23 ppm peak arising from ? -glucose clearly decrease during
ripening, especially during the first 9 days, and, compared to sucrose and fructose, remain
quite low in the juices of ripe fruits. Fructose signals show smaller variations in intensity
compared to the other sugars. These variations are more clearly shown and further
discussed in section IV.3.2.2, where quantification results obtained for the three sugars are
presented. Moreover, the inserts in Figure IV.3 show the increasing intensity of non-
reducing galacturonic acid signals (5.05-5.20 ppm) during ripening. Along with the
increase noted for the rhamnose signals in the high-field region, this observation suggests
an increase in the amount of pectic oligosaccharides detected in the juice. Indeed, most

Chapter IV
106
studies reported in the literature state that mango ripening is accompanied by pectin
hydrolysis (Tucker and Seymour, 1991; Lizada, 1993; Muda et al., 1995), thus giving rise
to smaller oligomers with higher water-solubility, which may be found in the juice
extracted from the fruit.
a) day 1
b) day 7
c) day 13
d) day 19
Figure IV.3. Mid-field region of the 600 MHz 1H NMR spectra of Tommy Atkins juices at different ripening stages; NS 64.
3.43.63.84.04.24.44.64.85.05.25.4 ppm
5.15.25.3 ppm
5.15.25.3 ppm
suc
n.r. galA (pectin)
MeOH
? -glc ? -glc
? -glc
fru
suc

Study of the Ripening Process of Mango: Physical and Biochemical Changes
107
Figure IV.4 illustrates the changes in the low-field region of the juice spectra. The
signals arising from the aromatic protons of phenylalanine and tyrosine are detected only at
the early stages of ripening and disappear after days 5 and 7, respectively. In the same
period, more precisely from day 5 to day 7, two broad resonances appear at 6.89 and 7.61
ppm (Figure IV.4b), suggesting the formation of condensed phenolic species. The
concomitance of these changes suggests that tyrosine and phenylalanine may act as
precursors in the polymerisation process of phenolic compounds. In addition, uridine and
adenosine systems are seen to increase in the late stages of ripening. Other spectral
changes in this region regard unassigned signals (indicated with arrows in Figure IV.4),
such as those at 5.82, 6.13 and 7.05 ppm, which increase during ripening and the singlet at
7.26 ppm, which decreases at the latter stages.
a) day 1
b) day 7
c) day 13
d) day 19
Figure IV.4. Low-field region of the 600 MHz 1H NMR spectra of Tommy Atkins juices at different ripening stages; NS 64.
phe tyr
polyphenols
6.57.07.58.08.59.0 ppm
uridine
adenosine adenosine uridine

Chapter IV
108
IV.3.2.2. Quantitative Analysis of Juices and Pulps
The variation of some juice components during ripening has been quantified with
basis on signal integration. The TSP signal at 0.0 ppm, arising from 9 protons (3 x CH3),
was used as the intensity reference. The values of this signal area, measured for the
different juice spectra, presented a small enough coefficient of variation (5.4%), reflecting
the constant concentration of TSP added to the samples. The unknown concentration of a
compound Y present in the juices could therefore be calculated according to the equation:
CY = F (AY MY / nY) (CTSP nTSP / MTSP ATSP ), where C is the concentration, F is the dilution
factor of the juice sample, A is the area of the signal integrated, M is the molecular mass
and n is the number of protons contributing to the signal integrated.
The three main sugars were quantified by integrating the signals that are free from
significant overlapping. For sucrose, the areas under the peaks at 4.22 ppm (H3, fructose
ring) and at 5.41 ppm (H1, glucose ring) were measured. Both signals arise from one
proton and, as expected, their integrals are quite similar. In the case of glucose, the
contributions from ? - and ? -glucopyranose anomers must be considered. The furanose
forms are known to be negligible in aqueous solution at 31ºC (Angyal, 1984). For
quantifying ? -glucose, the doublet at 5.23 ppm was integrated, while for ? -glucose the
areas under the signals at 3.24 ppm (H2) and at 4.64 ppm (H1) were measured. For the
glucose signal at 4.64 ppm, additional baseline correction was carried out over the
integrated region, in order to correct for the baseline offset caused by the proximity of the
suppressed water signal. For fructose, the only peak relatively free of overlap is the 4.11
ppm peak arising from H3 and H4 of the ? -furanose form. This is, however, a poor
indication of the total spectral contribution of fructose since the ? -pyranose form is
expected to occur in higher abundance, in aqueous solution: 65% ? -pyranose and 25% ? -
furanose, at 31ºC (Angyal, 1984). The 25% value was therefore used to estimate the total
amount of fructose.
The results of sugar quantification in the Tommy Atkins juices, obtained with basis
on the integration measurements described in the previous paragraph, and also on
enzymatic determinations, are shown in Figure IV.5a. In the juice of day 1, fructose is the
predominant sugar (41.6 g/L), followed by sucrose (31.3 g/L) and glucose (20.3 g/L). After
day 5, sucrose becomes the most abundant sugar and continues to increase until day 15,

Study of the Ripening Process of Mango: Physical and Biochemical Changes
109
reaching a concentration that is almost 5 times higher than in the juice of day 1. From day
15 to day 23, sucrose shows a slight decreasing trend. Glucose concentration is steady in
the first stages of ripening and then shows a 7.5 times decrease from day 7 to day 11, after
which it remains low. Compared to sucrose and glucose, the concentration of fructose does
not vary much through the whole ripening period, increasing about 1.4 times until day 9
and decreasing back to initial values afterwards. Fructose amounts calculated with basis on
the ? -furanose signal area are over-estimated compared to the reference enzymatic values,
but both determinations show the same trend. In summary, the first 7-9 days of the storage
period are characterised by the accumulation of the three sugars, especially of sucrose,
resulting in a two-fold increase of the total sugars content; in the late ripening stages, slight
decreasing trends are noted for all sugars.
a) b) Figure IV.5. Sugars variation in Tommy Atkins juices during ripening: a) concentrations (g/L) determined by integration of NMR signals (suc: 5.41 ppm, fru: 4.11 ppm, ? -glc: 5.23 ppm, ?-glc: 4.64 ppm) and by enzymatic methods for glucose and fructose, and b) relative contribution of each sugar to the total sugar content, using the total area of the sugar region (see text). (*) Results reported by Medlicott et al. (1986).
0.0
50.0
100.0
150.0
200.0
250.0
1 3 5 7 9 11 13 15 17 19 21 23
Storage Time (days)
Con
cent
ratio
n (g
/L)
Suc (NMR)
Fru (NMR)
Fru (enzymatic)
Glc (NMR)
Glc (enzymatic)
Total Sugars (NMR)
0.0
10.0
20.030.0
40.0
50.0
60.0
70.0
80.0
1 3 5 7 9 11 13 15 17 19 21 23
Storage Time (days)
% o
f Tot
al S
ugar
s
% Suc (NMR)
% Suc from literature (*)
% Fru (NMR)
% Fru from literature (*)
% Glc (NMR)
% Glc from literature (*)

Chapter IV
110
In what concerns the relative contribution of each sugar to the total sugar content,
the results are shown in Figure IV.5b. These values have been calculated by using the areas
measured for each sugar peak (sucrose: 5.41 ppm, fructose: 4.11 ppm, ? -glucose: 5.23
ppm and ? -glucose: 4.64 ppm) multiplied by the appropriate factor (14, 7/2 and 7 for
sucrose, fructose and glucose, respectively) to obtain the area corresponding to the total
amount of each sugar, and divided by the area measured for the total sugars (area of the
3.20-4.26 ppm region plus the areas of the anomeric signals at 4.64, 5.23 and 5.41 ppm). In
the unripe juice, sucrose, fructose and glucose account for approximately 34, 43 and 21 %
of total sugars, respectively, whereas in the ripe juice, the sucrose contribution reaches
values close to 75 %, fructose accounts for about 20-23 % and glucose contributes less
than 2-3% to total sugars. These results reasonably agree with those reported by Medlicott
et al. (1986) for juices of the same mango cultivar ripened at 22ºC (obtained by high-
performance liquid chromatography), which are shown by the open symbols in the graph
of Figure IV.5b.
The organic acids quantified were citric, malic and shikimic. For citric acid, the
doublet at 2.58 ppm arising from two protons was integrated. Malic acid was quantified
through integration of the CH2 signals centred at ~2.4 ppm. In the case of shikimic acid,
the signal chosen for integration was the 6.45 ppm peak arising from H6. Succinic and
quinic acids could not be determined because, in most juice spectra, their signals strongly
overlap with other signals and, thus, integration would carry very large errors. The
variation of citric and malic acids during ripening is shown in Figure IV.6. In agreement
with several studies reported in the literature (Medlicott and Thompson, 1985; Medlicott et
al., 1986; Lizada, 1993), citric acid is abundant in unripe juices (cc. ~14 g/L) and
consistently declines during ripening to levels below 3 g/L. This high rate of citric acid loss
accounts for most of the decrease in acidity observed during ripening. Malic acid
contributes with a small loss until day 13, probably due to its utilization as a respiratory
substrate, and then increases until the end of the storage period to concentration values
close to citric acid amounts in the ripe juice. Medlicott et al. (1986) registered a similar
variation in the content of malic acid measured by HPLC at six stages during storage for 15
days. Finally, in what regards shikimic acid, its concentration is seen to decrease steadily
from 1.9 g/L to 1.2 g/L, as it will be shown further ahead.

Study of the Ripening Process of Mango: Physical and Biochemical Changes
111
Figure IV.6. Citric and malic acid variation in Tommy Atkins juices during ripening. Concentrations (g/L) determined by integration of NMR signals (citric acid: 2.58 ppm, malic acid: 2.40 ppm).
The amino acids quantified were isoleucine (1.01 ppm, 3 protons), valine (1.04
ppm, 3 protons), alanine (1.48 ppm, 3 protons), GABA (2.30 ppm, 2 protons), arginine
(1.60-1.78 ppm, 2 protons), tyrosine (7.19 ppm, 2 protons) and phenylalanine (7.30-7.45
ppm, 5 protons). Their variation during ripening is shown in Figures IV.7 and IV.8.
Figure IV.7. Amino acids variation in Tommy Atkins juices during ripening. Concentrations (mg/L) determined by integration of NMR signals (ile: 1.01 ppm, val: 1.04 ppm, ala: 1.48 ppm, GABA: 2.30 ppm, arg:1.60-1.78 ppm). The concentrations of all amino acids except arginine are indicated on the left-hand yy axis; arginine concentration is indicated on the right-hand axis; the dashed line indicates the decrease of arginine to undetectable amounts.
0.0
2.0
4.0
6.0
8.0
10.0
12.0
14.0
16.0
1 3 5 7 9 11 13 15 17 19 21 23
Storage Time (days)
0.0
0.2
0.40.60.8
1.0
1.21.4
1.6
1.8
cc. (
g/L)
ci
tric
aci
d (?
) cc. (g/L) m
alic acid (¦)
0.0
100.0
200.0
300.0
400.0
500.0
1 3 5 7 9 11 13 15 17 19 21 23
Storage Time (days)
0.0
200.0
400.0
600.0
800.0
1000.0 Isoleucine
Valine
Alanine
GABA
Arginine
cc. (
mg/
L) cc. (m
g/L) arginine

Chapter IV
112
In the juices of days 1-7, arginine predominates, followed by alanine. For
subsequent stages, arginine drastically decreases, becoming undetectable from day 9
onwards, and alanine shows a general increasing trend, thus becoming the most abundant
amino acid measured. Increases are also noted for valine, isoleucine and GABA, the latter
showing a trend similar to alanine. These results generally agree with the variations
reported in the literature for two extreme ripening stages (Kalra et al., 1995). The
phenylalanine and tyrosine variations are shown in Figure IV.8, along with the variations
registered for the area under the signal at 7.61 ppm, possibly arising from polyphenols (for
which exact assignment is not known), and for shikimic acid concentration. The results
show that polyphenols are being formed while the aromatic amino acids and shikimic acid
are being consumed. Therefore, it is possible that tyrosine, phenylalanine and shikimic acid
are used as precursors for phenolic polymerisation, the amino acids acting during the first
ripening stages and shikimic acid acting more steadily during the whole process.
Figure IV.8. Variation of aromatic amino acids, shikimic acid and polyphenols in Tommy Atkins juices during ripening, determined by integration of NMR signals (tyr: 7.19 ppm, phe: 7.30-7.45 ppm, shikimic acid: 6.45 ppm, polyphenols: 7.61 ppm). In the top graph, the dashed lines indicate the decreases of tyrosine and phenylalanine to undetectable amounts; in the bottom graph the dashed line indicates the appearance of polyphenols at day 7.
0.0
10.0
20.0
30.0
40.0
50.0
1 3 5 7 9 11 13 15 17 19 21 230.0
0.5
1.0
1.5
2.0
cc. (
mg/
L)
tyr
(?)
and
phe
(¦)
cc. (g/L) shikimic acid (?
)
0
0.1
0.2
1 3 5 7 9 11 13 15 17 19 21 23
Storage Time (days)
Are
a of
pol
yphe
nols
sig
nal

Study of the Ripening Process of Mango: Physical and Biochemical Changes
113
The use of an intensity reference for carrying out absolute quantification in pulps is
not as straightforward as in juices, since it has been found that the relationship between the
area of the TSP signal (used for quantification studies in juices) and the concentration
added to the pulp samples is not linear. Physical and/or chemical interactions of TSP
within the pulp may account for this effect. Moreover, the visible area under the signals
arising from pulp components does not always correspond to their total amount but only to
the more mobile fraction, thus rendering quantification inaccurate.
In this study, the variations in pulps and juices during ripening are compared
through a semi-quantitative approach, which consists of calculating ratios of signals for
each spectrum, in order to be able to compare different spectra. These ratios have been
obtained by dividing the area of the signal of interest by the area of the sucrose signal at
5.41 ppm, assuming that the concentration of sucrose in a certain juice is the same as in the
corresponding intact pulp. Figure IV.9 shows the results obtained for some components.
The ratio shikimic acid/sucrose (graph a) is very similar between each intact pulp and the
corresponding juice. On the contrary, the ratio polyphenols/sucrose (graph b) shows higher
values for pulps, consistent with preferable retention of polyphenols in the pulp. It is also
possible that the oxidation reactions leading to the formation of condensed phenolic
compounds have occurred more extensively in the pulp than in the juice.
Graph c in Figure IV.9 shows the ratio calculated for the signals in the 5.05-5.20
ppm range, which arise from pectic components, namely from non-reducing galacturonic
acid residues. In the unripe fruit of day 1, these signals are much more intense in the
spectrum of the intact pulp than in the corresponding juice spectrum, indicating that, as
expected, pectins are preferably located in the solid phase of the fruit. From day 5 onwards,
the same signals become equally intense in the spectra of pulps and juices, suggesting that
the expected pectin hydrolysis has occurred during the first 5 days of ripening, rendering
oligomers that are released into the liquid phase.
Finally, graph d in Figure IV.9 shows the ratio calculated for the region 1.10-1.40
ppm, where signals from fatty acids and deoxy-sugars, namely pectic rhamnose, are
detected. Ethanol and lactate also resonate in this region, but show small and
approximately constant contributions in the spectra compared. In order to evaluate the
variation of fatty acids separately from that of pectic rhamnose, the variation of
galacturonic acid residues (which are also pectic components), shown in graph c and

Chapter IV
114
discussed above, can be considered. Since, after day 5, those components were seen to be
present in similar amounts in pulps and juices, it may be stated that the points shown in
graph d for days 5, 9, 13 and 21 correspond mainly to the variation of fatty acids signals.
Similarly to what has been observed in the previous Chapter (section III.4.3), these signals
are generally more intense in the spectra of pulps than in the corresponding juices.
Moreover, the magnitude of this difference is found to be higher for earlier ripening stages
(graph d in Figure IV.9). Thus, it is likely that fatty acids are retained in the solid phase of
the fruit, especially for early ripening stages.
a) b)
c) d)
Figure IV.9. Ratios of the areas of some signals relative to the sucrose signal (5.41 ppm) in mango pulp (? ) and juice (?) at different ripening stages: a) shikimic acid (6.45 ppm), b) polyphenols (7.61 ppm), c) non-reducing galacturonic acid residues of pectic chains (5.05-5.20 ppm), and d) fatty acids + pectic rhamnose (1.10-1.40 ppm).
0.01.02.03.04.05.06.07.08.09.0
10.0
1 3 5 7 9 11 13 15 17 19 21 23
Storage Time (days)
0.0
0.5
1.0
1.5
2.0
2.5
1 3 5 7 9 11 13 15 17 19 21 23Storage Time (days)
0.0
2.0
4.0
6.0
8.0
10.0
12.0
1 3 5 7 9 11 13 15 17 19 21 23Storage Time (days)
0.0
20.0
40.0
60.0
80.0
100.0
120.0
140.0
1 3 5 7 9 11 13 15 17 19 21 23Storage Time (days)
Are
a ra
tio s
hiki
mic
/ su
cros
e
Are
a ra
tio p
olyp
heno
ls /
sucr
ose
Are
a ra
tio p
ectic
gal
A /
sucr
ose
Are
a ra
tio f.
a.+
pect
ic rh
a / s
ucro
se

Study of the Ripening Process of Mango: Physical and Biochemical Changes
115
IV.4. Preliminary Study of the Effect of Refrigeration on Mango
Ripening
In the present section, the main changes taking place in two batches of mango fruits
of the cultivar Haden, stored at different temperatures, are discussed. One of the batches
(grown in Venezuela) was stored at 22?1ºC, whereas the other batch (grown in Brazil) was
stored at 7?1ºC. Such low temperature is expected to cause chilling injury on mango fruit,
generally assessed by failure to ripen with normal colour, texture and organoleptic
properties (Medlicott et al., 1986; Krishnamurthy and Joshi, 1989). Hereby, the effect of
refrigeration is monitored not only by usual physicochemical parameters (firmness, pH and
% SS), but also by recording 1H NMR spectra of juices. This is, however, a preliminary
study since, in the case of the batch stored under refrigeration, only one fruit could be
analysed at each ripening stage. In addition, the comparison between the two batches must
account for their different geographical origins and for the subjectivity associated with the
initial ripeness stage of each set of mangoes, assessed only with basis on fruit colour and
firmness.
IV.4.1. Changes in Texture, pH and Soluble Solids
The variations of firmness, pH and soluble solids (%SS) during storage of the two
batches of fruits are shown in Figure IV.10. On days 1-5, all the fruits show high rigidity,
expressed by the small penetration depth achieved by the penetrometer needle (Figure
IV.10a). After day 5, the fruits of the batch stored at 22ºC show a marked softening until
day 13, similarly to what has been observed for the Tommy Atkins fruits (section IV.3.1).
On the other hand, the fruits of the batch stored at 7ºC show a much less pronounced
softening, as viewed by the smaller increase of the penetration depth. Medlicott et al.
(1986) registered an identical effect for mango fruits ripened at 12ºC, compared to those
stored at temperatures above 22ºC.
The juices collected from the batch ripened at 22ºC show the expected pH increase
from ~3.0 to a value close to 5.0 for the juice of day 19 (Figure IV.10b). On the other hand,
at 7ºC, the pH values remain low (3.3-3.7), indicating that the ripe juice is still
characterised by high acidity.
The %SS is seen to increase from 8.4 to 15.6% in the batch stored at 22ºC (Figure
IV.10c), a variation that is similar to the one observed in the Tommy Atkins juices (section

Chapter IV
116
IV.3.1). The juices of the refrigerated batch also reach values around 16%, and thus, this
parameter is not a particularly good indicator of mango chilling injury. However, it must
be noted that the sugar content of the unripe juice is already high (12.6%) compared to that
of the day 1 juice of the other batch. This difference at the initial stage, which is also noted
in the pH values, may be related to several factors, namely the different geographical
origins of the two batches compared (Venezuela and Brazil) and possible different stages
of maturity on harvest. Both pH and %SS results described above fairly agree with those
reported in the literature (Medlicott et al., 1986; Krishnamurthy and Joshi, 1989).
a) b) c) Figure IV.10. Variations in physicochemical properties of mango fruit (cv. Haden) during ripening at 22ºC and at 7ºC: a) firmness, b) pH and c) soluble solids (%SS). The values shown for the batch stored at 22ºC correspond to the averages determined for the three juices analysed each day, while for the refrigerated batch only one juice has been analysed at each ripening stage.
0.0
5.0
10.0
15.0
20.0
25.0
1 3 5 7 9 11 13 15 17 19 21 23
Storage Time (days)
Dep
th o
f pen
etra
tion
(mm
)
22ºC 7ºC
2.0
2.5
3.0
3.5
4.0
4.5
5.0
5.5
1 3 5 7 9 11 13 15 17 19 21 23
Storage Time (days)
pH
22ºC 7ºC
2.0
4.0
6.0
8.0
10.0
12.0
14.0
16.0
18.0
1 3 5 7 9 11 13 15 17 19 21 23
Storage Time (days)
% S
S
22ºC 7ºC

Study of the Ripening Process of Mango: Physical and Biochemical Changes
117
IV.4.2. Changes Assessed by NMR
The changes observed in the 1H NMR spectra of the juices collected at different
ripening stages from the two batches of Haden fruits (stored at 22 and a 7ºC) are discussed
in the present section. However, before investigating the effect of refrigeration, it is
interesting to compare the ripening changes taking place at 22ºC for the cultivar Haden
with those previously reported for the Tommy Atkins cultivar, in order to evaluate the
influence of cultivar/origin on the ripening process.
Significant differences are noted regarding some amino acids: a) glutamic
acid/glutamine are present in low amounts in Haden juices and do not increase as in
Tommy Atkins juices; b) arginine is present in Haden juices throughout ripening until day
17, whereas in Tommy Atkins juices it disappears after day 9; c) phenylalanine and
tyrosine are present in all Haden juices and show an increasing trend with ripening, while
they are absent in Tommy Atkins juices after 5-7 days of storage. Further differences
between the two batches may be noted in the aromatic regions of the spectra. The
polyphenolic compounds detected in Tommy Atkins juices (from day 7 onwards) are
absent in Haden juices. The synthesis of these compounds has been suggested to be
associated with the disappearance of tyrosine and phenylalanine, and, indeed, in Haden
juices, these amino acids do not disappear and polyphenols are not formed. Other
differences regard uridine and adenosine systems, which do not increase in Haden juices.
Hence, ripening at 22ºC of the Tommy Atkins and Haden batches differs mainly in the
variation of some amino acids (glutamic acid/glutamine, arginine, phenylalanine and
tyrosine), polyphenols and other minor components (uridine- and adenosine-containing
compounds).
For studying the effect of refrigeration, the changes noted for the two batches of
Haden fruits will now be considered. Most spectral changes detected for the Haden juices
ripened at 22ºC do not occur in the juices of the batch stored at 7ºC, which maintain the
spectral profile quite unchanged during the whole storage period. The amino acids, for
instance, show negligible variations, except for alanine, whose metabolism does not seem
to be affected, since it shows the same increasing trend under refrigerated storage and
under normal temperature. Similarly, the initial levels of organic acids in the juice remain
approximately constant and the variations noted at 22ºC, such as the citric acid substantial
decrease, are not seen at 7ºC.

Chapter IV
118
The major sugars also show relatively small variations in their relative proportions
during refrigerated storage, as illustrated in Figure IV.11. However, by comparing the
sugar percentages measured for the two batches, significant differences are found,
especially in what regards fructose and sucrose (Figure IV.11). Since these differences are
noted from the beginning of the storage period, they are likely to arise from factors such as
geographical origin and initial ripeness stage, rather than from the effect of the storage
temperature. In what concerns aromatic compounds, no significant variations are noted.
Figure IV.11. Sugars variation in Haden juices during ripening at 22ºC and at 7ºC: relative contribution of each sugar to the total sugar content, determined by integration of NMR signals (suc: 5.41 ppm, fru: 4.11 ppm, ? -glc: 5.23 ppm, ?-glc: 4.64 ppm; total sugars: 3.20-4.26 ppm + 4.64, 5.23 and 5.41 ppm). The values shown for the batch stored at 22ºC correspond to the averages determined for the three juices analysed each day, while for the refrigerated batch only one juice has been analysed at each ripening stage.
The small variations in the levels of organic acids and sugars, at 7ºC, account for
the high acidity and poor edible quality of the refrigerated fruits. Indeed, as shown in
Figure IV.12, the ratio of total sugars to citric acid, which is an important indicator of the
fruit organoleptic properties, remains low in the juices stored at 7ºC, while it significantly
increases in the juices collected from mangoes ripened under normal temperature, which
developed good flavour. These results agree with those reported by Medlicott et al. (1986),
who found that, during ripening at 12 and 17ºC, although sugars reached levels similar to
those accumulated at higher temperatures, citric acid remained high in the juices of
refrigerated mangoes, leading to an unfavourable balance between sugars and acids.
0.0
10.0
20.0
30.0
40.0
50.0
60.0
70.0
80.0
1 3 5 7 9 11 13 15 17 19 21 23
Storage Time (days)
% o
f Tot
al S
ugar
s
% Suc (22ºC)
% Suc (7ºC)
% Fru (22ºC)
% Fru (7ºC)
% Glc (22ºC)
% Glc (7ºC)

Study of the Ripening Process of Mango: Physical and Biochemical Changes
119
Figure IV.12. Total sugars:citric acid ratio calculated for Haden juices ripened at 22 and 7ºC, with basis on integration measurements. The values shown for the batch stored at 22ºC correspond to the averages determined for the three juices analysed each day, while for the refrigerated batch only one juice has been analysed at each ripening stage.
In summary, storage at 7ºC is found to prevent (or at least to retard) most
compositional changes occurring at normal temperature (22ºC), within the period studied.
In particular, the metabolism of most amino acids and organic acids (namely citric acid) is
clearly affected by the low temperature, since these compounds exhibit only small
variations throughout storage.
IV.5. Conclusions
In this work, the ripening process of mango fruit was found to be characterised by
significant changes in many components, as monitored by high resolution 1H NMR of
juices. The major sugars present in mango juice showed different variations upon ripening:
sucrose (initial cc. 31 g/L) increased almost 5 times until the mid-stages of the storage
period, becoming the most abundant sugar after day 5; fructose, which was the ma jor sugar
in the unripe juice (cc. 42 g/L), showed a small increase until day 9 (cc. 60 g/L) and then
decreased back to initial concentrations; glucose (initial cc. 20 g/L) significantly decreased
after day 7 to 2-3 g/L, constituting only about 2% of the total sugars in the ripe juice. The
sum of these variations resulted, as expected, in a two-fold increase of the total sugars
content, a slight decreasing trend being noted for late ripening stages. Concerning organic
acids and amino acids, different variation patterns were found. As expected, citric acid
0.0
50.0
100.0
150.0
200.0
250.0
300.0
350.0
1 3 5 7 9 11 13 15 17 19 21 23
Storage Time (days)
Tot
al S
ugar
s/C
itric
Aci
d R
atio
22ºC 7ºC

Chapter IV
120
(initial cc. 14 g/L) showed a substantial decrease, being largely responsible for the acidity
loss reflected by the pH increase of the juice. Shikimic acid also decreased from about 1.8
to 1.1 g/L, whereas malic acid (initial cc. 1 g/L) decreased until mid-stages but then
increased back until the end of storage. Some amino acids like alanine, valine and
isoleucine were seen to increase during ripening while others such as arginine, tyrosine and
phenylalanine were found to decrease. The decrease of the aromatic amino acids, as well as
of shikimic acid, was accompanied by the increase in the broad signals attributed to
polyphenolic compounds, suggesting the use of the former as precursors of phenolic
polymerisation. Another interesting observation regarded the increase in pectic signals,
reflecting the process of pectin hydrolysis expected to accompany mango ripening.
For the pulps, a semi-quantitative study has been carried out and the results
suggested that polyphenols and fatty acids may be retained in the pulp solid phase, giving
rise to signals with relative lower intensities in the spectra of juices. Moreover, pectic
components, namely galacturonic acid residues, were detected in higher amounts in the
unripe pulp than in the corresponding juice, although this difference was not observed for
subsequent ripening stages.
Compared to the Tommy Atkins cultivar, the compositional changes registered for
the Haden cultivar, ripened at the same temperature (22ºC), differed mainly in the
variations of some amino acids, namely glutamic acid/glutamine, arginine, tyrosine and
phenylalanine, polyphenols (which were not formed in Haden juices) and other minor
components (uridine- and adenosine-containing compounds). The effect of refrigerated
storage on the composition of Haden juices has also been investigated and it was found
that most juice components showed small variations, compared to the juices stored under
normal conditions. Citric acid, for instance, remained high in the juices collected from
refrigerated fruits, conferring them a high acidity and an unfavourable balance with sugars,
resulting in poor edible quality. Alanine, on the other hand, increased at both storage
temperatures, suggesting that its metabolism was not affected by refrigeration.
References
Angyal, S.J. The composition of reducing sugars in solution. Advances in Carbohydrate Chemistry and Biochemistry 1984, 42, 15-67.

Study of the Ripening Process of Mango: Physical and Biochemical Changes
121
Barcelon, E.G.; Tojo, S.; Watanabe, K. Relating X-ray absorption and some quality characteristics of mango fruit (Mangifera indica L.). Journal of Agricultural and Food Chemistry 1999, 47, 3822-3825. Bellon, V.; Cho, S.I.; Krutz, G. W.; Davenel, A. Ripeness sensor development based on nuclear magnetic resonance. Food Control 1992, January, 45-48. Belton, P.S.; Delgadillo, I.; Holmes, E.; Nicholls, A.; Nicholson, J.K.; Spraul, M. Use of high-field 1H NMR spectroscopy for the analysis of liquid foods. Journal of Agricultural and Food Chemistry 1996, 44, 1483-1487. Belton, P.S.; Delgadillo, I.; Gil, A.M.; Casuscelli, F.; Colquhou, I.J.; Dennis, M.J.; Spraul, M. High field proton NMR studies of apple juices. Magnetic Resonance in Chemistry 1997, 35, S52-S60. Belton, P.S.; Colquhoun, I.J.; Kemsley, E.K.; Delgadillo, I.; Roma, P.; Dennis, M.J.; Sharman, M.; Holmes, E.; Nicholson, J.K.; Spraul, M. Application of chemometrics to the 1H NMR spectra of apple juices: discrimination between apple varieties. Food Chemistry 1998, 61, 207-213. Bertoluzza, A.; Bottura, G.; Filippetti, P.; Tosi, M.R.; Vasina, M.; Pratella, G.C.; Folchi, A.; Gallerani, G. Vibrational spectroscopy for the evaluation of molecular perturbations induced in fruit lipids by cold storage. Journal of Molecular Structure 1994, 324, 177-188. Chatjigakis, A.K.; Pappas, C.; Proxenia, N.; Kalantzi, O.; Rodis, P.; Polissiou, M. FT-IR spectroscopic determination of the degree of esterification of cell wall pectins from stored peaches and correlation to textural changes. Carbohydrate Polymers 1998, 37, 395-408. Chen, P.; McCarthy, M.J.; Kim, S.-M.; Zion, B. Development of a high-speed NMR technique for sensing maturity of avocados. Transactions of the ASAE 1996, 39, 2205-2209. Clark, C.J.; Drummond, L.N.; MacFall, J.S. Quantitative NMR imaging of kiwifruit (Actinidia deliciosa) during growth and ripening. Journal of the Science of Food and Agriculture 1998, 78, 349-358. Clark, C.J.; MacFall, J.S. Magnetic resonance imaging of persimmon fruit (Diospyros kaki) during storage at low temperature and under modified atmosphere. Postharvest Biology and Technology 1996, 9, 97-108. Goodman, B.A.; Williamson, B.; Simpson, E.J.; Chudek, J.A.; Hunter, G.; Prior, D.A.M. High-field NMR microscopic imaging of cultivated strawberry fruit. Magnetic Resonance Imaging 1996, 14, 187-196. Guthrie, J.; Walsh, K. Non-invasive assessment of pineapple and mango fruit quality using near infra-red spectroscopy. Australian Journal of Experimental Agriculture 1997, 37, 253-263.

Chapter IV
122
Ishida, N.; Koizumi, M.; Kano, H. Ontogenic changes in water in cherry tomato fruits measured by nuclear magnetic resonance imaging. Scientia Horticulturae 1994, 57, 335-346. Joyce, D.C.; Hockings, P.D.; Mazucco, R.A.; Shorter, A.J.; Brereton, I.M. Heat treatment injury of mango fruit revealed by nondestructive magnetic resonance imaging. Postharvest Biology and Technology 1993, 3, 305-311. Kalra, S.K.; Tandon, D.K.; Singh, B.P. Mango. In Handbook of Fruit Science and Technology. Production, Composition, Storage and Processing; Salunkhe, D.K., Kadam, S.S. Eds.; Marcel Dekker Inc.: New York, 1995; 123-169. Keener, K.M.; Stroshine, R.L.; Nyenhuis, J.A. Proton magnetic resonance measurement of self-diffusion coefficient of water in sucrose solutions, citric acid solutions, fruit juices and apple tissue. Transactions of the ASAE 1997, 40, 1633-1631. Krishnamurthy, S.; Joshi, S.S. Studies on low temperature storage of Alphonso mango. Journal of Food Science and Technology 1989, 26, 177-180. Le Gall, G., Puaud, M., Colquhoun, I.J. Discrimination between orange juice and pulp wash by 1H nuclear magnetic resonance spectroscopy: Identification of marker compounds. Journal of Agricultural and Food Chemistry 2001, 49, 580-588. Lizada, C. Mango. In Biochemistry of Fruit Ripening; Seymour, G.B., Taylor, J.E., Tucker, G.A., Eds.; Chapman & Hall: London, 1993; 255-271. Medlicott, A.P; Thompson, A.K. Analysis of sugars and organic acids in ripening mango fruits (Mangifera indica L. var Keitt) by high performance liquid chromatography. Journal of the Science of Food and Agriculture 1985, 36, 561-566. Medlicott, A.P; Reynolds, S.B.; Thompson, A.K. Effects of temperature on the ripening of mango fruit (Mangifera indica L. var Tommy Atkins). Journal of the Science of Food and Agriculture 1986, 37, 469-474. Mizrach, A.; Flitsanov, U.; Fuchs, Y. An ultrasonic nondestructive method for measuring maturity of mango fruit. Transactions of the ASAE. 1997, 40, 1107-1111. Mizrach, A.; Flitsanov, U.; Schmilovitch, Z.; Fuchs, Y. Determination of mango physiological indices by mechanical wave analysis. Postharvest Biology and Technology 1999, 16, 179-186. Morga, N.S.; Lustre, A.O.; Tunac, M.M.; Balagot, A.H.; Soriano, M.R. Physico-chemical changes in Philippine Carabao mangoes during ripening. Food Chemistry 1979, 15, 225-234. Muda, P.; Seymour, G.B.; Errington, N.; Tucker, G.A. Compositional changes in cell wall polymers during mango fruit ripening. Carbohydrate Polymers 1995, 26, 255-260.

Study of the Ripening Process of Mango: Physical and Biochemical Changes
123
Ni, Q.W.; Eads, T.M. Low-speed magic-angle-spinning carbon-13 NMR of fruit tissue. Journal of Agricultural and Food Chemistry 1992, 40, 1507-1513. Ni, Q.W.; Eads, T.M. Liquid-phase composition of intact fruit tissue measured by high resolution proton NMR. Journal of Agricultural and Food Chemistry 1993a, 41, 1026-1034. Ni, Q.X.; Eads, T.M. Analysis by proton NMR of changes in liquid-phase and solid-phase components during ripening of banana. Journal of Agricultural and Food Chemistry 1993b, 41, 1035-1040. Selvaraj, Y.; Kumar, R.; Pal, D.K. Changes in sugars, organic acids, amino acids, lipid constituents and aroma characteristics of ripening mango (Mangifera indica L.) fruit. Journal of Food Science and Technology 1989, 26, 308-313. Tarkosova, J.; Copikova, J. Determination of carbohydrate content in bananas during ripening and storage by near infrared spectroscopy. Journal of Near Infrared Spectroscopy 2000, 8, 21-26. Tucker, G.A.; Seymour, G.B. Cell wall degradation during mango fruit ripening. Acta Horticulturae 1991, 291, 454-460. Vogels, J.T.W.E.; Terwel, L.; Tas, A.C.; van den Berg, F.; Dukel, F.; van der Greef, J. Detection of adulteration in orange juices by a new screening method using proton NMR spectroscopy in combination with pattern recognition techniques. Journal of Agricultural and Food Chemistry 1996, 44, 175-180. Zion, B.; Chen, P.; McCarthy, M.J. Nondestructive quality evaluation of fresh prunes by NMR spectroscopy. Journal of the Science of Food and Agriculture 1995, 67, 423-429.

Chapter IV
124

V. SUGAR QUANTIFICATION IN MANGO JUICE BY MULTIVARIATE ANALYSIS
OF FTIR AND NMR DATA
V.1. Introduction…………………………………………………………………………
V.2. Materials and Methods………………...……………………………………………
V.2.1. Sample Preparation…………………………………………………………...
V.2.2. FTIR Measurements…………………………………………………………..
V.2.3. NMR Measurements………………………………………………………….
V.2.4. Enzymatic Determinations…………………………………………………...
V.2.5. Multivariate Analysis…………………………………………………………
V.3. Sugar Quantification by Partial Least Squares (PLS)-FTIR………………………..
V.3.1. Application to Sugar Standard Solutions……………………………………..
V.3.2. Application to Mango Juices as a Function of Ripening……………………..
V.4. Sugar Quantification by Partial Least Squares (PLS)-NMR………………………..
V.4.1. Application to Sugar Standard Solutions……………………………………..
V.4.2. Application to Mango Juices as a Function of Ripening……………………..
V.5. Conclusions…………………………………………………………………………
References………………………………………………………………………………..
126
128
128
130
130
130
131
131
131
135
138
138
142
144
144

Chapter V
126
V.1. Introduction
The sugar composition and its dependence upon the ripening process has been
studied for many fruits, including mango. As reported in Chapters III and IV of this thesis,
glucose, fructose and sucrose are the most abundant components of mango juice and show
large variations with ripening. Indeed, total sugar content is commonly used as a ripening
indicator and is one of the most important criteria for evaluating the edibility of fruits and
the quality of their processed products. Traditionally, sugar contents of foods (particularly
in juices and beverages) are estimated with basis on refractive index measurements and
volumetric procedures, which provide information about the total sugar content and the
amount of reducing sugars (glucose and fructose), respectively (Pomeranz and Meloan,
1994). For quantifying each sugar separately, enzymatic analysis and chromatographic
methods (Corradini et al., 1997; Lee and Coates, 2000) are usually employed. In recent
years, spectroscopic methods have become alternative techniques for the analysis of sugars
in food samples, having the attractive features of being non- invasive and potentially more
rapid than the above methods.
Many authors have illustrated the applicability of mid- infrared spectroscopy, in
conjunction with chemometric methods, to the quantification of sugars in natural samples.
Most studies used the Attenuated Total Reflectance (ATR) technique for measuring the
infrared spectra, which is very convenient for analysing liquid and semi-solid samples. In a
comparative study of a horizontal ATR cell and a Cylindrical Internal Reflection cell
(CIRCLE cell), Garrigues et al. (1998) demonstrated the superiority of ATR in terms of the
sensitivity achieved in the determination of sugars in fruit juices and soft drinks by PLS
regression of the FTIR data. ATR FTIR measurements have been employed to determine
glucose, fructose and sucrose in aqueous standards (Kemsley et al., 1993), glucose syrups
(Mirouze et al., 1993), raw sugar cane juices (Cadet and Offmann, 1997; Cadet, 1999) and
fruit juices (Garrigues et al., 1998; Rambla et al., 1998; Tewari et al., 1999), using
multivariate data analysis. Good results have been reported when samples employed as
standards in the calibration set were of the same type as those to be analysed, as evaluated
by comparison with reference methods such as HPLC and polarimetry (Mirouze et al.,
1993; Cadet and Offmann, 1997; Cadet, 1999). Although the use of real samples for
calibration may aid in taking into account possible contributions from other components in
the system, the choice of the reference analytical method may, for the same reason, be

Sugar Quantification in Mango Juice by Multivariate Analysis of FTIR and NMR Data
127
hindered by possible interferences. In addition, a calibration set based on real samples will
be specifically applicable to the particular sample under study whereas, if a suitable model
can be built based on simpler laboratory samples, such robust model may be applicable to
other systems. Therefore, some studies have been carried out based on external calibration
sets prepared from aqueous standard solutions (Garrigues et al., 1998; Rambla et al., 1998;
Tewari et al., 1999). Tewari et al. (1999) quantified sugars and citric acid in synthetic
mixtures and in apple juices, using PLS and PCR of FTIR ATR data. The calibration set
comprised 24 standard mixtures of glucose, fructose, sucrose and citric acid, in which
concentrations were gradually increased for all components simultaneously. Internal cross-
validation indicated good agreement between known and predicted concentrations and
some results of the application to apple juices were shown. However, comparison with a
reference method to evaluate their accuracy was lacking. Garrigues et al. (1998) and
Rambla et al. (1998) proposed the use of a reduced calibration set, comprising 8 ternary
mixtures of glucose, fructose and sucrose at two concentration levels, for quantification of
sugars in aqueous synthetic mixtures and several fruit juices and soft drinks. Recovery
studies indicated good accuracy of the procedure.
In this work (Duarte et al., 2002), a recently developed single reflectance ATR cell
is employed to record the FTIR spectra of sugar standard solutions and mango juices at
different ripening stages. This cell enables very small sample amounts to be analysed
(enough to cover a 2 mm diameter crystal surface) and is of easy-handling relating to cell
cleaning between experiments. The PLS calibration is constructed with a set of synthetic
mixtures of glucose, fructose and sucrose, comprising six concentrations for each sugar,
and the contents of each sugar in ripening mango juices are predicted and compared to the
values obtained by enzymatic determinations.
Nuclear magnetic resonance (NMR) spectroscopy is also potentially valuable for
quantitative analysis, provided that adequate experimental conditions are employed, as
described in Chapter II.1.2. However, there are not many studies in the literature reporting
the quantification of food components using high resolution NMR. Cho et al. (1991)
measured the total sugar content in muskmelon tissue by correlating the 1H NMR sugar
peak height with the sugar content measured by refractometry. Subsequently, using the
technique of Magic Angle Spinning (MAS), Ni and Eads (1993) were able to estimate the
concentrations of individual sugars (glucose, fructose and sucrose) in banana tissue, by

Chapter V
128
first measuring the standard NMR spectra on separate samples of aqueous solutions of
each sugar at known concentrations, and then simulating an observed banana spectrum
through the addition of appropriate fractions of standard spectra until the shape of the
observed spectrum was reproduced. More recently, there has been a report in which some
amino acid ratios observed in the NMR spectra of fruit juices have been compared to
published values obtained by HPLC (Belton et al., 1996). In Chapter IV.3.2.2 of this
thesis, the concentrations of sugars and other mango juice constituents have been
determined by integration of the NMR signals, using the signal of a standard material
(TSP) as an intensity reference. However, in the case of strongly overlapped signals, this
approach is clearly misleading and unsatisfactory. Moreover, when a large number of
samples are to be quantified, signal integration may be a tedious process. Therefore, the
use of multivariate methods becomes desirable.
The work described in section V.4 of this Chapter makes use of multivariate
analysis, namely PLS regression, applied to the 1H NMR spectra of standard solutions and
mango juices to predict the concentrations of glucose, fructose and sucrose, similarly to the
approach used for the FTIR data. The procedure is tested here for sugars, which are major
components in juices, but it would be important to apply it to other components,
particularly those whose signals show strong overlap in the NMR spectrum.
V.2. Materials and Methods
V.2.1. Sample Preparation
Standard Solutions: Standard aqueous solutions of glucose, fructose and sucrose
were prepared from analytical grade reagents, obtained from Sigma-Aldrich and dried
under vacuum at 35ºC until constant weight (?0.0002 g). These standards comprised one
solution of each sugar, nine binary mixtures and ten ternary mixtures, with concentrations
varying according to a triangular experimental design; six concentration levels were
chosen for each sugar, based on the concentration ranges commonly found in mango juices
at different ripening stages (Hulme, 1971; Medlicott et al., 1986): sucrose, 4-148 g/L,
glucose, 3-59 g/L, fructose, 4-99 g/L. Table V.1 lists the standard mixtures prepared and
respective sugar concentrations. In order to prevent microbial growth, sodium azide was
added, so that each solution contained 0.05% NaN3. The solutions, found to have pH
values of 6.9-7.0, were frozen in liquid nitrogen and stored at -20ºC until FTIR and NMR

Sugar Quantification in Mango Juice by Multivariate Analysis of FTIR and NMR Data
129
measurements. For NMR analysis, the thawed solutions were prepared to contain 10% D2O
(field-frequency lock) and 0.02% sodium 3-(trimethylsilyl)tetradeutero propionate (TSP-
d4, chemical shift and intensity reference), by mixing 900 ? l of sample with 100 ? l of TSP-
d4 0.2% in D2O.
Table V.1. Concentrations (g/L) of the three sugars in the standard solutions of the calibration set.
Standard solution no.
Sugar concentration (g/L) Glucose Fructose Sucrose
1 2.96 4.45 88.90 2 7.41 4.45 59.26
3 2.96 29.64 59.26
4 14.82 4.45 29.63 5 7.41 29.64 29.63
6 2.96 44.46 29.63
7 29.64 4.45 4.45 8 14.82 29.64 4.45
9 7.41 44.46 4.45
10 2.96 59.28 4.45 11 - 4.45 118.53
12 - 29.64 88.90
13 - 59.28 29.63 14 2.96 74.10 -
15 7.41 59.28 -
16 29.64 29.64 - 17 44.46 - 4.45
18 29.64 - 29.63
19 7.410 - 88.90 20 - - 148.16
21 - 98.80 -
22 59.28 - -
Mango Juices: Juices prepared from Tommy Atkins mangoes as described in Chapter
IV.2.1 were used for this study. For FTIR, the thawed juices were measured directly. For
NMR, sample preparation consisted of adding water (to reduce excessive viscosity) and
phosphate buffer containing D2O and TSP, so that the juices pH, initially varying between
3.20 to 5.30, were adjusted to fall in the narrower range of 5.60-6.20, as previously
explained in Chapter IV.2.1.

Chapter V
130
V.2.2. FTIR Measurements
Fourier transform infrared spectra of standard solutions and of juice samples were
collected on a Bruker IFS55 FTIR spectrometer. A single reflectance horizontal ATR cell
(Golden Gate, equipped with a diamond crystal) was used. The data were recorded at
20?1oC, in the spectral range of 4000-700 cm-1, by accumulating 512 scans with a
resolution of 4 cm-1. The choice of these conditions was based on a study of FTIR
acquisition parameters and their effect on the mean errors of prediction reported by
Rambla et al. (1998). For each standard solution and juice sample, a total of five spectra
were recorded (named here as replica spectra), each spectrum obtained for a different
sample batch. Between consecutive spectra, the crystal was carefully cleaned with water
and, to avoid memory effects, the replica spectra were recorded randomly, i.e. intermingled
with the spectra of other samples. In this way, a total of 110 spectra of standard solutions
and 40 spectra of juices were recorded. These spectra were converted into JCAMP format
and transferred to a PC workstation for statistical analysis.
V.2.3. NMR Measurements
The 1D 1H NMR spectra of mango juices have been recorded using the acquisition
parameters described in Chapter III.2.2. The spectra of sugar standard solutions were
acquired under the same conditions. The FIDs were Fourier transformed with different
line-broadening factors, varying in the range 0.3-100 Hz, as it will be described in section
V.4.1. The spectra were then phased, baseline corrected and calibrated by the TSP signal at
0.0 ppm. The resulting spectra were converted into JCAMP format and transferred to a PC
workstation for statistical analysis.
V.2.4. Enzymatic Determinations
In order to evaluate the predictive ability of sugar quantification in mango juices by
multivariate analysis of FTIR and NMR data, each sugar was quantified enzymatically for
a selected set of samples, using the triple enzymatic test for suc rose/D-glucose/D-fructose
(cat. no. 716260) and the single test for D-glucose (cat. no. 716251), both purchased from
Boehringer Mannheim. For ripening stages later than day 13, the glucose-specific test had
to be used along with the triple test, since glucose content becomes significantly lower than
those of the other sugars.

Sugar Quantification in Mango Juice by Multivariate Analysis of FTIR and NMR Data
131
V.2.5. Multivariate Analysis
Partial-Least Squares (PLS1) regression was the method employed to build
calibration models and predict the concentration of sugars in juice samples. Principal
Components Analysis (PCA) was also used. The calculations were performed using the
program developed by Dr. A. Barros in the ‘Institut National Agronomique Paris-Grignon’
in collaboration with the University of Aveiro (Barros, 1999). The basic principles of PCA
and PLS methods are described in Chapter II.5.
For multivariate analysis of the FTIR data, the spectral region between 1250 and
900 cm-1 (‘fingerprint’ region) was selected. Each spectrum was autoscaled (mean centred
and standardised), and the first and second derivatives of the spectra were calculated by the
Savistsky-Golay procedure (Savistsky and Golay, 1964). PLS regression was applied to the
three sets of spectra (autoscaled, first and second derivatives), as discussed in section
V.3.1. For multivariate analysis of the NMR spectra, the 2.9-5.7 ppm region was used,
excluding the segment containing the suppressed water signal at 4.80 ppm. Each spectrum
was normalised by adjusting the total area to unity. This procedure helps removing the
potential intensity variation caused by the NMR equipment.
The prediction errors of the PLS models developed for the estimation of sugars in
mango juices were evaluated by the Root Mean Square Error of Prediction (RMSEP), in
percentage, defined as:
where N is the number of samples, yi is the actual concentration, yi is the predicted
concentration, and is the average of actual concentration values.
V.3. Sugar Quantification by Partial Least Squares (PLS)-FTIR
V.3.1. Application to Sugar Standard Solutions
Glucose, fructose and sucrose show intense and characteristic bands in the
fingerprint region (1250-900 cm-1) of the mid- infrared wavelength range (Figure V.1),
reflecting mainly C-O stretching vibrations. Although each sugar has a characteristic set of
absorption bands in this region, these bands are severely overlapped in the spectrum of a
? ?
? ? ? ? ?
? ? ? ? ? ? ?
? ? N
y ˆ y 2
y 100 RMSEP(%)
N 1 i
i i
y

Chapter V
132
mixture of sugars, thus hindering individual sugar identification/quantification by
univariate calibration strategies.
a) b)
Figure V.1. a) FTIR-ATR spectra (1250-900 cm-1) of standard aqueous solutions of sucrose, fructose and glucose, recorded using a Golden Gate single reflectance ATR cell, with 4 cm-1 resolution and 512 scans; b) first derivative functions of the FTIR spectra shown in a).
In order to build a multivariate calibration model for determining sugars in mango
juices, the set of 22 standard solutions shown in Table V.1 was measured by FTIR and
PLS1 regression was applied to the autoscaled spectra, to the first derivatives and to the
second derivatives of the spectra. Table V.2 shows the statistical parameters obtained for
the three models. Each model was tested by internal cross-validation, also called the leave-
k-out procedure, k being the 5 replica spectra of each sample. The objective function used
to find the "best" model was the Root Mean Square Error of Cross-Validation (RMSECV),
in percentage. It is clear from the results shown in Table V.2 that the RMSECV (%) values
and the model dimensionalities (or latent variables) corresponding to the first derivative
treatment are lower than those obtained for the other models, in particular for the model
constructed with the autoscaled spectra. Therefore, the underlying variations present in the
FTIR spectra of sucrose, glucose and fructose mixtures are most suitably identified with
the use of the first derivatives of the spectra, shown in Figure V.1b. Rambla et al. (1998)
have also reported lower prediction errors for PLS regression of first-derivative spectra
compared to absorbance spectra. In addition, it also becomes clear from Table V.2 that the
error obtained for glucose (4.9%) is higher than that obtained for sucrose and fructose
(1.4%). This may be a reflection of the relatively low glucose concentrations, spread within
4,50E+08
5,50E+08
6,50E+08
7,50E+08
8,50E+08
9,50E+08
900100011001200
Wavenumber (cm -1)
Abs
orba
nce
(arb
itrar
y un
its)
Suc Fru Glc
Abs
orba
nce
-0.004
-0.003
-0.002
-0.001
0
0.001
0.002
0.003
900100011001200
Wavenumber (cm-1)A
bs (
a.u.
) -
1st d
eriv
ativ
eA
bs.
–1st
deriv
ativ
e

Sugar Quantification in Mango Juice by Multivariate Analysis of FTIR and NMR Data
133
a narrower range (3-59 g/L) than those of sucrose and fructose (4-148 g/L and 4-99 g/L,
respectively).
Table V.2. Statistical results of the application of PLS1 to the three sets of FTIR data: autoscaled spectra, first derivative spectra and second derivative spectra.
Latent Variables RMSECV (%) autoscaled spectra
Fructose 8 9.3 Glucose 5 10.1 Sucrose 7 14.9
1st derivative spectra Fructose 4 1.4 Glucose 4 4.9 Sucrose 4 1.4
2nd derivative spectra Fructose 4 3.0 Glucose 6 5.7 Sucrose 6 1.8
Figure V.2 shows the b vectors as obtained from the PLS1 regression applied on
the first derivatives of the spectra. These vectors establish the profile of each sugar and
enable its amount to be predicted in test or real samples. All the three obtained PLS1
models (each with 4 latent variables) explained 99% of the total variability present in the
concentration vectors (sugars amount).
Figure V.2. b vectors obtained with the PLS1 model (4 latent variables) applied on the first derivatives of the FTIR-ATR spectra (1250-900 cm-1) of the standard sugar solutions.
-400
-300
-200
-100
0
100
200
300
900950100010501100115012001250
Wavenumbers (cm-1)
b ve
ctor
s
Sucrose Fructose Glucose

Chapter V
134
For a better understanding of the main sources of variability affecting the FTIR
spectra of the standard sugar solutions in the calibration set, Principal Component Analysis
(PCA) was performed in the 1250-900 cm-1 region of the corresponding first derivative
spectra. Figure V.3a shows the scores scatter plot of the two first Principal Components
(PCs), which together account for 99% of the total variability present in the spectra.
a)
b)
Figure V.3. PCA of the first derivative FTIR-ATR spectra (1250-900 cm-1) of the standard sugar solutions: a) Scores scatter plot of PC1 vs. PC2 and b) PC1 and PC2 loadings profiles.
The plot obtained shows that the samples are suitably distributed along a
concentration gradient, according to their sugar composition determined by the triangular
experimental design employed. As expected, the three individual sugar solutions at
maximum concentration levels are located at the vertices of the “triangle”: sucrose (sample
20) is located in the negative side of PC1 axis while fructose (sample 21) and glucose
(sample 22) are located in the positive side of PC1. This distinction can be further
interpreted by inspecting the loadings profile corresponding to PC1 (Figure V.3b). It can
10
11
12
1314
15
16
1718
19120
21
22
2
3
4
5
6
7
8
9
PC1 (74%)
PC
2 (2
5%)
Glc
Fru
Suc
-0.3
-0.2
-0.1
0
0.1
0.2
0.3
900950100010501100115012001250
Wavenumber (cm-1)
Load
ings
PC1 PC2
935
953
960
985
1007 1072
1111
1055
1086
1062 1080 1147

Sugar Quantification in Mango Juice by Multivariate Analysis of FTIR and NMR Data
135
be seen that the bands related to sucrose (negative PC1 loadings) are those located at 935,
953, 1007, 1022, 1062, 1080 and 1147 cm-1. Comparison with the first derivative spectra
shown in Figure V.1b confirms that these values correspond to maxima in the suc rose
spectral profile. The scores scatter plot (Figure V.3a) also shows a distinction between
fructose and glucose along the PC2 axis: the positive bands located at 960, 1055 and 1086
cm-1 (Figure V.3b) appear to be more related to glucose variation, whereas the negative
bands located at 985, 1016, 1072, 1095 and 1111 cm-1 (Figure V.3b) should be more
related to fructose variation.
V.3.2. Application to Mango Juices as a Function of Ripening
The FTIR spectra of four mango juices collected at different ripening stages are
shown in Figure V.4. From day 1 to day 19, these spectra show a tendency for total area
increase, reflecting the increase in total sugars, as well as changes in the spectral profile
due to changes in the proportion of the three main sugars, sucrose, fructose and glucose.
Figure V.4. FTIR-ATR spectra (1250-900 cm-1) of four mango juices at different ripening stages, recorded using a Golden Gate single reflectance ATR cell, with 4 cm-1 resolution and 512 scans.
In order to quantify each of the three sugars at different ripening stages, the PLS1
calibration model developed for the standard sugar solutions was applied to the first
derivative functions of the mango juices spectra. Sucrose, glucose and fructose were also
quantified by specific enzymatic tests so that the accuracy of the estimated concentrations
5,00E+08
6,00E+08
7,00E+08
8,00E+08
9,00E+08
1,00E+09
1,10E+09
900950100010501100115012001250
Wavenumber (cm-1)
Abs
. (a.
u.)
Day 1 Day 5 Day 9 Day 19
Abs
orba
nce

Chapter V
136
could be verified. The results are shown in Table V.3. Firstly, it should be noted that some
discrepancy occurs between FTIR and enzymatic results for sucrose and fructose in day 1.
This may relate to the fact that the 5 replica spectra taken for the juice of day 1 show
poorer reproducibility than the replica measured for the other samples, therefore limiting
the accuracy of the values obtained by PLS-FTIR. For days 3 to 9, both sets of data are in
very good agreement for all sugars. For stages later than day 13, good agreement is shown
for sucrose and fructose but, for glucose, concentrations determined enzymatically are
consistently lower than those predicted by FTIR. This arises from the drastic glucose
decrease, at late ripening stages, to concentration levels lower than those observed in
previous studies (Medlicott and Thompson, 1985; Medlicott et al., 1986). Since the
glucose concentration levels found here (0.6-1.5 g/L) are well below the minimum glucose
concentration present in the standard solutions used to build the PLS-FTIR model (3.0
g/L), such low concentrations could not be adequately predicted by this model.
Table V.3. Concentrations (g/L) of the three sugars in mango juices at different ripening stages, estimated by PLS1 applied on the first derivative FTIR-ATR spectra and measured by enzymatic tests. The uncertainties of each PLS-FTIR estimated values are indicated; the precision of the enzymatic tests was found to be 1.5-1.6% for each type of test employed.
Ripening stage
Glucose Fructose Sucrose
PLS1 Enzymatic PLS1 Enzymatic PLS1 Enzymatic
Day 1 20.36 ±1.00 19.34 34.28 ±0.48 39.10 27.84 ±0.40 38.15 Day 3 18.27 ±0.90 16.03 36.14 ±0.51 35.70 31.48 ±0.44 32.00
Day 5 19.58 ±0.96 17.13 37.17 ±0.52 36.07 47.17 ±0.66 47.63
Day 9 11.71 ±0.57 10.84 42.72 ±0.60 43.64 98.59 ±1.40 97.00 Day 13 2.46 ±0.12 0.58 42.68 ±0.60 38.90 117.69 ±1.65 118.02
Day 17 2.49 ±0.12 0.94 32.13 ±0.45 32.67 109.40 ±1.53 111.31
Day 19 4.20 ±0.21 1.29 26.40 ±0.37 25.87 111.30 ±1.56 110.80 Day 21 4.46 ±0.22 1.47 26.51 ±0.37 n.d. 104.64 ±1.46 n.d.
n.d.: not determined
In summary, the present PLS-FTIR model is able to predict sugar contents in
mango juices with different ripening degrees with the following RMSEP (%) values: 5.1%
for sucrose (down to 1.3% if spectral dispersion in day 1 is improved); 6.7% for fructose
(down to 4.8% if spectral dispersion in day 1 is improved); 8.0 % for glucose until mid-
stages of ripening, beyond which prediction errors may reach about 25%.

Sugar Quantification in Mango Juice by Multivariate Analysis of FTIR and NMR Data
137
The juices first derivative spectra, obtained as a function of ripening, were also
treated by PCA and the resulting scores scatter plot is shown in Figure V.5a. The juices of
days 1 to 5 are clearly separated from the remaining samples, along the PC1 dimension.
a)
b)
Figure V.5. PCA of the first derivative FTIR-ATR spectra (1250-900 cm-1) of mango juices: a) Scores scatter plot of PC1 vs. PC2 and b) PC1 loadings profile.
The PC1 loadings profile (Figure V.5b) indicates that the samples with scores
located in the negative side of PC1 are richer in sucrose, since loading values are negative
at the wavenumbers 935, 953, 1007, 1022, 1072 and 1147 cm-1, already seen to be
characteristic of sucrose. Indeed, the quantification results presented in Table V.3 show
that the sucrose content is below 50 g/L from day 1 to day 5 and increases to
concentrations close to or higher than 100 g/L in the remaining days. Moreover, since citric
acid is known to decrease drastically during the first stages of ripening (Medlicott and
Thompson, 1985; Medlicott et al., 1986), the possibility that this variation may contribute
-0.3
-0.2
-0.1
0
0.1
0.2
0.3
900950100010501100115012001250
Wavenumber (cm-1)
Load
ings
935 953
1007 1072 1147
PC1 (97%)
PC
2 (2
%)
day 9
day 17
day 5
day 3
day 1
day 13
day 19 day 21

Chapter V
138
to the PC1 loadings profile shown in Figure V.5b was also considered. However, the fact
that this profile shows no significant contributions in regions of strong citric acid
absorbance such as at 1180 cm-1 or 1220 cm-1 indicates that the results obtained do not
depend significantly on the citric acid variations. The variability within the PC2 dimension
is not as significant as that in PC1, since it accounts for only 2% of the total variability in
the spectra. However, some distinction between juices of day 9 and those of the latest
ripening stages (days 19 and 21) may be suggested from the plot (Figure V.5a), probably
reflecting variations in the proportion of glucose and fructose.
V.4. Sugar Quantification by Partial Least Squares (PLS)-NMR
V.4.1. Application to Sugar Standard Solutions
Similarly to the approach used for the FTIR data, PLS1 regression was applied to
the 1H NMR spectra of standard sugar solutions, aiming at building a model to predict the
concentrations of glucose, fructose and sucrose in real juice samples. The model was tested
by internal cross-validation and extremely large errors (RMSECV%) resulted for the three
sugars: 50.8% for glucose, 37.1% for fructose and 52.3% for sucrose. A first approach to
investigate possible sources for such large errors consisted of carrying out integration
measurements in the spectra of sugar solutions, in order to find out if the signals areas
correctly represented the known concentrations. The signals integrated were: 5.41 ppm for
sucrose, 5.23 ppm for ? -glucose, 3.24 ppm for ? -glucose and 4.11 ppm for fructose. PLS1
regression was applied to these signals areas taking into account the known sugars
concentrations. The values of RMSECV (%) obtained were: 2.1% for sucrose, 2.9% for ? -
and ? -glucose, and 1.8 % for fructose (3 latent variables used for each sugar). These values
are notably low, showing the good predictive power of this model and thus the correct
correspondence between the areas of the signals and the known concentrations. Therefore,
possible sources of error arising from sample preparation or from saturation effects in the
vicinity of the suppressed water signal may be discarded.
One of the critical factors known to affect the multivariate analysis of NMR data is
the alignment of the spectra, in which peak position may shift due to changes in pH,
concentration and/or temperature. In the case of the sugar solutions studied, small shifts of
about 0.004 ppm were found for some signals probably due to the
concentration/temperature effects rather than pH effects, since pH values fell between 6.9

Sugar Quantification in Mango Juice by Multivariate Analysis of FTIR and NMR Data
139
and 7.0, and the positions of the sugar signals are not expected to be affected by such small
pH variations. In order to mask these shifts, LB factors higher than 0.3 Hz were tentatively
employed for processing the spectra. Figure V.6 shows the 2.5-6.0 ppm region of the
spectrum of a sugar mixture processed with LB 0.3, 25, 50, 75 and 100 Hz and illustrates,
for the sucrose signal at 5.4 ppm, how the differences in peak position are masked.
a) b)
Figure V.6. a) 600 MHz 1H NMR spectrum of a ternary sugar mixture (solution 5 in Table V.1) processed with different LB factors (NS 64) and b) sucrose signal at 5.4 ppm in two sugar solutions spectra, processed with different LB’s.
3.03.54.04.55.05.5 ppm
LB 0.3 Hz
LB 25 Hz
LB 50 Hz
LB 75 Hz
LB 100 Hz
5.425.44 ppm
5.45.5 ppm
5.45.5 ppm
LB 0.3 Hz
LB 25 Hz
5.45.5 ppm
5.45.5 ppm
LB 50 Hz
LB 75 Hz
LB 100 Hz
suc suc ? -glc ?-glc ?-glc
fru

Chapter V
140
New PLS1 models were built for the sets of normalised spectra processed with LB
factors up to 100 Hz. Table V.4 shows the statistical parameters obtained. The prediction
errors (RMSECV %) significantly decrease for the sets processed with LB 25 and 50 Hz,
increasing again for higher LB values, probably due to the great loss of spectral
information. These results show that increasing the LB factor in order to mask spectral
shifts is a possible way to improve the predictive ability of a calibration model based on
NMR spectra of sugar standards, suggesting that low field instruments may be adequate for
this use. However, this matter requires further investigation, as the results are far from
optimum.
Table V.4. Statistical results of the application of PLS1 to the sets of NMR spectra processed with different LB factors.
Latent Variables RMSECV (%) LB 0.3 Hz
Fructose 5 37.1 Glucose 3 50.8 Sucrose 4 52.3
LB 25 Hz Fructose 6 13.5 Glucose 5 26.4 Sucrose 4 9.4
LB 50 Hz Fructose 5 12.4 Glucose 6 15.6 Sucrose 4 9.7
LB 75 Hz Fructose 7 13.9 Glucose 7 25.0 Sucrose 5 11.7
LB 100 Hz Fructose 3 36.7 Glucose 2 34.1 Sucrose 5 11.6
With basis on the lowest prediction errors, the set processed with LB 50 Hz was
chosen for building the calibration curves and for calculating the b vectors, shown in
Figure V.7, which were used to predict the amounts of each sugar in the juice samples.

Sugar Quantification in Mango Juice by Multivariate Analysis of FTIR and NMR Data
141
Figure V.7. b vectors obtained with the PLS1 model (4 latent variables for sucrose, 5 for fructose and 6 for glucose) applied on the normalised 1H NMR spectra (sugar region) of the standard sugar solutions.
Indeed, PCA of the sugar spectra showed that the scores distribution closer to the
triangular design was the plot obtained for the spectra processed with LB 50 Hz, shown in
Figure V.8a.
a)
b)
Figure V.8. PCA of the normalised 1H NMR spectra (sugar region) of the standard sugar solutions: a) Scores scatter plot of PC1 vs. PC2 and b) PC1 and PC2 loadings profiles.
Fru Glc
Suc 1
10
11
13
14 15 16
17
18
192
20
21
22
3 4
56
789
PC1 (68%)
PC
2 (3
1%)
21
22
-0.04
-0.02
0.00
0.02
0.04
0.06
2.93.43.94.44.95.4
Chemical Shift (ppm)
Load
ings
PC1 PC2
3.23
3.42 3.82
4.22
4.00 4.11
5.41

Chapter V
142
As expected, the single sugar solutions (samples 20, 21 and 22) are located at the
vertices of the ‘triangle’, with sucrose separated from glucose and fructose with basis on
PC2, and the two monosaccharides distinguished from each other by PC1. Indeed, the PC2
loadings profile (Figure V.8b) shows positive signals at positions corresponding to sucrose
(3.82, 4.22, 5.41 ppm), whereas the PC1 loadings profile (Figure V.8b) shows positive
values for glucose peaks (3.24, 3.42, 5.23) and negative values for fructose peaks (4.00,
4.11). However, the scores scatter plot in Figure V.8a is a poor version of the plot obtained
by PCA of the FTIR spectra (Figure V.3a).
V.4.2. Application to Mango Juices as a Function of Ripening
Although the PLS calibration model discussed in the previous section has large
prediction errors, it was applied to the 1H NMR spectra of mango juices, processed with
LB 50 Hz, in order to estimate the concentrations of the three sugars and compare them to
the values determined by enzymatic assays. The results of this exploratory quantification
are presented in Table V.5. For juices of days 1 and 5, the PLS1 and enzymatic values
show relatively good agreement, but for the samples of later ripening stages, large
discrepancies are noted. The prediction errors (RMSEP %) obtained are 25.5% and 32.3%
for glucose and fructose, respectively, and such high errors reflect the little accuracy of the
PLS-NMR method.
Table V.5. Concentrations (g/L) of the three sugars in mango juices at different ripening stages, predicted by PLS1-NMR and measured by enzymatic tests. The precision of the enzymatic tests was found to be 1.5-1.6% for each type of test employed, whereas the uncertainties of the PLS-NMR results are shown.
Ripening stage
Glucose Fructose Sucrose
PLS1 Enzymatic PLS1 Enzymatic PLS1 Enzymatic
Day 1 16.69 ±2.60 18.04 35.69 ±4.43 34.33 30.90 ±3.00 n.d.
Day 5 18.15 ±2.83 17.06 39.77 ±4.93 35.71 56.18 ±5.45 n.d. Day 9 6.72 ±1.05 10.10 26.21 ±3.25 46.23 64.46 ±6.25 n.d.
Day 11 2.73 ±0.43 1.62 37.36 ±4.63 42.82 113.82 ±11.04 n.d.
Day 15 2.85 ±0.44 0.87 18.73 ±2.32 39.19 66.61 ±6.46 n.d. Day 21 4.14 ±0.65 1.55 22.92 ±2.84 27.26 100.39 ±9.74 n.d.
n.d.: not determined

Sugar Quantification in Mango Juice by Multivariate Analysis of FTIR and NMR Data
143
The 1H NMR spectra of the juice samples processed with LB 50 Hz were also
analysed by PCA. The scores scatter plot of PC1 vs. PC2 is shown in Figure V.9a. As in
the case of the FTIR data (Figure V.5a), the juices collected at early ripening stages are
separated from the juices collected after day 9 along the PC1 axis, which explains 93% of
the total variability present in the NMR data. The PC1 loadings profile (Figure V.9b)
shows positive values at chemical shifts characteristic of sucrose and negative values at
positions corresponding to glucose and fructose, thus indicating that the observed
separation of samples is determined essentially by the proportions of these sugars: the
juices of days 9 to 23, with scores lying in the positive side of PC1, are characterised by
the predominance of sucrose, while the contributions of glucose and fructose are more
important in the juices of days 1 to 7.
a)
b)
Figure V.9. PCA of the normalised 1H NMR spectra (sugar region) of mango juices: a) Scores scatter plot of PC1 vs. PC2 and b) PC1 loadings profile.
day 9
day 7
day 5
day 3
day 23
day 21
day 19day 1
day 17
day 15
day 13
day 11
PC1 (93%)
PC
2 (5
%)
-0.04
-0.02
0
0.02
0.04
0.06
5.8
5.65
5.51
5.36
5.22
5.07
4.29
4.14 4
3.85
3.71
3.56
3.42
3.27
3.13
2.98
Chemical Shift (ppm)
Load
ings
3.82
4.22 5.41

Chapter V
144
V.5. Conclusions
The PLS-FTIR method, calibrated by a triangular model of standard sugar
solutions, has been shown to be suitable for the determination of sucrose, fructose and
glucose in mango juices obtained from fruits differing in ripening degree. Sucrose and
fructose were accurately quantified throughout the ripening process, whereas glucose
determination carried a prediction error of up to 25% after day 9. It was shown that the
FTIR spectrum of a juice may, in this way, be used as a rapid indicator of ripening degree,
particularly when pH and %SS of the fresh juice are not very sensitive to ripening degree
(after the mid-stages of ripening, as shown in Chapter IV.3.1) or when, in the case of
commercial juices, they are affected by other factors e.g. addition of pH regulators or
sweeteners. The present work refers to a particular mango cultivar, however, the method
and model developed should be applicable to other cultivars and possibly even to other
fruits, as long as the sucrose/glucose/fructose proportion is sensitive to ripening degree and
the sugar concentrations fall within the concentration ranges used in the sugar calibration
model. In any case, for a new system (fruit of different cultivar or type) the trends of sugar
variation should be characterised and the model concentration values checked/optimised.
On the other hand, the prediction errors obtained by the PLS-NMR method were
much higher. It was found that spectral alignment was determinant in the magnitude of
these errors and that increasing the line broadening factor used to process the spectra could
improve the predictive ability of the calibration model. Still, the results were far from
optimum and this matter requires further investigation.
References
Barros, A.S. Contribution à la sélection et la comparaison de variables caractéristiques. Ph.D. Thesis, Institut National Agronomique Paris-Grignon, France, 1999. Belton, P.S.; Delgadillo, I.; Holmes, E.; Nicholls, A.; Nicholson, J.K.; Spraul, M. Use of high-field 1H NMR spectroscopy for the analysis of liquid foods. Journal of Agricultural and Food Chemistry 1996, 44, 1483-1487. Cadet, F. Measurement of sugar content by multidimensional analysis and mid- infrared spectroscopy. Talanta 1999, 48, 867-875. Cadet, F.; Offmann, B. Direct spectroscopic sucrose determination of raw sugar cane juices. Journal of Agricultural and Food Chemistry 1997, 45, 166-171.

Sugar Quantification in Mango Juice by Multivariate Analysis of FTIR and NMR Data
145
Cho, S.I.; Bellon, V.; Eads, T.M.; Stroshine, R.L.; Krutz, G.W. Sugar content measurement in fruit tissue using water peak suppression in high resolution 1H magnetic resonance. Journal of Food Science 1991, 56, 1091-1094. Corradini, C.; Canali, G.; Nicoletti, I. Application of HPAEC-PAD to carbohydrate analysis in food products and fruit juices. Seminars in Food Analysis, 1997, 2, 99-111. Duarte, I.F.; Barros, A.; Delgadillo, I.; Almeida, C.; Gil, A.M. Application of FTIR spectroscopy for the quantification of sugars in mango juice as a function of ripening. Journal of Agricultural and Food Chemistry 2002, 50, 3104-3111. Garrigues, S.; Rambla, F.J.; de la Guardia, M. Comparative study of reflectance cells for PLS-FTIR determination of sugars in soft drinks. Fresenius Journal of Analytical Chemistry 1998, 362, 137-140. Hulme, A.C. The Mango. In The Biochemistry of Fruits and their Products; Hulme, A.C. Ed.; Academic Press: London, 1971; 233-254. Kemsley, E.K.; Wilson, R.H.; Poulter, G.; Day, L.L. Quantitative analysis of sugars solutions using a novel fiber-optic-based sapphire ATR accessory. Applied Spectroscopy 1993, 47, 1651-1654. Lee, H. S.; Coates, G. A. Quantitative study of free sugars and myo-inositol in citrus juices by HPLC and a literature compilation. Journal of Liquid Chromatography and Related Techniques 2000, 23, 2123-2141. Medlicott, A.P; Reynolds, S.B.; Thompson, A.K. Effects of temperature on the ripening of mango fruit (Mangifera indica L. var Tommy Atkins). Journal of the Science of Food and Agriculture 1986, 37, 469-474. Medlicott, A.P; Thompson, A.K. Analysis of sugars and organic acids in ripening mango fruits (Mangifera indica L. var Keitt) by high performance liquid chromatography. Journal of the Science of Food and Agriculture 1985, 36, 561-566. Mirouze, F. L.; Boulou, J.C.; Dupuy, N.; Meurens, M.; Huvenne, J.P.; Legrand, P. Quantitative analysis of glucose syrups by ATR/FT-IR spectroscopy. Applied Spectroscopy 1993, 47, 1187-1191. Ni, Q.X.; Eads, T.M. Analysis by proton NMR of changes in liquid-phase and solid-phase components during ripening of banana. Journal of Agricultural and Food Chemistry 1993, 41, 1035-1040. Pomeranz, Y.; Meloan, C.E.; Refractometry and Polarimetry. In Food Analysis; Pomeranz, Y.; Meloan, C. E. Eds.; Chapman & Hall: New York, 1994; 430-447. Rambla, F. J.; Garrigues, S.; Ferrer, N.; de la Guardia, M. Simple partial least squares-attenuated total reflectance Fourier transform infrared spectrometric method for the

Chapter V
146
determination of sugars in fruit juices and soft drinks using aqueous standards. Analyst 1998, 123, 277-281. Savitsky, A.; Golay, M.J.E. Smoothing and differentiation of data by simplified least squares procedures. Analytical Chemistry 1964, 36, 1627-1639. Tewari, J.; Joshi, M.; Gupta, A.; Mehrotra, R.; Chandra, S. Determination of sugars and organic acid concentration in apple juices using infrared spectroscopy. Journal of Scientific & Industrial Research 1999, 58, 19-24.

VI. STUDY OF SPOILAGE, HEAT TREATMENT AND MICROBIAL
CONTAMINATION IN MANGO JUICES BY NMR SPECTROSCOPY
VI.1 Introduction…………………………………………………………………………
VI.2. Materials and Methods……………………………………………………………..
VI.2.1. Sample Preparation…………………………………………………………..
VI.2.1.1. Culture of Microorganisms…………………………………………….
VI.2.1.2. Preparation of Spores Suspensions…………………………………….
VI.2.1.3. Preparation and Inoculation of Juices………………………………….
VI.2.2. Soluble Solids, pH and Enzymatic Determinations………………………….
VI.2.3. NMR Measurements…………………………………………………………
VI.3. Natural Mango Juice: Changes Upon Spoilage, Heat Treatment and
Microbial Contamination………………………………………………………………...
VI.3.1. Changes Assessed by Soluble Solids and pH………………………………..
VI.3.2. Changes Assessed by NMR Spectroscopy…………………………………..
VI.3.2.1. Effect of Natural Spoilage……………………………………………..
VI.3.2.2. Effect of Heat Treatment………………………………………………
VI.3.2.3. Effect of Inoculation with Penicillium expansum……………………..
VI.4. Commercial Mango Juice: Changes Upon Microbial Contamination……………..
VI.4.1. Changes Assessed by Soluble Solids and pH………………………………..
VI.4.2. Changes Assessed by NMR Spectroscopy…………………………………..
VI.4.2.1. Effect of Inoculation with Penicillium expansum……………………...
VI.4.2.2. Effect of Inoculation with Neosartorya fischeri……………………….
VI.5 Conclusions…………………………………………………………………………
References………………………………………………………………………………..
148
150
150
150
150
151
152
152
153
153
154
154
163
164
170
171
172
172
177
181
183

Chapter VI
148
VI.1. Introduction
Microbial growth in fruits and fruit products is a serious concern, as it may cause
decay, loss of nutritive and organoleptic properties and production of toxic substances. The
low pH of fruits is the major factor that influences the composition of their microflora. In
general, most yeasts and moulds grow well under acid conditions, and thus fungi are often
the predominant microorganisms in fruit products, while only a few bacteria are
sufficiently aciduric to be important (Frazier and Westhoff, 1988; Splittstoesser, 1996).
The traditional methods of detecting microbial growth in fruit and fruit products
consist of platting procedures based on culturing the fruit sample in adequate medium,
incubating and counting the microbial populations after 3-5 days. This is often too long for
quality control management to initiate prompt corrective action if product contamination is
detected. Therefore, research efforts have focused on developing more rapid methods for
detecting microbial contamination. Examples of these methods are the bioluminescent
procedure that measures the quantity of adenosine triphosphate (ATP) in living yeasts
(Littel and LaRocco, 1986), the impedimetric detection, which correlates the microbial
population with the time required to produce a change in impedance (Schaertel et al.,
1987), and some specific imunoassays (Lin et al., 1986; Notermans et al., 1992). Another
approach is to detect specific metabolic products of microorganisms. For instance, the
degree of mouldiness in grapes may be related to the glycerol content of the must, and the
amounts of ethanol have long been used to monitor yeast growth in bulk-stored grape juice
(Splittstoesser, 1996). Acetylmethyl carbinol (acetoin) and diacetyl are suggested to be
indicators of the growth of various fungi and certain bacteria, conferring characteristic off-
flavours to the contaminated fruit products (Singhal et al., 1997). Organic acids are also
indicators of microbial growth. Succinic, acetic, formic and lactic acids have been found to
be produced in tomatoes by mould and bacteria, whereas citric acid has been seen to
disappear (Singhal et al., 1997). The pattern of volatile amines in apple fruits has also been
reported to be a good indication of contamination by different moulds. It has been
observed that butylamine and isobutylamine, not present in healthy fruits, occur in
contaminated ones and could therefore be used as an index of mould contamination
(Singhal et al., 1997). Another common response of plant tissue to infection by
microorganisms is an increase in the synthesis of characteristic phenolic compounds
(Singhal et al., 1997).

Study of Spoilage, Heat Treatment and Microbial Contamination in Mango Juices by NMR Spectroscopy
149
High resolution NMR spectroscopy has been shown to be a powerful method for
the elucidation of metabolic pathways of microorganisms. In particular, the technique has
been applied to study the metabolism of lactic acid bacteria, which are involved in wine
fermentation, through in vivo 1H, 13C and 31P NMR experiments that provide information
on metabolite levels and fluxes through metabolic pathways (Santos, 1995; Ramos and
Santos, 1999). The strength of applying NMR towards this aim resides on its non-
destructive nature and its broad screening capability, i.e. the ability to simultaneously
detect a wide range of species and potentially enable the identification of novel,
unexpected compounds.
The work presented in this Chapter makes use of high resolution NMR to follow
the compositional changes of natural and commercial mango juice subject to natural
spoilage and to inoculation with two moulds; the effect of heat treatment on a natural juice
is also investigated to a lesser extent. Indeed, the principal aim of the work described here
is to explore the potential of the technique to detect and identify indicators of spoilage,
either occurring naturally or caused by specific microorganisms. The natural juice prepared
from fresh mangoes was tested for the effects of spoilage (resulting from chemical,
enzymatic and/or microbial processes), heat-treatment, and deliberate contamination with
spores of Penicillium expansum. This mould is the most common apple-rotting fungus and
can be commonly found in the processing lines of fruit products. It infects the intact fruit
through the wounds caused during handling and packing operations and is responsible for
high postharvest losses. Moreover, although P. expansum is destroyed by the pasteurisation
treatment given to the juices or other fruit products, it produces the mycotoxin patulin,
which is resistant to thermal destruction between pH 3.5 and 5.5, and thus may be present
in pasteurised products, constituting a health concern (Splittstoesser, 1996). The effect of
microbial contamination was also investigated for a commercial juice, in order to evaluate
its susceptibility to spoilage after the processing treatment given at the industrial scale. For
this purpose, P. expansum and a second mould, Neosartorya fischeri, have been used to
inoculate the juice. The choice of the N. fischeri was based on the knowledge that this
mould is heat resistant, thus, in many instances, surviving the commercial pasteurisation
treatment given to most fruit products (e.g. 90ºC, 3 minutes) and being able to induce
spoilage by germination and subsequent outgrowth during storage. There are a few studies
reporting the presence of this fungus in processed juices (Obeta and Ugwuanyi, 1995), and

Chapter VI
150
investigating its thermal resistance in fruit products, by determining the number of spores
that survive heat treatment at various temperatures (Beuchat, 1986; Rajashekhara et al.,
1998; Rajashekhara et al., 2000). Moreover, the growth of N. fischeri on mango, orange
and pineapple juices has been monitored by microbial counts and by observing the changes
in the juices colour, odour and body (Obeta and Ugwuanyi, 1997). However, the
information on the compositional changes induced by this mould is scarce, and the present
work aims at identifying possible chemical indicators of the N. fischeri growth on a
processed juice, in particular, mango juice.
VI.2. Materials and Methods
VI.2.1. Sample Preparation
VI.2.1.1. Culture of Microorganisms
The mould Penicillium expansum used in this study was kindly provided by the
‘Instituto Nacional de Engenharia e Tecnologia Industrial’, in Lisbon, from its culture
collection (strain 310 isolated from apple juice). The mould Neosartorya fischeri was
purchased from DSMZ (‘Deutsche Sammlung von Mikroorganismen and Zellkulturen
GmbH’) culture collection (strain DSM 3700). Both cultures were maintained on slants of
freshly prepared potato dextrose agar (PDA) and stored at 4ºC until used.
VI.2.1.2. Preparation of Spores Suspensions
In order to produce sufficient mature spores, P. expansum and N. fischeri cultures
were inoculated into slants of PDA and incubated at 25-28 ºC for 5 and 20 days,
respectively. For each mould, spores were harvested from the slants by flooding with 5-6
ml of sterile deionised water containing 0.1% Tween 80 and collecting the aliquots to an
Erlenmeyer flask, until 20-30 ml were obtained. A 10 minutes sonication treatment was
followed by filtration of the suspension through sterile glass wool to remove hyphal
fragments. Microscopic examination of the filtrate revealed free spores. Each suspension
was then diluted to give spores concentrations of 106/ml, 105/ml and 104/ml, measured by
using a Newbauer chamber for counting spores. The spores of heat-resistant moulds are in
a state of dormancy which requires heat treatment to induce germination. Therefore, the N.

Study of Spoilage, Heat Treatment and Microbial Contamination in Mango Juices by NMR Spectroscopy
151
fischeri suspension was activated by heating a 10 ml portion, in a screw capped test tube, at
70ºC for 1 hour in a water bath, as described by Obeta and Ugwuanyi (1997).
VI.2.1.3. Preparation and Inoculation of Juices
Natural Mango Juice: Ripe edible mangoes of the cultivar Haden grown in Brazil
were used for this study. The fruits were washed, peeled and their pulps macerated in a
domestic juice extractor. The resulting puree was centrifuged (at 15000 r.p.m. during 15
minutes) to give the juice. Aliquots of 20.0 ml were poured into 27 sterile bottles of 100
ml, which were treated/stored in the following conditions: one group of 6 bottles was
stored at 25ºC without any treatment, in order to follow the changes occurring during
natural spoilage of the juice, while the other bottles were heat-treated in a water bath at
80ºC during 15 minutes, in order to eliminate most of the natural microflora existing in the
juice (Ejechi et al., 1998), similarly to the pasteurisation treatment commonly applied at
industrial level; five of these bottles containing heated juice were then stored under
refrigeration (4ºC) for maximum preservation and other six were stored at 25ºC. The
remaining 10 bottles of heat-treated juice were inoculated with spores of P. expansum, in
order to investigate the changes induced by this mould in the juice composition: 5 bottles
were inoculated with 0.500 ml of suspension containing 105 spores per ml, and 5 bottles
were inoculated with 0.500 ml of suspension containing 104 spores per ml, to give spores
concentrations in the juice of about 2500/ml (batch A) and 250/ml (batch B), respectively.
During a period of 132 hours (5.5 days), one bottle was withdrawn every 24 hours
from each group and the juice samples prepared. The juice was filtered through a glass
microfiber filter under vacuum and through a 0.45 ? m filter with a syringe, and both pH
and soluble solids (%SS) were measured. For NMR analysis, the filtered juice was mixed
with a solution of D2O containing 3-(trimethylsilyl)propionate sodium salt (TSP) and
sodium azide (NaN3), in order to give samples with 10% D2O (field-frequency lock),
0.02% TSP (chemical shift and intensity reference) and 0.05% NaN3 (to prevent microbial
growth in the stored samples). The pH of the juices was adjusted to 7.00?0.05 with
microliter amounts of sodium hydroxide solutions (NaOH 3M, 1M, 0.1M), in order to
reduce pH-related shifts in the positions of NMR signals. The juice samples were frozen in
liquid nitrogen and stored at –20ºC until the NMR measurements.

Chapter VI
152
Commercial Mango Juice: One-litre packages were aseptically opened and their
contents dispensed into sterile flasks of 4L capacity to have 2L of juice in each flask
(plugged with cotton). For each experiment, one flask was used as control (juice without
inoculation) and inoculation was performed on the second flask. For the experiment with
Penicillium expansum, 1.00 ml of spore suspension (106/ml) was inoculated into 2L of
juice to give approximately 500 spores per ml. For the experiment with Neosartorya
fischeri, the flasks were heated in a water bath at 75ºC for 15 minutes and one flask
containing 2L of juice was inoculated with 1.00 ml of the heat-activated spores suspension
(106/ml), to give 500 spores per ml.
All the flasks were stored at 25ºC, during 310 hours (13 days) for the experiment
with P. expansum and during 465 hours (24 days) for the experiment with N. fischeri. At
regular time intervals, 25 ml samples of juice were withdrawn, centrifuged (15000 r.p.m.,
15 min), filtered through a glass microfiber filter under vacuum and through a 0.45 ? m
filter with a syringe, and both pH and %SS were measured. The filtered juices were frozen
in liquid nitrogen and stored at –20ºC until the NMR measurements. The preparation of
samples for NMR consisted of adding D2O containing TSP and NaN3.
For additional information on the commercial juice, the composition shown on the
package label (per 100 ml of juice) follows: 10 g sugars, 0.1 g proteins, traces of lipids and
30 mg vitamin C (ascorbic acid).
VI.2.2. Soluble Solids, pH and Enzymatic Determinations
The soluble solids (%SS) were measured by refractometry, using an Atago hand
refractometer (accuracy ?0.2%) and the pH values were measured using a Hanna pH meter
(precision ?0.01). Sucrose, glucose and fructose were quantified enzymatically for a
selected set of samples (commercial juices only), using enzymatic tests purchased from
Boehringer Mannheim (cat. no. 716260).
VI.2.3. NMR Measurements
The NMR spectra of natural juices were recorded on a Bruker Avance DRX-600
spectrometer, operating at 599.87 MHz for proton and 150.85 MHz for carbon, while the
spectra of commercial juices were recorded on a Bruker Avance DRX-500 spectrometer,
operating at 500.13 MHz for proton and 125.77 MHz for carbon. Typically, each 1H 1D

Study of Spoilage, Heat Treatment and Microbial Contamination in Mango Juices by NMR Spectroscopy
153
spectrum consisted of 64 scans of 65536 data points with a spectral width of 12019.23 Hz,
an acquisition time of 2.73 s, and a relaxation delay of 7 s. A presaturation sequence was
used to suppress the water signal by applying low-power selective irradiation at the water
frequency during 3 s of the relaxation delay (pulse program ‘zgcppr’). All the FIDs were
Fourier transformed with 0.3 Hz line broadening, phased and baseline corrected using the
Bruker XWIN-NMR software. TOCSY spectra were also recorded for a few samples to aid
spectral assignment.
VI.3. Natural Mango Juice: Changes Upon Spoilage, Heat Treatment and
Microbial Contamination
VI.3.1. Changes Assessed by Soluble Solids and pH
The variations of soluble solids (%SS) and pH in natural mango juice submitted to
different treatments and storage conditions are shown in Figures VI.1a and VI.1b,
respectively. The %SS showed an increasing trend dur ing storage of the non-treated juice
and of the not inoculated heated juices. The increase from 14.1 to 15.8% noted by heating
the juice may simply reflect some water evaporation. On the other hand, hardly any change
is observed for the inoculated juices. The pH did not vary much in heated juices stored
either at 25 or 4ºC, but decreased for the juice naturally spoiled and for the juices
inoculated with P. expansum. As it will be shown later, this decrease in pH should be
related to the accumulation of several organic acids in the spoiled and contaminated juices.
Changes in the juice colour have also been registered: the colour of the non-treated
juice was seen to change from yellow to light brown in the first 36 hours of storage and to
darken until the end of the experiment time; moreover, from 36 hours onwards, the juice
presented small particles in suspension; heat treatment was seen to cause a slight darkening
of the yellow colour at the time of heating, but the heated juices did not subsequently
change in appearance during storage; on the other hand, after 84 hours, the inoculated
juices presented a lighter colour and a higher viscosity than the control juice stored in the
same conditions, these changes being more marked in the juice of batch A, inoculated with
higher spores concentration.

Chapter VI
154
a) b) Figure VI.1. Variation of a) %SS and b) pH in natural mango juices submitted to different treatments/storage conditions: (?) non-treated juice stored at 25ºC, (?) heated juice stored at 25ºC, (? ) heated juice stored at 4ºC, (¦ ) batch A of heated and inoculated juice (spores cc. 2500/ml), stored at 25 ºC and (? ) batch B of heated and inoculated juice (spores cc. 250/ml), stored at 25 ºC. VI.3.2. Changes Assessed by NMR Spectroscopy
VI.3.2.1. Effect of Natural Spoilage
Figures VI.2a, VI.5a and VI.6a show, respectively, the high-field, mid-field and
low-field regions of the 1D spectra of the non-treated juices, freshly prepared (time 0), and
after storage during 132 hours, the final time of the experiment. Many differences may be
observed in the whole spectral range, reflecting drastic changes in the juice composition
upon natural degradation. These changes may have many different sources, since many
types of chemical, enzymatic and microbial processes are expected to occur, and, hence,
the biochemical interpretation of the spectral changes is obviously very difficult due to the
high complexity of the system and the great diversity of reactions and metabolic pathways
present. Table VI.1 summarises the spectral changes observed within the period of the
experiment and the time when they are first noted. Some of the signals that vary are still
unassigned and, in cases for which the corresponding spin systems were identified in the
TOCSY spectra, this is indicated on Table VI.1. The most significant variations are
discussed in the following paragraphs. In the case of some major compounds, a semi-
quantitative study has been carried out through integration of the 1D spectra. For a given
signal, the areas measured at different storage times have been divided by the area
measured in the time 0 spectrum, thus providing the magnitude of variation of that signal
from time 0 to the end of the experiment.
12.0
13.0
14.0
15.0
16.0
17.0
18.0
0 24 48 72 96 120 144
Storage Time (hours)
% S
S
3.5
4.0
4.5
5.0
5.5
6.0
0 24 48 72 96 120 144
Storage Time (hours)
pH

Study of Spoilage, Heat Treatment and Microbial Contamination in Mango Juices by NMR Spectroscopy
155
Table VI.1. Changes in the 1H NMR spectra of non-treated mango juice, after storage at 25ºC during 132 hours; (*) possibly 3,4,5-trihydroxyciclohexane carboxylic acid; (a) tentative identification; (b) additional information provided in Figure VI.5b; the values in square brackets correspond to other chemical shifts belonging to the same spin system. Compound undergoing change ? 1H ppm (multiplicity) Type of variation
? : increase ? : decrease
Time when variation is first noted
High-field region (0-3 ppm) Acetate 1.92 (s) ? 36 h Acetoin 1.37 (d) 2.22 (s) 4.42 ? 36 h Alanine 1.47 (d) 3.79 ? 36 h Cyclic acid (*) 1.38 1.62 1.99 2.13 2.58 3.43
3.79 4.13 Appears 36 h
Isoleucine 0.93 (t) 1.00 (d) ? 36 h Isopropanol / 2,3-butanediol 1.14 (d) 3.67 ? 36 h Lactic acid 1.32 (d) 4.12 ? 36 h Leucine 0.95 (t) 1.72 ? 36 h Quinic acid 1.87 195 2.06 3.55 4.02 4.14 ? 36 h Shikimic acid 2.19 2.77 3.70 3.98 4.40 6.45 ? 36 h Succinic acid 2.41 (s) ? 36 h Valine 0.98 (d) 1.04 (d) ? 36 h Unassigned: 1 2.96 (s) ? 36 h Mid-field region (3-5.5 pm) Fructose 4.11 (b)
Glucose 4.64, 5.23 (b) Sucrose 5.41 (b) Unassigned: 1 4.90 ?3.95? Appears 60 h 2 4.96 ?3.75 4.01? Appears 60 h 3 5.37 ?3.59 3.77 4.02? Appears 60 h Low-field region (5.5-10 ppm) Acetaldehyde 9.67 Disappears 36 h Adenine / Adenosine (a) 8.30 (s), 8.31 (s), 8.35 (s), 8.38 (s) Disappear 36 h Adenosine (ribose moiety) (a) 6.07 (d) ?4.43? Disappears 36 h Catechol (a) 6.86 6.94 Appears 60 h Fumaric acid (a) 6.52 (s) Disappears 36 h Gallic acid (a) 7.04 (s) Disappears 36 h Nicotinamide 7.57 8.27 8.63 8.96 Disappears 36 h NAD+ 8.99 9.09 9.34 Appears 36 h Shikimic acid 6.45 ? 36 h Tyrosine 6.89 (d) 7.19 (d) Disappears 36 h Uracil (a) 5.80 (d) 7.54 (d) ? 36 h Unassigned: 1 6.11 (d) ?3.77 4.35? ? 36 h 2 7.24 (s) Disappears 36 h

Chapter VI
156
In the high-field region (Figure VI.2a), prominent increases are detected for several
signals, namely the doublet at 1.14 ppm (which shows a TOCSY correlation to 3.67 ppm,
and may arise from isopropanol or from 2,3-butanediol), the lactic acid doublet (1.32
ppm), the singlet at 1.92 ppm assigned to acetate, the signals of acetoin (1.37 ppm doublet
and 2.22 ppm singlet), and the singlet at 2.41 ppm attributed to succinic acid with basis on
the shift of this peak with the variation in the sample’s pH. Other compounds like pyruvic
acid, diacetyl and oxaloacetic acid may also originate a singlet at about 2.4 ppm but show a
lower sensitivity to pH changes, and thus the assignment to succinic acid is favoured. The
quantitative variation of these compounds is shown in Figure VI.2b. The largest increase is
registered for the signal at 1.14 ppm arising from isopropanol/2,3-butanediol (100 times/84
hours). Acetate increases 25 times/132 hours, while lactic acid, acetoin and succinic acid
increase 18 times/84 hours, 10 times/84 hours and 6 times/84 hours, respectively.
All the compounds indicated above are typical products of different types of
fermentation, possibly undergone by the microorganisms present in the juice. To illustrate
this, Figure VI.3 shows the wealth of products that may result from the bacterial
fermentation of glucose. The extension of each metabolic flux and the proportions of the
products formed depend on the nature of the microorganisms present and on a number of
factors such as aeration, pH, temperature and water activity. In the case of our experiment,
the formation of acetoin, isopropanol/2,3-butanediol, acetate, lactic acid and succinic acid
have been favoured, in detriment of other fermenting pathways like those producing
ethanol. Indeed, the alcoholic fermentation that is typical of yeasts does not seem to be
important here since ethanol is not accumulated in significant quantities (Figure VI.2b).
Other changes in the high-field region of the spectra (Figure VI.2a) regard the
decrease of some amino acids, namely valine, leucine, isoleucine and alanine, and of the
acids quinic and shikimic, which progressively decrease to residual amounts. Interestingly,
the marked decrease of these organic acids is accompanied by the formation of a new
compound, not present in the initial juice, which gives rise to the signals marked with
arrows in Figure VI.2a. Besides this group of resonances (1.38, 1.62, 1.99, 2.13, 2.58
ppm), the spin system of the new compound includes signals at 3.43, 3.79 and 4.13 ppm, as
shown by the TOCSY expansion in Figure VI.2c, where dashed lines highlight the
identified correlations. The observed spin system is consistent with the structure shown in

Study of Spoilage, Heat Treatment and Microbial Contamination in Mango Juices by NMR Spectroscopy
157
a)
0 hours
132 hours
b) c)
Figure VI.2. a) High-field region of the 600 MHz 1H NMR spectra of non-treated natural mango juice, freshly prepared (time 0) (top spectrum) and after storage during 132 hours (bottom spectrum), NS 64. The arrows indicate the signals of the new cyclic acid formed (see Figure VI.4); b) Relative variation of some compounds determined by integration of NMR signals (At = area at time t, A0 = area at time 0): ethanol-1.17 ppm, acetoin-2.22 ppm, lactic acid-1.32 ppm, acetate-1.92 ppm, succinic acid-2.41 ppm and isopropanol/2,3-butanediol-1.14 ppm; c) Expansion of the TOCSY spectrum of the non-treated juice stored for 132 hours, where the spin system of the new cyclic acid is highlighted by dashed lines.
ppm
1.01.52.02.5 ppm
2
3
4
1.01.21.41.61.82.02.22.42.62.83.0 ppm
Isopropanol / 2,3-butanediol
Lactic
Acetoin
Succinic Acetate
Ala EtOH
TSP
Quinic
Shikimic
0
5
10
15
20
25
30
0 24 48 72 96 120
Storage Time (hours)
Mag
nitu
de o
f Var
iatio
n
0
20
40
60
80
100
120
Mag
nitu
de o
f Var
iatio
n (Is
opro
pano
l)
Ethanol Acetoin Lactic
Acetic Succinic Isopropanol
At /
A0
At / A
0 1.14 ppm
Isoprop./2,3-But. Acetate

Chapter VI
158
Figure VI.4, corresponding to 3,4,5-trihydroxyciclohexane carboxylic acid (or to a similar
structure substituted in the hydroxyl groups). The similarity of the proposed structure with
the structures of quinic and shikimic acids (also shown in Figure VI.4) suggests that the
variations of these compounds may indeed be correlated. However, the nature of the
reactions occurring is, at this stage, not known. Specific enzymes (naturally present in the
juice or carried by microorganisms) might be involved, since the conversion of either
quinic or shikimic acids to the new cyclic acid is not expected to occur spontaneously. In
addition, one may also speculate that quinic and shikimic acids may be inter-converted,
with basis on the scheme shown in Figure VI.4, where several enzymes (identified in the
enzymatic complex of plants, bacteria, fungi and yeasts) are involved (Dewick, 1998).
Figure VI.3. Diagram illustrating the major fates of pyruvate in various bacterial fermentations of glucose (Morris, 1985).
Pyruvate
Acetyl-CoA
2HCO2
Acetyl-phosphate
AcetateATPADP
AcetaldehydeAcetolactate
Acetoin
Lactate
Oxaloacetate
Ethanol
Malate
Fumarate
Succinate
Propionate
2,3-butanediolFormate + Acetyl-CoA + H2 + CO2
Acetoacetyl-CoA
Acetoacetate
Acetone
Isopropyl alcohol
Crotonyl-CoAAcetate
Acetylphosphate
Acetaldehyde Ethanol
? -Hydroxybutyryl-CoA
Butyryl-CoA
Butyraldehyde
n-Butyl alcohol Butyrate
2H
2H
2H
2H
2H
2H
2H
2H
H2O
CO2
2H
CO2 H2O
2H
CO2
2H
CO2
ATPADP
ATPADP
CoAPi
CoA
CoA
CoA
CoA
Pi

Study of Spoilage, Heat Treatment and Microbial Contamination in Mango Juices by NMR Spectroscopy
159
a)
b)
Figure VI.4. a) Scheme showing a possible pathway for the inter-conversion of quinic and shikimic acids (adapted from Dewick, 1998). The enzymes involved are: (i) shikimate dehydrogenase, (ii) 3-dehydroquinate synthase, (iii) quinate dehydrogenase; b) structure proposed for the new cyclic acid formed upon spoilage of natural mango juice (3,4,5-trihydroxyciclohexane carboxylic acid).
The mid-field regions of the spectra are shown in Figure VI.5a. Although no
significant changes are seen in the profile of the major sugars, some quantitative variation
is noted, as shown in Figure VI.5b. Relatively to the initial contents (0 hours), sucrose
decreases while glucose and fructose increase. In order to better evaluate the real
magnitude of these variations, the approximate absolute concentrations of each sugar
expected to be present in the initial juice should be considered. These concentrations were
not measured but may be estimated with basis on the values reported for ripe mango juice
in Chapter IV.3.2.2: sucrose ~140 g/L, fructose ~45 g/L and glucose ~3 g/L. With basis on
these values, the sugars variation upon spoilage may be represented in terms of
approximate concentrations, as shown in Figure VI.5c. From 0 to 132 hours of storage,
sucrose decreases ~45 g/L, while ~20 g of fructose and ~3 g of glucose are accumulated.
These numbers suggest that sucrose is hydrolysed into fructose and glucose and that most
glucose is metabolised, since only a small amount of this sugar is accumulated, resulting
from the balance between its production (from sucrose hydrolysis) and its utilization. The
glucose catabolism is likely to be related to the accumulation of the typical fermentation
products identified in the aliphatic region of the juice spectra.
(i)
COOH
OH
OHO
OH
OHO
HO COOH
COOH
HO
OH
OH
OH
OH
HO COOH
HO
COOH
HO
OH
OH
Quinic acid Shikimic acid
3,4,5-Trihydroxyciclohexane carboxylic acid
(ii)
(iii)
3-Dehydroquinic 3-Dehydroshikimic

Chapter VI
160
In addition to the major sugars variations, other changes detected in the same
spectral region concern the appearance of signals at 4.90, 4.96 and 5.37 ppm,
corresponding to the formation of new carbohydrates in the juices stored for more than 60
hours. Their corresponding spin systems are listed in Table VI.1. The broad nature of the
new signals at 4.90 and 4.96 ppm (compounds 1 and 2 shown by the insert in Figure VI.5a)
suggests that the carbohydrates formed consist of relatively large molecules.
a)
0 hours
132 hours
b) c)
Figure VI.5. a) Mid-field region of the 600 MHz 1H NMR spectra of non-treated natural mango juice, freshly prepared (time 0) (top spectrum) and after storage during 132 hours (bottom spectrum), NS 64. The peak numbers correspond to unassigned carbohydrates listed in Table VI.1; b) Relative variation of sugars determined by integration of NMR signals (At = area at time t, A0 = area at time 0): glucose-5.23 ppm, fructose-4.11 ppm and sucrose-5.41 ppm; c) Variation of sugars in terms of absolute concentrations, estimated with basis on the values expected to be present in ripe mango juice at time 0 (see text).
0
0.5
1
1.5
2
2.5
3
0 24 48 72 96 120
Storage Time (hours)
Mag
nitu
de o
f Var
iatio
n
Glc Fru Suc
At /
A0
0
20
40
60
80
100
120
140
160
0 24 48 72 96 120
Storage Time (hours)
Est
imat
ed c
c. (g
/L)
Glc Fru Suc
3.43.63.84.04.24.44.64.85.05.25.4 ppm
5.05.15.25.3 ppm
5.05.15.25.3 ppm
Glc
1 2
Suc
Pectic galA

Study of Spoilage, Heat Treatment and Microbial Contamination in Mango Juices by NMR Spectroscopy
161
In the low-field region, there are many differences between the spectra of juices
collected at different storage times, as summarised in Table VI.1 and illustrated in Figure
VI.6a for the extreme times. Several signals are seen to decrease/disappear in the spectrum
of the spoiled juice, while others are seen to increase/appear. The assignment of most
signals is not straightforward either because they show no TOCSY correlations (e.g.
singlets proposed to belong to fumaric and gallic acids) or because they may arise from
molecules with similar structures. For instance, the singlets between 8.3 and 8.4 ppm,
which are seen to disappear, may correspond to protons H2 and H8 of adenine or of an
adenosine system, either free or as part of adenosine mono-, di-, or tri-phosphate molecules
(Figure VI.6b), but a more certain assignment is not possible only with basis on the 1D and
TOCSY spectra. The disappearance of these singlets is accompanied by the disappearance
of the small doublet at 6.07 ppm (spin system 4.43, 6.07), which may arise from a ribose
moiety of an adenosine system. Other interesting changes regard the disappearance of the
spin system comprising the signals at 7.57, 8.27, 8.63 and 8.96 ppm, concomitantly with
the appearance of the system 8.99, 9.09 and 9.34 ppm. The former may arise from
nicotinamide, while the latter is assignable to NAD+ (nicotinamide adenine dinucleotide)
(structures shown in Figure VI.6b). Nicotinic acid (niacin), on the other hand, shows no
significant variation. Additional changes in the aromatic region of the spectra consist of
decreases in shikimic acid, already noted in the aliphatic region of the spectra, tyrosine,
uracil and acetaldeyde signals. On the other hand, a significant increase is noted for the
unassigned doublet at 6.11 ppm probably arising from a sugar moiety (compound 1 in
Figure VI.6a), and for the multiplets at 6.86 and 6.94 ppm arising from an aromatic ring,
possibly catechol.
Regarding the timing of the changes viewed by NMR, it is noted that most of them
have been observed at 36 hours of storage. During that period, the juice also changed its
colour and a small increase in the soluble solids content was already noticed. Therefore, in
order to better evaluate the ability of high resolution NMR to detect indicators of natural
spoilage earlier than simpler methods, collection and analysis of samples between 0 and 36
hours of storage would be required. However, these results have already been useful to
demonstrate the complex amalgam of compositional changes that NMR is able to detect
and identify.

Chapter VI
162
a)
0 hours
132 hours
b)
Figure VI.6. a) Low-field region of the 600 MHz 1H NMR spectra of non-treated natural mango juice, freshly prepared (time 0) (top spectrum) and after storage during 132 hours (bottom spectrum), NS 64. Peak no. 1 corresponds to an unassigned compound (?’s listed in Table VI.1); b) Structures of some compounds undergoing changes in the low-field region of the spectra.
N
NN
N
NH2
O
OHOH
HH
H
CH2
H
OP
O-
O
OP
O
O-
OP
O-
O
O-
Adenosine
AMP
ADP
ATP
NH
C
O
NH2
+
Nicotinamide
N
C
O
NH2
+
Ribose P P Ribose
Adenine
Nicotinamide Adenine Dinucleotide (NAD+)
1
6.57.07.58.08.59.09.5 ppm
Catechol
NAD+
Acetaldehyde
Shikimic
Nicotinamide Uracil
Fumaric
Tyr
Adenosine systems

Study of Spoilage, Heat Treatment and Microbial Contamination in Mango Juices by NMR Spectroscopy
163
VI.3.2.2. Effect of Heat Treatment
The spectra of non-treated and heat-treated juices collected at time 0 are generally
similar, showing that the heat treatment applied (80ºC, 15 min) does not cause drastic
changes in the juice composition. However, there are some differences to point out in the
low-field region of the spectra, indicated with arrows in Figure VI.7. Acetaldehyde
disappears (due to evaporation) and so do the signals tentatively assigned to uracil and to
an adenosine system, and the unassigned signals at 6.11 (spin system 3.77, 4.35, 6.11 ppm)
and 7.28 ppm. On the other hand, a uridine system is detected in the heat-treated juice.
a) non-treated juice
b) heat-treated juice
Figure VI.7. Low-field region of the 600 MHz 1H NMR spectra (NS 64) of a) non-treated natural mango juice and b) the same juice immediately after heat treatment (80ºC, 15 min). The arrows indicate signals undergoing changes.
In what regards the changes in the composition of the heat-treated juice during
storage at 25ºC, only a few changes are noted, namely in the low-field region of the spectra
(marked with arrows in Figure VI.8). In the juice stored at 25ºC, tyrosine, the singlet at
7.04 ppm (possibly gallic acid), and the singlet at 7.24 ppm (unassigned) are seen to
gradually decrease and disappear. In the juice stored at 4ºC, tyrosine and the singlet at 7.24
ppm decrease at a lower rate than in the juice stored at 25ºC, and are still detected at the
final time of the experiment.
Acetaldehyde Adenosine Uracil
6.57.07.58.08.59.09.5 ppm
Uridine + other
Uridine

Chapter VI
164
These results confirm the effectiveness of heat treatment in preserving the
composition of the juice, especially if refrigerated storage is employed, since almost all the
changes seen to occur throughout storage of the non-treated juice (described in the
previous section) have been prevented in the heated juice. Therefore, since the heated juice
practically doesn’t change its composition over time, it may be taken as ‘control’ for
evaluation of the changes caused by the presence of the mould P. expansum (inoculated
after heat-treatment), discussed in the following section. Indeed, these changes can be
assumed to be due specifically to the P. expansum growth, since the natural juice
microflora has been eliminated by heating the juice prior to inoculation.
a) 0 hours
b) 132 hours (25ºC)
c) 132 hours (4ºC)
Figure VI.8. 600 MHz 1H NMR spectra (6.7-7.7 ppm region) of heat-treated natural mango juices collected at time 0 (a) and after 132 hours of storage at 25ºC (b) and at 4ºC (c); NS 64. The arrows indicate signals undergoing changes.
VI.3.2.3. Effect of Inoculation with Penicillium expansum
The changes induced by P. expansum growth were followed by recording 1H NMR
spectra of the juices collected at different times after inoculation, in order to find out which
features may be pointed out as indicators of the natural juice contamination. The
magnitude of variation of some major compounds has been determined by signal
integration, as described in section VI.3.2.1.
Figures VI.9, VI.10 and VI.11 show, respectively, the high-field, mid-field and
low-field regions of the 1D spectra of the control juice and of the juice inoculated with
6.97.07.17.27.37.47.57.6 ppm
Tyr Tyr Gallic acid

Study of Spoilage, Heat Treatment and Microbial Contamination in Mango Juices by NMR Spectroscopy
165
2500 spores/ml (batch A), after 132 hours of storage. It is important to stress that the
control juice showed only minor variations over time in the aromatic region of the spectra,
as described in the previous section. The spectral variations in the contaminated juices are
summarised in Table VI.2. The data shown refers to the juices of batch A, but it has been
observed that the juices of batch B, inoculated with smaller spores concentration (250
spores/ml) show the same qualitative changes, occurring at a slower rate. In the following
paragraphs, the most prominent changes observed in the different spectral regions are
discussed sequentially.
In the high-field region (Figure VI.9a), the signals for which most significant
increases are noted arise from isopropanol/2,3-butanediol, lactic acid, acetoin, acetate and
succinic acid, similarly to the changes registered for natural spoilage (Figure VI.2a).
However, the magnitude of these increases is now different, reflecting differences in the
metabolic processes that lead to the formation of these products. The largest accumulations
in the juices contaminated with P. expansum are observed for acetoin (120-160 times/84
hours), lactic acid (85-95 times/60 hours) and isopropanol/2,3-butanediol (50-75 times/132
hours), as shown graphically in Figure VI.9c, for both batches of inoculated juice. The
effect of the higher spores concentration in the juice of batch A is reflected by the larger
accumulation of the compounds mentioned above, except for lactic acid, which increases at
approximately the same rate independently of the inoculum concentration.
On the other hand, citric and malic acids are seen to decrease and it is possible that
their catabolism contributes to the aliphatic compounds accumulated. Concerning the
utilization of citric acid, it is interesting to note the spectral variation shown in Figure
VI.9b. From 0 to 36 hours, the broad resonances give place to the well-resolved signals of
citric acid, which disappear afterwards. The broad nature of the signals in the first
spectrum suggests hindered mobility of citric acid in the initial juice, which may be related
to the formation of complexes. The next steps seem to consist of rendering the citric acid
free and of its subsequent utilization. In addition to citric and malic acids, several amino
acids, listed in Table VI.2, are seen to decrease. These compounds may be used as organic
sources of nitrogen, which is required by the fungus to synthesize proteins to build
protoplasm.

Chapter VI
166
Table VI.2. Changes in the 1H NMR spectra of heat-treated mango juice, after inoculation with spores of P. expansum and storage at 25ºC during 132 hours; (*) variation specific of P. expansum growth (compared to natural spoilage); (a) tentative identification; (b) additional information provided in Figure VI.10b; the values in square brackets correspond to other chemical shifts belonging to the same spin system. Compound undergoing change ? 1H ppm (multiplicity) Type of variation
? : increase ? : decrease
Time when variation is first noted
High-field region (0-3 ppm) Acetate 1.92 (s) ? 36 h Acetoin 1.37 (d) 2.22 (s) 4.42 ? 36 h Alanine 1.47 (d) 3.79 ? 36 h Isoleucine 0.93 (t) 1.00 (d) ? 36 h Isopropanol / 2,3-Butanediol 1.14 (d) 3.67 ? 36 h Lactic acid 1.32 (d) 4.12 ? 36 h Leucine 0.95 (t) 1.72 ? 36 h Citric acid (*) 2.57 2.70 Disappears 60 h Glu / Gln (*) 2.13 2.46 3.77 ? 36 h Malic acid (*) 2.38 2.68 4.29 ? 36 h Succinic acid 2.41 (s) ? 36 h Valine 0.98 (d) 1.04 (d) ? 36 h Unassigned: 1 (*) 0.83 (d) 0.96 Appears 36 h 2 (*) 1.43 (d) 4.11 Appears 36 h 3 (*) 1.51 (s) Appears 36 h 4 2.96 (s) ? 36 h Mid-field region (3-5.5 ppm) Fructose 4.11 (b) Glucose 4.64, 5.23 (b) Sucrose 5.41 (b) Unassigned: 1 4.91 ?3.71 3.95? Appears 36 h 2 4.98 ?3.57 3.71 3.89? Appears 36 h 3 (*) 5.11 ?3.41 3.54 3.77 3.89? Appears 36 h 4 5.37 ?3.80 4.01? Appears 36 h Low-field region (5.5-10 ppm) Acetaldehyde 9.67 Disappears 36 h Adenine / Adenosine (a) 8.26 (s), 8.35 (s) Disappear 36 h Adenosine (ribose moiety) (a) 6.07 (d) ?4.43? Disappears 36 h Fumaric acid (a) 6.52 (s) Disappears 60 h Gallic acid (a) 7.04 (s) Disappears 36 h Tyrosine 6.89 (d) 7.19 (d) Disappears 36 h Uridine 5.90 7.86 (d) Disappears 36 h Unassigned: 1 (*) 5.79 ?3.71 4.26? ? 60 h 2 6.12 (d) ?3.73 4.35? ? 36 h 3 7.24 (s) ? 60 h

Study of Spoilage, Heat Treatment and Microbial Contamination in Mango Juices by NMR Spectroscopy
167
a) b)
c) Isopropanol /2,3-Butanediol Lactic acid
Acetoin
Figure VI.9. a) High-field region of the 600 MHz 1H NMR spectra of heat-treated natural mango juice at time 0 (top spectrum) and of the juice inoculated with P. expansum after 132 hours of storage (bottom spectrum), NS 64; b) 2.45-2.90 ppm region of the spectra at time 0 (top), 36 hours (middle) and 132 hours (bottom); c) Relative variation of some compounds determined by integration of NMR signals (At = area at time t, A0 = area at time 0): isopropanol/2,3-butanediol-1.14 ppm, lactic acid-1.32 ppm and acetoin-2.22 ppm; (?) control juice, (¦ ) inoculated juice (batch A), (? ) inoculated juice (batch B).
1.01.21.41.61.82.02.22.42.62.83.0 ppm
Isopropanol / 2,3-butanediol
Lactic
Ala EtOH
Acetate Acetoin Succinic
Citric
Malic
0 hours
132 hours
0
10
20
30
40
50
60
70
80
0 24 48 72 96 120 144
Storage Time (hours)
Mag
nitu
de o
f Var
iatio
n
0
20
40
60
80
100
120
0 24 48 72 96 120 144Storage Time (hours)
Mag
nitu
de o
f Var
iatio
n
0
20
40
60
80
100
120
140
160
180
0 24 48 72 96 120 144Storage Time (hours)
Mag
nitu
de o
f Var
iatio
n
At /
A0
At /
A0
At /
A0
2.62.72.8 ppm
Citric
Malic
0 h
36 h
132 h
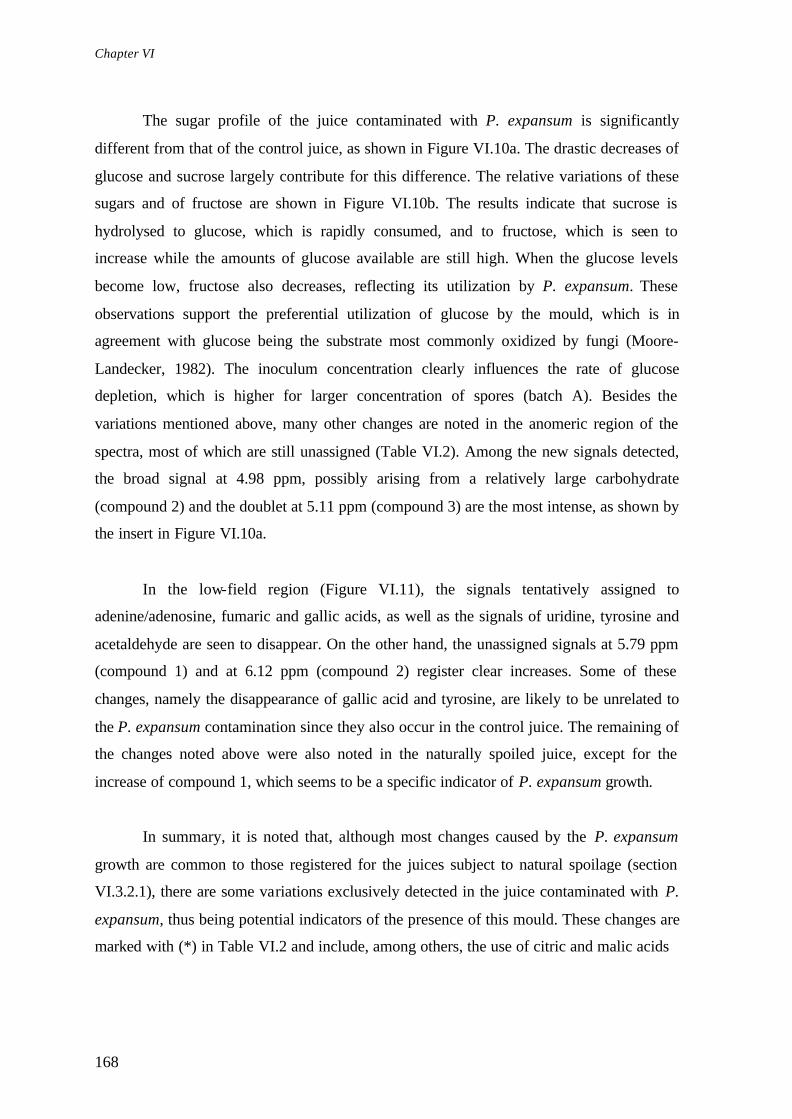
Chapter VI
168
The sugar profile of the juice contaminated with P. expansum is significantly
different from that of the control juice, as shown in Figure VI.10a. The drastic decreases of
glucose and sucrose largely contribute for this difference. The relative variations of these
sugars and of fructose are shown in Figure VI.10b. The results indicate that sucrose is
hydrolysed to glucose, which is rapidly consumed, and to fructose, which is seen to
increase while the amounts of glucose available are still high. When the glucose levels
become low, fructose also decreases, reflecting its utilization by P. expansum. These
observations support the preferential utilization of glucose by the mould, which is in
agreement with glucose being the substrate most commonly oxidized by fungi (Moore-
Landecker, 1982). The inoculum concentration clearly influences the rate of glucose
depletion, which is higher for larger concentration of spores (batch A). Besides the
variations mentioned above, many other changes are noted in the anomeric region of the
spectra, most of which are still unassigned (Table VI.2). Among the new signals detected,
the broad signal at 4.98 ppm, possibly arising from a relatively large carbohydrate
(compound 2) and the doublet at 5.11 ppm (compound 3) are the most intense, as shown by
the insert in Figure VI.10a.
In the low-field region (Figure VI.11), the signals tentatively assigned to
adenine/adenosine, fumaric and gallic acids, as well as the signals of uridine, tyrosine and
acetaldehyde are seen to disappear. On the other hand, the unassigned signals at 5.79 ppm
(compound 1) and at 6.12 ppm (compound 2) register clear increases. Some of these
changes, namely the disappearance of gallic acid and tyrosine, are likely to be unrelated to
the P. expansum contamination since they also occur in the control juice. The remaining of
the changes noted above were also noted in the naturally spoiled juice, except for the
increase of compound 1, which seems to be a specific indicator of P. expansum growth.
In summary, it is noted that, although most changes caused by the P. expansum
growth are common to those registered for the juices subject to natural spoilage (section
VI.3.2.1), there are some variations exclusively detected in the juice contaminated with P.
expansum, thus being potential indicators of the presence of this mould. These changes are
marked with (*) in Table VI.2 and include, among others, the use of citric and malic acids

Study of Spoilage, Heat Treatment and Microbial Contamination in Mango Juices by NMR Spectroscopy
169
a)
0 hours
132 hours
b) Sucrose Glucose
Fructose
Figure VI.10. a) Mid-field region of the 600 MHz 1H NMR spectra of heat-treated natural mango juice at time 0 (top spectrum) and of the juice inoculated with P. expansum after 132 hours of storage (bottom spectrum), NS 64. The peak numbers correspond to unassigned carbohydrates listed in Table VI.2; b) Relative variation of sugars determined by integration of NMR signals (At = area at time t, A0 = area at time 0): glucose-5.23 ppm, fructose-4.11 ppm and sucrose- 5.41 ppm. (?) control juice, (¦ ) inoculated juice (batch A), (? ) inoculated juice (batch B).
0.0
0.2
0.4
0.6
0.8
1.0
1.2
0 24 48 72 96 120 144Storage Time (hours)
Mag
nitu
de o
f Var
iatio
n
0.0
0.2
0.4
0.6
0.8
1.0
1.2
1.4
1.6
0 24 48 72 96 120 144
Storage Time (hours)
Mag
nitu
de o
f Var
iatio
n
0.0
0.5
1.0
1.5
2.0
2.5
0 24 48 72 96 120 144Storage Time (hours)
Mag
nitu
de o
f Var
iatio
n
At /
A0
At /
A0
At /
A0
3.43.63.84.04.24.44.64.85.05.25.4 ppm
2 3
5.05.15.25.3 ppm
5.05.15.25.3 ppm
1

Chapter VI
170
and the increase of some new unidentified sugars (not detected in the initial juice). On the
other hand, some alterations detected during natural spoilage did not occur in the juice
contaminated with P. expansum. Some examples are the marked decreases of quinic and
shikimic acids, probably related to the formation of a new cyclic acid (proposed to be
3,4,5-trihydroxyciclohexane carboxylic acid), and several changes in the low-field region.
Those alterations reflect the action of the microorganisms and enzymes present in the non-
treated juice, which were inactivated by the heat-treatment that preceded inoculation with
P. expansum.
0 hours
132 hours
Figure VI.11. Low-field region of the 600 MHz 1H NMR spectra of heat-treated natural mango juice at time 0 (top spectrum) and of the juice inoculated with P. expansum after 132 hours of storage (bottom spectrum), NS 64. The peak numbers correspond to unassigned compounds listed in Table VI.2.
VI.4. Commercial Mango Juice: Changes Upon Microbial Contamination
It has been shown in the last sections that natural mango juice suffers significant
changes in composition by the effect of microbial activity. The present sub-chapter is
concerned with the susceptibility to microbial spoilage of a commercial mango juice. This
study is important because contamination can also occur after the juice has been processed
and, in addition, some microorganisms, like the mould Neosartorya fischeri used in this
work, may survive the processing treatment commonly given to fruit products.
6.57.07.58.08.59.09.5 ppm
Shikimic
Adenine / Adenosine Uridine
+ other Gallic Fumaric Uridine
Tyr
1 2

Study of Spoilage, Heat Treatment and Microbial Contamination in Mango Juices by NMR Spectroscopy
171
VI.4.1. Changes Assessed by Soluble Solids and pH
Both the control juice and the juice inoculated with P. expansum showed no
significant variations of the soluble solids content, which was found to be in the range
11.7-12.3% until the end of the experiment (Figure VI.12a). The pH of the control juice
was 3.95?0.05, whereas for the inoculated juice a slight decreasing trend may be
suggested, the final value being 3.75?0.05 (FigureVI.12b). It is also important to note that
the inoculated juice started to show alterations in appearance after 72 hours. The colour
developed from intense to light yellow, and at 120 hours the juice presented a modified
aroma. After 144 hours, the juice showed solid aggregates in suspension and at the end of
the experiment (310 hours), there was a dense fungal colony at the surface.
The %SS and the pH showed also no significant changes in the juice inoculated
with N. fischeri (Figures VI.12c and VI.12d). Alterations in appearance were noted after
168 hours. The colour developed from intense to light yellow, and at 240 hours, the
contaminated juice presented solid aggregates in suspension and a modified aroma.
a) b) c) d) Figure VI.12. Variation of %SS (a and c) and pH (b and d) in commercial mango juices: (?) control juice, (¦ ) juice inoculated with P. expansum, (? ) juice inoculated with N. fischeri.
10.0
11.0
12.0
13.0
14.0
15.0
0 50 100 150 200 250 300 350Storage Time (hours)
% S
S
3.0
3.5
4.0
4.5
5.0
0 50 100 150 200 250 300 350Storage Time (hours)
pH
10.0
11.0
12.0
13.0
14.0
15.0
0 100 200 300 400 500
Storage Time (hours)
% S
S
3.0
3.5
4.0
4.5
5.0
0 100 200 300 400 500Storage Time (hours)
pH

Chapter VI
172
VI.4.2. Changes Assessed by NMR Spectroscopy
VI.4.2.1. Effect of Inoculation with Penicillium expansum
The 1H NMR spectra of commercial juice samples contaminated with P. expansum
showed several changes during the storage period after inoculation, contrarily to the
spectra of control juice (not inoculated and stored under the same conditions). Figures
VI.13, VI.14 and VI.15 show, respectively, the high-field, mid-field and low-field regions
of the spectra corresponding to the control juice and to the contaminated juice stored for
310 hours. The spectral differences detected within that period are summarised in Table
VI.3, including the changes not yet assigned. The following paragraphs will address each
spectral region separately.
In the high-field region (Figure VI.13a), the main variation is detected for ethanol,
which increases significantly from 20 hours onwards (28 times/310 hours), as shown
graphically in Figure VI.13b. This is accompanied by smaller increases of isopropanol /
2,3-butanediol (doublet at 1.14 ppm) and succinic acid (singlet at 2.61 ppm), illustrated in
the same figure. Propionic acid (triplet at 1.05 ppm) is seen to appear and increase after
150 hours of storage. On the other hand, contrarily to what has been observed for the
natural juice inoculated with P. expansum, the accumulations of other fermentation
products like lactic acid, acetate and acetoin are not registered. Differences between the
initial compositions and pH values of natural and commercial juices, as well as differences
in the experimental setups employed may account for the different variations observed. For
instance, the commercial juice was subject to more anaerobic conditions during storage
than the natural juice (larger volume, less exposure to air), which is likely to influence the
metabolism of the mould.
In what regards the compounds that are used up, some amino acids, namely alanine
and GABA, are seen to decrease in the latter stages of the experiment. Moreover, fatty
acids, which contribute with resonances at 0.88, 1.25-1.30 and 1.57 ppm in the spectrum of
the initial juice, significantly decrease, possibly indicating their utilization by the fungus as
carbon and energy sources. Interestingly, this decrease is accompanied by the increase in
the signals of TSP, the reference that has been added to the juices. It is possible that, at the
beginning of the experiment, TSP (namely the more hydrophobic part of the molecule,
consisting of the CH3 groups attached to Si) is interacting with the lipid fraction of the

Study of Spoilage, Heat Treatment and Microbial Contamination in Mango Juices by NMR Spectroscopy
173
juice, originating broader and less intense signals; as the fatty acids are used, TSP is
rendered free and gives rise to well- resolved signals.
Table VI.3. Changes in the 1H NMR spectra of commercial mango juice, after inoculation with spores of P. expansum and storage at 25ºC during 310 hours; (a) tentative identification; (b) additional information provided in Figure VI.14b; the values in square brackets correspond to other chemical shifts belonging to the same spin system. Compound undergoing change ? 1H ppm (multiplicity) Type of variation
? : increase ? : decrease
Time when variation is first noted
High-field region (0-3 ppm) Alanine 1.47 (d) 3.79 ? 198 h Succinic acid 2.61 (s) ? 70 h Propionic acid (a) 1.05 (t) ? 150 h Fatty acids 0.88 1.25-1.30 1.57 ? 44 h GABA 1.90 2.40 (t) 3.01 ? 198 h Ethanol 1.18 (t) 3.65 ? 44 h Isopropanol / 2,3-Butanediol 1.14 (d) ? 70 h Unassigned: 1 1.31 (t) ? 150 h 2 1.49 (s) Appears 310h 3 2.11 (s) ? 150 h Mid-field region (3-5.5 ppm) Fructose 4.11 (b)
Glucose 4.64, 5.23 (b) Sucrose 5.41 (b) Unassigned: 1 4.18 ?3.83 4.07? Appears 44 h 2 4.26 ?3.79 4.03? Appears 44 h 3 4.91 ?3.71 3.93? Appears 44 h 4 4.96 ?3.72 4.00? Appears 44 h 5 5.42 Appears 44 h Low-field region (5.5-10 ppm) Unassigned: 1 5.85 ?3.80? ? 100 h 2 6.12 ?3.76? Appears
Disappears 44 h 198 h
3 6.40 6.85 7.35 Appears 44 h 4 6.56 7.03 7.62 Appears 44 h 5 7.13 (s) ? 70 h 6 7.18 (s) ? 70 h 7 7.26 (s) ? 100 h

Chapter VI
174
a)
0 hours
310 hours
b) Ethanol Isopropanol / 2,3-Butanediol
Succinic acid
Figure VI.13. a) High-field region of the 500 MHz 1H NMR spectra of commercial mango juice at time 0 (top spectrum) and of the juice inoculated with P. expansum after 310 hours of storage (bottom spectrum), NS 64; b) Relative variation of some compounds determined by integration of NMR signals (At = area at time t, A0 = area at time 0): ethanol-1.17 ppm, isopropanol/2,3-butanediol-1.14 ppm, succinic acid-2.61 ppm. (?) control juice, (¦ ) inoculated juice.
1.01.21.41.61.82.02.22.42.62.83.0 ppm
TSP Propionic
Ala EtOH
Isopropanol / 2,3-butanediol
TSP
Fatty acids
GABA
Succinic
0
5
10
15
20
25
30
0 50 100 150 200 250 300 350Storage Time (hours)
Mag
nitu
de o
f Var
iatio
nA
t / A
0
0
0.5
1
1.5
2
2.5
0 50 100 150 200 250 300 350Storage Time (hours)
Mag
nitu
de o
f Var
iatio
nA
t / A
0
0
0.5
1
1.5
2
2.5
0 50 100 150 200 250 300 350Storage Time (hours)
Mag
nitu
de o
f Var
iatio
nA
t / A
0

Study of Spoilage, Heat Treatment and Microbial Contamination in Mango Juices by NMR Spectroscopy
175
The sugar profiles of the spectra (Figure VI.14a) show drastic changes in the
carbohydrate composition of the inoculated juice. The quantitative variations of the major
sugars are shown in Figure VI.14b. In the case of sucrose and fructose, only the enzymatic
results are presented because integration measurements in the 1D spectra are affected by
large errors arising from strong signal overlapping. For glucose, the values measured by
signal integration and by enzymatic tests agree, indicating a glucose increase of about 2.5-
2.8 times/198 hours. The enzymatic determinations of the three sugars show that, from 0 to
198 hours of storage, sucrose decreases almost 55 g/L, while glucose suffers an increase of
22.6 g/L and fructose shows a small decrease (4.4 g/L). These results suggest that while the
amount glucose resulting from sucrose hydrolysis remains in the juice, fructose is used by
the mould more extensively than it is produced, thus showing an absolute decrease. The
proposal that fructose is preferentially being utilized by P. expansum is, however,
discrepant with the general observation that glucose is the substrate most commonly
oxidized by fungi. Furthermore, these results are quite different from those registered for
the natural juice contaminated with the same mould (Figure VI.10). It should be reminded
that differences have also been noted concerning the aliphatic compounds formed, thus
supporting the idea that the metabolism of P. expansum is significantly different in natural
and commercial juices, under the experimental conditions employed. A more detailed
discussion of this matter would require, however, further investigation.
Other spectral changes detected in the mid-field region of the spectra regard the
appearance and increase of signals at 5.42, 4.26 and 4.18 ppm (overlapping with sucrose)
and at 4.07 ppm (overlapping with fructose). These signals (numbered in Figure VI.14a
and listed in Table VI.3) probably arise from new carbohydrates formed by the mould, but
their identity could not be established at this stage.
In the low-field region, several variations are detected, involving the signals
numbered in Figure VI.15, which arise from compounds not yet identified. Compound 1
(5.85 ppm) increases from 100 hours onwards, while compound 2 (6.12 ppm) appears at
44h, but then disappears again after 198 hours of storage; compounds 3 and 4 appear after
44 hours and show very weak signals until the end of storage; in addition, the singlets at
7.13, 7.18 and 7.26 ppm (peak numbers 5, 6 and 7 in Figure VI.15) vary in intensity. These
unknown compounds may correspond to numerous aromatic species, synthesised by the

Chapter VI
176
a)
0 hours
310 hours
b) Glucose (NMR) Glucose (enzymatic)
Sucrose (enzymatic) Fructose (enzymatic)
Figure VI.14. a) Mid-field region of the 500 MHz 1H NMR spectra of commercial mango juice at time 0 (top spectrum) and of the juice inocula ted with P. expansum after 310 hours of storage (bottom spectrum), NS 64. The peak numbers correspond to unassigned compounds listed in Table VI.3 (peaks 3 and 4 are not visible in the expansion shown); b) Variation of sugars in not inoculated, commercial mango juice (?) and in juice inoculated with P. expansum (¦ ), determined by integration of NMR signals (At = area at time t, A0 = area at time 0) and by enzymatic tests.
05
1015202530354045
0 50 100 150 200 250Storage Time (hours)
Glu
cose
cc.
(g/
L)
0
5
10
15
20
25
30
0 50 100 150 200 250Storage Time (hours)
Fru
ctos
e cc
. (g/
L)
0
20
40
60
80
100
120
0 50 100 150 200 250Storage Time (hours)
Suc
rose
cc.
(g/
L)
0
0.5
1
1.5
2
2.5
3
3.5
0 50 100 150 200 250 300 350Storage Time (hours)
Mag
nitu
de o
f Var
iatio
nA
t / A
0
Suc
Glc
Suc
Glc Fru
3.43.63.84.04.24.44.64.85.05.25.4 ppm
5 2 1

Study of Spoilage, Heat Treatment and Microbial Contamination in Mango Juices by NMR Spectroscopy
177
mould in very low amounts, and their identification by standard 1H NMR is obviously very
difficult, calling for the use of improved analytical methods. In addition, it should be noted
that these changes clearly differ from those detected for the natural juice contaminated
with the same mould (Figure VI.11), similarly to what has been observed in the other
spectral regions. The distinct aromatic compositions of natural and commercial juices
(shown by comparing the top spectra in Figures VI.11 and VI.15) are likely to greatly
account for that difference.
0 hours
310 hours Figure VI.15. Low-field region of the 500 MHz 1H NMR spectra of commercial mango juice at time 0 (top spectrum) and of the juice inoculated with P. expansum after 310 hours of storage (bottom spectrum), NS 64. The peak numbers correspond to unassigned compounds listed in Table VI.3 (peak 2 is detected between 44 and 198 hours only, thus it is not seen in the spectra shown).
VI.4.2.2. Effect of Inoculation with Neosartorya fischeri
The heat-resistant mould N. fischeri has been inoculated into the commercial juice
and the compositional changes followed by 1H NMR over a storage period of 465 hours.
While the control juice spectra did not change within the time of the experiment, the
spectra of the contaminated juices showed several variations with time, as illustrated in
Figures VI.16 to VI.18 for the extreme times. Those variations are summarised in Table
VI.4 and discussed in the following paragraphs for the different spectral regions.
In the high-field region (Figure VI.16), most signals show no pronounced varia tion.
The most significant change, first noted at 128 hours, is the decrease of the signals of fatty
acids, accompanied by the increase of the TSP signals, similarly to what was registered for
the commercial juice inoculated with P. expansum. In addition, alanine and GABA show
6.57.07.58.08.59.09.5 ppm
1
3 4
5 6
3 4
4
7

Chapter VI
178
slight deceasing trends from 226 hours onwards, while the signals of valine, leucine and
isoleucine show increased intensities in the last spectrum recorded (465 hours), although
no variations have been noted before that. Finally, it should be noted that the production of
alcohols (ethanol, isopropanol/2,3-butanediol) and acids (propionic, succinic) seen to occur
in the juice contaminated with P. expansum is not detected here, reflecting an important
difference in the metabolism of the two moulds.
Table VI.4. Changes in the 1H NMR spectra of commercial mango juice, after inoculation with spores of N. fischeri and storage at 25ºC during 465 hours; (a) tentative identification; (b) additional information provided in Figure VI.17b.
Compound undergoing change ? 1H ppm (multiplicity) Type of variation
? : increase ? : decrease
Time when variation is first noted
High-field region (0-3 ppm) Alanine 1.47 (d) 3.79 ? 226 h Fatty acids 0.88 1.25-1.30 1.57 ? 128 h GABA 1.90 2.40 (t) 3.01 ? 226 h Valine 0.98 (d) 1.04 (d) ? 465 h Leucine 0.95 (t) 1.72 (m) ? 465 h Isoleucine 0.93 (t) 1.00 (d) ? 465 h Unassigned: 1 2.06 (s) ? 226 h 2 2.11 (s) ? 226 h Mid-field region (3-5.5 ppm) Fructose 4.11 (b)
Glucose 4.64, 5.23 (b) Sucrose 5.41 (b) Unassigned: 1 4.91 ?3.70 3.99? Appears 145 h 2 4.96 ?3.75 4.02? Appears 145 h 3 4.98 ?3.75? Appears 145 h 4 5.37 Appears 193 h Low-field region (5.5-10 ppm) Tyrosine 6.89 (d) 7.19 (d) ? 273 h Unassigned: 1 6.12 ? 3.79 4.35? Appears 145 h 2 7.13 (s) ? 145 h 3 7.26 (s) ? 226 h 4 7.92 (s) Appears 273 h 5 8.65 (s) Appears 273 h

Study of Spoilage, Heat Treatment and Microbial Contamination in Mango Juices by NMR Spectroscopy
179
0 hours
465 hours
Figure VI.16. High-field region of the 500 MHz 1H NMR spectra of commercial mango juice at time 0 (top spectrum) and of the juice inoculated with N. fischeri after 465 hours of storage (bottom spectrum), NS 64.
In the mid-field region (Figure VI.17a), it is clear that while the juice spectrum
corresponding to time 0 is dominated by sucrose, the spectrum of contaminated juice
stored for 465 hours is dominated by glucose and fructose. The variation of these sugars
with time is shown in Figure VI.17b. The results obtained by integration of the NMR
signals agree with those obtained by enzymatic assays and suggest that sucrose starts being
hydrolysed into glucose and fructose after 226 hours of storage. Both monosaccharides are
accumulated and there is no evidence of their use by the microorganism, thus suggesting
that the growth of N. fischeri was still at an early stage at the end of the storage period
studied. Further changes detected in this region regard the appearance of new weak signals
(listed in Table VI.4) arising from unidentified carbohydrates.
In the low-field region (Figure VI.18), the most prominent change concerns the
signal at 6.11 ppm (peak 1), which appears in the spectrum recorded for 128 hours and
increases from that time onwards. This variation is distinct from that observed in the juice
contaminated with P. expansum. Other important changes are the increase of the singlet at
7.13 ppm (peak 2), which is one of the first alterations to be noted in the whole spectral
range, and the disappearance of the unassigned singlet at 7.26 ppm (peak 3). There is still
to point out the appearance of weak signa ls at 7.92 and 8.65 ppm (peaks 4 and 5,
respectively) and the increase of tyrosine, changes that did not occur in the juice inoculated
with P. expansum. Again, further interpretation of these changes in hindered by the
unknown identity of the compounds giving rise to them.
1.01.21.41.61.82.02.22.42.62.83.0 ppm
TSP
Val, Leu, Ile
Fatty acids Ala
GABA

Chapter VI
180
a) 0 hours
465 hours
b) Sucrose (NMR) Sucrose (enzymatic)
Glucose (NMR) Glucose (enzymatic)
Fructose (NMR) Fructose (enzymatic)
Figure VI.17. a) Mid-field region of the 500 MHz 1H NMR spectra of commercial mango juice at time 0 (top spectrum) and of the juice inoculated with N. fischeri after 465 hours of storage (bottom spectrum), NS 64; b) Variation of sugars in not inoculated commercial mango juice (?) and in juice inoculated with N. fischeri (¦ ), determined by integration of NMR signals (At = area at time t, A0 = area at time 0) and by enzymatic tests.
020406080
100120
140160
0 100 200 300 400 500Storage Time (hours)
Suc
rose
cc.
(g/
L)
0
10
20
30
40
50
60
70
0 100 200 300 400 500Storage Time (hours)
Glu
cose
cc.
(g/
L)
0
10
20
30
40
50
60
70
0 100 200 300 400 500Storage Time (hours)
Fru
ctos
e cc
. (g/
L)
0.0
0.2
0.4
0.6
0.8
1.0
1.2
0 100 200 300 400 500Storage Time (hours)
Mag
nitu
de o
f Var
iatio
n
01
234
56
78
0 100 200 300 400 500Storage Time (hours)
Mag
nitu
de o
f Var
iatio
n
0
1
2
3
4
5
0 100 200 300 400 500Storage Time (hours)
Mag
nitu
de o
f Var
iatio
nA
t / A
0 A
t / A
0 A
t / A
0
3.43.63.84.04.24.44.64.85.05.25.4 ppm
Suc
Glc
Suc
Glc
Fru Glc

Study of Spoilage, Heat Treatment and Microbial Contamination in Mango Juices by NMR Spectroscopy
181
0 hours
465 hours Figure VI.18. Low-field region of the 500 MHz 1H NMR spectra of commercial mango juice at time 0 (top spectrum) and of the juice inoculated with N. fischeri after 465 hours of storage (bottom spectrum), NS 64. The peak numbers correspond to unassigned compounds listed in Table VI.4.
VI.5. Conclusions
High resolution 1H NMR has been used for detecting compositional changes in
mango juices subject to different treatments and microbial contaminations, and has enabled
the simultaneous screening of a wide range of compounds, including their quantitative
variation through time.
In the case of the natural juice prepared from fresh mangoes and stored at 25ºC
without any treatment, the components that have been found to decrease were mainly
organic acids (e.g. quinic, shikimic and fumaric) and amino acids (e.g. alanine and
tyrosine). The decreases of shikimic and quinic acids were suggested to be related to the
formation of a new compound in the spoiled juice, proposed to be 3,4,5-
trihydroxyciclohexane carboxylic acid. In what regards the main sugars, sucrose showed a
decrease, possibly reflecting its partial hydrolysis into fructose and glucose, which were
accumulated in the spoiled juice. The amount of glucose accumulated, however, was much
smaller than the expected to result from sucrose hydrolysis, indicating the utilization of this
sugar. Indeed, the glucose catabolism is consistent with the increases found for typical
fermentation products, namely acetate, lactic acid, acetoin, isopropanol/2,3-butanediol and
succinic acid. The spoiled juice was also characterised by the presence of relatively large
carbohydrates, suggested with basis on the appearance and increase of broad signals in the
6.57.07.58.08.59.09.5 ppm
3
1 2
4 5

Chapter VI
182
4.9-5.0 ppm region, with spin systems characteristic of sugars. Finally, the aromatic region
of the spectra showed changes involving adenosine and nicotinamide systems, which may
be related to variations in the levels of ADP/ATP and NAD+.
Heat treatment of the natural juice (80ºC, 15 min) was seen to cause some
compositional changes detected in the low-field region of the spectra. After heat-treatment,
the juice preserved its general composition throughout storage and only slight changes
concerning a few aromatic compounds were noted. On the other hand, the heat-treated
juice inoculated with spores of Penicillium expansum showed several changes over time.
The compounds catabolised by the mould included organic acids such as citric and malic
acids, amino acids (e.g. alanine, tyrosine, glutamic acid/glutamine), the three major sugars
(especially glucose), and others like uridine- and adenosine-containing compounds. On the
other hand, the main metabolic products were acetate, lactic acid, acetoin, isopropanol/
2,3-butanediol, succinic acid and some unassigned sugars possibly including
oligosaccharides. Many of these changes are common to those detected in the naturally
spoiled juice but occur at different rates, while others have only been detected in the juice
contaminated with P. expansum (e.g. decrease of citric and malic acids, increase of some
unidentified carbohydrates). It should also be noted that most changes were detected by
NMR at 36 hours of storage, whereas soluble solids and pH showed negligible variations
in that period, and the colour of the juice only started to change after 84 hours.
The susceptibility of a commercial mango juice to the contamination with P.
expansum has been evaluated and the results were significantly different from those
obtained for the natural juice. The different composition of the juices, their different pH
values and the distinct experimental setups employed are expected to contribute to this
fact. Ethanol was one of the main metabolic products, while the accumulations of lactic
acid, acetate and acetoin were not observed. In what regards the main sugars, the
hydrolysis of sucrose and the utilization of fructose, rather than of glucose, were suggested.
In addition, fatty acids were consumed and several unassigned changes were detected in
the aromatic region of the spectra. The time when some of the spectral changes were first
noted has been at 44 hours of storage, much earlier than changes in appearance (noticed
after 72 hours) or in pH (slight decreasing trend after 98 hours) were observed.
Finally, in what concerns the effects of the heat-resistant mould Neosartorya
fischeri on the composition of the commercial mango juice, less significant alterations

Study of Spoilage, Heat Treatment and Microbial Contamination in Mango Juices by NMR Spectroscopy
183
were found within the time of the experiment, reflecting the slower metabolism of this
mould compared to P. expansum. In the aliphatic region of the spectra, the major change
was the decrease of fatty acids. The sugar composition changed from the predominance of
sucrose to the predominance of glucose and fructose, suggesting the occurrence of sucrose
hydrolysis. The aromatic regions of the spectrum have also been found to change with N.
fischeri growth, but most variations are still unassigned at this stage. Again, NMR enabled
earlier detection of microbial contamination, since the first spectral change was noticed at
128 hours, whereas no significant changes in pH or %SS were registered and the changes
in the juice appearance were visible after 168 hours only.
In summary, it can be concluded that, although many questions need to be further
investigated, NMR is a powerful tool for monitoring the complex compositional changes
of juices spoiled by microbial activity and other effects, being potentially useful for quality
control purposes, for instance, in terms of detecting contamination at early times. In the
future, this study would obviously benefit from a more complete assignment of the spectral
changes, particularly in what regards carbohydrates and aromatic compounds, and from
accurate absolute quantitative determinations.
References
Beuchat, L.R. Extraordinary heat resistance of Talaromyces flavus and Neosartorya fischeri ascospores in fruit products. Journal of Food Science 1986, 51, 1506-1510. Dewick, P.M. The biosynthesis of shikimate metabolites. Natural Products Reports 1998, 15, 17-58. Ejechi, B.O.; Souzey, J.A.; Akpomedaye, D.E. Microbial stability of mango (Mangifera indica L.) juice preserved by combined application of mild heat and extracts of two tropical species. Journal of Food Protection 1998, 61, 725-727. Frazier, W.C.; Westhoff, D.C. Contamination, preservations and spoilage of vegetables and fruits. In Food Microbiology; Frazier, W.C., Westhoff, D.C. Eds.; McGraw-Hill: Singapore, 1988; 196-217. Lin, H.H.; Lister, R.M.; Cousin, M.A. Enzymes- linked immunosorbent assay for detection of mold in tomato puree. Journal of Food Science 1986, 51, 180-192.

Chapter VI
184
Littel, K.J.; LaRocco, K.A. ATP screening method for presumptive detection of microbiologically contaminated carbonated beverages. Journal of Food Science 1986, 51, 474-476. Moore-Landecker, E. Fundamentals of the Fungi; Prentice-Hall: New Jersey, 1982. Notermans, S.; Heuvelman, C.J.; Van Egmond, H.P.; Paulsch, W.E.; Besling, J.R. Detection of mold in food by enzyme-linked immunosorbent assay. Journal of Food Protection 1986, 49, 786-791. Morris, J.G. Anaerobic Metabolism of Glucose. In Comprehensive Biotechnology: The Principles, Applications and Regulations of Biotechnology in Industry, Agriculture and Medicine; Moo-Young, M., Bull, A.T., Dalton, H., Eds.; Pergamon Press: 1985; 357-378. Obeta, J.A.N.; Ugwuanyi, J.O. Heat-resistant fungi in Nigerian heat-processed fruit juices. International Journal of Food Science and Technology 1995, 30, 587-590. Obeta, J.A.N.; Ugwuanyi, J.O. Shelf life study of some Nigerian fruit juices inoculated with ascospores of Neosartorya spp.. Plant Foods for Human Nutrition 1997, 50, 325-331. Rajashekhara, E.; Suresh, E.R.; Ethiraj, S. Thermal death rate of ascospores of Neosartorya fischeri ATCC 200957 in the presence of organic acids and preservatives in fruit juices. Journal of Food Protection 1998, 61, 1358-1362. Rajashekhara, E.; Suresh, E.R.; Ethiraj, S. Modulation of thermal resistance of ascospores of Neosartorya fischeri by acidulants and preservatives in mango and grape juice. Food Microbiology 2000, 17, 269-275. Ramos, A.; Santos, H. NMR studies of wine chemistry and wine bacteria. In Annual Reports on NMR Spectroscopy; Webb, G.A. Ed.; Academic Press: London, 1999; 179-202. Santos, H. NMR studies of lactic acid bacteria involved in wine fermentation. In Magnetic Resonance in Food Science; Belton, P.S., Delgadillo, I., Gil, A.M., Webb, G.A. Eds.; The Royal Society of Chemistry: Cambridge, 1995; 127-135. Schaertel, B.J.; Tsang, N.; Firstenberg-Eden, R. Impedimetric detection of yeast and mold. Food Microbiology 1987, 4, 155-163. Singhal, S.; Kulkarni, P.R.; Rege, D.V. Fruit and vegetable products. In Handbook of Indices of Food Quality and Authenticity; Singhal, S., Kulkarni, P.R., Rege, D.V. Eds; Woodhead Publishing Limited: Cambridge, 1997; 79-130. Splittstoesser, D.F. Microbiology of fruit products. In Processing Fruits: Science and Technology; Somogyi, L.P., Ramaswamy, H.S., Hui, Y.H., Eds.; Technomic: Basel, 1996; 261-292.

VII. APPLICATION OF HYPHENATED NMR (HPLC-NMR AND HPLC-
NMR/MS) FOR THE DETECTION OF MINOR COMPONENTS IN FRUIT JUICES
AND WINE
VII.1. Introduction……………………………………………………………………….
VII.2. Materials and Methods……………………………………………………………
VII.2.1. Sample Preparation……………………………………………………...
VII.2.2. Instrumentation and Measurements……………………………………..
VII.3. Characterisation of Carbohydrates in Mango Juice……………………………….
VII.3.1. Application to Fresh Mango Juices..……………………………………
VII.3.2. Application to Spoiled and Contaminated Mango Juices….……………
VII.4. Characterisation of Aromatic Compounds in Grape Juice………………………..
VII.5. Characterisation of Aromatic Compounds in a Wine Phenolic Extract…………..
VII.6. Conclusions……………………………………………………………………….
References………………………………………………………………………………..
186
187
187
187
190
190
196
200
212
216
217

Chapter VII
186
VII.1. Introduction
Over the last years, HPLC-NMR and HPLC-NMR/MS have been established as
standard analytical tools, especially in the area of pharmaceutical research (Lindon et al.,
2000). The numerous works reporting on the identification of endogenous and drug
metabolites in biofluids (Schockor et al., 1996; Sidelmann et al., 1997; Daykin et al.,
2001) and on the investigation of natural products (Bringman et al., 1999; Hansen et al.,
1999) have demonstrated the outstanding advantages of these techniques for the analysis of
complex mixtures, that may offset the high cost of the equipment and the relatively low
sensitivity of NMR spectroscopy. These advantages may be summarised as the speed of
analysis and the high structural information obtained concurrently as the chromatography
proceeds, thus avoiding the need to obtain perfect chromatographic separations, which
often requires a time-consuming and laborious process, and providing the possibility of
detecting and identifying novel structures. In the area of food analysis, however, only a
few applications have been reported. These include an example of on-flow HPLC-NMR of
a wine concentrate, showing the potential interest of the method to study wine
oligosaccharides (Spraul and Hoffman, 1995), the investigation of the detailed structures of
hop and beer bitter acids by HPLC-NMR (Pusecker et al., 1999), and the identification of
several quercetin and phloretin glycosides differing in the state of glycosilation in an apple
peel extract by HPLC-NMR/MS (Lommen et al., 2000).
In this work, HPLC-NMR and HPLC-NMR/MS are applied to the investigation of
minor components in different food samples, namely mango and grape juices and a wine
phenolic extract. The mango juice analysis is focused on the characterisation of
carbohydrates other than the main sugars commonly found in the juice (sucrose, glucose
and fructose), which have been found difficult to characterise by NMR alone. In particular,
a pectic fraction is separated and characterised for two ripening stages, with basis on the
spectroscopic data obtained. Furthermore, the structural elucidation of the sugars formed
during spoilage and microbial contamination of mango juice is attempted by using the
HPLC-NMR method. In the case of the grape juice and of the wine extract samples,
HPLC-NMR/MS analysis is carried out to characterise their aromatic composition, giving
particular emphasis to the investigation of phenolic components. As previously described
in Chapter I.2, grape juice and wine are usually rich sources of phenolic compounds,
which, besides contributing significantly to the sensory qualities of these products, are

Application of Hyphenated NMR for the Detection of Minor Components in Fruit Juices and Wine
187
suspected to have important beneficial properties to human health (Bravo, 1998). There is
extensive literature on the isolation and identification of the phenolic constituents of grape
and wine, as briefly reviewed in Chapter I.2.2. Among the various methods available,
HPLC-MS is regarded as one of the most valuable tools for polyphenols analys is. In this
work, the potential usefulness of HPLC-NMR/MS is discussed.
VII.2. Materials and Methods
VII.2.1. Sample Preparation
The mango juices analysed by hyphenated NMR consisted of natural fresh juices
and of spoiled/contaminated juices. The fresh samples were a ripe juice of the cultivar
Tommy Atkins and two juices of the cultivar Haden at unripe and ripe stages. These
samples have been prepared as described in Chapter IV.2.1 (batches 1 and 2, respectively)
and kept frozen at –20ºC until analysis. The thawed samples were then directly injected
onto the HPLC column for HPLC-NMR and HPLC-NMR/MS measurements. Some of the
natural mango juices described in Chapter VI were also analysed by HPLC-NMR, namely
the non-treated juices stored for 0 and 132 hours at 25ºC and the juice inoculated with
spores of Penicillium expansum, stored under the same conditions.
The grape juice sample was kindly provided by the University of Santa Catarina,
Brazil, within a work collaboration. The pulp and seeds from red grapes (variety Isabel)
were used to prepare the juice, which was then freeze-dried. Before analysis, 315 mg of
sample were dissolved in 1.0 ml of distilled water.
The wine phenolic extract was also provided by the University of Santa Catarina,
Brazil. The extract was prepared from red wine produced from grapes of the variety Bordo,
by phase partitioning with ethyl acetate, followed by chromatographic separation using
sequential elution with hexane, chloroform, ethyl acetate, methanol and water. The detailed
extraction procedure is described by Maraschin et al. (2001).
VII.2.2. Instrumentation and Measurements
1D and 2D NMR spectra of grape juice and wine extract samples were recorded on
a Bruker Avance DRX-500 spectrometer, operating at 500.13 MHz for proton and 125.77
MHz for carbon. For acquiring the 1H 1D spectra, a presaturation sequence was used to

Chapter VII
188
suppress the water signal by applying low-power selective irradiation at the water
frequency during the relaxation delay. Each 1H 1D spectrum consisted of 512 scans of
16384 data points with a spectral width of 8012.82 Hz, an acquisition time of 1.02 s, and a
relaxation delay of 7 s. The TOCSY spectra were acquired in the phase sensitive mode
using time proportional phase incrementation (TPPI) and the MLEV17 pulse sequence. 32
transients were collected for each of the 400 increments, using a spectral width of 5482.46
Hz in both dimensions, 8192 data points, a mixing time of 100 ms and a relaxation delay of
1.5 seconds.
HPLC-NMR/(MS) experiments were performed us ing the following
instrumentation: The HPLC system consisted of a HP 1100 solvent delivery pump with
vacuum degasser (Agilent, Waldbronn, Germany), a manual injector from Rheodyne,
Model 7725i (Cotati, CA, USA), equipped with a 1-ml sample loop, and a diode array
detector from Bruker, Rheinstetten, Germany. HPLC-NMR measurements were carried out
using a BPSU-36 interface coupled to a DRX-500 NMR spectrometer equipped with a 1H-13C inverse-detection flow probe (cell of 4 mm i.d. with a volume of 120 ? l) from Bruker
(Rheinstetten, Germany). The temporary sample storage unit (BPSU-36) was used for
automated multiple NMR experiments overnight. For on- line MS detection, an ESQUIRE-
3000 ion trap mass spectrometer, equipped with an electrospray ion source, from Bruker
Daltonics (Bremen, Germany) was used. Five percent of the eluent was split into the MS
using a splitter from LC Packings, San Francisco, CA, USA. Both UV as well as MS were
used to trigger the transfer of the HPLC fractions to the BPSU (for temporary storage) or
directly to the NMR.
For the study of mango juice carbohydrates, chromatographic separation was
carried out at 35ºC, using a 300 x 7.8 mm ION-300 column, containing a cation-exchange
polymer in the hydrogen ionic form, with a particle size of 5.0 ? m. The mobile phase
consisted of 0.0085N H2SO4 in D2O. Injection volumes of 50-100 ? l and flow rates of
0.15-0.30 ml/min were used. The diode array detector was operated at 200 and 220 nm, for
detection of sugars and organic acids, respectively.
1H NMR spectra were obtained at 500 MHz using the continuous-flow and the
loop-sampling methods. For continuous-flow experiments, successive NMR spectra were

Application of Hyphenated NMR for the Detection of Minor Components in Fruit Juices and Wine
189
acquired automatically, each spectrum comprising a total of 16 transients summed into
8192 data points with an acquisition time of 0.82 s and a spectral width of 5000 Hz. A
pulse sequence with presaturation during relaxation delay (1.0 s) was used (program
‘lc2pr’ from the Bruker library). 1D 1H NMR spectra of loops were recorded by
accumulating 64 transients with 16384 data points, a spectral width of 10000 Hz and an
acquisition time of 0.82 s. The TOCSY spectra of loops consisted of 4096 data points with
24 transients per each of 128 increments acquired with a spectral width of 3000 Hz in both
dimensions. The mixing time of the MLEV spin lock was 60 ms.
Electrospray ionisation (ESI) was carried out in positive mode and mass spectra
were acquired up to m/z 1500 after adding 50 ? l/min of 20 mM aqueous sodium acetate
solution to the split ratio of the eluent via a T-piece with a syringe pump.
For the studies of aromatic compounds, chromatographic separation was carried out
at 35ºC, using a 250 x 4 mm Purospher reverse phase (RP18) column from Merck, with a
particle size of 5.0 ? m. The mobile phase consisted of a mixture of D2O (containing 0.06%
formic acid) and acetonitrile, changing in composition according to the following gradient:
0 min - 3% acetonitrile, 40 min - 40 % acetonitrile, 60 min - 100 % acetonitrile, 70 min -
3% acetonitrile. Injection volumes were 20 ? l (in the case of the wine phenolic extract, due
to the small volume available) and 500 ? l (for grape juice). The flow rate was typically
1.00 ml/min. The diode array detector was operated at 280 nm (for detection of catechins,
proanthocyanidins and benzoic acids), 320 nm (for detection of hydroxycinnamic acids)
and 365 nm (for detection of flavonols). 1H NMR spectra were obtained at 500 MHz using the continuous-flow mode for
both grape juice and wine extract samples and also the loop-sampling method for the grape
juice. In continuous-flow experiments, data were recorded with double solvent suppression
of water and acetonitrile signals (pulse program ‘lc1wetdw’). Each spectrum consisted of
16 transients of 8192 data points with a spectral width of 7002.8 Hz and an acquisition
time of 0.6 s. 1D 1H NMR spectra of loops were recorded with 64 transients, 16384 data
points, a spectral width of 10000 Hz and an acquisition time of 0.82 s.
ESI-MS experiments were carried out in positive and negative modes with a scan
range from 100 to 1000 m/z. For loop analysis, automatic switch between MS and MS/MS
was performed in order to identify fragment ions.

Chapter VII
190
VII.3. Characterisation of Carbohydrates in Mango Juice
VII.3.1. Application to Fresh Mango Juices
The typical carbohydrate composition of mango juice viewed by NMR has been
presented in Chapter III.3.1. Besides sucrose, glucose and fructose, identified as the major
sugars, other resonances arising from less abundant carbohydrates have been detected,
namely the signals at 5.0-5.4 ppm, expanded in Figure VII.1, showing very low intensity
and poor resolution compared to the major sugars. Some of these signals are thought to
arise from galacturonic acid units of pectin chains. In this Chapter, a more complete
characterisation of these less abundant carbohydrates is attempted by combining the
separation ability of liquid chromatography with NMR and mass spectrometry.
Figure VII.1. Mid-field region of the 600 MHz 1H NMR spectrum of mango juice; NS 64.
Figure VII.2 shows the continuous-flow NMR chromatogram obtained by the
elution of ripe mango juice (cv. Tommy Atkins) in the ION-300 column, using the
conditions described in section VII.2.2. The NMR chemical shifts are represented on the
horizontal axis and the chromatographic retention times (RT) on the vertical axis;
therefore, the rows of this type of diagram correspond to 1H NMR spectra of the fractions
separated during chromatography. The vertical lines at about 4.7 and 2.0 ppm arise,
respectively, from continuous flow of water and acetonitrile (residual amount existing on
the system). Along the RT axis, the different rows reveal the separation of different sugars
and organic acids present in mango juice. Figure VII.2b shows some of these rows and
Figure VII.2c shows the MS spectra corresponding to rows 2 to 5, recorded during the
continuous-flow experiment. Row 1 did not give a measurable MS spectrum.
3.54.04.55.05.5 ppm
5.15.25.35.4 ppm
Suc
Glc Glc
Suc Fru

Application of Hyphenated NMR for the Detection of Minor Components in Fruit Juices and Wine
191
a)
b) c)
Figure VII.2. a) Continuous-flow NMR chromatogram resulting from the elution of mango juice on the column ION-300 (flow rate 0.3 ml/min); b) rows extracted from the NMR chromatogram; c) MS spectra acquired concurrently with the NMR data in positive-ionisation mode. Identification of compounds in spectra 1 to 5: 1 - pectic fraction (no MS ionisation), 2 - sucrose + glucose, 3 - glucose + fructose + citric acid, 4 - fructose + malic acid, and 5 - shikimic acid.
Between 15 and 30 minutes, the NMR chromatogram shows the elution of the
major sugars and organic acids present in mango juice. Sucrose starts eluting at about 15.0
min and is immediately followed by glucose (spectrum 2), which later co-elutes with
198.0
306.9373.1
+ MS, 27.0min (#1161)
203.9
385.2
+ MS, 21.0min (#902)
204.0 385.2
+ MS, 17.5min (#739)
204.0
246.9307.0
337.3
367.3
+ MS, 13.5min (#555)
0
2
4
5x10Intens.
0
1
2
6x10
0.0
0.5
1.0
1.56x10
0.0
0.5
1.0
5x10
200 250 300 350 m/z
sec
23456 ppm
30
20
10
0
RT (min)
1
2
4
3
5
216.0
23456 ppm
5 - RT 30.0 min
4 - RT 24.0 min
3 - RT 20.0 min
2 - RT 17.0 min
1 - RT 13.0 min

Chapter VII
192
fructose and citric acid (spectrum 3). Fructose and malic acid are eluted at 24.0 min
(spectrum 4), followed by shikimic acid (spectrum 5). Although NMR data is sufficient for
the unequivocal identification of these compounds, confirmation is provided by the
corresponding MS spectra (Figure VII.2c). It must be noted that, since sodium acetate was
added to the eluent fraction sent to the mass spectrometer, in order to facilitate ionisation,
the m/z values detected are those due to ?M + Na?+ ions. Moreover, M includes
exchangeable hydrogen-to-deuterium substitutions, since D2O was used for HPLC. The
deuteration to different extents justifies the multiplet nature of the MS peaks observed for
sugars and organic acids, which have several exchangeable protons in OH and COOH
groups. Therefore, the MS data is interpreted as follows: at 17.0 min, the peaks at m/z 204
and 367 correspond, respectively, to the molecular ions ?M + Na?+ of glucose and sucrose;
at 20.0 min, the peak at m/z 385 indicates the formation of a noncovalent dimer of glucose
and/or fructose ?M + (M + Na)?+ and m/z 216 corresponds to citric acid; at 24.0 min, m/z
204 is detected again, but it now corresponds to fructose only, as shown by the NMR
spectrum; finally, at 30.0 min, shikimic acid gives a peak at m/z 198 and the noncovalent
dimer ?M + (M + Na)?+ is detected at m/z 373.
The pectic fraction in which we are especially interested in is seen to elute at earlier
retention times (spectrum 1 in Figure VII.2b), separated from the major components, thus
enabling, potentially, a more detailed characterisation of these carbohydrates.
Unfortunately, no MS data is available, because this fraction showed no ionisation under
the conditions used (positive mode). In order to improve the S/N of the 1D NMR spectrum
shown, a second chromatographic run has been carried out, during which the pectic
fraction has been collected into a capillary loop of a storage unit, for subsequent transfer to
the NMR spectrometer. The 1D spectrum acquired by accumulation of 64 scans and the
TOCSY spectrum of the same fraction are shown in Figure VII.3.
Before analysing those spectra, it is useful to recall the general structure of pectins.
Pectins are a family of complex, highly heterogeneous polysaccharides found in the cell
walls and intercellular regions of higher plants. They consist of an ? (1-4)-linked
galacturonic acid homopolymer (smooth region) interrupted by rhamnose units carrying
neutral sugar side-chains (hairy regions) (Tucker, 1993). Galacturonic acid units in both
regions are partially methyl-esterified (at carboxylic groups) and acetylated (at hydroxyl
groups). Figure VII.4 shows a schematic representation of pectin structure.

Application of Hyphenated NMR for the Detection of Minor Components in Fruit Juices and Wine
193
a) b)
Figure VII.3. a) 1H NMR spectrum (NS 64) and b) TOCSY spectrum obtained for the pectic fraction of mango juice, collected into a loop after injection of 50 ? l of juice into the column ION-300.
Figure VII.4. Schematic representation of the pectin structure (Tucker, 1993). The side chains (branched polymers of galactose and arabinose) constitute the neutral pectin which is attached to the rhamnogalacturonan acidic pectin polymers via the rhamnose residues.
The spectrum obtained for the pectic fraction of mango juice (Figure VII.3) will
now be considered. The doublets at 1.19 and 1.22 ppm, shown in the Figure insert, can be
readily assigned to methyl protons (H-6) of rhamnose units. Furthermore, a third signal at
1.23 ppm, overlapping in the 1D spectrum, could be identified in the TOCSY spectrum as
being part of another spin system also characteristic of rhamnose. With basis on the 1H
ppm
123456 ppm
2
3
4
5
6
1.52.02.53.03.54.04.55.05.56.0 ppm
5.05.2 ppm 1.21.3 ppm
Rhamnose
Side chain
Galacturonic acid chain
OCOOH
OH
OH
O O
OH
OH
COOH

Chapter VII
194
chemical shifts reported in the literature for sugars (Bock and Thøgersen, 1982) and for
rhamnogalacturonan oligosaccharides (Colquhoun et al., 1990; Schols et al., 1994), these
systems have been tentatively assigned to ? - and ? - forms of rhamnose in the terminal
position of the chain (reducing moiety) and to non-reducing rhamnose, as indicated in
Table VII.1. Another highly informative region is the 4.9-5.4 ppm region, also expanded in
Figure VII.3a, which contains signals of galacturonic acid residues. More specifically,
protons H-5 of esterified galacturonic acid units are expected to fall in the 5.0-5.1 ppm
region and to show a correlation with H-4 at about 4.3-4.4 ppm, while protons H-1 of
esterified and non-esterified residues are expected to resonate in the 4.9-5.0 ppm and 5.1-
5.2 ppm ranges, respectively (Tjan et al., 1974; Neiss et al., 1999). The spin systems
identified in the TOCSY spectrum for different galacturonic acid units that compose the
pectic fraction studied are shown in Table VII.1. Although many resonances could not be
assigned due to the still high complexity of the 2D spectrum in the 3.0-4.5 ppm region, it
may be suggested that at least five different galacturonic acid residues are present in the
fraction separated. At least two of these residues are thought to be non-esterified (as
indicated in Table VII.1), with basis on the H-1 shifts falling in the range 5.1-5.2 ppm; the
other galacturonic acid residues are possibly esterified, with basis on the correlations of
5.0-5.1 ppm with 4.3-4.4 ppm, attributed to H-5 and H-4, respectively, and on the H-1
shifts at about 5.0 ppm. Moreover, it also becomes apparent that galacturonic acid is not
present as a reducing moiety, since the H-1 signals expected to arise at 5.3 and 4.6 ppm for
? - and ? -GalA, respectively, are not observed. In what regards other neutral sugars other
than rhamnose, there is no clear evidence of their presence.
Table VII.1. 1H NMR chemical shifts (ppm) from the 1D and TOCSY spectra of the pectic fraction of mango juice; r.e.: reducing end; n.r.: non-reducing; n.i.: not identified.
H-1 H-2 H-3 H-4 H-5 H-6 Rha (r.e.) ? 5.12 4.06 3.80 3.41 3.83 1.22 ? 4.88 n.i. 3.62 3.85 3.37 1.23 Rha (n.r.) 5.19 4.23 3.76 3.32 3.56 1.19 GalA possibly esterified n.i. n.i. 3.61 4.41 5.01 n.i. n.i. 3.78 4.34 5.13 4.99 4.05 n.i. n.i. n.i. 5.02 4.05 n.i. n.i. n.i. 5.04 4.22 n.i. n.i. n.i. GalA non-esterified 5.09 4.06 3.87 n.i. n.i. 5.15 4.09 3.88 n.i. n.i.

Application of Hyphenated NMR for the Detection of Minor Components in Fruit Juices and Wine
195
In order to investigate the effect of ripening on the pectic fraction of mango juice,
HPLC-NMR data have also been collected for unripe and ripe juices of the cultivar Haden.
The 1H NMR spectra of the fractions separated in each juice are shown in Figure VII.5.
The profile of the bottom spectrum, corresponding to the ripe juice, is generally similar to
the one shown in Figure VII.3a for the ripe juice of the Tommy Atkins cultivar, except for
the more intense signal at 3.74 ppm. This signal appears to be a singlet and may arise from
methyl groups (-OCH3) esterifying the carboxylic groups of galacturonic acid residues,
thus suggesting a higher degree of methylation for the pectic fraction of the Haden juice. In
what concerns the effect of ripening, there are clear differences in the spectral profiles of
the two fractions shown in Figure VII.5. The top spectrum shows lower S/N ratio (for
equal sample amounts and number of transients), which is indicative of the smaller amount
of pectic material in the unripe juice. Moreover, this spectrum has an overall poorer
resolution, indicating the presence of larger molecules. These observations may be
interpreted in light of pectin hydrolysis reported to occur during mango ripening (Lizada,
1993). Indeed, it is expected that, as the fruit ripens, smaller and more soluble oligomers
are released from the pectin complex, being present in the liquid phase in higher amounts.
Furthermore, the spectra reveal differences in the monomer composition of the two
fractions. In the 1.0-1.4 ppm region of the unripe juice spectrum, only the doublet at 1.19
ppm, previously assigned to non-reducing rhamnose, is observed, whereas the other signals
identified in the ripe juice as belonging to ? - and ? -rhamnose (reducing moiety) are absent.
In the 3.0-4.5 ppm region, some of the most prominent signals in the unripe juice spectrum
(3.48, 3.61, 3.86, 3.90 and 4.42 ppm doublet with J 7.8 Hz) may possibly arise from ? -
galactose and/or ? -arabinose, although further confirmation by 2D spectra would be useful.
On the other hand, the signals assigned to galacturonic acid residues are much weaker in
the unripe juice spectrum, as clearly shown by comparison of the 4.9-5.4 ppm regions
expanded in the Figure inserts. These observations suggest that the pectic fraction of the
unripe juice is characterised by lower contents of galacturonic acid and higher contents of
neutral sugars (galactose/arabinose). This agrees with previous studies on the cell wall
polysaccharides of mango fruit. Brinson et al. (1988) reported that the ripe tissue fraction
contained approximately 90% galacturonic acid whereas the unripe material possessed
only 7% and was particularly rich in galactose and arabinose. The marked loss of galactose

Chapter VII
196
from the pectic polysaccharides during ripening has also been reported by Tucker and
Seymour (1991).
a)
b)
Figure VII.5. 1H NMR spectra of pectic fractions obtained after elution of a) unripe and b) ripe mango juices on the column ION-300 (injection volume 50 ? l); NS 128.
VII.3.2. Application to Spoiled and Contaminated Mango Juices
It has been shown in Chapter VI.3.2 that spoilage and microbial contamination of
mango juice induce drastic changes in the carbohydrate composition, although most of the
new sugars formed could not be identified. In this Chapter, the HPLC-NMR analysis of
three of these samples is described, in order to investigate further the nature of the changes
detected. The continuous-flow NMR chromatograms obtained for the control juice (freshly
prepared), for the spoiled juice (non-treated and stored for 132 hours at 25ºC) and for the
juice inoculated with P. expansum and stored for 132 hours (25ºC) are shown in Figure
VII.6. The compounds eluting in some of the rows are identified in the Figure. It must be
noted that the flow rate used is not the same for the three juices, as indicated in the Figure
caption, thus requiring careful comparison of retention times.
Compared to the continuous-flow NMR chromatogram of fresh mango juice
(Figure VII.6a), the NMR chromatogram of spoiled juice (Figure VII.6b) shows several
differences, reflecting some of the compositional changes discussed in Chapter VI.3.2.1.
1.52.02.53.03.54.04.55.05.5 ppm
5.2 ppm 1.21.3 ppm
5.2 ppm 1.21.3 ppm
residual CH3CN

Application of Hyphenated NMR for the Detection of Minor Components in Fruit Juices and Wine
197
a)
b)
c)
Figure VII.6. Continuous-flow NMR chromatograms obtained for mango juices eluted on the column ION-300: a) fresh ju ice, b) naturally spoiled juice (non-treated, stored for 132 hours at 25ºC) and c) juice inoculated with P.expansum and stored for 132 hours (25ºC). Flow rates: a) and c) 0.15 ml/min.; b) 0.2 ml/min.
A major difference regards the detection of a new compound in the spoiled juice eluting in
the first 4 min of chromatography, before the other juice components. Spectrum 1 in Figure
VII.7 shows the corresponding row extracted from the NMR chromatogram. Comprising
three groups of signals at about 3.55, 3.73, 3.95 ppm and a doublet at 4.97 ppm (J 2.3 Hz),
this spectrum shows a profile which is typical of a carbohydrate-type molecule, but its
sec
6 5 4 3 2 1 ppm
60
40
20
0
sec
6 5 4 3 2 1 ppm
60
40
20
0
6 - EtOH
5 - MeOH
4 - Suc + Fru + Succinic + Shikimic
3 - Suc + Fru + Glc + Quinic
2 - Suc + Fru + Glc + Citric
1 - Pectic oligosaccharides
RT (min)
RT (min)
1
sec
6 5 4 3 2 1 ppm
60
40
20
0
RT (min)
2 3
4
5 6
1
2 3 4
8
5, 6
7
8 - EtOH
7 - MeOH + Isopropanol
6 - Fru + Succinic + Lactic
5 - Fru + Cyclic acid
4 - Fru + Glc + Citric
3 - Suc + Fru + Glc
2 - Pectic oligosaccharides
1 - Unassigned I
1 2
8, 9, 10
6
7
10 - EtOH
9 - Acetoin
8 - MeOH + Isopropanol 7 - Fru + Succinic + Shikimic + Lactic
6 - Fru + Quinic
5 - Un. III + Citric
4 - Unassigned III
3 - Un. I + Pectic olig.. + Unassigned II
2 - Un. I + Pectic oligosaccharides
1 - Unassigned I
3, 4, 5

Chapter VII
198
3 - RT 51.0 min
2 - RT 36.5 min
1 - RT 3.0 min
Figure VII.7. Rows extracted from the NMR chromatogram of the spoiled juice shown in Figure VII.6b.
structure has not been determined yet (compound named as ‘Unassigned I’). As it elutes
very early in the chromatography, even before the pectic fraction, it should arise from a
relatively large compound with low affinity for the cation-exchange polymer contained in
the chromatographic column used. Later in the chromatography, at about 36.5 min, another
new compound is detected in the NMR chromatogram of the spoiled juice, co-eluting with
fructose. The corresponding 1H spectrum (spectrum 2 in Figure VII.7) shows the signals of
fructose and six weak signals (marked with arrows) that have been identified in Chapter
VI.3.2.1 to belong to the spin system of a cyclic acid, possibly derived from quinic and/or
shikimic acids and proposed to be 3,4,5-trihydroxyciclohexane carboxylic acid. The
absence of quinic and shikimic acids in the spoiled juice is indeed clearly visible by
comparing the continuous-flow diagrams shown in Figures VII.6a and VII.6b. Other
compounds that have been seen to increase by the effect of spoilage (Figure VI.2b in
Chapter VI.3.2.1) and are clearly detected in the NMR chromatogram of the spoiled juice
(Figure VII.6b) are succinic and lactic acids, co-eluting at 39.0 min, and isopropanol, co-
eluting with methanol at about 51.0 min. This latter row is shown in Figure VII.7
(spectrum 3). In this spectrum, the ratio between the area of the doublet at 1.14 ppm and
3.43.63.84.04.24.44.64.85.05.25.4 ppm
1.52.02.53.03.5 ppm
Isopropanol
MeOH
1.52.02.53.03.54.0 ppm
Fru + new cyclic acid
Unassigned I

Application of Hyphenated NMR for the Detection of Minor Components in Fruit Juices and Wine
199
the area of the multiplet at 3.72 ppm is 6.0, thus confirming the identification of
isopropanol. This is a useful finding, since, when the spectrum of the whole juice has been
analysed in the previous Chapter, these signals, which were partially or totally overlapped,
could not be conclusively assigned because the chemical shifts observed were consistent
with either isopropanol or 2,3-butanediol.
The continuous-flow NMR chromatogram of juice contaminated with P. expansum
(Figure VII.6c) also shows marked differences compared to the diagram in Figure VII.6a.
Again, there is a new compound eluting before the pectic fraction. The row in which this
compound is detected is shown in Figure VII.8 (spectrum 1) and is identical to the row
separated in the spoiled juice at early retention times, indicating that the same unassigned
carbohydrate-like compound (‘Unassigned I’) is formed in the contaminated juice, as
already noted in Chapter VI.3.2.3.
4 - RT 27.0 min
3 - RT 25.0 min
2 - RT 20.5 min
1 - RT 15.0 min
Figure VII.8. Rows extracted from the NMR chromatogram of the juice contaminated with P. expansum shown in Figure VII.6c.
The following rows of the contaminated juice NMR chromatogram are distinct from those
found in the fresh juice, especially due to the absence of sucrose and glucose. Moreover,
new sugars are detected in those rows, as shown in Figure VII.8 (spectra 3 and 4).
Spectrum 3 (RT 25.0 min) contains signals from the compounds eluting earlier (spectra 1
Unassigned I
Un. I + Pectic oligosaccharides
Un. I + Pectic olig. + Unassigned II
Unassigned III
3.43.63.84.04.24.44.64.85.05.25.4 ppm

Chapter VII
200
and 2), but also some other signals, such as the doublet at 5.40 ppm, which must arise from
a different sugar, the identity of which is still unknown. At 27.0 min (spectrum 4), another
unidentified new sugar is seen to elute, giving rise to signals at 3.41, 3.56, 3.71-4.06 and
5.11 ppm, which have already been identified to be part of the same spin system in the
TOCSY spectrum of the contaminated juice, analysed in the previous Chapter. This sugar
has now been separated from the other juice components, and additional information may
be obtained from its spectrum. For instance, the fact that the doublet at 5.11 ppm (J 3.8 Hz)
is the only signal detected in the anomeric region of the spectrum suggests that the
anomeric proton is not free and that this sugar is non-reducing, since, otherwise, two
signals for the ? - and ? -configuration would be observed. Obviously, further structural
elucidation of this compound needs to be carried out in and, in the future, it would be
useful to acquire MS data in addition to NMR spectra. Other differences detected in the
NMR chromatogram of the contaminated juice (Figure VII.6c) compared to the fresh juice
(Figure VII.6a) are: the detection of lactic acid, co-eluting with shikimic and succinic
acids, the increased intensity of the isopropanol signals, and the appearance of acetoin,
eluting right before ethanol. Indeed, all these compounds have been previously shown to
suffer significant increases by the effect of the P. expansum growth in the natural mango
juice (Chapter VI.3.2.3, Figure VI.9).
Hence, the main advance obtained by HPLC-NMR relatively to the NMR analysis
carried out in Chapter VI consisted of separating some of the carbohydrates formed upon
spoilage and microbial contamination, thus providing additional structural information,
although not having enabled their full assignment yet.
VII.4. Characterisation of Aromatic Compounds in Grape Juice
Figure VII.9 shows the 1H NMR spectrum of red grape juice. As expected, the most
intense signals arise from the sugars glucose and fructose, known to be the major
components of grape juice (Peynaud and Ribéreau-Gayon, 1971). The other regions of the
spectrum, vertically expanded in the Figure, show many lines, revealing the great chemical
complexity of the sample. It is beyond the aim of this work to pursue extensive assignment
or give an exhaustive description of grape juice composition. Nevertheless, partial
assignment based on the analysis of 1D and TOCSY spectra, and on the assignment of

Application of Hyphenated NMR for the Detection of Minor Components in Fruit Juices and Wine
201
mango juice, previously carried out in Chapter III, is given in Table VII.2. Some signals
are also labelled in Figure VII.9.
Figure VII.9. 500 MHz 1H NMR spectrum of red grape juice; NS 512.
In the aliphatic region, ten amino acids have been identified (e.g. valine, threonine,
alanine, proline, arginine, glutamine), as well as the acids malic, succinic and acetic,
ethanol and rhamnose. In the sugar region, besides glucose and fructose, signals from
pectic galacturonic acid units and tartaric acid have been detected. In the aromatic region,
the TOCSY spectrum (Figure VII.10a) shows a great number of cross peaks, but their
assignment is not straightforward because most spin systems are described by two
chemical shifts only, and no more couplings are observed. For instance, the cross-peaks
outlined by box I in Figure VII.10a correspond to at least five pairs of doublets with
similar chemical shifts and coupling constants (J 16 Hz), without any other TOCSY
correlations. These signals may arise from olefinic protons of trans-cinnamic acids or their
derivatives, known to be present in grape juice in reasonable concentrations (Spanos and
Wrolstad, 1992), either free or esterified. In addition, the signals in box II (Figure VII.10a)
correspond to another five spin systems (with two chemical shifts each) that may arise
from the ring protons of those compounds. However, due to the structure of cinnamic
derivatives (Figure VII.10b), the olefinic protons (I) have no TOCSY correlation with the
phenyl protons (spin system II), and in the esterified form there are no correlations with the
protons of the ester radical (III). Consequently, only fragments of spin systems are visible
in the TOCSY spectrum, hindering the identification of the different cinnamic compounds.
Arg
9 8 7 6 5 4 3 2 ppm
789 ppm 1.52.02.5 ppm
Ala
Thr Val, Leu, Ile
Glc
GAB
Acetic Malic
Succinic
Fru

Chapter VII
202
a) b)
Figure VII.10. a) 500 MHz TOCSY spectrum of red grape juice; b) Structure of some cinnamic compounds commonly found in grapes; I, II and III indicate different spin systems.
The identification of this kind of phenolic acids by high resolution NMR has been
reported in the literature. Gerothanassis et al. (1998) investigated the phenolic composition
of oregano extracts by using a combination of 2D methods (COSY, TOCSY and
NOESY/ROESY), and, in particular, by making use of the NOE/ROE effect between
spatially close but uncoupled 1H nuclei to establish the connection between the olefinic and
the phenyl protons. Further work has been carried out by Exarchou et al. (2001), who
performed COSY experiments at low temperature and 1H-13C heteronuclear multiple-bond
correlation (HMBC) experiments to resolve the signals of caffeic and rosmaniric acid in
plant extracts. These approaches show clear advantages over classical analysis, where
individual phenolic acids require isolation and purification prior to structural identification,
but have the disadvantages of involving long experimental times for acquisition of 2D
NMR spectra, and a demanding work of spectral interpretation. The work hereby reported
aims at showing the potential of the HPLC-NMR/MS method for separating and
identifying these phenolic acids and other aromatic compounds present in grape juice.
ppm
6.57.07.5 ppm
6.5
7.0
7.5
8.0
II
R1 H
CH
HR2
HO CH COOH
R1 H
CH
HR2
HO CH C
O
O R3
p-Coumaric acid: R1, R2 = H Caffeic acid: R1 = H, R2 = OH Ferulic acid: R1 = H, R2 = OCH3
R3 = tartaric acid, quinic acid, sugars, etc.
I III
Cinnamic acids
Cinnamic esters
II II
I
I

Application of Hyphenated NMR for the Detection of Minor Components in Fruit Juices and Wine
203
Table VII.2. 1H chemical shifts, multiplicity and JHH for assigned compounds in grape juice; s: singlet, d: doublet, t: triplet, dd: doublet of doublets, m: multiplet; (a) tentative identification; un.: unassigned.
Compound Assignment ? 1H (ppm) Multiplicity J (Hz)
Acetic acid ?CH3 2.08 s Alanine ?CH3
? CH 1.48 3.83
d 7.2
?-Aminobutyric acid (GABA)
?CH2
? CH2
?CH2
1.94 2.48 3.04
t
7.4
Arginine
?CH2
?CH2
?CH2
? CH
1.68 1.90 3.22 3.79
m
Ethanol CH3 CH2
1.18 3.65
t 7.1
Fructose (?-furanose)
C6H C5H
C3H, C4H
3.67 3.80 4.11
Fumaric (a) CH 6.65 s ? -Galacturonic acid
(pectic, non-reducing) / ? -Rhamnose (a)
un. un. un. un.
4.00, 4.12, 5.08 3.92, 4.28, 5.11
4.13, 5.15 3.92, 5.18
? -Galacturonic acid (free/pectic, reducing
end) (a)
C2H C3H C4H C1H
3.82 3.92 4.33 5.31
broad
Gallic acid (a) C2H, C6H 7.06 or 7.15 s ? -Glucose C4H
C2H C3H C6H C5H C1H
3.40 3.53 3.70 3.77 3.82 5.23
d
3.7 ?-Glucose C2H
C4H C5H C3H C6H C1H
3.24 3.40 3.46 3.49
3.72, 3.89 4.64
dd d
7.9 Glutamic acid ? ,?’CH
?CH2
? CH
2.10 2.51 4.28
Glutamine ?CH2 ?CH2
? CH
2.15 2.54 3.82

Chapter VII
204
Table VII.2 (cont.)
Compound Assignment ? 1H (ppm) Multiplicity J (Hz)
Isoleucine
?CH3 ?’CH3
?CH ? CH
0.93 1.00 1.98 3.71
Leucine ? , ?’CH3 ?CH2, ?CH
? CH
0.95 1.71 3.77
Malic acid
?CH
?’CH
? CH
2.78 2.90 4.53
dd
6.5, 16.5
Niacin C5H C4H, C6H
C2H
8.06 8.82 9.12
s
Phenylalanine C3H, C5H C4H
C2H, C6H
7.32 7.37 7.41
Proline
?CH2
?CH2 ?CH2 ?CH2
?CH2
? CH
2.00 2.06 2.33 3.33 3.41 4.14
m
Succinic acid ? , ?CH2 2.65 s Tartaric acid
CH 4.52 s
Threonine ?CH3 ? CH ?CH
1.32 3.63 4.27
d 6.4
Tyrosine C3H, C5H C2H, C6H
6.89 7.17
Uridine C5H, C1’H C6H
5.89 7.85
d
8.3
Valine ?CH3
?’CH3
?CH ? CH
0.98 1.03 2.27 3.65
d d

Application of Hyphenated NMR for the Detection of Minor Components in Fruit Juices and Wine
205
The UV chromatogram obtained by HPLC elution of the grape juice, using the
conditions previously described in section VII.2.2, shows the detection of many peaks at
280, 320 and 365 nm (Figure VII.11a), which are major absorption wavelengths for a wide
range of phenolic compounds (Revilla and Ryan, 2000). Some peaks are not very well
resolved, but this is not of great concern, since they are subsequently analysed by NMR
and MS, which are potentially capable of distinguishing between co-eluting compounds.
Figures VII.11b and VII.11c show the
Total Ion Current (TIC) MS
chromatograms obtained in negative and
positive ionisation modes, respectively,
during two chromatographic runs. For
most retention times, the TIC obtained in
negative mode (Figure VII.11b) shows
higher intensity than the one obtained in
positive mode (Figure VII.11c). Therefore,
data obtained by negative ionisation are
preferably reported, as in most studies
reporting the analysis of phenolic
compounds by ESI-MS (Pérez-Margariño
et al., 1999; Lazarus et al., 1999; Fulcrand
et al., 1999). Indeed, Fulcrand et al.
(1996) found that, generally, the response
of polyphenols is better in the negative
ionisation mode than in the positive mode.
The continuous-flow NMR chromatogram is shown in Figure VII.12a. At early
retention times, the most polar metabolites elute together, giving rise to the series of bands
that appear at the start of the chromatogram. Among these are the sugars glucose and
fructose, several amino acids (e.g. val, leu, ala, gln, glu), organic acids (e.g. malic,
succinic, citric) and ethanol. With respect to aromatic components, at least 14 rows
containing signals in the 6.0-10.0 ppm region are detected, which is indicative of the rich
aromatic composition of the grape juice.
0 5 10 15 20 25 30 Time [min]
0
500
1000
1500
2000
2500
Intens.[mAU]
0 5 10 15 20 25 30 Time [min]
0
500
1000
1500
2000
2500
Intens.[mAU]
0 5 10 15 20 25 30 Time [min]
0
500
1000
1500
2000
2500
Intens.[mAU]
Figure VII.11. a) UV chromatogram (280, 320, 365 nm), b) MS TIC (negative mode) and c) MS TIC (positive mode), resulting from the elution of grape juice on the column RP18 (flow rate 1.00 ml/min).
a)
c)
b)

Chapter VII
206
a) b)
Figure VII.12. a) Continuous-flow NMR chromatogram resulting from the elution of red grape juice on the column RP18 (flow rate 1.00 ml/min) and b) rows extracted from the NMR chromatogram.
Compared to the grape juice spectrum (Figure VII.9), the spectra of the rows, such
as those shown in Figure VII.12b, are easier to assign, since they arise from much simpler
fractions. In some cases, however, the S/N of the spectra registered during the on-flow
experiment (with only 16 scans each) is too low. In order to improve the results, a loop-
sampling experiment was performed. 1D spectra with 64 scans and in some cases TOCSY
spectra were recorded for the fractions collected. Moreover, automatic switch between
positive and negative ionisation was employed and MS/MS experiments were carried out
to identify fragment ions. In this way, several aromatic compounds could be identified in
grape juice and Table VII.3 summarises the results, putting together the UV, MS and NMR
data registered in each case; the structure of some of the compounds listed is not
completely elucidated, for reasons that will be explained further ahead, and their tentative
identification is marked with (a). The following paragraphs discuss the results obtained in
more detail.
Figure VII.13 shows the 1H NMR spectra in the aromatic region of four fractions
collected into loops during the first 10 min of chromatography. Spectrum 1 (RT 4.6 min) is
rather complex as it shows many signals, appearing to reflect the coelution of several
compounds. Among the signals detected, the doublets overlapping at 5.83 ppm and the
sec
8 7 6 5 4 3 2 1 ppm
30
20
10
0
RT (min)
8 7 6 5 4 3 2 ppm
RT 26.2 min
RT 21.9 min
RT 12.8 min
RT 8.8 min

Application of Hyphenated NMR for the Detection of Minor Components in Fruit Juices and Wine
207
doublet at 7.81 ppm may be assigned to a uridine system. Spectrum 2 (RT 6.4 min) is
probably a compound related to epicatechin, but its structure is still not clear. Spectrum 3
(RT 7.0 min) shows the compound detected in spectrum 2 and a singlet arising from gallic
acid (? 7.12 ppm). The identification of this phenolic acid (Mw 170) is confirmed by the
respective mass spectrum, which shows a peak at m/z 172, corresponding to the fully
deuterated molecular ion ?M - D?- of gallic acid. Spectrum 4 (RT 8.8 min) shows the
presence of phenylalanine. The additional high-field signals and the MS peak at m/z 170
(in positive- ionisation mode) provide unambiguous confirmation of the presence of this
aromatic amino acid, which is overlapped in the 1D spectrum.
4 – RT 8.8 min
3 – RT 7.0 min
2 – RT 6.4 min
1 – RT 4.6 min
Figure VII.13. 1H NMR spectra of four fractions of grape juice collected into loops.
Between 10 and 30 min, good separation is noted for several aromatic compounds.
The compounds eluting at 12.8, 15.8 and 21.9 min are unequivocally identified as
cinnamic constituents, with basis on the comparison of their NMR spectra with published
data (Gerothanassis et al., 1998; Lu and Foo, 1999), and also with basis on the
corresponding MS spectra (Figure VII.14). The data shown in Figure VII.14a is consistent
with the presence of trans-caftaric acid (trans-caffeoyltartaric acid), the most abundant
cinnamic compound known to occur in grapes (Singleton et al., 1986). The signals found
6.06.57.07.58.08.5 ppm

Chapter VII
208
a) RT 12.8 min
b) RT 15.8 min
c) RT 21.9 min
Figure VII.14. 1H NMR and MS spectra of three fractions of grape juice collected into loops: a) RT 12.8 min, trans-caftaric acid; b) RT 15.8 min, trans-coutaric acid; and c) RT 21.9 min, p-coumaric acid.
5.56.06.57.07.5 ppm
5.56.06.57.07.5 ppm
5.56.06.57.07.5 ppm
151.9180.9
315.1
- MS, 4.1min (#78)
150.9180.9
- MS2(315.0), 4.4min (#82)0
1
2
3
5x10Intens.
0
2
4
6
4x10
150 200 250 300 350 m/z
MS
MS/MS
163.8
298.0
- MS, 4.6min (#84)
163.8- MS2(298.0), 4.9min (#87)
0.0
0.5
1.0
5x10Intens.
0
2
4
4x10
150 200 250 300 350 400 m/z
MS
MS/MS
163.9
- MS, 4.2min (#78)
146.9
- MS2(164.0), 4.4min (#80)0
1
2
4x10Intens.
0
250
500
750
1000
150 200 250 300 350 m/z
MS
MS/MS
C
HO
HO
O
O CHCOOH
CHOHCOOH
C
HO
O
O CHCOOH
CHOHCOOH
COOH
HO

Application of Hyphenated NMR for the Detection of Minor Components in Fruit Juices and Wine
209
in the 6.0-8.0 ppm region of the 1H NMR spectrum are consistent with a trans-caffeoyl
moiety: the aromatic ring protons originate an ABX spin system at 6.89 (J 8.3 Hz), 7.10 (J
8.3 Hz) and 7.17 ppm and the olefinic protons give rise to a pair of doublets at 6.39 and
7.67 ppm (J 16.0 Hz). The doublets seen at 4.81 and 5.50 ppm indicate that this caffeoyl
moiety is esterified with tartaric acid, thus being trans-caftaric acid. Further confirmation
is given by the MS data recorded for this fraction, as the mass spectrum shows a peak at
m/z 315, corresponding to the molecular ion ?M - D?- for trans-caftaric acid with the 3 OH
and the 2 COOH groups all deuterated. The fragmentation of this ion, seen in the MS/MS
spectrum, originates, as expected, the ions corresponding to caffeic (m/z 181) and tartaric
(m/z 151) acids. The ? max 322 nm observed in the UV spectrum also agrees with the
expected value for trans-caftaric acid (Revilla and Ryan, 2000). Figure VII.13b shows the
data obtained for the fraction of grape juice collected at 15.8 min, which indicates the
presence of trans-coutaric acid (trans-coumaroyltartaric acid). The trans-coumaroyl group
is identified by the AB resonance system (6.89 and 7.56 ppm, J 8.6 Hz) and by the
doublets arising from the olefinic protons (6.43 and 7.73 ppm, J 16.2 Hz). Again, the
doublets at 4.81 and 5.50 ppm are detected, indicating esterification with tartaric acid. This
assignment is corroborated by MS, as the mass spectrum of this fraction shows a peak at
m/z 298 corresponding to the molecular ion ?M - D?- of coutaric acid with exchangeable
protons fully deuterated. In the MS/MS spectrum, the fragment ion with m/z 164
corresponding to coumaric acid is observed. The data shown in Figure VII.13c,
corresponding to the fraction collected at 21.9 min, enables the identification of free p-
coumaric acid in grape juice.
Besides the compounds identified above, other cinnamic derivatives are seen to
elute at 16.9, 17.5 and 18.1 min (coumaric and ferulic derivatives marked with (a) in Table
VII.3). The first fraction shows 1H NMR signals characteristic of a p-coumaroyl moiety
together with sugar resonances (spectrum 1 in Figure VII.15). The corresponding mass
spectrum shows a peak at m/z 329, which gives fragment ions with m/z 164, 236 and 267.
Among the most common cinnamic esters, listed in Table VII.4 along with the respective
molecular weights, an ester of p-coumaric acid with an hexose is most likely the compound
detected. The hexose identity is, however, not known due to the low S/N in the NMR
spectrum acquired. The 17.5 min fraction also shows m/z 329 in the mass spectrum, but in
the MS/MS spectrum a fragment ion with m/z 194 is obtained, suggesting the presence of
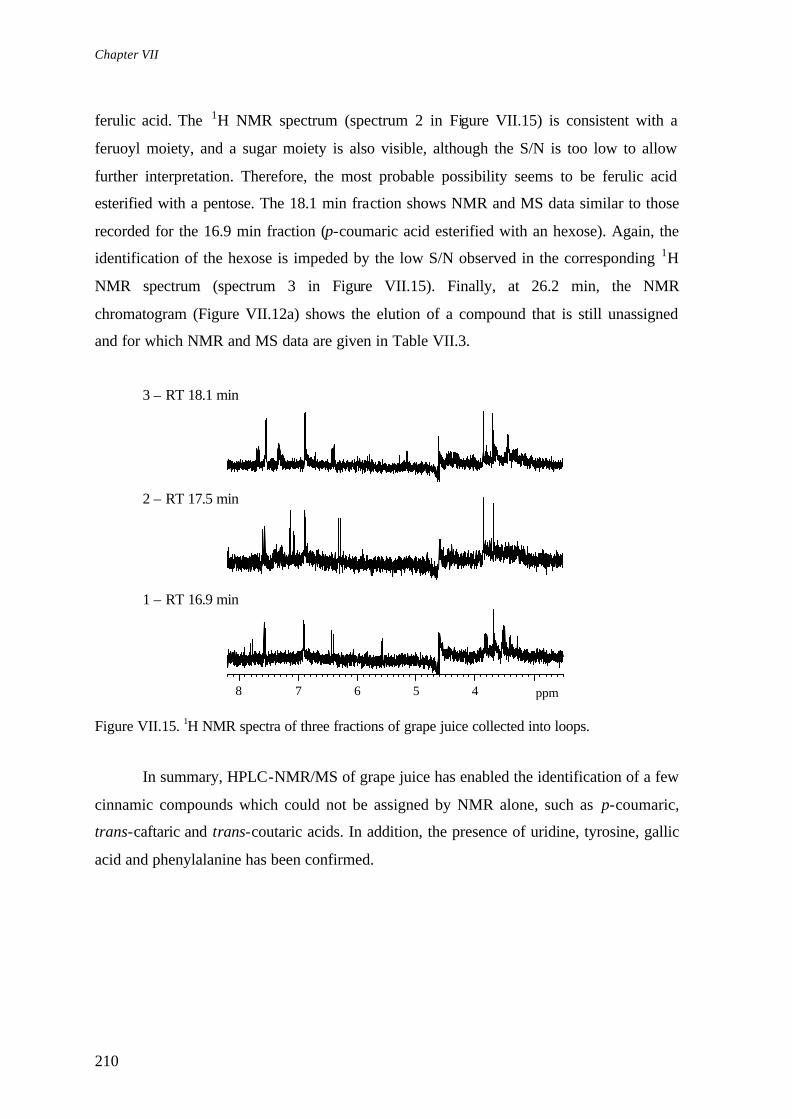
Chapter VII
210
ferulic acid. The 1H NMR spectrum (spectrum 2 in Figure VII.15) is consistent with a
feruoyl moiety, and a sugar moiety is also visible, although the S/N is too low to allow
further interpretation. Therefore, the most probable possibility seems to be ferulic acid
esterified with a pentose. The 18.1 min fraction shows NMR and MS data similar to those
recorded for the 16.9 min fraction (p-coumaric acid esterified with an hexose). Again, the
identification of the hexose is impeded by the low S/N observed in the corresponding 1H
NMR spectrum (spectrum 3 in Figure VII.15). Finally, at 26.2 min, the NMR
chromatogram (Figure VII.12a) shows the elution of a compound that is still unassigned
and for which NMR and MS data are given in Table VII.3.
3 – RT 18.1 min
2 – RT 17.5 min
1 – RT 16.9 min
Figure VII.15. 1H NMR spectra of three fractions of grape juice collected into loops.
In summary, HPLC-NMR/MS of grape juice has enabled the identification of a few
cinnamic compounds which could not be assigned by NMR alone, such as p-coumaric,
trans-caftaric and trans-coutaric acids. In addition, the presence of uridine, tyrosine, gallic
acid and phenylalanine has been confirmed.
45678 ppm

Application of Hyphenated NMR for the Detection of Minor Components in Fruit Juices and Wine
211
Table VII.3. UV, MS and NMR data of aromatic constituents, obtained by HPLC-NMR/MS analysis of grape juice, using the loop-sampling method; n.i.: not identified; n.a.: not acquired; (a) structure not fully known.
RT (min)
?max (nm)
m/z ?M – D?- NMR signals ? in ppm (mult., J in Hz)
Compound
MS MS/MS 4.6 273/308 n.i. n.i. 5.82 (d, 8.0), 5.84 (d, 4.5),
7.81 (d, 8.0) Uridine (Mw 244)
5.5 272 183 n.a. 6.81 (d, 8.5), 7.11 (d, 8.5) Tyrosine (Mw 181)
6.4 278 376 128 163 274 292
5.45 (s), 6.89 (s), 6.98 (s) (a) Epicatechin derivative
7.0 272 172 127 7.12 (s)
Gallic acid (Mw 170)
8.8
280 ?M + D?+
170 122
3.08 (dd, 14.0 8.0), 3.25 (dd, 15.0 5.0), 4.02 (m), 7.26 (m), 7.32 (m), 7.36 (m)
Phenylalanine (Mw 165)
12.8 322 315 151 181
4.81 (d, 2.2), 5.50 (d, 2.2), 6.39 (d, 16.0), 6.89 (d, 8.3), 7.10 (d, 8.3), 7.17 (s), 7.67 (d, 16.0)
trans-Caftaric acid (Mw 312)
15.8 307 298 164 4.81 (d, 2.2), 5.50 (d, 2.2), 6.43 (d, 16.2), 6.89 (d, 8.6), 7.56 (d, 8.6), 7.73 (d, 16.2)
trans-Coutaric acid (Mw 296)
16.9 307 329 164 236 267
sugar resonances + 6.41 (d, 16.2), 6.89 (d, 8.6), 7.54 (d, 8.6), 7.67 (d, 16.2)
(a) p-Coumaric + hexose (Mw 326)
17.5 315 329 194 sugar resonances + 6.30 (d, 16.0), 6.88 (d, 8.2), 7.07 (d, 8.2), 7.14 (s), 7.58 (d, 16.0)
(a) Ferulic + pentose (Mw 326)
18.1 307 329 164 236 267
sugar resonances + 6.41 (d, 16.0), 6.88 (d, 8.4), 7.54 (d, 8.3), 7.67 (d, 16.0)
(a) p-Coumaric + hexose (Mw 326)
21.9 307 164 147 6.34 (d, 16.1), 6.88 (d, 8.5), 7.53 (d, 8.5), 7.64 (d, 16.1)
p-Coumaric acid (Mw 164)
26.2 254/281 ?M + D?+ 115
97
1.80 (d), 5.78 (d), 6.26, 7.26
Unassigned
Table VII.4. Molecular weights of cinnamic acids and esters commonly found in grapes.
coumaric ferulic caffeic 164 194 180
tartaric 150 296 326 312 quinic 192 338 368 354 malic 134 280 310 296
shikimic 174 320 350 336 pentose 150 296 326 312 hexose 180 326 356 342

Chapter VII
212
VII.5. Characterisation of Aromatic Compounds in a Wine Phenolic
Extract
Figure VII.16b shows the 1H NMR spectrum of the red wine phenolic extract,
analysed by HPLC-NMR/MS, compared to the spectrum of the original wine sample
(Figure VII.16a). The expected concentration increase of phenolic constituents was
achieved, as viewed by the higher intensity of aromatic signals and the lower intensity of
the sugar peaks in the spectrum of the extract. However, one can also see several
differences in the aromatic profiles (inserts), which are due to losses (e.g. niacin and
acetaldehyde) or chemical modifications occurring during the extraction procedure.
The aromatic section of the TOCSY spectrum recorded for the wine extract (Figure
VII.16c) shows many cross-peaks, of which some may be tentatively assigned to tyrosine
and/or tyrosol, and to cinnamic acids. However, like in the case of grape juice, the
unambiguous identification of these and other aromatic compounds is very difficult
because most of them show incomplete spin systems and a high degree of overlap.
Continuous-flow HPLC-NMR/MS analysis is used here to tackle this problem.
a) c)
b)
Figure VII.16. 500 MHz 1H NMR spectra of a) red wine and of b) the phenolic extract prepared from that wine; c) Aromatic section of the 500 MHz TOCSY spectrum of the wine extract.
ppm
6.57.07.58.0 ppm
6.5
7.0
7.5
8.0
H2O
EtOH
EtOH + glycerol
Acetic
9 8 7 6 5 4 3 2 ppm
789 ppm
Ethyl acetate
Ethyl acetate

Application of Hyphenated NMR for the Detection of Minor Components in Fruit Juices and Wine
213
Figure VII.17 shows the UV chromatogram registered at 280, 320 and 365 nm and
the total ion current MS chromatogram obtained by negative electrospray ionisation. Many
signals are detected in both traces. The continuous-flow NMR chromatogram (Figure
VII.18a) exhibits a good separation as a function of RT and example rows are shown. The
information obtained from UV, MS and NMR chromatograms is summarised in Table
VII.5 and discussed in the following paragraphs.
a) b)
Figure VII.17. a) UV chromatogram (280, 320, 365 nm) and b) MS TIC (negative ionisation), resulting from the elution of the wine extract on the column RP18 (flow rate 1.00 ml/min.).
a) b)
Figure VII.18. a) Continuous-flow NMR chromatogram resulting from the elution of the wine extract on the column RP18 (flow rate 1.00 ml/min.) and b) rows extracted from the NMR chromatogram.
Gallic acid is the first aromatic component detected, eluting between 4.0 and 7.0
min, after succinic (? 2.61 ppm) and tartaric (? 4.32 ppm) acids. The presence of this
phenolic acid is confirmed by the singlet at 7.12 ppm in the 1H NMR spectrum (spectrum 1
0 10 20 30 Time [min]
0
500
1000
1500
2000
2500
Intens.[mAU]
0 10 20 30 Time [min]
0
500
1000
1500
2000
2500
Intens.[mAU]
sec
8 7 6 5 4 3 2 1 ppm
30
20
10
0
RT (min)
8 7 6 5 4 3 2 ppm
1 - RT 5.5 min
2 - RT 12.5 min
3 - RT 14.2 min
4 - RT 17.3 min

Chapter VII
214
in Figure VII.18b) and by the peak at m/z 172 observed in the negative- ionisation mode
mass spectrum. Between 12.0 and 14.5 min, two separate rows with an identical profile in
the aromatic region are seen (spectra 2 and 3 in Figure VII.18b). Both spectra contain
doublets at 6.83 and 7.16 ppm (J 8.5 Hz) and may only be distinguished with basis on the
high-field signals, which enable the assignment to tyrosine (spectrum 2) and tyrosol
(spectrum 3). The latter shows a triplet at 3.76 ppm arising from CH2OH, and a triplet at
2.76 ppm (CH2-CH2OH), partially overlapped by the citric acid signals at ~2.8 ppm. The
presence of tyrosine is further confirmed by the peak at m/z 183, corresponding to ?M - D?-.
It is important to note that 1D and TOCSY spectra of the whole sample did not enable
these compounds to be distinguished, as their aromatic signals overlap and there is no
coupling between aromatic and aliphatic protons.
The rows recorded between 14.5 and 20.0 minutes clearly show the elution of three
phenolic compounds: catechin, caffeic acid and epicatechin. The UV, NMR and MS data
that allowed their unequivocal identification are summarised in Table VII.5 and the cases
of catechin and epicatechin are shown in Figure VII.19a and VII.19b. These compounds
have identical absorbance properties (? max 278 nm) and, being isomers, show the same m/z
values in the mass spectra: m/z 294 for the molecular ion ?M - D?- of deuterated
(epi)catechin, and m/z 589 for noncovalent dimers ?M + (M - D)?- of two stacked
(epi)catechin molecules, formed during MS analysis. This phenomenon of self-association
is often observed by electrospray MS of these type of substances (Fulcrand et al., 1999).
Distinction of such compounds becomes possible due to their 1H NMR spectra, assignable
to catechin and epicatechin with basis on literature data (Lu and Foo, 1999). In the case of
catechin (trans-orientation), large couplings are observed between H-2 and H-3 (4.78 and
4.24 ppm, J 7.0 Hz), while for epicatechin (cis-orientation) broad singlets at 5.00 and 4.34
ppm are seen for those protons.
Finally, several aromatic compounds are detected between 20 and 40 minutes, but
only tryptophane (RT 24.7 min) and trans-reveratrol (RT 31.3 min) have been identified so
far. Figure VII.19c shows the NMR and MS data that demonstrate the presence of trans-
resveratrol, a phenolic substance known for its strong antioxidant activity and potential
health benefits.

Application of Hyphenated NMR for the Detection of Minor Components in Fruit Juices and Wine
215
a) RT 15.2 min
b) RT 18.3 min
c) RT 31.3 min
Figure VII.19. 1H NMR and MS spectra of three fractions of the wine extract collected into loops: a) RT 15.2 min, catechin; b) RT 18.3 min, epicatechin and c) RT 31.3 min, trans-resveratrol.
3.03.54.04.55.05.56.06.57.07.5 ppm
3.03.54.04.55.05.56.06.57.07.5 ppm
6.46.66.87.07.27.47.67.8 ppm
HO
HO
OH
154.9
294.1589.2
- MS, 15.4min (#992)
0
1
2
3
4
5x10Intens.
200 300 400 500 600 700 800 m/z
161.9
294.1
407.1
589.2
- MS, 18.4min (#1202)
0
1
2
3
5x10Intens.
200 300 400 500 600 700 800 m/z
230.1
362.4457.3528.4
625.3695.2
- MS, 31.4min (#2092)
0.0
0.5
1.0
1.5
2.0
2.5
5x10Intens.
200 300 400 500 600 700 800 m/z

Chapter VII
216
Table VII.5. UV, MS and NMR data of aromatic constituents, obtained by HPLC-NMR/MS analysis of wine phenolic extract, using the continuous-flow method; n.i.: not identified.
RT (min)
?max (nm)
m/z ?M - D?-
NMR signals ? in ppm (mult., J in Hz)
Compound
4.0-7.0 278 172 7.12 (s) Gallic acid (Mw 170)
12.5 272 183 2.90 (dd, 15.0 8.0), 3.04 (dd, 15.0 5.0), 3.83, 6.83 (d, 8.5), 7.16 (d, 8.5)
Tyrosine (Mw 181)
14.2 274 n.i. 3.76 (t, 6.5), 6.83 (d, 8.5), 7.16
(d, 8.5) Tyrosol (Mw 138)
15.2 278 294
2.55 (dd, 17.1 8.5), 2.87 (dd, 17.1 5.1), 4.24 (m), 4.78 (d, 7.0), 6.01 (bs), 6.09 (bs), 6.86 (d, 8.2), 6.92 (d, 8.2), 6.92 (bs)
Catechin (Mw 290)
17.3 305 181 6.37 (d, 16.0), 6.95 (d, 8.6), 7.14 (d, 8.6), 7.21 (s), 7.65 (d, 16.0)
Caffeic acid (Mw 180)
18.3 278 294
2.76 (dd 17.1, 3.5), 2.94 (dd 17.1, 4.5), 4.34 (bs), 5.00 (bs), 6.09 (bs), 6.11 (bs), 6.95 (bs), 7.06 (s)
Epicatechin (Mw 290)
24.7 278 206 3.25 (dd 14.0, 6.8), 3.34 (dd 14.5, 5.0), 3.82 (m), 7.20 (t 7.0), 7.28 (t 7.0), 7.31 (s), 7.54 (d 8.0), 7.74 (d 8.0)
Tryptophane (Mw 204)
31.3 305 230 6.39 (s), 6.72 (s), 7.00 (d 8.5), 7.05 (d 16.5), 7.24 (d 16.5), 7.60 (d 8.5)
trans-Resveratrol (Mw 228)
VII.6. Conclusions
HPLC-NMR/MS has been applied to characterise the composition of ripe mango
juice (cv. Tommy Atkins). The major sugars and organic acids have been readily identified
with basis on both NMR and MS data. Most importantly, a pectic fraction has been
separated and its structural characterisation attempted. Unfortunately, this fraction showed
no ionisation under the conditions used (positive- ionisation mode) and, thus, information
on its molecular weight could not be obtained. The NMR data (1D and TOCSY spectra)
revealed the presence of at least two different types of rhamnose: a reducing terminal, for
which ? - and ? -forms have been identified, and a non-reducing residue, probably
interspersed with galacturonic acid residues. Moreover, at least five different galacturonic
acid residues have been found to be present in the fraction separated, some of which (at
least two) showed methyl esterification at carboxylic groups. The pectic fractions of unripe

Application of Hyphenated NMR for the Detection of Minor Components in Fruit Juices and Wine
217
and ripe juices (cv. Haden), separated by HPLC and analysed on- line by NMR, have
shown several differences. The pectic material detected in the unripe juice has been
suggested to consist of larger oligomers, as indicated by the lower spectral resolution, and
to contain higher amounts of neutral sugars (galactose and/or arabinose), relatively lower
contents of galacturonic acid and only one type of rhamnose (non-reducing). In order to
complete this study and obtain more detailed structural information, regarding for instance
the sequence of the sugar residues, additional 2D NMR experiments, such as NOESY and 1H-13C correlation experiments, as well as MS and MS/MS data, should be recorded.
Mango juices subject to natural spoilage and to contamination with the mould
Penicillium expansum have also been analysed by hyphenated NMR, using the continuous-
flow HPLC-NMR method. The comparison of the NMR chromatograms obtained for the
different juices has enabled the rapid screening of the major compositional changes
induced by spoilage and contamination of the fresh juice. Interestingly, some of the new
carbohydrates formed upon those effects have been separated and their 1H NMR spectra
recorded. Although these sugars could not yet be identified, the HPLC-NMR analysis has
added valuable information about their structure.
HPLC-NMR/MS applied to the investigation of aromatic constituents of grape juice
and of a wine phenolic extract has shown to significantly aid the assignment of these
compounds. In grape juice, several cinnamic acids (e.g. p-coumaric, trans-caftaric, trans-
coutaric) have been identified, overcoming the difficulties found in the analysis of the 1D
and TOCSY spectra of the whole sample. In the wine extract, a range of phenolics such as
catechin, epicatechin, caffeic acid and trans-resveratrol have been identified.
References
Bock, K.; Thøgersen, H. Nuclear magnetic resonance spectroscopy in the study of mono- and oligosaccharides. Annual Reports on NMR Spectroscopy 1982, 13, 1-57. Bravo, L. Polyphenols: chemistry, dietary sources, metabolism and nutritional significance. Nutrition Reviews 1998, 56, 317-333. Bringman, G.; Messer, K.; Wohlfarth, M.; Kraus, J.; Dumbuya, K.; Ruckert, M. HPLC-CD on- line coupling in combination with HPLC-NMR and HPLC-MS/MS for the determination of the full absolute stereostructure of new me tabolites in plant extracts. Analytical Chemistry 1999, 71, 2678-2686.

Chapter VII
218
Brinson, K.; Prakash, M.D.; John, M.A.; Pridham, J.B. Post-harvest changes in mangifera indica cell walls and cytoplasmic polysaccharides. Phytochemistry 1988, 27, 719-723. Colquhoun, I.J.; de Ruiter, G.A.; Schols, A.; Voragen, G.J. Identification by NMR spectroscopy of oligosaccharides obtained by treatment of the hairy regions of apple pectin with rhamnogalacturonase. Carbohydrate Research 1990, 206, 131-144. Daykin, C.A.; Corcoran, O.; Hansen, S.H.; Bjornsdottir, I.; Cornett, C.; Connor, S.C.; Lindon, J.C.; Nicholson, J.K. Application of directly coupled HPLC NMR to separation and characterization of lipoproteins from human serum. Analytical Chemistry 2001, 73, 1084-1090. Exarchou, V.; Troganis, A.; Gerothanassis, I.P.; Tsimidou, M.; Boskou, D. Identification and quantification of caffeic and rosmaniric acid in complex plant extracts by the use of variable-temperature two-dimensional nuclear magnetic resonance spectroscopy. Journal of Agricultural and Food Chemistry 2001, 49, 2-8. Fulcrand, H.; Doco, T.; Es-Safi, N.; Cheynier, V.; Moutounet, M. Study of the acetaldehyde induced polymerization of flavan-3-ols by liquid chromatography ion spray mass spectrometry. Journal of Chromatography A 1996, 752, 85-91. Fulcrand, H.; Remy, S.; Souquet, J.-M.; Cheynier, V.; Moutounet, M. Study of wine tannin oligomers by on- line liquid chromatography electrospray ionization mass spectrometry. Journal of Agricultural and Food Chemistry 1999, 47, 1023-1028. Gerothanassis, I.P.; Exarchou, V.; Lagouri, V.; Troganis, A.; Tsimidou, M.; Boskou, D. Methodology for identification of phenolic acids in complex phenolic mixtures by high-resolution two-dimensional nuclear magnetic resonance. Application to methanolic extracts of two oregano species. Journal of Agricultural and Food Chemistry 1998, 46, 4185-4192. Hansen, S.H.; Jensen, A.G.; Cornett, C.; Bjornsdottir, I.; Taylor, S.; Wright, B.; Wilson, I.D. High-performance liquid chromatography on- line coupled to high-field NMR and mass spectrometry for structure elucidation of constituents of Hypericum perforatum L. Analytical Chemistry 1999, 71, 5235-5241. Lazarus, S.A.; Adamson, G.E.; Hammerstone, J.F.; Schmitz, H.H. High-performance liquid chromatography/mass spectrometry analysis of proanthocyanidins in foods and beverages. Journal of Agricultural and Food Chemistry 1999, 47, 3693-3701. Lindon, J.C.; Nicholson, J.K.; Wilson, I.D. Direct coupling of chromatographic separations to NMR spectroscopy. Progress in Nuclear Magnetic Resonance Spectroscopy 1996, 29, 1-49. Lizada, C. Mango. In Biochemistry of Fruit Ripening; Seymour, G.B., Taylor, J.E., Tucker, G.A., Eds.; Chapman & Hall: London, 1993; 255-271.
Application of Hyphenated NMR for the Detection of Minor Components in Fruit Juices and Wine
219
Lommen, A.; Godejohann, M.; Venema, D.P.; Hollman, P.C.H.; Spraul, M. Application of directly coupled HPLC-NMR-MS to the identification and confirmation of quercetin glycosides and phloretin glycosides in apple peel. Analytical Chemistry 2000, 72, 1793-1797. Lu, Y.; Foo, L.Y. The polyphenol constituents of grape pomace. Food Chemistry 1999, 65, 1-8. Maraschin, M.; Passos, R.; Duarte da Silva, J.M.O.; Dias, P.F.; Araujo, P.S.; Oltramari, J.D.; Fontana, J.D.; Caro, M.S.B. Isolation and trans-resveratrol analysis in Brazilian red wine by 1H nuclear magnetic resonance. In Magnetic Resonance in Food Science - a View to the Future; Webb, G.A., Belton, P.S., Gil, A.M., Delgadillo, I. Eds.; The Royal Society of Chemistry: Cambridge, 2001; 136-139. Neiss, T.G.; Cheng, H.N.; Daas, P.J.H.; Schols, H.A. Compositional heterogeneity in pectic polysaccharides: NMR studies and statistical analysis. Macromolecules Symposium 1999, 140, 165-178. Pérez-Magariño, S.; Revilla, I.; González-SanJosé, M.L.; Beltrán, S. Various applications of liquid chromatography-mass spectrometry to the analysis of phenolic compounds. Journal of Chromatography A 1999, 847, 75-81. Peynaud, E.; Ribéreau-Gayon, P. The Grape. In The Biochemistry of Fruits and Their Products; Hulme, A.C., Ed.; Academic Press: London, 1971; 171-205. Pusecker, K.; Albert, K.; Bayer, E. Investigation of hop and beer bitter acids by coupling of high-performance liquid chromatography to nuclear magnetic resonance spectroscopy. Journal of Chromatography A 1999, 836, 245-252. Revilla, E.; Ryan, J.-M. Analysis of several phenolic compounds with potential antioxidant properties in grape extracts and wines by high-performance liquid chromatography-diode array detection without sample preparation. Journal of Chromatography A 2000, 881, 461-469. Schols, H.A.; Voragen, A.G.J.; Colquhoun, I.J. Isolation and characterization of rhamnogalacturonan oligomers, liberated during degradation of pectic hairy regions of rhamnogalacturonase. Carbohydrate Research 1994, 256, 97-111. Shockcor, J.P.; Unger, S.E.; Wilson, I.D.; Foxall, P.J.D.; Nicholson, J.K.; Lindon, J.C. Combined HPLC, NMR spectroscopy, and ion-trap mass spectrometry with application to the detection and characterization of xenobiotic and endogenous metabolites in human urine. Analytical Chemistry 1996, 68, 4431-4435. Sidelmann, U.G.; Braumann, U.; Hofmann, M.; Spraul, M.; Lindon, J.C.; Nicholson, J.K.; Hansen, S.H. Directly coupled 800 MHz HPLC-NMR spectroscopy of urine and its application to the identification of the major phase II metabolites of tolfenamic acid. Analytical Chemistry 1997, 69, 607-612.

Chapter VII
220
Singleton, V.L. Zaya, J.; Trousdale, E.K. Caftaric and coutaric acids in fruit of Vitis. Phytochemistry 1986, 25, 2127-2133. Spanos, G.A.; Wrolstad, R.E. Phenolics of apple, pear and white grape juices and their changes with processing and storage – a review. Journal of Agricultural and Food Chemistry 1992, 40, 1478-1487. Spraul, M.; Hofmann, M. 750 MHz NMR spectroscopy and food-related LC-NMR applications. In Magnetic Resonance in Food Science; Belton, P.S., Delgadillo, I., Gil, A.M., Webb, G.A., Eds.; The Royal Society of Chemistry: Cambridge, 1995; 77-92. Tjan, S.B.; Voragen, A.G.J.; Pilnik, W. Analysis of some partly and fully esterified oligogalactopyranuronic acids by p.m.r. spectrometry at 220 MHz. Carbohydrate Research 1974, 34, 15-23. Tucker, G.A. Introduction. In Biochemistry of Fruit Ripening; Seymour, G.B., Taylor, J.E., Tucker, G.A., Eds.; Chapman & Hall: London, 1993; 1-51. Tucker, G.A.; Seymour, G.B. Cell wall degradation during mango fruit ripening. Acta Horticulturae 1991, 291, 454-460.

VIII. CHARACTERISATION OF BEER COMPOSITION BY NMR AND
HYPHENATED NMR (HPLC-NMR/MS)
VIII.1. Introduction………………………………………………………………………
VIII.2. Materials and Methods…………………………………………………………...
VIII.2.1. Sample Preparation…………………………………………………….
VIII.2.2. NMR and HPLC-NMR/MS Measurements……………………………
VIII.3. Characterisation of Beer Composition by High Resolution NMR ………………
VIII.4. Characterisation of Beer Composition by HPLC-NMR/MS……………………..
VIII.4.1. Application to Carbohydrates…………………………………………..
VIII.4.2. Application to Aromatic Compounds………………………………….
VIII.5. Conclusions………………………………………………………………………
References………………………………………………………………………………..
222
223
223
223
226
233
233
240
244
244
Chapter VIII
222
VIII.1. Introduction
There has been great interest in studying the chemical composition of beer, as this
information is essential for the assessment of beer quality and the development of new
products. The data reported in the literature, summarised in Chapter I.3, has been obtained
with basis on analytical techniques that often involve some kind of pre-treatment of the
beer sample in order to concentrate the desired group of compounds. Moreover, the choice
of method and protocol followed depends on the specific family/type of compounds under
study, making the process of overall characterisation of beer very time consuming. High
resolution NMR has already proved useful for studying the composition of different liquid
foods such as fruit juices (Belton et al., 1996; Belton et al., 1997; Gil et al., 2000; Le Gall
et al., 2001), coffee (Bosco et al., 1999), olive oil (Sacchi et al., 1996) and wine (Ramos
and Santos, 1999; Kosir and Kidric, 2001; Brescia et al., 2002), offering the advantages of
giving information about a very wide range of different components in a single experiment,
in which the sample is analysed directly and non- invasively.
In this work, the first direct characterisation of beer composition by NMR is reported
(Duarte et al., 2002), although the technique has already been applied to specific problems
such as the identification of hop bitter acids using HPLC-NMR (Pusecker et al., 1999), and
of oligosaccharides in beer fractions obtained by HPLC (Vinogradov and Bock, 1998). In
addition, the further investigation of some beer components (carbohydrates and aromatic
compounds) is carried out in this work by HPLC-NMR/MS. Carbohydrates are the major
non-volatile components of beer and have a marked influence on beer taste and body.
Monitoring of the carbohydrate composition in wort and beer is therefore extremely
important for modern brewing technology and particularly in the development of new sorts
of beer and in the selection of raw materials and yeast strains. The composition of beer in
carbohydrates has been studied for many years, mostly by chemical and enzymatic analysis
(Shanta-Kumara et al., 1995) and by chromatographic methods, (Uchida et al., 1991;
Corradini et al., 1997; Désévaux et al., 1997). High-performance anion-exchange
chromatography with pulsed amperometric detection (HPAEC-PAD) is particularly well-
established for the analysis of malto-oligosaccharides, but the need for reference standards
and the difficulty to separate isomeric structures, for instance branched dextrins of a given
degree of polymerisation, are important limitations of this method (Jodelet et al., 1998).
High resolution NMR has been shown to be a powerful tool for the structure elucidation of
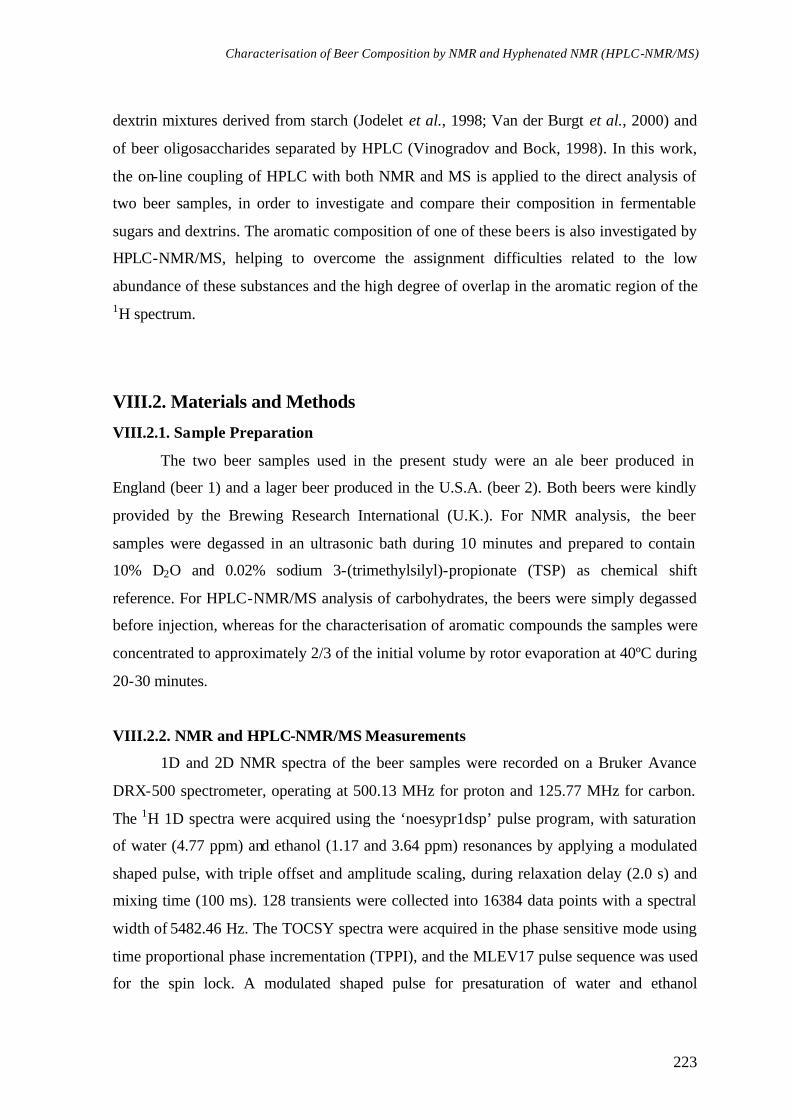
Characterisation of Beer Composition by NMR and Hyphenated NMR (HPLC-NMR/MS)
223
dextrin mixtures derived from starch (Jodelet et al., 1998; Van der Burgt et al., 2000) and
of beer oligosaccharides separated by HPLC (Vinogradov and Bock, 1998). In this work,
the on-line coupling of HPLC with both NMR and MS is applied to the direct analysis of
two beer samples, in order to investigate and compare their composition in fermentable
sugars and dextrins. The aromatic composition of one of these beers is also investigated by
HPLC-NMR/MS, helping to overcome the assignment difficulties related to the low
abundance of these substances and the high degree of overlap in the aromatic region of the 1H spectrum.
VIII.2. Materials and Methods
VIII.2.1. Sample Preparation
The two beer samples used in the present study were an ale beer produced in
England (beer 1) and a lager beer produced in the U.S.A. (beer 2). Both beers were kindly
provided by the Brewing Research International (U.K.). For NMR analysis, the beer
samples were degassed in an ultrasonic bath during 10 minutes and prepared to contain
10% D2O and 0.02% sodium 3-(trimethylsilyl)-propionate (TSP) as chemical shift
reference. For HPLC-NMR/MS analysis of carbohydrates, the beers were simply degassed
before injection, whereas for the characterisation of aromatic compounds the samples were
concentrated to approximately 2/3 of the initial volume by rotor evaporation at 40ºC during
20-30 minutes.
VIII.2.2. NMR and HPLC-NMR/MS Measurements
1D and 2D NMR spectra of the beer samples were recorded on a Bruker Avance
DRX-500 spectrometer, operating at 500.13 MHz for proton and 125.77 MHz for carbon.
The 1H 1D spectra were acquired using the ‘noesypr1dsp’ pulse program, with saturation
of water (4.77 ppm) and ethanol (1.17 and 3.64 ppm) resonances by applying a modulated
shaped pulse, with triple offset and amplitude scaling, during relaxation delay (2.0 s) and
mixing time (100 ms). 128 transients were collected into 16384 data points with a spectral
width of 5482.46 Hz. The TOCSY spectra were acquired in the phase sensitive mode using
time proportional phase incrementation (TPPI), and the MLEV17 pulse sequence was used
for the spin lock. A modulated shaped pulse for presaturation of water and ethanol

Chapter VIII
224
resonances was applied (pulse program ‘lcmlevpcpstp’). 16 scans were collected for each
of the 512 increments, using a spectral width of 5482.46 Hz in both dimensions, 2048 data
points, a mixing time of 100 ms and a relaxation delay of 1.5 seconds. 1H-13C phase
sensitive (Echo/Antiecho-TPPI) heteronuclear single quantum correlation (HSQC) spectra
were recorded with inverse detection and 13C decoupling during acquisition (pulse program
‘invietgpsi’). 2048 data points with 64 scans per increment and 300 increments were
acquired with spectral widths of 5482.46 Hz and 25157.23 Hz in the proton and carbon
dimensions, respectively. J-resolved spectra were measured with a shaped pulse for triple
suppression of water and ethanol resonances (pulse program ‘lcjresps’). 8192 data points
were acquired with 8 scans for each of 128 increments, using a spectral width of 8012.82
Hz in the proton dimension and 31.30 Hz in the J dimension.
The HPLC-NMR/MS measurements were performed using the instrumentation
described in Chapter VII.2.2. For the study of carbohydrates, chromatographic separation
was carried at 35ºC, using a 300 x 7.8 mm cation-exchange ION-300 column with a
particle size of 5.0 ? m, at a flow rate of 0.3 ml/min, with diode array detection at 200 and
220 nm. The injection volume was 100 ? l and the mobile phase consisted of 0.0085N
H2SO4 in D2O.
1H NMR spectra were recorded at 500 MHz using the continuous-flow and the
loop-sampling modes. For continuous-flow experiments, successive NMR spectra were
acquired automatically, co-adding 16 transients and using 8192 data points with a spectral
width of 5000 Hz. Acquisition time was 0.82 s, with 1.8 s delay between transients. A
pulse sequence with presaturation during relaxation delay was used (program ‘lc2pr’ from
the Bruker library). 1D 1H NMR spectra of loops were recorded using multiple solvent
suppression with time-shared double presaturation of water and acetonitrile 1H frequencies
by means of a shaped low power RF-pulse and CW-decoupling on the F2- channel for the
decoupling of the 13C satellites of residual acetonitrile (present in the system even when
using 100% D2O). 128 transients were collected into 32768 computer data points with a
spectral width of 10000 Hz and an acquisition time of 1.6 s. Prior to Fourier
transformation, an exponential multiplication was applied to the FID, corresponding to a
line broadening of 1.0 Hz. In addition to the 1D spectra, phase-sensitive TOCSY
experiments with WET (water suppression enhanced through T1 effects) and 13C

Characterisation of Beer Composition by NMR and Hyphenated NMR (HPLC-NMR/MS)
225
decoupling during WET were carried out. A total of 16 increments with 128 transients and
2048 computer data points were acquired in simultaneous mode with a spectral width in
both dimensions of 10000 Hz. The applied mixing time of the MLEV spin lock was 65 ms.
The data were apodized with a shifted squared sine bell window function 2.5 Hz in both
dimensions and zero-filled in the f1 dimension to 1024 data points.
Electrospray ionisation (ESI) was carried out in positive-ionisation mode and mass
spectra were acquired up to m/z 3000 after adding 50 ? l/min of 20 mM aqueous sodium
acetate solution to the split ratio of the eluent via a T-piece with a syringe pump.
For the study of aromatic compounds, chromatographic separation was carried out
at 35ºC, using a 250 x 4 mm Purospher reverse phase (RP18) column from Merck, with a
particle size of 5.0 ? m, at a flow rate of 1.00 ml/min, with diode array detection in the UV-
Vis region. The injection volume was 500 ? l. The mobile phase consisted of a mixture of
D2O (containing 0.06% formic acid) and acetonitrile, changing in composition according
to the following gradient: 0 min - 3% acetonitrile, 40 min - 40 % acetonitrile, 60 min - 100
% acetonitrile, 70 min - 3% acetonitrile. 1H NMR spectra were obtained at 500 MHz using the time-sliced stop-flow and the
loop-sampling methods. Each spectrum in the time slice array was recorded with double
solvent suppression of water and acetonitrile signals (pulse program ‘lc1wetdw’). 32
transients were collected into 32768 computer data points with a spectral width of 10000
Hz, and an acquisition time of 1.6 s. The FIDs (free induction decays) were combined in a
2D serial file and an exponential multiplication was applied prior to Fourier transformation
resulting in a line broadening of 1.0 Hz. When using the time-sliced method, no MS data
could be acquired because of the interruption of the flow during the NMR measurement.
1D 1H NMR spectra of fractions collected into loops were acquired using the same
conditions as described above, but with a higher number of scans (128/512).
ESI-MS analysis of loops was carried out in positive and negative ionisation
modes, using automatic switch between MS and MS/MS in order to identify fragment ions.

Chapter VIII
226
VIII.3. Characterisation of Beer Composition by High Resolution NMR
Figure VIII.1 shows the 1H 1D spectrum of an ale beer, recorded at 500 MHz, with
suppression of ethanol (? 1.17 and 3.64 ppm) and water (? 4.77 ppm) signals. The general
high spectral complexity clearly shows the potential of the technique to enable the
identification of many different compounds, present in a wide range of concentrations. In
order to aid spectral assignment, the results obtained from TOCSY, 1H-13C correlation and
J-resolved spectra were combined. These 2D spectra, shown in Figures VIII.2, VIII.3 and
VIII.4, contain a significant number of signals even for the less abundant compounds
resonating in the aliphatic and aromatic regions, thus enabling the identification of several
beer components, as exemplified in Figure VIII.2. Table VIII.1 shows a complete list of
the signals assigned in the beer spectra.
Figure VIII.1. 500 MHz 1H NMR spectrum of an ale beer, with triple suppression of water and ethanol resonances; NS 128. The Figure insert shows an expansion of the aromatic region.
In the aliphatic region, peaks from alcohols (ethanol, propanol, isobutanol,
isopentanol), aliphatic organic acids (e.g. citric, malic, pyruvic, acetic, succinic) and amino
acids (e.g. alanine, ?-aminobutyric acid, proline) are observable. Furthermore, two
aliphatic spin systems have been tentatively assigned to lipids, possibly medium chain fatty
acids that are known to occur in beer (Table VIII.1). These compounds contribute
importantly for the characteristic flavour of beer, being also responsible for off- flavours if
present in excessive concentrations (Hawthorne et al., 1986). None of these spin systems
show correlations with unsaturated proton or carbon resonances which suggests that the
lipids detected are mostly of the saturated type.
EtOH
EtOH
H2O
9 8 7 6 5 4 3 2 1 ppm
789 ppm

Characterisation of Beer Composition by NMR and Hyphenated NMR (HPLC-NMR/MS)
227
a)
b)
Figure VIII.2. Expansions of the 500 MHz TOCSY spectrum of the ale beer; NS 16 in f2. Some assignments are indicated: 1-propanol, 2-isobutanol, 3-isopentanol, 4-ethanol, 5-lactic acid, 6-GABA, 7-proline, 8-acetic acid, 9-pyruvic acid, 10-succinic acid, 11-citric acid, 12-malic acid, 13-dextrins, 14-uridine, 15-adenosine/inosine, 16-cytidine, 17,18-tyrosine/tyrosol, 19-histidine, 20-tryptophane, 21,22-polyphenols.
1,2,3
ppm
1.01.52.02.53.03.54.04.55.05.5 ppm
1
2
3
4
5
6
1,2,3
4 4
5
6
7
8 9 10
11
7 5
12
11,12
13 H2O
1,2,3
19 15
ppm
6.06.57.07.58.08.59.0 ppm
4
5
6
7
8
9
14,16
15 16 19 14 16
17,18
14 15
14 16
17,18
20
22
21

Chapter VIII
228
Figure VIII.3. 500 MHz HSQC spectrum of the ale beer; NS 64 in f2.
Figure VIII.4. 500 MHz homonuclear J-resolved spectrum of the ale beer; NS 8 in f2.
ppm
123456789 ppm
50
100
150
Hz
123456789 ppm
-10
-5
15
10
5
0

Characterisation of Beer Composition by NMR and Hyphenated NMR (HPLC-NMR/MS)
229
The 3.0-6.0 ppm region of the spectrum reflects the strong contribution of beer
carbohydrates. This region shows relatively lower resolution, compared to the remaining
parts of the spectrum, reflecting the predominance of medium- and/or high-molecular
weight dextrins, undergoing slow molecular tumbling, and, hence, leading to fast
transverse relaxation and broader signals. However, spectral distinction between dextrins
of different sizes is extremely difficult because of strong peak overlap in both uni- and bi-
dimensional NMR spectra (Figures VIII.2 to VIII.4). The spectral similarity for different
glucose oligomers is illustrated by the set of 1D 1H NMR spectra of standard solutions
shown in Figure VIII.5, where, as expected, spectral resolution is strongly dependent on
molecular size, reflecting the shortening of transverse relaxation times for larger
molecules. The linear carbohydrates maltose, maltotriose and maltohepatose, consisting of
glucose monomers linked by ? (1-4) linkages, show similar overlapping profiles. Partial
assignment may be carried out with basis on NMR data reported for dextrins (Jodelet et al.,
1998; Vinogradov and Bock, 1998). In the anomeric region (4.5-5.5 ppm), the protons H1
of the reducing glucose ring of the ? and ? anomers give rise to the doublets at 5.22 and
4.63 ppm, respectively. The non-reducing H1 protons engaged in ? (1-4) glycosidic
linkages resonate at about 5.38 ppm, whereas those involved in ? (1-6) linkages are shifted
upfield to about 4.96 ppm, as seen for isomaltose (Figure VIII.5c). In the beer spectrum
(Figure VIII.5g), the group of overlapped signals in the 5.3-5.4 ppm range reveals the
presence of different-sized linear glucose segments, while the 4.96 ppm peak is indicative
of branched carbohydrates containing the ? (1-6) linkage. However, in such a complex
mixture, further assignment is hindered by the broad and overlapped nature of the
spectrum, thus calling for improved analytical methods.
The aromatic spectral region is one of the most interesting regions due to the very
low relative abundance of aromatic metabolites. As shown in the TOCSY spectrum (Figure
VIII.2b), quite a few homonuclear correlations are detected, either within the aromatic
region or with resonances appearing at higher field. With support from the 1H-13C and J-
resolved spectra (Figures VIII.3 and VIII.4, respectively), the assignment of most of the
stronger peaks has been carried out showing the presence of compounds like tyrosine,
tryptophane, uridine, adenosine/inosine and cytidine. The underlying broad humps between
6.7 and 8.7 ppm may result from large molecular weight aromatic compounds, possibly
polyphenols (Table VIII.1). Interestingly, the broad resonances at 7.9-8.7 ppm show weak

Chapter VIII
230
correlations with broad resonances at 3.8-4.5 ppm. This suggests the presence of non-
aromatic moieties in the polyphenols fraction; however, alternative and/or complementary
methods are required in order to characterise the nature of these moieties.
a) glucose
b) maltose
c) isomaltose
d) trehalose
e) maltotriose
f) maltoheptaose
g) beer sample
Figure VIII.5. 500 MHz 1H NMR spectra of (a-f) standard solutions and of (g) the ale beer shown in Figure VIII.1; NS 32 for standards and 128 for the beer sample.
As shown in Table VIII.1, about 30 compounds have been assigned in the beer
sample investigated, whereas about 30 more spin systems have been identified, but their
assignment still remains unknown, requiring further investigation.
3.54.04.55.05.5 ppm

Characterisation of Beer Composition by NMR and Hyphenated NMR (HPLC-NMR/MS)
231
Table VIII.1. 1H and 13C chemical shifts, proton multiplicity and JHH for assigned compounds in an ale beer. s: singlet, d: doublet, t: triplet, q: quartet, dd: doublet of doublets, m: multiplet; (a) tentative identification; n.i.: not identified.
Compound Assignment ? 1H (ppm) Multiplicity J (Hz) ? 13C (ppm)
Acetaldehyde CH3 CH
2.23 9.67
d 3.0 32.22
Acetaldehyde hydrate CH3, hydrate CH, hydrate
1.32 5.24
Acetic acid / Acetates ?CH3 2.04 s 23.82
Adenosine/Inosine C4’H, ribose C3’H, ribose C2’H, ribose C1’H, ribose
C8H, ring C2H, ring
4.27 4.41 4.79 6.07 8.28 8.37
d s s
Alanine ?CH3 ? CH
1.51 3.77
d
7.2
?-Aminobutyic acid (GABA)
?CH2
? CH2
?CH2
1.92 2.39 3.02
t t
7.2 7.2
26.28 32.28 41.83
Citric acid ? , ?CH ? ’, ?’CH
2.72 2.84
d d
15.7 15.7
46.50
Cytidine C1’H, ribose C6H, ring C5H, ring
5.86 6.13 7.97
d d
7.9 7.9
98.36
145.72 Ethanol CH3
CH2 1.17 3.64
t q
7.2 7.2
19.56 60.19
Ethyl esther (e.g. ethyl acetate)
CH3 OCH2
1.24 4.12
t 12.92 60.34
Fatty acids (a) (saturated)
? CH3
CH2-CH3
CH2-CH2-CH3
CH2-COOH
0.89 0.95 1.30 1.53 1.58 1.70 2.33
Formic acid (a) HCOOH 8.38 s
Histidine C4H, ring C2H, ring
7.03 7.99
s s
119.00 140.62
Isobutanol CH3 CH
CH2OH
0.87 1.73 3.36
d d
6.6
6.5
Isoleucine ?CH3
?’CH3
?CH ?’CH ?CH ? CH
0.92 1.00 1.25 1.46 1.96 3.64
t d

Chapter VIII
232
Table VIII.1 (cont.) Compound Assignment ? 1H (ppm) Multiplicity J (Hz) ? 13C (ppm)
Isopentanol
CH3 CH CH2
CH2OH
0.88 1.42 1.64 3.63
d
6.6
24.60
Lactic acid CH3
? CH 1.35 4.19
d q
7.0 7.0
22.48 70.87
Leucine ? , ?’ CH3? CH2, ?CH
0.94 1.70
Malic acid ?CH
?’CH
? CH
2.63 2.82 4.38
dd dd
7.5;16.2 4.4;16.1
42.78
71.20 Malto-
oligosaccharides
?C1H (red.) ? C1H (red.) C1H ? (1-6) C1H ? (1-4)
4.64 5.22 4.96
5.3-5.4
d d
8.0 3.7
98.50 94.58
101.28 ~102
Phenylalanine C3H, C5H, ring C4H, ring
C2H, C6H, ring
7.33 7.37 7.43
Polyphenols (a) n.i. n.i.
6.84 7.51
Polyphenols with non-aromatic moiety (a)
n.i. n.i.
3.8-4.0 4.1-4.4 8.2-8.6 7.9-8.5
Proline ?CH2 ?’CH ?CH ?’CH ?CH ? CH
2.00 2.06 2.33 3.32 3.41 4.11
m m m
26.60 31.70 31.70 48.90 48.90 64.06
Propanol CH3 CH2
CH2OH
0.88 1.53 3.54
t m t
7.5
5.8
13.7 26.9 62.46
Pyruvic acid ?CH3 2.35 s 29.12
Succinic acid ? , ?CH2 2.59 s 32.79
Tryptophane C5H, ring C6H, ring C7H, ring C4H, ring
7.15 7.24 7.50 7.69
114.49
Tyrosine / Tyrosol C3H, C5H, ring C2H, C6H, ring
6.81 6.85 7.11 7.17
d d
8.5 8.5
118.2 118.2 133.3 133.1
Uridine C4’H C3’H C2’H
C5H, ring C1’H
C6H, ring
4.11 4.21 4.38 5.88 5.89 7.85
d
d
8.2
8.2
105.00 90.51
144.56

Characterisation of Beer Composition by NMR and Hyphenated NMR (HPLC-NMR/MS)
233
VIII.4. Characterisation of Beer Composition by HPLC-NMR/MS
VIII.4.1. Application to Carbohydrates
The ale beer shown in the previous section (beer 1) and a lager beer (beer 2),
characterised by a significantly different carbohydrate composition, were chosen for a
more thorough carbohydrate characterisation using HPLC-NMR/MS. The sugar regions of
their 1H NMR spectra, as well as of the spectrum of another lager (beer 3), are shown in
Figure VIII.6. The spectra of beers 1 and 3 are similar, both in terms of resolution and
spectral profile, indicating that the two beer types, ale and lager, do not necessarily show
distinct carbohydrate compositions. The spectrum of beer 2, on the other hand, shows a
well-resolved sugar region due to the predominance of low molecular weight
carbohydrates, namely glucose. In addition, the inserts shown in the Figure for beers 1 and
2 show the presence of a number of minor carbohydrates besides the predominant
compounds.
a) beer 1 (ale)
b) beer 2 (lager)
c) beer 3 (lager)
Figure VIII.6. Mid-field region of the 500 MHz 1H NMR spectra of three beer samples; NS 128. The inserts show the additional peaks observed in the anomeric regions.
3.54.04.55.05.5 ppm
5.25.4 ppm
5.25.4 ppm

Chapter VIII
234
The continuous-flow NMR chromatogram obtained for beer 1 is shown in Figure
VIII.7a and the carbohydrates identified are listed in Table VIII.2. Some components are
readily separated and identified through their NMR spectra, namely ethanol (RT 45.0 min),
glycerol (RT 30.0 min), fructose (RT 22.5 min) and citric acid (RT 19.5 min). In the case
of glycerol (? 3.48, 3.57 and 3.70 ppm), it should be noted that its detection by NMR of
beer is usually hindered by overlap with sugar signals and by the effects of ethanol
suppression at 3.64 ppm. The major beer carbohydrates elute at retention times between 12
and 17 min, showing poor separation, as expected with basis on their similar sizes and
structures. Figure VIII.7b shows some of the rows extracted from the continuous-flow
NMR chromatogram in that range of retention times. The observed profiles are consistent
with the presence of malto-oligosaccharides (dextrins) of different sizes and structures, the
larger ramified compounds eluting first, as shown by the poorer resolution of the earlier
spectra, followed by smaller compounds. Integration of selected anomeric signals may give
estimates of the average number of glucose units and branching points per molecule
(Jodelet et al., 1998). The average number of glucose units per molecule is given by the
ratio of the summed areas of H1 protons in both ? (1-4) and ? (1-6) glycosidic linkages
(signals at 5.3-5.4 and 4.9-5.0 ppm, respectively) and the summed areas for the reducing
H1 protons (5.2 and 4.6 ppm for the ? and ? anomers, respectively). The average number
of branching points per molecule is estimated by the ratio of the integral of the peak for H1
protons in ? (1-6) linkages (4.9-5.0 ppm) and that of the peak for H1 protons in ? (1-4)
linkages (5.3-5.4 ppm), multiplied by the number of total linkages. The results of these
calculations are shown in the second and third columns of Table VIII.2. It must be noted
that the fractions considered are mixtures of carbohydrates and, hence, the numbers
estimated represent average values.
The MS data recorded for the same fractions (Figure VIII.7c), using the positive-
ionisation mode, give more precise and detailed information about the size of the dextrins
present, enabling the detection of glucose oligomers with degrees of polymerisation (DP)
varying from 2 to 9 (Table VIII.2). For the fraction eluting at 12.3 min, the MS spectrum
shows peaks at m/z 522, 604, 685 and 766 that arise from the double-charged ions ?M +
2Na?2+ of partially deuterated dextrins with DP6, DP7, DP8 and DP9, respectively. The
ions ?M + Na?+ are also detected for DP6, DP7 and DP8 (m/z 1019, 1182 and 1345), but
not for DP9, which only forms the ?M + 2Na?2+ ion. This is in agreement with previous

Characterisation of Beer Composition by NMR and Hyphenated NMR (HPLC-NMR/MS)
235
a)
b) c)
Figure VIII.7. a) Continuous-flow NMR chromatogram resulting from the elution of beer 1 on the column ION-300 (flow rate 0.3 ml/min; injection volume 100 ? l); b) rows extracted from the NMR chromatogram; c) MS spectra acquired concurrently with the NMR data in positive-ionisation mode.
RT 16.6 min
RT 13.7 min
RT 12.8 min
RT 12.3 min
RT 14.7 min
3.54.04.55.05.5 ppm
367.4
591.0
+ MS, 15.1min (#384)
529.7+ MS, 13.2min (#334)
358.0
692.1+ MS, 12.2min (#308)
307.2 522.3
855.5
1019.8
+ MS, 11.3min (#284)
270.3
684.71018.8
1181.81344.7
+ MS, 10.8min (#271)
0.0
0.5
1.05x10
Intens.
0.0
0.5
1.0
6x10
0.0
0.5
6x10
0.0
0.5
1.0
5x10
0
12
4x10
400 600 800 1000 1200 m/z
Citric acid
Glycerol
Fructose
EtOH
Malto-oligosaccharides
sec
12345 ppm
50
40
30
20
10
0
RT (min)

Chapter VIII
236
mass spectrometry studies of oligosaccharides, which indicated the formation of
dissodiated cations for oligomers with DP>4 (Careri et al., 1998). The MS results alone do
not enable the identification of the oligomers as branched or linear; in this respect, the
corresponding NMR row (Figure VIII.7b) does indicate, through the 4.96 ppm peak, that at
least some of the dextrins detected comprise ? (1-6) branches. The MS spectrum of the
fraction eluting at 12.8 min shows peaks at m/z 856 and 1020, arising from ?DP5 + Na?+
and ?DP6 + Na?+, respectively; the double-charged ions also appear at m/z 439 and 522, but
with lower abundance. Again, the NMR spectrum of this fraction indicates ramification of
these carbohydrates to some extent. The following subfraction under study, eluted at 13.7
min, is found to comprise mainly DP4 oligosaccharides (as seen by the m/z peaks at 692
and 358 arising from ?DP4 + Na?+ and ?DP4 + 2Na?2+, respectively), which from the
corresponding NMR spectrum are shown to be in the linear form, that is, maltotetraose.
Indeed, the residual broad signal at 4.96 ppm seems to result from the gradual decrease of
the broad components in the spectrum (note also the low intensity at 5.25-5.30 ppm), rather
than from the predominant DP4 oligomer present. At 14.7 min, MS detects the elution of a
glucose trisaccharide, which originates the ?DP3 + Na?+ ion found at m/z 530. This is, in
fact, maltotriose, as clearly shown by the corresponding NMR spectrum. Finally, DP2 is
detected in the MS spectrum of the fraction eluting at 16.6 min (m/z 367). The NMR
spectrum, however, shows a S/N that is too low for enabling the structural characterization
of this sugar. For that reason, this fraction was collected into a loop during a second
chromatographic run and a 1D spectrum with better S/N (NS 128) recorded (Figure
VIII.8). By comparison with spectra of standard solutions (Figure VIII.5), it was found that
the fraction collected, for which MS detected only one peak, actually contains two
different glucose dimers: maltose and trehalose, differing in the glycosidic linkage (? (1-4)
for the former and ? (1-1) for the latter).
Figure VIII.8. 1H NMR spectrum of the subfraction of beer 1 collected into a loop at 16.6 minutes; NS 128.
trehalose
3.43.63.84.04.24.44.64.85.05.25.4 ppm
maltose

Characterisation of Beer Composition by NMR and Hyphenated NMR (HPLC-NMR/MS)
237
Table VIII.2. NMR and MS data of beer 1 carbohydrates obtained by continuous-flow HPLC-NMR/MS analysis; (a) the oligomers identified may be either linear and/or branched; (b) calculated by integration of anomeric signals, as described in text.
NMR MS (positive-ionisation) RT (min) average no. of
glucose units per molecule (b)
average no. of branchings per
molecule (b)
m/z molecular ion
Compounds identified
522 ?DP6 + 2Na?2+ 604 ?DP7 + 2Na?2+ 685 ?DP8 + 2Na?2+
12.3 9.6 1.4 766 ?DP9 + 2Na?2+ 1019 ?DP6 + Na?+ 1182 ?DP7 + Na?+ 1345 ?DP8 + Na?+
Dextrins DP6, DP7, DP8 and DP9 (a)
439 ?DP5 + 2Na?2+ 12.8 7.0 0.9 522 ?DP6 + 2Na?2+
856 ?DP5 + Na?+ 1020 ?DP6 + Na?+
Dextrins
DP5 and DP6 (a)
13.7 4.2 0 358 ?DP4 + 2Na?2+ 692 ?DP4 + Na?+
Maltotetraose
14.7 3.2 0 530 ?DP3 + Na?+ Maltotriose 16.6 n.d. n.d. 367 ?DP2 + Na?+
Spectrum of loop shows maltose and trehalose
Maltose and Trehalose
22.5 Fructose profile 204 ?hexose + Na?+ Fructose n.d.: not determined due to low S/N
As previously noted in Figure VIII.6, beer 2 is characterised by a very different
carbohydrate profile, dominated by the contribution of glucose. The continuous-flow NMR
chromatogram obtained for this sample is shown in Figure VIII.9a and the carbohydrates
identified are listed in Table VIII.3. By comparison with the NMR chromatogram of beer 1
(Figure VIII.7a), the differences between the two beers can be clearly visualised. A major
difference regards the detection of glucose, which is seen to elute at about 21.5 min in beer
2 (between citric acid and fructose) and is absent in beer 1. The other significant difference
is observed for the carbohydrates eluting at earlier retention times. The continuous-flow
NMR chromatogram of beer 2 shows three rows, with a satisfactory degree of separation
but with very poor signal-to-noise ratio (Figure VIII.9b). By analysing the corresponding
MS data obtained with positive mode ESI (Figure VIII.9c), different m/z values are found
for those rows. The first compound to be eluted (RT 13.5 min) shows m/z 692, which is

Chapter VIII
238
a)
b) c) Figure VIII.9. Continuous-flow NMR chromatogram resulting from the elution of beer 2 on the column ION-300 (flow rate 0.3 ml/min; injection volume 100 ? l); b) rows extracted from the NMR chromatogram; c) MS spectra acquired concurrently with the NMR data in positive-ionisation mode.
Citric acid
Glycerol
EtOH
Fructose
Glucose
Malto-oligosaccharides
sec
12345 ppm
50
40
30
20
10
0
RT (min)
247.1
307.2
367.4
531.1
+ MS, 14.9min (#378)
247.1
307.2
389.2
529.7
613.2
+ MS, 12.9min (#328)
247.1
329.3
389.2
449.1 531.2613.1
692.7
+ MS, 12.0min (#303)
0
1
5x10Intens.
0.0
0.5
1.0
5x10
0
1
2
4x10
200 300 400 500 600 700 m/z3.54.04.55.0 ppm
RT 17.3 min
RT 15.3 min
RT 13.5 min
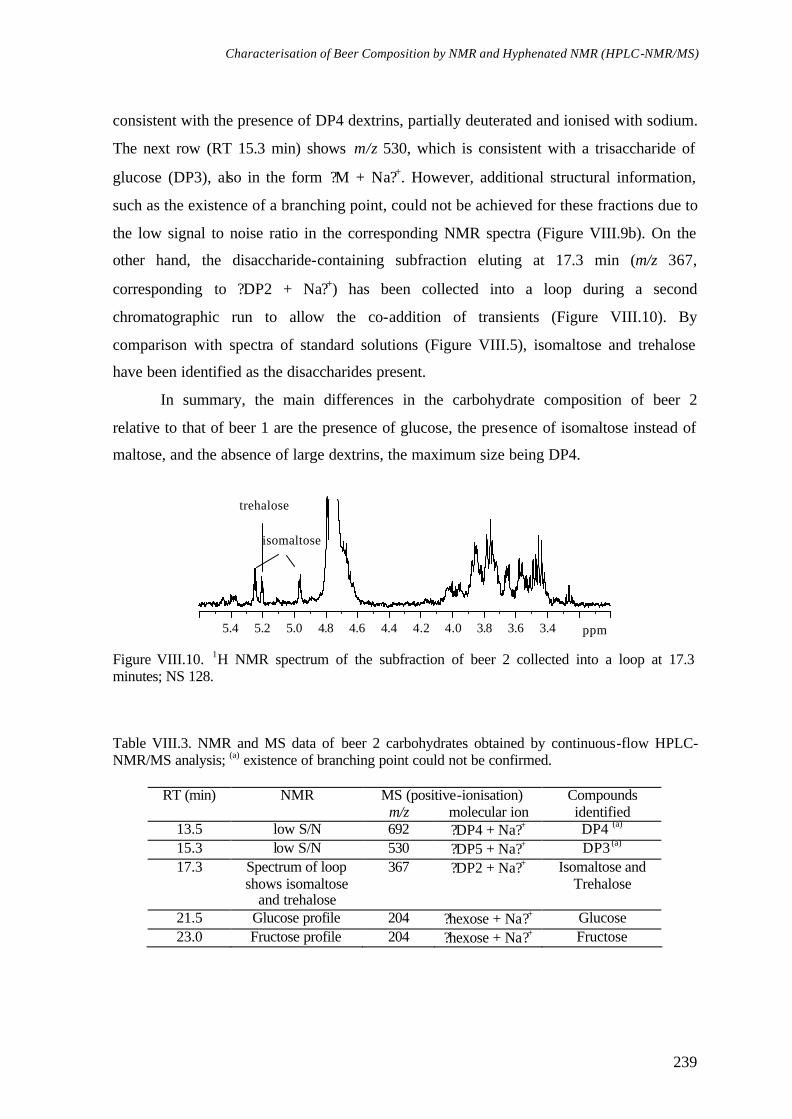
Characterisation of Beer Composition by NMR and Hyphenated NMR (HPLC-NMR/MS)
239
consistent with the presence of DP4 dextrins, partially deuterated and ionised with sodium.
The next row (RT 15.3 min) shows m/z 530, which is consistent with a trisaccharide of
glucose (DP3), also in the form ?M + Na?+. However, additional structural information,
such as the existence of a branching point, could not be achieved for these fractions due to
the low signal to noise ratio in the corresponding NMR spectra (Figure VIII.9b). On the
other hand, the disaccharide-containing subfraction eluting at 17.3 min (m/z 367,
corresponding to ?DP2 + Na?+) has been collected into a loop during a second
chromatographic run to allow the co-addition of transients (Figure VIII.10). By
comparison with spectra of standard solutions (Figure VIII.5), isomaltose and trehalose
have been identified as the disaccharides present.
In summary, the main differences in the carbohydrate composition of beer 2
relative to that of beer 1 are the presence of glucose, the presence of isomaltose instead of
maltose, and the absence of large dextrins, the maximum size being DP4.
Figure VIII.10. 1H NMR spectrum of the subfraction of beer 2 collected into a loop at 17.3 minutes; NS 128. Table VIII.3. NMR and MS data of beer 2 carbohydrates obtained by continuous-flow HPLC-NMR/MS analysis; (a) existence of branching point could not be confirmed.
MS (positive-ionisation) RT (min) NMR m/z molecular ion
Compounds identified
13.5 low S/N 692 ?DP4 + Na?+ DP4 (a) 15.3 low S/N 530 ?DP5 + Na?+ DP3 (a) 17.3 Spectrum of loop
shows isomaltose and trehalose
367 ?DP2 + Na?+ Isomaltose and Trehalose
21.5 Glucose profile 204 ?hexose + Na?+ Glucose 23.0 Fructose profile 204 ?hexose + Na?+ Fructose
3.43.63.84.04.24.44.64.85.05.25.4 ppm
isomaltose
trehalose

Chapter VIII
240
VIII.4.2. Application to Aromatic Compounds
Beer 1 was also selected for a more thorough investigation of aromatic components
using HPLC-NMR/MS. Figure VIII.11 shows the UV chromatogram obtained by gradient
elution of the beer sample in a reverse phase column with acetonitrile/water. At the
wavelengths used for detection (280, 320 and 365 nm), a large number of peaks are
observed, many of which overlap, reflecting the coelution of different compounds.
Figure VIII.11. UV chromatogram resulting from the elution of beer 2 on the column RP-18 (flow rate 1.00 ml/min; injection volume 500 ? l).
In the sight of the relatively poor chromatographic resolution obtained, the time-
slicing method was selected for a subsequent chromatographic run. Using this operational
mode, the flow is stopped at short intervals to “time-slice” different parts of a
chromatographic peak, subsequently analysed by NMR. Combining the 1D NMR spectra
acquired, a “pseudo” on-flow diagram is obtained (Figure VIII.12), allowing an easy
visualisation of the number and type of compounds detected. This diagram shows that
many aromatic components are separated, coeluting with carbohydrates in the first 10 min
of chromatography. A disadvantage of this method is that MS data could not be recorded
because of the interrup tion of the flow during the NMR measurement. However, some
fractions were analysed by MS after collection into loops during another chromatographic
run. The aromatic compounds identified with basis on the structural information provided
by NMR and also by MS of the loops are listed in Table VIII.4. The following paragraphs
discuss the results obtained in more detail.
The aromatic regions of a series of 1H NMR spectra acquired for fractions eluting
in the first 12 min of chromatography are shown in Figure VIII.13. Spectrum 1 (RT 2.5
min) shows two broad resonances at 7.69 and 8.49-8.85 ppm. These signals may arise from
polyphenols, but the information available is scarce to suggest any further identification.
0 5 10 15 20 25 30 Time [min]
0
200
400
600
Intens.[mAU]

Characterisation of Beer Composition by NMR and Hyphenated NMR (HPLC-NMR/MS)
241
Spectrum 2 (RT 3.0 min) contains three doublets (? 5.84, 6.16 and 8.07 ppm) assigned to
cytidine, which has been previously identified with basis on 1D and 2D spectra of whole
beer. Indeed, the positive- ionisation mode mass spectrum recorded for this fraction shows
a peak at m/z 250 corresponding to the molecular ion ?M + D?+ of cytidine in the fully
deuterated form (Mw 243). Spectrum 3 (RT 4.0 min) reveals the coelution of tyrosine (?
6.83 and 7.13 ppm, J 8.5 Hz) and uridine (? 5.84, 7.84 ppm). Again, the mass spectrum
recorded for this fraction confirms this identification as the m/z values 183 and 246,
detected in negative-ionisation mode, correspond to the molecular ions ?M - D?- of tyrosine
(Mw 181) and uridine (Mw 244) in fully deuterated forms. This is an example where both
NMR and MS recognise that different compounds are coeluting, something that the UV
chromatogram alone had failed to observe under the conditions used. Spectrum 4 (RT 5.0
min) is consistent with the presence of adenosine and/or inosine. These compounds are
difficult to distinguish by NMR and also by MS, since their molecular weights only differ
by 1 mass unit and are the same for the fully deuterated forms. Therefore, the m/z value
274 found in the positive- ion mode mass spectrum of this fraction may correspond to either
adenosine or inosine. Spectra 5 (RT 7.5 min) and 6 (RT 10.5 min) show the elution of
phenylalanine and tryptophane, respectively. These amino acids had already been
identified by 1D and 2D NMR of beer and confirmation is now provided by observation of
the typical high field NMR patterns and by MS data.
Figure VIII.12. “Pseudo” on-flow NMR chromatogram, resulting from the elution of beer 1 on the column RP-18 (flow rate 1.00 ml/min; injection volume 500 ? l).
sec
123456789 ppm
30
25
20
15
10
5
0
RT (min)

Chapter VIII
242
Figure VIII.13. Rows of the “pseudo” on-flow NMR chromatogram of beer 1.
After 12 min, fewer compounds are detected in the NMR chromatogram (Figure
VIII.12), but their spectra are “cleaner”, as the carbohydrates have been eluted at the
beginning of chromatography. The spectra of the three compounds identified between 12
and 30 min are shown in Figure VIII.14. Spectrum 1 (RT 14.0 min) shows two triplets at
2.71 and 3.71 ppm and two doublets in the aromatic region (? 6.79, 7.12 ppm, J 8.4 Hz),
consistent with the presence of tyrosol. In the 1D spectrum of beer, the aromatic doublets
of this phenolic alcohol overlap with tyrosine signals. Moreover, as there is no correlation
between aromatic and side chain protons, the TOCSY spectrum does not aid in the
unambiguous identification of these compounds. By HPLC-NMR/MS, both tyrosine and
tyrosol, reported to occur in beer (Hughes and Baxter, 2001), are separated and identified.
Spectrum 2 (RT 26.5 min) and spectrum 3 (RT 28.5 min) also show two triplets in the
high-field region and a group of signals in the aromatic region, thus suggesting the
tyr
6.57.07.58.08.59.0 ppm
1 – RT 2.5 min
2 – RT 3.0 min
5 – RT 7.5 min
4 – RT 5.0 min
3 – RT 4.0 min
6 – RT 10.5 min
polyphenols
adenosine/inosine
cytidine
uridine uridine
phe
trp

Characterisation of Beer Composition by NMR and Hyphenated NMR (HPLC-NMR/MS)
243
presence of other aromatic alcohols. Indeed, spectrum 2 is consistent with 2-phenylethanol
and spectrum 3 shows evidence of 3- indolethanol (tryptophol).
Figure VIII.14. Rows of the “pseudo” on-flow NMR chromatogram of beer 1.
Table VIII.4. MS and NMR data of beer 1 aromatic compounds obtained by HPLC-NMR/MS analysis (time-slicing and loop sampling modes); n.i.: not identified; n.a.: not acquired.
RT (min) MS ( m/z)
NMR signals ? in ppm (multiplicity, J in Hz)
Compounds identified
2.5 n.i. 7.69 (broad), 8.49-8.85 Polyphenols
3.0 ?M+D?+ = 250 5.84 (d, 4.5), 6.16 (d, 8.0), 8.07 (d, 8.0) Cytidine
4.0 ?M-D?- = 183 ?M-D?- = 246
6.83 (d, 8.5), 7.13 (d, 8.5), 5.84 (m), 7.84 (d, 8.4)
Tyrosine Uridine
5.0 ?M+D?+ = 274 6.09 (d, 5.5), 8.37 (s), 8.47 (s) Adenosine/Inosine
7.5 ?M+D?+ = 170 7.27 (m), 7.32 (m), 7.37 (m) Phenylalanine
10.5 ?M+D?+ = 210
7.13 (t, 7.5), 7.22 (t, 7.9), 7.25 (s), 7.47 (d, 8.5), 7.65 (d, 8.0)
Tryptophane
14.0 n.a. 2.71 (t, 6.8), 3.70 (t, 7.0), 6.79 (d, 8.4), 7.12 (d, 8.4)
Tyrosol
26.5 n.a. 2.79 (t, 7.0), 3.74 (t, 7.0), 7.24 (m), 7.31 (m)
2-Phenylethanol
28.5 n.a. 2.94 (t, 7.1), 3.79 (t, 7.1), 7.07 (t, 7.3), 7.15 (m), 7.41 (d, 8.4), 7.60 (d, 7.6)
Tryptophol
345678 ppm
1 – RT 14.0 min
2 – RT 26.5 min
3 – RT 28.5 min
tyrosol
2-phenylethanol
tryptophol

Chapter VIII
244
VIII.5. Conclusions
This work has shown that high resolution NMR is of great utility to characterise the
complex chemical composition of beer, enabling the rapid identification of a large number
of compounds, present in a range of concentrations. This has been achieved in a non-
invasive manner, requiring only the degassing of the beer sample. However, some
difficulties were encountered in the assignment of the beer spectra. In particular, the
spectral distinction of beer carbohydrates, mainly constituted of glucose monomers, was
found to be extremely difficult due to peak overlap even in the 2D spectra.
A deeper insight to characterising beer carbohydrates was achieved by HPLC-
NMR/MS, applied to two beer samples. In one of the samples, a range of carbohydrates,
from small fermentable sugars to dextrins with up to 9 glucose monomers could be
identified. Although the presence or absence of ? (1-6) branching points in each subfraction
could be indicated by NMR, a more complete structural characterisation of the dextrins
present requires further improvement of the chromatographic methods/conditions used, in
tandem with multidimensional NMR methods. The other beer sample analysed was
characterised by the predominance of glucose and the absence of high molecular weight
dextrins, the maximum size being DP4.
HPLC-NMR/MS has also been useful for confirming the identity of some aromatic
compounds previously assigned by NMR alone and for revealing new ones, like the
aromatic alcohols tyrosol, 2-phenylethanol and tryptophol.
References
Belton, P.S.; Delgadillo, I.; Holmes, E.; Nicholls, A.; Nicholson, J.; Spraul, M. Use of high-field 1H NMR spectroscopy for the analysis of liquid foods. Journal of Agricultural and Food Chemistry 1996, 44, 1483-1487. Belton, P.S.; Delgadillo, I.; Gil, A.M.; Roma, P.; Casuscelli, F.; Colquhoun, I.J., Dennis, M.J.; Spraul, M. High field proton NMR studies of apple juices. Magnetic Resonance in Chemistry 1997, 35, S52-S60. Bosco, M.; Toffanin, R.; Palo, D.; Zatti, L.; Segre, A. High resolution 1H NMR investigation of coffee. Journal of the Science of Food and Agriculture 1999, 79, 869-878.

Characterisation of Beer Composition by NMR and Hyphenated NMR (HPLC-NMR/MS)
245
Brescia, M.A.; Caldarola, V.; De Giglio, A.; Benedetti, D.; Fanizzi, F.P.; Sacco, A. Characterization of the geographical origin of Italian red wines based on traditional and nuclear magnetic resonance spectrometric determinations. Analytica Chimica Acta 2002, 458, 177-186. Careri, M.; Mangia, A.; Musci, M. Overview of the applications of liquid-chromatography-mass spectrometry interfacing systems in food analysis: naturally occurring substances in food. Journal of Chromatography A 1998, 794, 263-297. Corradini, C; Canali, G. Nicoletti, I. Application of HPAEC-PAD to carbohydrate analysis in food products and fruit juices. Seminars in Food Analysis 1997, 2, 99-111. Désévaux, S; Daems, V.; Delvaux, F.; Derdelinckx, G. Analysis of fermentable sugars and dextrins in beer by anion exchange chromatography with electrochemical detection. Seminars in Food Analysis 1997, 2, 113-117. Duarte, I.; Barros, A.; Belton,P.S.; Righelato,R.; Spraul, M.; Humpfer,, E.; Gil, A M. High resolution NMR spectroscopy and multivariate analysis for the characterisation of beer. Journal of Agricultural and Food Chemistry 2002, 50, 2475-2481. Gil, A.M.; Duarte, I.F.; Delgadillo, I.; Colquhoun, I.J.; Casuscelli, J.; Humpfer, E.; Spraul, M. Study of the compositional changes of mango during ripening by use of nuclear magnetic resonance spectroscopy. Journal of Agricultural and Food Chemistry 2000, 48, 1524-1536. Hawthorne, D. B.; Jones, R. D.; Barret, P.A.; Kavanagh, T. E.; Clarke, B. J. Methods for the analysis of C4 to C10 fatty acids in beer, wort and carbohydrate syrups. Journal of the Institute of Brewing 1986, 92, 181-184. Hughes, P. S.; Baxter, E. D. Beer Quality, Safety and Nutritional Aspects; The Royal Society of Chemistry: Cambridge, 2001. Jodelet, A.; Rigby, N.M.; Colquhoun, I.J. Separation and NMR structural characterisation of singly branched ? -dextrins which differ in the location of the branch point. Carbohydrate Research 1998, 312, 139-151. Kosir, I. J.; Kidric, J. Identification of amino acids in wines by one- and two-dimensional nuclear magnetic resonance spectroscopy. Journal of Agricultural and Food Chemistry 2001, 49, 50-56. Le Gall, G., Puaud, M., Colquhoun, I.J. Discrimination between orange juice and pulp wash by 1H nuclear magnetic resonance spectroscopy: Identification of marker compounds. Journal of Agricultural and Food Chemistry 2001, 49, 580-588. Pusecker, K.; Albert, K.; Bayer, E. Investigation of hop and beer bitter acids by coupling of high-performance liquid chromatography to nuclear magnetic resonance spectroscopy. Journal of Chromatography A 1999, 836, 245-252.

Chapter VIII
246
Ramos, A.; Santos, H. NMR studies of wine chemistry and wine bacteria. In Annual Reports on NMR Spectroscopy; Webb, G.A. Ed.; Academic Press: London, 1999; 179-202. Sacchi, R.; Patumi, M.; Fontanazza, G.; Barone, P.; Fiordiponti, P.; Mannina, L.; Rossi, E.; Segre, A.L. A high-field 1H nuclear magnetic resonance study of the minor components in virgin olive oils. Journal of the American Oil Chemists’ Society 1996, 73, 747-758. Shanta-Kumara, H. M. C.; Iserentant, D.; Verachtert, H. Comparative analysis of malto-oligosaccharides in different beer types by thin layer chromatography, chemical and enzymatical analysis. Cerevisia: Belgian Journal Brewing Biotechnology 1995, 20, 47-53. Uchida, M.; Nakatani, K.; Ono, M.; Nagami, K. Carbohydrates in brewing. I. Determination of fermentable sugars and oligosaccharides in wort and beer by partition high-performance liquid chromatography. Journal of the American Society of Brewing Chemists 1991, 49, 665-673. Van der Burgt, Y.E.M.; Bergsma, J.; Bleeker, I.P.; Mijland, P.J.H.C.; Kamerling, J.P.; Vliegenthart, J.F.G. Substituent distribution in highly branched dextrins from methylated starches. Carbohydrate Research 2000, 327, 423-429. Vinogradov, E.; Bock, K. Structural determination of some new oligosaccharides and analysis of the branching patterns of isomaltooligosaccharides from beer. Carbohydrate Research 1998, 309, 57-64.

IX. MULTIVARIATE ANALYSIS OF NMR AND FTIR OF BEER AS A
POTENTIAL TOOL FOR BEER QUALITY CONTROL
IX.1. Introduction………………………………………………………………………...
IX.2. Materials and Methods……………………………………………………………..
IX.2.1. Sample Preparation………………………………………………………...
IX.2.2. Spectroscopic Measurements………………………………………………
IX.2.3. Multivariate Analysis………………………………………………………
IX.3. Principal Components Analysis (PCA) of NMR Data…………………………….
IX.4. Principal Components Analysis (PCA) of FTIR Data……………………………..
IX.5. Canonical Correlation Analysis (CCA) of NMR and FTIR Data………………….
IX.6. Conclusions………………………………………………………………………...
References………………………………………………………………………………..
.
24
8
24
9
24
9
24
9
25
1
25
1
26
1
26
3
26
5
26
6

Chapter IX
248
IX.1. Introduction
The maintenance of beer quality throughout its lifetime is a considerable challenge,
reinforced by the increasing demands of the market forces for extended distribution chains.
In order to accomplish an efficient quality control and extended shelf life, the detailed
study of beer composition and quality attributes is of paramount importance. High
resolution NMR and hyphenated NMR methods may give a valuable contribution to that
study, as demonstrated in Chapter VIII. In addition, it is also important to develop methods
which provide rapid information about factors such as geographical origin, processing
conditions and reproducibility within different brewing sites. To accomplish this task,
multivariate analysis of spectroscopic data may be a possible strategy. Spectroscopic
methods can provide information on a wide range of compounds present in the food matrix
in a single experiment, offering advantages in terms of simplicity of sample preparation
and rapidity of analysis. The speed with which spectra can be obtained, often under
automation, makes examination of many samples possible. Since the richness of
information often results in high spectral complexity, it calls for the use of multivariate
analysis to study large numbers of spectra and extract meaningful information.
The application of chemometrics to high resolution 1H NMR data has been
successfully used for the analysis of biological fluids and tissues and the investigation of
perturbed metabolic processes (Lindon et al., 2000; Lindon et al., 2001). In the area of
food research, there are also promising results concerning the classification of apple juice
according to variety (Belton et al., 1998), the detection of adulteration of orange juice
(Vogels et al., 1996; Le Gall et al., 2001), the discrimination of coffee samples differing in
the manufacturing process (Charlton et al., 2002), the geographical origin classification of
oils (Sacchi et al., 1998) and wines (Vogels et al., 1993; Brescia et al., 2002), and the
differentiation of grapevine cultivars and clones (Forveille et al., 1996). The usefulness of
FTIR spectroscopy in tandem with chemometrics to tackle the problems of food
authentication and adulteration has also been demonstrated for several foods, namely fruit
products (Twomey et al., 1995; Defernez and Wilson, 1995; Kemsley et al., 1996; Holland
et al., 1998), coffee (Briandet et al., 1996; Downey et al., 1997), wine (Edelmann et al.,
2001) and meat (Al-Jowder et al., 2002).
In this work, Principal Components Analysis (PCA) is applied for the first time to our
knowledge to the high resolution 1H NMR spectra and to the FTIR-ATR spectra of a set of

Multivariate Analysis of NMR and FTIR of Beer as a Potential Tool for Beer Quality Control
249
fifty beers in order to find out if the spectral profile of beer may be consistently correlated
with specific compositional properties and/or sample origin. These beers have been
produced in different countries and belong to different types (ale, lager and alcohol- free),
which basically differ on the fermentation conditions, as described in Chapter I (section
I.3). Moreover, Canonical Correlation Analysis (CCA) is used to correlate the two domains
(NMR and FTIR), which may potentially reveal complementary information.
IX.2. Materials and Methods
IX.2.1. Sample Preparation
A set of 50 beers, some produced nationally and others imported from different
countries, was obtained in the Portuguese market. Some of their characteristics are given in
Table IX.1, namely the country of origin, the type (ale, lager, alcohol- free), the alcohol
content and the pH. For NMR measurements, beer samples were degassed in an ultrasonic
bath during 10 minutes and prepared to contain 10% D2O (internal lock) and 0.02%
sodium 3-(trimethylsilyl)tetradeutero propionate (TSP-d4) as chemical shift reference. For
FTIR measurements, preparation simply consisted of degassing the beers in an ultrasonic
bath during 10 minutes.
IX.2.2. Spectroscopic Measurements
The 1H 1D NMR spectra were recorded at 27ºC on a Bruker Avance DRX-600
spectrometer, operating at 599.87 MHz for proton. The pulse program ‘lc1pnps’ (shown in
appendix) was used, with suppression of water and ethanol signals by applying a
modulated shaped pulse during the mixing time (100 ms) and 1.6 s of the relaxation delay
(8.0 s). 128 transients were collected into 32768 data points with a spectral width of
8389.26 Hz and an acquisition time of 1.95 s. The spectrometer was equipped with an
autosampler and the data were acquired under an automation procedure that included
temperature stabilisation (5 min), automatic tuning and shimming, calculation of the
shaped pulse for triple suppression, and acquisition, requiring approximately 30 min per
sample. The FIDs were Fourier transformed (with 0.3 Hz line-broadening unless otherwise
stated) and the spectra phased, baseline corrected and calibrated by the TSP signal at 0.0
ppm. The resulting spectra were converted into JCAMP format and transferred to a PC
workstation for statistical analysis.

Chapter IX
250
Table IX.1. Some characteristics of the beers analysed; (a) analysed by FTIR only, (b) analysed by NMR only.
Sample no. Origin Type % Alcohol pH
1 Portugal Lager 5.2 4.38 2 Portugal Lager 5.1 3.92 3 Portugal Lager 5.2 4.42 4 Ireland Ale 4.2 4.15 5 Portugal Lager 5.1 3.95 6 Portugal Alcohol-free < 0.5 4.28 7 Portugal Alcohol-free < 0.5 4.58 8 Portugal Lager 5.8 4.32 9 Portugal Lager 5.1 4.06 10 Belgium Lager 4.9 4.01 11 Portugal Lager 4.3 4.01 12 Portugal Lager 5.0 4.28 13 Portugal Lager 4.2 4.40 14 Spain Lager 5.0 4.00 15 Portugal Lager 5.4 4.52 16 Belgium Lager 4.6 4.14 17 Belgium Ale 6.5 4.32 18 Portugal Lager 5.1 4.00 19 unknown Lager 4.8 4.12 20 Germany Lager 4.8 4.12 21 Germany unknown 4.8 4.49 22 Belgium Ale 8.5 4.23 23 Belgium Ale 9.0 4.33 24 Belgium Ale 8.0 4.28 25 England unknown 5.0 3.86 26 England Lager 4.7 4.02 27 England Lager 5.0 4.11 28 Scotland Ale 6.0 3.91 29 Germany unknown 4.8 4.35 30 Germany Ale 5.0 4.24 31 Germany Ale 5.0 3.97 32 Germany Ale 5.0 4.08 33 Belgium Ale 9.0 4.24 34 Belgium Ale 8.1 4.15 35 Belgium Ale 6.6 4.14 36 Belgium Ale 6.5 4.02 37 Belgium Lager 5.2 4.14 38 Germany Lager 5.0 4.14 39 Holland Lager 5.0 4.24 40 Holland Alcohol-free < 0.5 4.05 41 Spain Lager 5.4 4.16
42 (a) Holland Alcohol-free < 0.5 4.22 43 Holland Lager 5.0 4.01 44 Holland Lager 5.4 4.27 45 Portugal Ale 7.2 4.52 46 England Ale 4.7 3.96 47 Germany Ale 4.9 4.01 48 U.S.A. Lager 4.2 3.76 49 England Ale 4.0 4.07
50 (b) Germany Lager unknown unknown

Multivariate Analysis of NMR and FTIR of Beer as a Potential Tool for Beer Quality Control
251
Fourier transform infrared spectra were collected on a Bruker IFS55 FTIR
spectrometer. A single reflectance horizontal ATR cell (Golden Gate, equipped with a
diamond crystal) was used. The data were recorded at 20 ? 1oC, in the spectral range of
4000-700 cm-1, by accumulating 256 scans with a resolution of 4 cm-1. For each sample, a
total of five spectra (replica) were recorded. Between determinations, the crystal was
carefully cleaned with water and, to avoid memory effects, the replica spectra were
recorded randomly i.e. intermingled with the spectra of other samples. The spectra were
converted into JCAMP format and transferred to a PC workstation for statistical analysis.
IX.2.3. Multivariate Analysis
For PCA of NMR spectra, data matrices corresponding to different spectral regions
were built, excluding the segments containing water and ethanol resonances (at 4.80 ppm
and at 1.17 and 3.65 ppm, respectively) to eliminate the variation in these signals
suppression. The spectral regions considered were: a) whole spectral range (0.5-10.0 ppm);
b) aliphatic region (0.5-3.0 ppm), c) sugar region (3.0-6.0 ppm) and d) aromatic region
(6.0-10.0 ppm). Each spectral region was normalised by adjusting the total area to unity.
For PCA of FTIR spectra, the region between 1200 and 800 cm-1 was selected and each
spectrum was autoscaled (mean centred and standardised). Canonical Correlation Analysis
(CCA) was performed using the 1200-800 cm-1 region of the FTIR autoscaled spectra and
the 0.5-10.0 ppm region of the NMR spectra. The calculations were performed using the
program developed by Dr. A. Barros in the ‘Institut National Agronomique Paris-Grignon’
in collaboration with the University of Aveiro (Barros, 1999).
IX.3. Principal Components Analysis (PCA) of NMR Data
In order to look for the main sources of variability in the 1H NMR spectra recorded
for the beer samples, PCA was firstly performed using the 0.5-10.0 ppm region, excluding
the water and ethanol resonances.
The first two PCs, which together express 49% of the total variance (PC1 = 25%,
PC2 = 24%), are displayed as a two-dimensional map in Figure IX.1a, where the sample
coordinates are the scores. Four clusters are suggested in the scores scatter plot: a large
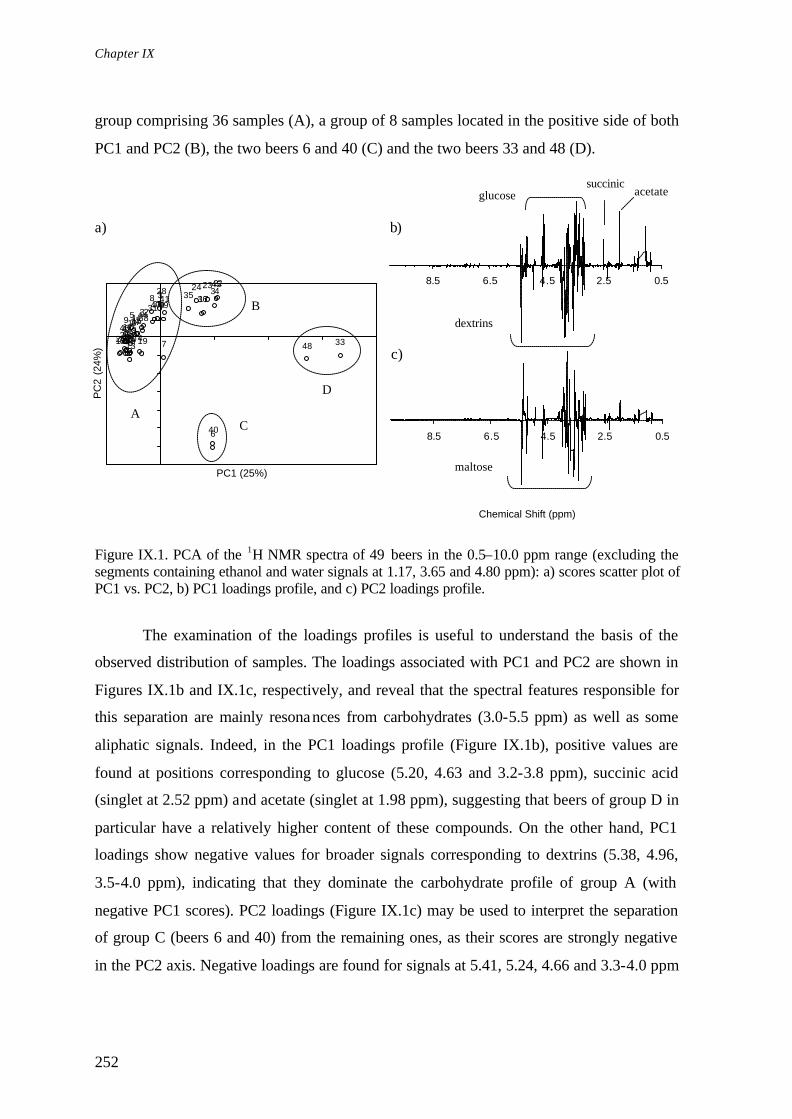
Chapter IX
252
group comprising 36 samples (A), a group of 8 samples located in the positive side of both
PC1 and PC2 (B), the two beers 6 and 40 (C) and the two beers 33 and 48 (D).
a) b)
Figure IX.1. PCA of the 1H NMR spectra of 49 beers in the 0.5–10.0 ppm range (excluding the segments containing ethanol and water signals at 1.17, 3.65 and 4.80 ppm): a) scores scatter plot of PC1 vs. PC2, b) PC1 loadings profile, and c) PC2 loadings profile.
The examination of the loadings profiles is useful to understand the basis of the
observed distribution of samples. The loadings associated with PC1 and PC2 are shown in
Figures IX.1b and IX.1c, respectively, and reveal that the spectral features responsible for
this separation are mainly resonances from carbohydrates (3.0-5.5 ppm) as well as some
aliphatic signals. Indeed, in the PC1 loadings profile (Figure IX.1b), positive values are
found at positions corresponding to glucose (5.20, 4.63 and 3.2-3.8 ppm), succinic acid
(singlet at 2.52 ppm) and acetate (singlet at 1.98 ppm), suggesting that beers of group D in
particular have a relatively higher content of these compounds. On the other hand, PC1
loadings show negative values for broader signals corresponding to dextrins (5.38, 4.96,
3.5-4.0 ppm), indicating that they dominate the carbohydrate profile of group A (with
negative PC1 scores). PC2 loadings (Figure IX.1c) may be used to interpret the separation
of group C (beers 6 and 40) from the remaining ones, as their scores are strongly negative
in the PC2 axis. Negative loadings are found for signals at 5.41, 5.24, 4.66 and 3.3-4.0 ppm
9
8
7
6
5
449 48
47
46
45
44
43
41
40
339
3837
3635 34
33
323130
229
28
272625
242322
2120
1
1918
17
16
15
1413
1211
10
PC1 (25%)
PC
2 (2
4%)
A
B
C
D
c)
glucose
dextrins
maltose
succinic acetate
0.52.54.56.58.5
0.52.54.56.58.5
Chemical Shift (ppm)

Multivariate Analysis of NMR and FTIR of Beer as a Potential Tool for Beer Quality Control
253
which may be attributed to maltose, therefore, beers 6 and 40 are in principle characterised
by an important contribution of this disaccharide rather than other carbohydrates.
The information provided by the loadings profiles may be verified by comparing
the NMR spectra of the beers separated. Figure IX.2 shows the sugar regions of the spectra
recorded for beer 1 (randomly selected from group A of samples), beer 23 (group B), beer
6 (group C) and beer 33 (group D). The first two samples (top spectra) are clearly
characterised by the strong contribution of dextrins. However, just with basis on the 1D
spectra, it does not become clear why PCA suggests distinction of two profiles (groups A
and B) and it is possible that this distinction reflects small differences in the nature and
quantitative proportions of the dextrins present. The spectrum of beer 6 is dominated by
the signals of maltose, and the same may be observed in the spectrum of beer 40 (not
shown). On the other hand, glucose clearly predominates in beer 33, as well as in beer 48
(spectrum not shown), confirming the observations of the PCA approach.
a) beer 1 (group A)
b) beer 23 (group B)
c) beer 6 (group C)
d) beer 33 (group D)
Figure IX.2. Sugar region (3.0-5.6 ppm) of the 600 MHz 1H NMR spectra of four different beer samples (numbered according to Table IX.1); NS 128.
3.54.04.55.05.5 ppm

Chapter IX
254
Relating the PCA results with the known characteristics of the samples, presented
previously in Table IX.1, it is interesting to note that group B comprises all the ale beers
containing more than 6.0% alcohol, except for beer 33, which, despite its high alcoholic
content (9.0%), is more similar to beer 48 (group D). On the other hand, the samples
forming group C are both alcohol- free beers. Therefore, one may suggest that the
differences highlighted by PCA in the carbohydrate profile are, at least in part, related to
the beer alcoholic content. It should be noted that this correlation is not a direct one since
the NMR regions where ethanol peaks resonate have been left out for the PCA.
Nevertheless, this result is not surprising since the production of beers with different
alcohol contents generally involves varied fermentation conditions, thus affecting the
amount and type of fermentable sugars and dextrins present in the final product.
When PCA is performed using the whole spectral range, the contribution of minor
components may be overlooked. Therefore, PCA was also performed on data matrices
constructed for NMR sub-regions, as described in section IX.2.3. PCA of the sugar regions
(not shown) produced identical results to those obtained when the whole spectra were
considered, since those results reflected mainly differences in the carbohydrate
composition.
The scores scatter plot obtained when only the aliphatic regions of the spectra are
considered for PCA shows considerable dispersion and apparently no clustering exists
(Figure IX.3a). The first two PCs explain only 27% of the total variance and the plots of
subsequent PCs show the same kind of dispersion. Therefore, the aliphatic region of the
spectra considered here is not particularly relevant for distinction between the beers
analysed.
When only the aromatic regions of the spectra are considered for PCA, the scores
scatter plot obtained shows some dispersion along PC1, which contains 22% of the total
variance (Figure IX.3b). In spite of this small percentage, it is interesting to note that the
scores lying towards the negative side of PC1 (group A) correspond to the majority of the
ale beers analysed, whereas the scores near zero or in positive PC1 (group B) correspond
mostly to lager beers, although three ales (beers 4, 46 and 49) are also included in this
group. These results indicate that the aromatic region is the spectral region showing higher
sensitivity to the fermentation processes that originate the two main types of beer, ale and

Multivariate Analysis of NMR and FTIR of Beer as a Potential Tool for Beer Quality Control
255
lager. It may therefore be suggested that the aromatic region of the spectra may be used to
distinguish between these beer types. The PC1 loadings profile, shown in Figure IX.4a,
gives an indication of which aromatic compounds are responsible for the observed
separation of samples; however, care should be taken in this analysis as some signals show
a first-derivative- like effect, resulting from shifts (caused mainly by differences in the
samples pH) and not from real changes in sample composition. The negative PC1 loadings
that contribute to the ale aromatic profiles (group A) seem to arise mainly from
polyphenolic species (relatively broad signals at 6.84, 7.50 and 7.67 ppm, indicated with
arrows in Figure IX.4). Among the positive PC1 loadings that characterise lager beers
(group B), the most significant peaks correspond to the signals of tyrosine/tyrosol
(doublets at 6.87 and 7.17 ppm), histidine (singlets at 7.04 and 7.99 ppm) and 2-
phenylethanol (multiplets at 7.36 and 7.40 ppm).
a) b)
Figure IX.3. Scores scatter plot of PC1 vs. PC2 obtained by PCA of the 1H NMR spectra of 49 beers, using: a) the aliphatic region (0.5-3.0 ppm, excluding the segment containing the 1.17 ppm ethanol signal), and b) the aromatic region (6.0-10.0 ppm).
The scores scatter plot obtained for the aromatic regions (Figure IX.3b) also show
the separation of two samples along PC2, explaining 17% of the total variance (group C).
The two samples have positive PC2 scores and correspond to the alcohol- free beers 6 and
40, that is, those which had already been distinguished from the other beers with basis on
their carbohydrate composition. The present result shows that these beers also differ from
the bulk of the samples in terms of their aromatic composition. However, the PC2 loadings
profile does not clearly show which aromatic components cause this distinction, due to the
strong first-derivative- like effect observed for most signals (Figure IX.4b).
1011
1213
14
15
16
17
18
19
1
20
21
22
23
24
25
26
27
28
29
2
30
31
32
33
34
35
36
37
38
39
3
40
41
43
4445
46 47
48
49
4
567
8
9
PC1 (15%)
PC
2 (1
2%)
10
11
12
1314
15
16
1718
19
1
20 21222324
25
26
2728
292
303132
33
3435
36
3738393
40
41
43
44
454647
48 494
5
6
78
9
PC1 (22%)
PC
2 (1
7%)
A B
C

Chapter IX
256
a)
b)
Figure IX.4. PCA of the 1H NMR spectra of 49 beers, using the aromatic region (6.0-10.0 ppm): a) PC1 loadings profile and b) PC2 loadings profile.
The variations between the resonance positions of comparable lines in different
spectra, caused by differences in the samples pH/concentration and/or instrumental
instabilities (e.g. temperature), constitute artefacts that may lower the classification ability
and the stability of the multivariate data analysis. As described above, these variations are
clearly seen to hinder the interpretation of the loadings obtained for the aromatic region of
the spectra, and may also affect the PCA results obtained for other spectral regions.
Therefore, the correction of shifts has been attempted by increasing the factor used for the
exponential multiplication of the FIDs (line broadening or LB factor), which reduces the
spectral resolution, thus masking the shifts. A sub-group of 35 beer spectra have been
processed with LB values of 0.3, 10, 30 and 50 Hz and new data matrices have been
constructed. The effect of these LB factors on the spectra is illustrated in Figure IX.5. As
expected, all signals become broader and many weak signals in the aliphatic and aromatic
regions become undetectable for larger LB’s. Table IX.2 shows the percentage of total
variance explained by PC1 and PC2, resulting from applying PCA to the new data
matrices. In general, higher values are obtained for higher LB factors. The following
paragraphs discuss this effect in more detail, for the three spectral regions considered.
5.606.607.608.60
tyr / tyrosol his
2-phenylethanol
his
5.606.607.608.60
Chemical Shift (ppm)

Multivariate Analysis of NMR and FTIR of Beer as a Potential Tool for Beer Quality Control
257
a) LB 0.3 Hz
b) LB 10 Hz
c) LB 30 Hz
d) LB 50 Hz
Figure IX.5. 600 MHz 1H NMR spectrum of beer 1 processed with different LB factors.
Table IX.2. Percentage of the variance explained by PC1 and PC2 when different LB factors are used for processing the NMR spectra.
Aliphatic Region Sugar Region Aromatic Region
LB (Hz) PC1 PC2 PC1 PC2 PC1 PC2
0.3 14 13 30 26 21 21
10 30 20 41 33 31 26 30 42 20 52 30 47 16
50 53 19 59 27 model without solution
Starting with the sugar region, the PC1 vs. PC2 scores scatter plot obtained for the
spectra processed with different LB’s is shown in Figure IX.6. The main difference regards
the location of beer 7, which, with increasing LB, becomes progressively closer to the
group formed by beers 6 and 40. Beer 7 is also an alcohol- free beer and its carbohydrate
profile is, in fact, very similar to that of beers 6 and 40, although it shows small shifts (? ?
0.002-0.003 ppm) compared to the spectra of those beers. When LB values of 30-50 Hz are
used, these shifts are no longer observed in the spectra and the 3 samples become clustered
in the corresponding scores scatter plots (Figures IX.6c and IX.6d), indicating that the
separation of beer 7 from beers 6 and 40 shown in Figures IX.6a and IX6b does not
correspond to true differences in the composition of the samples. On the other hand, the
789 ppm
23456789 ppm

Chapter IX
258
separation of group B, comprising beers with more than 6.0% alcohol, is no longer
observed for LB factors greater than 0.3 Hz. This loss of information is obviously caused
by the decrease in spectral resolution, which masks the small differences between the
dextrins profiles of groups A and B.
a) c)
b) d)
Figure IX.6. Scores scatter plots of PC1 vs. PC2 obtained by PCA of the sugar region of the 1H NMR spectra of 35 beers, processed with different LB’s: a) 0.3, b) 10, c) 30 and d) 50 Hz.
When the aliphatic regions of the spectra are considered for PCA, the increase of
LB results in the gradual clustering of beers 6, 7 and 40 (Figure IX.7). These beers become
separated along PC1 and the percentage of variance explained by this axis increases with
increasing LB (Table IX.2). The PC1 loadings are shown in Figure IX.8. For LB 0.3 Hz,
the loadings profile shows strong first-derivative- like effects, due to shifts in the signals of
acetate, pyruvic and succinic acids. For higher LB values, these effects are no longer
observed and the features responsible for separation of the alcohol- free beers become
apparent in the PC1 loadings profile: the signals of alanine and arginine (1.46 and 1.70
ppm, respectively) show positive loadings, suggesting that beers 6, 7 and 40 have a
relatively higher content of these amino acids, whereas the signals of acetate, pyruvic and
succinic acids are negative, thus being more abundant in the samples with negative PC1
scores. Therefore, these results show that the aliphatic regions of the beer spectra do
10 1622021
2223241
33032
33
343536
3745 47 50
1829111213
1517 3138
40
5
67
89
PC1 (59%)
PC
2 (2
7%)
47
40
3837
363534
33
32313029
242322
2120
17
1698
76
505
453
218
1513 12 11101
PC1 (52%)
PC
2 (3
0%)
50
4740
3837
3635
34
33
32313029
2423
22
2120
17
16109
8 7 65
45
321815
1312111
PC1 (41%)
PC
2 (3
3%)
98
7
6
5
45
3218 15
131211 11016
17
2021
222324
29303132
33
3435
36
3738
40
4750
PC1 (30%)
PC
2 (2
6%)
A
B
C
D

Multivariate Analysis of NMR and FTIR of Beer as a Potential Tool for Beer Quality Control
259
contain information that can be used to distinguish beers, namely the alcohol- free beers
from the remaining ones, contrarily to what has been observed by applying PCA to the
spectra processed with LB 0.3 Hz.
a) c)
b) d)
Figure IX.7. Scores scatter plots of PC1 vs. PC2 obtained by PCA of the aliphatic region of the 1H NMR spectra of 35 beers, processed with different LB’s: a) 0.3, b) 10, c) 30 and d) 50 Hz.
a) c)
b) d)
Figure IX.8. PC1 loadings profiles obtained by PCA of the aliphatic region of the 1H NMR spectra of 35 beers, processed with different LB’s: a) 0.3, b) 10, c) 30 and d) 50 Hz.
1
10
11
12
13
15
18
2
3 45
5
50
67
8
91617
20
21 22
23242930
3132
33
3435
36
3738 40
47
PC1 (53%)
PC
2 (1
9%)
50
47
40
383736
35 3433
323130
29
24
23
22
21
20
17
16
10
1
11
1213
15
18
2
3455
6
7
8
9
PC1 (14%)
PC
2 (1
3%)
9
8
7
6
5
4038
31
17
15
131
11
12
50
47
45
3736
3534
33
32
30329
24
23
22
21
20218 16
10
PC1 (30%)
PC
2 (2
0%)
1
10
11
1213
15
18 2
345
5
50 67
8
916
17
20
21
22
23
24 29303132
33
3435
3637
3840
47
PC1 (42%)
PC
2 (2
0%)
0.511.522.53
acetate pyruvic succinic
0.511.522.53
ala arg
Chemical Shift (ppm)
0.511.522.53
0.511.522.53
Chemical Shift (ppm)

Chapter IX
260
Finally, when the aromatic regions are considered, the increase of the LB factor
affects once more the location of beer 7 in the scores scatter plot (Figure IX.9). Although
this beer has a very similar aromatic profile to those of the other alcohol- free beers
(samples 6 and 40), it only clusters with them when a 30 Hz LB is used, due to the
masking of pH-related shifts. On the other hand, the reduction of resolution with increasing
LB is clearly seen to cause the loss of important information, since the suggested
separation of beers according to type is no longer observed for LB 30Hz, and for LB 50 Hz
a model without solution is obtained, because many weak signals become undetectable due
to excessive broadening. These results demonstrate that the attempt made here to correct
for shifts by decreasing the spectral resolution may help to highlight true compositional
similarities/differences between some samples, but it also has the disadvantage of
eliminating important spectral features. Therefore, it would be more useful to carry out
spectral alignment without reducing the resolution; some preprocessing algorithms like the
partial linear fit (Vogels et al., 1993; Vogels et al., 1996) and the dynamic time warping
(Pravdova et al., 2002) seem to be promising in this respect.
a) b)
c)
Figure IX.9. Scores scatter plots of PC1 vs. PC2 obtained by PCA of the aromatic region of the 1H NMR spectra of 35 beers, processed with different LB’s: a) 0.3, b) 10 and c) 30 Hz.
9 87
6
50
5
40
38
31
1715131211
10
118 162
20 21
222324
293
3032
3334
353637
45
47
PC1 (31%)
PC
2 (2
6%)
1
10
11
12 1315
182 3
45
5
50
6
789
16
17
20 21
222324
29
303132
33
34
3536
3738
40
47
PC1 (21%)
PC
2 (2
1%)
1
11
121315
1731
38
40
5
6
7
8
910
16
182
2021
22
2324
293
303233
3435
36
37
45
47
50
PC1 (47%)
PC
2 (1
6%)

Multivariate Analysis of NMR and FTIR of Beer as a Potential Tool for Beer Quality Control
261
IX.4. Principal Components Analysis (PCA) of FTIR Data
Figure IX.10a shows the FTIR spectra of four beers in the region selected for PCA
(1200-800 cm-1), i.e. the fingerprint region of the mid- infrared wavelength range. In the
three top spectra, as well as in the spectra of most beers analysed, the most intense bands
appear at 1151-1155, 1079-1085, 1045 and 879 cm-1. These bands reflect mainly the
contributions of beer carbohydrates and of ethanol, as seen by comparison with the
reference spectra shown in Figure IX.10b: ethanol strongly absorbs at 879, 1045 and 1079
cm-1, while maltose and malto-oligosaccharides show several overlapping bands ranging
from 998 to 1155 cm-1. On the other hand, the spectrum shown at the bottom of Figure
IX.10a does not show the band at 879 cm-1 and shows much lower intensity for the 1045
cm-1 band, in agreement with the fact that it belongs to a alcohol- free beer. In this
spectrum, the contribution of maltose/dextrins is thus clearly visible, as indicated by the
similarity with the reference spectra shown in Figure IX.10b.
a)
b)
Figure IX.10. 1250-800 cm-1 region of the FTIR-ATR spectra of a) four different beers, numbered according to Table IX.1, and of b) ethanol, maltose and potato starch dextrin aqueous solutions.
800900100011001200
Wavenumber (cm -1)
Beer 1
Beer 23
Beer 33
Beer 6
879
1029
1045
1085
1155
998
1043 1079
1110 1151
800900100011001200
Wavenumber (cm-1)
800900100011001200
Wavenumber (cm-1)
Ethanol
Maltose
Dextrin
879
1045
1085
998
1041 1078
1111 1151
1024

Chapter IX
262
Although visual inspection of the FTIR spectra may be useful for a general survey
of major components, the detailed interpretation of compositional differences between
samples is impeded by the strong band overlap, thus calling for multivariate analysis. PCA
of the FTIR spectra of the 49 beer samples analysed has therefore been performed (using
the 1200-800 cm-1 spectral region). Figure IX.11a shows the scores scatter plot of the first
two PCs, which together account for 93% of the total variance. PC1 contains most of that
variance (77%) and separates the beers containing more than 6% alcohol (whose scores fall
in the negative side of this axis) from the remaining ones. Indeed, the PC1 loadings profile
(Figure IX.11b) shows negative values at the absorption bands characteristic of ethanol
(879, 1045 and 1085 cm-1), indicating that higher amounts of this compound characterise
the samples with negative PC1 scores. On the othe r hand, the four alcohol- free beers
(samples 6, 7, 40 and 42) are roughly separated from the others along PC2, showing scores
lying in the negative side of this axis. The PC2 loadings profile (Figure IX.11c) shows
negative values at 1024, 1060, 1076, 1110 and 1149 cm-1, which correspond to
characteristic absorption bands of maltose/malto-oligosaccharides, thus suggesting that the
alcohol- free beers differ from the remaining samples in the carbohydrate composition.
Indeed, NMR analysis has shown that these beers are characterised by the predominance of
maltose, containing only small amounts of dextrins, unlike the majority of the other
samples, in which dextrins are abundant. In addition, the positive values of PC2 loadings
correspond to ethanol absorption bands, meaning that this compound is also influencing
the separation of samples along this axis.
a) b)
c)
Figure IX.11. PCA of the FTIR-ATR spectra of 49 beers (1200-800 cm-1): a) scores scatter plot of PC1 vs. PC2, b) PC1 loadings profile, and c) PC2 loadings profile.
98
76
5
453 2
119
18
15
13
12
1110
449
48
474644
43
42
41
40
39383736
3534
33
32
31
3029
28
2726
2524
2322
2120
1716
14
PC1 (77%)
PC
2 (1
6%)
> 6.0% alcohol
alcohol-free
800900100011001200
800900100011001200
Wavenumber (cm-1)
879 1045 1085

Multivariate Analysis of NMR and FTIR of Beer as a Potential Tool for Beer Quality Control
263
In summary, PCA of the FTIR spectra identifies the alcohol content and the
carbohydrate composition as the main differences between the beers analysed. Compared
to PCA of the NMR spectra, discussed in the previous section, these results are much less
informative, since NMR could also provide information on the contribution of specific
carbohydrates (glucose, maltose and dextrins) and of other components such as organic
acids (acetate, pyruvic and succinic acids) and aromatic compounds (histidine,
tyrosine/tyrosol, 2-phenylethanol and polyphenols) to the separation of samples.
IX.5. Canonical Correlation Analysis (CCA) of NMR and FTIR Data
In order to highlight possible correlations between the NMR and FTIR domains,
Canonical Correlation Analysis (CCA) has been applied to the 0.5-10.0 ppm NMR spectral
regions (processed with LB 0.3 Hz) and to the 1200-800 cm-1 regions of the FTIR spectra.
As briefly described in Chapter II.5.3, this analysis seeks for correlations between two sets
of variables measured on the same samples and highlights those variables that are changing
in the same direction in both domains. The CCA approach may, therefore, be useful for
exploring complementary information provided by NMR and FTIR data. The strength of
NMR resides in the readability of the spectra and of the loadings resulting from PCA,
which reveal part of the chemical origin responsible for the separation of samples in the PC
space. The interpretation of the FTIR PCA loadings is less informative since, generally,
infrared bands in the fingerprint region cannot be attributed to individual components. On
the other hand, the FTIR technique presents some advantages, such as the much lower
price of the equipment and the higher rapidity of analysis. The correlations established by
CCA between the well-characterised NMR variables and the FTIR variables may,
therefore, help evaluate the real potential of FTIR in providing further information.
Figure IX.12a shows the canonical scores scatter plot obtained by CCA of the
NMR and FTIR spectra. The correlation coefficients are high for both canonical variates
(0.99 for CV1 and 0.97 for CV2), indicating that the NMR and FTIR spectral features
contributing to the observed distribution of samples along CV1 and CV2 are strongly
correlated, i.e. vary in the same direction.

Chapter IX
264
a)
Figure IX.12. CCA of NMR (0.5-10.0 ppm) and FTIR (1200-800 cm-1) spectra of beers: a) Canonical scores scatter plot CV1 vs. CV2, b) NMR CV1 loadings profile, c) NMR CV2 loadings profile, d) FTIR CV1 loadings profile, and e) FTIR CV2 loadings profile.
Beers 6, 7 and 40 are clearly separated from the others due to their significantly
positive CV1 scores. The NMR loading for this canonical variate (Figure IX.12b) shows
positive values at positions corresponding to maltose, in agreement with the results
10
1112 131415
16
17
18
19
12021
22
23 24
25
26
27
28
292303132
33
3435
36
3738
39
3
4041
43
44
45
4647
48
49
4
5 678
9
CV1 (0.99)
CV
2 (0
.97)
alcohol-free
d) FTIR CV1 loadings profile
e) FTIR CV2 loadings profile c) NMR CV2 loadings profile
b) NMR CV1 loadings profile
0.52.54.5
dextrins
maltose
glucose
0.52.54.5
succinic
acetate
Chemical Shift (ppm)
800900100011001200
879
1045
1004
1075 1112
1089 1160
800900100011001200
879
1045
Wavenumber (cm-1)

Multivariate Analysis of NMR and FTIR of Beer as a Potential Tool for Beer Quality Control
265
obtained by PCA. The FTIR CV1 loading (Figure IX.12d) is clearly positive at 1075 and
1112 cm-1, which are indeed two of the most prominent bands in the spectrum of maltose
(Figure IX.10b). On the other hand, CV1 is negative for signals corresponding to dextrins
in the NMR domain (Figure IX.12b), while in the FTIR domain (Figure IX.12d), the
negative loading values correspond to bands characteristic of ethanol (at 879, 1045, and
1160 cm-1) and also to bands at 1004 and 1160 cm-1 which may be related to the presence
of dextrins.
CV2 determines the separation of beer 33, which is characterised by the
predominance of glucose and by relatively high contents of acetate and succinic acid, as
shown by the CV2 NMR loading with positive values for the chemical shifts of these
compounds (Figure IX.12c). The FTIR loading for this CV (Figure IX.12e) shows that
ethanol content is also responsible for separation of this beer (positive bands at 879 and
1045 cm-1). Indeed, if glucose, succinic acid and acetate were the only factors accounting
for the observed distribution, beer 48 would be clustered with beer 33, as occurred when
PCA of NMR spectra was performed (Figure IX.1 in section IX.3). The separation of these
two beers from one another in the canonical scores scatter plot (Figure IX.12a) is therefore
determined by the information carried by FTIR on the alcohol content (9.0 % in beer 33
and only 4.2 % in beer 48). This result clearly demonstrates that the NMR and FTIR data
of these samples provide complementary information on different components.
IX.6. Conclusions
Principal Components Analysis has been used for the first time to analyse high
resolution 1H NMR and FTIR spectra of beers of different labels, types and countries of
origin. When PCA was performed on the whole NMR spectra, four clusters were separated
on the PC space. Inspection of the loadings and of the spectra showed that samples in these
clusters differ in the carbohydrate composition: two of the clusters are characterised by the
predominance of dextrins (probably differing in nature or quantitative proportions),
whereas a group of alcohol- free beers is characterised by the predominance of maltose and
two other samples are dominated by the contribution of glucose. If PCA is performed on
separate spectral regions, the contribution of minor components is highlighted. In
particular, most ales and lagers could be distinguished with basis on their aromatic

Chapter IX
266
composition, showing the sensitivity of the aromatic spectral region toward these two types
of fermentation. The ale profile seems to be characterised by a higher amount of
polyphenols, while compounds such as histidine, tyrosine/tyrosol and 2-phenylethanol
contribute more importantly to the lager profile. Furthermore, it has been found that PCA
distinction of some beers could be improved by correcting for signals shifts, caused by
variations in pH, concentration and/or temperature. Such correction was attempted here by
increasing the line-broadening factor used to process the spectra. However, this approach
has the disadvantage that valuable information is lost due to the reduction of spectral
resolution. Methods of spectral alignment that do not change the resolution should
therefore be more convenient. PCA of the FTIR spectra has separated the beers analysed
with basis on differences in their alcoholic content and carbohydrate composition, giving
little information on the identity of specific components, other than ethanol, contributing to
the observed clustering of samples. Canonical Correlation Analysis of NMR and FTIR
spectra has produced high correlation coefficients between the two domains, identifying
the spectral features varying in the same direction. In particular, the variations in the NMR
signals of different carbohydrates (glucose, maltose, dextrins) and organic acids (acetate,
succinic acid) have been found to correlate to specific variations in the FTIR spectra.
References
Al-Jowder, Osama; Kemsley, E.K.; Wilson, R.H. Detection of adulteration in cooked meat products by mid- infrared spectroscopy. Journal of Agricultural and Food Chemistry 2002, 50, 1325-1329. Barros, A.S. Contribution à la sélection et la comparaison de variables caractéristiques. Ph.D. Thesis, Institut National Agronomique Paris-Grignon, France, 1999. Belton, P.S.; Colquhoun, I.J.; Kemsley, E.K.; Delgadillo, I.; Roma, P.; Dennis, M.J.; Sharman, M.; Holmes, E.; Nicholson, J.; Spraul, M. Application of chemometric s to the 1H NMR spectra of apple juices: discrimination between apple varieties. Food Chemistry 1998, 61, 207-213. Brescia, M.A.; Caldarola, V.; De Giglio, A.; Benedetti, D.; Fanizzi, F.P.; Sacco, A. Characterization of the geographical origin of Italian red wines based on traditional and nuclear magnetic resonance spectrometric determinations. Analytica Chimica Acta 2002, 458, 177-186.

Multivariate Analysis of NMR and FTIR of Beer as a Potential Tool for Beer Quality Control
267
Briandet, R.; Kemsley, E.K.; Wilson, R.H. Discrimination of Arabica and Robusta in instant coffee by Fourier transform infrared spectroscopy and chemometrics. Journal of Agricultural and Food Chemistry 1996, 44, 170-174. Charlton, A.J.; Farrington, W.H.H.; Brereton, P. Application of 1H NMR and multivariate statistics for screening complex mixtures: quality control and authenticity of instant coffee. Journal of Agricultural and Food Chemistry 2002, 50, 3098-3103. Defernez, M.; Wilson, R.H. Mid-infrared spectroscopy and chemometrics for determining the type of fruit used in jam. Journal of the Science of Food and Agriculture 1995, 67, 461-467. Downey, G.; Briandet, R.; Wilson, R.H.; Kemsley, E.K. Near- and mid- infrared spectroscopies in food authentication: coffee varietal identification. Journal of Agricultural and Food Chemistry 1997, 45, 4357-4361. Edelmann, A.; Diewok, J.; Schuster, K.C.; Lendl, B. Rapid method of discrimination of red wine cultivars based on mid- infrared spectroscopy of phenolic wine extracts. Journal of Agricultural and Food Chemistry 2001, 49, 1139-1145. Forveille, L.; Vercauteren, J.; Rutledge, D.N. Multivariate statistical analysis of two-dimensional NMR data to differentiate grapevine cultivars and clones. Food Chemistry 1996, 57, 441-450. Holland, J.K.; Kemsley, E.K.; Wilson, R.H. Use of Fourier transform infrared spectroscopy and partial least squares regression for the detection of adulteration of strawberry purees. Journal of the Science of Food and Agriculture 1998, 76, 263-269. Kemsley, E.K.; Holland, J.K.; Defernez, M.; Wilson, R.H. Detection of adulteration of raspberry purees using infrared spectroscopy and chemometrics. Journal of Agricultural and Food Chemistry 1996, 44, 3864-3870. Le Gall, G., Puaud, M., Colquhoun, I.J. Discrimination between orange juice and pulp wash by 1H nuclear magnetic resonance spectroscopy: Identification of marker compounds. Journal of Agricultural and Food Chemistry 2001, 49, 580-588. Lindon, J.C.; Nicholson, J.K.; Holmes, E.; Everett, J.R. Metabonomics: metabolic processes studied by NMR spectroscopy of biofluids. Concepts in Magnetic Resonance 2000, 12, 289-320. Lindon, J.C.; Holmes, E.; Nicholson, J.K. Pattern recognition methods and applications in biomedical magnetic resonance. Progress in Nuclear Magnetic Resonance Spectroscopy 2001, 39, 1-40. Pravdova, A.; Walczak, B.; Massart, D.L. A comparison of two algorithms for mapping of analytical signals. Analytica Chimica Acta 2002, 456, 77-92.

Chapter IX
268
Sacchi, R.; Mannina, L.; Fiordiponti, P.; Barone, P.; Paolillo, L.; Patumi, M.; Segre, A.L. Characterization of Italian extra virgin olive oils using 1H-NMR spectroscopy. Journal of Agricultural and Food Chemistry 1998, 46, 3947-3951. Twomey, M.; Downey, G.; McNulty, P.B. The potential of NIR spectroscopy for the detection of the adulteration of orange juice. Journal of the Science of Food and Agriculture 1995, 67, 77-84. Vogels, J.T.W.E.; Tas, A.C.; Van der Berg, F.; Van der Greef, J. A new method for classification of wines based on proton and carbon-13 NMR spectroscopy in combination with pattern recognition techniques. Chemometrics and Intelligent Laboratory Systems 1993, 21, 149-258. Vogels, J.T.W.E.; Terwel, L.; Tas, A.C.; Van den Berg, F.; Dukel, F.; Van der Greef, J. Detection of adulteration in orange juices by a new screening method using proton NMR spectroscopy in combination with pattern recognition techniques. Journal of Agricultural and Food Chemistry 1996, 44, 175-180.

X. FINAL CONCLUSIONS AND FUTURE WORK

Final Conclusions and Future Work
270
X. Final Conclusions and Future Work
The potential of high resolution NMR to study the composition and biochemistry of
fruits and, in particular, of mango fruit (Mangifera indica L.) has been explored in a large
part of this thesis. High-field solution state NMR revealed a great richness and complexity
of information about the juice composition, requiring minimum sample preparation and
allowing its direct and non- invasive analysis, thus avoiding laborious and time-consuming
procedures usually required by traditional chromatographic methods. With the aid of 2D
NMR experiments, about 50 compounds, present in a wide range of concentrations, could
be identified out of more than 65 spin systems observed. Such information was very
valuable for studying the ripening process of mango fruit, since the compositional
variations of many components could be followed simultaneously through qualitative and
quantitative changes in the spectra registered for twelve stages of a 23 days storage period.
In agreement with the literature, sucrose, fructose and glucose were identified as
the major sugars in mango. Their amounts in the juice (cv. Tommy Atkins), estimated with
basis on integration of the 1D 1H spectra, were found to vary significantly upon ripening.
In particular, the sucrose content increased almost 5 times to values above 140 g/L in the
ripe juice, becoming the most abundant sugar after day 5; fructose which predominated in
the unripe juice, showed an increasing trend at the beginning of ripening but then
decreased back to initial values (~40 g/L); glucose registered a significant decrease from
20 to 2-3 g/L, constituting only about 2% of the total sugars in the ripe juice. Besides these
sugars, the spectra showed the contribution of much less abundant carbohydrates,
tentatively assigned to fucose, xylose, arabinose and/or galactose, myo-inositiol, and pectic
constituents, namely rhamnose and galacturonic acid, which were seen to increase in the
juice during ripening, in relation to pectin hydrolysis. The major organic acids were found
to be citric, malic, succinic, quinic and shikimic. To our knowledge, this is the first time
that quinic and shikimic acids are reported to be present in mango juice. Lactic, propionic,
3-hydroxybutyric, formic, fumaric and gallic acids were also detected in small amounts. In
what regards the variation of the major acids upon ripening, citric acid showed a
substantial decrease (from ~14 to ~2 g/L), whereas malic acid decreased until mid-stages
but then increased back to values ~1.6 g/L, and shikimic acid registered a decrease from
~1.8 to ~1.1 g/L. As in previous reports, alanine was the most abundant amino acid
identified, although many others were detected, namely valine, leucine, isoleucine,

Chapter X
271
arginine, ?-aminobutyric acid (GABA), asparagine, aspartic acid, glutamine, glutamic acid,
threonine, tyrosine and phenylalanine. These amino acids showed different variation
patterns upon ripening. In particular, alanine, valine, isoleucine, and GABA were seen to
increase, showing concentrations of the order of tens to hundreds of milligrams per litre,
whereas arginine (initial cc. 700-800 mg/L), tyrosine and phenylalanine (initial cc. 32-33
mg/L) decreased to undetectable amounts in the first 5-9 days of ripening. The decrease of
the aromatic amino acids, as well as of shikimic acid, has been related to the formation of
polyphenolic compounds, noted in the aromatic region of the spectra by the appearance
and increase of two broad resonances. Interestingly, in a different batch of mangoes (cv.
Haden, Venezuela), these signals were not observed, neither were decreases in the levels of
tyrosine and phenylalanine, supporting the possibility that the polymerisation of phenolic
compounds may indeed involve the aromatic amino acids. Tommy Atkins and Haden
batches from Venezuela and Brazil were also found to differ in the relative abundances of
other amino acids and some organic acids, showing the influence of both cultivar and
geographical origin on mango composition. Other minor components identified in mango
juice include lipids (possibly saturated fatty acids), niacin, and compounds with uridine
and adenosine systems, which were seen to increase during ripening. As these compounds
are usually involved in energy transfer processes and in the activation of molecules for
synthesis reactions, their detection may potentially open new insights toward metabolic
studies.
The direct and non- invasive study of intact mango pulp has also been carried out in
this work, by means of techniques derived from solid state NMR spectroscopy. The high
molecular mobility characterising the fruit pulp significantly reduces the anisotropic
interactions responsible for line broadening in the spectra of solids. Thus, by spinning the
sample at the magic angle (MAS) using low rates (~1 KHz), the spectral resolution was
significantly improved, allowing for the most abundant components (sugars) to be
detected. The use of a HR-MAS probe enabled a further resolution enhancement of six-
fold compared to standard MAS, and the resulting spectra showed a richness of
information similar to that obtained for the juice. The significant resolution improvement
achieved allowed standard 2D NMR experiments to be carried out, thus enabling the
detailed study of the intact fruit composition. Compared to the juice, the pulp was found to

Final Conclusions and Future Work
272
be richer in lipids, polyphenols and pectins, showing that the composition of the liquid
phase is not fully representative of the composition of the whole fruit as usually assumed.
In the future, this work may be extended to a more thorough investigation of the changes
undergone by those particular families of compounds in the intact fruit, thus avoiding
separation methods that may cause losses and/or interfere with the fruit biochemistry.
Moreover, further studies focused on the effect of special postharvest treatments and
different storage conditions on the composition and biochemistry of mango fruit, by means
of both solution and solid state high resolution NMR, may help finding ways of improving
the shelf life and edible quality of mango products.
High resolution 1H NMR also showed promising results in the detection of
indicators of mango juice spoilage, caused either by natural degradation or after deliberate
contamination with specific moulds. Non-treated natural mango juice was seen to
significantly change its composition during storage at 25ºC, reflecting chemical, enzymatic
and/or microbial processes. Most of these alterations could be prevented by heating the
juice (80ºC, 15 min) prior to storage, although some aromatic components were found to
be more prone to resist pasteurisation. Inoculation with Penicillium expansum caused
drastic changes in the composition of both natural and commercial juices. Besides the
utilization of the main sugars and the formation of typical fermentation products (namely
acetate, lactic acid, acetoin and isopropanol in natural juice, and ethanol, propionic acid
and isopropanol in commercial juice), changes in many other components have been
viewed by NMR, namely involving amino acids, minor carbohydrates (possibly
oligosaccharides) and aromatic compounds (many of which could not be identified at this
stage). The heat-resistant mould Neosartorya fischeri caused less extensive changes in the
composition of commercial juice, affecting mainly fatty acids, amino acids, sugars, and
some unidentified minor compounds. In all the cases studied (except for natural spoilage),
NMR was able to detect alterations in the composition of contaminated juices much earlier
than changes in colour, pH or soluble solids content were noticed. This result, along with
the ability to allow for structural characterisation of novel, unexpected compounds
enlightening specific aspects of fruit biosynthesis, shows the potential usefulness of NMR
in the area of food microbiological control. Further investigation of specific indicators of
microbial growth, by means of improved assignment strategies (multidimensional and

Chapter X
273
hyphenated NMR) and by the application of multivariate statistics, may help advancing in
that direction.
The application of high resolution NMR to other food samples, namely to beer and
grape juice, also proved to be very valuable for studying their chemical composition,
knowledge which may aid, not only in the development of novel quality control methods,
but also in the full evaluation of foods as important sources of new natural compounds
with varied possible uses. Beer was found to contain a complex mixture of nutrients, which
were identified to some extent by 1D and 2D NMR methods. In particular, about 30
components were detected, including several organic acids (citric, malic, pyruvic, succinic,
lactic, formic), amino acids (proline, alanine, isoleucine, GABA, tyrosine, phenylalanine,
histidine, tryptophane), alcohols (ethanol, propanol, isobutanol, isopentanol), fatty acids,
polyphenols and nucleosides (cytidine, uridine, adenosine/inosine). Dextrins gave rise to
the most intense signals in the beer spectrum, but the strong spectral overlap hindered their
structural characterisation, calling for improved analytical methods. The NMR analysis of
grape juice enabled the identification of about 25 components, including the major sugars
glucose and fructose, organic acids (e.g. malic, tartaric, succinic) and amino acids (e.g.
alanine, threonine, arginine, proline). In this case, the major assignment difficulties
concerned aromatic compounds showing incomplete spin systems of ambiguous
identification.
In order to overcome the assignment difficultie s associated with the direct NMR
analysis of such complex mixtures, hyphenated NMR methods (HPLC-NMR and HPLC-
NMR/MS) have been employed. When applied to mango juice, this analysis enabled some
advances in the characterisation of the pectic fraction, although further structural studies
should be carried out, namely through the optimisation of MS acquisition in order to obtain
molecular weight information. The rapid screening of the effects of spoilage and microbial
contamination on the juice composition was also achieved by HPLC-NMR, confirming the
results obtained by high resolution NMR. The HPLC-NMR/MS analysis of beer enabled
the rapid and successful identification of dextrins with degrees of polymerisation (DP) of
up to nine monomers by the direct analys is of samples, degassing being the only sample
treatment required. Although the presence or absence of ? (1-6) branching points in each
sub-fraction could be indicated by NMR, unambiguous assignment of high DP dextrins in

Final Conclusions and Future Work
274
terms of their structure (linear or branched) could not be achieved, requiring further
improvement of the chromatographic methods/conditions used, in tandem with NMR
multidimensional methods. Furthermore, HPLC-NMR/MS of beer helped confirming the
identity of some aromatic compounds already assigned by NMR alone, and revealing new
ones, such as the aromatic alcohols 2-phenylethanol, tyrosol (2-(4-hydroxyphenyl) ethanol)
and tryptophol (3- indolethanol). Samples of grape juice and wine (phenolic extract) have
also been investigated by HPLC-NMR/MS, aiming at characterising their complex
aromatic composition. This technique enabled the separation and identification of several
phenolic compounds which could not be unambiguously assigned by standard 1D and 2D
NMR. In particular, gallic acid and several cinnamic acids (e.g. p-coumaric, trans-coutaric
and trans-caftaric) were identified in grape juice, whereas the wine extract was found to
contain catechin, epicatechin, trans-resveratrol, tyrosol and caffeic acid.
The tandem use of chemometrics with NMR spectroscopy and also vibrational
spectroscopy has been explored in this thesis to accomplish two main goals. One was the
rapid quantification of sugars in mango juices at different ripening stages. For that purpose,
Partial Least Squares (PLS1) regression was applied to the 1H NMR spectra and to the
FTIR-ATR spectra of juices, using a triangular model of standard sugar solutions for the
calibration. Compared to enzymatic determinations of sugars (used as reference), the PLS-
FTIR method showed good predictive ability, except for glucose at later ripening stages,
probably because its concentration decreased below the lower limit of the concentration
range used in the calibration model. These results enabled a correlation with fruit ripening
stage to be established, which may be particularly useful to detect over-ripening in fresh
fruits, a period when other indicators (pH and soluble solids) do not change significantly or
when, in the case of commercial juices, they are affected by other factors e.g. addition of
pH regulators or sweeteners. In addition, this knowledge may help predicting fruit stability
to transport and/or storage. The prediction errors obtained by PLS of the NMR spectra
were much higher. It was found that spectral alignment was determinant in the magnitude
of these errors and that increasing the line broadening factor used to process the spectra
could mask the shifts and improve the predictive ability of the calibration model. Still, the
results were far from optimum and this matter requires further investigation. Another
challenging task for the future may be the development of PLS-NMR models for
Chapter X
275
measuring compounds that are particularly difficult to quantify by integration of the 1D
NMR spectrum, namely those showing signals with high degree of overlap and weak
intensities. A second purpose of using chemometrics for analysing spectroscopic data
consisted of investigating the variability present in the NMR and FTIR spectra of a group
of fifty beers by using Principal Components Analysis (PCA). PCA of NMR data
originated the separation of beers mainly according to their carbohydrate composition,
although minor components (aromatic compounds in particular) were also found to
contribute for the distinction of beers, namely in terms of the types ale and lager. PCA of
FTIR data separated beers with basis on differences in their alcoholic content and
carbohydrate composition, providing little information on the identity of specific
components, other than ethanol, contributing to the distinction of samples. Additionally,
canonical correlation analysis of NMR and FTIR data showed high correlations between
the two domains, enabling the identification of spectral features varying in the same
direction. These results open the possibility that tandem use of chemometrics with
spectroscopic data may be useful to provide rapid information about factors such as
geographical origin, processing conditions and reproducibility within different brewing
sites.

Final Conclusions and Future Work
276