Embed Size (px)
Citation preview
Q1 2020
Results
Investors
Presentation
Management Update | Results | Long Term Performance | Management OutlookQ1 2020
Disclaimer
| Investor Presentation
This presentation has been prepared solely for informational purposes. The presentation may contain forward looking statements, which reflect our beliefs or current expectations and assumptions regarding the future of the business, future plans and strategies, projections, anticipated events and trends, the economy and other future conditions. Forward looking statements are neither historical facts nor assurances of future performance and can generally be identified by terminology including "anticipate”, "aspire", "believe", "project", "estimate", "expect", "forecast", "strategy", "target", "trend", "future", "likely", "may", "should", "will", "intend", "plan", "goal", "objective", "seek", “roadmap”, and other words of similar meaning or similar expressions.
By their nature, forward looking information and statements are subject to known and unknown uncertainties, risks and changes incircumstances that are difficult to predict and not in our control. Our actual results of operations and financial conditions may differ materially from that or those indicated in the forward looking statements. You should not place undue reliance on any of these forward looking statements.
Any forward looking statement made by us in the presentation is based only on information currently available to us and speaks only as to the date on which this presentation is made. Past performance is not a reliable indication of future performance. We make no representations or warranties as to the accuracy, or completeness of the information and shall not have any liability for anyrepresentations, express or implied, regarding the information contained in, or for any omissions from, the information included in this presentation. We undertake no obligation to publicly update any forward looking statement whether as a result of new information, future developments or otherwise. The information contained in the presentation is prepared to assist prospective investors in making their own evaluation of the Company.
Cautionary Note Regarding Forward-Looking Statements
Management
Update
Management Update | Results | Long Term Performance | Management OutlookQ1 2020
| Investor Presentation
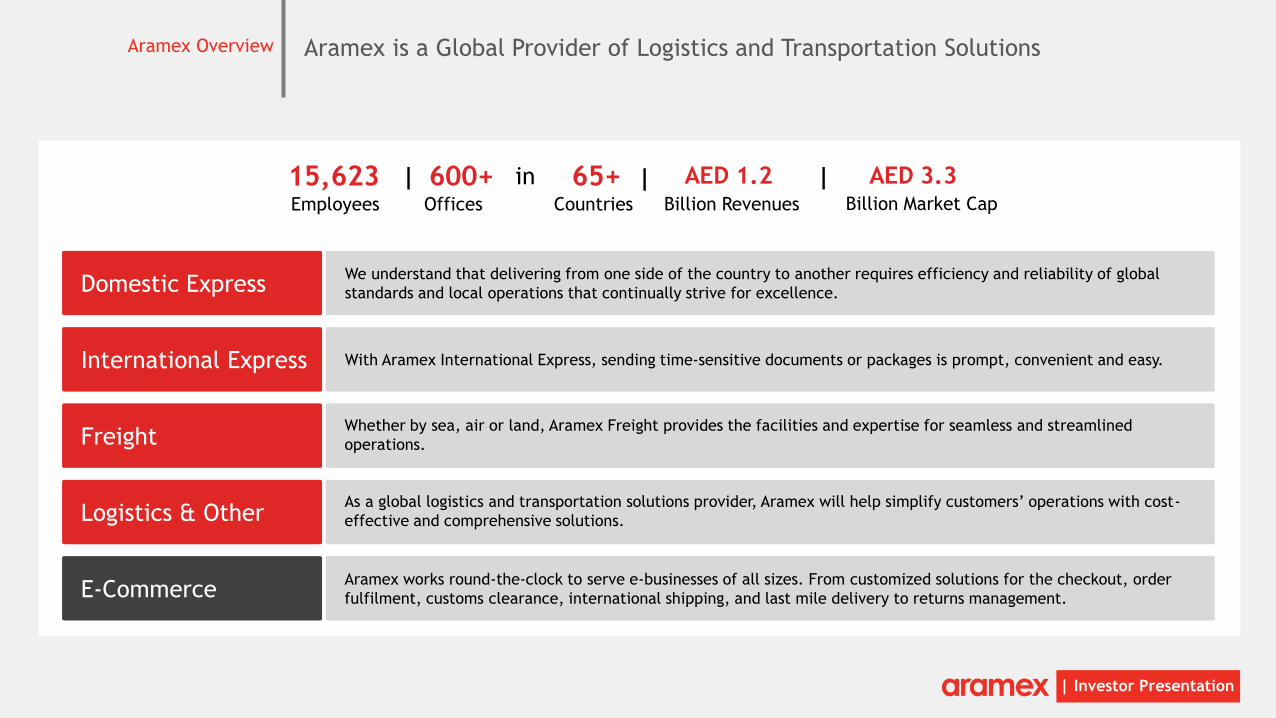
Aramex is a Global Provider of Logistics and Transportation SolutionsAramex Overview
We understand that delivering from one side of the country to another requires efficiency and reliability of global
standards and local operations that continually strive for excellence.Domestic Express
International Express With Aramex International Express, sending time-sensitive documents or packages is prompt, convenient and easy.
FreightWhether by sea, air or land, Aramex Freight provides the facilities and expertise for seamless and streamlined
operations.
Logistics & OtherAs a global logistics and transportation solutions provider, Aramex will help simplify customers’ operations with cost-
effective and comprehensive solutions.
E-CommerceAramex works round-the-clock to serve e-businesses of all sizes. From customized solutions for the checkout, order
fulfilment, customs clearance, international shipping, and last mile delivery to returns management.
Employees
15,623Offices Countries
600+ 65+Billion Revenues Billion Market Cap
| | |in AED 1.2 AED 3.3
| Investor Presentation
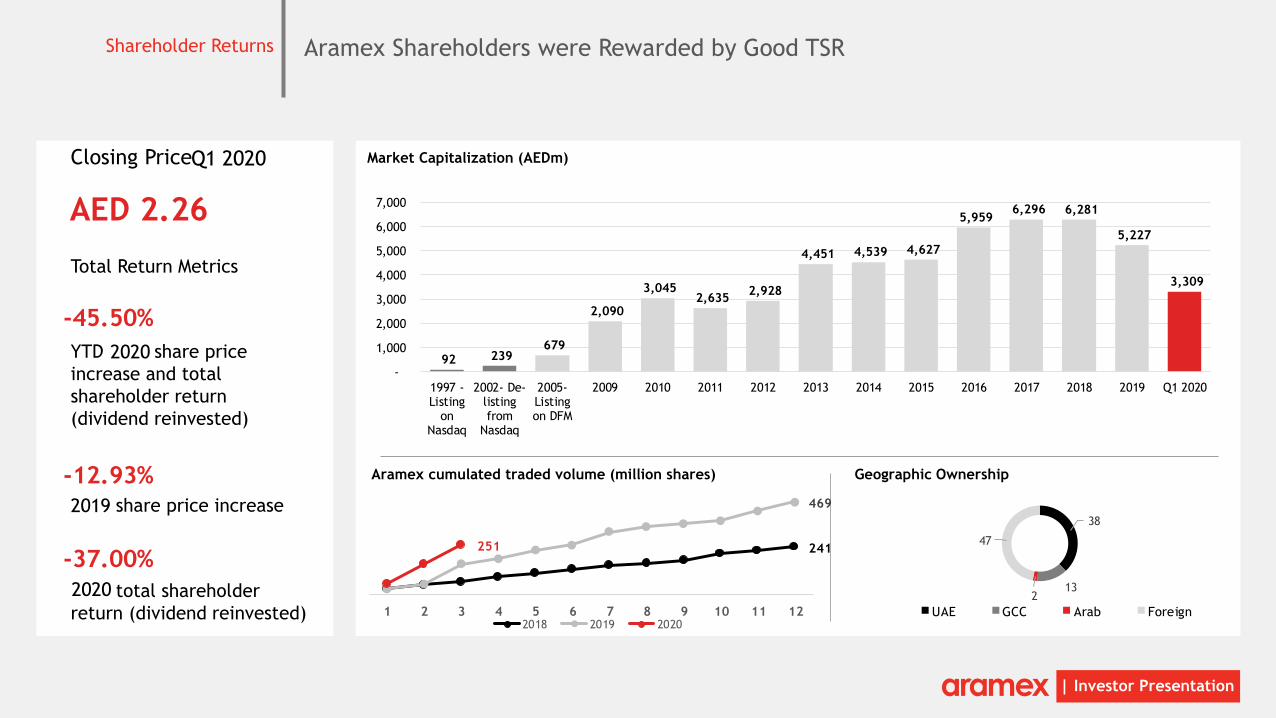
Aramex Shareholders were Rewarded by Good TSRShareholder Returns
Total Return Metrics
YTD share price
increase and total
shareholder return
(dividend reinvested)
share price increase
total shareholder
return (dividend reinvested)
92 239 679
2,090
3,045 2,635
2,928
4,451 4,539 4,627
5,959 6,296 6,281
5,227
3,309
-
1,000
2,000
3,000
4,000
5,000
6,000
7,000
1997 -Listing
onNasdaq
2002- De-listingfrom
Nasdaq
2005-Listingon DFM
2009 2010 2011 2012 2013 2014 2015 2016 2017 2018 2019 Q1 2020
38
132
47
UAE GCC Arab Foreign
AED 2.26
-45.50%
-12.93%
-37.00%
Aramex cumulated traded volume (million shares)
Market Capitalization (AEDm)
241
469
251
1 2 3 4 5 6 7 8 9 10 11 122018 2019 2020
Geographic Ownership
Q1 2020Closing Price
2019
2020
2020
| Investor Presentation
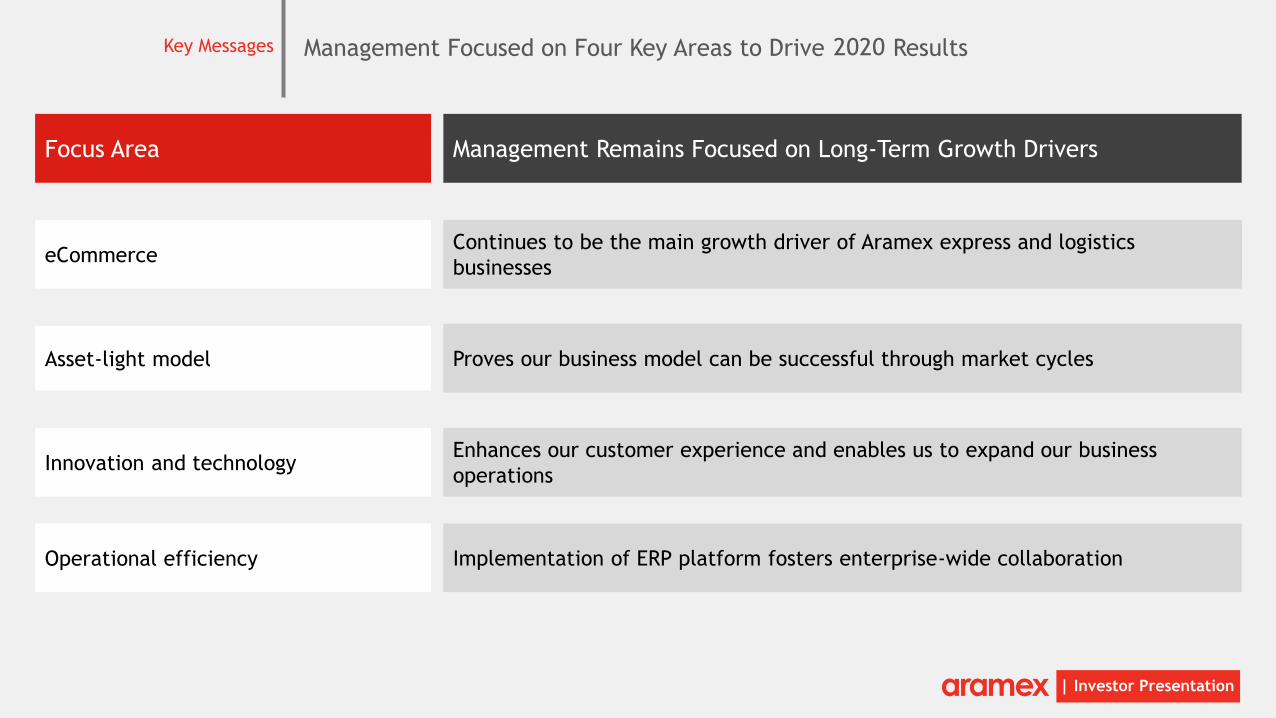
Management Focused on Four Key Areas to Drive ResultsKey Messages
eCommerce
Asset-light model
Innovation and technology
Operational efficiency
Continues to be the main growth driver of Aramex express and logistics
businesses
Management Remains Focused on Long-Term Growth DriversFocus Area
Proves our business model can be successful through market cycles
Enhances our customer experience and enables us to expand our business
operations
Implementation of ERP platform fosters enterprise-wide collaboration
2020
| Investor Presentation
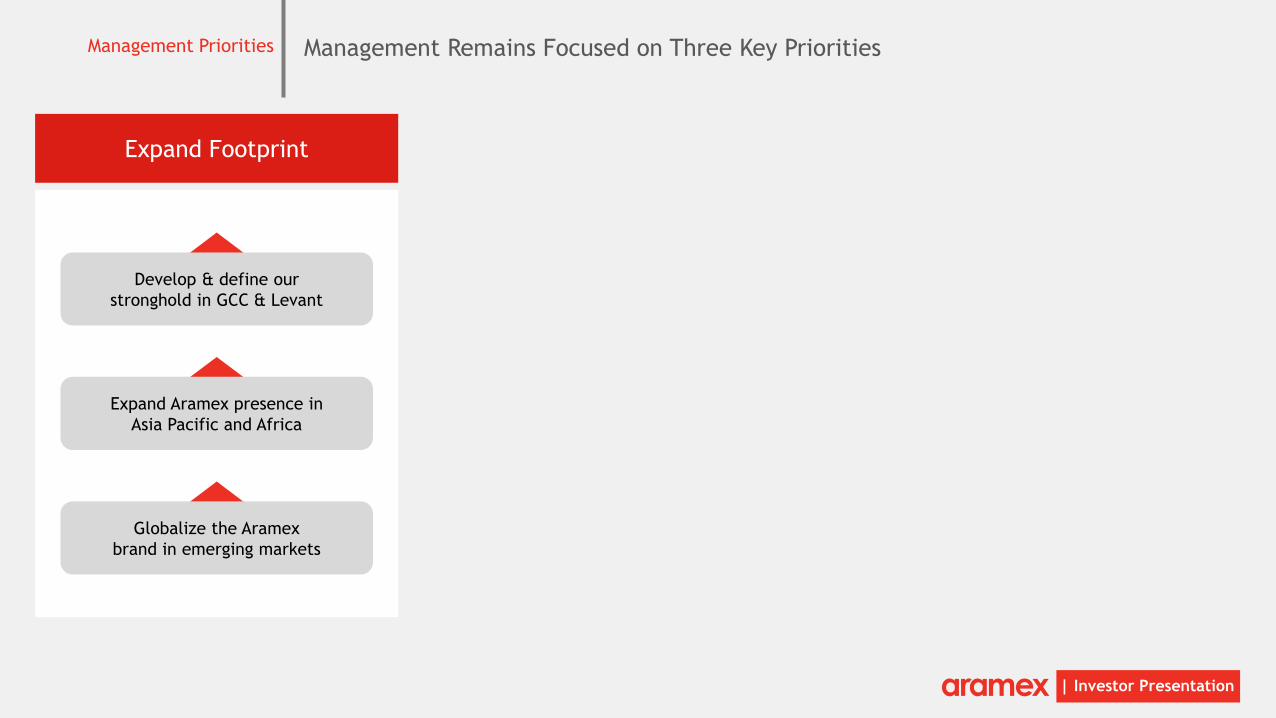
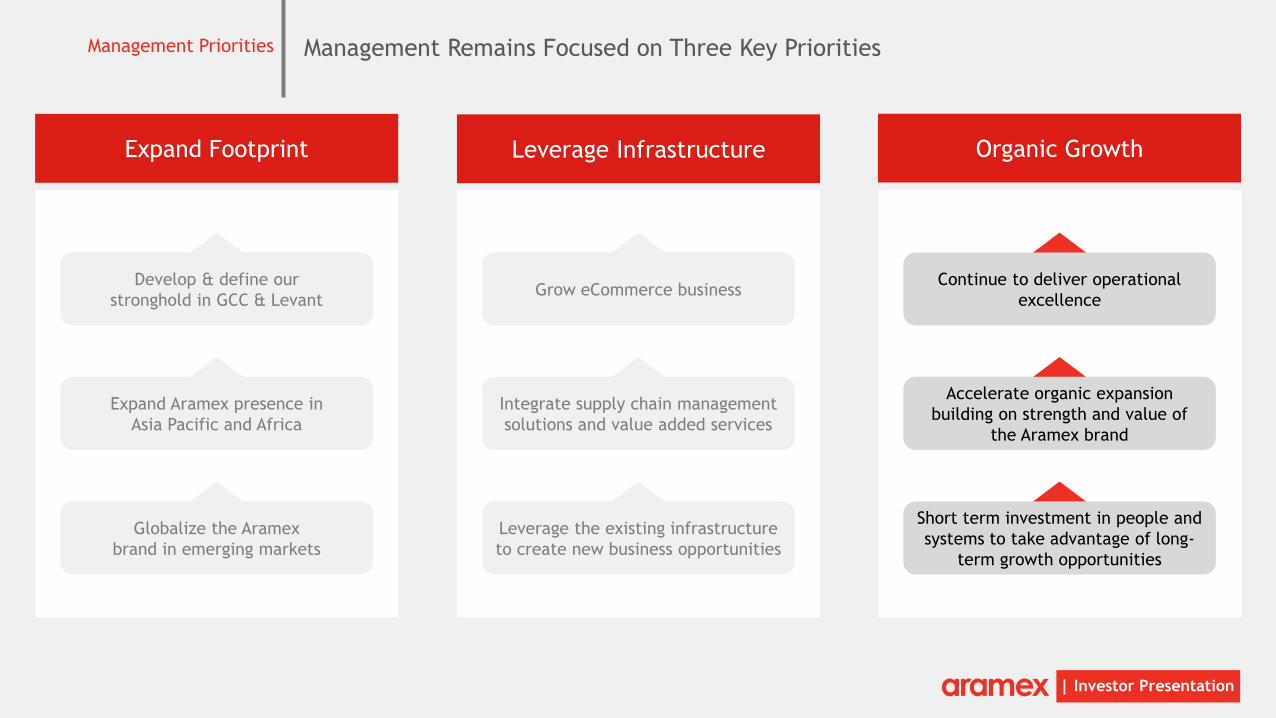
Management Remains Focused on Three Key PrioritiesManagement Priorities
Expand Footprint
Expand Aramex presence in
Asia Pacific and Africa
Develop & define our
stronghold in GCC & Levant
Globalize the Aramex
brand in emerging markets
| Investor Presentation
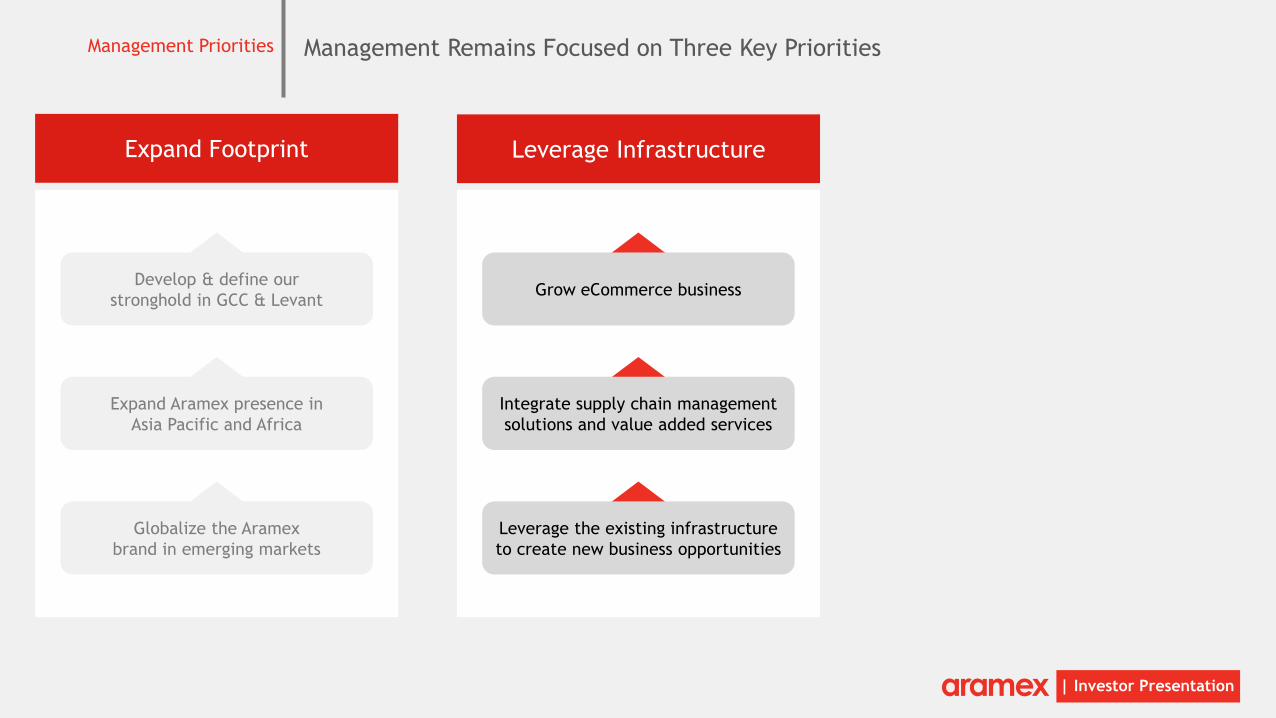
Management Remains Focused on Three Key PrioritiesManagement Priorities
Expand Footprint
Expand Aramex presence in
Asia Pacific and Africa
Develop & define our
stronghold in GCC & Levant
Globalize the Aramex
brand in emerging markets
Leverage Infrastructure
Integrate supply chain management
solutions and value added services
Grow eCommerce business
Leverage the existing infrastructure
to create new business opportunities
| Investor Presentation
Management Remains Focused on Three Key PrioritiesManagement Priorities
Expand Footprint
Expand Aramex presence in
Asia Pacific and Africa
Develop & define our
stronghold in GCC & Levant
Globalize the Aramex
brand in emerging markets
Leverage Infrastructure
Integrate supply chain management
solutions and value added services
Grow eCommerce business
Leverage the existing infrastructure
to create new business opportunities
Organic Growth
Accelerate organic expansion
building on strength and value of
the Aramex brand
Continue to deliver operational
excellence
Short term investment in people and
systems to take advantage of long-
term growth opportunities
Results
Q1 2020
Management Update | Results | Long Term Performance | Management OutlookQ1 2020
| Investor Presentation
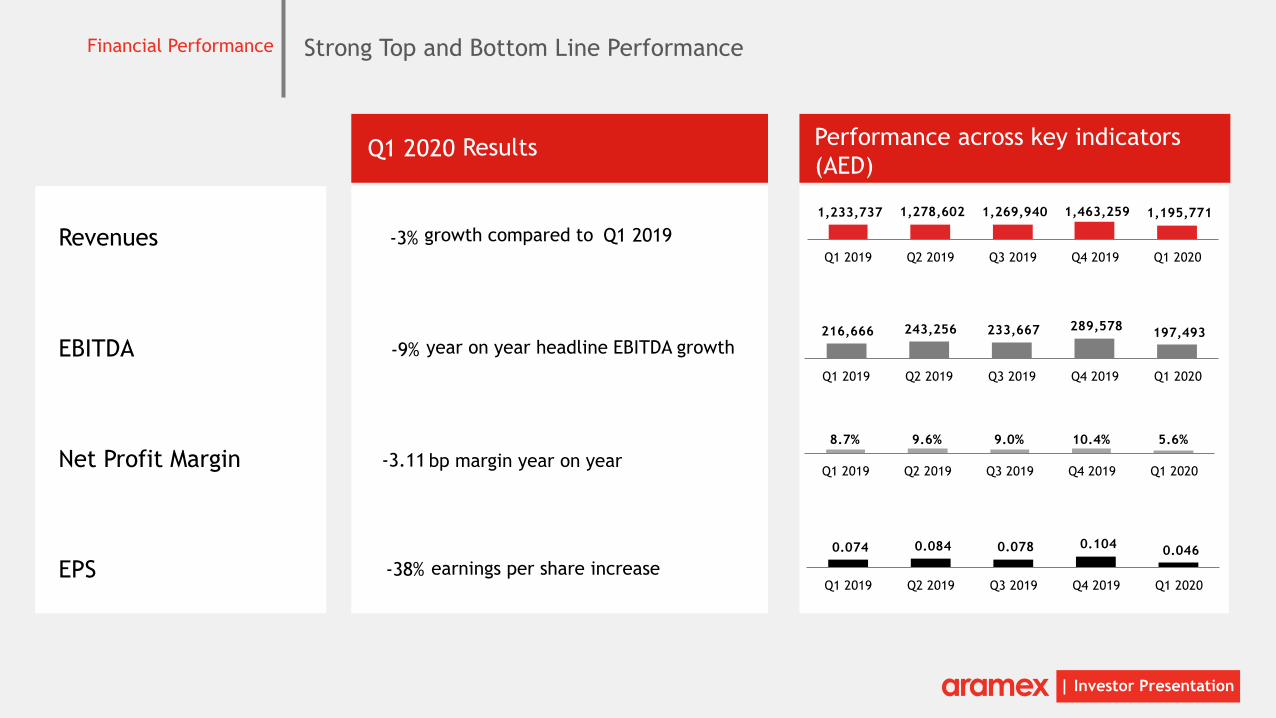
Strong Top and Bottom Line PerformanceFinancial Performance
ResultsQ1 2020
Revenues -3% growth compared to Q1 2019
1,233,737 1,278,602 1,269,940 1,463,259 1,195,771
Q1 2019 Q2 2019 Q3 2019 Q4 2019 Q1 2020
EBITDA -9% year on year headline EBITDA growth216,666 243,256 233,667 289,578
197,493
Q1 2019 Q2 2019 Q3 2019 Q4 2019 Q1 2020
Net Profit Margin -3.11 bp margin year on year
8.7% 9.6% 9.0% 10.4% 5.6%
Q1 2019 Q2 2019 Q3 2019 Q4 2019 Q1 2020
EPS0.074 0.084 0.078 0.104
0.046
Q1 2019 Q2 2019 Q3 2019 Q4 2019 Q1 2020earnings per share increase-38%
Performance across key indicators
(AED)
| Investor Presentation
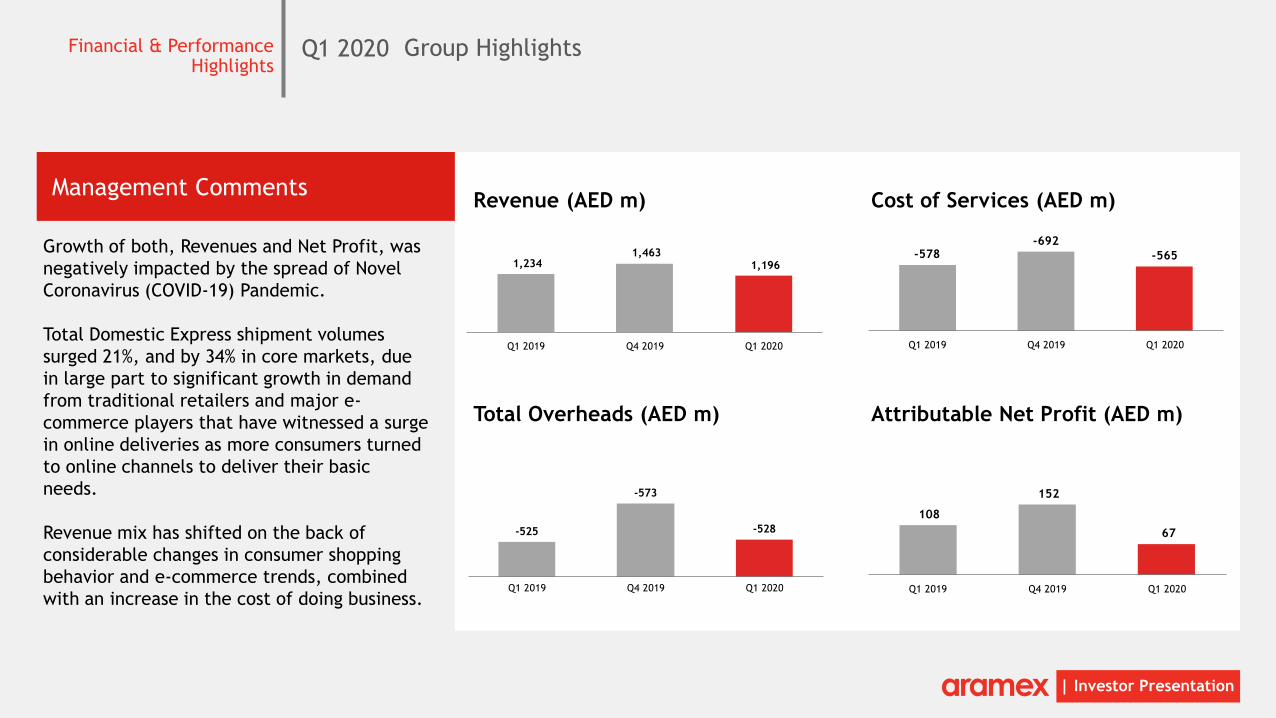
Group HighlightsFinancial & Performance Highlights
Growth of both, Revenues and Net Profit, was
negatively impacted by the spread of Novel
Coronavirus (COVID-19) Pandemic.
Total Domestic Express shipment volumes
surged 21%, and by 34% in core markets, due
in large part to significant growth in demand
from traditional retailers and major e-
commerce players that have witnessed a surge
in online deliveries as more consumers turned
to online channels to deliver their basic
needs.
Revenue mix has shifted on the back of
considerable changes in consumer shopping
behavior and e-commerce trends, combined
with an increase in the cost of doing business.
Revenue (AED m)
Total Overheads (AED m)
Cost of Services (AED m)
Attributable Net Profit (AED m)
-525
-573
-528
Q1 2019 Q4 2019 Q1 2020
-578-692
-565
Q1 2019 Q4 2019 Q1 2020
108
152
67
Q1 2019 Q4 2019 Q1 2020
1,234 1,463
1,196
Q1 2019 Q4 2019 Q1 2020
Q1 2020
Management Comments
| Investor Presentation
Financial HighlightsFinancial Performance & Highlights
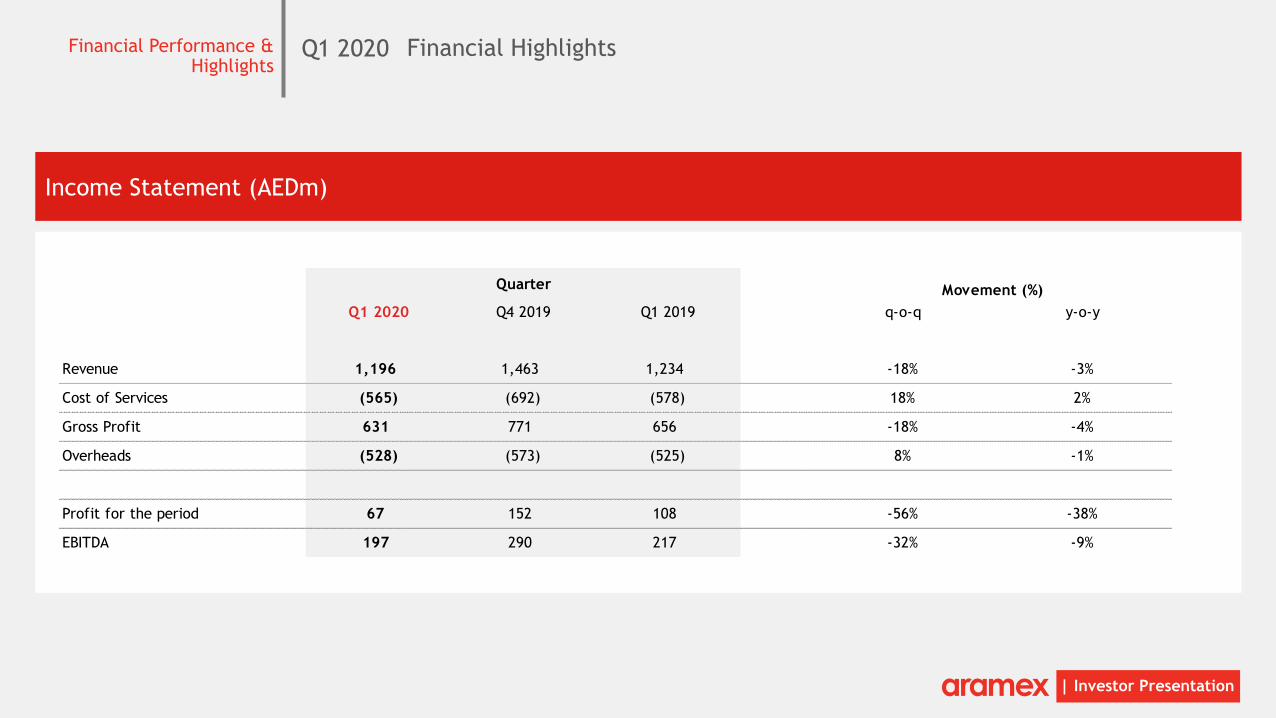
Income Statement (AEDm)
Q1 2020 Q4 2019 Q1 2019 q-o-q y-o-y
Revenue 1,196 1,463 1,234 -18% -3%
Cost of Services (565) (692) (578) 18% 2%
Gross Profit 631 771 656 -18% -4%
Overheads (528) (573) (525) 8% -1%
Profit for the period 67 152 108 -56% -38%
EBITDA 197 290 217 -32% -9%
Quarter Movement (%)
Q1 2020
| Investor Presentation
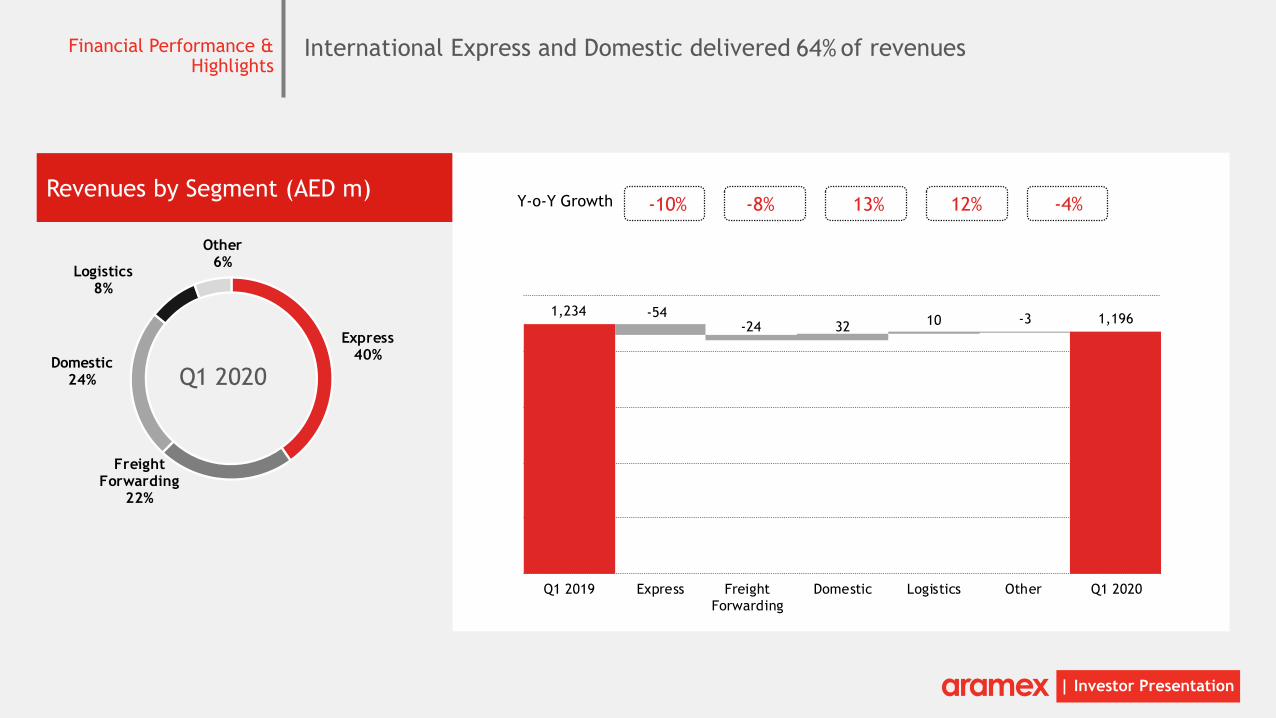
International Express and Domestic delivered of revenuesFinancial Performance & Highlights
Revenues by Segment (AED m)
Express40%
Freight Forwarding
22%
Domestic24%
Logistics8%
Other6%
Q1 2020
64%
Y-o-Y Growth -10% -8% 13% 12% -4%
1,234 -54-24 32 10 -3 1,196
Q1 2019 Express Freight
Forwarding
Domestic Logistics Other Q1 2020
| Investor Presentation
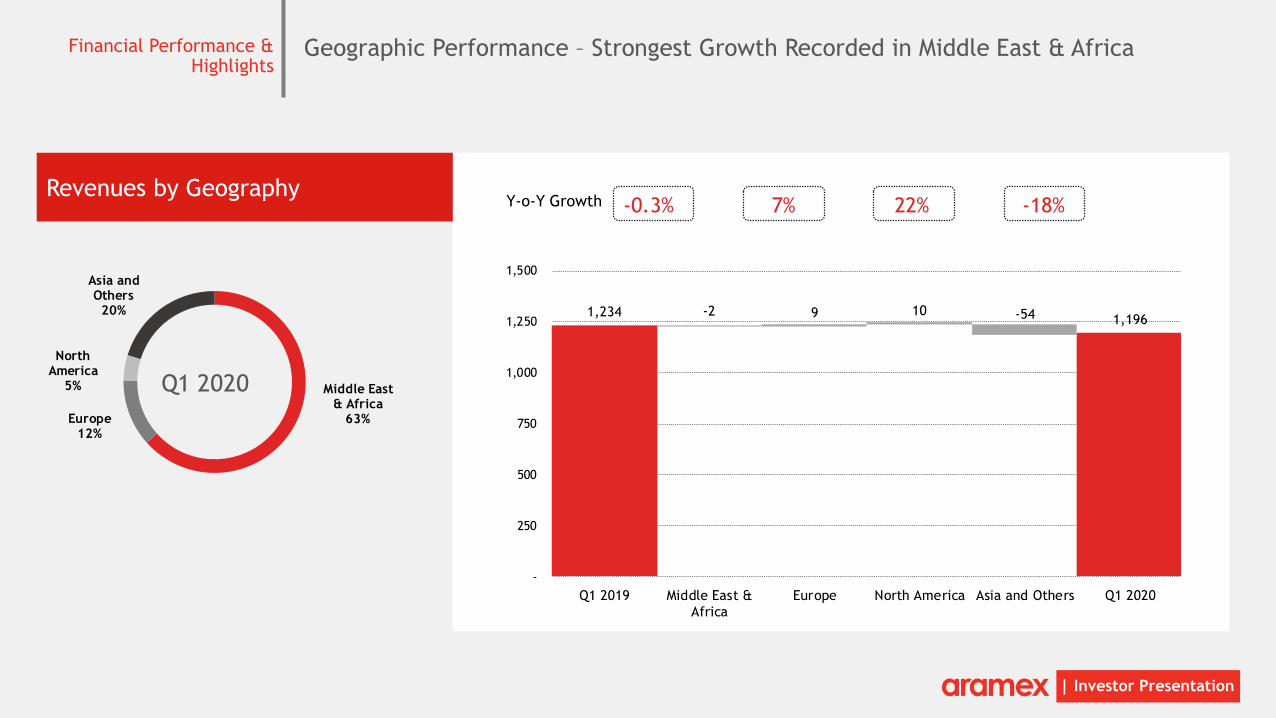
Geographic Performance – Strongest Growth Recorded in Middle East & AfricaFinancial Performance & Highlights
Revenues by Geography
1,234 -2 9 10 -54 1,196
-
250
500
750
1,000
1,250
1,500
Q1 2019 Middle East &
Africa
Europe North America Asia and Others Q1 2020
Middle East & Africa
63%Europe12%
North America
5%
Asia and Others
20%
Q1 2020
Y-o-Y Growth -0.3% 7% 22% -18%
| Investor Presentation
Financial HighlightsFinancial Performance & Highlights
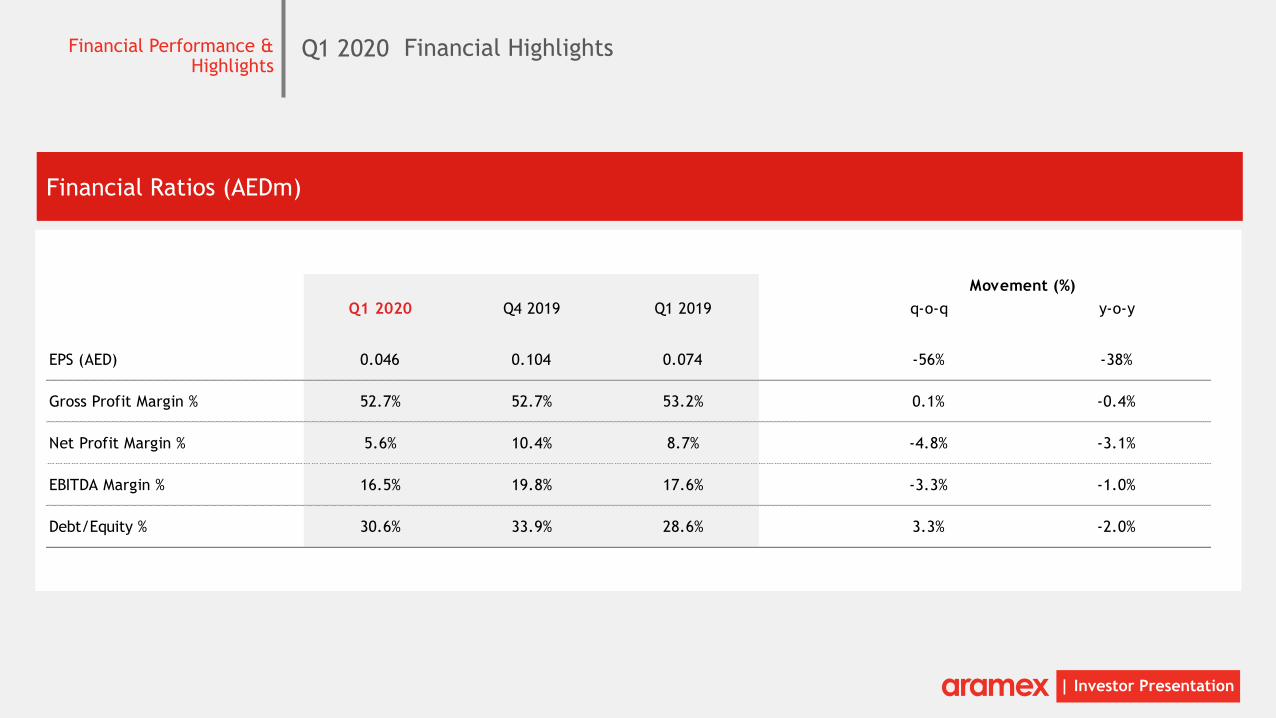
Financial Ratios (AEDm)
Q1 2020 Q4 2019 Q1 2019 q-o-q y-o-y
EPS (AED) 0.046 0.104 0.074 -56% -38%
Gross Profit Margin % 52.7% 52.7% 53.2% 0.1% -0.4%
Net Profit Margin % 5.6% 10.4% 8.7% -4.8% -3.1%
EBITDA Margin % 16.5% 19.8% 17.6% -3.3% -1.0%
Debt/Equity % 30.6% 33.9% 28.6% 3.3% -2.0%
Movement (%)
Q1 2020
| Investor Presentation
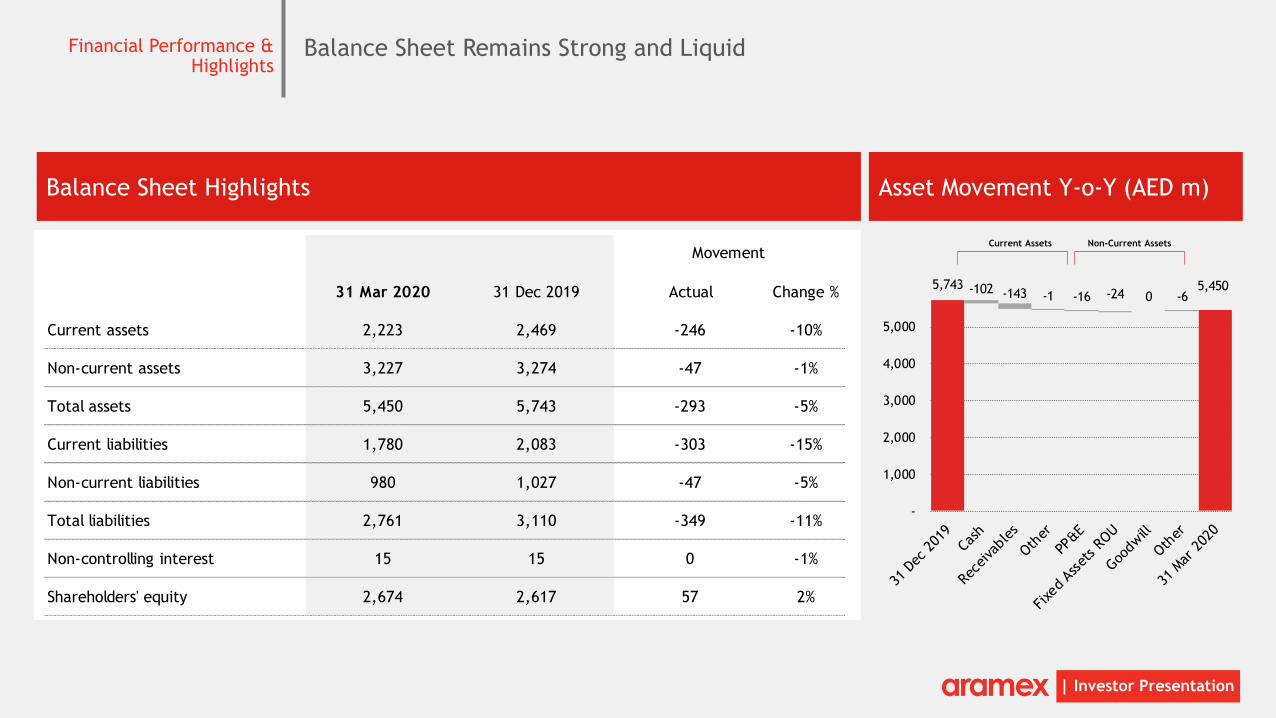
Balance Sheet Remains Strong and LiquidFinancial Performance & Highlights
Balance Sheet Highlights Asset Movement Y-o-Y (AED m)
31 Mar 2020 31 Dec 2019 Actual Change %
Current assets 2,223 2,469 -246 -10%
Non-current assets 3,227 3,274 -47 -1%
Total assets 5,450 5,743 -293 -5%
Current liabilities 1,780 2,083 -303 -15%
Non-current liabilities 980 1,027 -47 -5%
Total liabilities 2,761 3,110 -349 -11%
Non-controlling interest 15 15 0 -1%
Shareholders' equity 2,674 2,617 57 2%
Movement
5,743 -102 -143 -1 -16 -24 0 -65,450
-
1,000
2,000
3,000
4,000
5,000
Current Assets Non-Current Assets
| Investor Presentation
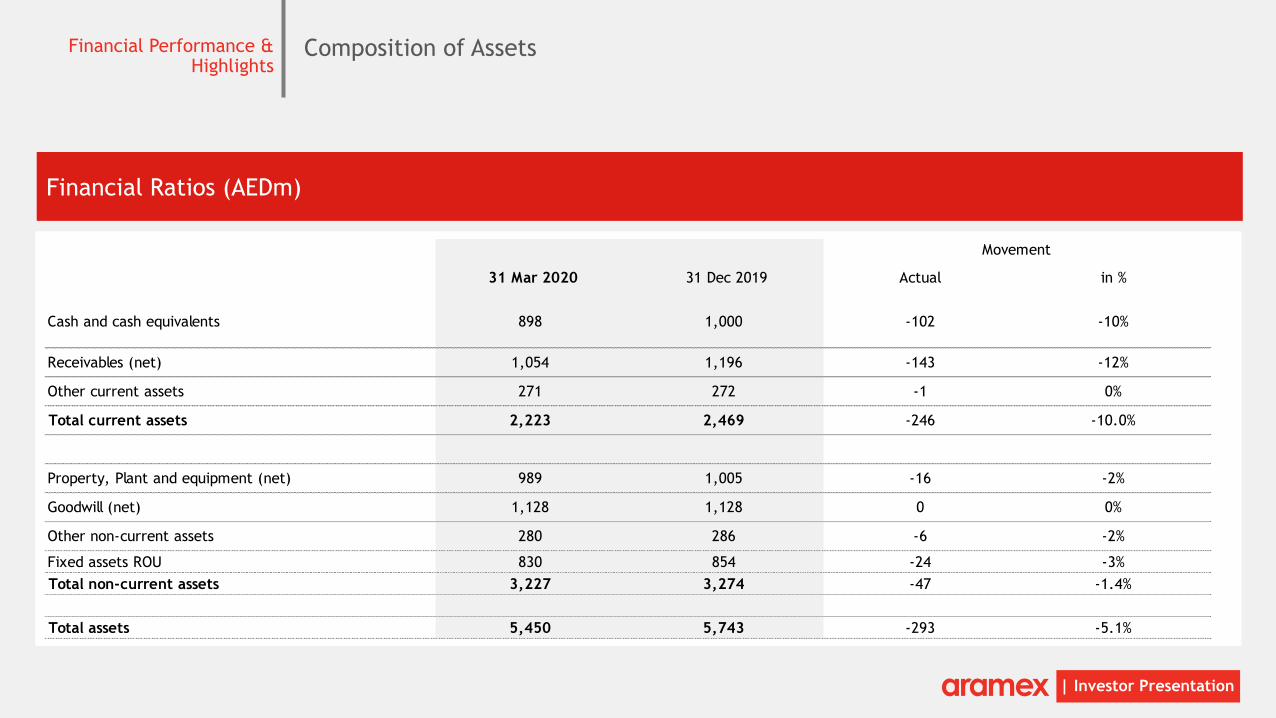
Composition of AssetsFinancial Performance & Highlights
Financial Ratios (AEDm)
31 Mar 2020 31 Dec 2019 Actual in %
Cash and cash equivalents 898 1,000 -102 -10%
Receivables (net) 1,054 1,196 -143 -12%
Other current assets 271 272 -1 0%
Total current assets 2,223 2,469 -246 -10.0%
Property, Plant and equipment (net) 989 1,005 -16 -2%
Goodwill (net) 1,128 1,128 0 0%
Other non-current assets 280 286 -6 -2%
Fixed assets ROU 830 854 -24 -3%
Total non-current assets 3,227 3,274 -47 -1.4%
Total assets 5,450 5,743 -293 -5.1%
Movement
Long Term
Performance
Management Update | Results | Long Term Performance | Management OutlookQ1 2020
| Investor Presentation
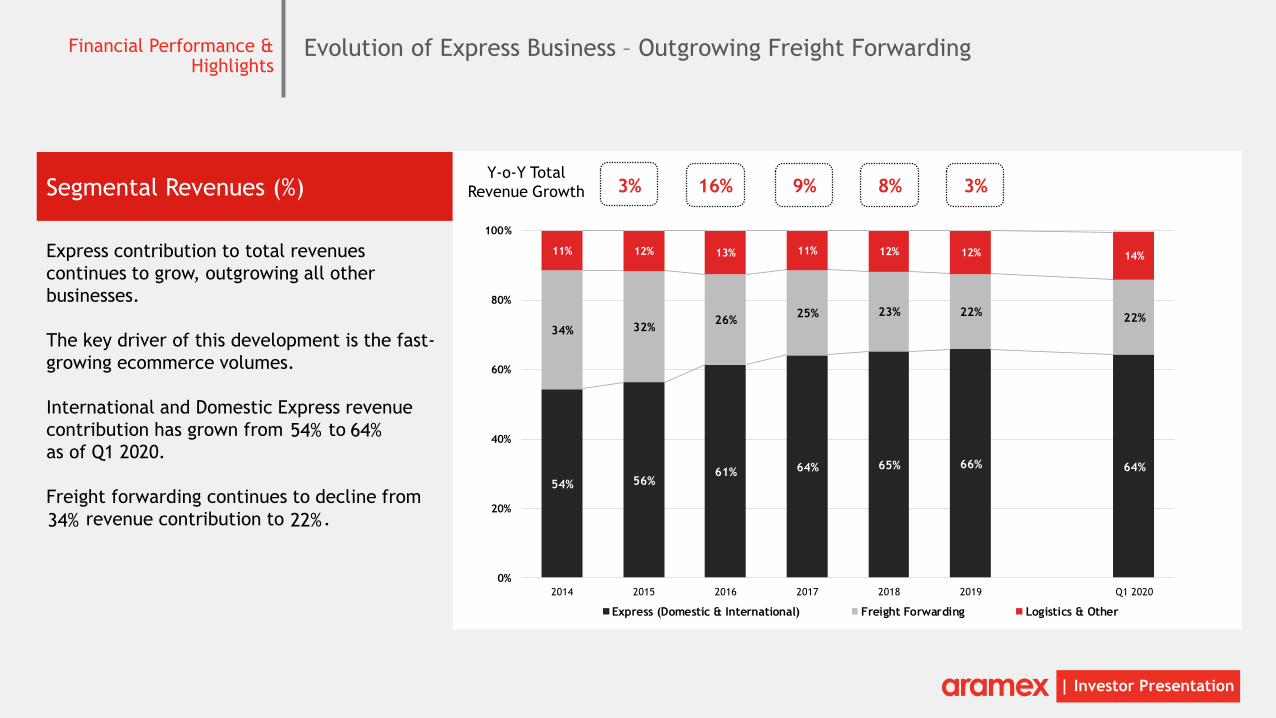
Evolution of Express Business – Outgrowing Freight ForwardingFinancial Performance & Highlights
Segmental Revenues (%)
Express contribution to total revenues
continues to grow, outgrowing all other
businesses.
The key driver of this development is the fast-
growing ecommerce volumes.
International and Domestic Express revenue
contribution has grown from to
as of Q1 2020.
Freight forwarding continues to decline from
revenue contribution to .
Y-o-Y Total
Revenue Growth
54% 56%61% 64% 65% 66% 64%
34% 32%26%
25% 23% 22%22%
11% 12% 13% 11% 12% 12% 14%
0%
20%
40%
60%
80%
100%
2014 2015 2016 2017 2018 2019 Q1 2020
Express (Domestic & International) Freight Forwarding Logistics & Other
3% 16% 9% 8% 3%
54%
34% 22%
64%
| Investor Presentation
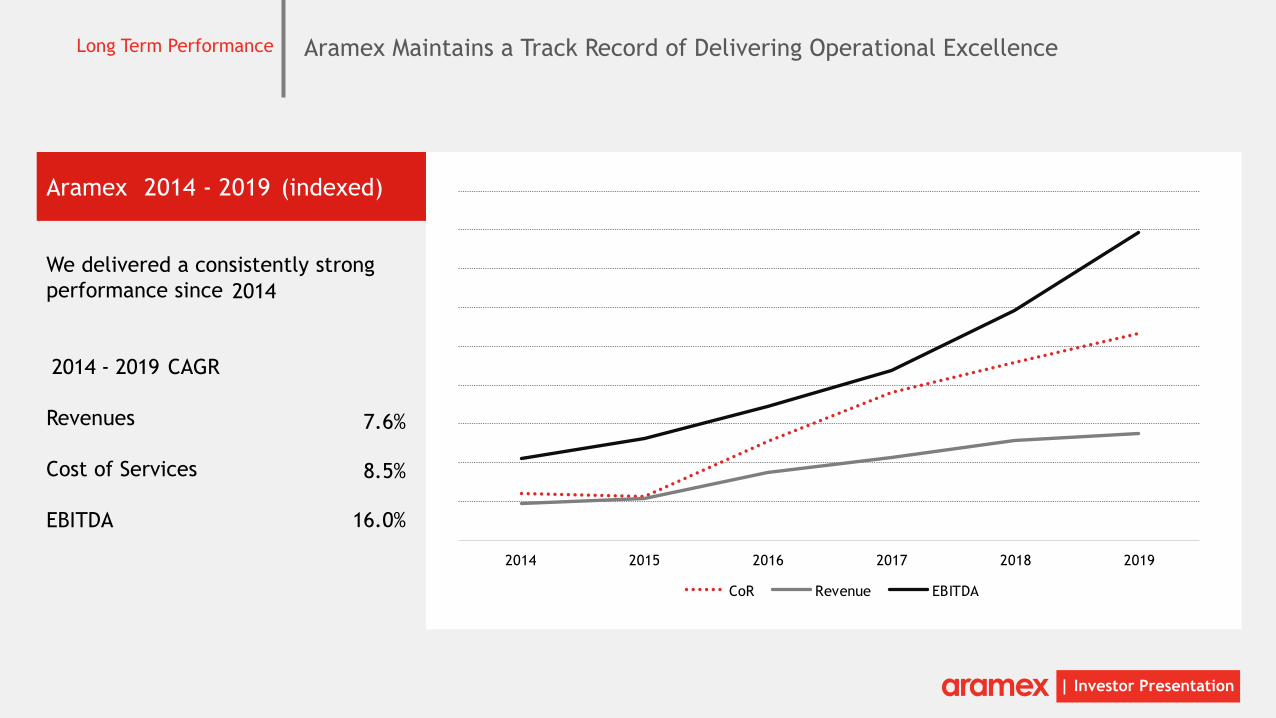
Aramex Maintains a Track Record of Delivering Operational ExcellenceLong Term Performance
Aramex (indexed)
We delivered a consistently strong
performance since
CAGR
Revenues
Cost of Services
EBITDA
7.6%
16.0%
8.5%
2014 - 2019
2014 - 2019
2014
2014 2015 2016 2017 2018 2019
CoR Revenue EBITDA
| Investor Presentation
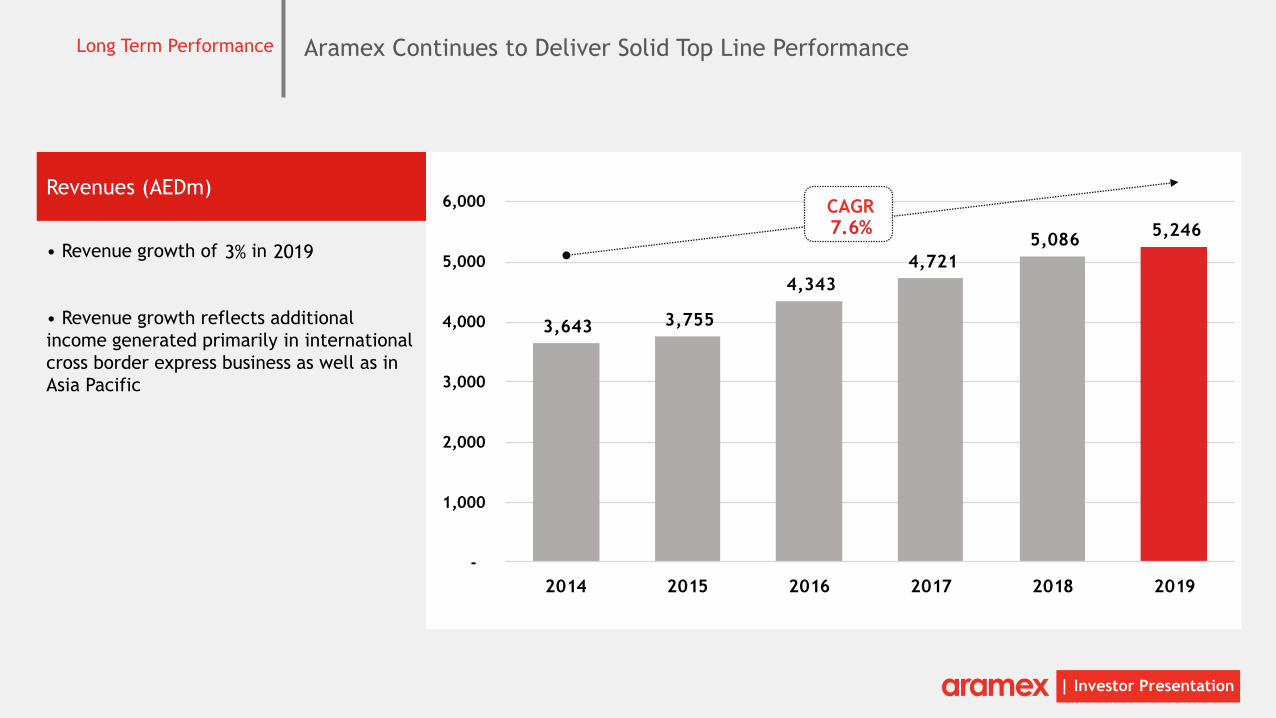
• Revenue growth of in
• Revenue growth reflects additional
income generated primarily in international
cross border express business as well as in
Asia Pacific
3,643 3,755
4,343
4,721
5,086 5,246
-
1,000
2,000
3,000
4,000
5,000
6,000
2014 2015 2016 2017 2018 2019
Aramex Continues to Deliver Solid Top Line PerformanceLong Term Performance
Revenues (AEDm) CAGR7.6%
3% 2019
| Investor Presentation
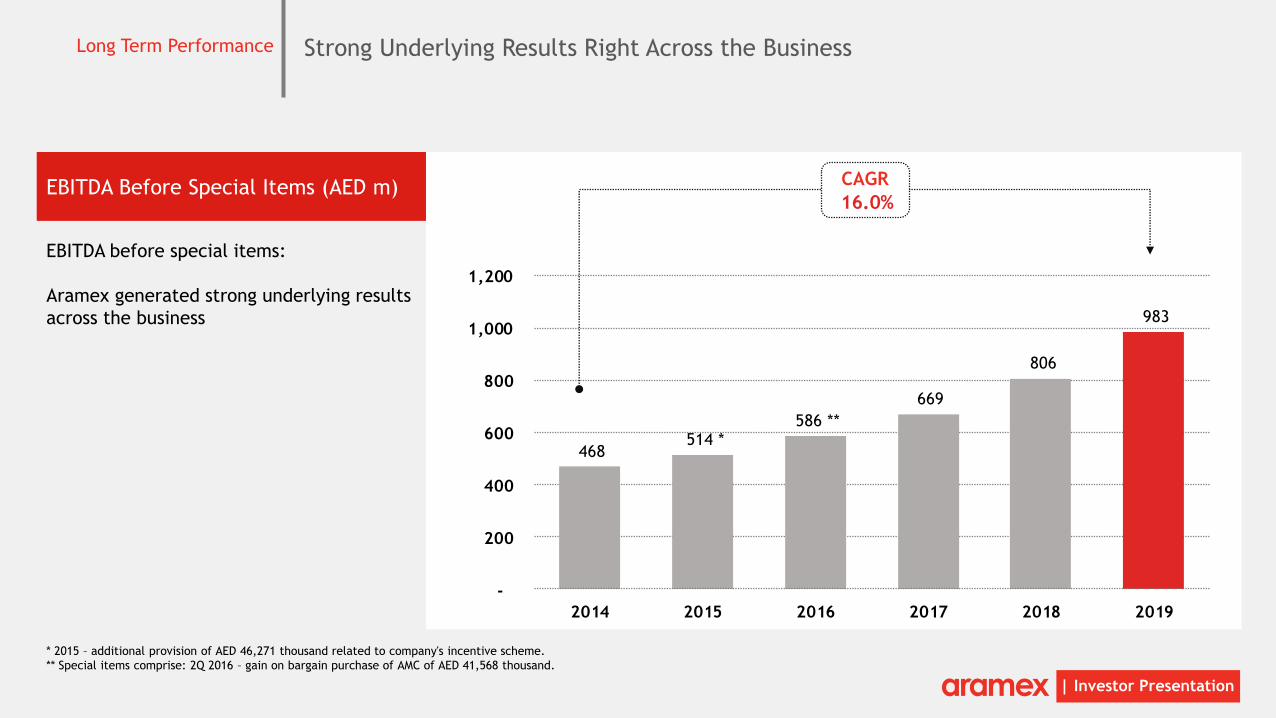
468 514 *
586 **
669
806
983
-
200
400
600
800
1,000
1,200
2014 2015 2016 2017 2018 2019
Strong Underlying Results Right Across the BusinessLong Term Performance
EBITDA Before Special Items (AED m)
EBITDA before special items:
Aramex generated strong underlying results
across the business
CAGR
16.0%
* 2015 – additional provision of AED 46,271 thousand related to company's incentive scheme.
** Special items comprise: 2Q 2016 – gain on bargain purchase of AMC of AED 41,568 thousand.
| Investor Presentation
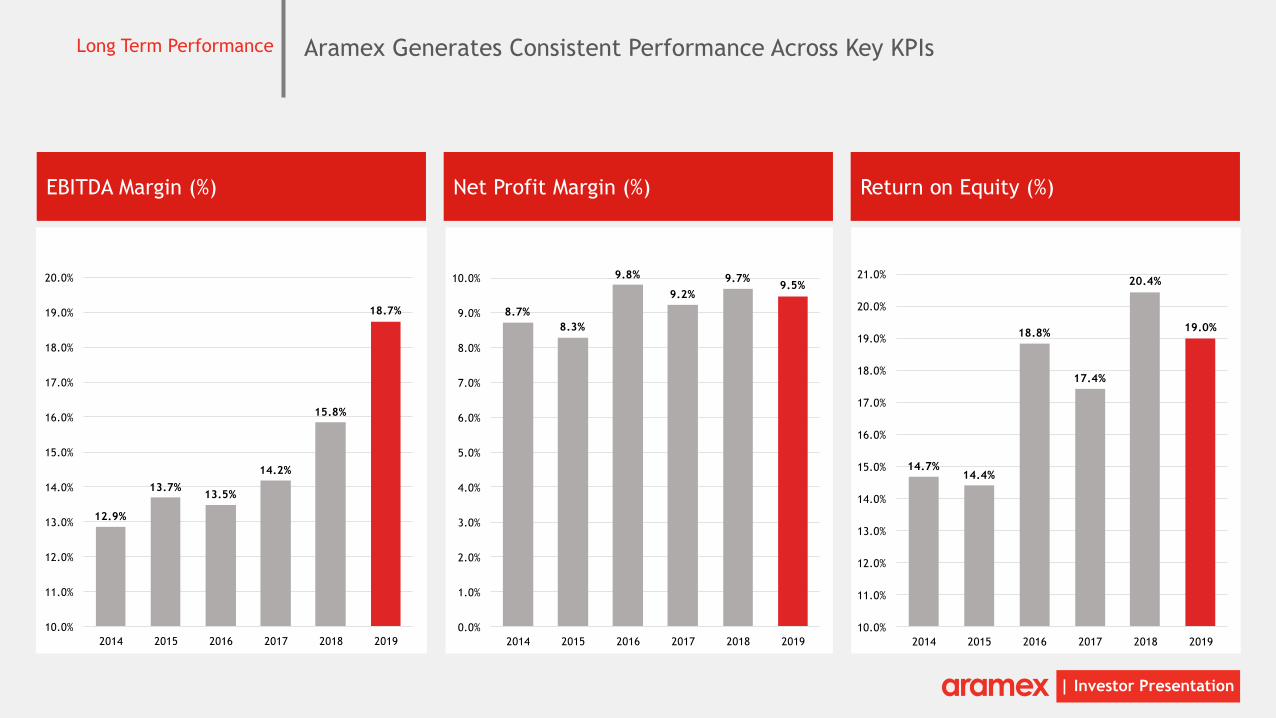
Aramex Generates Consistent Performance Across Key KPIsLong Term Performance
EBITDA Margin (%) Net Profit Margin (%) Return on Equity (%)
12.9%
13.7%13.5%
14.2%
15.8%
18.7%
10.0%
11.0%
12.0%
13.0%
14.0%
15.0%
16.0%
17.0%
18.0%
19.0%
20.0%
2014 2015 2016 2017 2018 2019
8.7%
8.3%
9.8%
9.2%
9.7%9.5%
0.0%
1.0%
2.0%
3.0%
4.0%
5.0%
6.0%
7.0%
8.0%
9.0%
10.0%
2014 2015 2016 2017 2018 2019
14.7%14.4%
18.8%
17.4%
20.4%
19.0%
10.0%
11.0%
12.0%
13.0%
14.0%
15.0%
16.0%
17.0%
18.0%
19.0%
20.0%
21.0%
2014 2015 2016 2017 2018 2019
| Investor Presentation
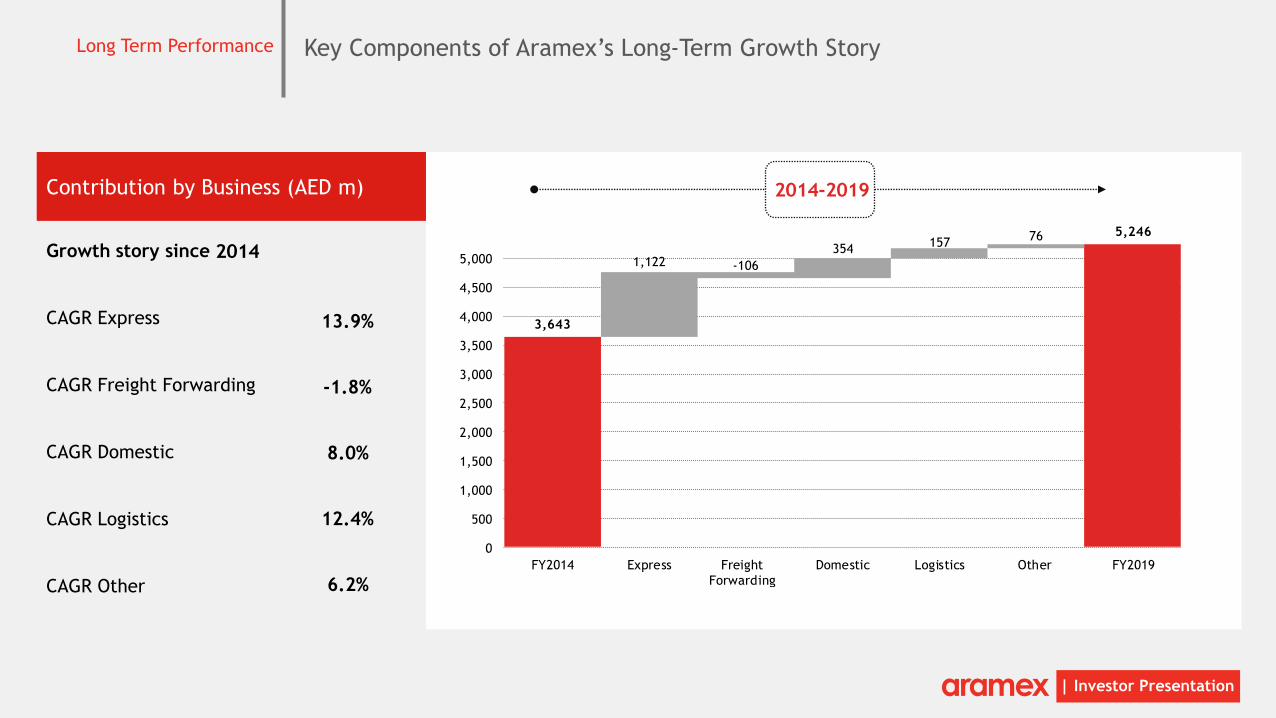
Key Components of Aramex’s Long-Term Growth StoryLong Term Performance
Contribution by Business (AED m)
Growth story since
CAGR Express
CAGR Freight Forwarding
CAGR Domestic
CAGR Logistics
CAGR Other
13.9%
-1.8%
8.0%
12.4%
6.2%
3,643
1,122 -106
354157
76 5,246
0
500
1,000
1,500
2,000
2,500
3,000
3,500
4,000
4,500
5,000
FY2014 Express Freight
Forwarding
Domestic Logistics Other FY2019
2014-2019
2014
| Investor Presentation
2014-2019
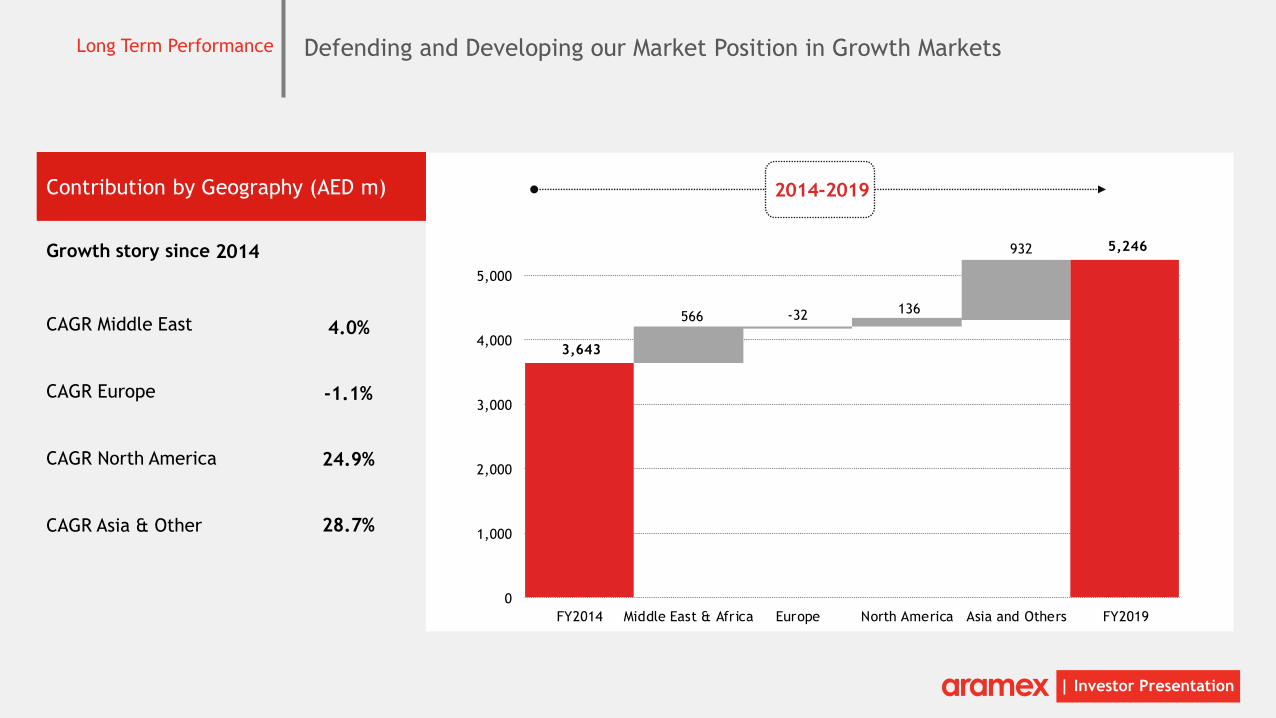
Defending and Developing our Market Position in Growth MarketsLong Term Performance
Contribution by Geography (AED m)
Growth story since
CAGR Middle East
CAGR Europe
CAGR North America
CAGR Asia & Other
4.0%
-1.1%
24.9%
28.7%
3,643
566 -32 136
932 5,246
0
1,000
2,000
3,000
4,000
5,000
FY2014 Middle East & Africa Europe North America Asia and Others FY2019
2014
| Investor Presentation
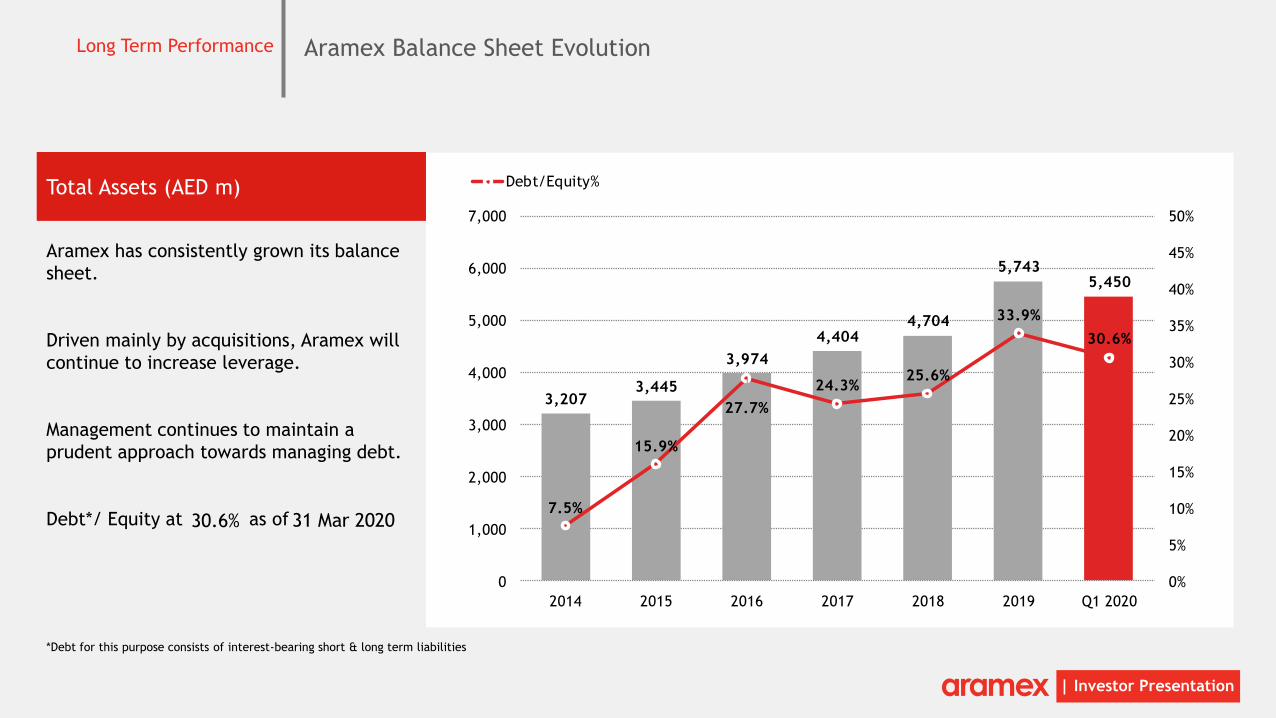
Aramex Balance Sheet EvolutionLong Term Performance
Total Assets (AED m)
Aramex has consistently grown its balance
sheet.
Driven mainly by acquisitions, Aramex will
continue to increase leverage.
Management continues to maintain a
prudent approach towards managing debt.
Debt*/ Equity at as of
*Debt for this purpose consists of interest-bearing short & long term liabilities
3,2073,445
3,974
4,4044,704
5,7435,450
7.5%
15.9%
27.7%
24.3%25.6%
33.9%
30.6%
0%
5%
10%
15%
20%
25%
30%
35%
40%
45%
50%
0
1,000
2,000
3,000
4,000
5,000
6,000
7,000
2014 2015 2016 2017 2018 2019 Q1 2020
Debt/Equity%
31 Mar 202030.6%
| Investor Presentation
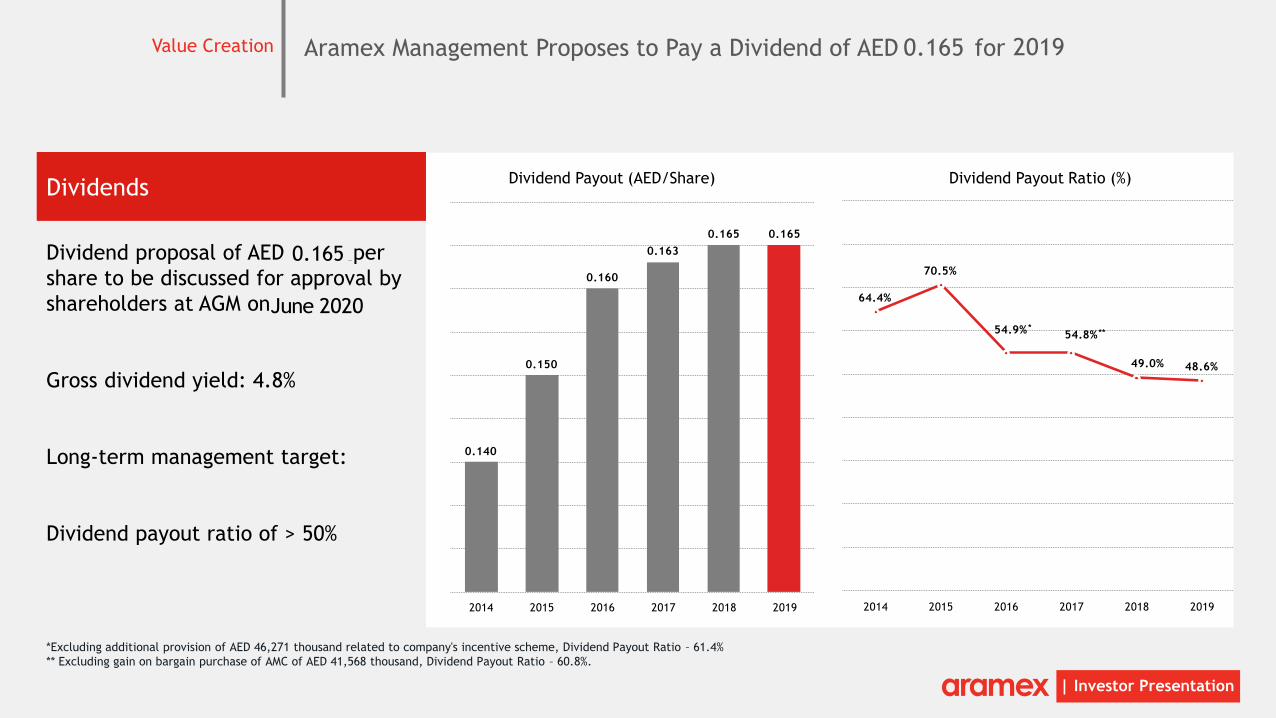
Aramex Management Proposes to Pay a Dividend of AED for Value Creation
Dividends
Dividend proposal of AED per
share to be discussed for approval by
shareholders at AGM on
Gross dividend yield: 4.8%
Long-term management target:
Dividend payout ratio of > 50%
*Excluding additional provision of AED 46,271 thousand related to company's incentive scheme, Dividend Payout Ratio – 61.4%
** Excluding gain on bargain purchase of AMC of AED 41,568 thousand, Dividend Payout Ratio – 60.8%.
0.140
0.150
0.160
0.163
0.165 0.165
2014 2015 2016 2017 2018 2019
Dividend Payout (AED/Share) Dividend Payout Ratio (%)
64.4%
70.5%
54.9% *54.8% **
49.0% 48.6%
2014 2015 2016 2017 2018 2019
0.165
0.165 2019
June 2020
| Investor Presentation
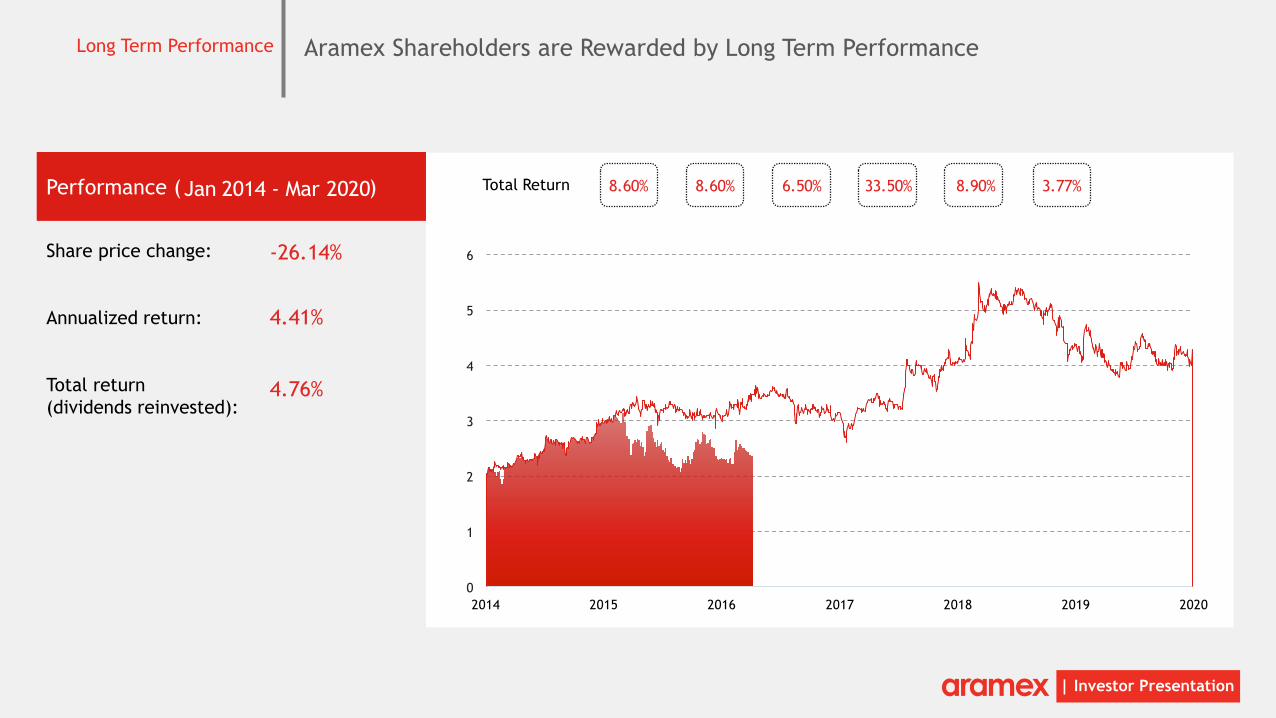
Aramex Shareholders are Rewarded by Long Term PerformanceLong Term Performance
Performance ( )
Share price change:
Annualized return:
Total return
(dividends reinvested):
Total Return
-26.14%
4.41%
4.76%
0
1
2
3
4
5
6
2014 2015 2016 2017 2018 2019 2020
Jan 2014 - Mar 2020 8.60% 6.50% 33.50% 8.90% 3.77%8.60%
Management
Outlook
Management Update | Results | Long Term Performance | Management OutlookQ1 2020
| Investor Presentation
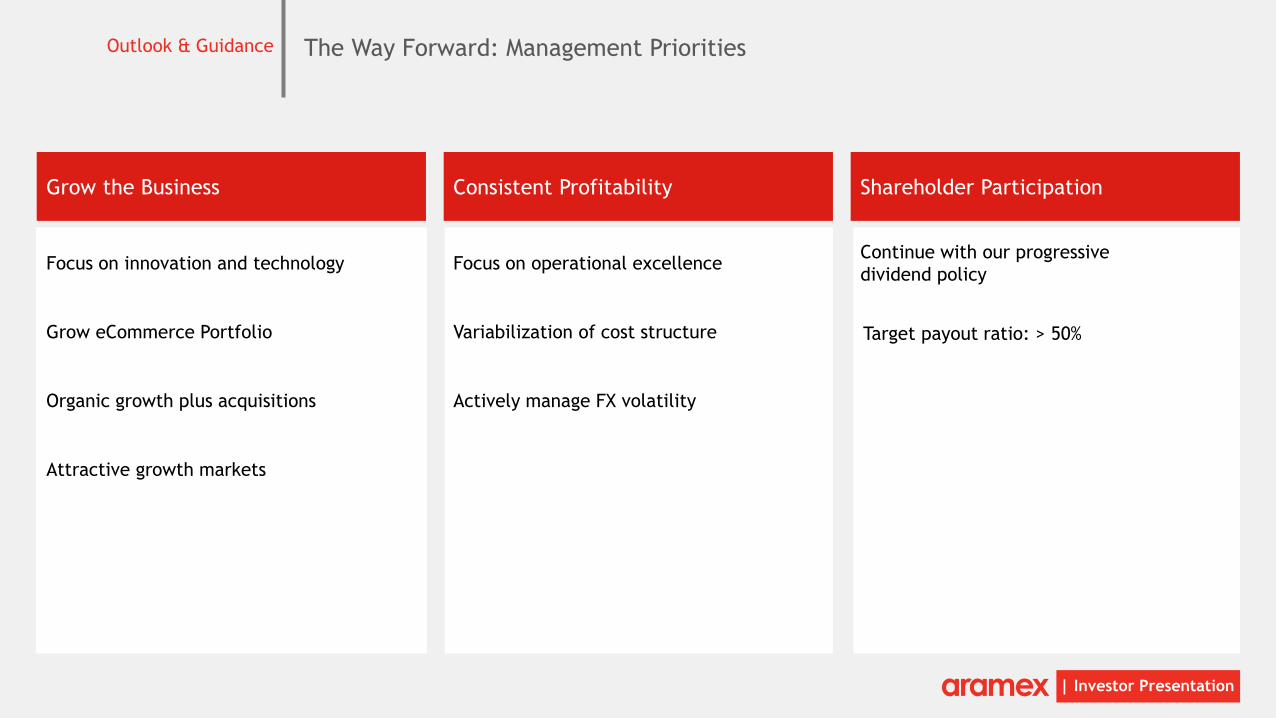
The Way Forward: Management PrioritiesOutlook & Guidance
Grow the Business Consistent Profitability Shareholder Participation
Focus on innovation and technology Focus on operational excellenceContinue with our progressive
dividend policy
Grow eCommerce Portfolio
Organic growth plus acquisitions
Attractive growth markets
Variabilization of cost structure
Actively manage FX volatility
Target payout ratio: > 50%
| Investor Presentation
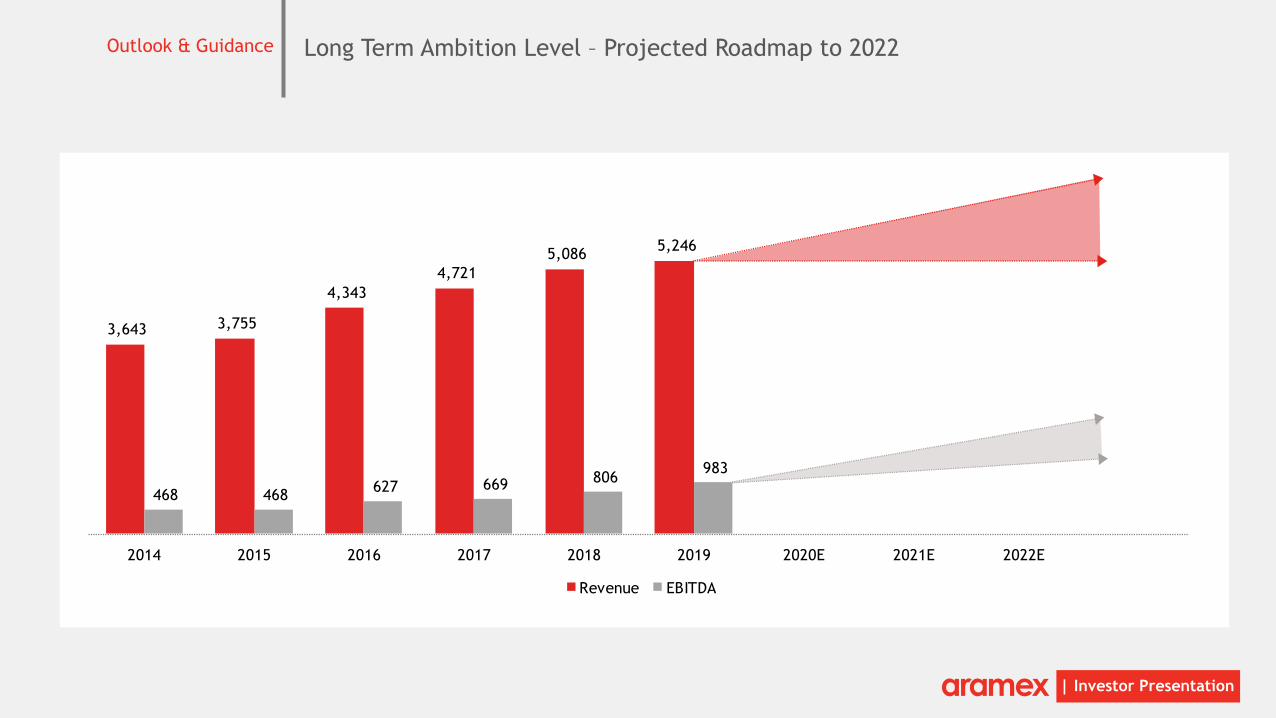
3,643 3,755
4,343
4,721
5,086 5,246
468 468 627 669 806
983
2014 2015 2016 2017 2018 2019 2020E 2021E 2022E
Revenue EBITDA
Long Term Ambition Level – Projected Roadmap to 2022Outlook & Guidance

| Investor Presentation
Investor Relations ContactsAramex
Bashar Obeid
CEO
Iyad Kamal
COO
Nadia Abu Sarah
CFO
Mohammad Al Qassem
Investor Relations
Investor Relations:[email protected]
Tel +971 4 211 8464
P.O. Box
Dubai – UAE
aramex.com/investors