Embed Size (px)
Citation preview
August 2016
Investor UpdateTransformational Business Combination of Centerra Gold and Thompson Creek

Caution Regarding Forward-Looking Information
2
Information contained in this presentation which are not statements of historical facts, may be “forward-looking information” for the purposes of Canadian and U.S. securities laws. Such forward-looking information involvesrisks, uncertainties and other factors that could cause actual results, performance, prospects and opportunities to differ materially from those expressed or implied by such forward looking information. The words “believe”,“expect”, “anticipate”, “contemplate”, “plan”, “intends”, “continue”, “budget”, “estimate”, “may”, “will”, “schedule”, “understand” and similar expressions identify forward-looking information. These forward-looking statementsrelate to, among other things: expectations regarding whether the proposed transactions outlined herein, including the arrangement to acquire Thompson Creek Metals Company Inc. (“TCM”), the equity financing and the debtfinancing, the redemption of TCM’s outstanding notes, as well as the issuance of the Centerra shares in connection with the arrangement and the equity financing, will be consummated, including whether conditions to theconsummation of the proposed transactions will be satisfied, or the timing for completing the transactions; further discussions with the Mongolian Government relating to definitive agreements for the development of theGatsuurt project, higher grade ore from cut-back 17 at Kumtor; matters relating to the Öksüt Project, including as to applications for and receipt of permits, timelines for development and production; completion of a feasibilitystudy; EIS/EA submissions and impact benefits agreements relating to the Hardrock Project; claims and investigations made by Kyrgyz Republic state agencies, including the GPO, SIETS and SAEPF and arbitration proceedingsinvolving KGC and the Kumtor Project, related Kyrgyz Republic court orders, the potential effects of such court orders and the Company’s intentions relating thereto; permitting and regulatory matters, including the EcologicalPassport, relating to the Kumtor Project, the potential effect of the Draft Nationalization Bill, and the potential effect on the Kumtor Project of Kumtor being prevented from moving ice; reclamation and closure activities at Boroo;estimates relating to the Company’s cash and short term investments and its 2016 business plans; expectations relating to the Company’s production, capital expenditures and costs for 2016. Forward-looking information isnecessarily based upon a number of estimates and assumptions that, while considered reasonable by Centerra, are inherently subject to significant political, business, economic and competitive uncertainties and contingencies.Known and unknown factors could cause actual results to differ materially from those projected in the forward looking information. Factors that could cause actual results or events to differ materially from current expectationsinclude, among other things: (A) the ability to consummate the proposed transactions; the ability to obtain requisite regulatory and shareholder approvals and the satisfaction of other conditions to the consummation of theproposed transactions on the proposed terms and schedule, and to the extent, anticipated the potential impact of the announcement or consummation of the proposed transactions on relationships, including with regulatoryauthorities, employees, suppliers, customers and competitors; changes in general economic, business and political conditions, including changes in the financial markets; changes in applicable laws; significant competition thatCenterra and TCM face; compliance with extensive government regulation; and the diversion of management time on the proposed transactions (B) strategic, legal, planning and other risks, including: political risks associatedwith the Company’s operations in the Kyrgyz Republic, Mongolia and Turkey; resource nationalism including the management of external stakeholder expectations; the impact of changes in, or to the more aggressiveenforcement of, laws, regulations and government practices in the jurisdictions in which the Company operates including any unjustified civil or criminal action against the Company, its affiliates or its current or formeremployees; the impact of any actions taken by the Kyrgyz Republic Government and Parliament relating to the Kumtor Project Agreements which are inconsistent with the rights of Centerra and KGC under the Kumtor ProjectAgreements; any impact on the purported cancellation of Kumtor’s land use rights at the Kumtor Project pursuant to a court claim commenced by the Kyrgyz Republic GPO; the risks related to other outstanding litigationaffecting the Company’s operations in the Kyrgyz Republic and elsewhere; the impact of the delay by relevant government agencies to provide required approvals and permits, including the delay currently being experienced atthe Kumtor Project over the ecological passport; the potential impact on the Kumtor Project of investigations by Kyrgyz Republic instrumentalities and movement restrictions on KGC employees and managers; the rights of theMongolian Government to take an interest in the Gatsuurt Project as a result of the deposit being declared a strategic deposit, and the terms of any such participation, or to take a special royalty rate which has yet to be defined;the impact of changes to, the increased enforcement of, environmental laws and regulations relating to the Company’s operations; the impact of any sanctions imposed by Canada, the United States or other jurisdictions againstvarious Russian individuals and entities; the ability of the Company to negotiate a successful deposit development agreement for Gatsuurt; potential defects of title in the Company’s properties that are not known as of the datehereof; the inability of the Company and its subsidiaries to enforce their legal rights in certain circumstances; the presence of a significant shareholder that is a state-owned company of the Kyrgyz Republic; risks related to anti-corruption legislation; risks related to the concentration of assets in Central Asia; Centerra’s future exploration and development activities not being successful; Centerra not being able to replace mineral reserves; difficulties withCenterra’s joint venture partners; and aboriginal claims and consultative issues relating to the Company’s 50% interest in the Greenstone Gold Property; potential risks related to kidnapping or acts of terrorism; and the failure ofthe Company and/or TCM to satisfy the conditions precedent, including shareholder or regulatory approvals, to the closing of the proposed acquisition of TCM by the Company or related transactions; (C) risks relating to financialmatters, including: sensitivity of the Company’s business to the volatility of gold prices, the imprecision of the Company’s mineral reserves and resources estimates and the assumptions they rely on, the accuracy of theCompany’s production and cost estimates, the impact of restrictive covenants in the Company’s revolving credit facility which may, among other things, restrict the Company from pursuing certain business activities, theCompany’s ability to obtain future financing, the impact of global financial conditions, the impact of currency fluctuations, the effect of market conditions on the Company’s short-term investments, the Company’s ability to makepayments including any payments of principal and interest on the Company’s debt facilities depends on the cash flow of its subsidiaries; and (D) risks related to operational matters and geotechnical issues, including: movementof the Davidov Glacier and the waste and ice movement at the Kumtor Project and the Company’s continued ability to successfully manage such matters, including the continued performance of the buttress; the occurrence offurther ground movements at the Kumtor Project and mechanical availability; the success of the Company’s future exploration and development activities, including the financial and political risks inherent in carrying outexploration activities; inherent risks associated with the use of sodium cyanide in the mining operations; the adequacy of the Company’s insurance to mitigate operational risks; mechanical breakdowns; the Company’s ability toobtain the necessary permits and authorizations to (among other things) raise the tailings dam at the Kumtor Project to the required height; the Company’s ability to replace its mineral reserves; the occurrence of any labourunrest or disturbance and the ability of the Company to successfully re-negotiate collective agreements when required; the risk that Centerra’s workforce may be exposed to widespread epidemic; seismic activity in the vicinityof the Company’s operations in the Kyrgyz Republic and Mongolia; long lead times required for equipment and supplies given the remote location of some of the Company’s operating properties; reliance on a limited number ofsuppliers for certain consumables, equipment and components; illegal mining on the Company’s Mongolian properties; the Company’s ability to accurately predict decommissioning and reclamation costs; the Company’s ability toattract and retain qualified personnel; competition for mineral acquisition opportunities; and risks associated with the conduct of joint ventures/partnerships, including Greenstone Gold Mines LP; the Company’s ability to manageits projects effectively and to mitigate the potential lack of availability of contractors, budget and timing overruns and project resources. See “Risk Factors” in the Company’s 2015 Annual Information Form available on SEDAR atwww.sedar.com. Furthermore, market price fluctuations in gold, as well as increased capital or production costs or reduced recovery rates may render mineral reserves containing lower grades of mineralization uneconomic andmay ultimately result in a restatement of reserves. The extent to which resources may ultimately be reclassified as proven or probable reserves is dependent upon the demonstration of their profitable recovery. Economic andtechnological factors which may change over time always influence the evaluation of reserves or resources. Centerra has not adjusted mineral resource figures in consideration of these risks and, therefore, Centerra can give noassurances that any mineral resource estimate will ultimately be reclassified as proven and probable reserves. There can be no assurances that forward-looking information and statements will prove to be accurate, as manyfactors and future events, both known and unknown could cause actual results, performance or achievements to vary or differ materially, from the results, performance or achievements that are or may be expressed or impliedby such forward-looking statements contained herein or incorporated by reference. Accordingly, all such factors should be considered carefully when making decisions with respect to Centerra, and prospective investors shouldnot place undue reliance on forward looking information. Forward-looking information is as of the date on which it is made. Centerra assumes no obligation to update or revise forward looking information to reflect changes inassumptions, changes in circumstances or any other events affecting such forward-looking information, except as required by applicable law. Except as otherwise noted herein, Gordon Reid, Professional Engineer and Centerra’sVice President and Chief Operating Officer, has reviewed and approved the scientific and technical information contained in this presentation. Mr. Reid is a Qualified Person within the meaning of NI 43-101. For moreinformation, please refer to the Company’s 2015 Annual Information Form and the technical reports referenced therein, which are available on SEDAR. All figures are in United States dollars unless otherwise stated.August 2016

1. 2016e AISC: Consolidated Centerra: $776 to 824 per ounce; Kumtor mine $717 to 759 per ounce. All-in sustaining costs per ounce sold is a non-GAAP measures and is discussed under “Non-GAAP Measures” in the Company’s MD&A dated July 26, 2016.2. As at June 30, 2016; Net Cash includes cash, cash equivalents, short-term investments, net of external debt.3. As of July 21, 2016.
Q2 Corporate Highlights
Internationally Diversified Gold Producer
Up to 530kozpa at AISC1 of $776 to $824 per ounce excluding proposed TCM transaction
Significant operational cash flow profile
Internally funded, late-stage development pipeline
Projects drive +100% increase in gold production by 2020
Peer Leading Net Cash2 Position of US$427MM2
Trading at a discount to peers, potential rerating
Quarterly Dividend Distributions (2.2% Yield3)
Positive Retained Earnings of US$734MM2
Add to Diversification with the Thomson Creek transaction
Centerra: Built For Success
Kumtor Five Year Gold Production Profile
Profitably Growing to +1Moz’s Per Annum
3
0
1,000
Kumtor Mt Milligan Oksut Gatsuurt Greenstone Total
Oun
ces
(000
’s)
1.00
1.50
2.00
2.50
3.00
3.50
4.00
4.50
0
100,000
200,000
300,000
400,000
500,000
600,000
2015 2016 2017 2018 2019 2020
grad
e g/
t
Oun
ces
August 2016

YTD Corporate Update
Cash$542MM
Strong Balance Sheet (US$)
Debt$100MM
(as of June 30, 2016)
4
Stable Share Count
216.2 216.3 216.3 226.7 235.5 236.1 236.4 236.4 236.4 237.9 242.2
0.0
50.0
100.0
150.0
200.0
250.0
300.0
2006 2007 2008 2009 2010 2011 2012 2013 2014 2015 Q2 2016
mill
ions
2015 Internally Funded Business (US$)
Retained Earnings Profile (US$)
0
400
800
1,200
1,600
2,000
0
200
400
600
800
1,000
1,200
2004 2005 2006 2007 2008 2009 2010 2011 2012 2013 2014 2015 Q22016
Gol
d Pr
ice
(US$
/oz)
US$
Mill
ions
Retained Earnings Cumulative Dividends Gold Price
Cash$527MM
* Includes cash, cash equivalents, and short-term investments.
*
August 2016
562
158 76
73
29 542
200
300
400
500
600
700
800
2014 Cash KumtorCashflow
GreenstoneAcquisition
Other(Projects,G&A, etc)
ShareholderDividends
2015 Cash
US$
Mill
ions
* *

925
800
500
600
700
800
900
1,000
Original Revised
Reduced All-In Sustaining Cost Per Ounce Guidance (US$/oz) -Mid Point
2016 Revised Guidance
2016 GUIDANCE: INCREASING PRODUCTION AND LOWER COSTS
Production increase: up to 2%; Costs decline: up to 14%;
› Underpins strong financial performance
2016 Company-Wide Operational Guidance Highlights
505,000 515,000
250,000
300,000
350,000
400,000
450,000
500,000
550,000
Original Revised
Gold Production (ounces) - Mid-Point
5August 2016

Operating Cash Flows $334 MM
Cash Flows Invested $244 MM
Operating Cash Flows $376 MM
Cash Flows Invested $282 MM
170U/G miners
240U/G miners
240U/G miners
Centerra: Robust Financial Margins in all Cycles
YE target of 4,000tpd
2014 Free Cash Flow Profile (US$)
2015 Free Cash Flow Profile (US$)
6
Cash Reserves1 Profile (US$)
0
400
800
1,200
1,600
2,000
0
200
400
600
800
1,000
2004 2005 2006 2007 2008 2009 2010 2011 2012 2013 2014 2015 Q22016
Gol
d Pr
ice
(US$
/oz)
US$
Mill
ions
Cumulative Dividends Cash Balance Gold Price1
Retained Earnings Profile (US$)
0
400
800
1,200
1,600
2,000
0
200
400
600
800
1,000
1,200
2004 2005 2006 2007 2008 2009 2010 2011 2012 2013 2014 2015 Q22016
Gol
d Pr
ice
(US$
/oz)
US$
Mill
ions
Retained Earnings Cumulative Dividends Gold Price
August 2016 1. Cash reserves and cash balance includes cash, cash equivalents and short-term investments

Centerra: Shareholder Value Creation
7
Financial Discipline Equals Peer Leading Dividend Distributions
Historical cumulative dividend payments of US$255 million
Peer leading dividend
Quarterly dividend distribution of C$0.04 cents per share
Annual Dividend Declared (US$MM’s) Dividend Yield
Source: Scotiabank GBM
$14
$99
$28$36 $34
$29
$15
0
25
50
75
100
2010 2011 2012 2013 2014 2015 Q2 2016
2.2%
1.9%
1.5%
1.2%
0.7% 0.7% 0.7%0.4% 0.4% 0.3% 0.3%
0.1%
CG CEE GFI ACA RRS AEM YRI ABX G AGI NEM ELD
August 2016
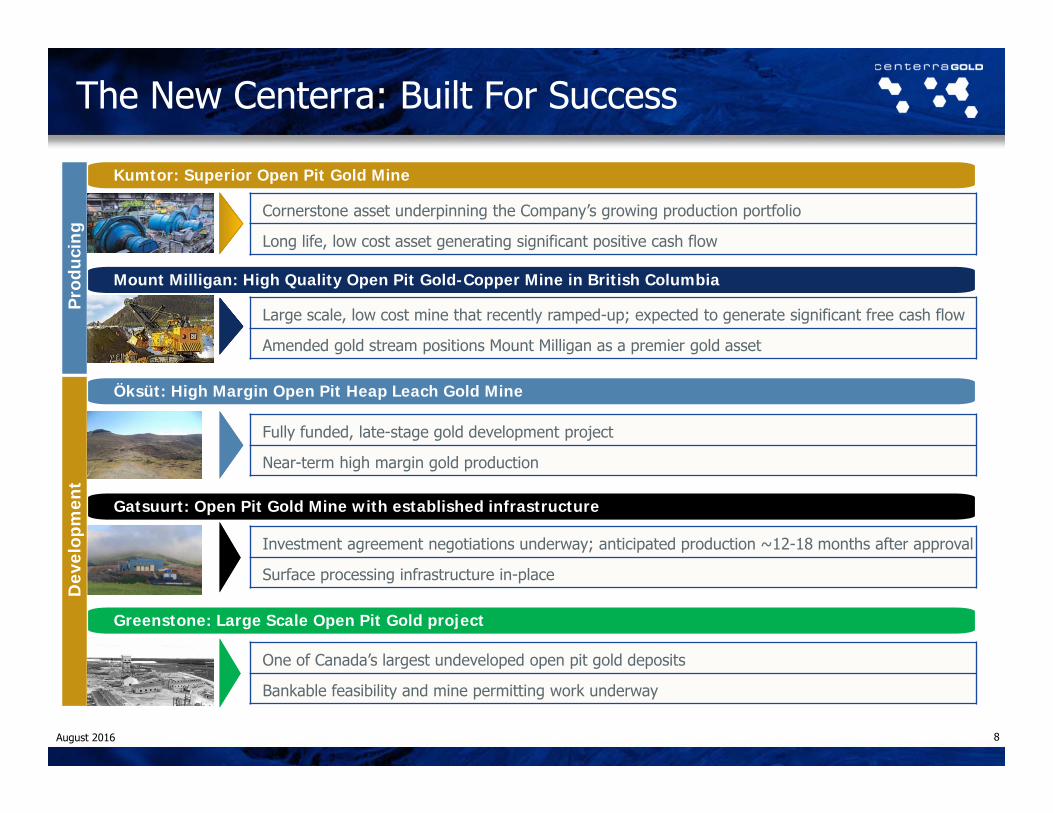
The New Centerra: Built For Success
Kumtor: Superior Open Pit Gold Mine
Öksüt: High Margin Open Pit Heap Leach Gold Mine
Gatsuurt: Open Pit Gold Mine with established infrastructure
Cornerstone asset underpinning the Company’s growing production portfolio
Long life, low cost asset generating significant positive cash flow
Fully funded, late-stage gold development project
Near-term high margin gold production
Investment agreement negotiations underway; anticipated production ~12-18 months after approval
Surface processing infrastructure in-place
8
Mount Milligan: High Quality Open Pit Gold-Copper Mine in British Columbia
Large scale, low cost mine that recently ramped-up; expected to generate significant free cash flow
Amended gold stream positions Mount Milligan as a premier gold asset
Greenstone: Large Scale Open Pit Gold project
One of Canada’s largest undeveloped open pit gold deposits
Bankable feasibility and mine permitting work underway
Pro
duci
ngD
evel
opm
ent
August 2016
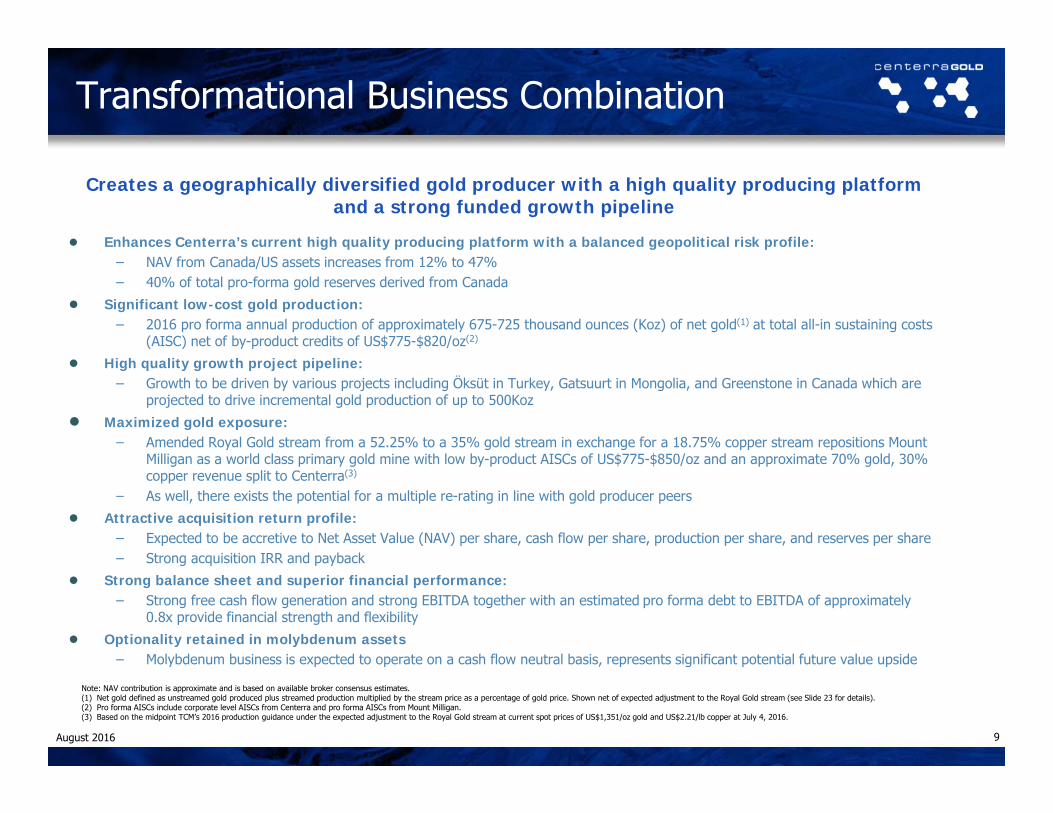
Transformational Business Combination
Creates a geographically diversified gold producer with a high quality producing platform and a strong funded growth pipeline
● Enhances Centerra’s current high quality producing platform with a balanced geopolitical risk profile:– NAV from Canada/US assets increases from 12% to 47%– 40% of total pro-forma gold reserves derived from Canada
● Significant low-cost gold production:– 2016 pro forma annual production of approximately 675-725 thousand ounces (Koz) of net gold(1) at total all-in sustaining costs
(AISC) net of by-product credits of US$775-$820/oz(2)
● High quality growth project pipeline:– Growth to be driven by various projects including Öksüt in Turkey, Gatsuurt in Mongolia, and Greenstone in Canada which are
projected to drive incremental gold production of up to 500Koz
● Maximized gold exposure:– Amended Royal Gold stream from a 52.25% to a 35% gold stream in exchange for a 18.75% copper stream repositions Mount
Milligan as a world class primary gold mine with low by-product AISCs of US$775-$850/oz and an approximate 70% gold, 30% copper revenue split to Centerra(3)
– As well, there exists the potential for a multiple re-rating in line with gold producer peers
● Attractive acquisition return profile:– Expected to be accretive to Net Asset Value (NAV) per share, cash flow per share, production per share, and reserves per share– Strong acquisition IRR and payback
● Strong balance sheet and superior financial performance:– Strong free cash flow generation and strong EBITDA together with an estimated pro forma debt to EBITDA of approximately
0.8x provide financial strength and flexibility
● Optionality retained in molybdenum assets– Molybdenum business is expected to operate on a cash flow neutral basis, represents significant potential future value upside
9
Note: NAV contribution is approximate and is based on available broker consensus estimates.(1) Net gold defined as unstreamed gold produced plus streamed production multiplied by the stream price as a percentage of gold price. Shown net of expected adjustment to the Royal Gold stream (see Slide 23 for details).(2) Pro forma AISCs include corporate level AISCs from Centerra and pro forma AISCs from Mount Milligan.(3) Based on the midpoint TCM’s 2016 production guidance under the expected adjustment to the Royal Gold stream at current spot prices of US$1,351/oz gold and US$2.21/lb copper at July 4, 2016.
August 2016

Transaction Summary
Transaction Summary
• Total transaction value of ~US$1.1 Billion(1)
• Purchase of TCM shares outstanding ~US$140MM(2)
• Redemption of TCM bonds at the call price plus accrued and unpaid interest (US$889MM(3))
• Assumption of TCM capital leases (US$47MM)
Consideration
• Each existing TCM share outstanding at closing will be exchanged for 0.0988 Centerra shares pursuant to a plan of arrangement providing TCM shareholders with an approximate 8% interest in Centerra
• The Exchange Ratio implies a premium of 33% to Thompson Creek common shares based on each company’s 20-day volume weighted average price on the TSX for the period ending July 4, 2016
• In connection with the closing of arrangement, Centerra will cause Thompson Creek to redeem its 9.75% secured notes due in 2017, 7.375% unsecured notes due in 2018, and 12.5% unsecured notes due in 2019. They will be redeemed for cash in accordance with the indenture terms
Financing Redemption of
TCM Notes
• The redemption of TCM’s notes will be financed with a combination of:
• Equity Offering:
Net proceeds of C$185.7MM from a recently completed bought deal offering of subscription receipts financing by Centerra
• New Credit Facilities:
US$300MM drawdown of the new US$325MM credit facility provided by Scotiabank to Centerra(4)
• Use of Cash on Hand:
The balance of approximately US$460MM will be financed by cash on hand at Thompson Creek and Centerra
Conditions• Thompson Creek shareholder approval (66⅔% of votes cast)
• Customary regulatory and court approvals
Governance• Centerra’s leadership will lead the combined company
• Appointment of one current member of the TCM board of directors to the Centerra board
Other • Customary non-solicitation covenants and a termination fee is payable in customary circumstances
Anticipated Timeline
• Mailing of TCM shareholder meeting materials in August 2016
• TCM shareholder meeting in September 2016
• Expected to close in Fall 2016
10
(1) Includes TCM capital leases assumed.(2) Calculated based on the closing price of Centerra’s shares on the TSX as of July 4, 2016.(3) Assumes redemption date of September 30, 2016.(4) Pursuant to a commitment letter from Scotiabank dated June 13, 2016 and subject to the terms and conditions contained therein.August 2016

Mount Milligan and Kumtor: Two Flagship Gold Assets
11
Source: Centerra’s public filings on SEDAR (“Company filings”), including the Kumtor Mine NI 43-101 Technical Report (March 20, 2015); TCM’s public filings on SEDAR and EDGAR (“TCM filings”), including Mount Milligan Mine NI 43-101 Technical Report (January 21, 2015).(1) See Note i on slide 30.(2) See Note ii on slide 30. See slide 31 for breakdown of proven and probable reserves.(3) See Note iii on slide 30.(4) See Note iv on slide 30. See slide 32 for breakdown of proven and probable reserves, and measured and indicated resources.
2016EGuidance
Gold Production (koz) 240-270
Copper Production (MMlbs) 55-65
All-In Sustaining Costs (US$/oz)(1) $775-$850
Remaining reserve life (years) 21 years
Gold Copper
P&P Reserves(2) 5.69Moz 2,185Mlbs
Grade 0.349g/t 0.196%
Amended Royal Gold stream 35% @ US$435/oz
18.75% @ 15% of spot Cu price
2015 2016E Guidance
Gold Production (koz) 521 500-530
Adjusted Operating Costs (US$/oz)(3) $326 $369-$391
All-In Sustaining Costs (US$/oz) (3) $731 $717-$759
Growth Capital (US$MM) (3) $14 $22
Projected Asset Life (years) +10
P&P Reserves (Moz) (4) 5.6
Au Grade (g/t) 2.5
M&I Resource (Moz) (4) 2.6
Au Grade (g/t) 2.7
+19 years of uninterrupted profitable production
Over 10M ounces of gold produced since 1997
5.6M ounces remaining in P&P reserves(4)
Low cost, long life production
High-grade underground opportunity
Mount Milligan Kumtor
21 years of production from existing P&P reserves(2)
5.7 million gold reserve ounces(2)
Low cost, long life production
Stable, mining-friendly jurisdiction
Restructured stream provides additional gold upside
August 2016

1.8x 1.8x 1.7x 1.6x 1.5x 1.5x 1.5x 1.5x 1.5x 1.5x 1.4x
1.0x 0.8x 0.8x
5% 5% 5% 5% 5% 5% 6% 5% 5% 5% 5% 5% 5% 10%
Silv
er S
tand
ard
Kinr
oss
Gol
d
Taho
e R
esou
rces
Yam
ana
Gol
d
B2G
old
IAM
GO
LD
Acac
ia M
inin
g
Alam
os G
old
SEM
AFO
Det
our
Gol
d
New
Gol
d
Eldo
rado
Gol
d
Curr
ent
Cent
erra
Base
Met
alPr
oduc
ers
Centerra Intermediate Gold Peers Thompson Creek Current Base Metal Peers Median Analyst Discount Rate
Median: 1.5x
Significant Re-Rating Potential
12
Source: FactSet, available street research.(1) Consensus Price / Net Asset Value (“NAV”) is calculated as the share price for each respective company as at July 4, 2016 divided by the median research analyst estimate for that same company.(2) Centerra’s P/NAV is shown on a current, pre-transaction basis. P/NAV is based on Centerra’s share price as of July 4, 2016 and the median analyst NAV per share estimate for Centerra as at the same date.(3) Base metals peers include: Capstone, Copper Mountain, Hudbay Minerals, Lundin Mining, OZ Minerals, Sandfire, Sherritt, Sierra Metals, Taseko, Western Areas.
Analyst Consensus Price / NAV(1)
Base metal producers trading at meaningful discount to precious metals producers
(2)
(3)
August 2016

Opportunities at Mount Milligan
● Following the construction and commissioning, a permanent secondary crushing plant is expected to enable Centerra to increase throughput to more than 62,500 tpd
● Subject to further evaluation and detailed engineering, Centerra believes that there is the potential for throughput to be further increased and copper and gold recoveries improved by
– Adding additional flotation capacity
– Adding additional regrind capacity
– Developing a geo-metallurgical model
– Leaching of flotation tailings
● Positions Centerra to obtain synergies in Canada and enables the utilization of tax benefits
13August 2016
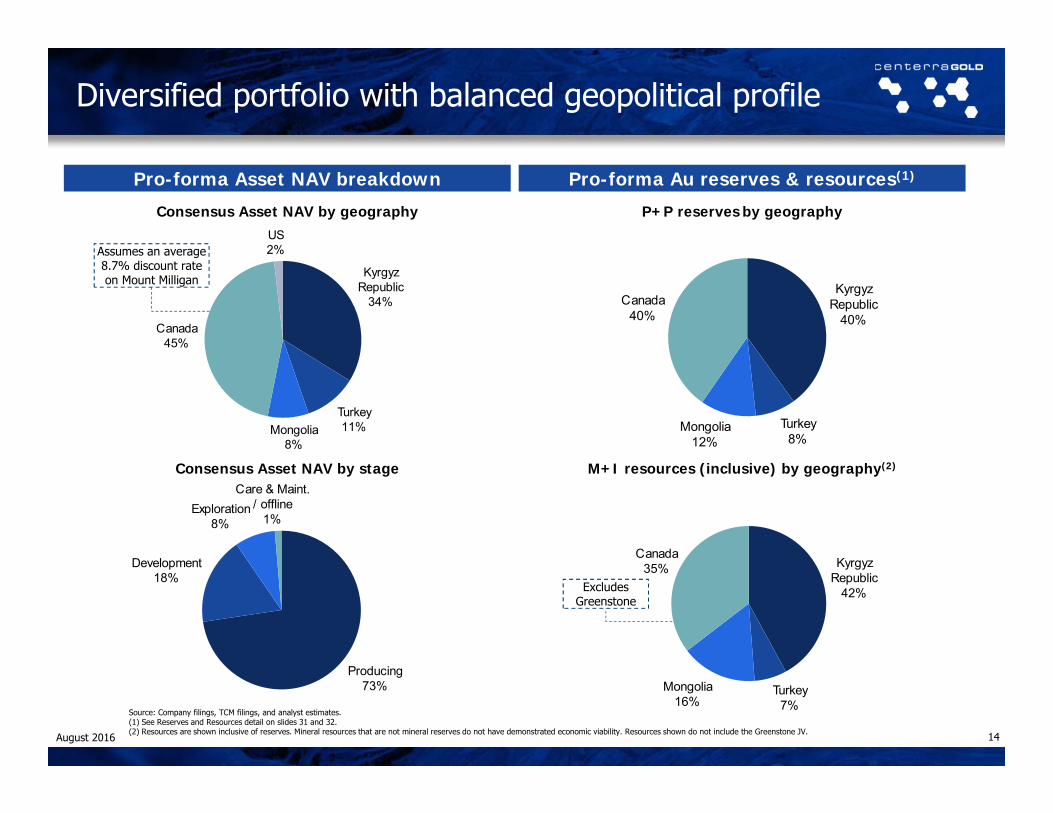
Producing73%
Development18%
Exploration8%
Care & Maint. / offline
1%
Diversified portfolio with balanced geopolitical profile
14
Kyrgyz Republic
40%
Turkey8%
Mongolia12%
Canada40%
Kyrgyz Republic
34%
Turkey11%Mongolia
8%
Canada45%
US2%
Pro-forma Au reserves & resources(1)Pro-forma Asset NAV breakdown
Consensus Asset NAV by geography
Consensus Asset NAV by stage
Source: Company filings, TCM filings, and analyst estimates.(1) See Reserves and Resources detail on slides 31 and 32.(2) Resources are shown inclusive of reserves. Mineral resources that are not mineral reserves do not have demonstrated economic viability. Resources shown do not include the Greenstone JV.
P+P reserves by geography
M+I resources (inclusive) by geography(2)
Kyrgyz Republic
42%
Turkey7%
Mongolia16%
Canada35%
Assumes an average 8.7% discount rate on Mount Milligan
Excludes Greenstone
August 2016
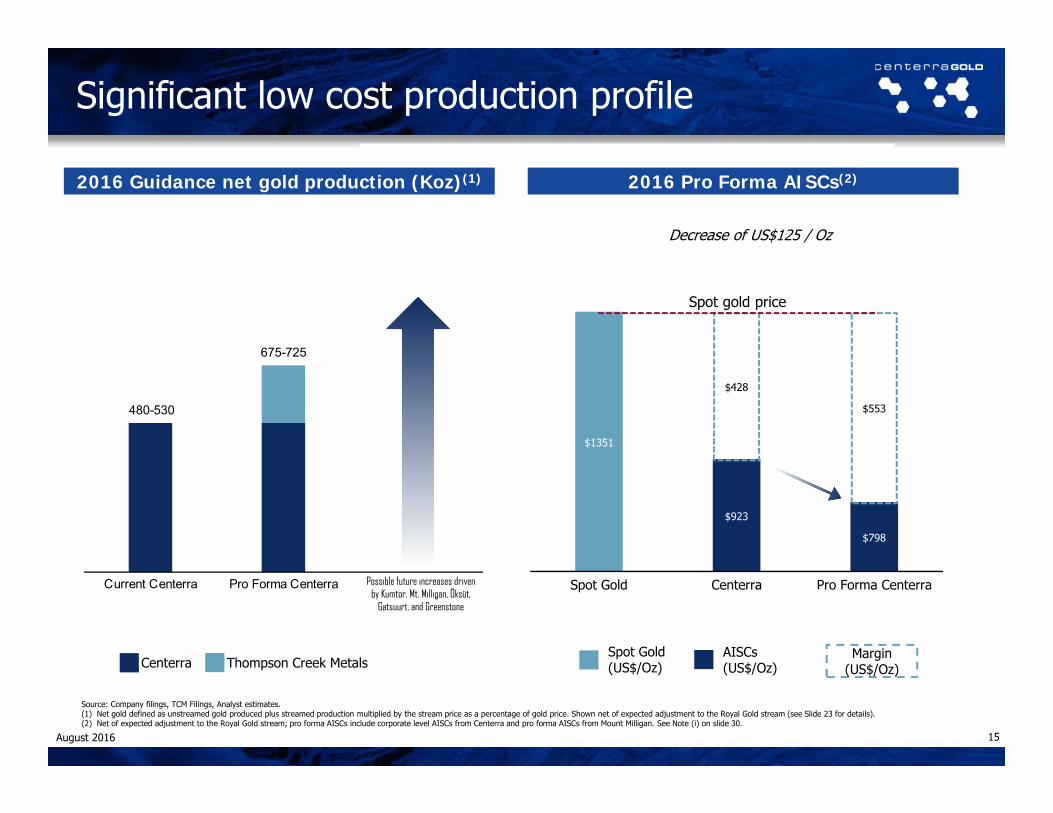
$1351
$923
$798
$428
$553
Spot Gold Centerra Pro Forma Centerra
480-530195
675-725
Current Centerra Pro Forma Centerra
Significant low cost production profile
15
2016 Guidance net gold production (Koz)(1) 2016 Pro Forma AISCs(2)
Centerra Thompson Creek Metals
Possible future increases driven by Kumtor, Mt. Milligan, Öksüt,
Gatsuurt, and Greenstone
Source: Company filings, TCM Filings, Analyst estimates.(1) Net gold defined as unstreamed gold produced plus streamed production multiplied by the stream price as a percentage of gold price. Shown net of expected adjustment to the Royal Gold stream (see Slide 23 for details).(2) Net of expected adjustment to the Royal Gold stream; pro forma AISCs include corporate level AISCs from Centerra and pro forma AISCs from Mount Milligan. See Note (i) on slide 30.
AISCs (US$/Oz)
Decrease of US$125 / Oz
Margin(US$/Oz)
Spot Gold(US$/Oz)
Spot gold price
August 2016
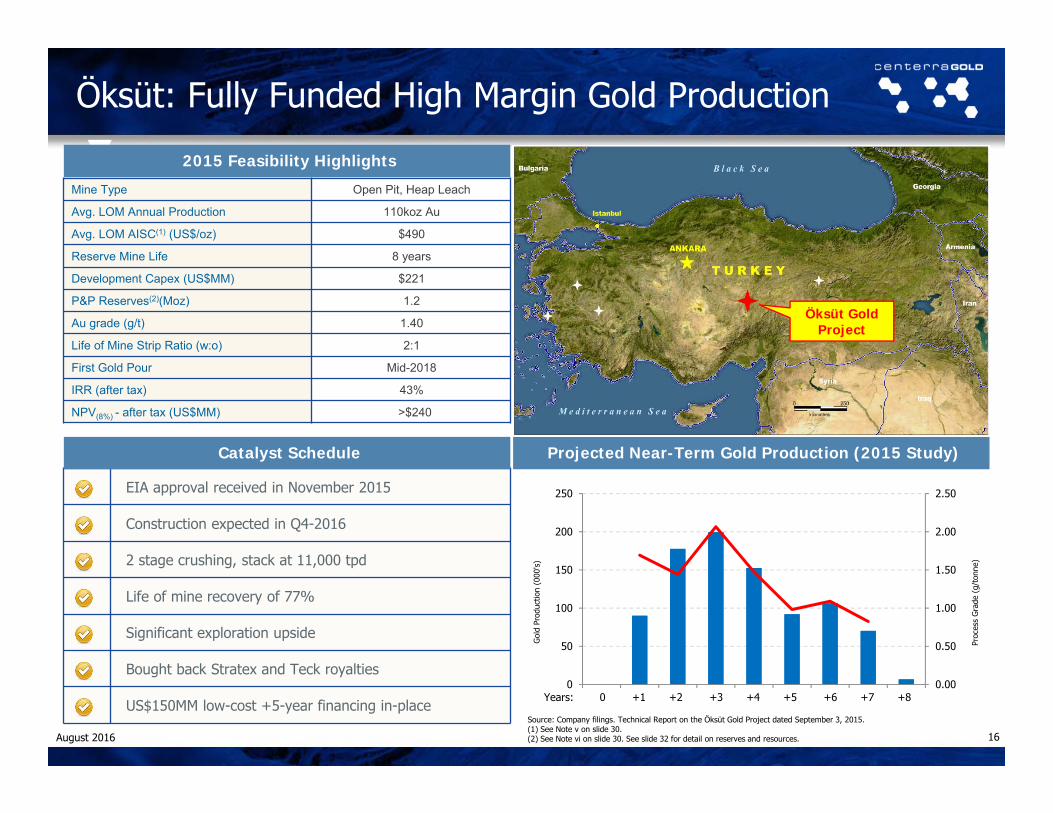
Öksüt: Fully Funded High Margin Gold Production
16
Mine Type Open Pit, Heap Leach
Avg. LOM Annual Production 110koz Au
Avg. LOM AISC(1) (US$/oz) $490
Reserve Mine Life 8 years
Development Capex (US$MM) $221
P&P Reserves(2)(Moz) 1.2
Au grade (g/t) 1.40
Life of Mine Strip Ratio (w:o) 2:1
First Gold Pour Mid-2018
IRR (after tax) 43%
NPV(8%) - after tax (US$MM) >$240
2015 Feasibility Highlights
EIA approval received in November 2015
Construction expected in Q4-2016
2 stage crushing, stack at 11,000 tpd
Life of mine recovery of 77%
Significant exploration upside
Bought back Stratex and Teck royalties
US$150MM low-cost +5-year financing in-place
Projected Near-Term Gold Production (2015 Study)
0.00
0.50
1.00
1.50
2.00
2.50
0
50
100
150
200
250
2016 2017 2018 2019 2020 2021 2022 2023 2024
Proc
ess
Gra
de (
g/to
nne)
Gol
d Pr
oduc
tion
(000
's)
Catalyst Schedule
Öksüt Gold Project
Source: Company filings. Technical Report on the Öksüt Gold Project dated September 3, 2015.(1) See Note v on slide 30.(2) See Note vi on slide 30. See slide 32 for detail on reserves and resources.
0 +1 +2 +3 +4 +5 +6 +7 +8Years:
August 2016

Gatsuurt: Gold Development Project
17
2015 Highlights
Boroo mill on care & maintenance awaiting Gatsuurt approval
Gatsuurt declared strategic January 2015
3% royalty (versus 34% ownership) approved by government
Investment development agreement negotiations underway
Potential production 12-18 months after approval
P&P Reserves(1) of 1.6M contained ounces of gold @ 2.9 g/tonne
Strip ratio of 6:1 and process recoveries in excess of 76%
Significant exploration upside
In-Place 5ktpd Processing Facility (Boroo)Boroo’s Historical Cumulative Net Cash Generation (US$MM)
(100)
0
100
200
300
400
500
600
2004 2005 2006 2007 2008 2009 2010 2011 2012 2013 2014
Source: Company filings.(1) See Note vii on slide 30. See slide 32 for detail on reserves and resources.
The Gatsuurt Project is ~90 km north of Ulaan Baatar
August 2016

Greenstone: One of Canada’s Largest Undeveloped Open Pit Gold Mines
18
Cornerstone Canadian Development Project
50:50 development partnership with Premier Gold
Open pit resources(1) (100%) in excess of 4Moz Au @ 1.47 g/t
Historic gold production of 4.12M oz (~1934-1970)
Large land package covers 337km2, good infrastructure
Significant exploration and underground resource potential
Bankable feasibility study expected end of October 2016
Ontario: Top Tier Mining Jurisdiction
Greenstone GoldProperty Greenstone Development Project
Location: Ontario, Canada
Geraldton
Beardmore
JellicoeBrookbank
HardrockViper
11
Beardmore – Geraldton Greenstone Belt +110 km
Brookbank Deposit
Hardrock Deposit
Source: Company filings.(1) See Note viii on slide 30.August 2016
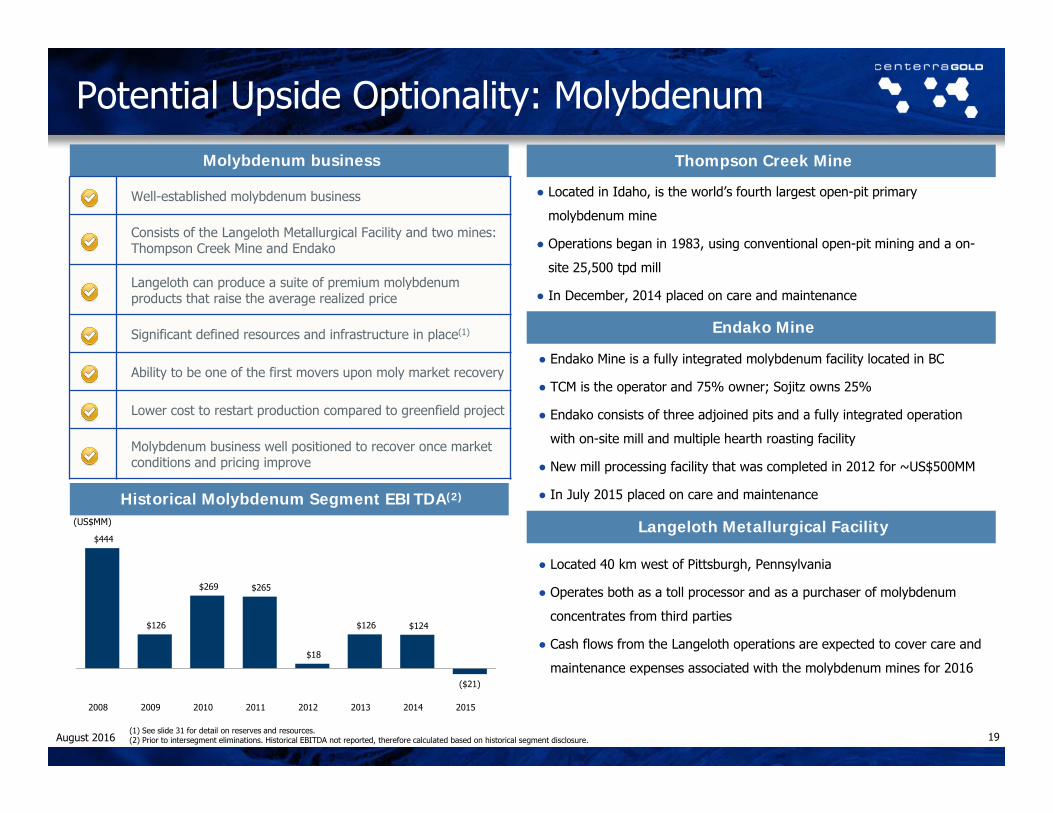
Potential Upside Optionality: Molybdenum
19
Molybdenum business
Well-established molybdenum business
Consists of the Langeloth Metallurgical Facility and two mines: Thompson Creek Mine and Endako
Langeloth can produce a suite of premium molybdenum products that raise the average realized price
Significant defined resources and infrastructure in place(1)
Ability to be one of the first movers upon moly market recovery
Lower cost to restart production compared to greenfield project
Molybdenum business well positioned to recover once market conditions and pricing improve
Thompson Creek Mine
Endako Mine
● Located in Idaho, is the world’s fourth largest open-pit primary
molybdenum mine
● Operations began in 1983, using conventional open-pit mining and a on-
site 25,500 tpd mill
● In December, 2014 placed on care and maintenance
● Endako Mine is a fully integrated molybdenum facility located in BC
● TCM is the operator and 75% owner; Sojitz owns 25%
● Endako consists of three adjoined pits and a fully integrated operation
with on-site mill and multiple hearth roasting facility
● New mill processing facility that was completed in 2012 for ~US$500MM
● In July 2015 placed on care and maintenance
Langeloth Metallurgical Facility
● Located 40 km west of Pittsburgh, Pennsylvania
● Operates both as a toll processor and as a purchaser of molybdenum
concentrates from third parties
● Cash flows from the Langeloth operations are expected to cover care and
maintenance expenses associated with the molybdenum mines for 2016
Historical Molybdenum Segment EBITDA(2)
$444
$126
$269 $265
$18
$126 $124
($21)
2008 2009 2010 2011 2012 2013 2014 2015
(US$MM)
(1) See slide 31 for detail on reserves and resources.(2) Prior to intersegment eliminations. Historical EBITDA not reported, therefore calculated based on historical segment disclosure.August 2016
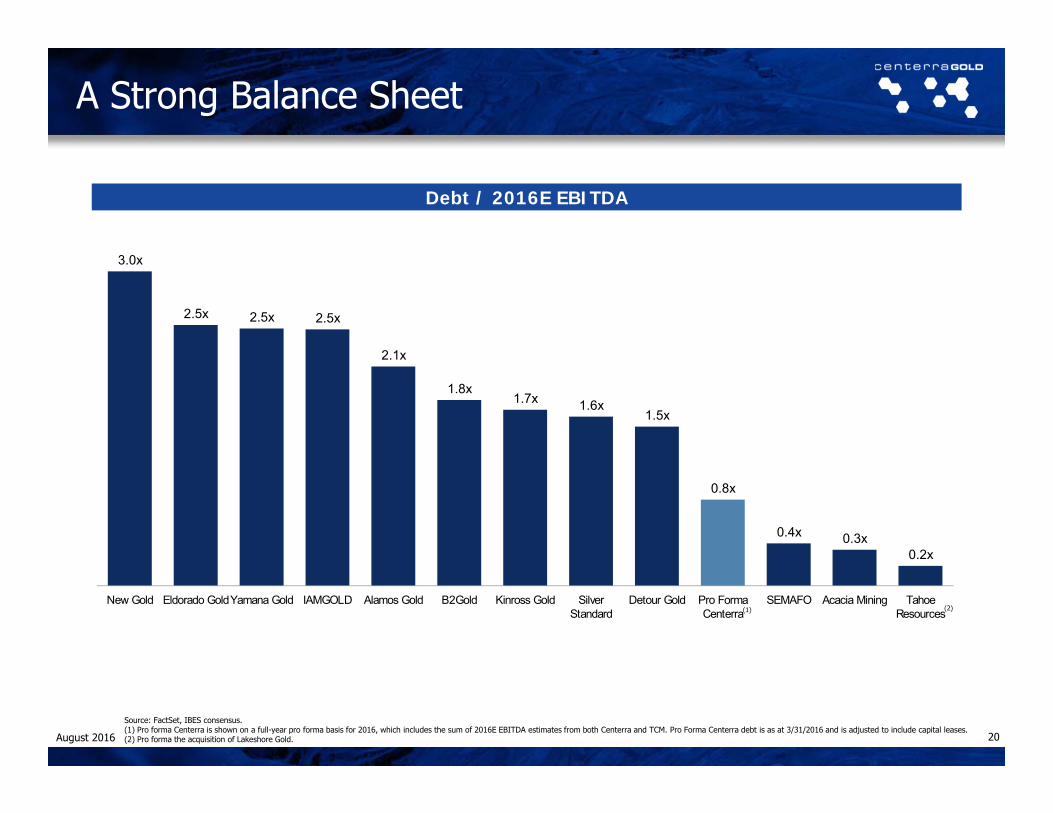
3.0x
2.5x 2.5x 2.5x
2.1x
1.8x 1.7x 1.6x
1.5x
0.8x
0.4x 0.3x 0.2x
New Gold Eldorado GoldYamana Gold IAMGOLD Alamos Gold B2Gold Kinross Gold SilverStandard
Detour Gold Pro FormaCenterra
SEMAFO Acacia Mining TahoeResources
A Strong Balance Sheet
20
Debt / 2016E EBITDA
Source: FactSet, IBES consensus.(1) Pro forma Centerra is shown on a full-year pro forma basis for 2016, which includes the sum of 2016E EBITDA estimates from both Centerra and TCM. Pro Forma Centerra debt is as at 3/31/2016 and is adjusted to include capital leases.(2) Pro forma the acquisition of Lakeshore Gold.
(1) (2)
August 2016

2,700
1,300
785 765 700
598 565 530 505
400 385 380
274 235
Kinross Gold Yamana Gold IAMGOLD Acacia Mining Pro FormaCenterra
EldoradoGold
Detour Gold B2Gold Centerra(Standalone)
TahoeResources
Alamos Gold New Gold SilverStandard
SEMAFO
740 798 805
845 890 910 923 940 955 960 965 975 975
1,050
SEMAFO Pro FormaCenterra
Yamana Gold New Gold Detour Gold B2Gold Centerra(Standalone)
Kinross Gold SilverStandard
EldoradoGold
Acacia Mining Alamos Gold TahoeResources
IAMGOLD
Strong low-cost operating platform
21
Source: Company filings, FactSet, Available street research.(1) Guidance based on the midpoint of the guidance range. Pro forma Centerra guidance is based on the addition of Centerra and Thompson Creek’s net gold guidance. For details, see note (i) on slide 30.(2) Pro forma is based on the addition of Centerra and Thompson Creek’s’ guidance. For details, see note (i) on slide 30. For other companies, AISCs based on broker estimates where no guidance estimates.(3) Silver Standard gold guidance is from Marigold and Seabee.(4) Eldorado guidance is not pro forma the sale of its Chinese assets.
P+P Gold Reserves (Moz)
Production guidance (Koz)(1) All-in sustaining costs (US$/oz) (2)
33.2
24.922.5
16.415.0 14.1
8.8 8.4 7.7 7.55.9
4.53.3 2.5
Kinross Gold Eldorado Gold Yamana Gold Detour Gold New Gold Pro FormaCenterra
Acacia Mining Centerra(Standalone)
IAMGOLD B2Gold Alamos Gold TahoeResources
SEMAFO Silver Standard
(3)(4)
August 2016

Appendices
Appendices:
22August 2016

Maximizing Gold Exposure: Amendment of Royal Gold Stream at Mount MilliganAs part of the Transaction, Centerra Gold has entered into a binding commitment letter with Royal Gold whereby, upon completion of the Transaction, Royal Gold will amend its gold stream at Mount Milligan from 52.25% to 35.00% in exchange for a 18.75% copper stream
Based on the midpoint of TCM’s 2016 production guidance (240-270 Koz of payable gold and 55-65 MMlbs of payable copper), Mount Milligan’s revenue split under the renegotiated stream agreement at current spot prices of US$1,351/oz(1) gold and US$2.21/lb(1) copper is approximately 70% revenue from gold, and 30% revenue from copper
Previous Amended
Percentage Gold Delivery
(% of mine production) 52.25% 35.00%
Gold Fixed Price (US$/oz) $435/oz $435/oz
Amendment to Royal Gold Stream Agreement
Percentage Copper Delivery
(% of mine production) N/A 18.75%
Copper Fixed Price(% of
prevailing Cu price)
N/A 15.00%
(1) Source: Bloomberg: London PM gold fix and LME copper spot at July 4, 2016. 23August 2016

Q2 Corporate Update
24
Safety – Institute a “Work Safe : Home Safe” Program Across the Company
Strong Gold Production of 97,724 Ounces at Kumtor
Competitive All-In Sustaining Cost1 of US$822 Per Ounce, US$768 Per Ounce at Kumtor
Favourably revised guidance, gold production 500-530koz, Company-wide AISC1 US$776-$824/oz
Net Earnings of US$2.9 Million ($0.01 Cents Per Share, basic)
Cash Flow From Operations of US$57.2 Million ($0.24 Cents Per Share, basic)
Peer Leading Net Cash2 Position of US$427 Million2
US$150 Million Project Financing Facility Established For Öksüt (Target Close Q3, 2016)
Received Forestry Usage Permit For Öksüt, Pastureland Permit In-Process
Transformational US$1.1 Billion Business Combination announced with Thompson Creek Metals
1. All-in sustaining costs per ounce sold is a non-GAAP measure and is discussed under “Non-GAAP Measures” in the Company’s MD&A dated July 26, 2016.2. Includes cash, cash equivalents and short-term investments, net of external debt.August 2016

2016 Revised Guidance
25
2016 Gold Production2016 All-in Sustaining
Costs1
(ounces) (per ounce sold)
Kumtor Mine 500,000 – 530,000 $717 – $759
Centerra 500,000 – 530,000 $776-$824
Projects 2016 Sustaining Capital1 2016 Growth Capital1
(millions) (millions)
Kumtor Mine $75 $22
Öksüt Project - $25
Gatsuurt Project - $6
Greenstone Property - $112
Corporate and other $1 -
Consolidated Total $76 $64
1 Non-GAAP measure discussed under “Non-GAAP Measures” in the Company’s MD&A dated July 26, 2016.
2 Greenstone growth capital excludes $13 million representing capitalized amount for Premier’s 50% share of the development expenditures related to the Greenstone Gold Property and funded by Centerra.
August 2016
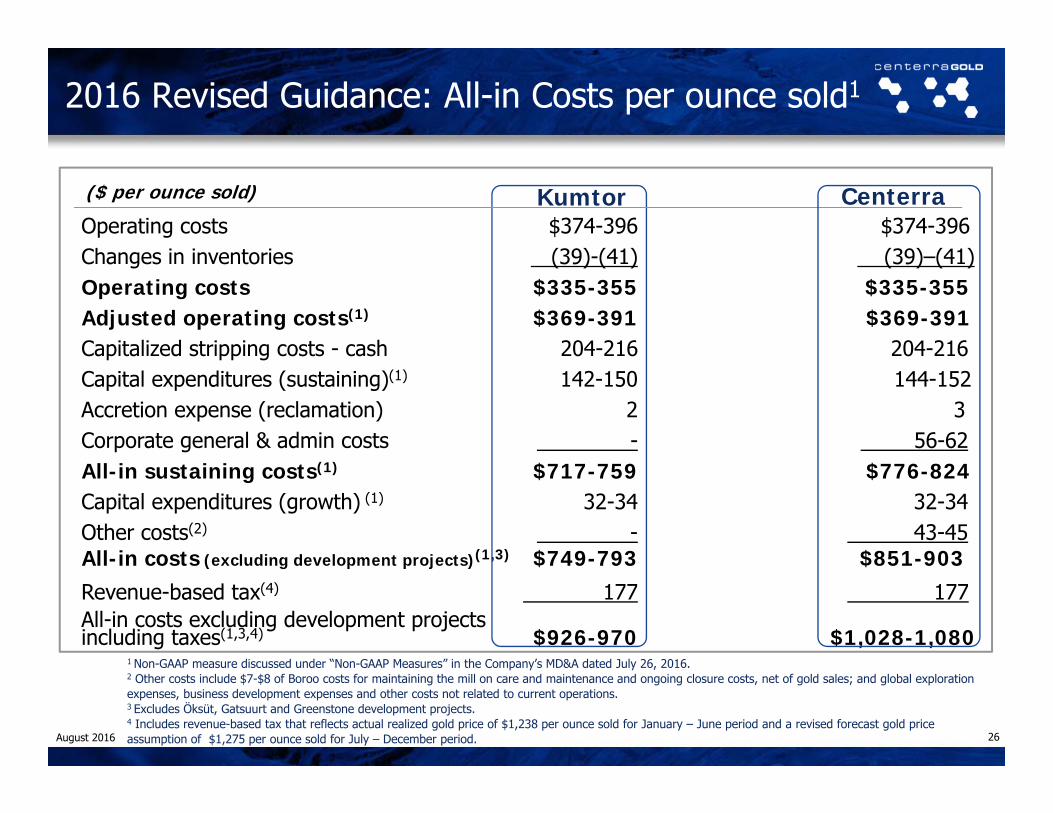
1 Non-GAAP measure discussed under “Non-GAAP Measures” in the Company’s MD&A dated July 26, 2016.2 Other costs include $7-$8 of Boroo costs for maintaining the mill on care and maintenance and ongoing closure costs, net of gold sales; and global exploration expenses, business development expenses and other costs not related to current operations.3 Excludes Öksüt, Gatsuurt and Greenstone development projects.4 Includes revenue-based tax that reflects actual realized gold price of $1,238 per ounce sold for January – June period and a revised forecast gold price assumption of $1,275 per ounce sold for July – December period.
Operating costs $374-396 $374-396Changes in inventories (39)-(41) (39)–(41)Operating costs $335-355 $335-355Adjusted operating costs(1) $369-391 $369-391Capitalized stripping costs - cash 204-216 204-216Capital expenditures (sustaining)(1) 142-150 144-152Accretion expense (reclamation) 2 3Corporate general & admin costs - 56-62All-in sustaining costs(1) $717-759 $776-824Capital expenditures (growth) (1) 32-34 32-34Other costs(2) - 43-45All-in costs (excluding development projects)(1,3) $749-793 $851-903Revenue-based tax(4) 177 177All-in costs excluding development projectsincluding taxes(1,3,4) $926-970 $1,028-1,080
2016 Revised Guidance: All-in Costs per ounce sold1
Kumtor Centerra($ per ounce sold)
26August 2016
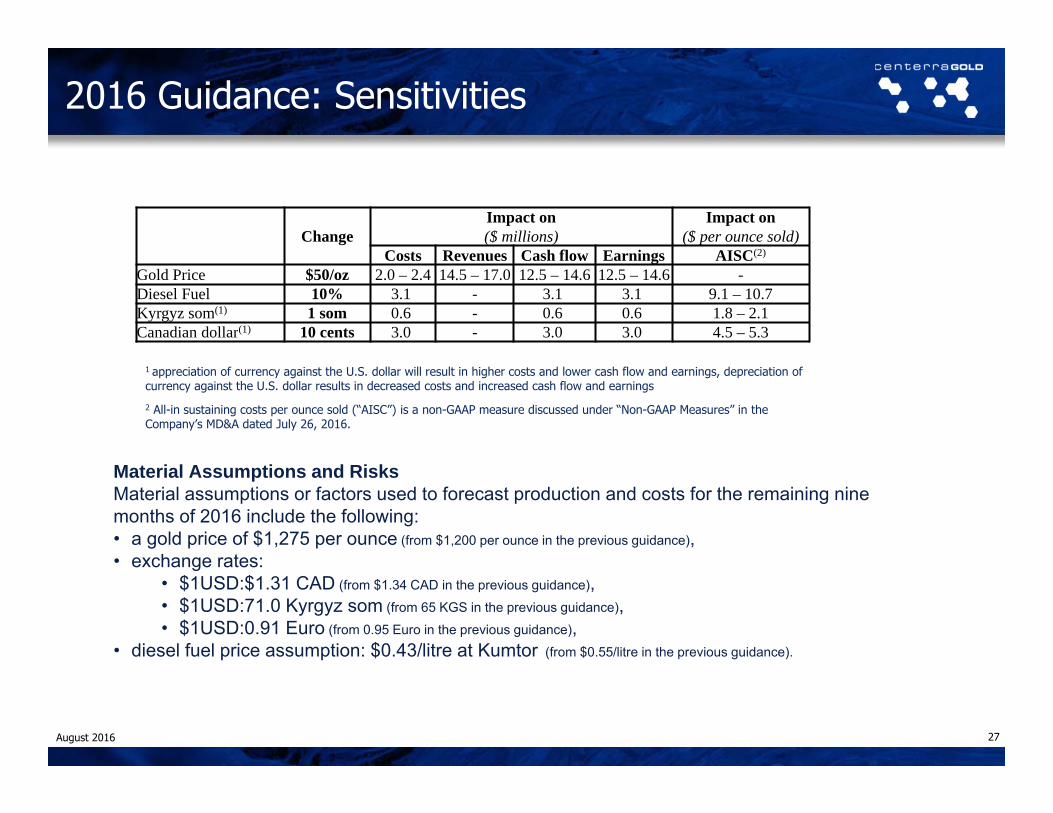
1 appreciation of currency against the U.S. dollar will result in higher costs and lower cash flow and earnings, depreciation of currency against the U.S. dollar results in decreased costs and increased cash flow and earnings
2 All-in sustaining costs per ounce sold (“AISC”) is a non-GAAP measure discussed under “Non-GAAP Measures” in the Company’s MD&A dated July 26, 2016.
2016 Guidance: Sensitivities
27
ChangeImpact on Impact on($ millions) ($ per ounce sold)
Costs Revenues Cash flow Earnings AISC(2)
Gold Price $50/oz 2.0 – 2.4 14.5 – 17.0 12.5 – 14.6 12.5 – 14.6 -Diesel Fuel 10% 3.1 - 3.1 3.1 9.1 – 10.7Kyrgyz som(1) 1 som 0.6 - 0.6 0.6 1.8 – 2.1Canadian dollar(1) 10 cents 3.0 - 3.0 3.0 4.5 – 5.3
Material Assumptions and RisksMaterial assumptions or factors used to forecast production and costs for the remaining nine months of 2016 include the following:• a gold price of $1,275 per ounce (from $1,200 per ounce in the previous guidance),• exchange rates:
• $1USD:$1.31 CAD (from $1.34 CAD in the previous guidance),• $1USD:71.0 Kyrgyz som (from 65 KGS in the previous guidance),• $1USD:0.91 Euro (from 0.95 Euro in the previous guidance),
• diesel fuel price assumption: $0.43/litre at Kumtor (from $0.55/litre in the previous guidance).
August 2016

Industry Experience Background
20 years• Appointed Chief Executive Officer in November, 2015
• Former Chief Executive Officer at AuRico Gold
25 years • Appointed President in November, 2015
• Joined Centerra in 2004
30 years• Appointed Chief Operating Officer in January, 2013
• Joined Centerra in 2004
18 years• Appointed Chief Financial Officer in April, 2016
• Joined Centerra in 2013
SCOTT PERRYChief Executive Officer
FRANK HERBERTPresident
GORDON REIDChief Operating Officer
Centerra: Senior Management
DARREN MILLMANChief Financial Officer
28August 2016

Board of Directors Background
STEPHEN A. LANG Chairman Appointed Director of Centerra’s Board, June 2008
BRUCE V. WALTER Vice Chair Appointed Director of Centerra’s Board, May 2008
SCOTT G. PERRY Director Appointed Director of Centerra’s Board, January 2016
RICHARD W. CONNOR Director Appointed Director of Centerra’s Board, June 2012
RAPHAEL A. GIRARD Director Appointed Director of Centerra’s Board, August 2010
EDUARD KUBATOV Director Appointed Director of Centerra’s Board, March 2016
NURLAN KYSHTOBAEV Director Appointed Director of Centerra’s Board, May 2016
MICHAEL S. PARRETT Director Appointed Director of Centerra’s Board, May 2014
SHERYL K. PRESSLER Director Appointed Director of Centerra’s Board, May 2008
TERRY V. ROGERS Director Appointed Director of Centerra’s Board, February 2003
BEKTUR SAGYNOV Director Appointed Director of Centerra’s Board, March 2016
Centerra: Directors
29August 2016

Notes to mineral properties slides:(i) Mount Milligan All-in sustaining cost (“AISC”) have been adjusted into metrics shown on a “per ounce of gold basis” based on existing TCM guidance. They have
been further adjusted for the expected change in the Gold Stream pricing. Shown net of byproduct credits. Adjusted operating costs, AISC, all-in costs and all-in costs - including taxes as well as sustaining capital, growth capital, average realized gold price per ounce and cost of sales per ounce sold are non-GAAP measures and are discussed under “Non-GAAP Measures” in the Company’s annual MD&A filed on SEDAR.(1)
(ii) The mineral reserve estimates for Mount Milligan Mine were prepared by Robert Clifford, Thompson Creek’s Director of Mine Engineering, who is a Qualified Person under NI 43-101. The mineral reserve estimates were prepared using an ultimate open pit design optimized at spot metal prices of $2.95/lb copper, $1,250/oz gold, an exchange rate of US$1.00/C$1.10, a cut-off grade of 0.176% copper equivalent and takes into consideration metallurgical recoveries, concentrate grades, transportation costs, smelter treatment charges and royalty and streaming arrangements in determining economic viability. The mineral reserve estimates are based on the cost assumptions included in the NI 43-101 technical report entitled "NI 43-101 Technical Report-Mount Milligan Mine-Northern Central British Columbia" dated January 21, 2015 and filed on SEDAR on January 21, 2015. Mill recoveries vary by rock type and region but average 85.0% copper and 71.5% gold. Anticipated losses resulting from beneficiation average approximately 4.5% copper and 2.5% gold.
(iii) Adjusted operating costs, all-in sustaining costs (AISC), all-in costs and all-in costs - including taxes as well as sustaining capital, growth capital, average realized gold price per ounce and cost of sales per ounce sold are non-GAAP measures and are discussed under “Non-GAAP Measures” in the Company’s annual MD&A filed on SEDAR.(1)
(iv) The mineral reserves at Kumtor have been estimated based on a gold price of US$1,200 per ounce, as at December 31, 2015. The open pit reserves and resources at Kumtor are estimated based on a cut-off grade of 0.85 grams of gold per tonne for the Central Pit and 1.0 grams of gold per tonne for the Southwest and Sarytor deposits. Open Pit resources at Kumtor are constrained by a pit shell developed using a gold price of US$1,450 per ounce. Mineral resources are in addition to reserves. Mineral resources do not have demonstrated economic viability. Further information including key assumptions, parameters and methods used to estimate mineral resources and reserves, as well as legal, political, environmental and other risks are described in Centerra’s2015 Annual Information Form dated March 31, 2016 filed on SEDAR.
(v) Adjusted operating costs, all-in sustaining costs (AISC), all-in costs and all-in costs - including taxes as well as sustaining capital, growth capital, average realized gold price per ounce and cost of sales per ounce sold are non-GAAP measures and are discussed under “Non-GAAP Measures” in the Company’s annual MD&A filed on SEDAR.(1)
(vi) The mineral reserves at Öksüt have been estimated based on a gold price of US$1,200 per ounce, as at December 31, 2015. The open pit reserves are estimated on a cut-off grade of 0.3 grams of gold per tonne. Further information including key assumptions, parameters and methods used to estimate mineral resources and reserves, as well as legal, political, environmental and other risks are described in the Technical Report on the Öksüt Gold Project dated September 3, 2015, Effective Date: June 30, 2015 filed on SEDAR.
(vii) The mineral reserves at Gatsuurt have been estimated based on a gold price of US$1,200 per ounce, as at December 31, 2015. The open pit reserves are estimated using a 1.4 grams of gold per tonne cut-off grade. Further information including key assumptions, parameters and methods used to estimate mineral resources and reserves, as well as legal, political, environmental and other risks are described in Centerra’s 2015 Annual Information Form dated March 31, 2016 filed on SEDAR.
(viii) As reported in Centerra Gold Inc. and Premier Gold Mines NI 43-101 Technical Report on the Trans-Canada Property (the “Greenstone” property), Issue Date: March 20, 2015, Effective Date: February 5, 2015 filed on SEDAR.
(1) See page 33.
Notes Regarding Mineral Properties
30August 2016

Thompson Creek: Reserves and Resources
31
Proven and Probable Gold and Copper Estimated Mineral Reserves at December 31, 2015 (1)
Property Category Tonnes Copper Grade Contained Copper Gold Grade Contained Gold(millions) (% Cu) (millions of lbs) (gram per tonne) (millions of oz)
Proven-Mine 271.9 0.198 1,185 0.416 3.64Proven-Stockpile 3.0 0.166 11 0.500 0.05Probable-Mine 231.5 0.194 989 0.269 2.00
Total Proven 274.9 0.197 1,196 0.417 3.69Probable 231.5 0.194 989 0.269 2.00
Proven+Probable 506.4 0.196 2,185 0.349 5.69
Estimated Measured and Indicated Copper Mineral Resources at December 31, 2015Measured Indicated Measured & Indicated
Property Tonnes Copper Grade Tonnes Copper Grade Tonnes Copper Grade(millions) (% Cu) (millions) (% Cu) (millions) (% Cu)
Mount Milligan (2) 40.8 0.13 77.7 0.17 118.5 0.16Berg Property (3) 53.3 0.48 452.7 0.28 506.0 0.30Total 2015 94.1 0.33 530.4 0.26 624.5 0.27
Estimated Measured and Indicated Gold Mineral Resources at December 31, 2015Measured Indicated Measured & Indicated
Property Tonnes Gold Grade Tonnes Gold Grade Tonnes Gold Grade(millions) (gram/tonne) (millions) (gram/tonne) (millions) (gram/tonne)
Mount Milligan (2) 40.8 0.465 77.7 0.244 118.5 0.32
Estimated Measured and Indicated Molybdenum Mineral Resources at December 31, 2015Measured Indicated Measured & Indicated
Property Tonnes Mo Grade Tonnes Mo Grade Tonnes Mo Grade(millions) (% Mo) (millions) (% Mo) (millions) (% Mo)
TC Mine (4) 34.3 0.077 31.7 0.068 66.0 0.073Endako Mine (4) 10.1 0.053 23.3 0.047 33.4 0.049Berg Property (3) 53.3 0.030 452.7 0.038 506.0 0.037 Total 2015 97.7 0.049 507.7 0.04 605.4 0.042:Estimated Measured and Indicated Silver Mineral Resources at December 31, 2015
Measured Indicated Measured & IndicatedProperty Tonnes Silver Grade Tonnes Silver Grade Tonnes Silver Grade
(millions) (gram/tonne) (millions) (gram/tonne) (millions) (gram/tonne)Berg Property (3) 53.3 4.5 452.7 3.7 506 3.8
Estimated Inferred Mineral Resources
Property Tonnes Copper Grade Gold Grade Molybdenum Grade Silver Grade(millions) (%) (gram/tonne) (%) (gram/tonne)
Mount Milligan (5) 8.8 0.15 0.32 --- ---TC Mine (6) 0.7 --- --- 0.035 ---Endako Mine (6) 2.2 --- --- 0.039 ---Berg Property (7) 144.6 0.23 --- 0.033 2.5
Mount Milligan
Thompson Creek 2015 Year‐End Gold Reserve and Resource Summary (as of December 31, 2015)
(1) The mineral reserve estimates for Mount Milligan Mine were prepared by Robert Clifford, Thompson Creek’s Director of Mine Engineering, who is a qualified person under NI 43-101. The mineral reserve estimates were prepared using an ultimate open pit design optimized at spot metal prices of US$2.95/lb copper, US$1,250/oz gold, an exchange rate of US$1.00/C$1.10, a cut-off grade of 0.176% copper equivalent and takes into consideration metallurgical recoveries, concentrate grades, transportation costs, smelter treatment charges and royalty and streaming arrangements in determining economic viability. The mineral reserve estimates are based on the cost assumptions included in the NI 43-101 technical report entitled "NI 43-101 Technical Report-Mount Milligan Mine-Northern Central British Columbia" dated January 21, 2015 and filed on SEDAR on January 21, 2015. Mill recoveries vary by rock type and region but average 85.0% copper and 71.5% gold. Anticipated losses resulting from beneficiation average approximately 4.5% copper and 2.5% gold.
(2) The mineral resource estimates, exclusive of mineral reserves, for Mount Milligan Mine were prepared by Mr. Clifford. The mineral resource estimates were tabulated within a conceptual open pit shell using spot metal prices of US$3.50/lb copper, US$1,500/oz gold, a cut-off grade of 0.176% copper equivalent, and takes into consideration metallurgical recoveries, concentrate grades, transportation costs, smelter treatment charges, and royalty and streaming arrangements. The mineral resource estimates are based on the cost and price assumptions included in a NI 43-101 technical report entitled "NI 43-101 Technical Report-Mount Milligan Mine-Northern Central British Columbia" dated January 21, 2015 and filed on SEDAR on January 21, 2015.
(3) The mineral resource estimate for the Berg property was approved by Mr. Clifford. The mineral resource estimate for the Berg property was prepared using a 0.30% copper equivalent cut-off, with copper equivalency defined using metal prices of US$1.60/lb copper, US$10.00/lb molybdenum, and US$10.00/oz silver, taking into account forecast metallurgical recoveries. Resources are reported to a maximum depth of 450 meters (1,476 feet) below surface.
(4) The mineral resource estimates for TC Mine and Endako Mine were prepared by the TC Mine and Endako Mine staff, respectively, under the supervision of Mr. Clifford, who approved the disclosure of the mineral resource estimate. The mineral resource estimates utilized a cut-off grade of 0.030% Mo and an average long-term molybdenum price of US$10.00 per pound. The mineral reserves previously reported proved to be uneconomic and have been re-allocated back as mineral resources and reported in the tables above.
(5) The inferred mineral resource estimates for Mount Milligan Mine were prepared by Mr. Clifford. The inferred mineral resource estimates were tabulated within a conceptual open pit shell using spot metal prices of US$3.50/lb copper, US$1,500/oz gold, a cut-off grade of 0.176% copper equivalent, and takes into consideration metallurgical recoveries, concentrate grades, transportation costs, smelter treatment charges, and royalty and streaming arrangements. The inferred mineral resource estimates are based on the cost and price assumptions included in a NI 43-101 technical report entitled "NI 43-101 Technical Report-Mount Milligan Mine-Northern Central British Columbia" dated January 21, 2015 and filed on SEDAR on January 21,
(6) The inferred mineral resource estimates for TC Mine and Endako Mine were prepared by the TC Mine and Endako Mine staff, respectively, under the supervision of Robert Clifford, Director of Mine Engineering, who is a Qualified Person under NI 43-101 and Robert Clifford has approved the disclosure of the mineral resource estimate. The inferred mineral resource estimates utilized a cut-off grade of 0.030% Mo and an average long-term molybdenum price of US$10.00 per pound.
(7) The inferred mineral resource estimate for the Berg property was approved by Robert Clifford, Director of Mine Engineering, who is a Qualified Person under NI 43-101. The inferred mineral resource estimate for the Berg property is reported using a 0.30% copper equivalent cut-off, with copper equivalency defined using metal prices of US$1.60/lb copper, US$10.00/lb molybdenum, and US$10.00/oz silver, taking into account forecast metallurgical recoveries. Resources are reported to a maximum depth of 450 meters (1476 feet) below surface.
August 2016
Centerra Gold Inc. 2015 Year‐End Gold Reserve and Resource Summary (as of December 31, 2015)
Centerra: Reserves and Resources
32
Grade Grade Grade
(g/t) (g/t) (g/t)
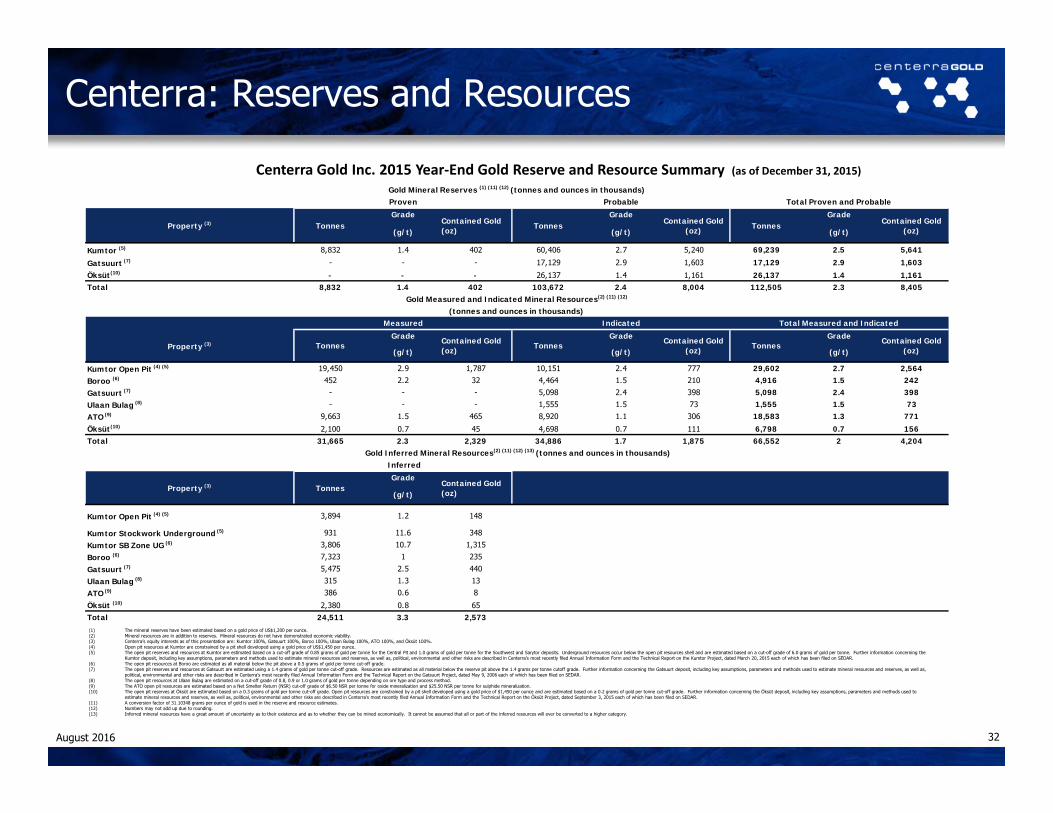
Kumtor (5) 8,832 1.4 402 60,406 2.7 5,240 69,239 2.5 5,641
Gatsuurt (7) - - - 17,129 2.9 1,603 17,129 2.9 1,603
Öksüt(10) - - - 26,137 1.4 1,161 26,137 1.4 1,161Total 8,832 1.4 402 103,672 2.4 8,004 112,505 2.3 8,405
Grade Grade Grade
(g/t) (g/t) (g/t)
Kumtor Open Pit (4) (5) 19,450 2.9 1,787 10,151 2.4 777 29,602 2.7 2,564
Boroo (6) 452 2.2 32 4,464 1.5 210 4,916 1.5 242
Gatsuurt (7) - - - 5,098 2.4 398 5,098 2.4 398
Ulaan Bulag (8) - - - 1,555 1.5 73 1,555 1.5 73
ATO (9) 9,663 1.5 465 8,920 1.1 306 18,583 1.3 771
Öksüt(10) 2,100 0.7 45 4,698 0.7 111 6,798 0.7 156Total 31,665 2.3 2,329 34,886 1.7 1,875 66,552 2 4,204
Grade
(g/t)
Kumtor Open Pit (4) (5) 3,894 1.2 148
Kumtor Stockwork Underground (5) 931 11.6 348
Kumtor SB Zone UG (6) 3,806 10.7 1,315
Boroo (6) 7,323 1 235
Gatsuurt (7) 5,475 2.5 440
Ulaan Bulag (8) 315 1.3 13
ATO (9) 386 0.6 8
Öksüt (10) 2,380 0.8 65Total 24,511 3.3 2,573
Gold Mineral Reserves (1) (11) (12) (tonnes and ounces in thousands)Proven Probable Total Proven and Probable
Property (3) Tonnes Contained Gold (oz) Tonnes Contained Gold
(oz) Tonnes
Contained Gold (oz) Tonnes
Contained Gold (oz)
Gold Measured and Indicated Mineral Resources(2) (11) (12)
(tonnes and ounces in thousands)Measured Indicated Total Measured and Indicated
Contained Gold (oz)
Gold Inferred Mineral Resources(2) (11) (12) (13) (tonnes and ounces in thousands) Inferred
Property (3) Tonnes Contained Gold (oz)
Property (3) Tonnes Contained Gold (oz) Tonnes
(1) The mineral reserves have been estimated based on a gold price of US$1,200 per ounce.(2) Mineral resources are in addition to reserves. Mineral resources do not have demonstrated economic viability.(3) Centerra’s equity interests as of this presentation are: Kumtor 100%, Gatsuurt 100%, Boroo 100%, Ulaan Bulag 100%, ATO 100%, and Öksüt 100%.(4) Open pit resources at Kumtor are constrained by a pit shell developed using a gold price of US$1,450 per ounce.(5) The open pit reserves and resources at Kumtor are estimated based on a cut-off grade of 0.85 grams of gold per tonne for the Central Pit and 1.0 grams of gold per tonne for the Southwest and Sarytor deposits. Underground resources occur below the open pit resources shell and are estimated based on a cut-off grade of 6.0 grams of gold per tonne. Further information concerning the
Kumtor deposit, including key assumptions, parameters and methods used to estimate mineral resources and reserves, as well as, political, environmental and other risks are described in Centerra’s most recently filed Annual Information Form and the Technical Report on the Kumtor Project, dated March 20, 2015 each of which has been filed on SEDAR.(6) The open pit resources at Boroo are estimated as all material below the pit above a 0.5 grams of gold per tonne cut-off grade.(7) The open pit reserves and resources at Gatsuurt are estimated using a 1.4 grams of gold per tonne cut-off grade. Resources are estimated as all material below the reserve pit above the 1.4 grams per tonne cutoff grade. Further information concerning the Gatsuurt deposit, including key assumptions, parameters and methods used to estimate mineral resources and reserves, as well as,
political, environmental and other risks are described in Centerra’s most recently filed Annual Information Form and the Technical Report on the Gatsuurt Project, dated May 9, 2006 each of which has been filed on SEDAR.(8) The open pit resources at Ulaan Bulag are estimated on a cut-off grade of 0.8, 0.9 or 1.0 grams of gold per tonne depending on ore type and process method.(9) The ATO open pit resources are estimated based on a Net Smelter Return (NSR) cut-off grade of $6.50 NSR per tonne for oxide mineralization and $25.50 NSR per tonne for sulphide mineralization. (10) The open pit reserves at Öksüt are estimated based on a 0.3 grams of gold per tonne cut-off grade. Open pit resources are constrained by a pit shell developed using a gold price of $1,450 per ounce and are estimated based on a 0.2 grams of gold per tonne cut-off grade. Further information concerning the Öksüt deposit, including key assumptions, parameters and methods used to
estimate mineral resources and reserves, as well as, political, environmental and other risks are described in Centerra’s most recently filed Annual Information Form and the Technical Report on the Öksüt Project, dated September 3, 2015 each of which has been filed on SEDAR.(11) A conversion factor of 31.10348 grams per ounce of gold is used in the reserve and resource estimates. (12) Numbers may not add up due to rounding.(13) Inferred mineral resources have a great amount of uncertainty as to their existence and as to whether they can be mined economically. It cannot be assumed that all or part of the inferred resources will ever be converted to a higher category.
August 2016

Non-GAAP Financial Measures
33
The information in this presentation includes the following non-IFRS financial measure: all-in sustaining costs. This financial measure does not have any standardized meaning prescribed by IFRS and is therefore unlikely to be comparable to similar measures presented by other issuers, even as compared to other issuers who may also be applying the World Gold Council ("WGC") guidelines, which can be found at http://www.gold.org. Management of Centerra believes that the use of this non-IFRS measure will assist analysts, investors and other stakeholders of the Company in understanding the costs associated with producing gold, understanding the economics of gold mining, assessing the Company's operating performance, the Company's ability to generate free cash flow from current operations and to generate free cash flow on an overall Company basis, and for planning and forecasting of future periods. However, the measure does have limitations as an analytical tool as it may be influenced by the point in the life cycle of a specific mine and the level of additional exploration or expenditures a company has to make to fully develop its properties. Accordingly, these non-IFRS measures should not be considered in isolation, or as a substitute for, analysis of the Company's results as reported under IFRS. A reconciliation of the non-IFRS measure presented in this presentation is contained in the Company's most recently filed annual MD&A, which is available on SEDAR at www.sedar.com.
August 2016
Other Important Disclaimers
34
A final short form prospectus containing important information relating to the securities described in this document has been filed with the securities regulatory authorities in certain of the provinces and territories of Canada. This document does not provide full disclosure of all material facts relating to the securities offered. Investors should read the final short form prospectus and any amendment, for disclosure of those facts, especially risk factors relating to the securities offered, before making an investment decision.
This presentation is not intended for distribution to, or use by, any person or entity in any jurisdiction or country where such distribution or use would be contrary to law or regulation. In particular, this presentation and the information contained herein does not constitute an offer for sale or subscription of, or solicitation of any offer to buy or subscribe for, any securities in the United States and this presentation may not be distributed, except (i) to persons reasonably believed to be qualified institutional buyers as defined in Rule 144A under the United States Securities Act of 1933, as amended (the “Securities Act”), or (ii) to persons who are outside the United States in accordance with Regulation S under the Securities Act (and, if investors are resident in a member state of the European Economic Area, a qualified investor (within the meaning of Article 2(i)e of the Prospective Directive (Directive 2003/71/EC) and any relevant implementing measure in each member state of the European Economic Area). The securities proposed to be offered have not been, and will not be, registered under the Securities Act or the securities laws of any state of the United States or any other jurisdiction and may not be offered or sold in the United States except pursuant to an exemption from, or in a transaction not subject to, the registration requirements of the Securities Act and applicable state or local securities laws. There will be no public offer of securities in the United States.
This document includes forward-looking statements (which includes “forward-looking information” within the meaning of applicable Canadian and U.S. securities laws). These forward-looking statements are not based on historical facts but instead reflect Centerra’s or Thompson Creek’s respective management’s expectations, estimates or projections concerning future results or events. These forward-looking statements are often identified by the words “may,” “might,” “believes,” “thinks,” “anticipates,” “plans,” “expects,” “intends” or similar expressions and include statements regarding (1) expectations regarding whether the proposed transactions, including the Arrangement, the related equity and debt financing of Centerra and the redemption of Thompson Creek’s secured and unsecured notes, will be consummated, including whether conditions to the consummation of the proposed transactions will be satisfied, or the timing for completing the proposed transactions, (2) expectations for the effects of the transactions or the ability of the combined company to successfully achieve business objectives, including integrating the companies or the effects of unexpected costs, liabilities or delays, (3) the potential benefits and synergies of the proposed transactions, (4) expectations regarding the amendments to Thompson Creek’s streaming arrangement with Royal Gold, and (5) expectations for other economic, business, and/or competitive factors. Although Centerra and Thompson Creek believe that the expectations reflected in such forward-looking statements are reasonable, such statements involve risks and uncertainties, and undue reliance should not be placed on such statements, as unknown or unpredictable factors could have material adverse effects on future results, performance or achievements of the combined company. Among the key factors that could cause actual results to differ materially from those projected in the forward-looking statements include the following: the ability to consummate the proposed transactions; the ability to obtain requisite regulatory and shareholder approvals and the satisfaction of other conditions to the consummation of the proposed transactions on the proposed terms and schedule; the ability of Centerra and Thompson Creek to successfully integrate their respective operations and employees and realize synergies and cost savings at the times, and to the extent, anticipated; the potential impact of the announcement or consummation of the proposed transactions on relationships, including with regulatory bodies, employees, suppliers, customers and competitors; changes in general economic, business and political conditions, including changes in the financial markets; changes in applicable laws; significant competition that Centerra and Thompson Creek face; compliance with extensive government regulation; and the diversion of management time on the proposed transactions. These forward-looking statements may be affected by risks and uncertainties in the business of Centerra and Thompson Creek and market conditions. This information is qualified in its entirety by cautionary statements and risk factor disclosure contained in filings made by Centerra and Thompson Creek’s filings with the Canadian securities regulators, including Centerra’s annual information form, financial statements and related MD&A for its financial year ended December 31, 2015 and its interim financial reports and related MD&A, as well as Thompson Creek’s quarterly reports on Form 10-Q and its annual report on Form 10-K for the year ended December 31, 2015, as well as Thompson Creek’s filings with the U.S. Securities and Exchange Commission (the “SEC”). Centerra and Thompson Creek wish to caution readers that certain important factors may have affected and could in the future affect their actual results and could cause their actual results for subsequent periods to differ materially from those expressed in any forward-looking statement made by or on behalf of Centerra or Thompson Creek. Neither Thompson Creek nor Centerra undertakes any obligation to update forward-looking statements to reflect events or circumstances after the date hereof, except as may be specifically required by applicable securities laws.
No Offer or SolicitationThis communication does not constitute an offer to sell or the solicitation of an offer to buy any securities, or a solicitation of any vote or approval, nor shall there be any sale of securities in any jurisdiction in which such offer, solicitation or sale would be unlawful prior to registration or qualification under the securities laws of any such jurisdiction.
Additional Information and Where to Find ItIn connection with the proposed transactions, Thompson Creek intends to file with the SEC a proxy statement in respect of the meeting of its shareholders to approve the Arrangement, and other relevant documents to be mailed by Thompson Creek to its shareholders in connection with the Arrangement. Thompson Creek’s proxy statement will also be filed with the Canadian securities regulators. WE URGE INVESTORS AND SECURITY HOLDERS TO READ THE PROXY STATEMENT AND ANY OTHER RELEVANT DOCUMENTS WHEN THEY BECOME AVAILABLE, BECAUSE THEY WILL CONTAIN IMPORTANT INFORMATION about Thompson Creek, Centerra and the proposed transactions. Investors and security holders will be able to obtain these materials (when they are available) and other documents filed with the SEC and the Canadian securities regulators free of charge at the SEC’s website, www.sec.gov and at the System for Electronic Document Analysis and Retrieval (SEDAR) maintained by the Canadian Securities Administrators at www.sedar.com. In addition, a copy of Thompson Creek’s proxy statement (when it becomes available) may be obtained free of charge from Thompson Creek’s investor relations website at http://www.thompsoncreekmetals.com. Investors and security holders may also read and copy any reports, statements and other information filed by Thompson Creek, with the SEC, at the SEC public reference room at 100 F Street, N.E., Washington, D.C. 20549. Please call the SEC at 1-800-SEC-0330 or visit the SEC’s website for further information on its public reference room.
August 2016


![Investor Update [Company Update]](https://img.dokumen.tips/doc/110x75/577ca7aa1a28abea748c8178/investor-update-company-update-578a5bfde230f.jpg)

![Updates on Investor Update [Company Update]](https://img.dokumen.tips/doc/110x75/577cb4961a28aba7118c90ad/updates-on-investor-update-company-update.jpg)

![Investor Update/ Presentation [Company Update]](https://img.dokumen.tips/doc/110x75/577ca57b1a28abea748b8d65/investor-update-presentation-company-update.jpg)


![Investor Update - March 2016 [Company Update]](https://img.dokumen.tips/doc/110x75/577c852e1a28abe054bc09a3/investor-update-march-2016-company-update.jpg)


![Investor Update Q1 FY16 [Company Update]](https://img.dokumen.tips/doc/110x75/577cb41b1a28aba7118c4de4/investor-update-q1-fy16-company-update.jpg)