Embed Size (px)
Citation preview

Investor Roadshow
June 2014

Disclaimer and important notice
This presentation contains forward looking statements that are subject to risk factors associated with the oil and gas industry. It is believed that the expectations reflected in these statements are reasonable, but they may be affected by a range of variables which could cause actual results or trends to differ materially, including but not limited to: price fluctuations, actual demand, currency fluctuations, geotechnical factors, drilling and production results, gas commercialisation, development progress, operating results, engineering estimates, reserve estimates, loss of market, industry competition, environmental risks, physical risks, legislative, fiscal and regulatory developments, economic and financial markets conditions in various countries, approvals and cost estimates.
All references to dollars, cents or $ in this document are to Australian currency, unless otherwise stated. All references to project completion percentages are on a value of work done basis, unless otherwise stated.
This presentation refers to estimates of petroleum reserves and contingent resources contained in Santos’ Annual Reserves Statement released to the ASX on 21 February 2014 (Annual Reserves Statement). Santos confirms that it is not aware of any new information or data that materially affects the information included in the Annual Reserves Statement and that all the material assumptions and technical parameters underpinning the estimates in the Annual Reserves Statement continue to apply and have not materially changed.
The estimates of petroleum reserves and contingent resources contained in this presentation are as at 31 December 2013. Santos prepares its petroleum reserves and contingent resources estimates in accordance with the Petroleum Resources Management System (PRMS) sponsored by the Society of Petroleum Engineers (SPE). Unless otherwise stated, all references to petroleum reserves and contingent resources quantities in this presentation are Santos’ net share. Reference points for Santos’ petroleum reserves and contingent resources and production are defined points within Santos’ operations where normal exploration and production business ceases, and quantities of produced product are measured under defined conditions prior to custody transfer. Fuel, flare and vent consumed to the reference points are excluded. Petroleum reserves and contingent resources are aggregated by arithmetic summation by category and as a result, proved reserves may be a very conservative estimate due to the portfolio effects of arithmetic summation. Petroleum reserves and contingent resources are typically prepared by deterministic methods with support from probabilistic methods. Conversion factors: 1PJ of sales gas and ethane equals 171,937 boe; 1 tonne of LPG equals 8.458 boe; 1 barrel of condensate equals 0.935 boe; 1 barrel of crude oil equals 1 boe.
INVESTOR ROADSHOW - JUNE 2014 2 |

Santos overview
Australia’s leading domestic gas producer
2013 production 140,000 boe/d (70% gas/30% liquids)
Top-20 Australian Securities Exchange listed company
Market capitalisation $14 billion (May 2014)
A leading energy company in Australia and Asia
INVESTOR ROADSHOW - JUNE 2014 3 |
Proved reserves 620 mmboe
Proved plus probable reserves
1,368 mmboe
2C Contingent resources 1,869 mmboe
2013 production 51 mmboe
Three-year organic reserve replacement ratio
102%
boe/d: barrels of oil equivalent per day mmboe: million barrels of oil equivalent
Otway
Phu Khanh
Nam Con Son
South Sumatra Papuan
Carnarvon
Browse
Timor Sea Bonaparte
Amadeus
Cooper Surat/Bowen
Gippsland
Narrabri
East Java
Bay of Bengal
McArthur
Santos assets
West Natuna
Bight

Our strategy Strong LNG project delivery positions Santos to achieve 80 to 90 mmboe of production by 2020
INVESTOR ROADSHOW - JUNE 2014 4 |
Growing Cooper Basin gas capacity to meet higher demand and capture higher prices
High margin Western Australian business performing strongly
Exploration success
First LNG production from PNG LNG in April 2014, ahead of schedule
GLNG over 80% complete and on track for first LNG in 2015
Peluang project delivered in March 2014 on budget and ahead of schedule
Dua project in Vietnam on track for first oil in coming weeks
Exploration drilling underway in PNG and Vietnam
ASIA LNG AUSTRALIA

Eastern Australia gas market transformation
Tripling of gas demand creating market tightness
Recent east coast gas contracts >$8/GJ
New sources of gas required in 2015-2020 to meet supply challenge
Santos well placed to meet increased east coast gas demand with over 4,600 PJ of net 2P reserves, 6,700 PJ of 2C resources and existing infrastructure
Additional supply is required to meet increased demand and Santos well placed to benefit
INVESTOR ROADSHOW - JUNE 2014 5 |
Accelerating Cooper Basin supply
Narrabri Gas Project progressing
Encouraging further unconventional exploration
Increasing infrastructure, transport and processing capability
0
500
1,000
1,500
2,000
2,500
2013 2015 2017 2019 2021 2023 2025
APLNG
GLNG
QCLNG
Power Gen
Retail, C&I
Eastern Australia gas demand (PJ)
x3
Santos asset footprint
Cooper Basin
Surat/Bowen
Narrabri
Otway/Gippsland

Increasing Cooper Basin gas production
Targeting three key areas during 2014-16 enabling cost efficiencies from increased scale
INVESTOR ROADSHOW - JUNE 2014 6 |
Innamincka
Ballera
Jackson
Moomba
Santos acreage
Gas field
Oil field
Gas pipeline
Oil pipeline
2 rig, pad development focus
High deliverability
~70 wells
Moomba Big Lake
SWQ Unit
Western Flank
Extending infrastructure to commercialise resource
~50 wells
High liquids, high value program
Includes Drillsearch farm-in
~100 wells

Mount Isa
Tennant Creek
Darwin
Alice Springs
Moomba Plant
Gladstone
Brisbane
Wallumbilla Ballera Plant
Australian shale Cooper and McArthur Basins have some key technical attributes comparable to successful US shale basins
INVESTOR ROADSHOW - JUNE 2014 7 |
Organic matter TOC wt%
Mineralogy Non-clay content %
Hydrocarbon content mmboe/km2
Gas Liquids Source: EIA 2011, Warren et al 1998, Ryder Scott
McArthur Basin
Cooper Basin
Eagle Ford
Barnett
McArthur
Cooper

Cooper Basin unconventional exploration program
Building knowledge and technological capacity to ‘crack the code’; two shale wells now producing
INVESTOR ROADSHOW - JUNE 2014 8 |
Moomba 193-H well
Moomba 193-H
Moomba 192
Confirmed prospective resource through coring, logs and other analysis
Proved the Basin Centre Gas accumulation in the Nappamerri Trough; over 1,000 metres of gas saturated rock
Proved flow from all unconventional lithologies - tight sand, shale and deep coal
─ Moomba-194 vertical well recorded a peak flow of 3.1 mmscf/day and is now on line
Drilled and fracked a horizontal well in a shale target and achieved flow
─ 550 metre horizontal section drilled in Roswell-2H and following five frac stages flowed at a rate of 0.75 mmscf/day
Projects underway to improve flow rates through more frac stages and better production per stage
─ Utilising fracture diagnostics from Roswell 2H – micro seismic and flowback tracer surveys
─ Moomba 193-H, 10 frac stages placed

Santos’ LNG portfolio Strong project delivery and performance supportive of backfill and expansion opportunities
INVESTOR ROADSHOW - JUNE 2014 9 |
Producing
Under construction
PNG LNG 13.5% equity
6.9 mtpa plant capacity
6.6 mtpa contracted to 2034
Darwin LNG Government environmental
approval in place for up to 10
mtpa
GLNG 30% equity (operated)
7.8 mtpa plant capacity
7.2 mtpa contracted to 2035
Darwin LNG 11.5% equity
3.7 mtpa plant capacity
Fully contracted to 2022
Growth opportunities
PNG LNG Hides 3P potential within base
project
Hides Deep (Santos 24%)

-
50
100
150
200
250
300
350
400
2010 2015 2020 2025 2030
Strong Asian demand for LNG
Large opportunity exists for new projects to supply into the Asian market
INVESTOR ROADSHOW - JUNE 2014 10 |
Source: Wood Mackenzie, LNG supply represents contracted volumes and potential contract roll-overs from operating and under construction projects.
mtpa
144 mtpa
225 mtpa
Contracted Asian LNG supply
Asia leads global LNG demand with LNG forecast to meet over 50% of Asia’s gas needs
− Asian LNG demand grows at CAGR of 5.4%
− By 2030, over 70% of global LNG demand comes from Asia
Large opportunity for new LNG supply
− Over 140 mtpa of uncontracted demand by 2025 (~ 35 new LNG trains)
− Over 220 mtpa of uncontracted demand by 2030 (~ 55 new LNG
trains)
Asian LNG supply and demand

Global LNG demand vs US LNG in 2025
Constraints on US LNG exports
─ Buyer appetite for diversity of supply
─ Not all US LNG projects will secure financing
─ LNG plant constructions and labour constraints
─ Potential regulatory constraints on upstream gas supply
─ Regulatory approvals
US LNG alone will not fill the gap
INVESTOR ROADSHOW - JUNE 2014 11 |
Source: Wood Mackenzie, Contracted supply and contract rollovers are for operational and under construction plants, includes SPAs, MOUs, and HOAs
mtpa
0
100
200
300
400
500
2025 US LNG
160
300
US LNG
~40-60 mtpa
Contestable market
Contracted supply and contract rollovers
~100 mtpa

US LNG pricing Portfolio players and trading houses dominate US LNG off-take with higher pricing
INVESTOR ROADSHOW - JUNE 2014 12 |
Sabine Pass LNG pricing - 2012
Spot
Portfolio player pricing terms for resale - 2013
0
2
4
6
8
10
12
14
16
2020 Forecast +15% HH Liquefaction Shipping(Assumed)
0
2
4
6
8
10
12
14
16
2020 Forecast +25% HH Liquefaction & Shipping
6-7
3
3
6-7
1.6
6.5
$14.6/mmBtu
$13.5/mmBtu
US$/mmBtu US$/mmBtu
Henry Hub Henry Hub
Source: PIRA, Poten & Partners, PFC Energy
1 1.6
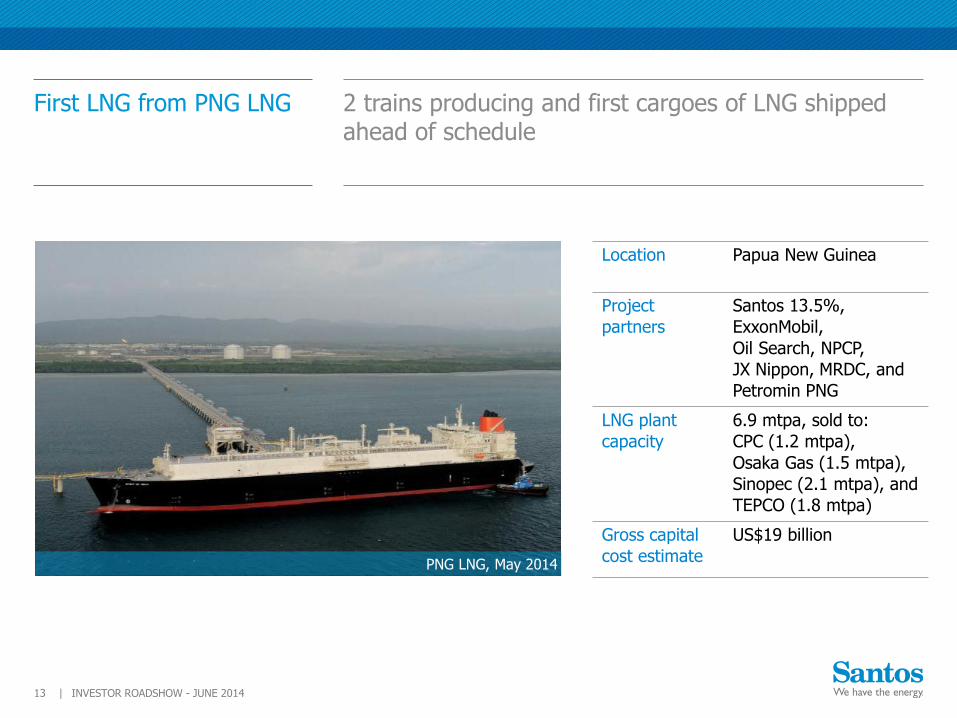
First LNG from PNG LNG
2 trains producing and first cargoes of LNG shipped ahead of schedule
PNG LNG, May 2014
INVESTOR ROADSHOW - JUNE 2014 13 |
Location Papua New Guinea
Project
partners
Santos 13.5%,
ExxonMobil,
Oil Search, NPCP,
JX Nippon, MRDC, and
Petromin PNG
LNG plant
capacity
6.9 mtpa, sold to:
CPC (1.2 mtpa),
Osaka Gas (1.5 mtpa),
Sinopec (2.1 mtpa), and
TEPCO (1.8 mtpa)
Gross capital
cost estimate
US$19 billion

Koi lange
PNG LNG potential expansion
Hides 3P potential within base project
Hides Deep to be spudded in late-2014
─ Exploration prospect below the existing Hides field
─ Well constrained anticline approximately 700 metres beneath the proven Toro reservoir
Existing infrastructure can support potential future expansion. As an owner of the foundation project infrastructure, Santos is well placed
Hides Deep seismic transect
INVESTOR ROADSHOW - JUNE 2014 14 |
Hides Deep SW NE

GLNG project summary The GLNG project is over 80% complete and on track for first LNG in 2015
INVESTOR ROADSHOW - JUNE 2014 15 |
Location Queensland, Australia
Project
partners
Santos (30% and operator), PETRONAS, Total
and KOGAS
LNG plant
capacity
7.8 mtpa of LNG; 7.2 mtpa has been sold to
PETRONAS and KOGAS
Gross capital
cost estimate
US$18.5 billion1 from FID to the end of 2015
when the second train is expected to be
ready for start-up
LNG train
ramp-up Train 1 first LNG expected in 2015; LNG production expected to ramp-up over 3-6 months
Train 2 first LNG expected 6-9 months after train 1; LNG production expected to ramp-up over 2-3 years
1 Based on foreign exchange rates which are consistent with the assumptions used at FID (A$/US$ 0.87 average over 2011-15).
GLNG tanks and jetty, May 2014

0
5,000
10,000
15,000
20,000
25,000
0
5
10
15
20
25
Fairview well performance
INVESTOR ROADSHOW - JUNE 2014 16 |
Fairview well performance as at 31 May 2014 183 wells connected
Optimum gas capacity (TJ/day)
Optimum water capacity (bbl/day)
Current average water capacity 425 bbls/day
Performance of Fairview wells continues to exceed expectations – average gas capacity of 2.2 TJ/day per well
Current average gas capacity 2.2 TJ/day
Reservoir performance better than expected
Total gross field well capacity 400 TJ/day at end of May
Forecast gross field well capacity ~560 TJ/day by end of 2015
Recent capacity testing on FV-183 and FV-247 wells showed optimum gas capacities >20 TJ/day per well

0
500
1,000
1,500
0.0
0.5
1.0
1.5
Roma well performance Roma wells online and dewatering, supporting individual well capacity of 0.5 TJ/day
INVESTOR ROADSHOW - JUNE 2014 17 |
Roma well performance as at 31 May 2014
Optimum gas capacity (TJ/day)
Optimum water capacity (bbl/day)
Current average water capacity 350 bbls/day
52 development wells online:
− 22 development wells that are dewatering into the Roma Hub 2 facilities
− 18 wells that are undergoing commissioning
− 12 dewatering to local facilities prior to connection
Additional 23 pilot wells online to assess coal productivity in potential future development areas

Drilling and completions Continuing to drive down well costs
INVESTOR ROADSHOW - JUNE 2014 18 |
Saxon 186 rig in the Fairview field
Over 560 wells drilled since FID
Over 30% reduction in drilling and completion costs per well since FID
─ Average 2013 D&C cost of $1.35 million per development well (30% wells drilled in Fairview, 70% drilled in Roma)
Current fleet of 6 drilling rigs and 4 completion rigs
2014 program focuses on Fairview field (80% Fairview, 20% Roma)
Expect to drill ~300 wells over 2014-15
Expect to drill 200-300 wells per annum over 2016-20 and ~200 wells per annum in 2021+
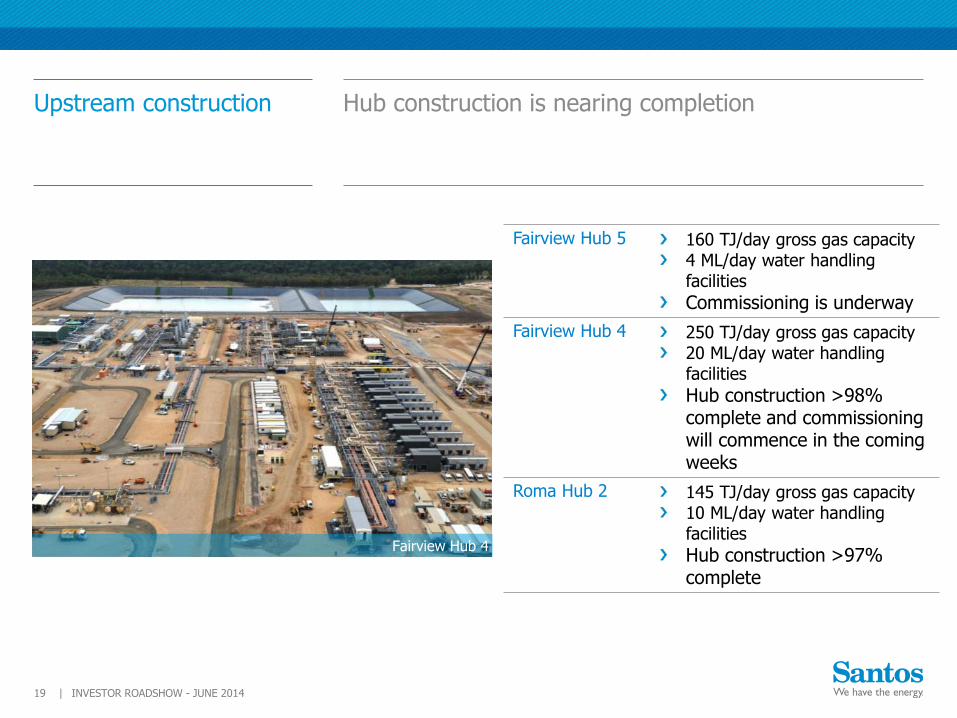
Upstream construction Hub construction is nearing completion
Fairview Hub 4
INVESTOR ROADSHOW - JUNE 2014 19 |
Fairview Hub 5 160 TJ/day gross gas capacity 4 ML/day water handling facilities
Commissioning is underway
Fairview Hub 4 250 TJ/day gross gas capacity 20 ML/day water handling facilities
Hub construction >98% complete and commissioning will commence in the coming weeks
Roma Hub 2 145 TJ/day gross gas capacity 10 ML/day water handling facilities
Hub construction >97% complete

Capital expenditure and opex guidance
US$18.5 billion1 capex from FID to the end of 2015
2016-20 average capex estimate A$1 billion pa
INVESTOR ROADSHOW - JUNE 2014 20 |
Capital expenditure estimate
FID to end of
2015 US$18.5 billion1
2016-2020 ~A$1 billion average per
annum
Post 2020 ~A$0.5 billion average per
annum
1 Based on foreign exchange rates which are consistent with the assumptions used at FID (A$/US$ 0.87 average over 2011-15).
Vast majority of 2016-20 expenditure is the upstream, and includes:
─ Drilling and completion of new wells (~200–300 per annum)
─ Connections of new wells, including wellpads, gas gathering lines, water pipelines, and power/communications infrastructure
─ Additional compression, water treatment facilities and ponds, trunklines, transmission lines and roads
─ Capitalised cost of staff working on upstream capex projects and wages associated with engineering, procurement and construction of upstream capex projects
─ Exploration and appraisal
─ Domestic gas stay-in-business capex
Includes maintenance capex for the LNG plant and gas transmission pipeline
Opex average cost estimate
Upstream field
(excludes electricity and carbon)
~A$1.25/GJ
Downstream
(pipeline, plant and port)
~A$150 million per annum

Third party gas supply Third party gas generates significant value for the project
INVESTOR ROADSHOW - JUNE 2014 21 |
Supplier Quantity TJ/day Starts Term Delivery point Price basis
Santos portfolio ‘Horizon’ 750 PJ 140 2015 15 years Wallumbilla Oil-linked
Origin 365 PJ 100 2015 10 years Wallumbilla Oil-linked
Origin 194 PJ1 50-1001 2016 5 years Wallumbilla Oil-linked
Other suppliers 85 PJ2 10-15 60-100
2015 2016
7 years 21 months
Wallumbilla Oil-linked
Meridian JV 445 PJ3 20-65 2015 20 years GLNG GTP Oil-linked4
Combabula/ Spring Gully
355 PJ5 30-50 2015 30 years Fairview Oil-linked
1 100 PJ firm volume over 5 years. Origin has the option to supply additional volumes of up to 94 PJ during the same period. 2 60PJ of this supply is subject to finalisation and execution of agreements, which is expected by mid-2014. 3 Source: WestSide Corporation Target Statement of 16 May 2014. Excludes additional gas production by the Meridian Joint Venture beyond 65 TJ/day. Volumes subject to Meridian field production performance and implementation of expansion plans. 4 Oil-linked from 2016. 5 Santos share 2P reserves in the APLNG-operated Combabula, Spring Gully and Ramyard fields at the end of 2013.
Attractive oil-linked gross margins
Provides operational flexibility in LNG train ramp-up and operation

Gas transmission pipeline Hydrotesting and de-watering complete, final drying in progress
Marine crossing tunnel break-through on 3 February 2014
INVESTOR ROADSHOW - JUNE 2014 22 |
42 inch diameter
420-kilometre pipeline
Strong progress as
pipeline draws to
completion:
─ All of the 420-kilometre pipeline is in the ground, hydrotested and de-watered
─ Marine crossing tunnel is complete
─ Pre-commissioning activities are substantially complete

Material Offloading Facility
LNG jetty 360m long, 4 loading arms
Two LNG Tanks 280,000m3 combined capacity
Train 1 3.9 mtpa nameplate capacity
Train 2 3.9 mtpa nameplate capacity
Flare 100 metres tall
Utilities Area Includes Central Control
Building Camp
Accommodation 1,680 beds
Gas Inlet and Refrigerant Storage
GLNG plant site, May 2014
GLNG plant site, Curtis Island
Two-train LNG plant with a nameplate capacity of 7.8 mtpa
INVESTOR ROADSHOW - JUNE 2014 23 |

LNG trains, May 2014.
LNG trains
INVESTOR ROADSHOW - JUNE 2014 24 |
All 82 Train 1 modules set; 11 of 29 Train 2 modules set, 7 modules in transit to site and 11 under assembly in Batangas, Philippines

LNG jetty, 360 metres long and suitable for ships with capacity up to 220,000m3, May 2014
LNG jetty Over 95% complete with the installation of quick release mooring hooks, capstans, fenders, vessel access gangway tower and loading arms complete
INVESTOR ROADSHOW - JUNE 2014 25 |

INVESTOR ROADSHOW - JUNE 2014 26 |
APLNG
QCLNG
GLNG
Curtis Island, 31 May 2014

Bayu-Undan / Darwin LNG
Maintain high margin asset
─ track record of reliable delivery (400+ cargoes since 2006; above contract production)
─ Phase 3 expansion underway with first gas expected in 2015
─ 35-40 day major shutdown scheduled for Q3 2014
Backfill and expansion:
─ Government approval for 10 mtpa and land available for Train 2 expansion
─ Multiple feed gas options available, including Santos’ Caldita Barossa, Bonaparte and Browse resources
─ Cost effective brownfield development options with quicker execution schedule
Strong production in 2014. Progress on Phase 3 offshore expansion. Multiple feed gas options for backfill and expansion emerging
INVESTOR ROADSHOW - JUNE 2014 27 |
Site for laydown and flare expansion
Site for LNG tanks and laydown
Site for new LNG trains
Darwin LNG plant

Asian growth Peluang project delivered on schedule and budget; Dua on track for first oil in mid-2014.
INVESTOR ROADSHOW - JUNE 2014 28 |
Peluang wellhead platform
Peluang, Indonesia (Santos 67.5%)
─ Project delivered in March 2014, on budget and ahead of schedule
─ Expected gross production rate of 25 mmscf/day
Dua, Vietnam (Santos 31.875%)
─ On track for first oil in coming weeks
─ Expected gross production rate of 8,000 barrels per day
Ande Ande Lumut, Indonesia (Santos 50%)
─ Focus on FPSO tender and detailed field development planning

Browse Basin
Significant resource build across the basin
─ Increase in Crown resource confidence through integration of nearby wells
─ Concerto and Ichthys field extensions into WA-274-P
─ Bassett West gas discovery
─ Drilling of Lasseter-1 is underway; potential southern extension into WA-281-P
Multiple commercialisation options
─ Brownfield expansion/backfill of existing projects
─ Standalone FLNG
─ Opportunity for upstream and downstream collaboration
Material resource build to support multiple commercialisation options including collaboration with adjacent resource owners for brownfield expansion
INVESTOR ROADSHOW - JUNE 2014 29 |
Crown discovery
Grand prospect Bassett West discovery
Lasseter prospect

Strong business outlook Operating cash flow is expected to double by 2016, providing the foundation for further growth and increased shareholder returns
INVESTOR ROADSHOW - JUNE 2014 30 |
Spirit of Hela, PNG LNG
Clear production growth outlook
Growing margins
Robust funding position provides the capacity to fund execution of strategy
Committed to increasing returns to shareholders as PNG LNG and GLNG come on line

Appendix
June 2014

2013 Full-year financial result
Growth in sales revenue, EBITDAX and EBIT. Net profit after tax of $516 million in line with 2012
INVESTOR ROADSHOW - JUNE 2014 32 |
2013 Full-year
Change on 2012
Production 51 mmboe -2%
Sales revenue $3,602 million +12%
EBITDAX $1,992 million +7%
EBIT $886 million +6%
Net profit after tax $516 million -0%
Underlying net profit after tax $504 million -17%
Operating cash flow $1,628 million -1%
Final dividend 15 cents per share -

Strong funding position $3.4 billion in balance sheet capacity to fund execution of business strategy and minimise financing risk. Minimal debt maturities to 2016
INVESTOR ROADSHOW - JUNE 2014 33 |
Available liquidity Debt maturity profile
A$billion
0
1
2
3
4
Cash Undrawn corporate
lines
Undrawn project line (PNG LNG)
ECA facilities
0
400
800
1,200
1,600
2,000
2014 2015 2016 2017 2018 2019 2020 Beyond
2020
Drawn facilities Euro subordinated notes
ECA Undrawn bank facilities
A$million
Charts as at 31 December 2013.
0.6
2.1
0.3
0.4
Notes mature in 2070, with Santos option to redeem in 2017

Capital expenditure
2014 guidance of $3.5 billion (excluding capitalised interest)
─ GLNG $1.4 billion
─ PNG LNG $0.3 billion
─ Eastern Australia $1.1 billion
─ WA&NT $0.3 billion
─ Asia Pacific $0.1 billion
─ Exploration $0.3 billion
2014 capitalised interest forecast at approximately $0.25 billion
2013 was peak year for capex. 2014 guidance unchanged at $3.5 billion
INVESTOR ROADSHOW - JUNE 2014 34 |
Capital expenditure (excludes capitalised interest)
0
1
2
3
4
2011 2012 2013 2014F
A$billion
2.9
3.2
4.1 3.5

GLNG capex US$18.5 billion GLNG gross capital cost estimate unchanged
1 Actual realised FX. 2 FID average exchange rate assumptions (A$/US$ 0.87 and US$/€0.76) over 2011-2015. 3 Average realised FX rates for 2011-2013 (A$/US$1.01 and US$/€0.75) and assumes average rates of A$/US$0.87 and US$/€0.80 over 2014-15.
2013 capex FID to Dec 2013
capex Capex estimate from FID
until the end of 2015
$billion A$1 A$1 US$2 A$3
LNG project capex (100%) 5.7 13.7 18.5 20.7
Santos 30% share 1.7 4.1 5.6 6.2
Non-LNG project capex (Santos 30% share)
Domestic stay in business
Exploration & appraisal
Capitalised stripping costs
Santos-only costs (Santos 100%)
Santos corporate costs
Capitalised interest
Capitalised restoration (non-cash)
0.04
0.07
0.01
0.12
0.02
0.13
0.15
0.03
0.10
0.17
0.02
0.29
0.05
0.29
0.34
0.09
Total Santos GLNG segment capex 2.0 4.8
SIB capex for GLNG’s domestic operations
Appraisal & pre-development activities
Capitalised borrowing costs
Capitalised de-watering costs
Governance, finance, head office
Non-cash, accounting entry only
INVESTOR ROADSHOW - JUNE 2014 35 |

2014 guidance
INVESTOR ROADSHOW - JUNE 2014 36 |
1 Royalty related taxation expense guidance based on an average realised oil price of A$110 per barrel
2 Capital expenditure guidance excludes capitalised interest, which is forecast at approximately $250 million in 2014
Item 2014 guidance
Production 52-57 mmboe
Production costs $820-880 million
DD&A expense $18.50/boe
Royalty related taxation expense1 (after tax) $60 million
Capital expenditure (including exploration & evaluation)2 $3.5 billion

2014 exploration schedule Delivers on our exploration strategy across super basins, frontier basins and unconventional basins
INVESTOR ROADSHOW - JUNE 2014 37 |
1 Subject to Government approval 2 Current interest is 10% but have the right to increase to 60%
Well Name Basin / Area Target Santos Interest %
Timing
Manta-1 PNG Gas 301 C&S, pending testing
South Sumatra CSG wells Sumatra CSG 102 1H 2014
Mt Kitty-1 Amadeus Gas 70 Gas discovery, evaluation ongoing
NW Koko-1 PNG Oil / gas 301 C&S, pending testing
Vanuatu-1 Carnarvon Oil 37.5 P&A
Lasseter-1 Browse Gas 30 Drilling
Hon Khoai-1 Nam Con Son Oil 451 Drilling
Tanumbirini McArthur Shale oil / gas 50 Q3 2014
Hides Deep PNG Gas 24 Q4 2014
The exploration portfolio is continuously being optimised, therefore the above program may vary as a result of farmout, rig availability, drilling outcomes and maturation of new prospects

Head Office Adelaide
Ground Floor, Santos Centre 60 Flinders Street Adelaide, South Australia 5000 GPO Box 2455 Adelaide, South Australia 5001 Telephone: +61 8 8116 5000
Useful email contacts
Share register enquiries: [email protected]
Investor enquiries: [email protected]
Website: www.santos.com
INVESTOR ROADSHOW - JUNE 2014 38 |
Andrew Nairn
Group Executive Investor Relations Direct: + 61 8 8116 5314 Email: [email protected]
Andrew Hay
Manager Investor Relations Direct: + 61 8 8116 7722 Email: [email protected]
Nicole Walker
Investor Relations Manager Direct: + 61 8 8116 5302 Email: [email protected]
Contact information
GLNG, Curtis Island, Queensland