Embed Size (px)
Citation preview
Investor Presentation November 15, 2016
This presentation may include statements which may constitute forward-looking statements. All statements that address expectations or projections about the future, including, but not limited to, statements about the strategy for growth, business development, market position, expenditures, and financial results, are forward looking statements. Forward looking statements are based on certain assumptions and expectations of future events. The Company cannot guarantee that these assumptions and expectations are accurate or will be realized. The actual results, performance or achievements, could thus differ materially from those projected in any such forward-looking statements.
The information contained in these materials has not been independently verified. None of the Company, its Directors, Promoter or affiliates, nor any of its or their respective employees, advisers or representatives or any other person accepts any responsibility or liability whatsoever, whether arising in tort, contract or otherwise, for any errors, omissions or inaccuracies in such information or opinions or for any loss, cost or damage suffered or incurred howsoever arising, directly or indirectly, from any use of this document or its contents or otherwise in connection with this document, and makes no representation or warranty, express or implied, for the contents of this document including its accuracy, fairness, completeness or verification or for any other statement made or purported to be made by any of them, or on behalf of them, and nothing in this document or at this presentation shall be relied upon as a promise or representation in this respect, whether as to the past or the future. The information and opinions contained in this presentation are current, and if not stated otherwise, as of the date of this presentation. The Company undertake no obligation to update or revise any information or the opinions expressed in this presentation as a result of new information, future events or otherwise. Any opinions or information expressed in this presentation are subject to change without notice.
This presentation does not constitute or form part of any offer or invitation or inducement to sell or issue, or any solicitation of any offer to purchase or subscribe for, any securities of RPG Life Sciences Limited Limited (the “Company”), nor shall it or any part of it or the fact of its distribution form the basis of, or be relied on in connection with, any contract or commitment therefore. Any person/ party intending to provide finance / invest in the shares/businesses of the Company shall do so after seeking their own professional advice and after carrying out their own due diligence procedure to ensure that they are making an informed decision. This presentation is strictly confidential and may not be copied or disseminated, in whole or in part, and in any manner or for any purpose. No person is authorized to give any information or to make any representation not contained in or inconsistent with this presentation and if given or made, such information or representation must not be relied upon as having been authorized by any person. Failure to comply with this restriction may constitute a violation of the applicable securities laws. The distribution of this document in certain jurisdictions may be restricted by law and persons into whose possession this presentation comes should inform themselves about and observe any such restrictions. By participating in this presentation or by accepting any copy of the slides presented, you agree to be bound by the foregoing limitations.
Disclaimer
Table of Contents
RPG Group
RPG LS : Overview, Performance and Strategic Direction
RPG LS : Financials
Table of Contents
RPG Group
RPG LS : Overview, Performance and Strategic Direction
RPG LS : Financials
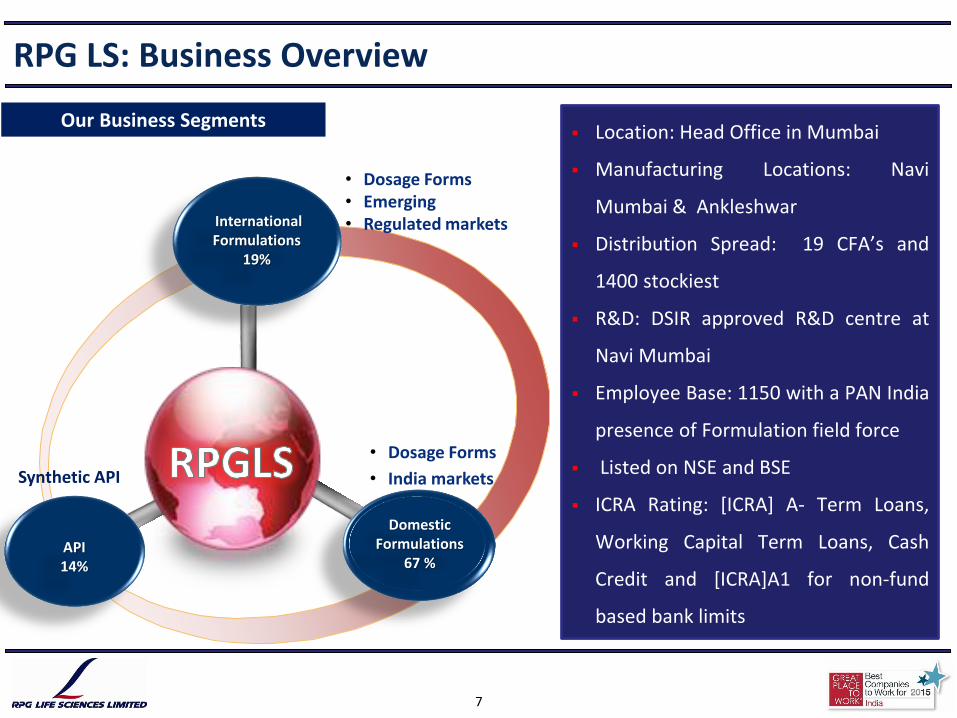
RPG LS: Business Overview
Our Business Segments
Synthetic API
Location: Head Office in Mumbai
Manufacturing Locations: Navi
Mumbai & Ankleshwar
Distribution Spread: 19 CFA’s and
1400 stockiest
R&D: DSIR approved R&D centre at
Navi Mumbai
Employee Base: 1150 with a PAN India
presence of Formulation field force
Listed on NSE and BSE
ICRA Rating: [ICRA] A- Term Loans,
Working Capital Term Loans, Cash
Credit and [ICRA]A1 for non-fund
based bank limits
API 14%
International Formulations
19%
• Dosage Forms • Emerging • Regulated markets
Domestic Formulations
67 %
• Dosage Forms
• India markets
7
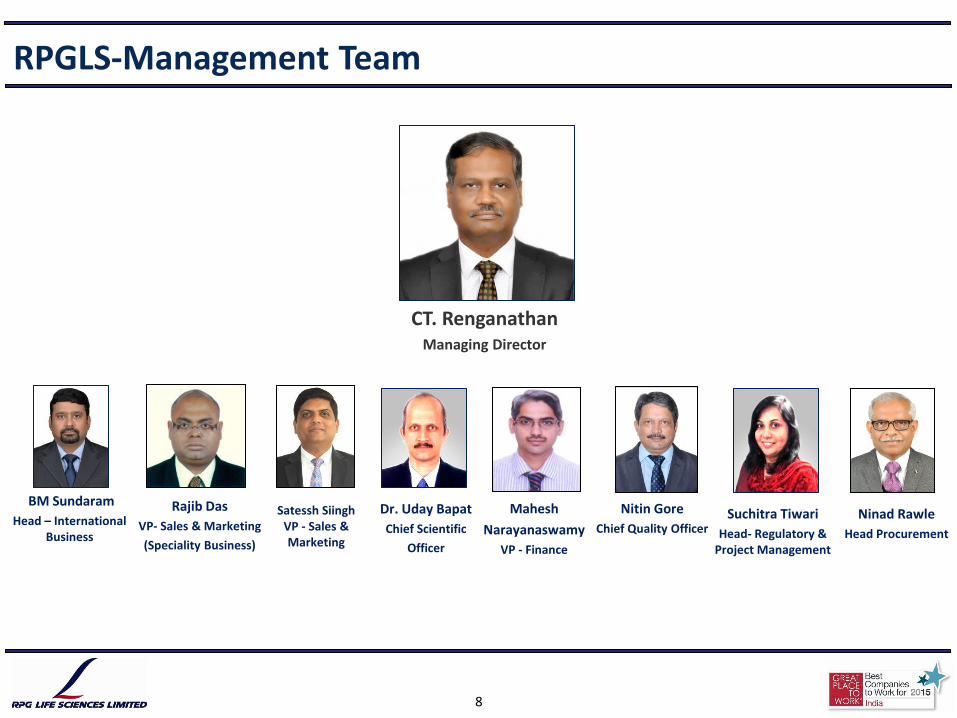
RPGLS-Management Team
CT. Renganathan Managing Director
BM Sundaram
Head – International Business
Dr. Uday Bapat
Chief Scientific
Officer
Mahesh
Narayanaswamy
VP - Finance
Suchitra Tiwari
Head- Regulatory & Project Management
Nitin Gore
Chief Quality Officer
Rajib Das
VP- Sales & Marketing
(Speciality Business)
Satessh Siingh VP - Sales & Marketing
Ninad Rawle
Head Procurement
8
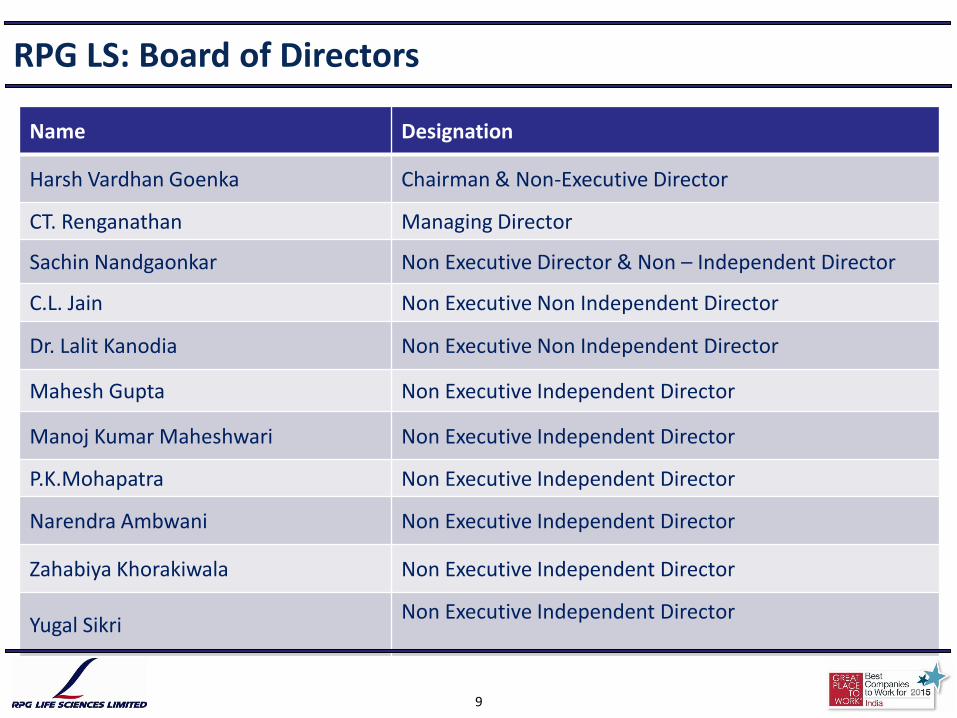
Name Designation
Harsh Vardhan Goenka Chairman & Non-Executive Director
CT. Renganathan Managing Director
Sachin Nandgaonkar Non Executive Director & Non – Independent Director
C.L. Jain Non Executive Non Independent Director
Dr. Lalit Kanodia Non Executive Non Independent Director
Mahesh Gupta Non Executive Independent Director
Manoj Kumar Maheshwari Non Executive Independent Director
P.K.Mohapatra Non Executive Independent Director
Narendra Ambwani Non Executive Independent Director
Zahabiya Khorakiwala Non Executive Independent Director
Yugal Sikri Non Executive Independent Director
RPG LS: Board of Directors
9
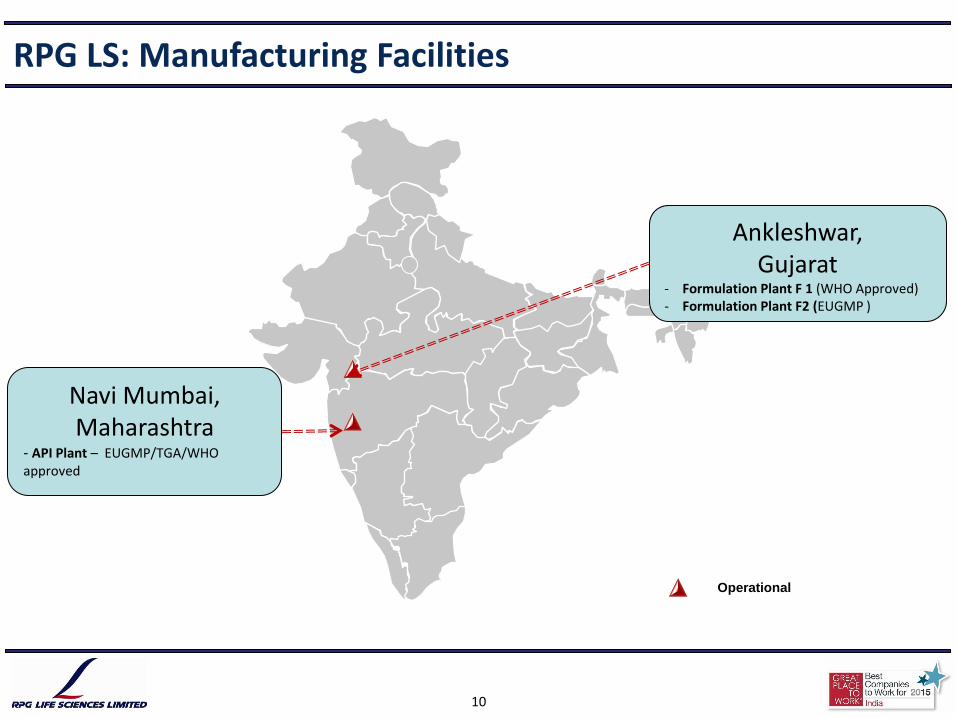
Operational
RPG LS: Manufacturing Facilities
Navi Mumbai, Maharashtra
- API Plant – EUGMP/TGA/WHO approved
Ankleshwar, Gujarat
- Formulation Plant F 1 (WHO Approved) - Formulation Plant F2 (EUGMP )
10
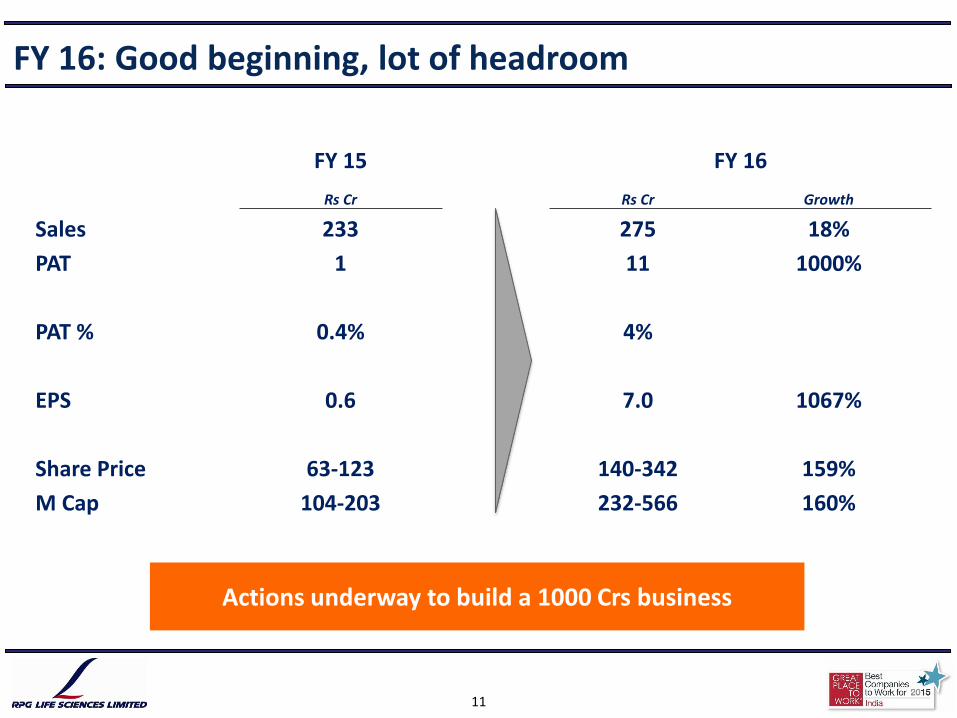
FY 16: Good beginning, lot of headroom
FY 15 FY 16
Rs Cr Rs Cr Growth
Sales 233 275 18%
PAT 1 11 1000%
PAT % 0.4% 4%
EPS 0.6 7.0 1067%
Share Price 63-123 140-342 159%
M Cap 104-203 232-566 160%
Actions underway to build a 1000 Crs business
11
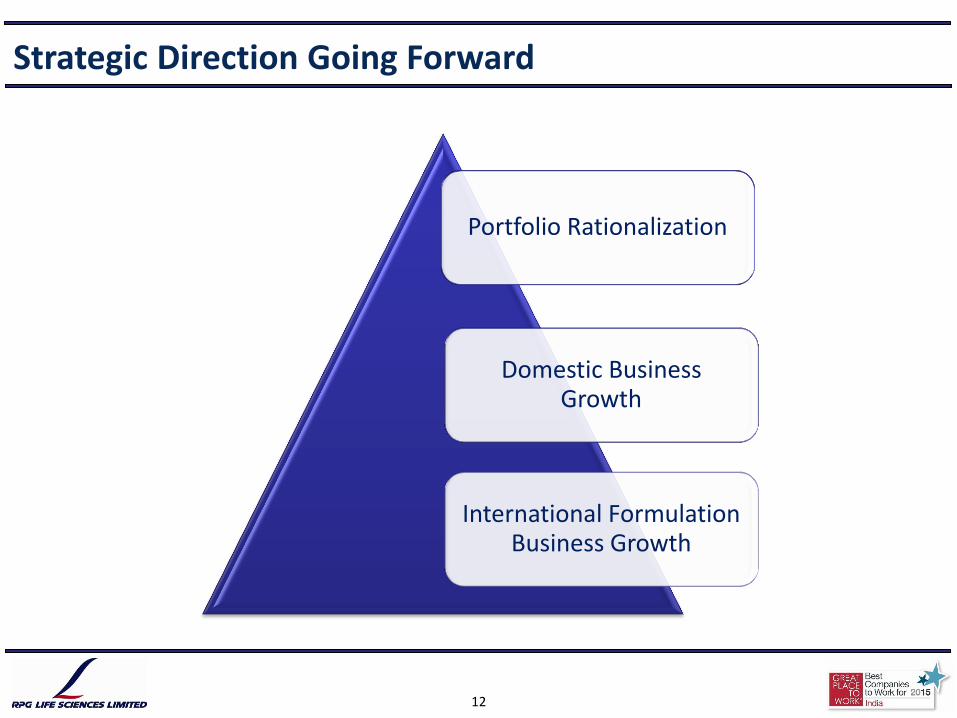
Strategic Direction Going Forward
Portfolio Rationalization
Domestic Business Growth
International Formulation Business Growth
12
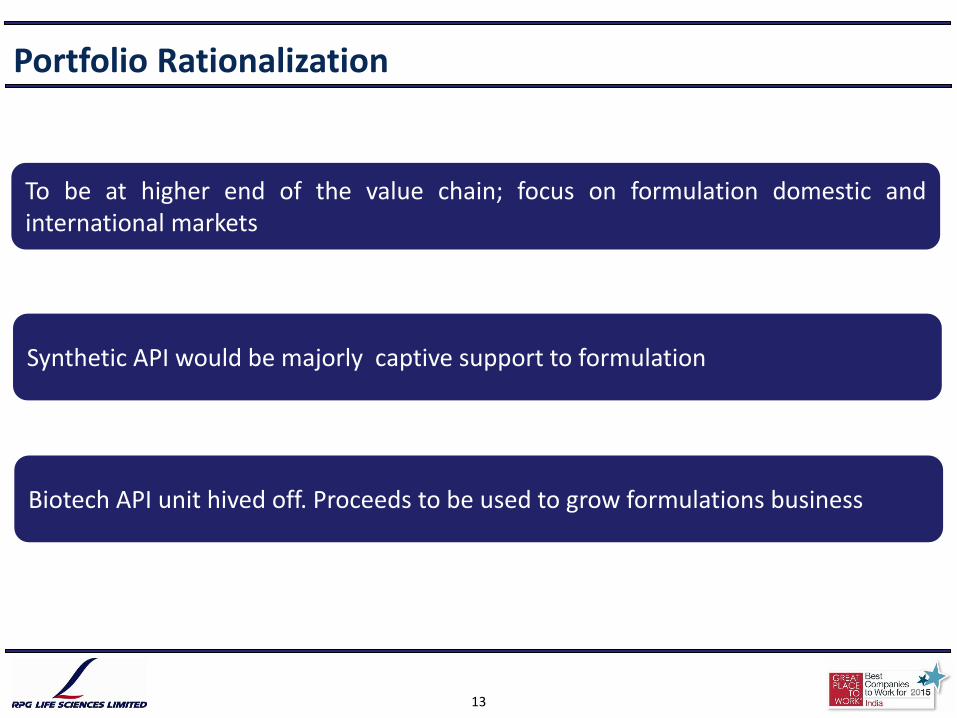
Portfolio Rationalization
To be at higher end of the value chain; focus on formulation domestic and international markets
Synthetic API would be majorly captive support to formulation
Biotech API unit hived off. Proceeds to be used to grow formulations business
13
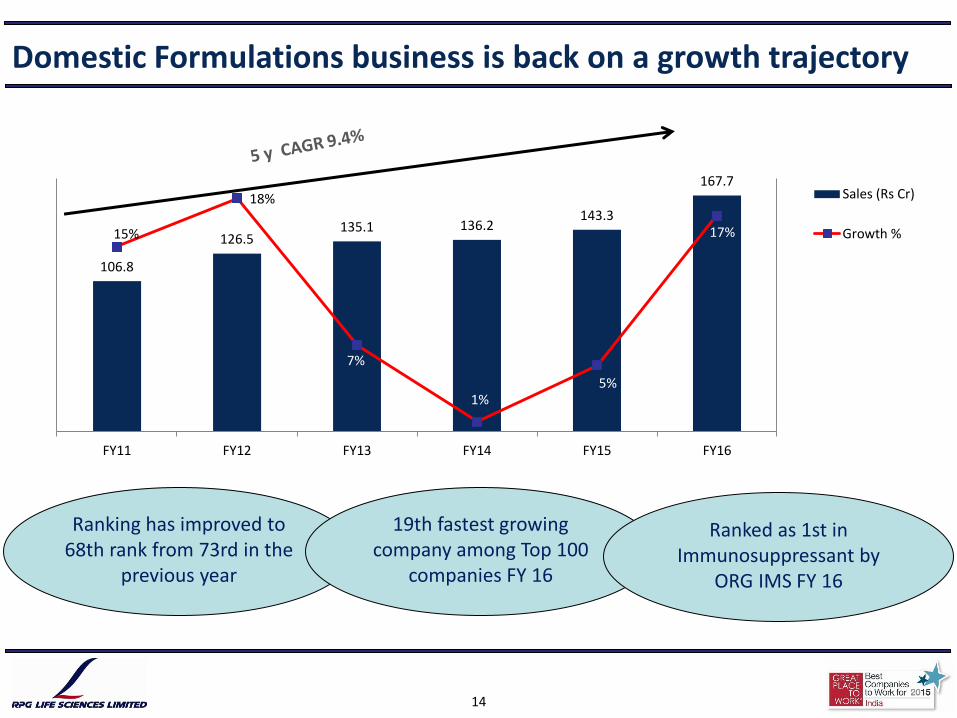
Domestic Formulations business is back on a growth trajectory
106.8
126.5 135.1 136.2
143.3
167.7
15%
18%
7%
1% 5%
17%
FY11 FY12 FY13 FY14 FY15 FY16
Sales (Rs Cr)
Growth %
Ranking has improved to 68th rank from 73rd in the
previous year
19th fastest growing company among Top 100
companies FY 16
Ranked as 1st in Immunosuppressant by
ORG IMS FY 16
14
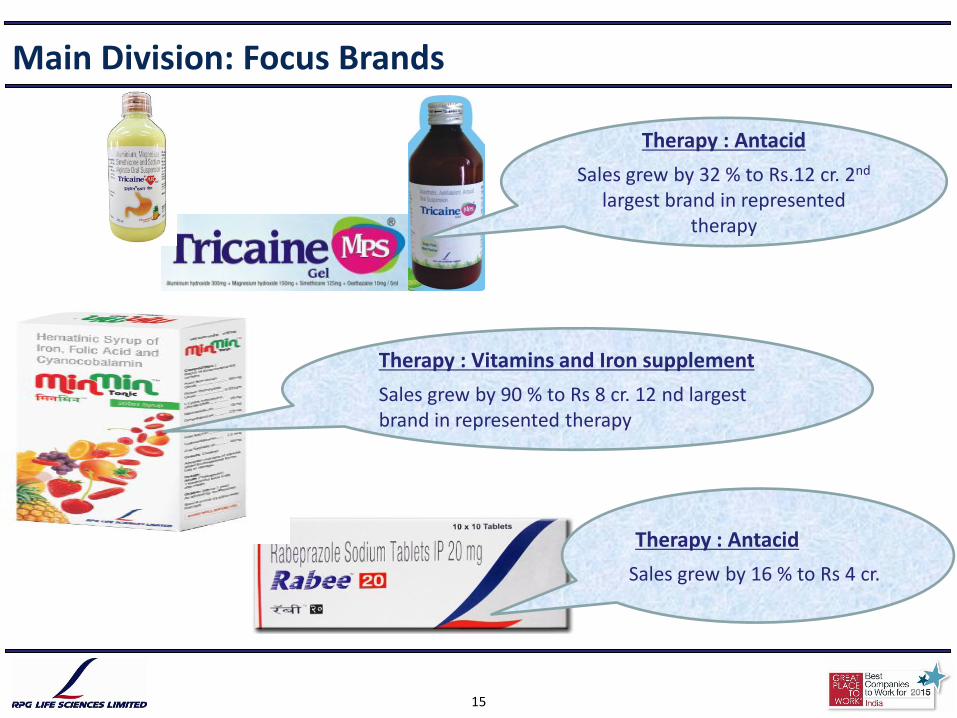
Main Division: Focus Brands
Therapy : Antacid
Sales grew by 32 % to Rs.12 cr. 2nd largest brand in represented
therapy
Therapy : Vitamins and Iron supplement
Sales grew by 90 % to Rs 8 cr. 12 nd largest brand in represented therapy
Therapy : Antacid
Sales grew by 16 % to Rs 4 cr.
15
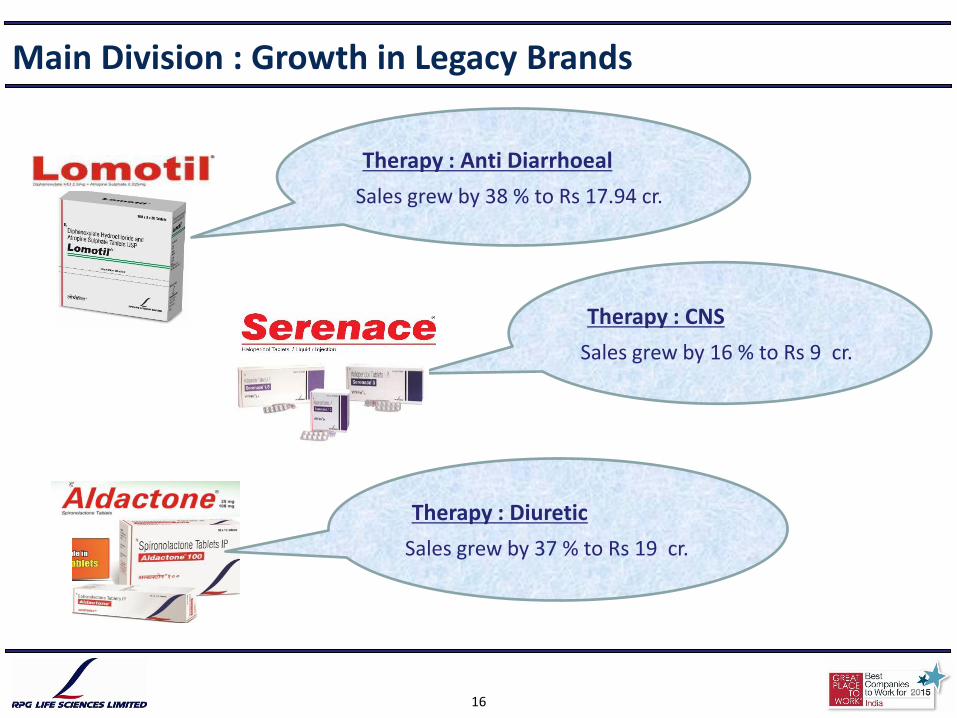
Main Division : Growth in Legacy Brands
Therapy : Anti Diarrhoeal
Sales grew by 38 % to Rs 17.94 cr.
Therapy : CNS
Sales grew by 16 % to Rs 9 cr.
Therapy : Diuretic
Sales grew by 37 % to Rs 19 cr.
16
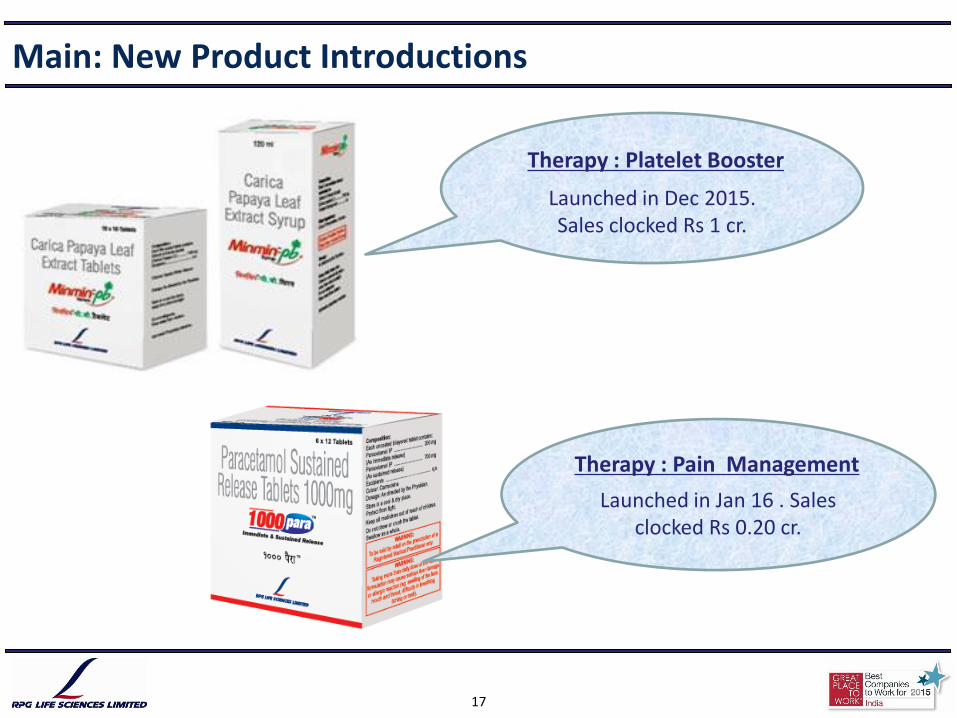
Main: New Product Introductions
Therapy : Platelet Booster
Launched in Dec 2015. Sales clocked Rs 1 cr.
Therapy : Pain Management
Launched in Jan 16 . Sales clocked Rs 0.20 cr.
17
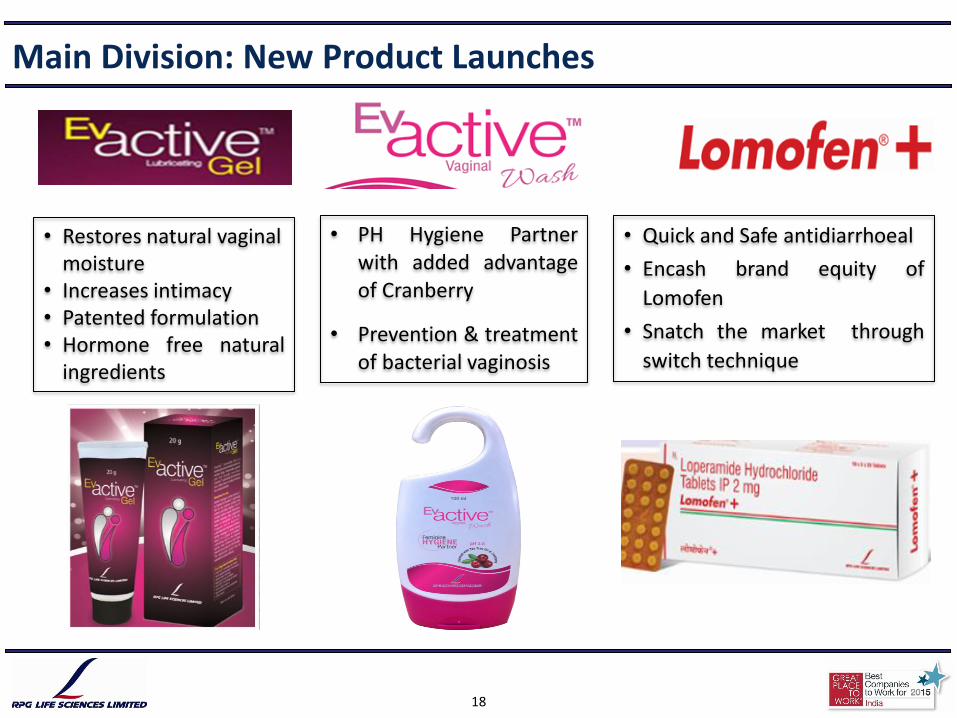
• Restores natural vaginal moisture
• Increases intimacy • Patented formulation • Hormone free natural
ingredients
• PH Hygiene Partner with added advantage of Cranberry
• Prevention & treatment of bacterial vaginosis
• Quick and Safe antidiarrhoeal
• Encash brand equity of
Lomofen
• Snatch the market through
switch technique
Main Division: New Product Launches
18
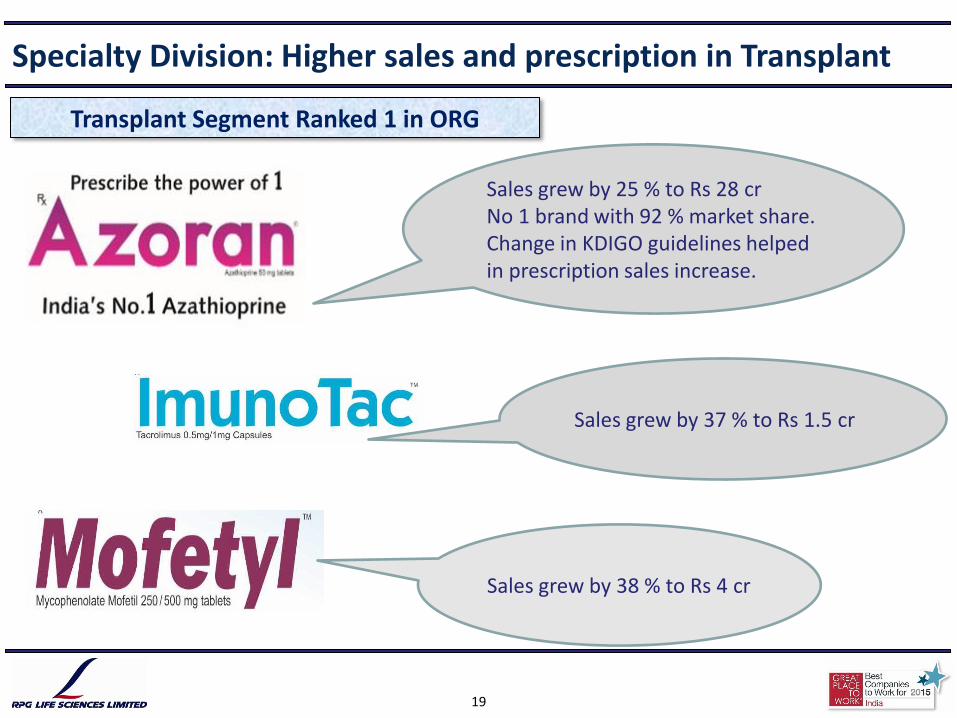
Specialty Division: Higher sales and prescription in Transplant
Sales grew by 25 % to Rs 28 cr No 1 brand with 92 % market share. Change in KDIGO guidelines helped in prescription sales increase.
Sales grew by 37 % to Rs 1.5 cr
Sales grew by 38 % to Rs 4 cr
Transplant Segment Ranked 1 in ORG
19
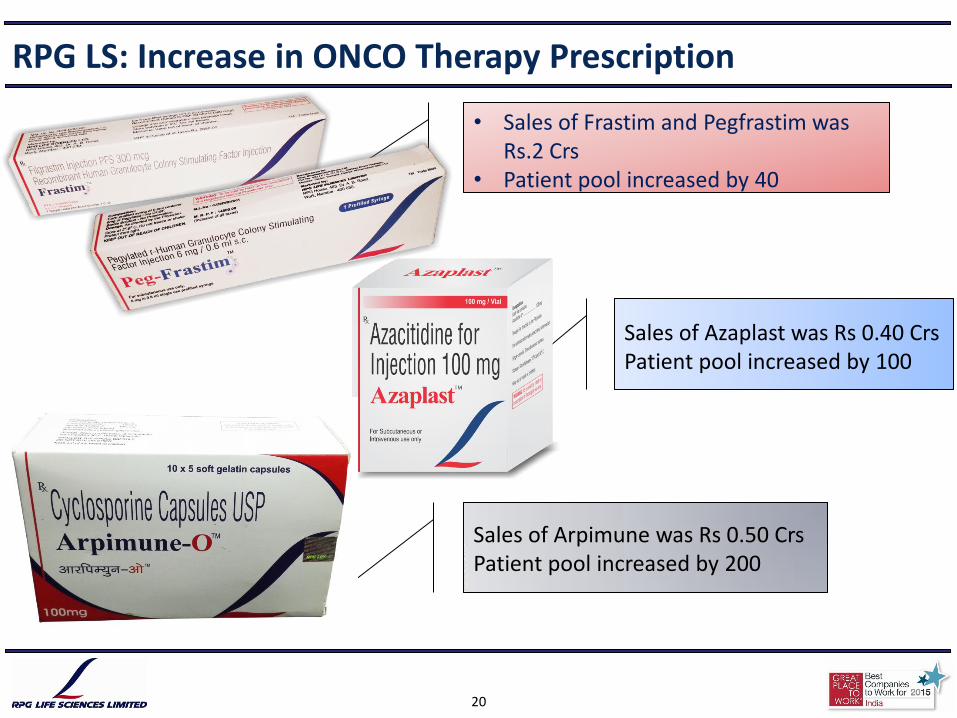
RPG LS: Increase in ONCO Therapy Prescription
• Sales of Frastim and Pegfrastim was Rs.2 Crs
• Patient pool increased by 40
Sales of Azaplast was Rs 0.40 Crs Patient pool increased by 100
Sales of Arpimune was Rs 0.50 Crs Patient pool increased by 200
20
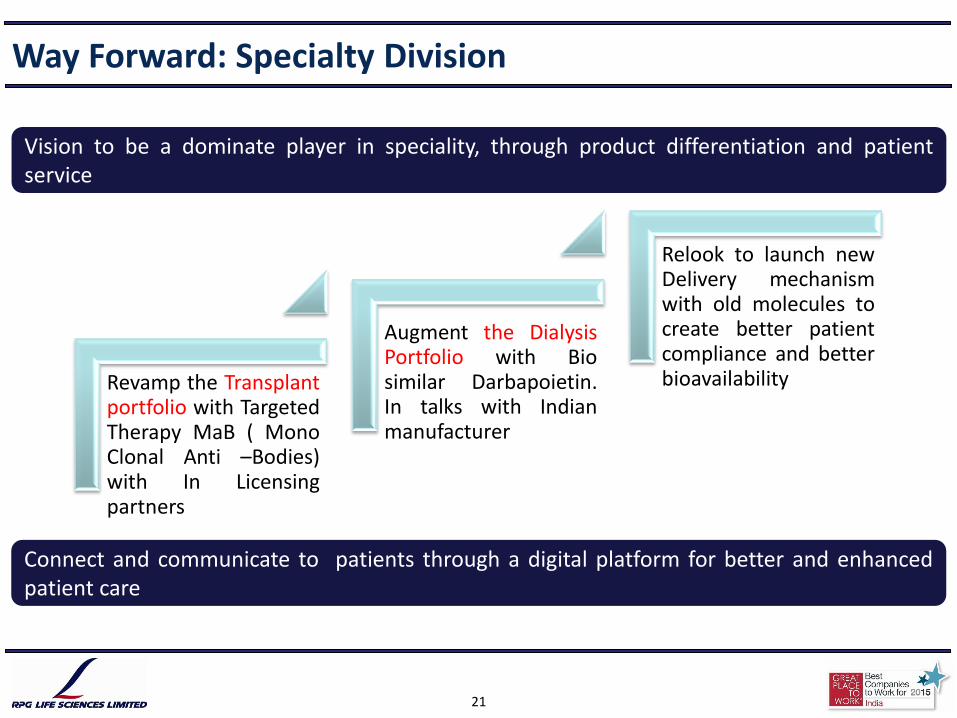
Revamp the Transplant portfolio with Targeted Therapy MaB ( Mono Clonal Anti –Bodies) with In Licensing partners
Augment the Dialysis Portfolio with Bio similar Darbapoietin. In talks with Indian manufacturer
Relook to launch new Delivery mechanism with old molecules to create better patient compliance and better bioavailability
Way Forward: Specialty Division
Vision to be a dominate player in speciality, through product differentiation and patient service
Connect and communicate to patients through a digital platform for better and enhanced patient care
21
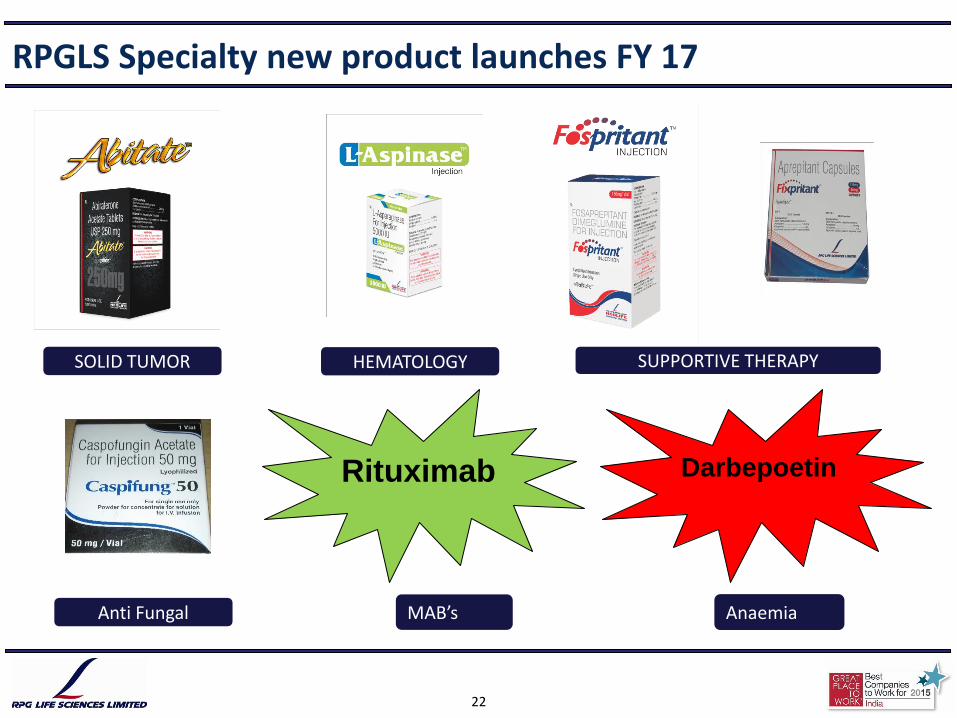
Darbepoetin
Rituximab
RPGLS Specialty new product launches FY 17
SOLID TUMOR HEMATOLOGY
Anaemia MAB’s Anti Fungal
SUPPORTIVE THERAPY
22
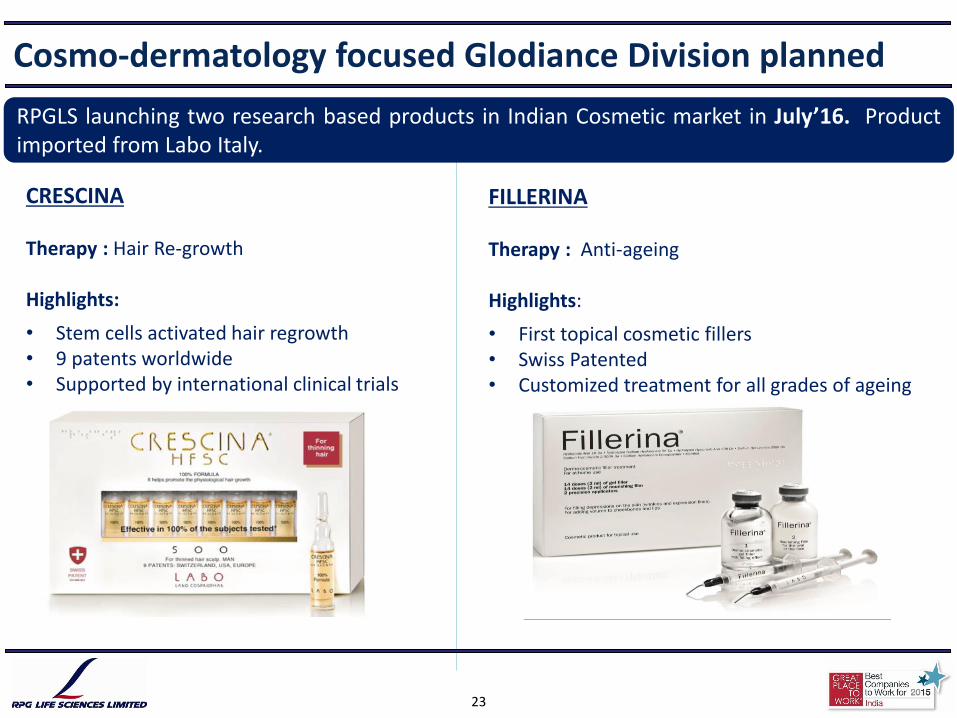
Cosmo-dermatology focused Glodiance Division planned
CRESCINA Therapy : Hair Re-growth Highlights:
• Stem cells activated hair regrowth • 9 patents worldwide • Supported by international clinical trials
FILLERINA Therapy : Anti-ageing Highlights:
• First topical cosmetic fillers • Swiss Patented • Customized treatment for all grades of ageing
RPGLS launching two research based products in Indian Cosmetic market in July’16. Product imported from Labo Italy.
23
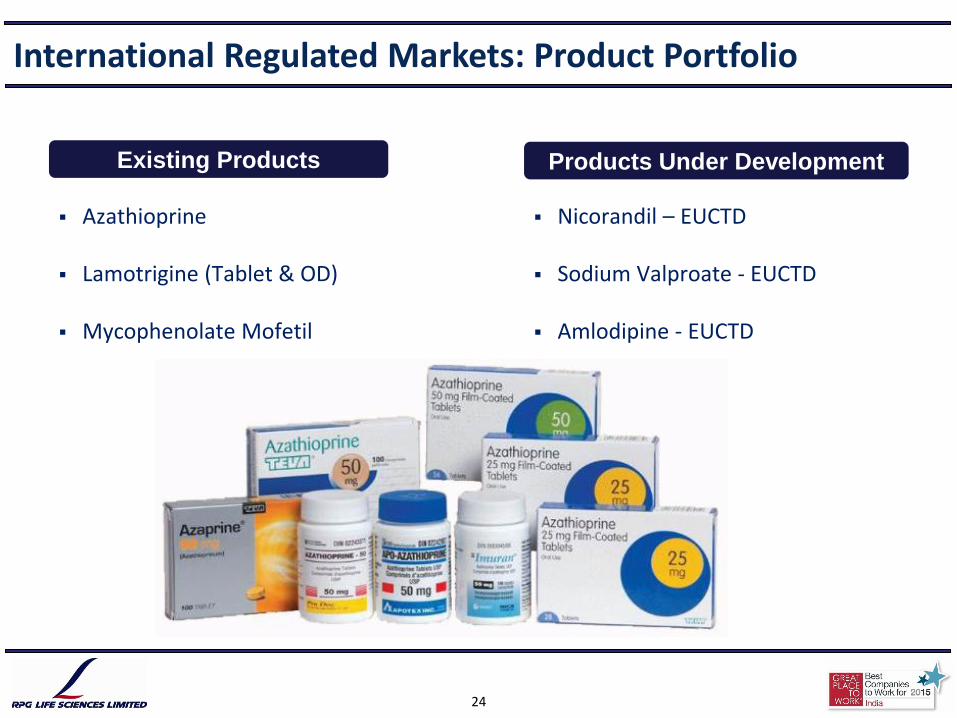
International Regulated Markets: Product Portfolio
Products Under Development
Nicorandil – EUCTD
Sodium Valproate - EUCTD
Amlodipine - EUCTD
Existing Products
Azathioprine
Lamotrigine (Tablet & OD)
Mycophenolate Mofetil
24

Regulated Market : Key actions taken in FY 16
Successfully commissioned the Hard gel and Low RH facility which are extension in F2
Developed new molecule Nicorandil and tied up with Amneal UK. Received GBP of 150000 from them
Received EU GMP certification for F 2 plant
Successfully passed customer orders of Apotex and Tillomed which resulted in higher orders from these customers
25
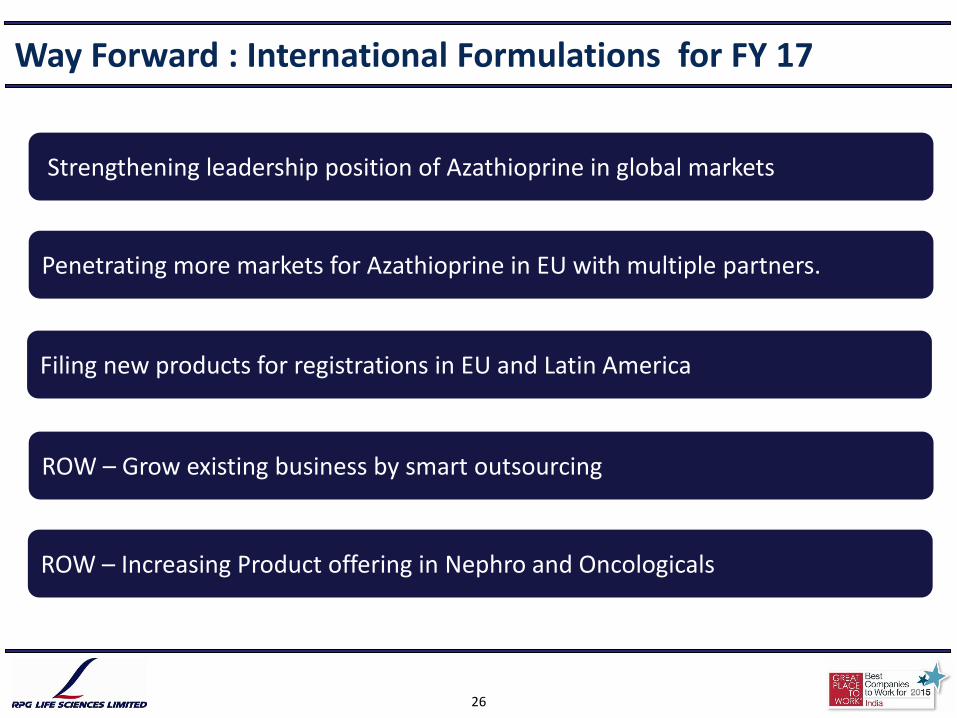
Way Forward : International Formulations for FY 17
Filing new products for registrations in EU and Latin America
Penetrating more markets for Azathioprine in EU with multiple partners.
Strengthening leadership position of Azathioprine in global markets
ROW – Grow existing business by smart outsourcing
ROW – Increasing Product offering in Nephro and Oncologicals
26
Table of Contents
RPG Group
RPG LS : Overview, Performance and Strategic Direction
RPG LS : Financials
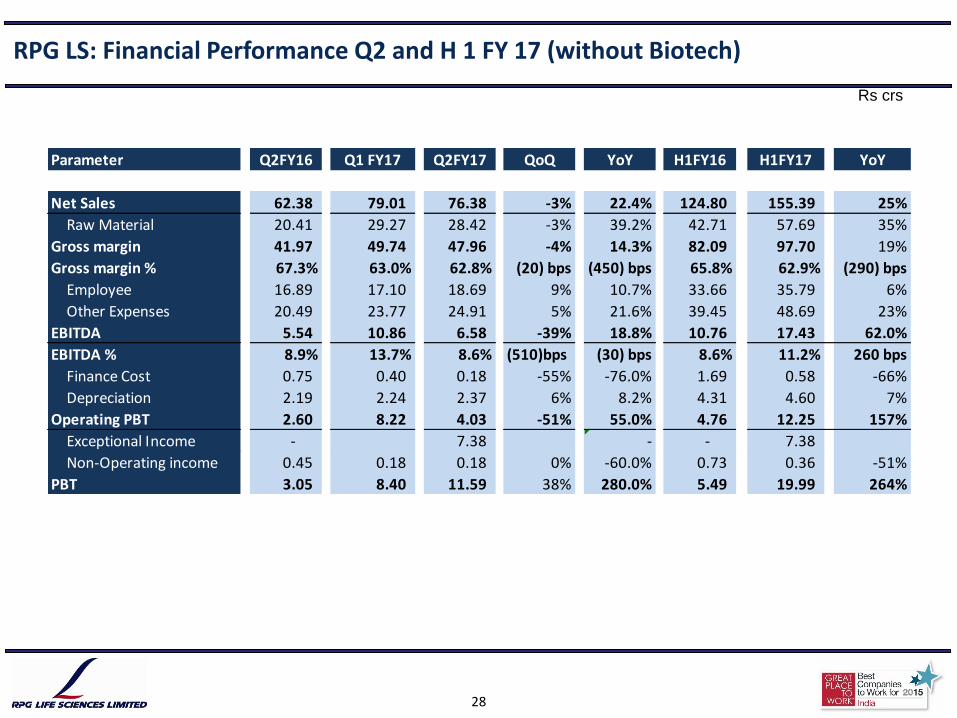
RPG LS: Financial Performance Q2 and H 1 FY 17 (without Biotech)
28
Rs crs
Parameter Q2FY16 Q1 FY17 Q2FY17 QoQ YoY H1FY16 H1FY17 YoY
Net Sales 62.38 79.01 76.38 -3% 22.4% 124.80 155.39 25%
Raw Material 20.41 29.27 28.42 -3% 39.2% 42.71 57.69 35%
Gross margin 41.97 49.74 47.96 -4% 14.3% 82.09 97.70 19%
Gross margin % 67.3% 63.0% 62.8% (20) bps (450) bps 65.8% 62.9% (290) bps
Employee 16.89 17.10 18.69 9% 10.7% 33.66 35.79 6%
Other Expenses 20.49 23.77 24.91 5% 21.6% 39.45 48.69 23%
EBITDA 5.54 10.86 6.58 -39% 18.8% 10.76 17.43 62.0%
EBITDA % 8.9% 13.7% 8.6% (510)bps (30) bps 8.6% 11.2% 260 bps
Finance Cost 0.75 0.40 0.18 -55% -76.0% 1.69 0.58 -66%
Depreciation 2.19 2.24 2.37 6% 8.2% 4.31 4.60 7%
Operating PBT 2.60 8.22 4.03 -51% 55.0% 4.76 12.25 157%
Exceptional Income - 7.38 - - 7.38
Non-Operating income 0.45 0.18 0.18 0% -60.0% 0.73 0.36 -51%
PBT 3.05 8.40 11.59 38% 280.0% 5.49 19.99 264%
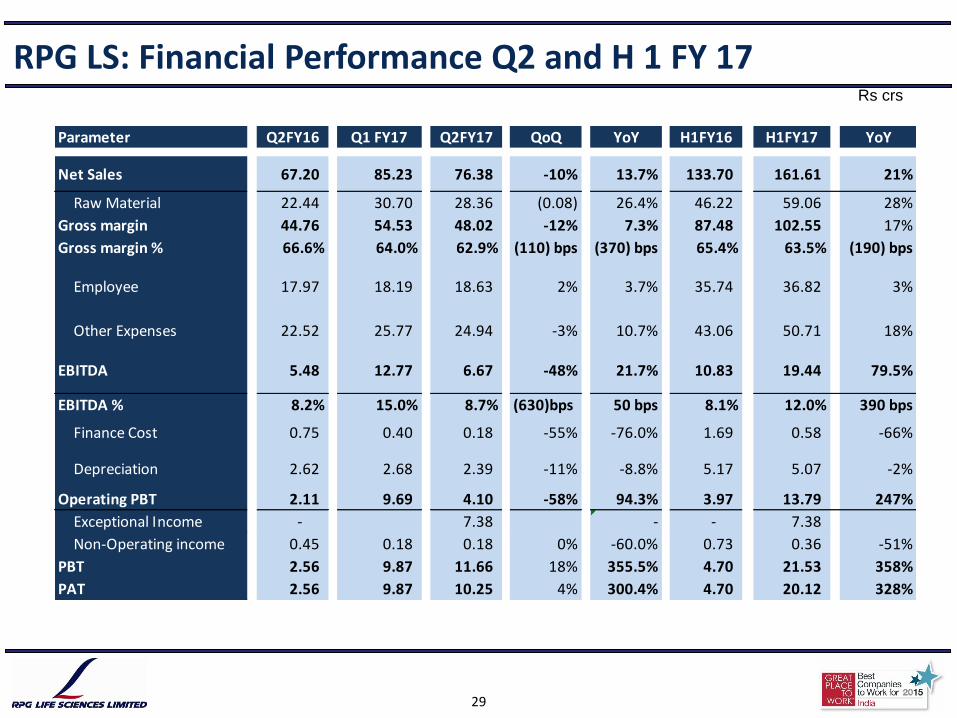
RPG LS: Financial Performance Q2 and H 1 FY 17
29
Rs crs
Parameter Q2FY16 Q1 FY17 Q2FY17 QoQ YoY H1FY16 H1FY17 YoY
Net Sales 67.20 85.23 76.38 -10% 13.7% 133.70 161.61 21%
Raw Material 22.44 30.70 28.36 (0.08) 26.4% 46.22 59.06 28%
Gross margin 44.76 54.53 48.02 -12% 7.3% 87.48 102.55 17%
Gross margin % 66.6% 64.0% 62.9% (110) bps (370) bps 65.4% 63.5% (190) bps
Employee 17.97 18.19 18.63 2% 3.7% 35.74 36.82 3%
Other Expenses 22.52 25.77 24.94 -3% 10.7% 43.06 50.71 18%
EBITDA 5.48 12.77 6.67 -48% 21.7% 10.83 19.44 79.5%
EBITDA % 8.2% 15.0% 8.7% (630)bps 50 bps 8.1% 12.0% 390 bps
Finance Cost 0.75 0.40 0.18 -55% -76.0% 1.69 0.58 -66%
Depreciation 2.62 2.68 2.39 -11% -8.8% 5.17 5.07 -2%
Operating PBT 2.11 9.69 4.10 -58% 94.3% 3.97 13.79 247%
Exceptional Income - 7.38 - - 7.38
Non-Operating income 0.45 0.18 0.18 0% -60.0% 0.73 0.36 -51%
PBT 2.56 9.87 11.66 18% 355.5% 4.70 21.53 358%
PAT 2.56 9.87 10.25 4% 300.4% 4.70 20.12 328%

Y O U T H A N K