Embed Size (px)
Citation preview
0 170 231
240 78 35
6 58 123
253 188 95
120 172 56
128 71 144
191 162 155
0 102 204
182 213 251
Investor Presentation
0 170 231
240 78 35
6 58 123
253 188 95
120 172 56
128 71 144
191 162 155
0 102 204
182 213 251
www.rostelecom.ru
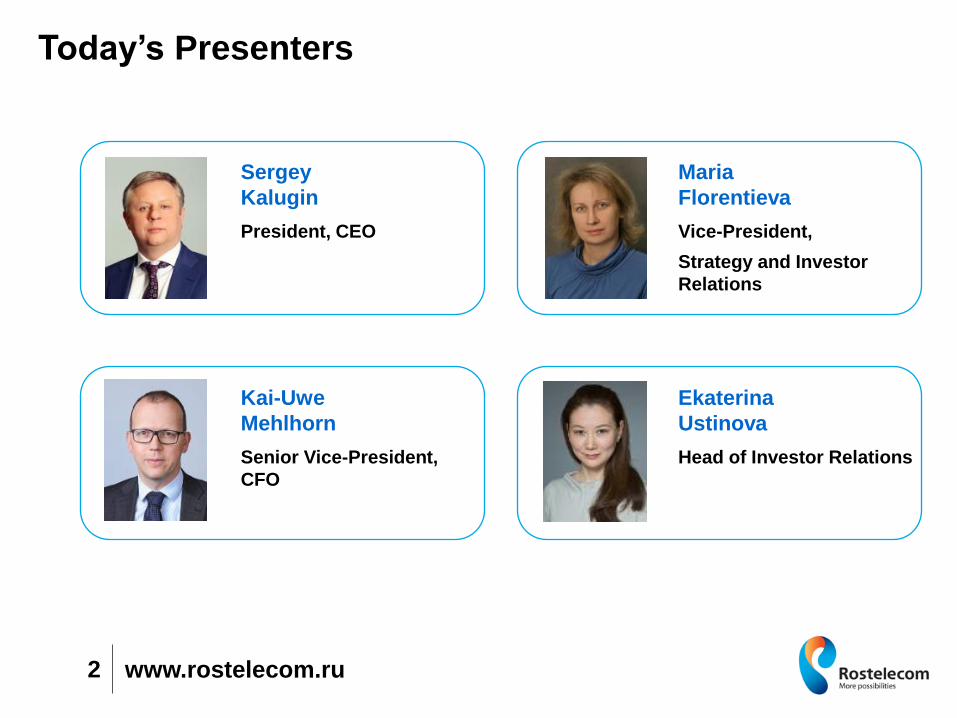
Today’s Presenters
2
Sergey
Kalugin
President, CEO
Ekaterina
Ustinova
Head of Investor Relations
Kai-Uwe
Mehlhorn
Senior Vice-President,
CFO
Maria
Florentieva
Vice-President,
Strategy and Investor
Relations
0 170 231
240 78 35
6 58 123
253 188 95
120 172 56
128 71 144
191 162 155
0 102 204
182 213 251
www.rostelecom.ru
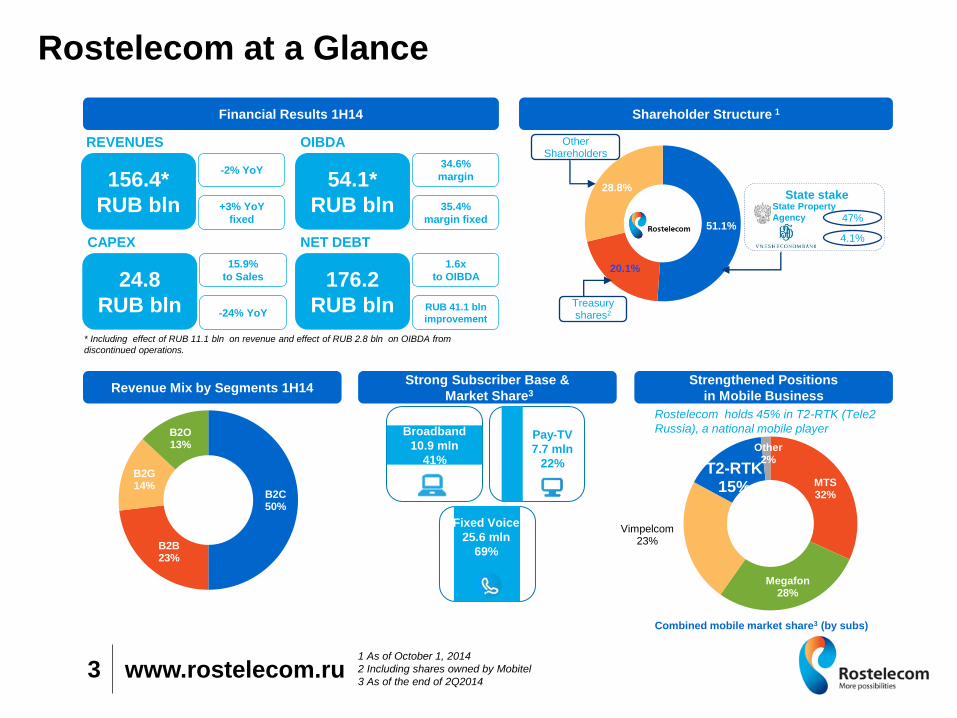
51.1%
20.1%
28.8%
Rostelecom at a Glance
3
Strong Subscriber Base &
Market Share3
Financial Results 1H14
Broadband
10.9 mln
41%
Shareholder Structure 1
Other Shareholders
Treasury shares2
Strengthened Positions
in Mobile Business
Rostelecom holds 45% in T2-RTK (Tele2
Russia), a national mobile player
Combined mobile market share3 (by subs)
156.4*
RUB bln
-2% YoY
REVENUES
+3% YoY
fixed
24.8
RUB bln
15.9%
to Sales
CAPEX
-24% YoY
54.1*
RUB bln
34.6%
margin
OIBDA
35.4%
margin fixed
176.2
RUB bln
1.6x
to OIBDA
NET DEBT
RUB 41.1 bln
improvement
State Property
Agency 47%
4.1%
State stake
B2C 50%
B2B 23%
B2G 14%
B2O 13%
Revenue Mix by Segments 1H14
MTS 32%
Megafon 28%
Vimpelcom 23%
T2-RTK 15%
Other 2%
* Including effect of RUB 11.1 bln on revenue and effect of RUB 2.8 bln on OIBDA from
discontinued operations.
Pay-TV
7.7 mln
22%
Fixed Voice
25.6 mln
69%
1 As of October 1, 2014
2 Including shares owned by Mobitel
3 As of the end of 2Q2014
0 170 231
240 78 35
6 58 123
253 188 95
120 172 56
128 71 144
191 162 155
0 102 204
182 213 251
www.rostelecom.ru
Content
4
Investment Highlights
1
Rostelecom Strategic Priorities
2
Financial Results & Outlook
3
0 170 231
240 78 35
6 58 123
253 188 95
120 172 56
128 71 144
191 162 155
0 102 204
182 213 251
1. Investment Highlights
0 170 231
240 78 35
6 58 123
253 188 95
120 172 56
128 71 144
191 162 155
0 102 204
182 213 251
www.rostelecom.ru
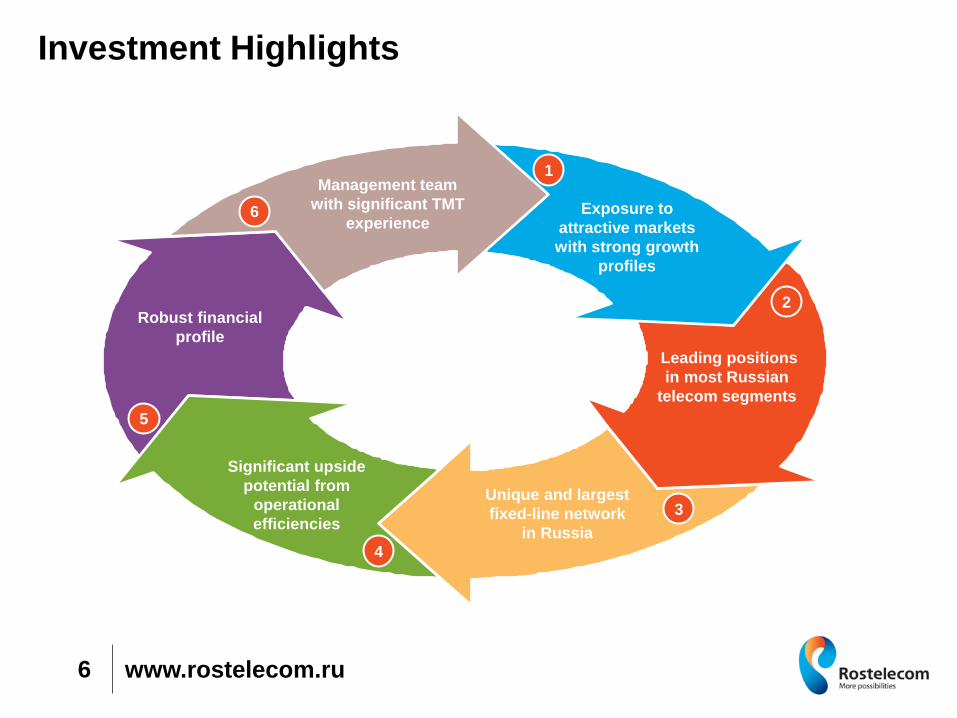
Investment Highlights
6
2
3
4
5
6
1
Exposure to
attractive markets
with strong growth
profiles
Leading positions
in most Russian
telecom segments
Unique and largest
fixed-line network
in Russia
Significant upside
potential from
operational
efficiencies
Robust financial
profile
Management team
with significant TMT
experience
0 170 231
240 78 35
6 58 123
253 188 95
120 172 56
128 71 144
191 162 155
0 102 204
182 213 251
www.rostelecom.ru
2.3
4.9 7.2
9.5 11.8
14.1
2013 2014F 2015F 2016F 2017F 2018F
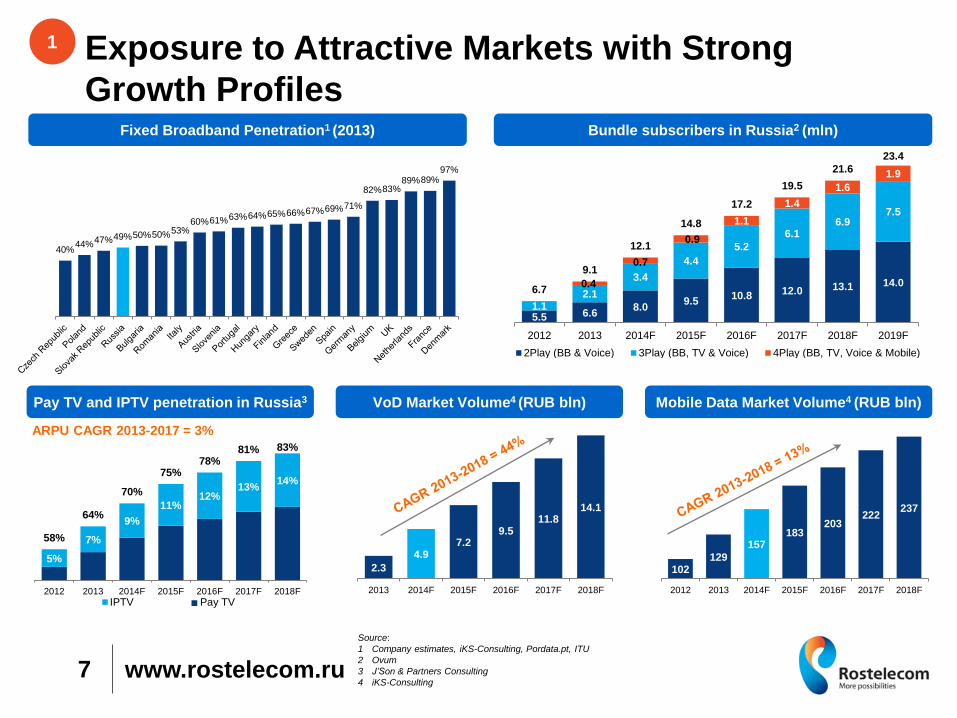
Exposure to Attractive Markets with Strong
Growth Profiles
7
1
Pay TV and IPTV penetration in Russia3
Fixed Broadband Penetration1 (2013)
VoD Market Volume4 (RUB bln) Mobile Data Market Volume4 (RUB bln)
ARPU CAGR 2013-2017 = 3%
5.5 6.6 8.0
9.5 10.8 12.0 13.1 14.0
1.1 2.1
3.4
4.4
5.2
6.1 6.9
7.5
0.4
0.7
0.9
1.1
1.4
1.6
1.9
6.7
9.1
12.1
14.8
17.2
19.5
21.6
23.4
2012 2013 2014F 2015F 2016F 2017F 2018F 2019F
2Play (BB & Voice) 3Play (BB, TV & Voice) 4Play (BB, TV, Voice & Mobile)
Bundle subscribers in Russia2 (mln)
102 129
157 183
203 222
237
2012 2013 2014F 2015F 2016F 2017F 2018F
Source:
1 Company estimates, iKS-Consulting, Pordata.pt, ITU
2 Ovum
3 J’Son & Partners Consulting
4 iKS-Consulting
40% 44% 47% 49% 50% 50% 53%
60% 61% 63% 64% 65% 66% 67% 69% 71%
82% 83% 89% 89%
97%
5%
7%
9%
11% 12%
13% 14%
58%
64%
70%
75% 78%
81% 83%
2012 2013 2014F 2015F 2016F 2017F 2018F
IPTV Pay TV
0 170 231
240 78 35
6 58 123
253 188 95
120 172 56
128 71 144
191 162 155
0 102 204
182 213 251
www.rostelecom.ru
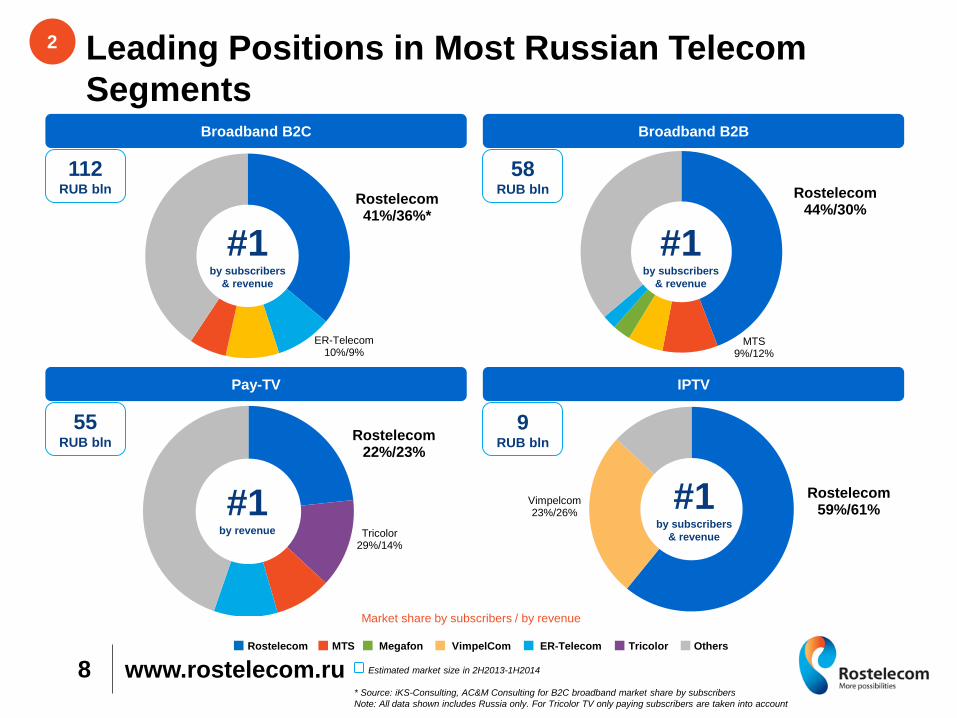
Rostelecom 41%/36%*
ER-Telecom 10%/9%
Rostelecom 22%/23%
Tricolor 29%/14%
Leading Positions in Most Russian Telecom
Segments
8
2
IPTV
Broadband B2C
Pay-TV
Broadband B2B
Rostelecom 44%/30%
MTS 9%/12%
#1 by subscribers
& revenue
#1 by revenue
Market share by subscribers / by revenue
Rostelecom 59%/61%
Vimpelcom 23%/26%
Estimated market size in 2H2013-1H2014
* Source: iKS-Consulting, AC&M Consulting for B2C broadband market share by subscribers
Note: All data shown includes Russia only. For Tricolor TV only paying subscribers are taken into account
VimpelCom Others Tricolor Megafon ER-Telecom MTS Rostelecom
112 RUB bln
55 RUB bln
58 RUB bln
9 RUB bln
#1 by subscribers
& revenue
#1 by subscribers
& revenue
www.rostelecom.ru
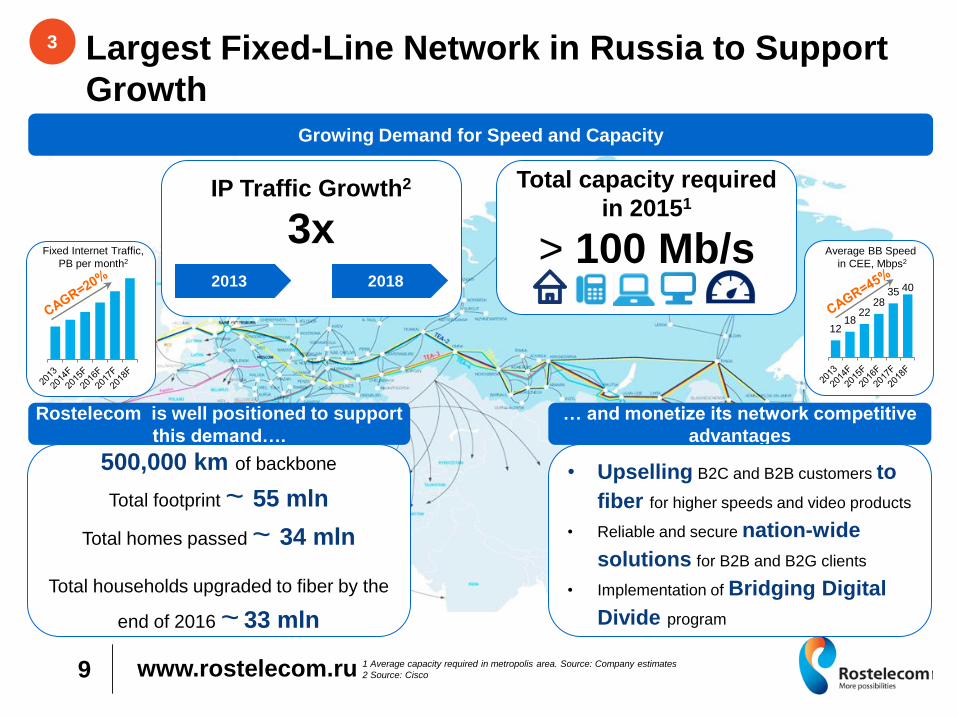
Largest Fixed-Line Network in Russia to Support
Growth
9
Growing Demand for Speed and Capacity
IP Traffic Growth2
3x
2013
2018
Rostelecom is well positioned to support
this demand….
500,000 km of backbone
Total footprint ~ 55 mln
Total homes passed ~ 34 mln
Total households upgraded to fiber by the
end of 2016 ~ 33 mln
… and monetize its network competitive
advantages
• Upselling B2C and B2B customers to
fiber for higher speeds and video products
• Reliable and secure nation-wide
solutions for B2B and B2G clients
• Implementation of Bridging Digital
Divide program
Total capacity required
in 20151
> 100 Mb/s
3
1 Average capacity required in metropolis area. Source: Company estimates
2 Source: Cisco
Fixed Internet Traffic,
PB per month2
12 18
22 28
35 40
Average BB Speed
in CEE, Mbps2
0 170 231
240 78 35
6 58 123
253 188 95
120 172 56
128 71 144
191 162 155
0 102 204
182 213 251
www.rostelecom.ru
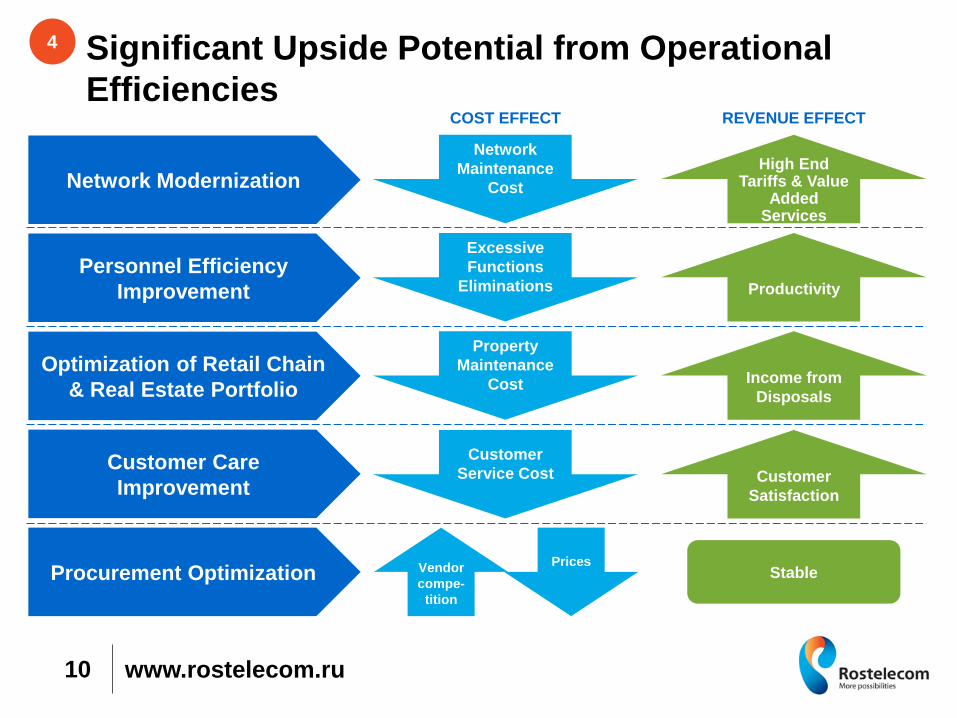
Significant Upside Potential from Operational
Efficiencies
10
COST EFFECT
Network Modernization
Network
Maintenance
Cost
REVENUE EFFECT
High End Tariffs & Value
Added Services
Personnel Efficiency
Improvement
Optimization of Retail Chain
& Real Estate Portfolio
Customer Care
Improvement
Procurement Optimization
Excessive
Functions
Eliminations Productivity
Property
Maintenance
Cost Income from
Disposals
Customer
Service Cost Customer
Satisfaction
Prices Vendor
compe-
tition
Stable
4
0 170 231
240 78 35
6 58 123
253 188 95
120 172 56
128 71 144
191 162 155
0 102 204
182 213 251
www.rostelecom.ru
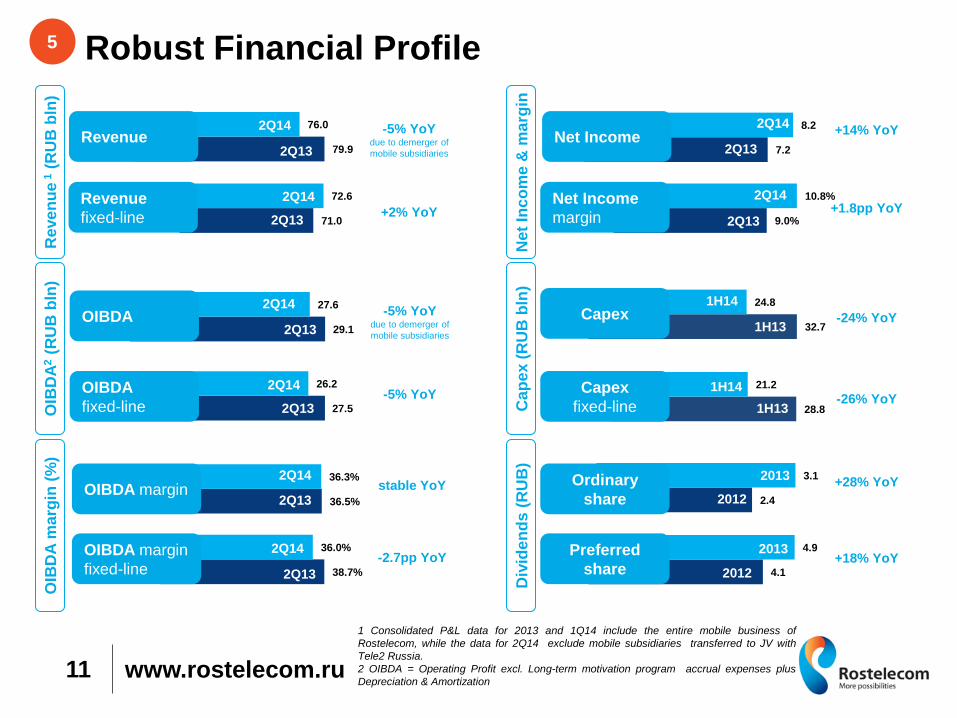
32.7
24.8
1H13
1H14
28.8
21.2
1H13
1H14
9.0%
10.8% 2Q14
2Q13
7.2
8.2 2Q14
2Q13
4.1
4.9 2013
2012
2.4
3.1 2013
2012
71.0
72.6 2Q14
2Q13
79.9
76.0 2Q14
2Q13
Robust Financial Profile
1 Consolidated P&L data for 2013 and 1Q14 include the entire mobile business of
Rostelecom, while the data for 2Q14 exclude mobile subsidiaries transferred to JV with
Tele2 Russia.
2 OIBDA = Operating Profit excl. Long-term motivation program accrual expenses plus
Depreciation & Amortization 11
Revenue
Revenue
fixed-line
Capex
Ordinary
share
Preferred
share
27.5
26.2 2Q14
2Q13
29.1
27.6 2Q14
2Q13 OIBDA
OIBDA
fixed-line Cap
ex
(R
UB
bln
)
Reve
nu
e 1 (
RU
B b
ln)
Capex
fixed-line OIB
DA
2 (
RU
B b
ln)
Div
ide
nd
s (
RU
B)
OIB
DA
ma
rgin
(%
)
Net
Inc
om
e &
ma
rgin
38.7%
36.0% 2Q14
2Q13
36.5%
36.3% 2Q14
2Q13 OIBDA margin
OIBDA margin
fixed-line
-5% YoY due to demerger of
mobile subsidiaries
+2% YoY
-5% YoY due to demerger of
mobile subsidiaries
-5% YoY
stable YoY
-2.7pp YoY
Net Income
Net Income
margin
+28% YoY
+18% YoY
-26% YoY
+14% YoY
+1.8pp YoY
-24% YoY
5
0 170 231
240 78 35
6 58 123
253 188 95
120 172 56
128 71 144
191 162 155
0 102 204
182 213 251
www.rostelecom.ru
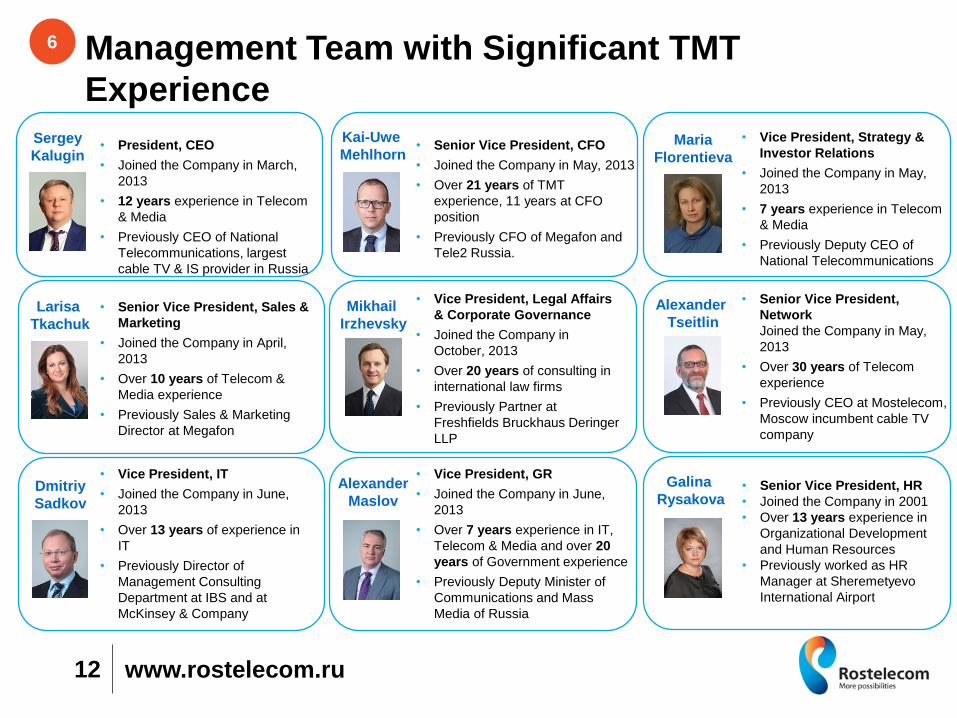
Management Team with Significant TMT
Experience
12
Sergey
Kalugin • President, CEO
• Joined the Company in March,
2013
• 12 years experience in Telecom
& Media
• Previously CEO of National
Telecommunications, largest
cable TV & IS provider in Russia
Maria
Florentieva
• Vice President, Strategy &
Investor Relations
• Joined the Company in May,
2013
• 7 years experience in Telecom
& Media
• Previously Deputy CEO of
National Telecommunications
Kai-Uwe
Mehlhorn • Senior Vice President, CFO
• Joined the Company in May, 2013
• Over 21 years of TMT
experience, 11 years at CFO
position
• Previously CFO of Megafon and
Tele2 Russia.
Larisa
Tkachuk
• Senior Vice President, Sales &
Marketing
• Joined the Company in April,
2013
• Over 10 years of Telecom &
Media experience
• Previously Sales & Marketing
Director at Megafon
Mikhail
Irzhevsky
• Vice President, Legal Affairs
& Corporate Governance
• Joined the Company in
October, 2013
• Over 20 years of consulting in
international law firms
• Previously Partner at
Freshfields Bruckhaus Deringer
LLP
Alexander
Maslov
• Vice President, GR
• Joined the Company in June,
2013
• Over 7 years experience in IT,
Telecom & Media and over 20
years of Government experience
• Previously Deputy Minister of
Communications and Mass
Media of Russia
Dmitriy
Sadkov
• Vice President, IT
• Joined the Company in June,
2013
• Over 13 years of experience in
IT
• Previously Director of
Management Consulting
Department at IBS and at
McKinsey & Company
Alexander
Tseitlin
• Senior Vice President,
Network
Joined the Company in May,
2013
• Over 30 years of Telecom
experience
• Previously CEO at Mostelecom,
Moscow incumbent cable TV
company
6
Galina
Rysakova • Senior Vice President, HR
• Joined the Company in 2001
• Over 13 years experience in
Organizational Development
and Human Resources
• Previously worked as HR
Manager at Sheremetyevo
International Airport
0 170 231
240 78 35
6 58 123
253 188 95
120 172 56
128 71 144
191 162 155
0 102 204
182 213 251
2. Rostelecom Strategic
Priorities
0 170 231
240 78 35
6 58 123
253 188 95
120 172 56
128 71 144
191 162 155
0 102 204
182 213 251
www.rostelecom.ru
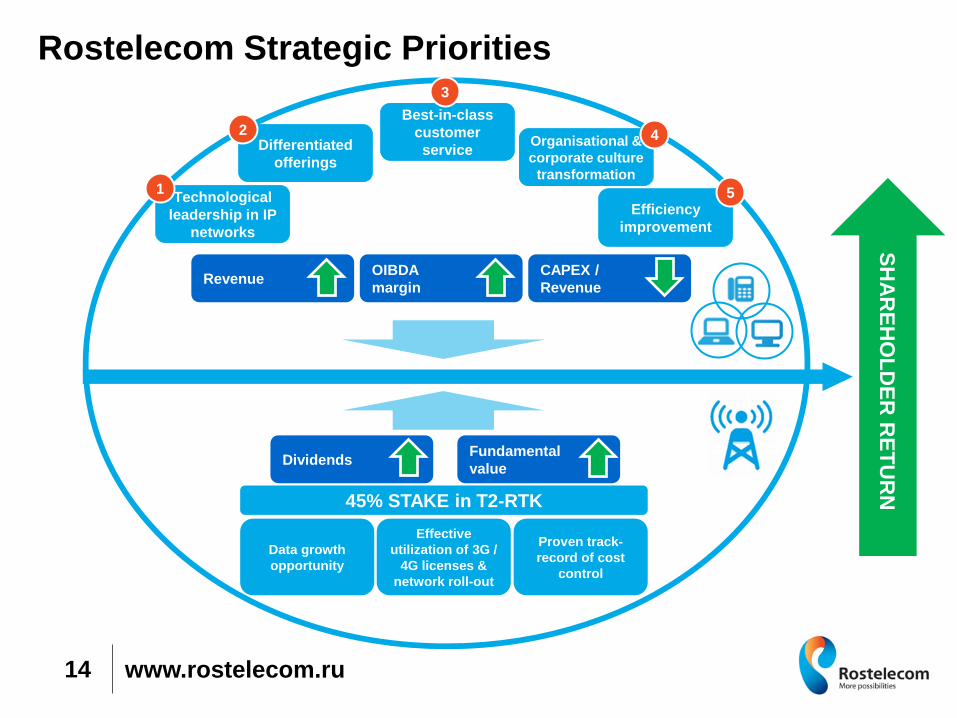
Rostelecom Strategic Priorities
14
Revenue CAPEX /
Revenue
OIBDA
margin
Technological
leadership in IP
networks
1
Differentiated
offerings
2 Best-in-class
customer
service
3
Organisational &
corporate culture
transformation
4
Efficiency
improvement
5
SH
AR
EH
OL
DE
R R
ET
UR
N
Proven track-
record of cost
control
Effective
utilization of 3G /
4G licenses &
network roll-out
Data growth
opportunity
45% STAKE in T2-RTK
Dividends Fundamental
value
0 170 231
240 78 35
6 58 123
253 188 95
120 172 56
128 71 144
191 162 155
0 102 204
182 213 251
www.rostelecom.ru
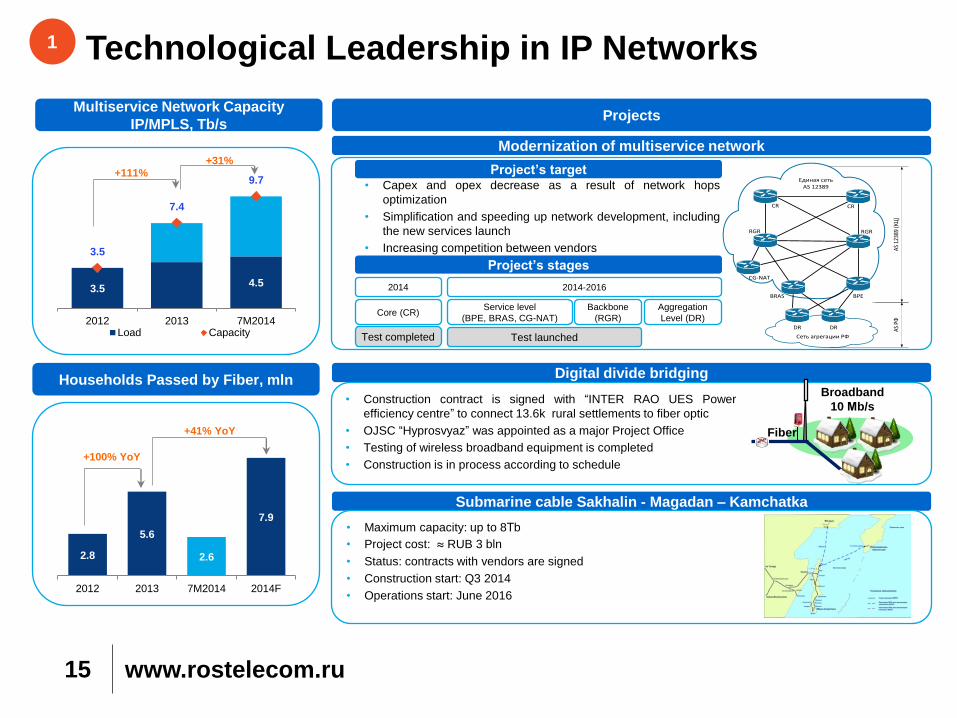
Technological Leadership in IP Networks
15
Projects Multiservice Network Capacity
IP/MPLS, Tb/s
Households Passed by Fiber, mln
Submarine cable Sakhalin - Magadan – Kamchatka
Modernization of multiservice network
Digital divide bridging
Сеть агрегации РФ
AS 1
2389
(КЦ
)AS
РФ
Единая сетьAS 12389
CR CR
RGR RGR
CG-NAT
BRAS
DR DR
BPE
• Capex and opex decrease as a result of network hops
optimization
• Simplification and speeding up network development, including
the new services launch
• Increasing competition between vendors
Core (CR) Service level
(BPE, BRAS, CG-NAT)
2014 2014-2016
Backbone
(RGR)
Aggregation
Level (DR)
Test completed Test launched
Project’s stages
Project’s target
Fiber
Broadband
10 Мb/s • Construction contract is signed with “INTER RAO UES Power
efficiency centre” to connect 13.6k rural settlements to fiber optic
• OJSC “Hyprosvyaz” was appointed as a major Project Office
• Testing of wireless broadband equipment is completed
• Construction is in process according to schedule
• Maximum capacity: up to 8Тb
• Project cost: ≈ RUB 3 bln
• Status: contracts with vendors are signed
• Construction start: Q3 2014
• Operations start: June 2016
3.5 4.5
3.5
7.4
9.7
2012 2013 7M2014Load Capacity
+111% +31%
2.8
5.6
2.6
7.9
2012 2013 7M2014 2014F
+100% YoY
+41% YoY
1
0 170 231
240 78 35
6 58 123
253 188 95
120 172 56
128 71 144
191 162 155
0 102 204
182 213 251
www.rostelecom.ru
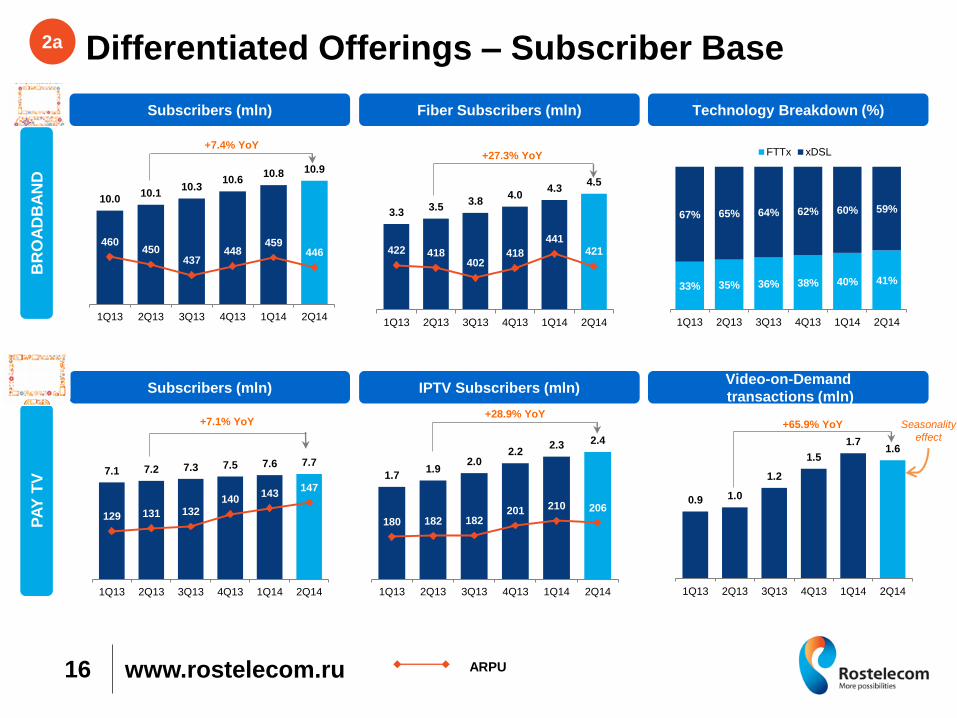
Differentiated Offerings – Subscriber Base
16
Subscribers (mln)
Subscribers (mln) Video-on-Demand
transactions (mln)
Technology Breakdown (%)
ARPU
Fiber Subscribers (mln)
IPTV Subscribers (mln)
7.1 7.2 7.3 7.5 7.6 7.7
129 131 132 140
143 147
1Q13 2Q13 3Q13 4Q13 1Q14 2Q14
+7.1% YoY
3.3 3.5
3.8 4.0
4.3 4.5
422 418 402
418
441 421
1Q13 2Q13 3Q13 4Q13 1Q14 2Q14
+27.3% YoY
0.9 1.0
1.2
1.5
1.7 1.6
1Q13 2Q13 3Q13 4Q13 1Q14 2Q14
+65.9% YoY Seasonality
effect
PA
Y T
V
BR
OA
DB
AN
D
2a
10.0 10.1
10.3 10.6
10.8 10.9
460 450
437 448
459 446
1Q13 2Q13 3Q13 4Q13 1Q14 2Q14
+7.4% YoY
1.7 1.9
2.0 2.2
2.3 2.4
180 182 182 201 210 206
1Q13 2Q13 3Q13 4Q13 1Q14 2Q14
+28.9% YoY
33% 35% 36% 38% 40% 41%
67% 65% 64% 62% 60% 59%
1Q13 2Q13 3Q13 4Q13 1Q14 2Q14
FTTx xDSL
0 170 231
240 78 35
6 58 123
253 188 95
120 172 56
128 71 144
191 162 155
0 102 204
182 213 251
www.rostelecom.ru
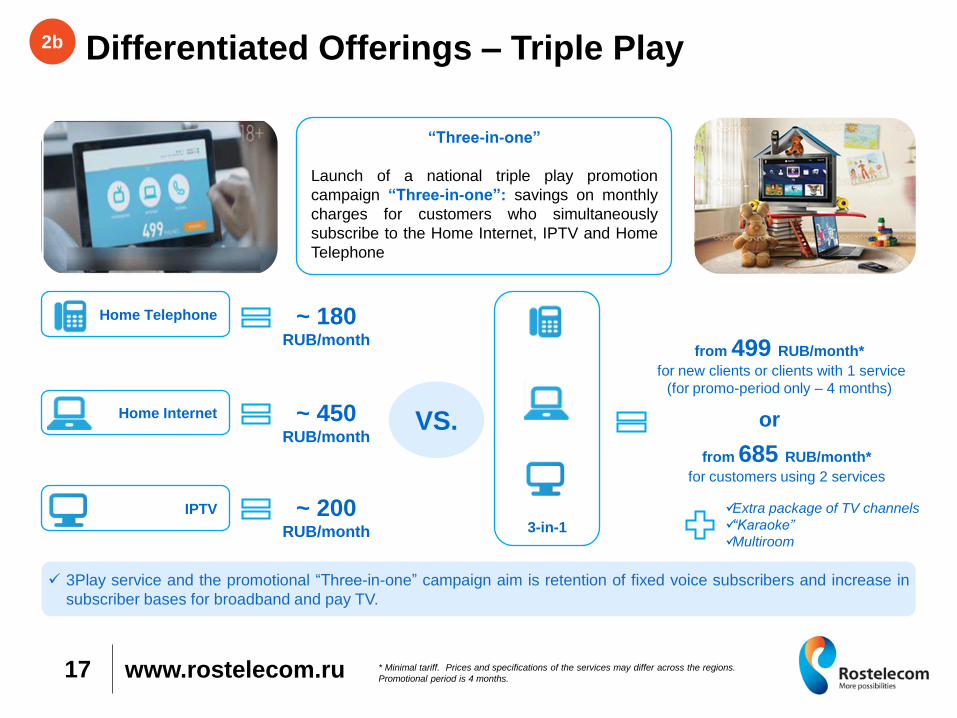
Differentiated Offerings – Triple Play
17
2b
“Three-in-one”
Launch of a national triple play promotion
campaign “Three-in-one”: savings on monthly
charges for customers who simultaneously
subscribe to the Home Internet, IPTV and Home
Telephone
Home Internet ~ 450
RUB/month VS.
Home Telephone ~ 180
RUB/month
IPTV ~ 200
RUB/month 3-in-1
from 499 RUB/month*
for new clients or clients with 1 service
(for promo-period only – 4 months)
Extra package of TV channels
“Karaoke”
Multiroom
3Play service and the promotional “Three-in-one” campaign aim is retention of fixed voice subscribers and increase in
subscriber bases for broadband and pay TV.
from 685 RUB/month*
for customers using 2 services
* Minimal tariff. Prices and specifications of the services may differ across the regions.
Promotional period is 4 months.
or
0 170 231
240 78 35
6 58 123
253 188 95
120 172 56
128 71 144
191 162 155
0 102 204
182 213 251
www.rostelecom.ru
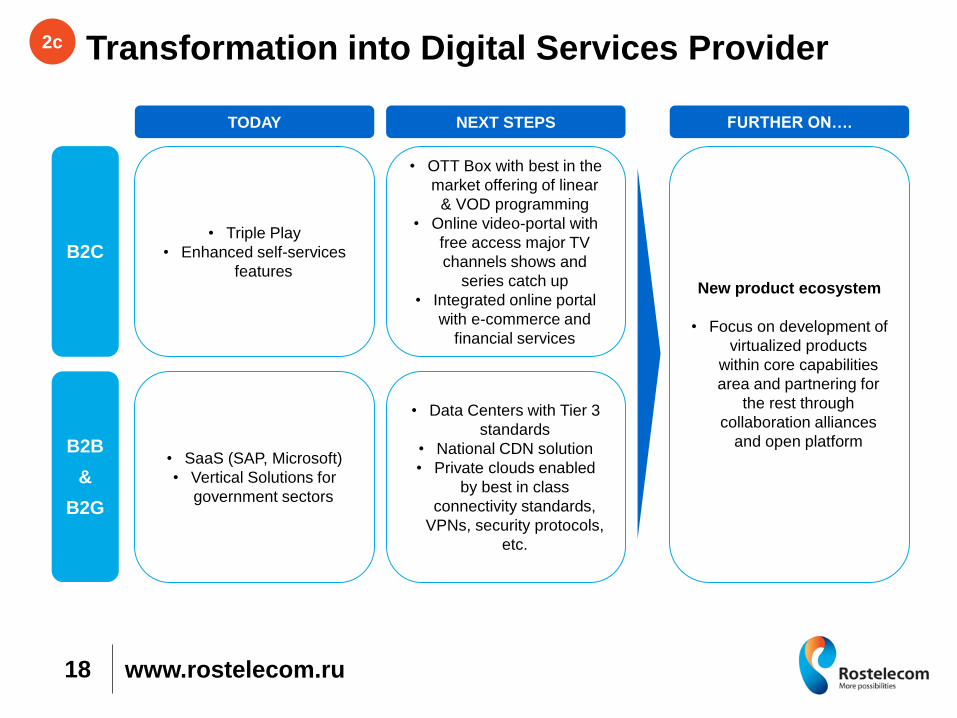
Transformation into Digital Services Provider
18
B2C
B2B
&
B2G
• Triple Play
• Enhanced self-services
features
• SaaS (SAP, Microsoft)
• Vertical Solutions for
government sectors
• OTT Box with best in the
market offering of linear
& VOD programming
• Online video-portal with
free access major TV
channels shows and
series catch up
• Integrated online portal
with e-commerce and
financial services
• Data Centers with Tier 3
standards
• National CDN solution
• Private clouds enabled
by best in class
connectivity standards,
VPNs, security protocols,
etc.
TODAY NEXT STEPS FURTHER ON….
New product ecosystem
• Focus on development of
virtualized products
within core capabilities
area and partnering for
the rest through
collaboration alliances
and open platform
2c
0 170 231
240 78 35
6 58 123
253 188 95
120 172 56
128 71 144
191 162 155
0 102 204
182 213 251
www.rostelecom.ru
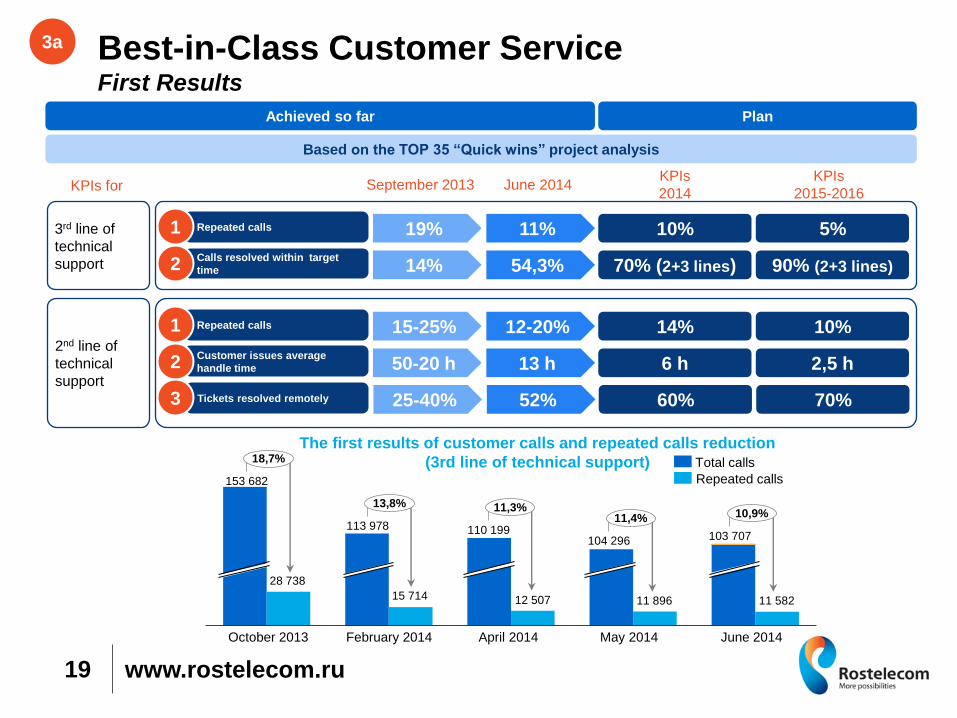
Best-in-Class Customer Service First Results
19
3a
Based on the TOP 35 “Quick wins” project analysis
September 2013 June 2014 KPIs
2015-2016
Repeated calls 1 19% 11% 5%
Calls resolved within target
time 2 14% 54,3% 90% (2+3 lines)
3rd line of
technical
support
Repeated calls 1 15-25% 12-20% 10%
Customer issues average
handle time 2 50-20 h 13 h 2,5 h 2nd line of
technical
support Tickets resolved remotely 3 25-40% 52% 70%
Plan Achieved so far
The first results of customer calls and repeated calls reduction
(3rd line of technical support)
28 738
15 714 12 507 11 896 11 582
11,3%
June 2014
103 707
May 2014
10,9% 11,4%
13,8%
104 296
April 2014
110 199
February 2014
113 978
October 2013
18,7%
153 682 Repeated calls
Total calls
10%
70% (2+3 lines)
14%
6 h
60%
KPIs
2014 KPIs for
0 170 231
240 78 35
6 58 123
253 188 95
120 172 56
128 71 144
191 162 155
0 102 204
182 213 251
www.rostelecom.ru
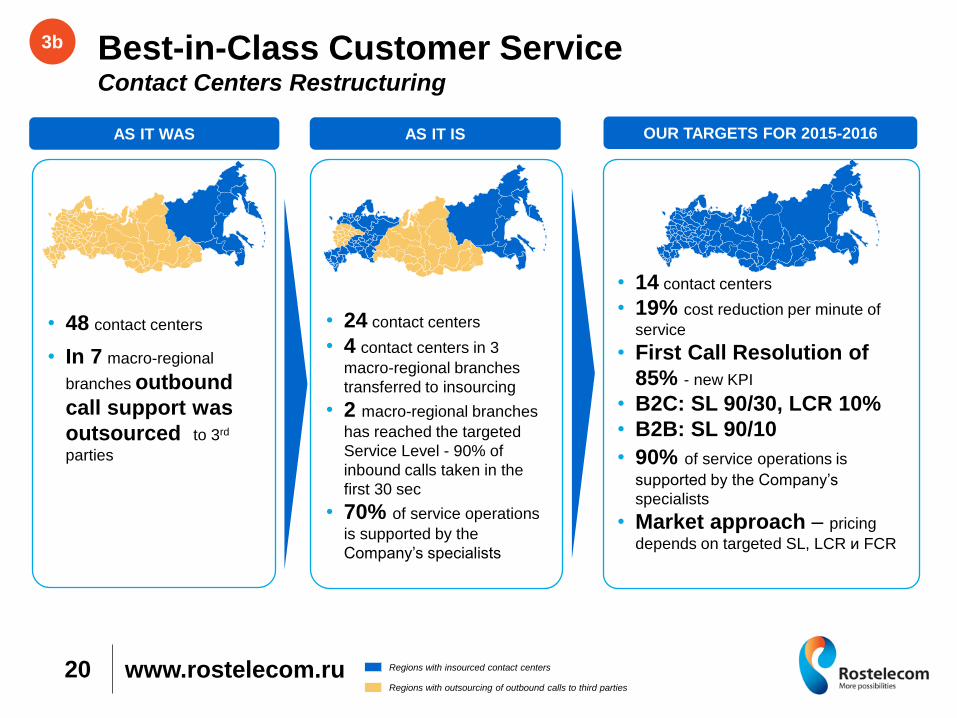
• 24 contact centers
• 4 contact centers in 3
macro-regional branches
transferred to insourcing
• 2 macro-regional branches
has reached the targeted
Service Level - 90% of
inbound calls taken in the
first 30 sec
• 70% of service operations
is supported by the
Company‟s specialists
• 14 contact centers
• 19% cost reduction per minute of
service
• First Call Resolution of
85% - new KPI
• B2C: SL 90/30, LCR 10%
• B2B: SL 90/10
• 90% of service operations is
supported by the Company‟s
specialists
• Market approach – pricing
depends on targeted SL, LCR и FCR
• 48 contact centers
• In 7 macro-regional
branches outbound
call support was
outsourced to 3rd
parties
Best-in-Class Customer Service Contact Centers Restructuring
20
3b
AS IT WAS AS IT IS OUR TARGETS FOR 2015-2016
Regions with outsourcing of outbound calls to third parties
Regions with insourced contact centers
0 170 231
240 78 35
6 58 123
253 188 95
120 172 56
128 71 144
191 162 155
0 102 204
182 213 251
www.rostelecom.ru
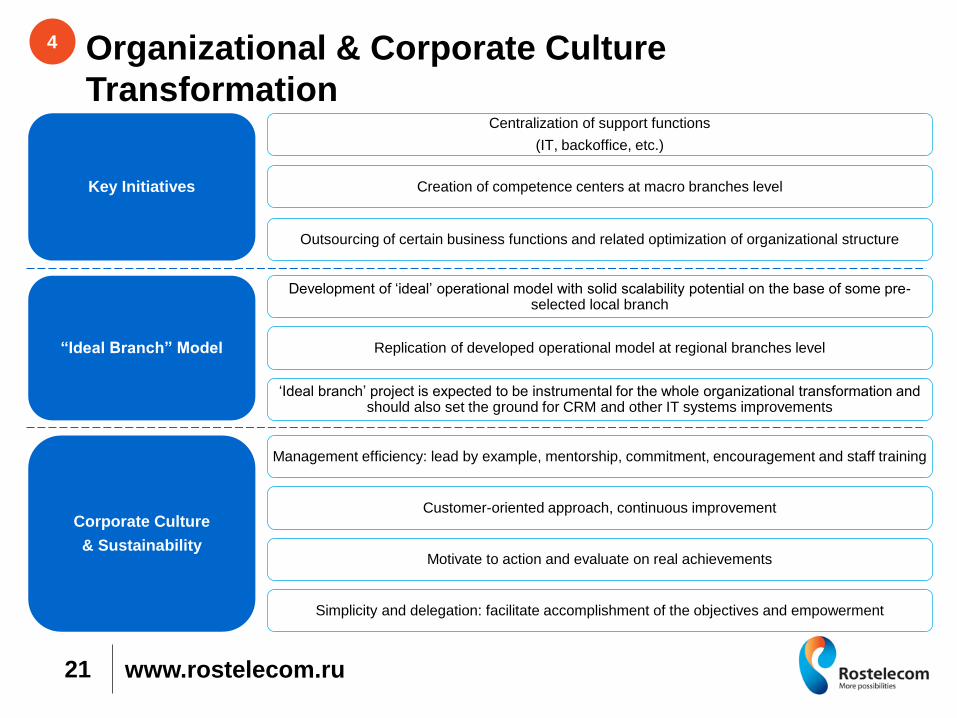
Organizational & Corporate Culture
Transformation
21
4
Key Initiatives
“Ideal Branch” Model
Corporate Culture
& Sustainability
Centralization of support functions
(IT, backoffice, etc.)
Creation of competence centers at macro branches level
Outsourcing of certain business functions and related optimization of organizational structure
Development of „ideal‟ operational model with solid scalability potential on the base of some pre-selected local branch
Replication of developed operational model at regional branches level
„Ideal branch‟ project is expected to be instrumental for the whole organizational transformation and should also set the ground for CRM and other IT systems improvements
Management efficiency: lead by example, mentorship, commitment, encouragement and staff training
Customer-oriented approach, continuous improvement
Motivate to action and evaluate on real achievements
Simplicity and delegation: facilitate accomplishment of the objectives and empowerment

0 170 231
240 78 35
6 58 123
253 188 95
120 172 56
128 71 144
191 162 155
0 102 204
182 213 251
www.rostelecom.ru 22
5
Personnel productivity
Total savings breakdown Project result: +1-2% OIBDA margin increase by 2017
26%
22%
7% 6%
5%
4%
2% 2%
26%
Points of sale
Personnel efficiency
Network modernization
Consolidation of controlcenters
Contact-centers
Rent of channels
Real estate in use
Bills printing and delivery
Other
RUB
15 bln of savings
Efficiency Improvement
2.9
4.24.6
2.9
1.8
Data for foreign operators include mobile business data (Source: companies’ data, World Bank)
Revenue per employee, RUB mln/person
CAGR
+10%
Orange DT/T-Mobile AT&T RTK
2018
RTK
2013
>2.5
Inflation
Str
uctu
ral
Busin
ess
Changes
OIB
DA
2017
OIB
DA
2013
Com
petition
Negative Effect Positive Effect
Pro
cure
ment
OE
I
Pro
gra
m
Pers
onnel
Optim
ization
Procurement savings, RUB bln
3.5
16.1
8.5
>12.0
2012 2013 1H2014 2014F
0 170 231
240 78 35
6 58 123
253 188 95
120 172 56
128 71 144
191 162 155
0 102 204
182 213 251
www.rostelecom.ru
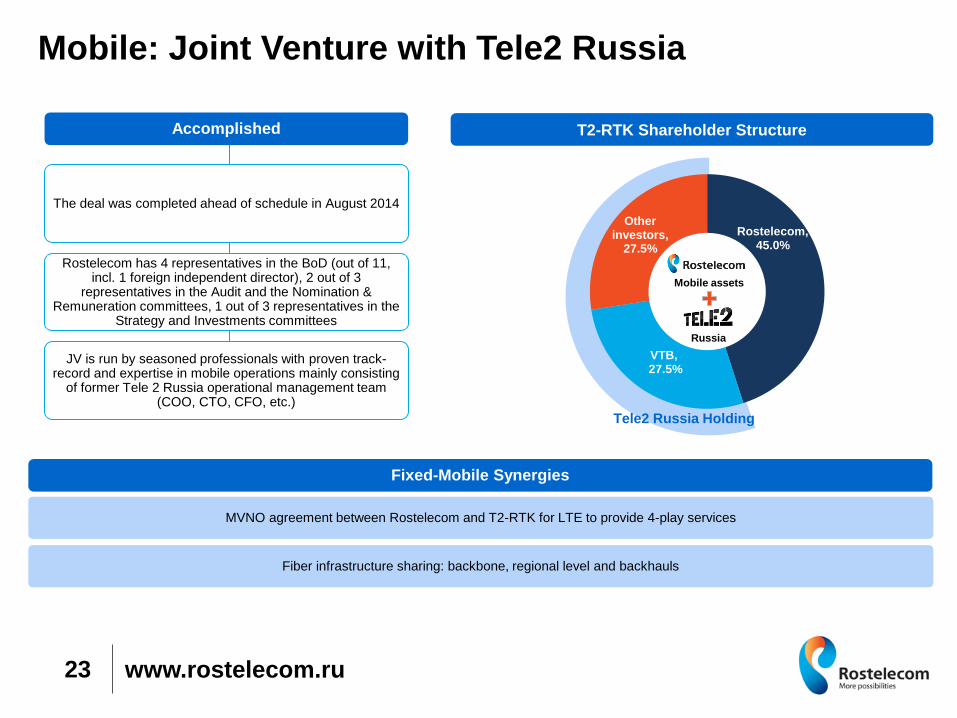
Rostelecom, 45.0%
VTB, 27.5%
Other investors,
27.5%
Mobile: Joint Venture with Tele2 Russia
23
Russia
Mobile assets
T2-RTK Shareholder Structure
The deal was completed ahead of schedule in August 2014
Rostelecom has 4 representatives in the BoD (out of 11, incl. 1 foreign independent director), 2 out of 3
representatives in the Audit and the Nomination & Remuneration committees, 1 out of 3 representatives in the
Strategy and Investments committees
JV is run by seasoned professionals with proven track-record and expertise in mobile operations mainly consisting
of former Tele 2 Russia operational management team (COO, CTO, CFO, etc.)
Accomplished
Fixed-Mobile Synergies
MVNO agreement between Rostelecom and T2-RTK for LTE to provide 4-play services
Fiber infrastructure sharing: backbone, regional level and backhauls
Tele2 Russia Holding
0 170 231
240 78 35
6 58 123
253 188 95
120 172 56
128 71 144
191 162 155
0 102 204
182 213 251
3. Financial Results & Outlook
0 170 231
240 78 35
6 58 123
253 188 95
120 172 56
128 71 144
191 162 155
0 102 204
182 213 251
www.rostelecom.ru
= 𝐑𝐔𝐁 𝟏𝟖𝟓. 𝟓 𝐛𝐥𝐧
CAPEX (RUB bln)
and CAPEX / Revenue (%)
OIBDA2 (RUB bln)
and OIBDA Margin (%) Revenue 1 (RUB bln)
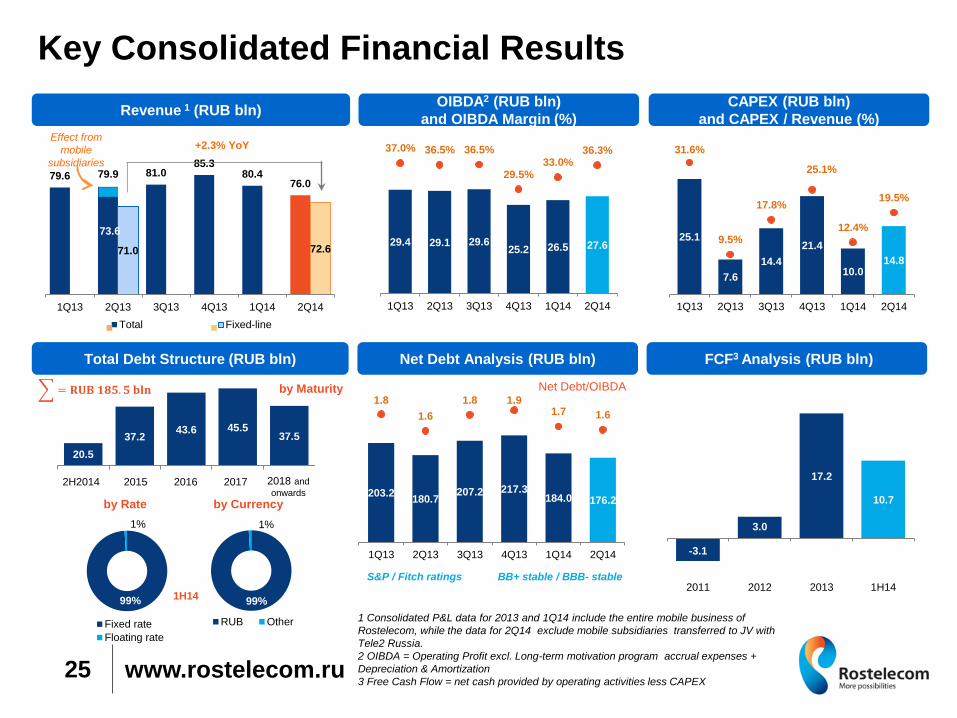
Key Consolidated Financial Results
25
79.6
73.6
81.0 85.3
80.4 76.0
71.0 72.6
1Q13 2Q13 3Q13 4Q13 1Q14 2Q14
Total Fixed-line
+2.3% YoY Effect from
mobile
subsidiaries
79.9
29.4 29.1 29.6 25.2 26.5 27.6
37.0% 36.5% 36.5%
29.5% 33.0%
36.3%
1Q13 2Q13 3Q13 4Q13 1Q14 2Q14
1 Consolidated P&L data for 2013 and 1Q14 include the entire mobile business of
Rostelecom, while the data for 2Q14 exclude mobile subsidiaries transferred to JV with
Tele2 Russia.
2 OIBDA = Operating Profit excl. Long-term motivation program accrual expenses +
Depreciation & Amortization
3 Free Cash Flow = net cash provided by operating activities less CAPEX
Net Debt/OIBDA
203.2 180.7
207.2 217.3 184.0 176.2
1.8
1.6
1.8 1.9 1.7 1.6
1Q13 2Q13 3Q13 4Q13 1Q14 2Q14
Net Debt Analysis (RUB bln) FCF3 Analysis (RUB bln) Total Debt Structure (RUB bln)
20.5
37.2 43.6 45.5
37.5
2H2014 2018 and
onwards 2016 2017 2015
by Maturity
by Rate by Currency
25.1
7.6
14.4
21.4
10.0 14.8
31.6%
9.5%
17.8%
25.1%
12.4%
19.5%
1Q13 2Q13 3Q13 4Q13 1Q14 2Q14
S&P / Fitch ratings BB+ stable / BBB- stable
Fixed rate
Floating rate
1%
99%
RUB Other
1%
99% 1H14
-3.1
3.0
17.2
10.7
2011 2012 2013 1H14
0 170 231
240 78 35
6 58 123
253 188 95
120 172 56
128 71 144
191 162 155
0 102 204
182 213 251
www.rostelecom.ru
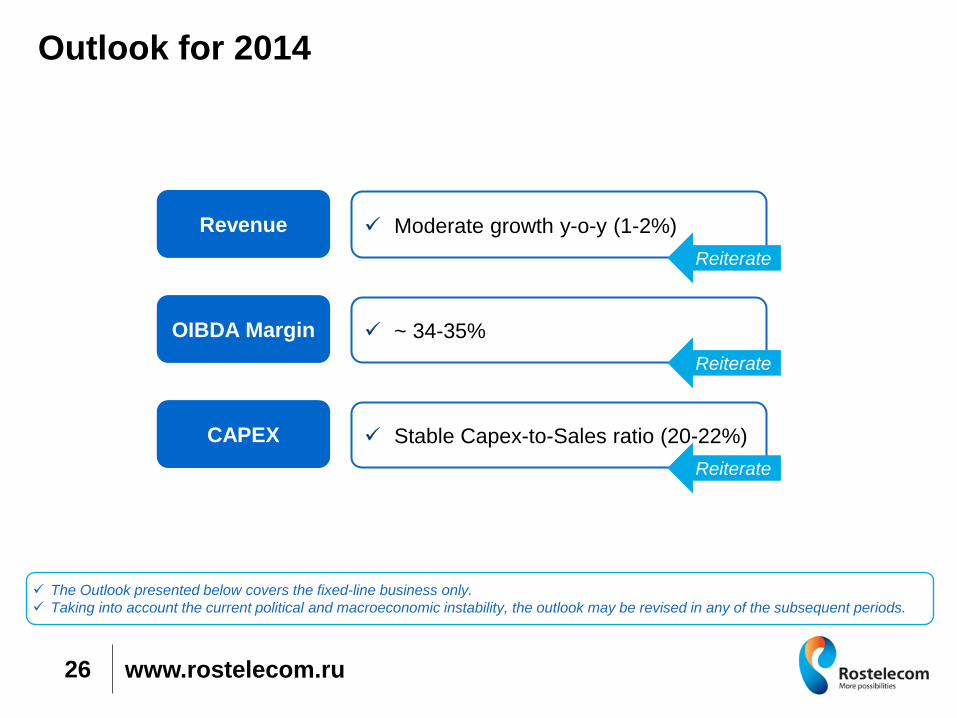
Outlook for 2014
26
The Outlook presented below covers the fixed-line business only.
Taking into account the current political and macroeconomic instability, the outlook may be revised in any of the subsequent periods.
Revenue Moderate growth y-o-y (1-2%)
OIBDA Margin ~ 34-35%
CAPEX Stable Capex-to-Sales ratio (20-22%)
Reiterate
Reiterate
Reiterate
0 170 231
240 78 35
6 58 123
253 188 95
120 172 56
128 71 144
191 162 155
0 102 204
182 213 251
Appendices
0 170 231
240 78 35
6 58 123
253 188 95
120 172 56
128 71 144
191 162 155
0 102 204
182 213 251
www.rostelecom.ru
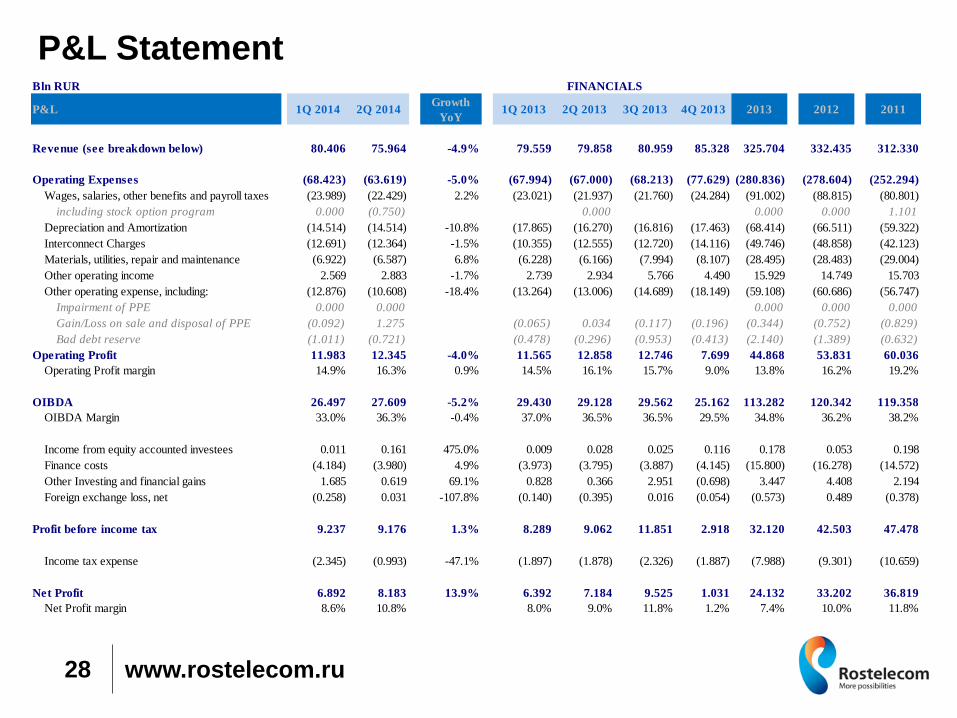
P&L Statement
28
Bln RUR
P&L 1Q 2014 2Q 2014Growth
YoY1Q 2013 2Q 2013 3Q 2013 4Q 2013 2013 2012 2011
Revenue (see breakdown below) 80.406 75.964 -4.9% 79.559 79.858 80.959 85.328 325.704 332.435 312.330
Operating Expenses (68.423) (63.619) -5.0% (67.994) (67.000) (68.213) (77.629) (280.836) (278.604) (252.294)
Wages, salaries, other benefits and payroll taxes (23.989) (22.429) 2.2% (23.021) (21.937) (21.760) (24.284) (91.002) (88.815) (80.801)
including stock option program 0.000 (0.750) 0.000 0.000 0.000 1.101
Depreciation and Amortization (14.514) (14.514) -10.8% (17.865) (16.270) (16.816) (17.463) (68.414) (66.511) (59.322)
Interconnect Charges (12.691) (12.364) -1.5% (10.355) (12.555) (12.720) (14.116) (49.746) (48.858) (42.123)
Materials, utilities, repair and maintenance (6.922) (6.587) 6.8% (6.228) (6.166) (7.994) (8.107) (28.495) (28.483) (29.004)
Other operating income 2.569 2.883 -1.7% 2.739 2.934 5.766 4.490 15.929 14.749 15.703
Other operating expense, including: (12.876) (10.608) -18.4% (13.264) (13.006) (14.689) (18.149) (59.108) (60.686) (56.747)
Impairment of PPE 0.000 0.000 0.000 0.000 0.000
Gain/Loss on sale and disposal of PPE (0.092) 1.275 3650.0% (0.065) 0.034 (0.117) (0.196) (0.344) (0.752) (0.829)
Bad debt reserve (1.011) (0.721) 143.6% (0.478) (0.296) (0.953) (0.413) (2.140) (1.389) (0.632)
Operating Profit 11.983 12.345 -4.0% 11.565 12.858 12.746 7.699 44.868 53.831 60.036
Operating Profit margin 14.9% 16.3% 0.9% 14.5% 16.1% 15.7% 9.0% 13.8% 16.2% 19.2%
OIBDA 26.497 27.609 -5.2% 29.430 29.128 29.562 25.162 113.282 120.342 119.358
OIBDA Margin 33.0% 36.3% -0.4% 37.0% 36.5% 36.5% 29.5% 34.8% 36.2% 38.2%
Income from equity accounted investees 0.011 0.161 475.0% 0.009 0.028 0.025 0.116 0.178 0.053 0.198
Finance costs (4.184) (3.980) 4.9% (3.973) (3.795) (3.887) (4.145) (15.800) (16.278) (14.572)
Other Investing and financial gains 1.685 0.619 69.1% 0.828 0.366 2.951 (0.698) 3.447 4.408 2.194
Foreign exchange loss, net (0.258) 0.031 -107.8% (0.140) (0.395) 0.016 (0.054) (0.573) 0.489 (0.378)
Profit before income tax 9.237 9.176 1.3% 8.289 9.062 11.851 2.918 32.120 42.503 47.478
Income tax expense (2.345) (0.993) -47.1% (1.897) (1.878) (2.326) (1.887) (7.988) (9.301) (10.659)
Net Profit 6.892 8.183 13.9% 6.392 7.184 9.525 1.031 24.132 33.202 36.819
Net Profit margin 8.6% 10.8% 8.0% 9.0% 11.8% 1.2% 7.4% 10.0% 11.8%
FINANCIALS
0 170 231
240 78 35
6 58 123
253 188 95
120 172 56
128 71 144
191 162 155
0 102 204
182 213 251
www.rostelecom.ru
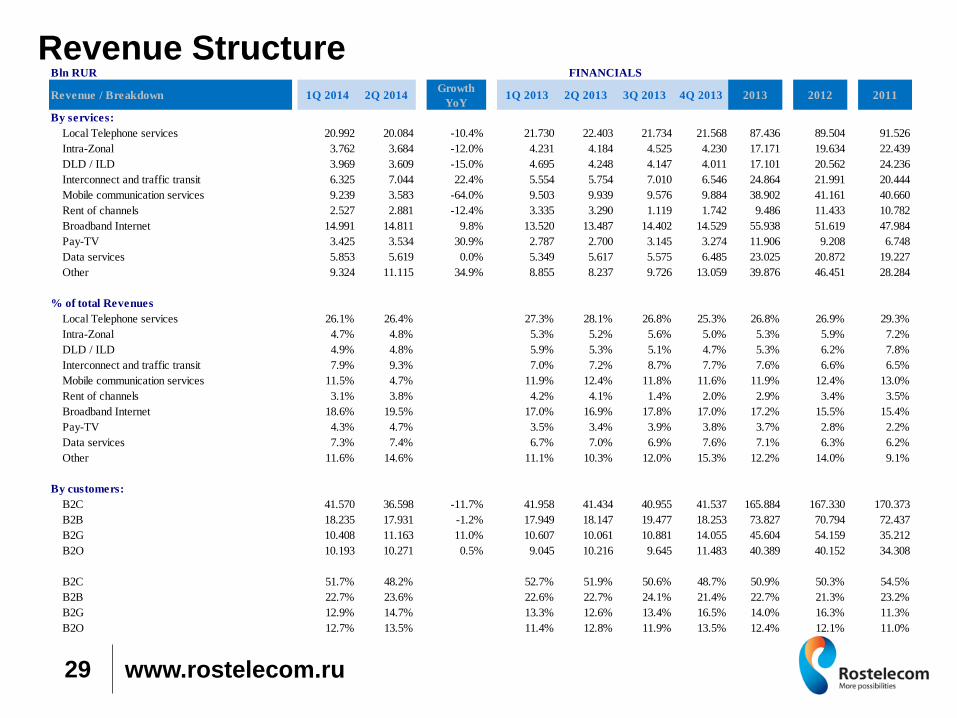
Revenue Structure
29
Bln RUR
Revenue / Breakdown 1Q 2014 2Q 2014Growth
YoY1Q 2013 2Q 2013 3Q 2013 4Q 2013 2013 2012 2011
By services:
Local Telephone services 20.992 20.084 -10.4% 21.730 22.403 21.734 21.568 87.436 89.504 91.526
Intra-Zonal 3.762 3.684 -12.0% 4.231 4.184 4.525 4.230 17.171 19.634 22.439
DLD / ILD 3.969 3.609 -15.0% 4.695 4.248 4.147 4.011 17.101 20.562 24.236
Interconnect and traffic transit 6.325 7.044 22.4% 5.554 5.754 7.010 6.546 24.864 21.991 20.444
Mobile communication services 9.239 3.583 -64.0% 9.503 9.939 9.576 9.884 38.902 41.161 40.660
Rent of channels 2.527 2.881 -12.4% 3.335 3.290 1.119 1.742 9.486 11.433 10.782
Broadband Internet 14.991 14.811 9.8% 13.520 13.487 14.402 14.529 55.938 51.619 47.984
Pay-TV 3.425 3.534 30.9% 2.787 2.700 3.145 3.274 11.906 9.208 6.748
Data services 5.853 5.619 0.0% 5.349 5.617 5.575 6.485 23.025 20.872 19.227
Other 9.324 11.115 34.9% 8.855 8.237 9.726 13.059 39.876 46.451 28.284
% of total Revenues
Local Telephone services 26.1% 26.4% 27.3% 28.1% 26.8% 25.3% 26.8% 26.9% 29.3%
Intra-Zonal 4.7% 4.8% 5.3% 5.2% 5.6% 5.0% 5.3% 5.9% 7.2%
DLD / ILD 4.9% 4.8% 5.9% 5.3% 5.1% 4.7% 5.3% 6.2% 7.8%
Interconnect and traffic transit 7.9% 9.3% 7.0% 7.2% 8.7% 7.7% 7.6% 6.6% 6.5%
Mobile communication services 11.5% 4.7% 11.9% 12.4% 11.8% 11.6% 11.9% 12.4% 13.0%
Rent of channels 3.1% 3.8% 4.2% 4.1% 1.4% 2.0% 2.9% 3.4% 3.5%
Broadband Internet 18.6% 19.5% 17.0% 16.9% 17.8% 17.0% 17.2% 15.5% 15.4%
Pay-TV 4.3% 4.7% 3.5% 3.4% 3.9% 3.8% 3.7% 2.8% 2.2%
Data services 7.3% 7.4% 6.7% 7.0% 6.9% 7.6% 7.1% 6.3% 6.2%
Other 11.6% 14.6% 11.1% 10.3% 12.0% 15.3% 12.2% 14.0% 9.1%
By customers:
B2C 41.570 36.598 -11.7% 41.958 41.434 40.955 41.537 165.884 167.330 170.373
B2B 18.235 17.931 -1.2% 17.949 18.147 19.477 18.253 73.827 70.794 72.437
B2G 10.408 11.163 11.0% 10.607 10.061 10.881 14.055 45.604 54.159 35.212
B2O 10.193 10.271 0.5% 9.045 10.216 9.645 11.483 40.389 40.152 34.308
B2C 51.7% 48.2% 52.7% 51.9% 50.6% 48.7% 50.9% 50.3% 54.5%
B2B 22.7% 23.6% 22.6% 22.7% 24.1% 21.4% 22.7% 21.3% 23.2%
B2G 12.9% 14.7% 13.3% 12.6% 13.4% 16.5% 14.0% 16.3% 11.3%
B2O 12.7% 13.5% 11.4% 12.8% 11.9% 13.5% 12.4% 12.1% 11.0%
FINANCIALS
0 170 231
240 78 35
6 58 123
253 188 95
120 172 56
128 71 144
191 162 155
0 102 204
182 213 251
www.rostelecom.ru
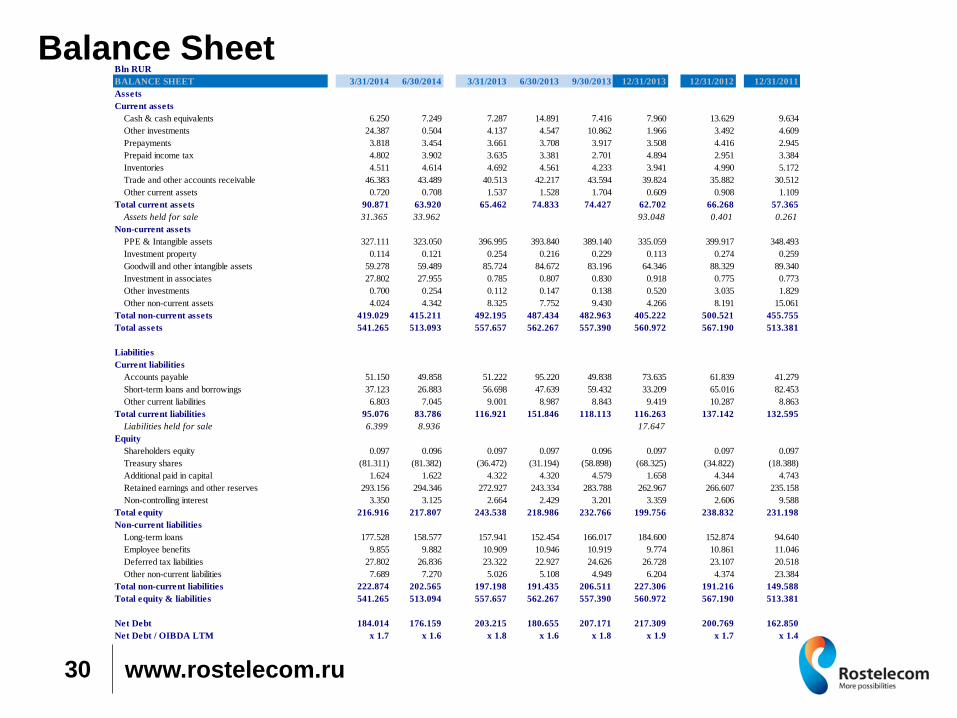
Balance Sheet
30
Bln RUR
BALANCE SHEET 3/31/2014 6/30/2014 3/31/2013 6/30/2013 9/30/2013 12/31/2013 12/31/2012 12/31/2011
Assets
Current assets
Cash & cash equivalents 6.250 7.249 7.287 14.891 7.416 7.960 13.629 9.634
Other investments 24.387 0.504 4.137 4.547 10.862 1.966 3.492 4.609
Prepayments 3.818 3.454 3.661 3.708 3.917 3.508 4.416 2.945
Prepaid income tax 4.802 3.902 3.635 3.381 2.701 4.894 2.951 3.384
Inventories 4.511 4.614 4.692 4.561 4.233 3.941 4.990 5.172
Trade and other accounts receivable 46.383 43.489 40.513 42.217 43.594 39.824 35.882 30.512
Other current assets 0.720 0.708 1.537 1.528 1.704 0.609 0.908 1.109
Total current assets 90.871 63.920 65.462 74.833 74.427 62.702 66.268 57.365
Assets held for sale 31.365 33.962 93.048 0.401 0.261
Non-current assets
PPE & Intangible assets 327.111 323.050 396.995 393.840 389.140 335.059 399.917 348.493
Investment property 0.114 0.121 0.254 0.216 0.229 0.113 0.274 0.259
Goodwill and other intangible assets 59.278 59.489 85.724 84.672 83.196 64.346 88.329 89.340
Investment in associates 27.802 27.955 0.785 0.807 0.830 0.918 0.775 0.773
Other investments 0.700 0.254 0.112 0.147 0.138 0.520 3.035 1.829
Other non-current assets 4.024 4.342 8.325 7.752 9.430 4.266 8.191 15.061
Total non-current assets 419.029 415.211 492.195 487.434 482.963 405.222 500.521 455.755
Total assets 541.265 513.093 557.657 562.267 557.390 560.972 567.190 513.381
Liabilities
Current liabilities
Accounts payable 51.150 49.858 51.222 95.220 49.838 73.635 61.839 41.279
Short-term loans and borrowings 37.123 26.883 56.698 47.639 59.432 33.209 65.016 82.453
Other current liabilities 6.803 7.045 9.001 8.987 8.843 9.419 10.287 8.863
Total current liabilities 95.076 83.786 116.921 151.846 118.113 116.263 137.142 132.595
Liabilities held for sale 6.399 8.936 17.647
Equity
Shareholders equity 0.097 0.096 0.097 0.097 0.096 0.097 0.097 0.097
Treasury shares (81.311) (81.382) (36.472) (31.194) (58.898) (68.325) (34.822) (18.388)
Additional paid in capital 1.624 1.622 4.322 4.320 4.579 1.658 4.344 4.743
Retained earnings and other reserves 293.156 294.346 272.927 243.334 283.788 262.967 266.607 235.158
Non-controlling interest 3.350 3.125 2.664 2.429 3.201 3.359 2.606 9.588
Total equity 216.916 217.807 243.538 218.986 232.766 199.756 238.832 231.198
Non-current liabilities
Long-term loans 177.528 158.577 157.941 152.454 166.017 184.600 152.874 94.640
Employee benefits 9.855 9.882 10.909 10.946 10.919 9.774 10.861 11.046
Deferred tax liabilities 27.802 26.836 23.322 22.927 24.626 26.728 23.107 20.518
Other non-current liabilities 7.689 7.270 5.026 5.108 4.949 6.204 4.374 23.384
Total non-current liabilities 222.874 202.565 197.198 191.435 206.511 227.306 191.216 149.588
Total equity & liabilities 541.265 513.094 557.657 562.267 557.390 560.972 567.190 513.381
Net Debt 184.014 176.159 203.215 180.655 207.171 217.309 200.769 162.850
Net Debt / OIBDA LTM x 1.7 x 1.6 x 1.8 x 1.6 x 1.8 x 1.9 x 1.7 x 1.4
0 170 231
240 78 35
6 58 123
253 188 95
120 172 56
128 71 144
191 162 155
0 102 204
182 213 251
www.rostelecom.ru
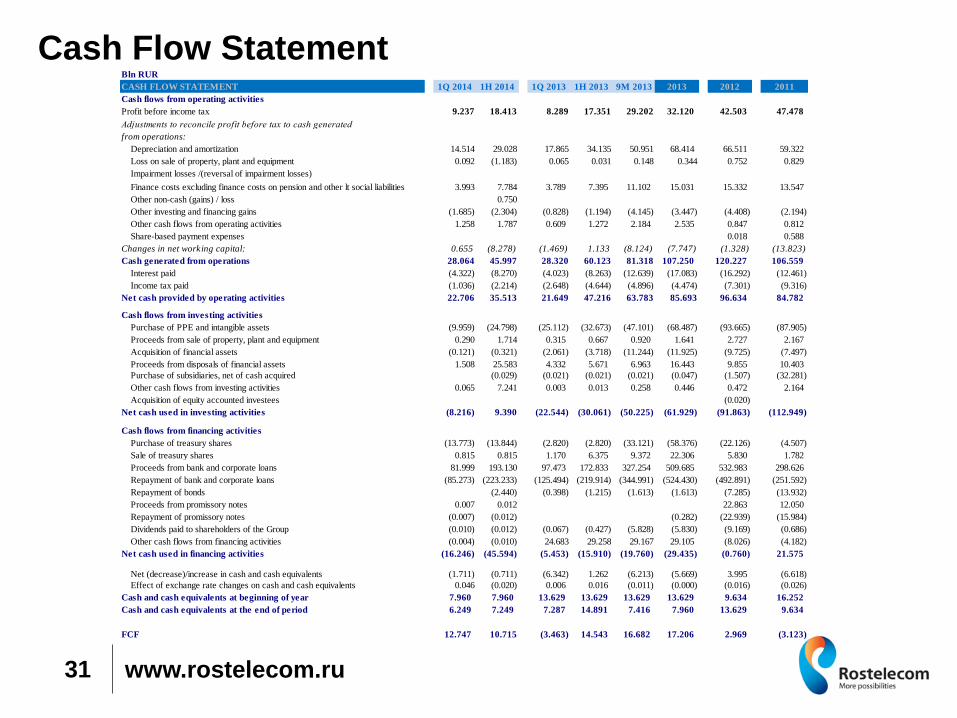
Cash Flow Statement
31
Bln RUR
CASH FLOW STATEMENT 1Q 2014 1H 2014 1Q 2013 1H 2013 9M 2013 2013 2012 2011
Cash flows from operating activities
Profit before income tax 9.237 18.413 8.289 17.351 29.202 32.120 42.503 47.478
Adjustments to reconcile profit before taх to cash generated
from operations:
Depreciation and amortization 14.514 29.028 17.865 34.135 50.951 68.414 66.511 59.322
Loss on sale of property, plant and equipment 0.092 (1.183) 0.065 0.031 0.148 0.344 0.752 0.829
Impairment losses /(reversal of impairment losses)
Finance costs excluding finance costs on pension and other lt social liabilities 3.993 7.784 3.789 7.395 11.102 15.031 15.332 13.547
Other non-cash (gains) / loss 0.750
Other investing and financing gains (1.685) (2.304) (0.828) (1.194) (4.145) (3.447) (4.408) (2.194)
Other cash flows from operating activities 1.258 1.787 0.609 1.272 2.184 2.535 0.847 0.812
Share-based payment expenses 0.018 0.588
Changes in net working capital: 0.655 (8.278) (1.469) 1.133 (8.124) (7.747) (1.328) (13.823)
Cash generated from operations 28.064 45.997 28.320 60.123 81.318 107.250 120.227 106.559
Interest paid (4.322) (8.270) (4.023) (8.263) (12.639) (17.083) (16.292) (12.461)
Income tax paid (1.036) (2.214) (2.648) (4.644) (4.896) (4.474) (7.301) (9.316)
Net cash provided by operating activities 22.706 35.513 21.649 47.216 63.783 85.693 96.634 84.782
Cash flows from investing activities
Purchase of PPE and intangible assets (9.959) (24.798) (25.112) (32.673) (47.101) (68.487) (93.665) (87.905)
Proceeds from sale of property, plant and equipment 0.290 1.714 0.315 0.667 0.920 1.641 2.727 2.167
Acquisition of financial assets (0.121) (0.321) (2.061) (3.718) (11.244) (11.925) (9.725) (7.497)
Proceeds from disposals of financial assets 1.508 25.583 4.332 5.671 6.963 16.443 9.855 10.403
Purchase of subsidiaries, net of cash acquired (0.029) (0.021) (0.021) (0.021) (0.047) (1.507) (32.281)
Other cash flows from investing activities 0.065 7.241 0.003 0.013 0.258 0.446 0.472 2.164
Acquisition of equity accounted investees (0.020)
Net cash used in investing activities (8.216) 9.390 (22.544) (30.061) (50.225) (61.929) (91.863) (112.949)
Cash flows from financing activities
Purchase of treasury shares (13.773) (13.844) (2.820) (2.820) (33.121) (58.376) (22.126) (4.507)
Sale of treasury shares 0.815 0.815 1.170 6.375 9.372 22.306 5.830 1.782
Proceeds from bank and corporate loans 81.999 193.130 97.473 172.833 327.254 509.685 532.983 298.626
Repayment of bank and corporate loans (85.273) (223.233) (125.494) (219.914) (344.991) (524.430) (492.891) (251.592)
Repayment of bonds (2.440) (0.398) (1.215) (1.613) (1.613) (7.285) (13.932)
Proceeds from promissory notes 0.007 0.012 22.863 12.050
Repayment of promissory notes (0.007) (0.012) (0.282) (22.939) (15.984)
Dividends paid to shareholders of the Group (0.010) (0.012) (0.067) (0.427) (5.828) (5.830) (9.169) (0.686)
Other cash flows from financing activities (0.004) (0.010) 24.683 29.258 29.167 29.105 (8.026) (4.182)
Net cash used in financing activities (16.246) (45.594) (5.453) (15.910) (19.760) (29.435) (0.760) 21.575
Net (decrease)/increase in cash and cash equivalents (1.711) (0.711) (6.342) 1.262 (6.213) (5.669) 3.995 (6.618)
Effect of exchange rate changes on cash and cash equivalents 0.046 (0.020) 0.006 0.016 (0.011) (0.000) (0.016) (0.026)
Cash and cash equivalents at beginning of year 7.960 7.960 13.629 13.629 13.629 13.629 9.634 16.252
Cash and cash equivalents at the end of period 6.249 7.249 7.287 14.891 7.416 7.960 13.629 9.634
FCF 12.747 10.715 (3.463) 14.543 16.682 17.206 2.969 (3.123)
0 170 231
240 78 35
6 58 123
253 188 95
120 172 56
128 71 144
191 162 155
0 102 204
182 213 251
www.rostelecom.ru
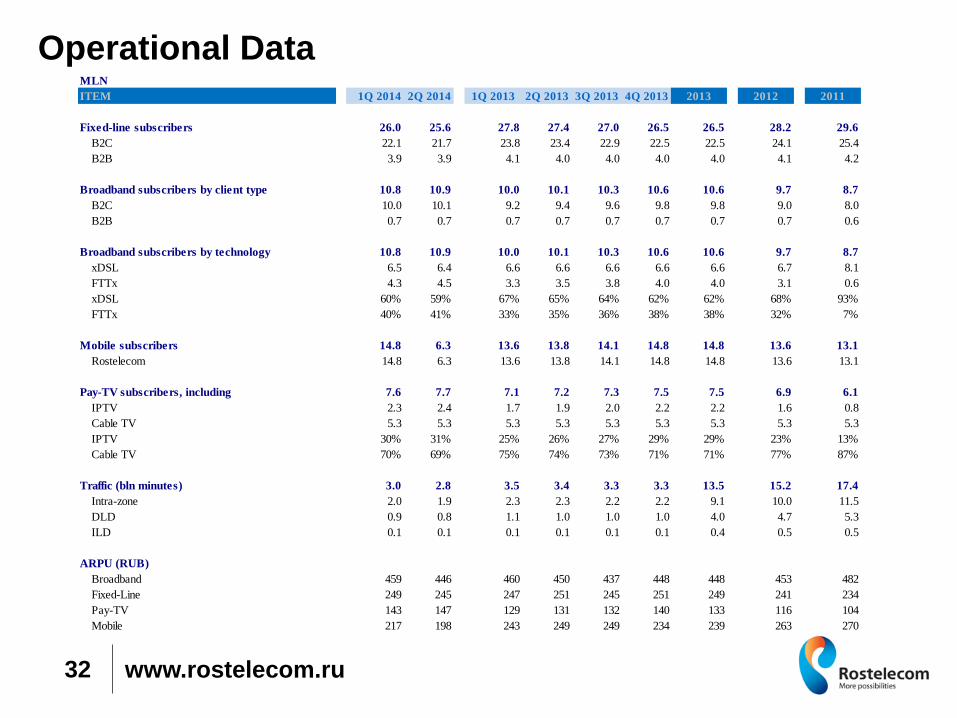
Operational Data
32
MLN
ITEM 1Q 2014 2Q 2014 1Q 2013 2Q 2013 3Q 2013 4Q 2013 2013 2012 2011
Fixed-line subscribers 26.0 25.6 27.8 27.4 27.0 26.5 26.5 28.2 29.6
B2C 22.1 21.7 23.8 23.4 22.9 22.5 22.5 24.1 25.4
B2B 3.9 3.9 4.1 4.0 4.0 4.0 4.0 4.1 4.2
Broadband subscribers by client type 10.8 10.9 10.0 10.1 10.3 10.6 10.6 9.7 8.7
B2C 10.0 10.1 9.2 9.4 9.6 9.8 9.8 9.0 8.0
B2B 0.7 0.7 0.7 0.7 0.7 0.7 0.7 0.7 0.6
Broadband subscribers by technology 10.8 10.9 10.0 10.1 10.3 10.6 10.6 9.7 8.7
xDSL 6.5 6.4 6.6 6.6 6.6 6.6 6.6 6.7 8.1
FTTx 4.3 4.5 3.3 3.5 3.8 4.0 4.0 3.1 0.6
xDSL 60% 59% 67% 65% 64% 62% 62% 68% 93%
FTTx 40% 41% 33% 35% 36% 38% 38% 32% 7%
Mobile subscribers 14.8 6.3 13.6 13.8 14.1 14.8 14.8 13.6 13.1
Rostelecom 14.8 6.3 13.6 13.8 14.1 14.8 14.8 13.6 13.1
Pay-TV subscribers, including 7.6 7.7 7.1 7.2 7.3 7.5 7.5 6.9 6.1
IPTV 2.3 2.4 1.7 1.9 2.0 2.2 2.2 1.6 0.8
Cable TV 5.3 5.3 5.3 5.3 5.3 5.3 5.3 5.3 5.3
IPTV 30% 31% 25% 26% 27% 29% 29% 23% 13%
Cable TV 70% 69% 75% 74% 73% 71% 71% 77% 87%
Traffic (bln minutes) 3.0 2.8 3.5 3.4 3.3 3.3 13.5 15.2 17.4
Intra-zone 2.0 1.9 2.3 2.3 2.2 2.2 9.1 10.0 11.5
DLD 0.9 0.8 1.1 1.0 1.0 1.0 4.0 4.7 5.3
ILD 0.1 0.1 0.1 0.1 0.1 0.1 0.4 0.5 0.5
ARPU (RUB)
Broadband 459 446 460 450 437 448 448 453 482
Fixed-Line 249 245 247 251 245 251 249 241 234
Pay-TV 143 147 129 131 132 140 133 116 104
Mobile 217 198 243 249 249 234 239 263 270
0 170 231
240 78 35
6 58 123
253 188 95
120 172 56
128 71 144
191 162 155
0 102 204
182 213 251
www.rostelecom.ru
Disclaimer
By attending any meeting where this presentation is made, or by reading any part of this presentation, you acknowledge and agree to be bound by the following:
• This presentation has been prepared by OJSC Rostelecom (the “Company”). This presentation is strictly confidential to the recipient, may not be distributed to the
press or any other person, and may not be reproduced in any form, in whole or in part.
• The Company has included its own estimates, assessments, adjustments and judgments in preparing certain market information herein, which have not been
verified by an independent third party. Market information included herein is, therefore, unless otherwise attributed exclusively to a third party source, to a certain
degree subjective. While the Company believes that its own estimates, assessments, adjustments and judgments are reasonable and that the market information
prepared by the Company appropriately reflects the industry and the markets in which it operates, there is no assurance that the Company’s own estimates,
assessments, adjustments and judgments are the most appropriate for making determinations relating to market information.
• Neither the Company nor any of its affiliates, advisors or representatives shall have any liability whatsoever (in negligence or otherwise) for any loss howsoever
arising from any use of this presentation or its contents or otherwise arising in connection with this presentation.
• This presentation is confidential and does not constitute or form part of, and should not be construed as, an offer to sell or issue or the solicitation of an offer to buy
or acquire securities of the Company or any of its subsidiaries in any jurisdiction or an inducement to enter into investment activity in any jurisdiction. Neither this
presentation nor any part thereof, nor the fact of its distribution, shall form the basis of, or be relied on in connection with, any contract or commitment or investment
decision whatsoever.
• This presentation is not intended for publication or circulation in the United States. This presentation does not constitute and should not be construed as an offer to
sell or the solicitation of an offer to buy securities in the United States or to any U.S. person (as defined in Regulation S under the US Securities Act of 1933 (the
“Securities Act”)). No securities of the Company have been, nor will be, registered under the Securities Act or the securities laws of any state of the United States,
and unless so registered may not be offered or sold except pursuant to an exemption from, or in a transaction not subject to, the registration requirements of the
Securities Act and applicable state securities laws. This presentation does not constitute a public offering or an advertisement of securities in the Russian
Federation and does not constitute an offer or a proposal to make offers or to acquire any securities in the Russian Federation.
• In any member state of the European Economic Area, this Presentation is made to and directed only at persons who are qualified investors within the meaning of
article 2(1)(e) of the Prospectus Directive (2003/71/EC) (“Qualified Investors”). In addition, in the United Kingdom, this Presentation is made to and directed at: (i)
investment professionals falling within article 19(5) of the Financial Services and Markets Act 2000 (Financial Promotion) Order 2005 (the “Order”) and (ii) high net
worth individuals, and other persons to whom it may lawfully be communicated, falling within article 49(2)(A) to (D) of the Order (such persons together with
Qualified Investors, being “Relevant Persons”). In these jurisdictions, persons who are not Relevant Persons must not rely on or act upon the information contained
in this presentation or any of its contents. Any investment or investment activity to which this Presentation relates is only available to Relevant Persons and will be
engaged in only with Relevant Persons. The recipients of the information contained herein should not base any behavior that would amount to market abuse for the
purposes of the Financial Services and Markets Act 2000 (“FSMA”) and the Code of Market Conduct made pursuant to the FSMA on the information in this
Presentation or any information provided or discussed in connection with it.
• This presentation is not directed at, or intended for distribution to or use by, any person or entity that is a citizen or resident or located in any locality, state, country
or other jurisdiction where such distribution, publication, availability or use would be contrary to law or regulation or which would require any registration or licensing
within such jurisdiction. Persons into whose possession this presentation comes should inform themselves about, and observe, any such restrictions
33
0 170 231
240 78 35
6 58 123
253 188 95
120 172 56
128 71 144
191 162 155
0 102 204
182 213 251
Contact Information
Investor Relations
Office +7 (499) 995 9780
E-mail: [email protected]
Web: http://www.rostelecom.ru/en/ir/