Embed Size (px)
Citation preview
Metall Zug Group, March 23, 2017
Investor Presentation 2016
Metall Zug Group
1. Metall Zug Group - overview 2016
2. Business Units
Household Appliances
Infection Control
Wire Processing
3. Group financial report 2016
4. Investments in our future
5. Information for investors
2
Content
Metall Zug Group
Overview 2016
Metall Zug Group
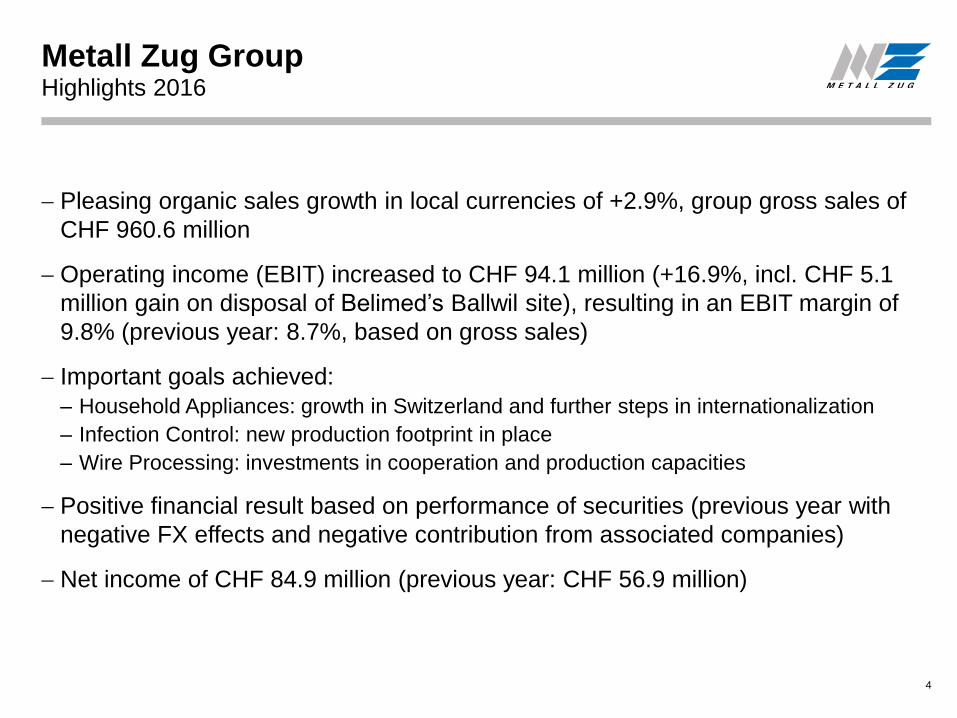
Pleasing organic sales growth in local currencies of +2.9%, group gross sales of
CHF 960.6 million
Operating income (EBIT) increased to CHF 94.1 million (+16.9%, incl. CHF 5.1
million gain on disposal of Belimed’s Ballwil site), resulting in an EBIT margin of
9.8% (previous year: 8.7%, based on gross sales)
Important goals achieved:
– Household Appliances: growth in Switzerland and further steps in internationalization
– Infection Control: new production footprint in place
– Wire Processing: investments in cooperation and production capacities
Positive financial result based on performance of securities (previous year with
negative FX effects and negative contribution from associated companies)
Net income of CHF 84.9 million (previous year: CHF 56.9 million)
4
Highlights 2016
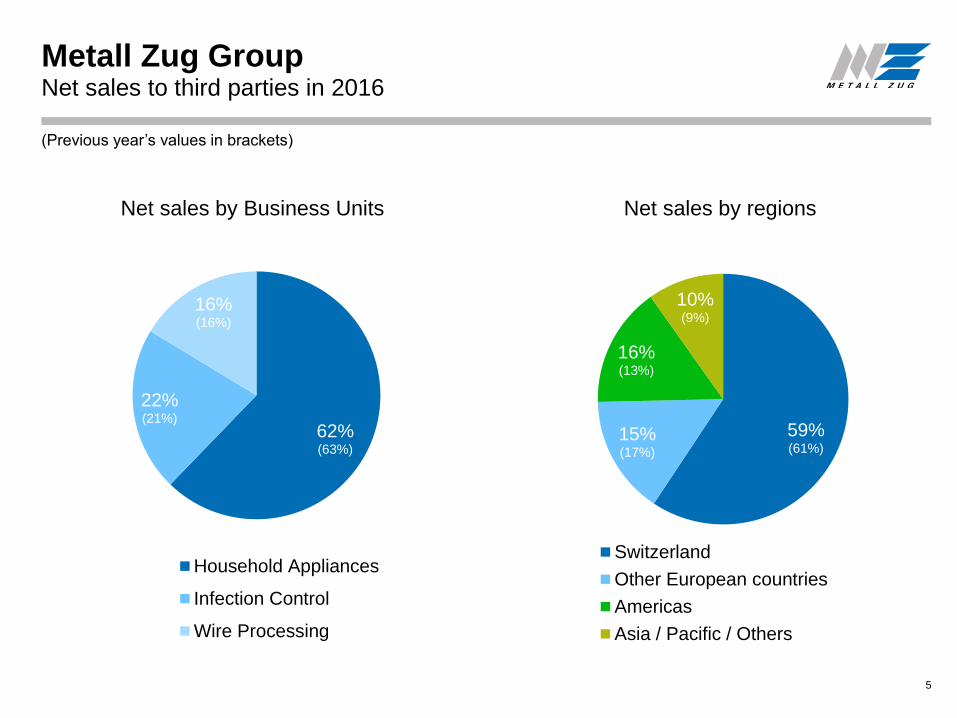
Metall Zug GroupNet sales to third parties in 2016
5
62%(63%)
22%(21%)
16%(16%)
Net sales by Business Units
Household Appliances
Infection Control
Wire Processing
59%(61%)
15%(17%)
16%(13%)
10%(9%)
Net sales by regions
Switzerland
Other European countries
Americas
Asia / Pacific / Others
(Previous year’s values in brackets)
Business Units
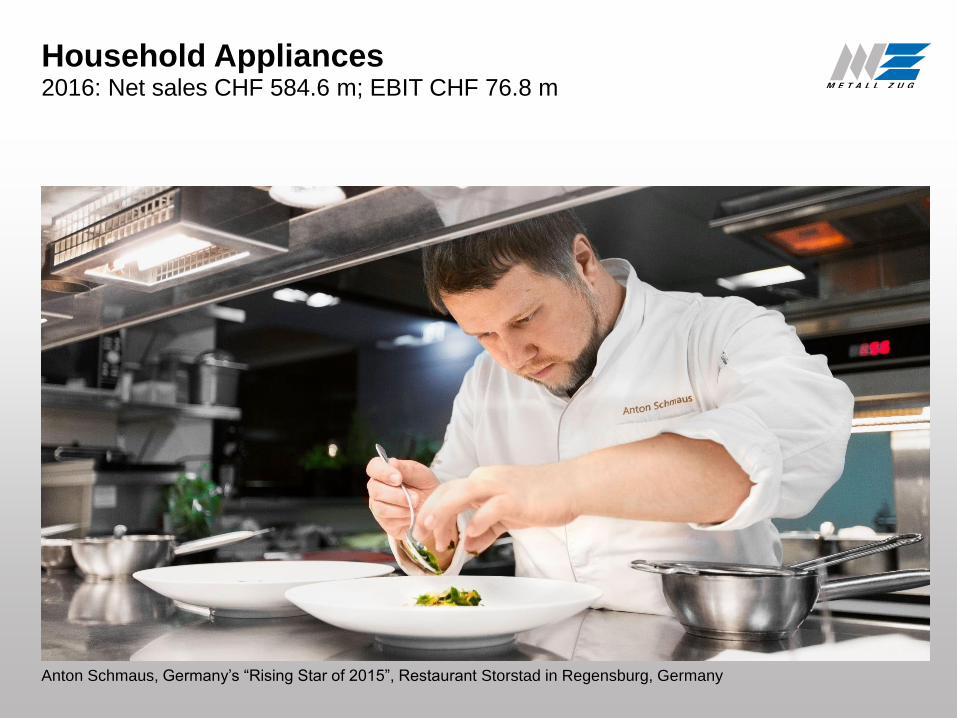
Household Appliances2016: Net sales CHF 584.6 m; EBIT CHF 76.8 m
Anton Schmaus, Germany’s “Rising Star of 2015”, Restaurant Storstad in Regensburg, Germany
Household Appliances
8
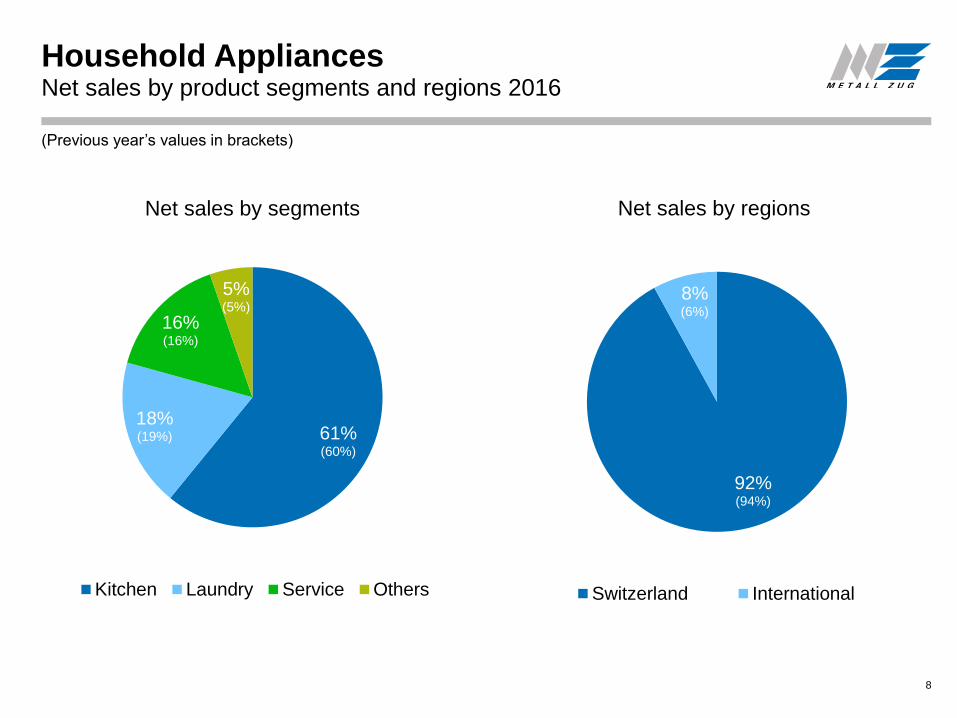
Net sales by product segments and regions 2016
61%(60%)
18%(19%)
16%(16%)
5%(5%)
Net sales by segments
Kitchen Laundry Service Others
92%(94%)
8%(6%)
Net sales by regions
Switzerland International
(Previous year’s values in brackets)
Household Appliances
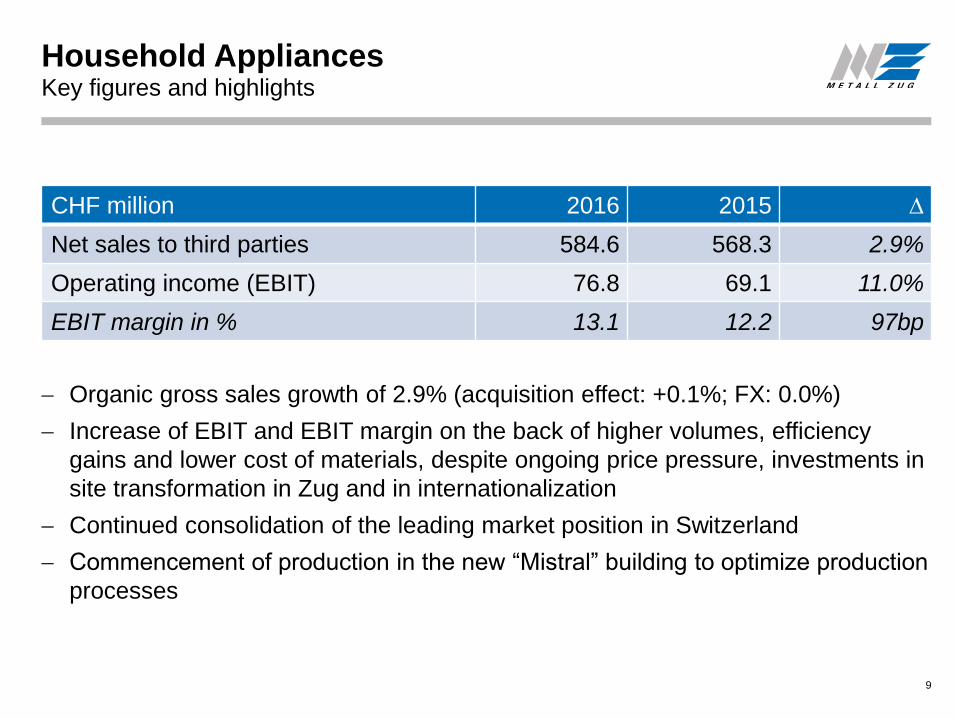
Organic gross sales growth of 2.9% (acquisition effect: +0.1%; FX: 0.0%)
Increase of EBIT and EBIT margin on the back of higher volumes, efficiency
gains and lower cost of materials, despite ongoing price pressure, investments in
site transformation in Zug and in internationalization
Continued consolidation of the leading market position in Switzerland
Commencement of production in the new “Mistral” building to optimize production
processes
9
Key figures and highlights
CHF million 2016 2015 ∆
Net sales to third parties 584.6 568.3 2.9%
Operating income (EBIT) 76.8 69.1 11.0%
EBIT margin in % 13.1 12.2 97bp
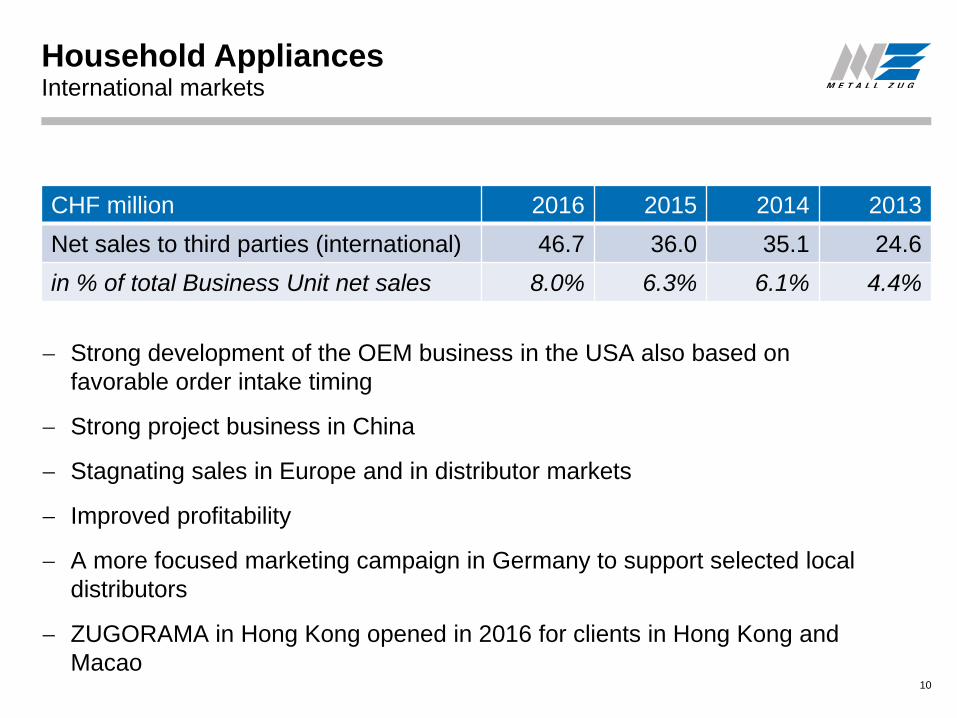
Household Appliances International markets
Strong development of the OEM business in the USA also based on
favorable order intake timing
Strong project business in China
Stagnating sales in Europe and in distributor markets
Improved profitability
A more focused marketing campaign in Germany to support selected local
distributors
ZUGORAMA in Hong Kong opened in 2016 for clients in Hong Kong and
Macao10
CHF million 2016 2015 2014 2013
Net sales to third parties (international) 46.7 36.0 35.1 24.6
in % of total Business Unit net sales 8.0% 6.3% 6.1% 4.4%
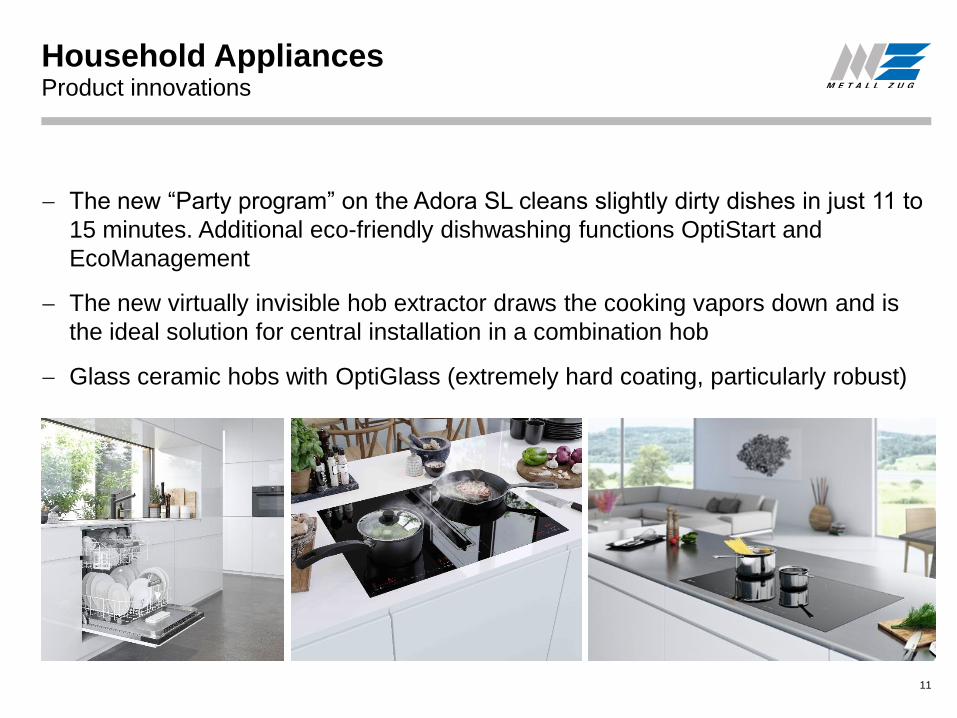
Household Appliances
The new “Party program” on the Adora SL cleans slightly dirty dishes in just 11 to
15 minutes. Additional eco-friendly dishwashing functions OptiStart and
EcoManagement
The new virtually invisible hob extractor draws the cooking vapors down and is
the ideal solution for central installation in a combination hob
Glass ceramic hobs with OptiGlass (extremely hard coating, particularly robust)
Product innovations
11
Household Appliances
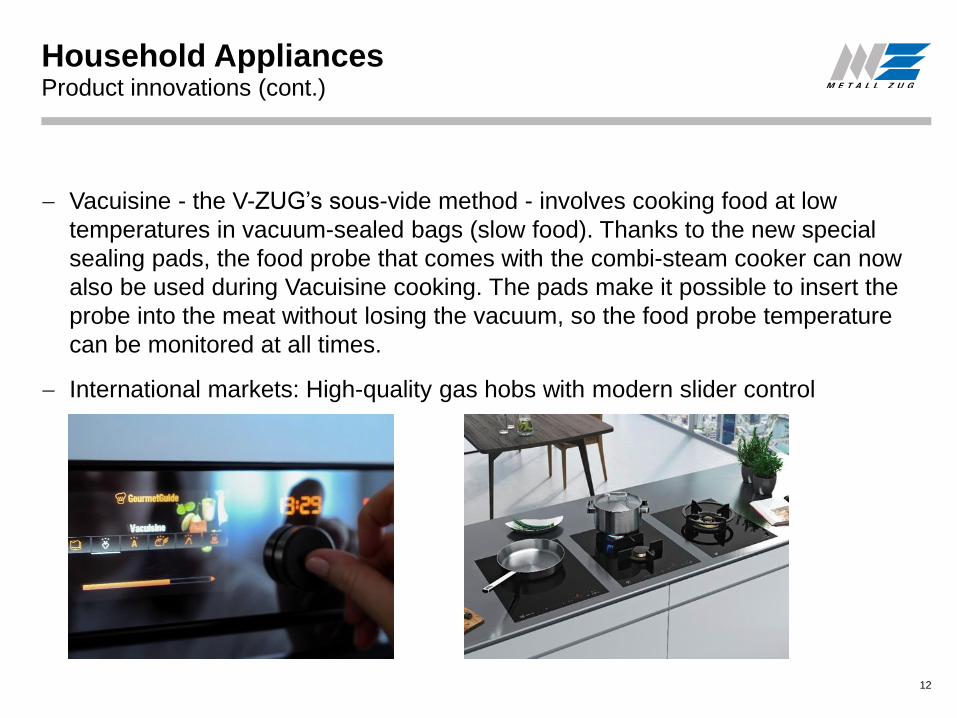
Vacuisine - the V-ZUG’s sous-vide method - involves cooking food at low
temperatures in vacuum-sealed bags (slow food). Thanks to the new special
sealing pads, the food probe that comes with the combi-steam cooker can now
also be used during Vacuisine cooking. The pads make it possible to insert the
probe into the meat without losing the vacuum, so the food probe temperature
can be monitored at all times.
International markets: High-quality gas hobs with modern slider control
Product innovations (cont.)
12
Household Appliances
13
Strategic priorities
Strengthen the market leadership of V-ZUG in Switzerland and its premium
brand worldwide as a leader in innovation, technology and quality with Swiss-
made products
Expand and consolidate the international business in the premium segment in
selected countries
Develop the own refrigerator business in the premium segment
Prepare products, processes, structures and business models for the Internet of
Everything
Permanently improve efficiency
New production and assembly operations started in new “Mistral” building in Zug
Investments in next steps of production site to increase productivity
Global sourcing
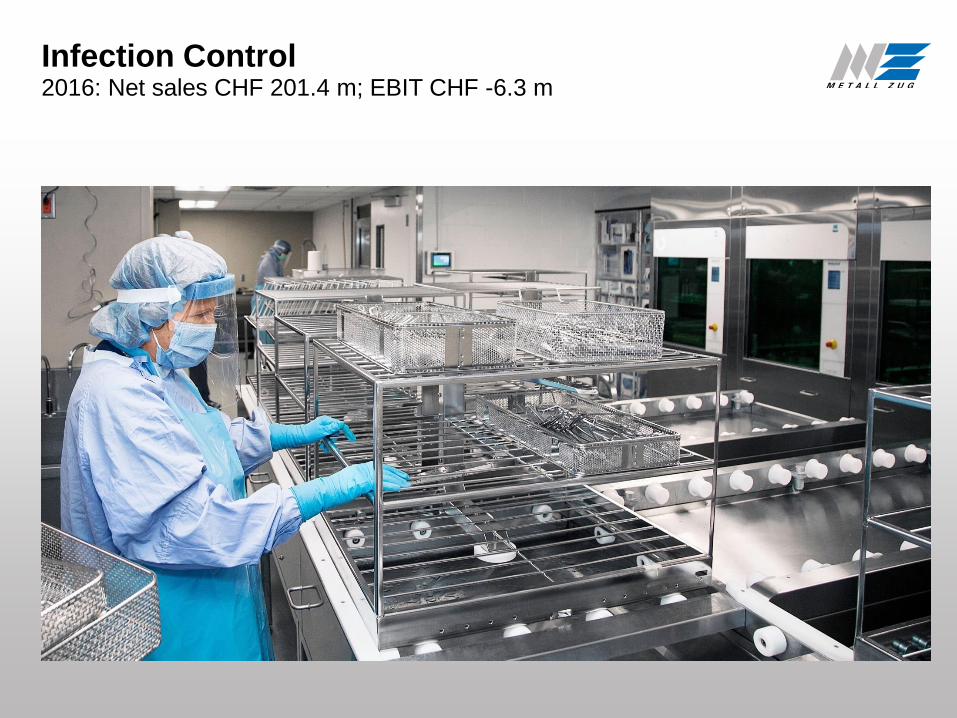
Infection Control 2016: Net sales CHF 201.4 m; EBIT CHF -6.3 m
Infection Control
15
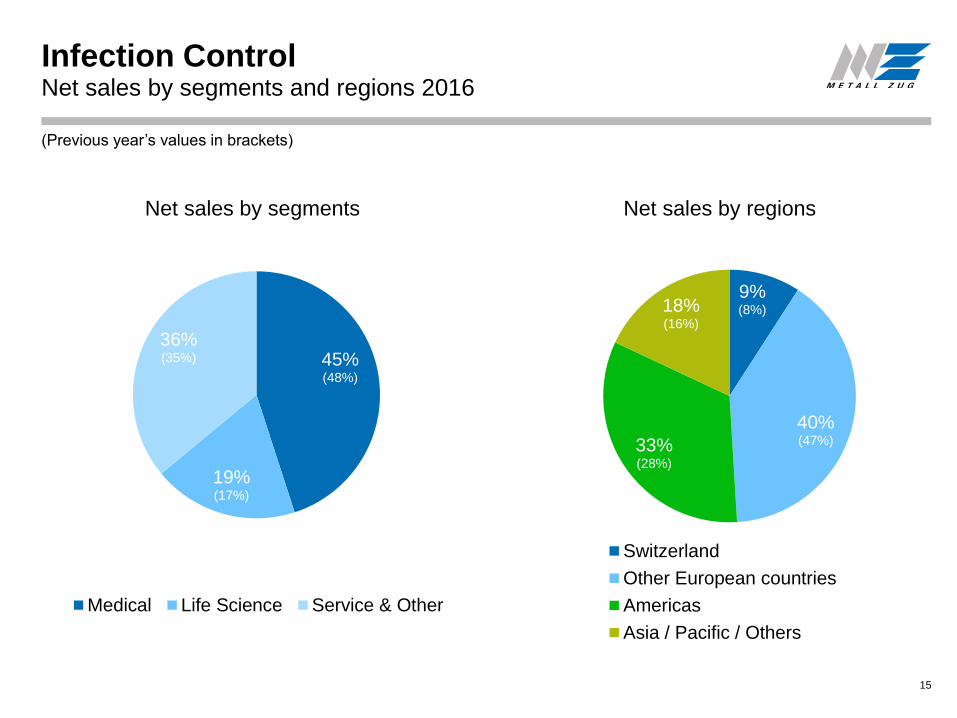
Net sales by segments and regions 2016
45%(48%)
19%(17%)
36%(35%)
Net sales by segments
Medical Life Science Service & Other
9%(8%)
40%(47%)33%
(28%)
18%(16%)
Net sales by regions
Switzerland
Other European countries
Americas
Asia / Pacific / Others
(Previous year’s values in brackets)
Infection Control
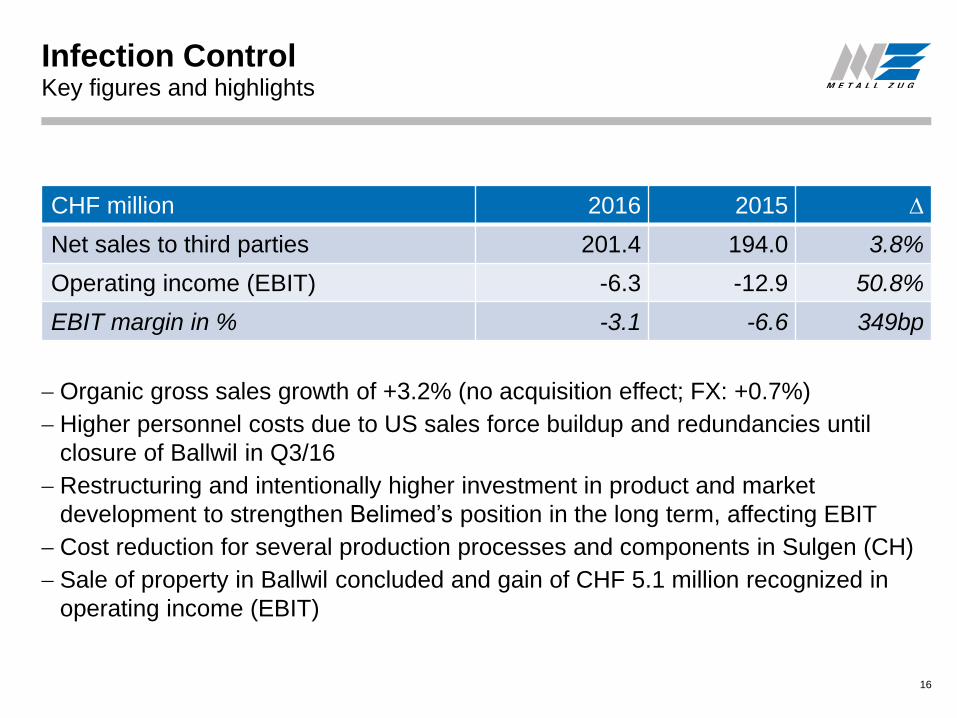
Organic gross sales growth of +3.2% (no acquisition effect; FX: +0.7%)
Higher personnel costs due to US sales force buildup and redundancies until
closure of Ballwil in Q3/16
Restructuring and intentionally higher investment in product and market
development to strengthen Belimed’s position in the long term, affecting EBIT
Cost reduction for several production processes and components in Sulgen (CH)
Sale of property in Ballwil concluded and gain of CHF 5.1 million recognized in
operating income (EBIT)
16
Key figures and highlights
CHF million 2016 2015 ∆
Net sales to third parties 201.4 194.0 3.8%
Operating income (EBIT) -6.3 -12.9 50.8%
EBIT margin in % -3.1 -6.6 349bp
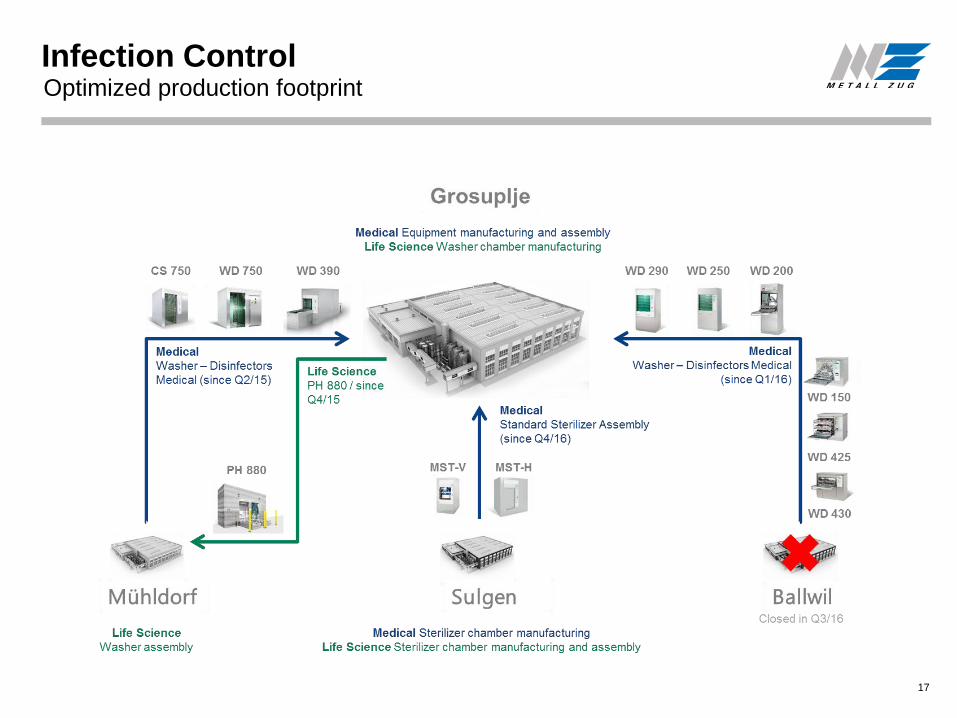
Optimized production footprint
Infection Control
17
Restructuring
Infection Control
18
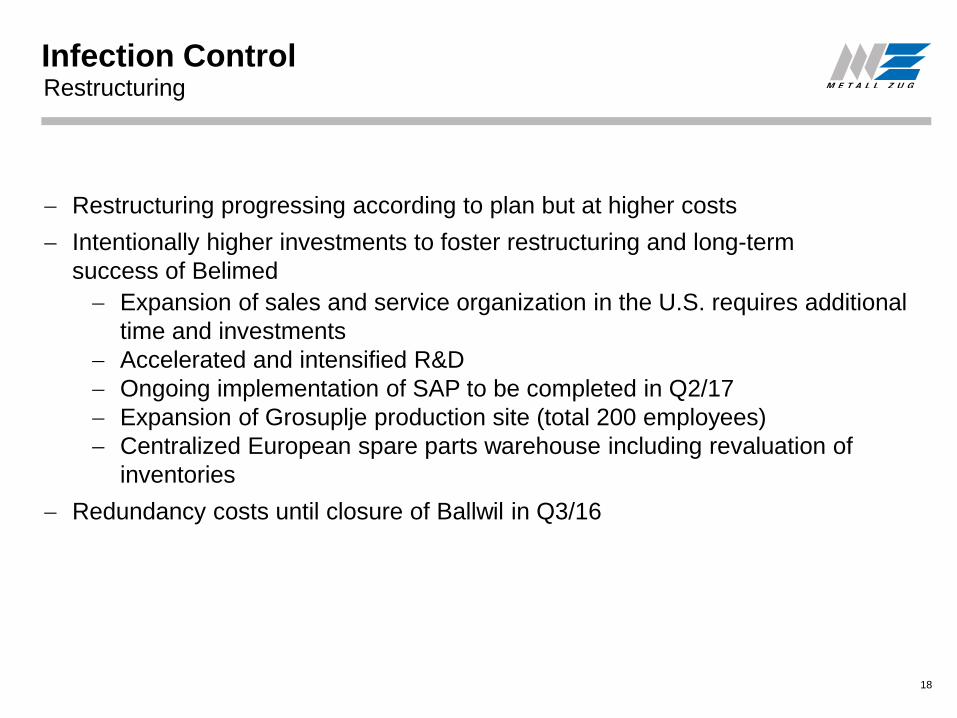
Restructuring progressing according to plan but at higher costs
Intentionally higher investments to foster restructuring and long-term
success of Belimed
Expansion of sales and service organization in the U.S. requires additional
time and investments
Accelerated and intensified R&D
Ongoing implementation of SAP to be completed in Q2/17
Expansion of Grosuplje production site (total 200 employees)
Centralized European spare parts warehouse including revaluation of
inventories
Redundancy costs until closure of Ballwil in Q3/16
Infection Control
19
Strategic priorities
Consolidate and complete restructuring of business in order to benefit from
reduced complexity of the business structure and processes, as well as reduce
costs
Consolidate corporate culture “One Belimed”
Increase market share in the U.S. and APAC
Develop chemicals business in the U.S.
Explore full potential of Life Science and Service segments
Strengthen R&D, accelerate product and technology innovations also related to
digitization
Explore synergies with V-ZUG on the back of shared R&D facilities
Prepare Belimed for profitable future growth
Wire Processing2016: Net sales CHF 153.5 m; EBIT CHF 22.8 m
Wire Processing
21
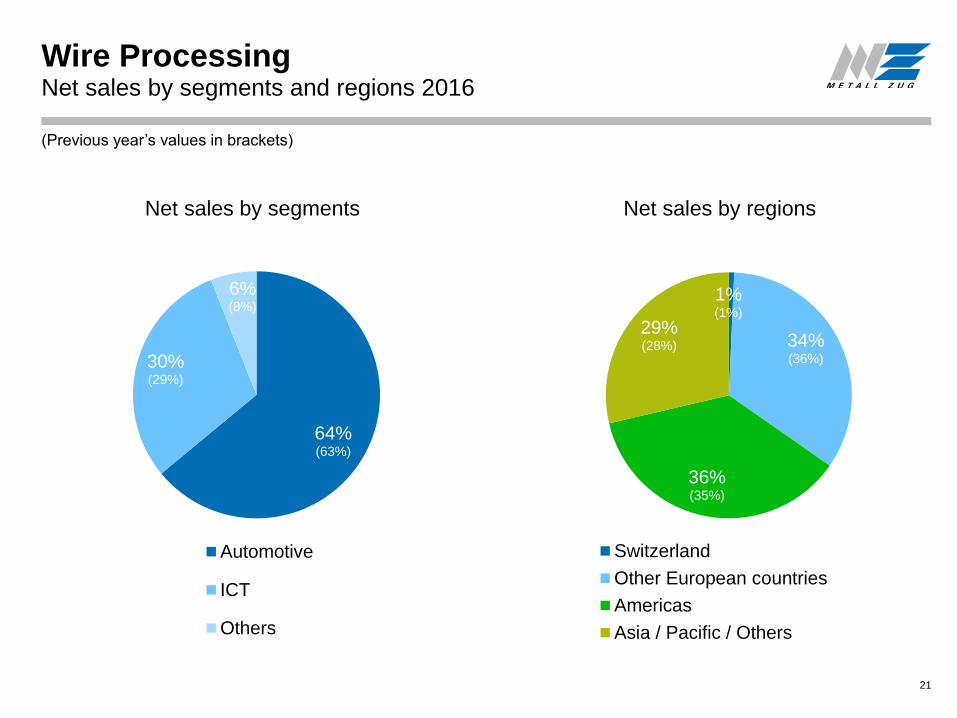
Net sales by segments and regions 2016
64%(63%)
30%(29%)
6%(8%)
Net sales by segments
Automotive
ICT
Others
1%(1%)
34%(36%)
36%(35%)
29%(28%)
Net sales by regions
Switzerland
Other European countries
Americas
Asia / Pacific / Others
(Previous year’s values in brackets)
Wire Processing
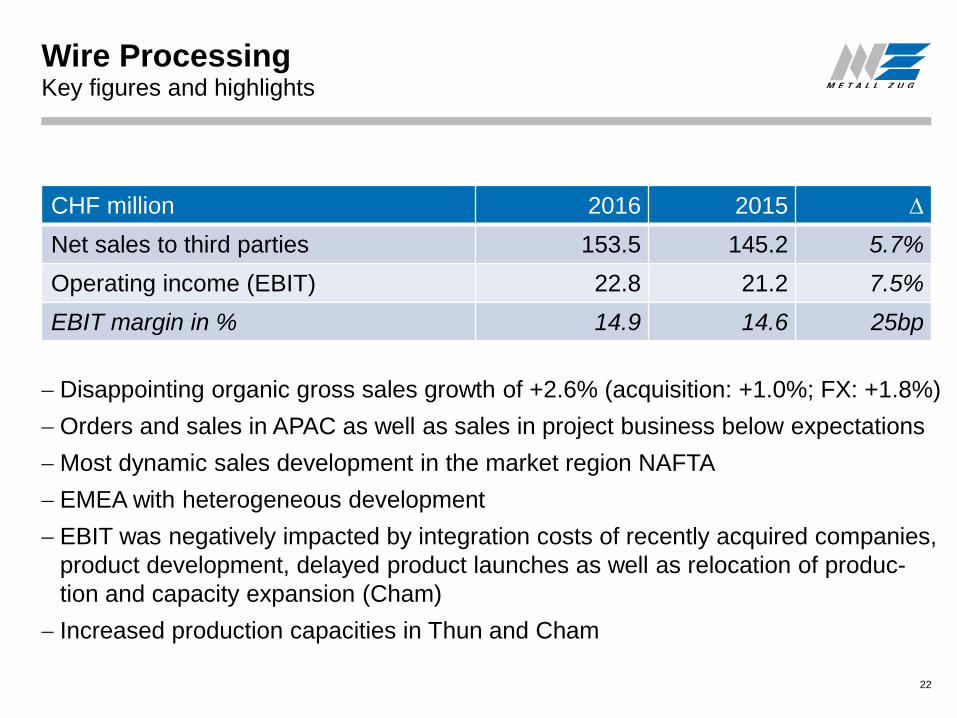
Disappointing organic gross sales growth of +2.6% (acquisition: +1.0%; FX: +1.8%)
Orders and sales in APAC as well as sales in project business below expectations
Most dynamic sales development in the market region NAFTA
EMEA with heterogeneous development
EBIT was negatively impacted by integration costs of recently acquired companies,
product development, delayed product launches as well as relocation of produc-
tion and capacity expansion (Cham)
Increased production capacities in Thun and Cham
22
Key figures and highlights
CHF million 2016 2015 ∆
Net sales to third parties 153.5 145.2 5.7%
Operating income (EBIT) 22.8 21.2 7.5%
EBIT margin in % 14.9 14.6 25bp
Wire Processing
Schleuniger increased its stake in DiIT AG from 35% to 100%. DiIT is fully
consolidated since the beginning of 2017
A globally leading producer of software systems for wire processing and wire
harness production; major manufacturers of wire harnesses for the automotive
industry rely on DiIT’s systems
Based on electronic drawings, DiIT’s solutions control and optimize the entire
production chain from the cutting area right through to shipping, including
generating all necessary production data
Acquisition of DiIT AG
23
Wire Processing
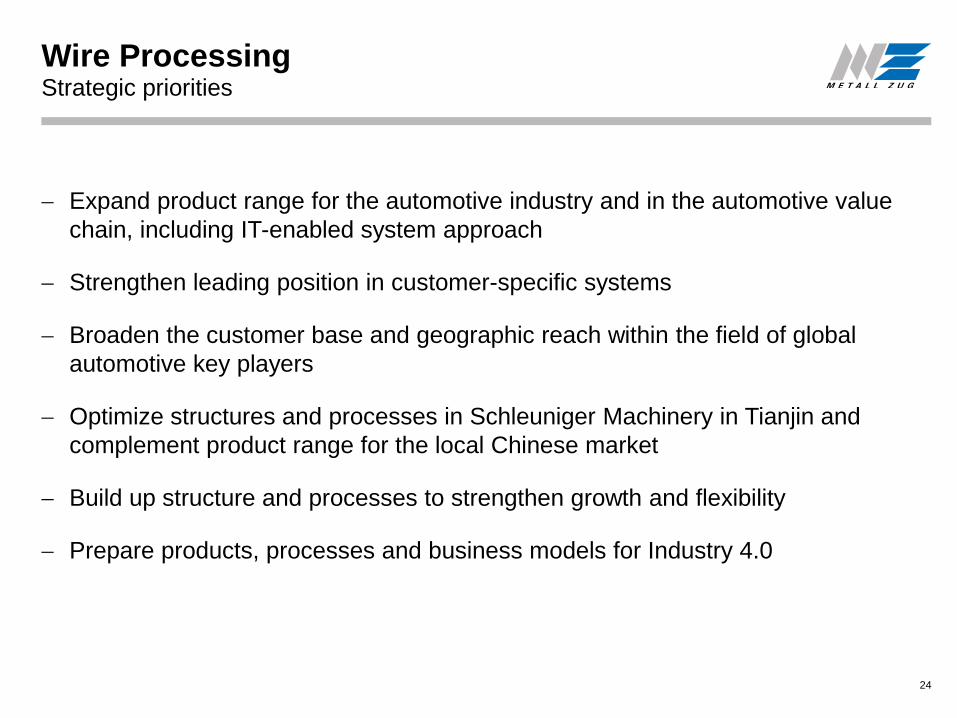
Expand product range for the automotive industry and in the automotive value
chain, including IT-enabled system approach
Strengthen leading position in customer-specific systems
Broaden the customer base and geographic reach within the field of global
automotive key players
Optimize structures and processes in Schleuniger Machinery in Tianjin and
complement product range for the local Chinese market
Build up structure and processes to strengthen growth and flexibility
Prepare products, processes and business models for Industry 4.0
Strategic priorities
24
Group Financial Report 2016
Group financial report
26
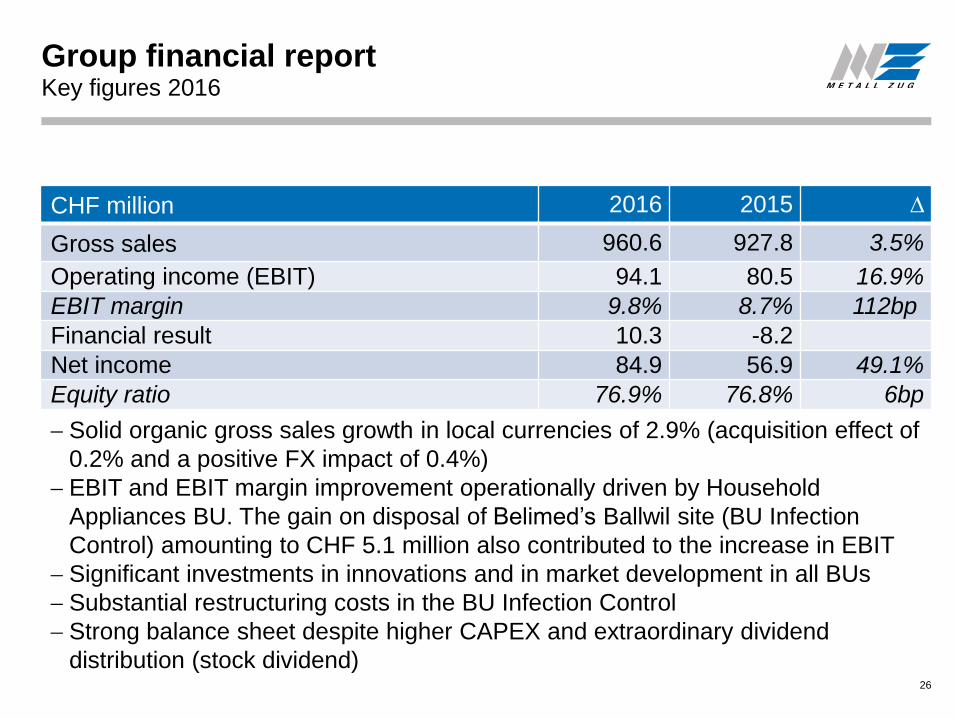
Key figures 2016
Solid organic gross sales growth in local currencies of 2.9% (acquisition effect of
0.2% and a positive FX impact of 0.4%)
EBIT and EBIT margin improvement operationally driven by Household
Appliances BU. The gain on disposal of Belimed’s Ballwil site (BU Infection
Control) amounting to CHF 5.1 million also contributed to the increase in EBIT
Significant investments in innovations and in market development in all BUs
Substantial restructuring costs in the BU Infection Control
Strong balance sheet despite higher CAPEX and extraordinary dividend
distribution (stock dividend)
CHF million 2016 2015 ∆
Gross sales 960.6 927.8 3.5%
Operating income (EBIT) 94.1 80.5 16.9%
EBIT margin 9.8% 8.7% 112bp
Financial result 10.3 -8.2
Net income 84.9 56.9 49.1%
Equity ratio 76.9% 76.8% 6bp
27
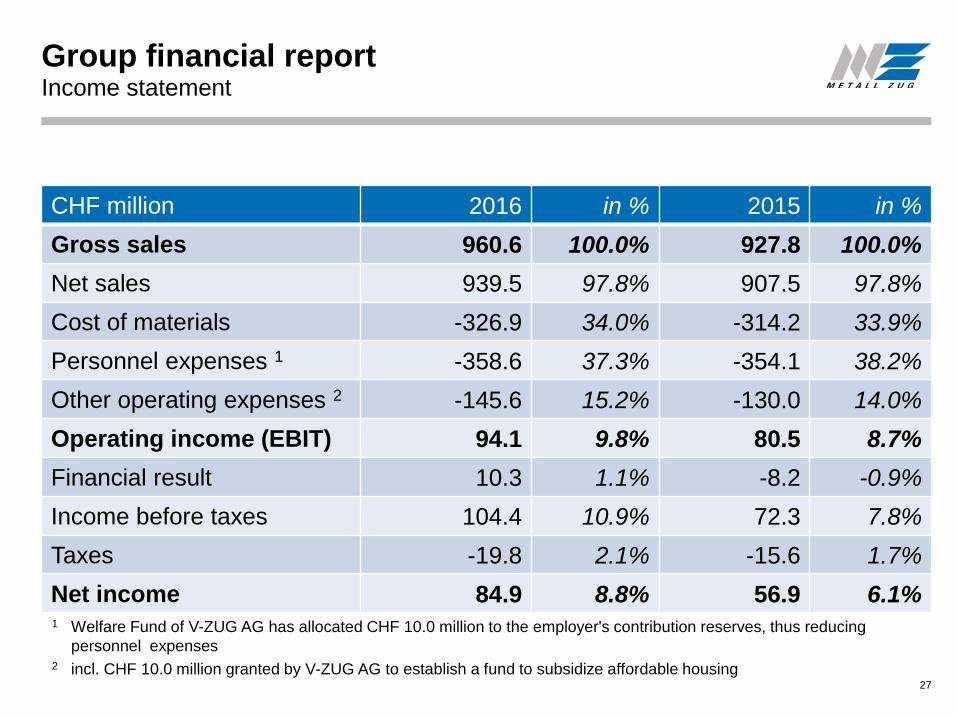
Income statement
Group financial report
CHF million 2016 in % 2015 in %
Gross sales 960.6 100.0% 927.8 100.0%
Net sales 939.5 97.8% 907.5 97.8%
Cost of materials -326.9 34.0% -314.2 33.9%
Personnel expenses 1 -358.6 37.3% -354.1 38.2%
Other operating expenses 2 -145.6 15.2% -130.0 14.0%
Operating income (EBIT) 94.1 9.8% 80.5 8.7%
Financial result 10.3 1.1% -8.2 -0.9%
Income before taxes 104.4 10.9% 72.3 7.8%
Taxes -19.8 2.1% -15.6 1.7%
Net income 84.9 8.8% 56.9 6.1%1 Welfare Fund of V-ZUG AG has allocated CHF 10.0 million to the employer's contribution reserves, thus reducing
personnel expenses2 incl. CHF 10.0 million granted by V-ZUG AG to establish a fund to subsidize affordable housing
Group financial report
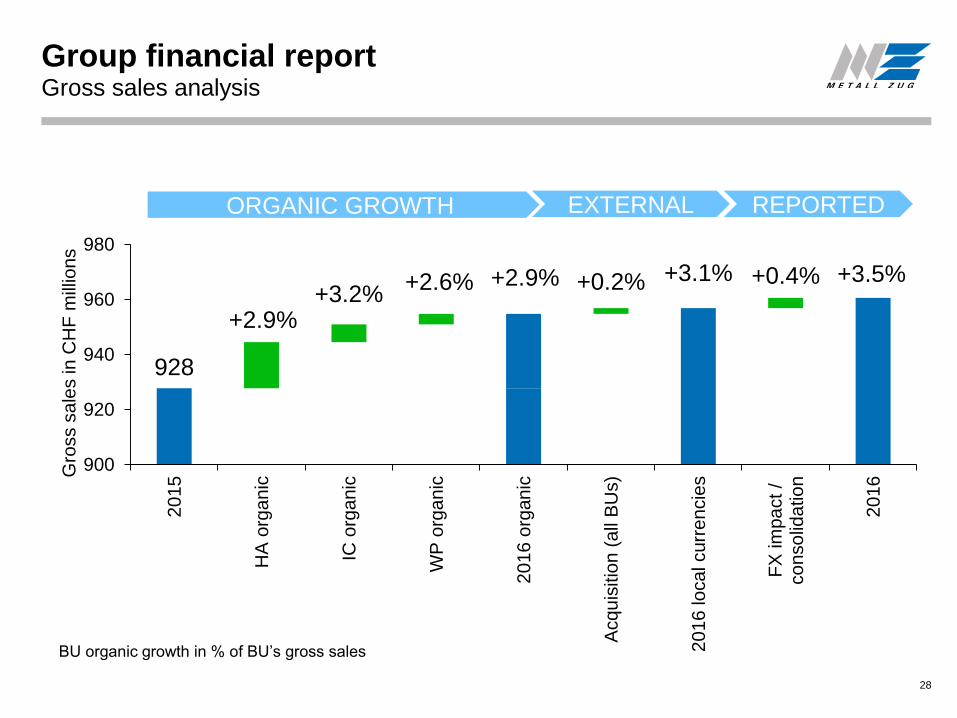
28
Gross sales analysis
ORGANIC GROWTH EXTERNAL REPORTED
928
+3.1% +3.5%
+2.9%+3.2%
+2.6% +2.9% +0.2% +0.4%
900
920
940
960
980
2015
HA
org
an
ic
IC o
rga
nic
WP
org
an
ic
20
16
org
an
ic
Acq
uis
itio
n (
all
BU
s)
20
16
lo
ca
l curr
en
cie
s
FX
im
pact /
consolid
ation
2016
Gro
ss s
ale
s in
CH
F m
illio
ns
BU organic growth in % of BU’s gross sales
Group financial report
29
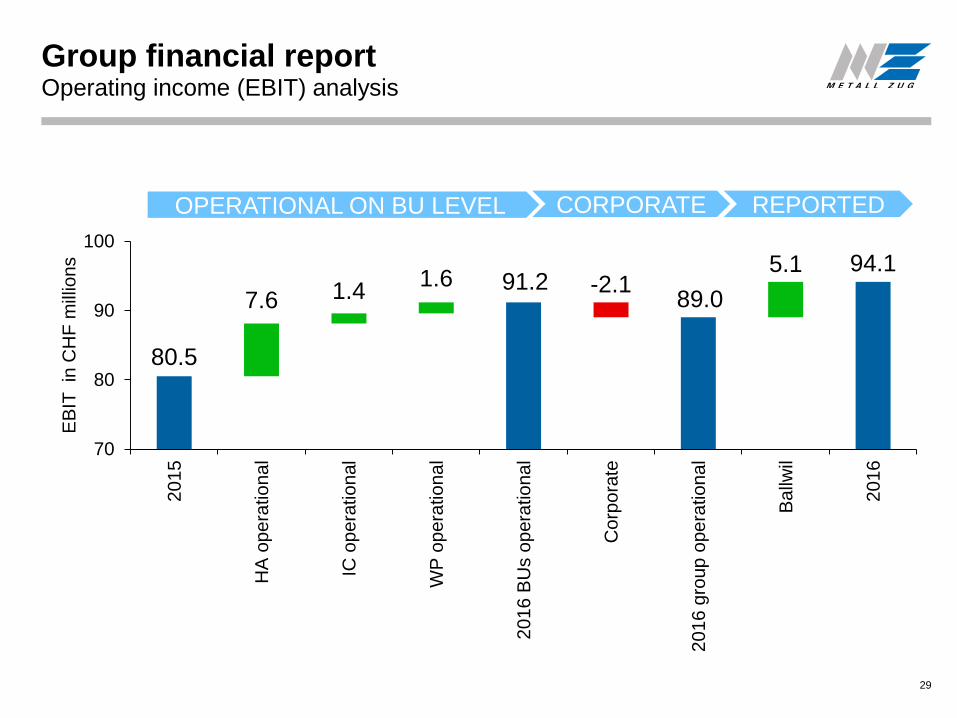
Operating income (EBIT) analysis
OPERATIONAL ON BU LEVEL CORPORATE REPORTED
80.5
91.289.0
94.1
7.6 1.41.6 -2.1
5.1
70
80
90
100
2015
HA
op
era
tio
na
l
IC o
pe
ratio
nal
WP
op
era
tio
na
l
20
16
BU
s o
pera
tio
na
l
Co
rpo
rate
20
16
gro
up
ope
ratio
na
l
Ba
llwil
2016
EB
IT in
CH
F m
illio
ns
Metall Zug Group
30
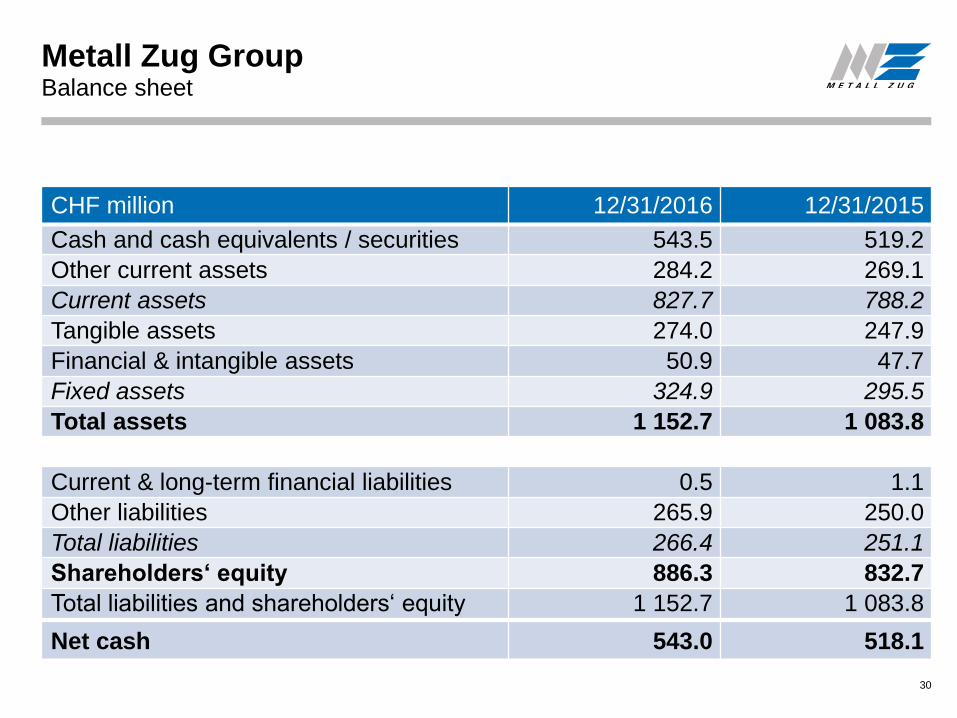
Balance sheet
CHF million 12/31/2016 12/31/2015
Cash and cash equivalents / securities 543.5 519.2
Other current assets 284.2 269.1
Current assets 827.7 788.2
Tangible assets 274.0 247.9
Financial & intangible assets 50.9 47.7
Fixed assets 324.9 295.5
Total assets 1 152.7 1 083.8
Current & long-term financial liabilities 0.5 1.1
Other liabilities 265.9 250.0
Total liabilities 266.4 251.1
Shareholders‘ equity 886.3 832.7
Total liabilities and shareholders‘ equity 1 152.7 1 083.8
Net cash 543.0 518.1
Metall Zug Group
31
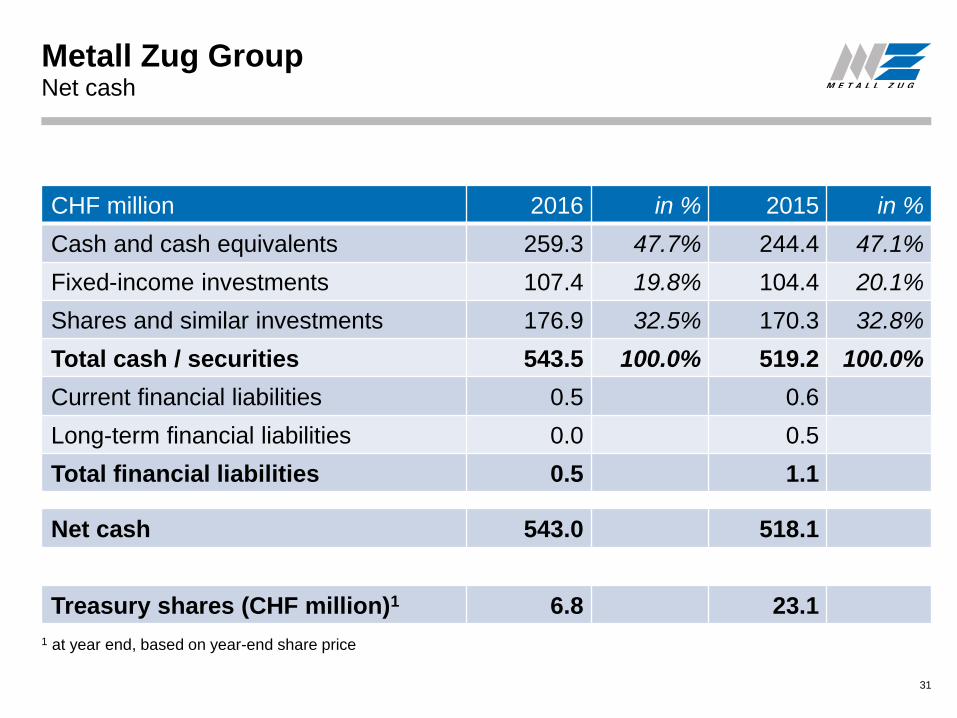
Net cash
CHF million 2016 in % 2015 in %
Cash and cash equivalents 259.3 47.7% 244.4 47.1%
Fixed-income investments 107.4 19.8% 104.4 20.1%
Shares and similar investments 176.9 32.5% 170.3 32.8%
Total cash / securities 543.5 100.0% 519.2 100.0%
Current financial liabilities 0.5 0.6
Long-term financial liabilities 0.0 0.5
Total financial liabilities 0.5 1.1
Net cash 543.0 518.1
Treasury shares (CHF million)1 6.8 23.1
1 at year end, based on year-end share price
Metall Zug Group
32
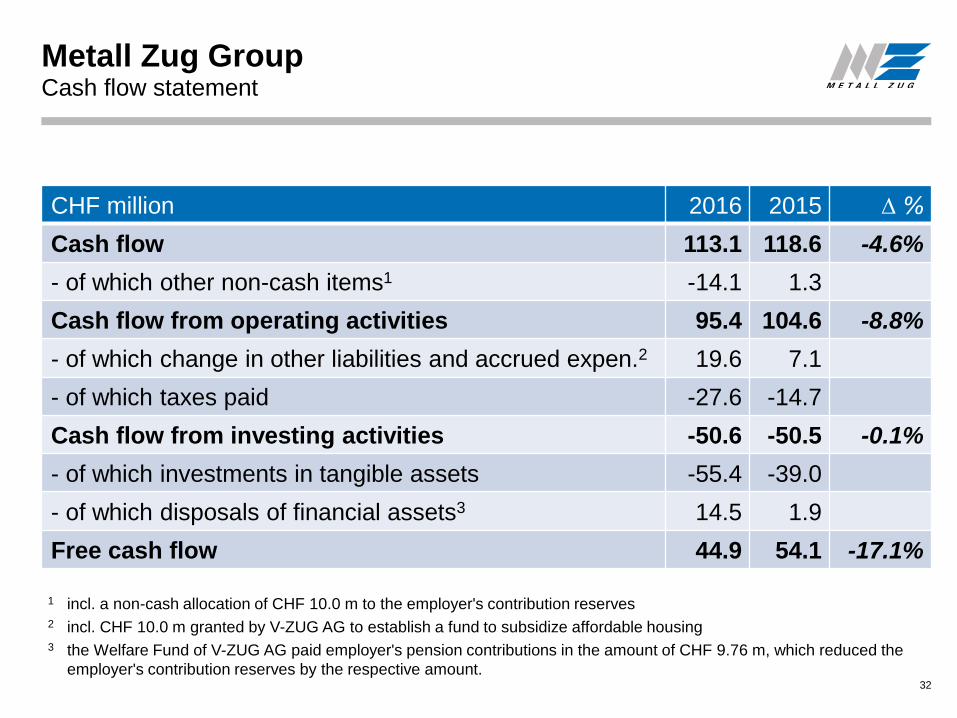
Cash flow statement
CHF million 2016 2015 ∆ %
Cash flow 113.1 118.6 -4.6%
- of which other non-cash items1 -14.1 1.3
Cash flow from operating activities 95.4 104.6 -8.8%
- of which change in other liabilities and accrued expen.2 19.6 7.1
- of which taxes paid -27.6 -14.7
Cash flow from investing activities -50.6 -50.5 -0.1%
- of which investments in tangible assets -55.4 -39.0
- of which disposals of financial assets3 14.5 1.9
Free cash flow 44.9 54.1 -17.1%
1 incl. a non-cash allocation of CHF 10.0 m to the employer's contribution reserves2 incl. CHF 10.0 m granted by V-ZUG AG to establish a fund to subsidize affordable housing3 the Welfare Fund of V-ZUG AG paid employer's pension contributions in the amount of CHF 9.76 m, which reduced the
employer's contribution reserves by the respective amount.
Investments in our future
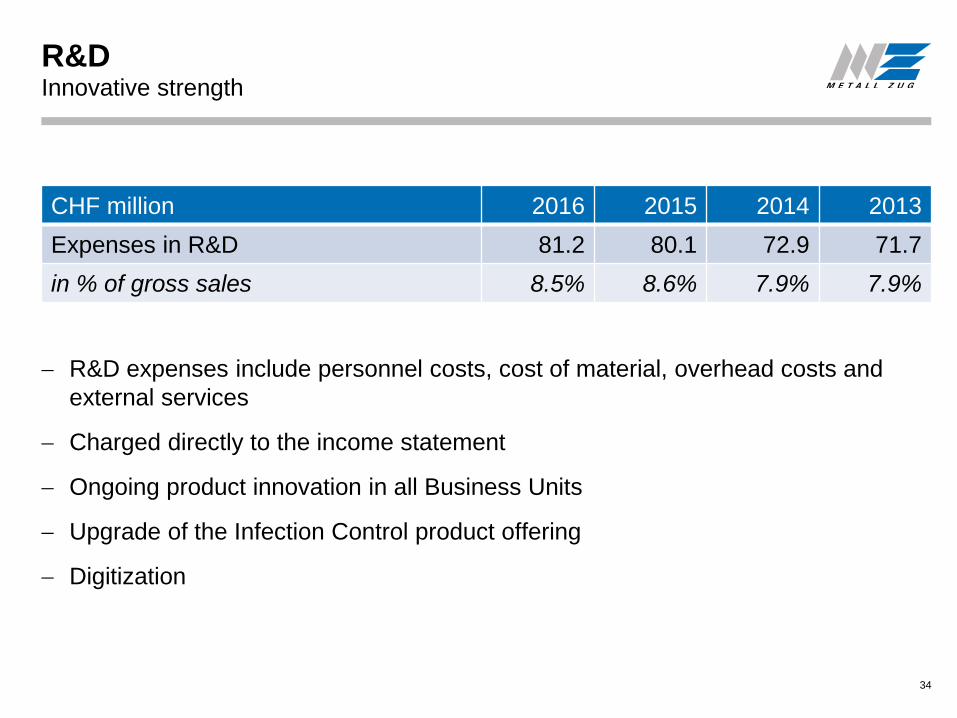
R&DInnovative strength
R&D expenses include personnel costs, cost of material, overhead costs and
external services
Charged directly to the income statement
Ongoing product innovation in all Business Units
Upgrade of the Infection Control product offering
Digitization
34
CHF million 2016 2015 2014 2013
Expenses in R&D 81.2 80.1 72.9 71.7
in % of gross sales 8.5% 8.6% 7.9% 7.9%
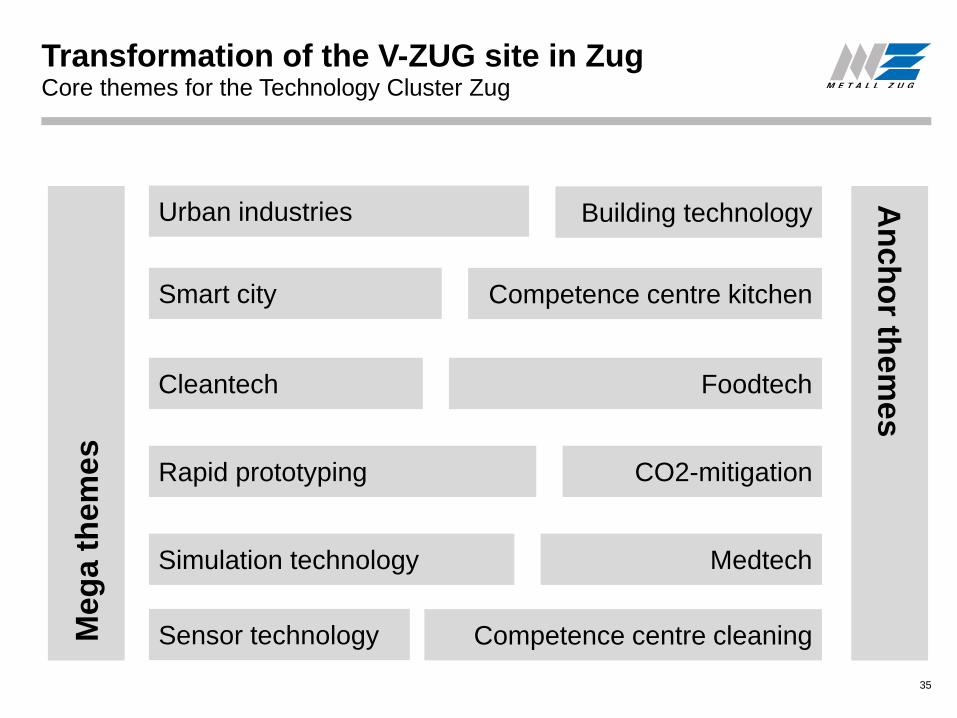
Transformation of the V-ZUG site in ZugCore themes for the Technology Cluster Zug
35
Smart city
Simulation technology
Sensor technology
Rapid prototyping
Urban industries
Me
ga
them
es
An
ch
or th
em
es
Foodtech
Medtech
Building technology
Competence centre kitchen
Competence centre cleaning
Cleantech
CO2-mitigation
Transformation of the V-ZUG site in ZugThomas Sevcik* – The new city
36
Digital urbanity
Absolute vs. effective traffic
New assessment of city areas
Emission-free space
Mixed-use sites
New or no zoning
Real estate developer as curator /
trustee
* Thomas Sevcik is Co-Founder and CEO of the Arthesia
Group, which provides strategic insight on cities, and is
based in Zurich and Los Angeles.
Technology Cluster Zug
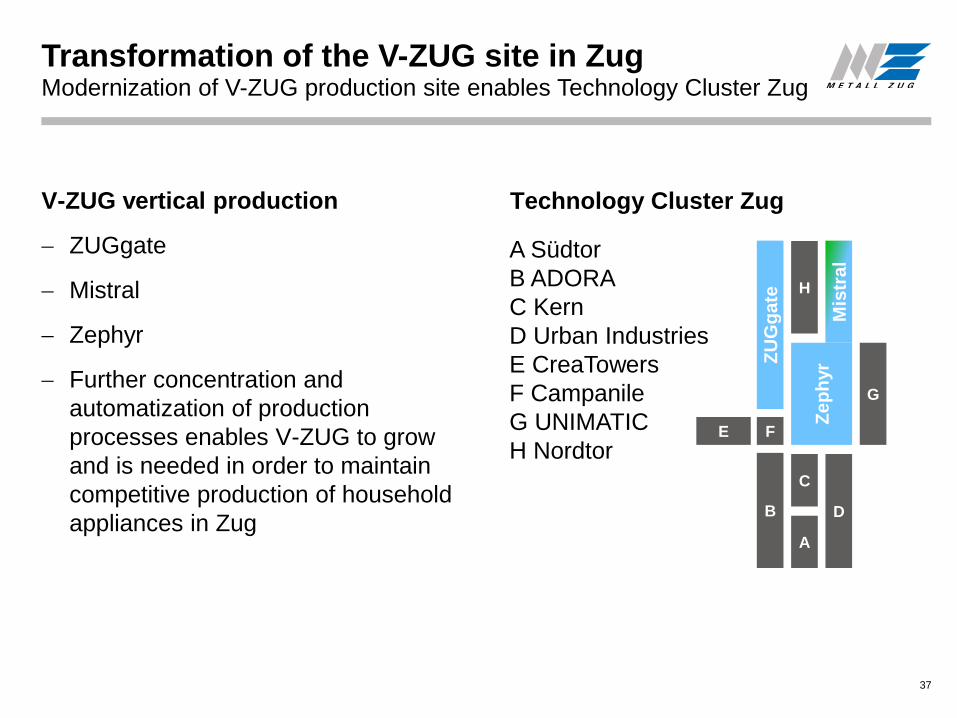
Transformation of the V-ZUG site in ZugModernization of V-ZUG production site enables Technology Cluster Zug
37
V-ZUG vertical production
ZUGgate
Mistral
Zephyr
Further concentration and
automatization of production
processes enables V-ZUG to grow
and is needed in order to maintain
competitive production of household
appliances in Zug
ZU
Gg
ate
H
Mis
tra
lZ
ep
hyr
G
D
C
A
B
FE
A Südtor
B ADORA
C Kern
D Urban Industries
E CreaTowers
F Campanile
G UNIMATIC
H Nordtor
Information for Investors
Investment case
39
Preparing for an insecure future
All three Business Units have to cope with a market environment with short
visibility and limited predictability and hence have to become highly flexible
All Business Units are well positioned in attractive markets with growth potential
based on competitive product portfolios, strong customer relationships and
opportunities related to digital business and processes
Earnings growth drivers are internationalization in HA, the new structure and
service offering in IC and a broader product portfolio (including testing and system
integration) in WP
Stable shareholder base with an entrepreneurial family as its main shareholder
pursues a decidedly long-term perspective creating sustainable value for all
stakeholders
Strong balance sheet enables investments in internal and external growth and
makes it possible to pursue attractive opportunities
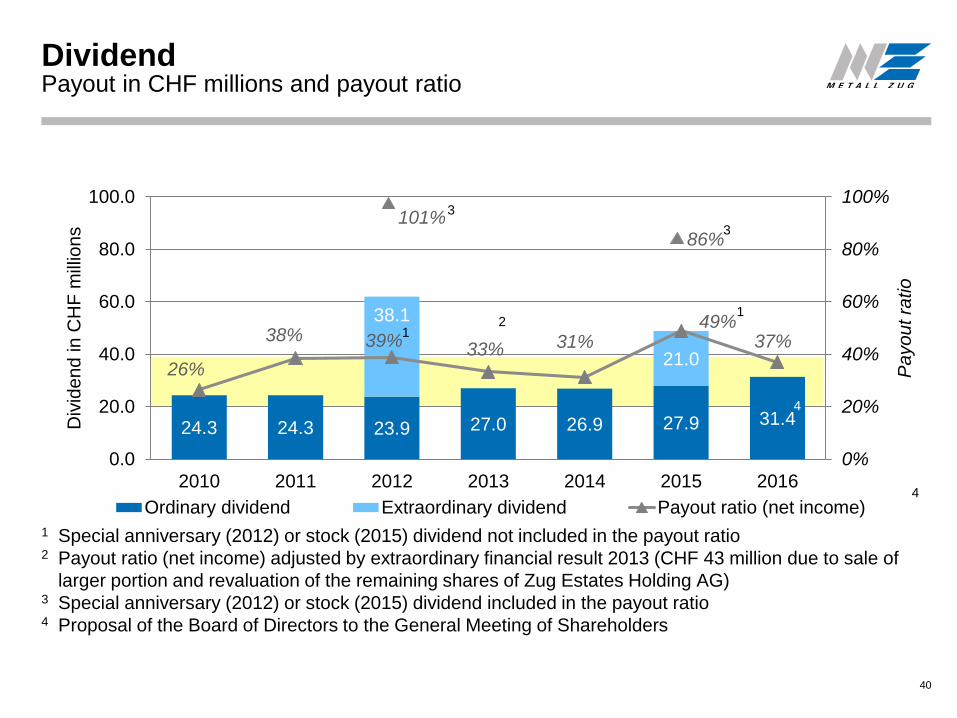
1 Special anniversary (2012) or stock (2015) dividend not included in the payout ratio2 Payout ratio (net income) adjusted by extraordinary financial result 2013 (CHF 43 million due to sale of
larger portion and revaluation of the remaining shares of Zug Estates Holding AG)3 Special anniversary (2012) or stock (2015) dividend included in the payout ratio4 Proposal of the Board of Directors to the General Meeting of Shareholders
DividendPayout in CHF millions and payout ratio
40
2
24.3 24.3 23.9 27.0 26.9 27.9 31.4
38.1
21.026%
38% 39% 33% 31%49%
37%
0%
20%
40%
60%
80%
100%
0.0
20.0
40.0
60.0
80.0
100.0
2010 2011 2012 2013 2014 2015 2016
Pa
yo
ut ra
tio
Div
ide
nd
in
CH
F m
illio
ns
Ordinary dividend Extraordinary dividend Payout ratio (net income)
101%
1
86%
4
4
1
3
3
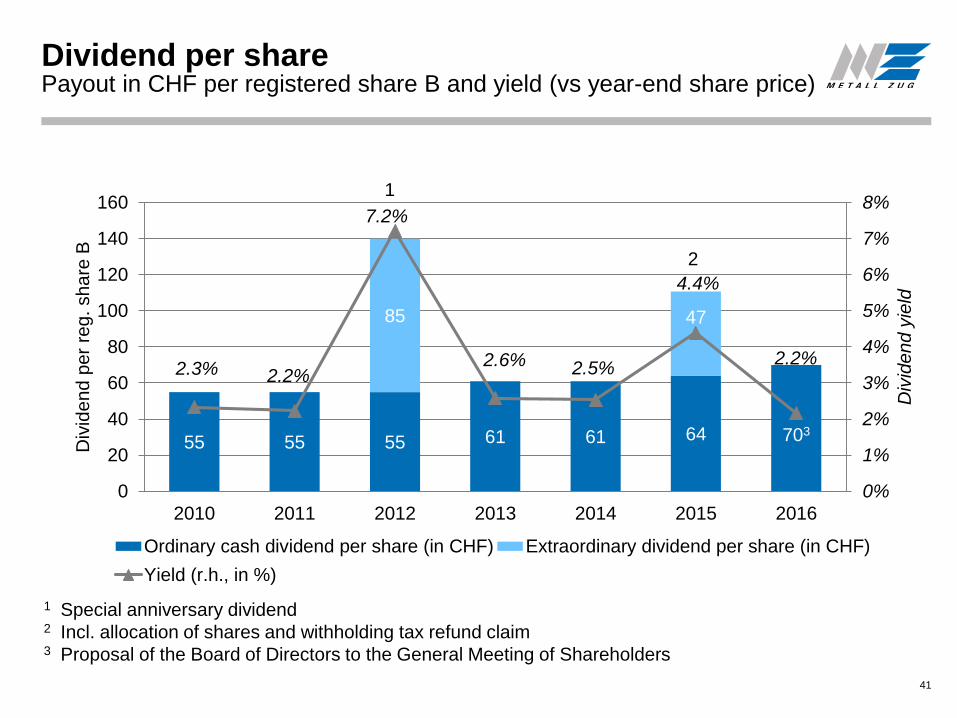
1 Special anniversary dividend2 Incl. allocation of shares and withholding tax refund claim3 Proposal of the Board of Directors to the General Meeting of Shareholders
Dividend per sharePayout in CHF per registered share B and yield (vs year-end share price)
41
55 55 55 61 61 64 703
85 47
2.3% 2.2%
7.2%
2.6% 2.5%
4.4%
2.2%
0%
1%
2%
3%
4%
5%
6%
7%
8%
0
20
40
60
80
100
120
140
160
2010 2011 2012 2013 2014 2015 2016
Div
ide
nd
yie
ld
Div
ide
nd
pe
r re
g. sh
are
B
Ordinary cash dividend per share (in CHF) Extraordinary dividend per share (in CHF)
Yield (r.h., in %)
1
2
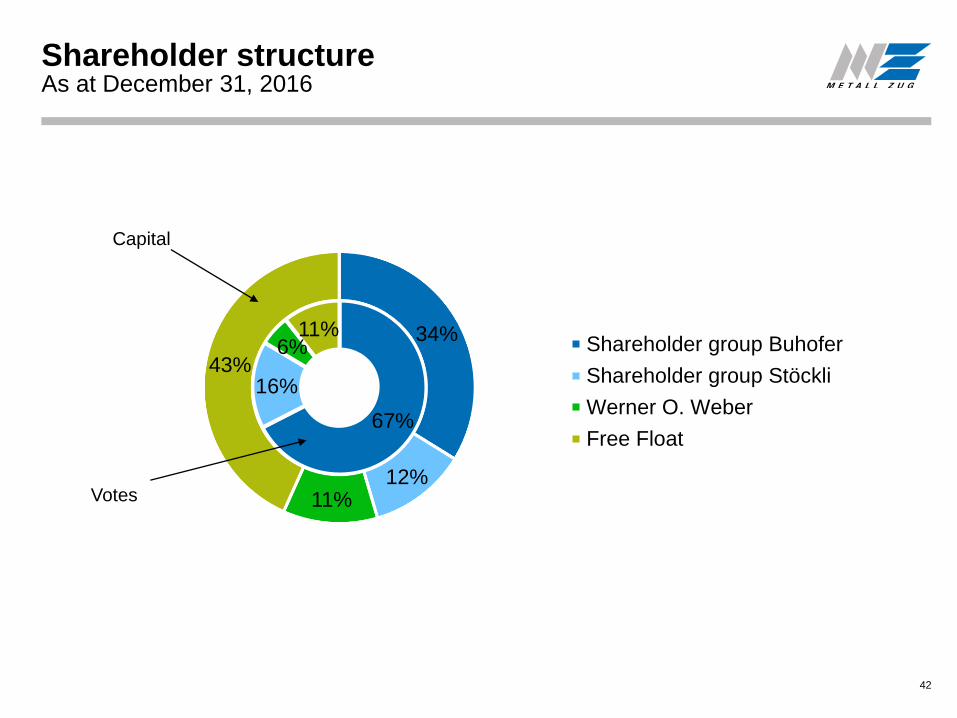
Shareholder structureAs at December 31, 2016
42
Votes
67%
16%
6%11% 34%
12%11%
43%Shareholder group Buhofer
Shareholder group Stöckli
Werner O. Weber
Free Float
Capital
Metall Zug Group
May 5, 2017 General Meeting of Shareholders
August 21, 2017 Publication of the half-year results 2017
43
Financial calendar
Metall Zug Group
Daniel Keist
Chief Financial Officer
Christian Arnold
Head of Corporate Communications & Investor Relations
Metall Zug AG
Industriestrasse 66
CH-6301 Zug
Switzerland
Phone: +41 58 768 10 20
44
Contact
Metall Zug Group
Metall Zug AG is making great efforts to include accurate and up-to-date information in this
document. However, we make no representations or warranties, expressed or implied, as to
the accuracy or completeness of the information provided in this document and we disclaim
any liability whatsoever for the use of it.
The statements in this document relating to matters that are not historical facts are forward-
looking statements. These forward-looking statements are based on estimates and
assumptions of the company and are believed to be reasonable, though are inherently
uncertain, difficult to predict and no guarantees of future performance. They may involve risks
and uncertainties including but not limited to: future global economic conditions, technological
advances, exchange rates, regulatory rules, market conditions, the actions of competitors and
other factors beyond the control of the company. Metall Zug AG disclaims any intention or
obligation to update these forward-looking statements.
The information provided in this document is not intended nor may be construed as an offer or
solicitation for purchase or disposal, trading or any transaction in any Metall Zug AG securities
or other financial instruments. Investors must not rely on this information for investment
decisions.
Disclaimer
45