Embed Size (px)
DESCRIPTION
Citation preview

December 13, 2012
Investor Day
Mike Waites, President and CEO
Strategic Overview
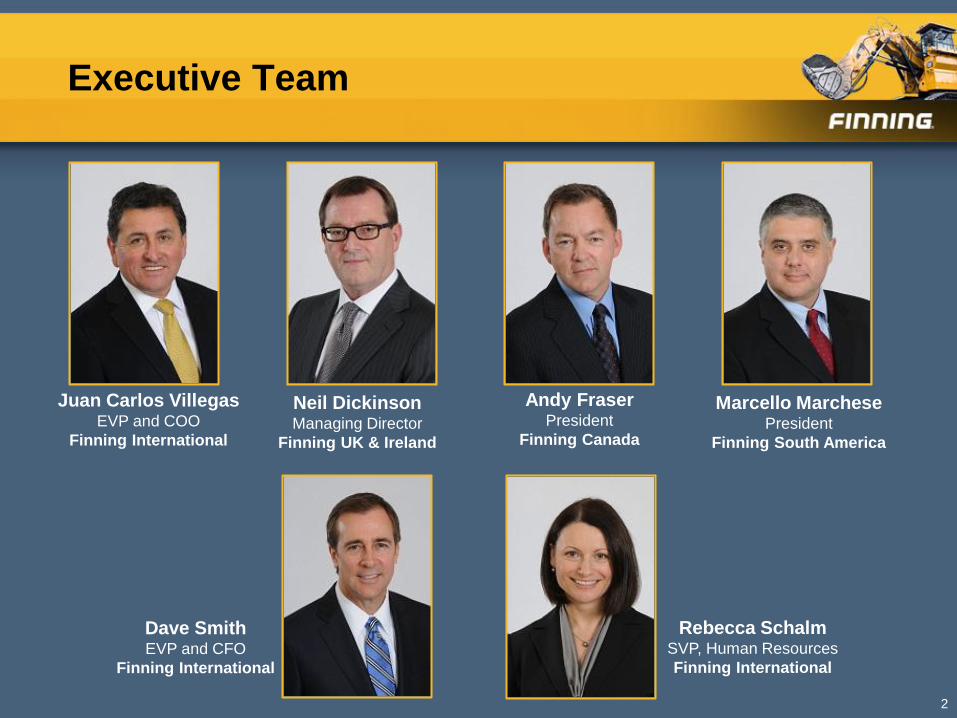
Executive Team
2
Andy Fraser President
Finning Canada
Dave Smith EVP and CFO
Finning International
Neil Dickinson Managing Director
Finning UK & Ireland
Rebecca Schalm SVP, Human Resources
Finning International
Marcello Marchese President
Finning South America
Juan Carlos Villegas EVP and COO
Finning International
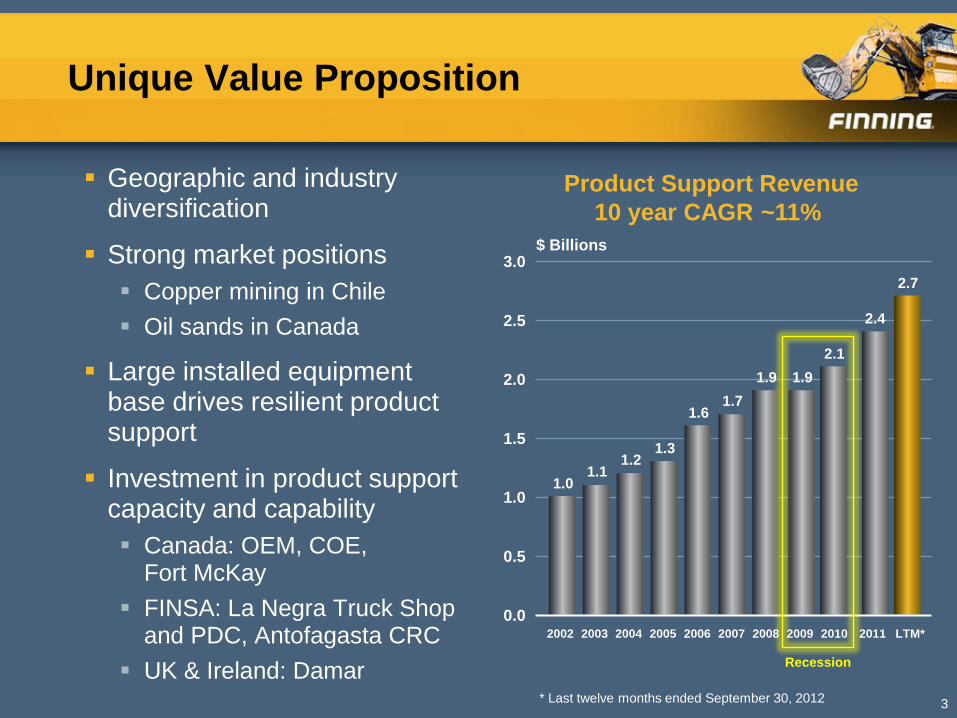
Unique Value Proposition
Geographic and industry diversification
Strong market positions
Copper mining in Chile
Oil sands in Canada
Large installed equipment base drives resilient product support
Investment in product support capacity and capability
Canada: OEM, COE, Fort McKay
FINSA: La Negra Truck Shop and PDC, Antofagasta CRC
UK & Ireland: Damar
3
$ Billions
* Last twelve months ended September 30, 2012
Recession
1.0 1.1
1.2 1.3
1.6 1.7
1.9 1.9
2.1
2.4
2.7
0.0
0.5
1.0
1.5
2.0
2.5
3.0
2002 2003 2004 2005 2006 2007 2008 2009 2010 2011 LTM*
Product Support Revenue
10 year CAGR ~11%
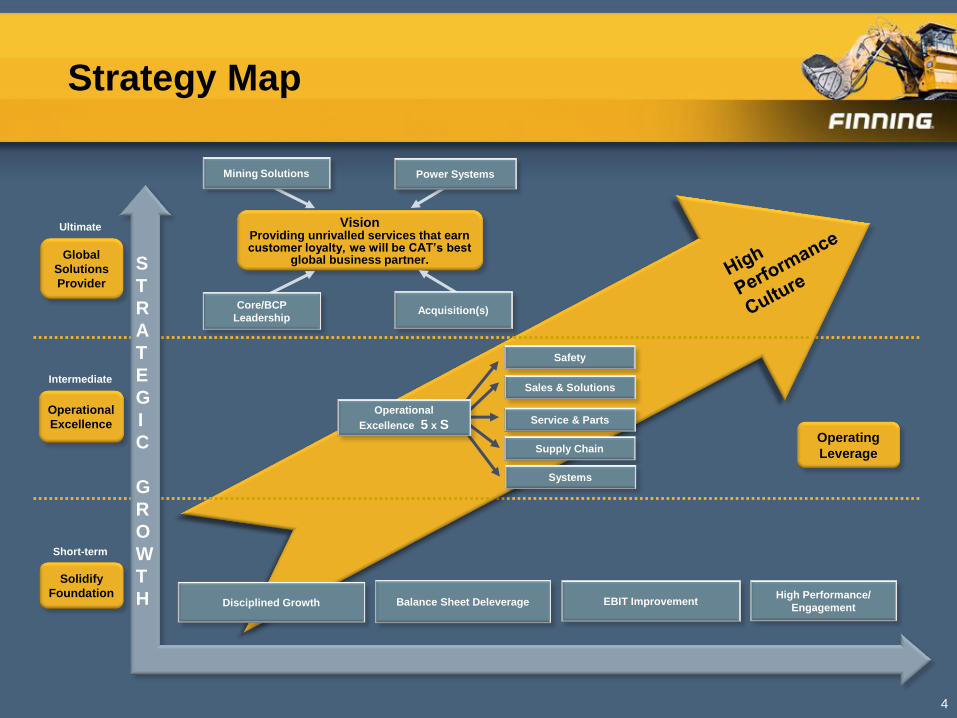
Strategy Map
4
Global
Solutions
Provider
Operational
Excellence
Solidify
Foundation
S
T
R
A
T
E
G
I
C
G
R
O
W
T
H
Vision Providing unrivalled services that earn customer loyalty, we will be CAT’s best
global business partner.
Acquisition(s)
Power Systems
Core/BCP
Leadership
Disciplined Growth EBIT Improvement Balance Sheet Deleverage High Performance/
Engagement
Sales & Solutions
Service & Parts
Supply Chain
Safety
Systems
Mining Solutions
Operating
Leverage
Ultimate
Intermediate
Short-term
Operational
Excellence 5 x S
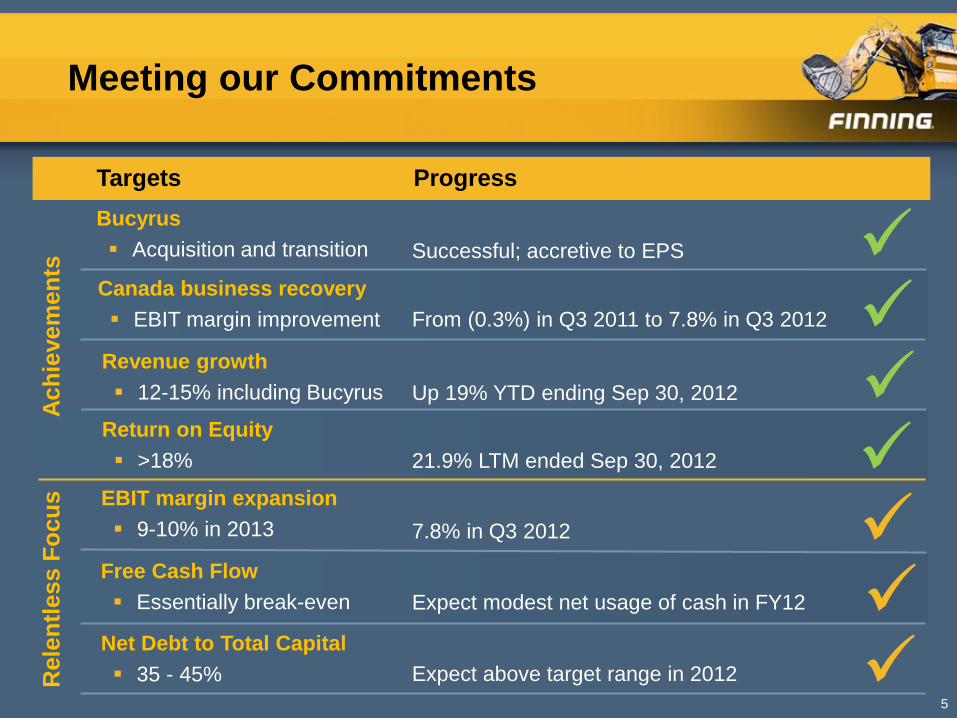
Meeting our Commitments
5
7.8% in Q3 2012
From (0.3%) in Q3 2011 to 7.8% in Q3 2012
Expect modest net usage of cash in FY12
Expect above target range in 2012
Targets
EBIT margin expansion
9-10% in 2013
Free Cash Flow
Essentially break-even
Net Debt to Total Capital
35 - 45%
Canada business recovery
EBIT margin improvement
Revenue growth
12-15% including Bucyrus Up 19% YTD ending Sep 30, 2012
Ach
ievem
en
ts
Return on Equity
>18% 21.9% LTM ended Sep 30, 2012
Bucyrus
Acquisition and transition Successful; accretive to EPS
Rele
ntl
ess F
ocu
s
Progress
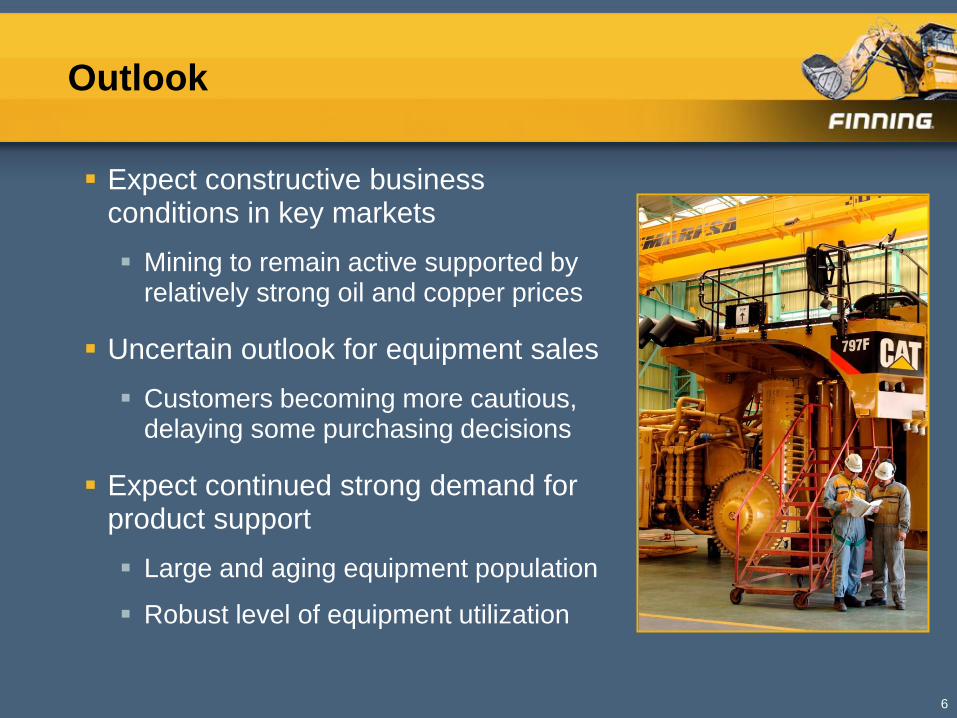
Outlook
Expect constructive business conditions in key markets
Mining to remain active supported by relatively strong oil and copper prices
Uncertain outlook for equipment sales
Customers becoming more cautious, delaying some purchasing decisions
Expect continued strong demand for product support
Large and aging equipment population
Robust level of equipment utilization
6
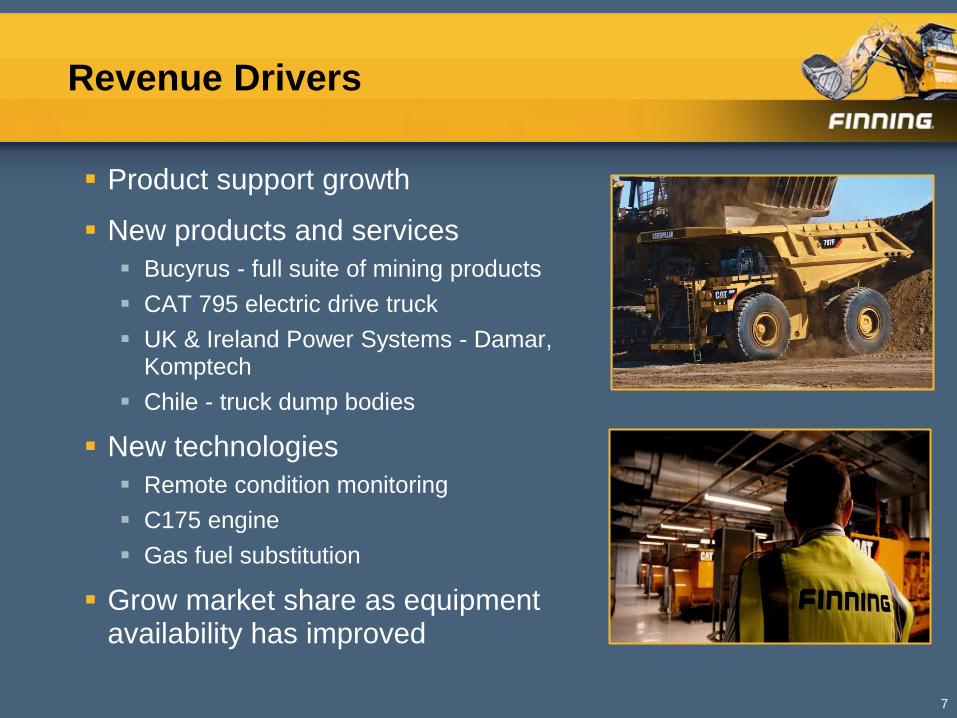
Revenue Drivers
Product support growth
New products and services
Bucyrus - full suite of mining products
CAT 795 electric drive truck
UK & Ireland Power Systems - Damar, Komptech
Chile - truck dump bodies
New technologies
Remote condition monitoring
C175 engine
Gas fuel substitution
Grow market share as equipment availability has improved
7
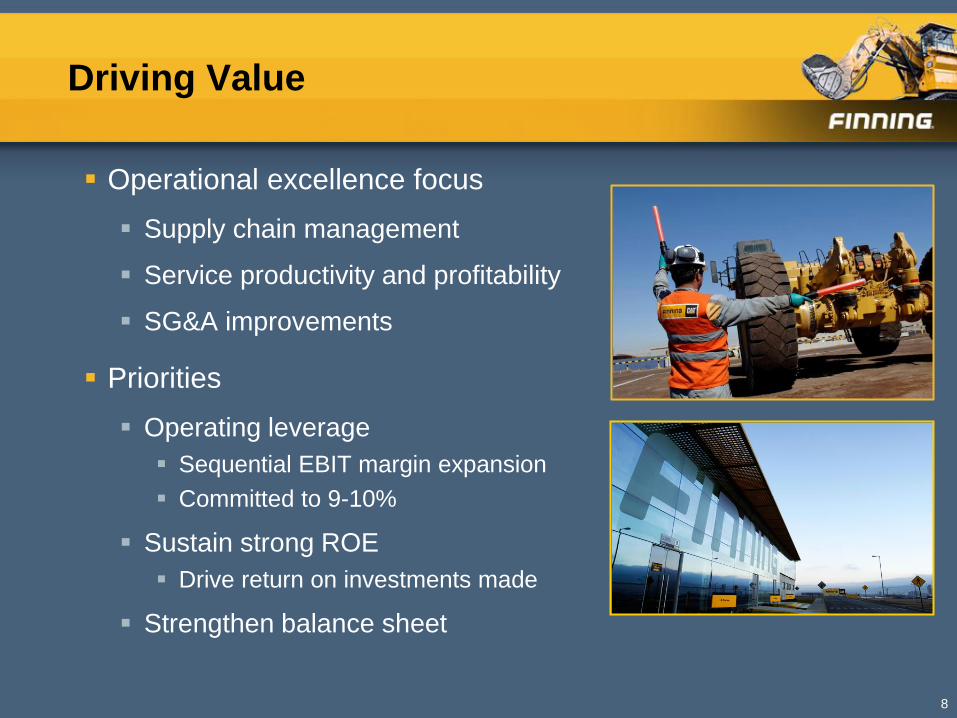
Driving Value
Operational excellence focus
Supply chain management
Service productivity and profitability
SG&A improvements
Priorities
Operating leverage
Sequential EBIT margin expansion
Committed to 9-10%
Sustain strong ROE
Drive return on investments made
Strengthen balance sheet
8
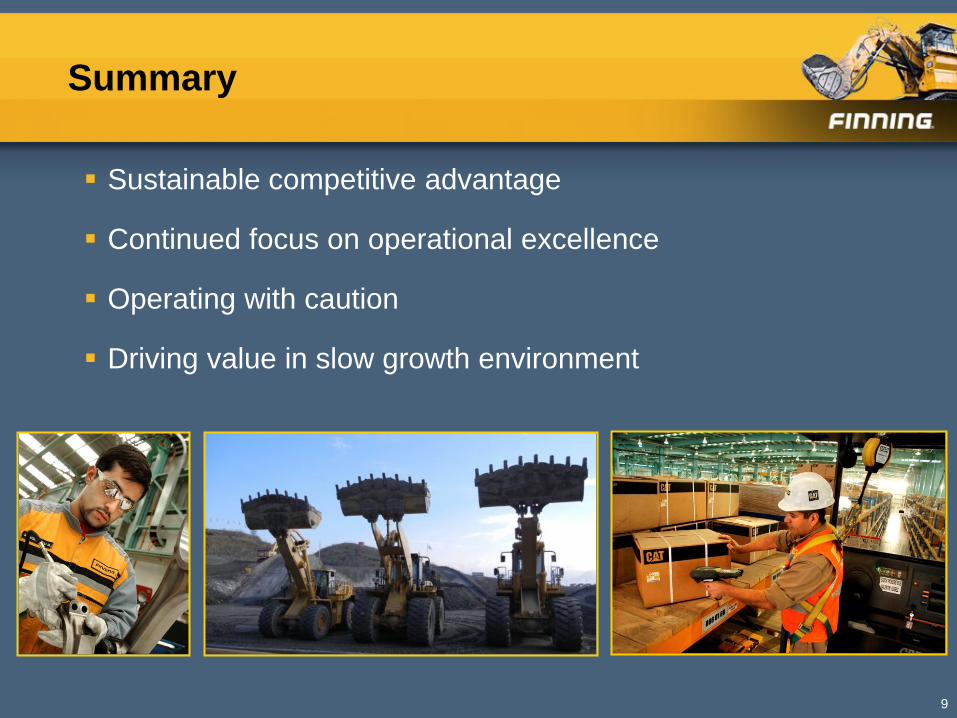
Summary
Sustainable competitive advantage
Continued focus on operational excellence
Operating with caution
Driving value in slow growth environment
9

December 13, 2012
Investor Day
Dave Smith, EVP and CFO
Financial Outlook
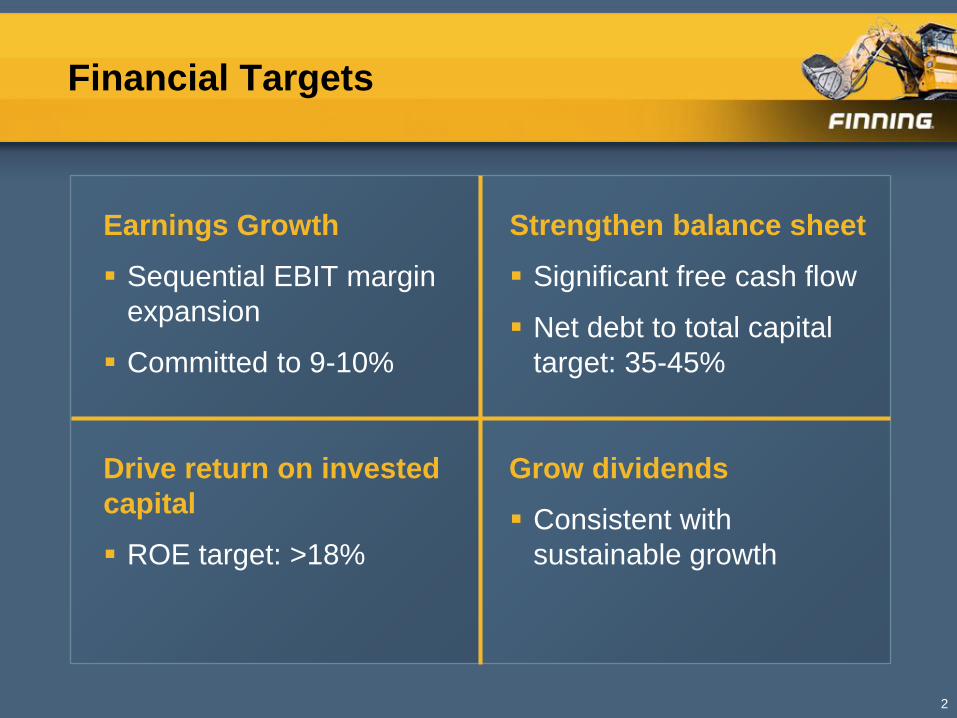
Financial Targets
Earnings Growth
Sequential EBIT margin
expansion
Committed to 9-10%
2
Strengthen balance sheet
Significant free cash flow
Net debt to total capital
target: 35-45%
Drive return on invested
capital
ROE target: >18%
Grow dividends
Consistent with
sustainable growth
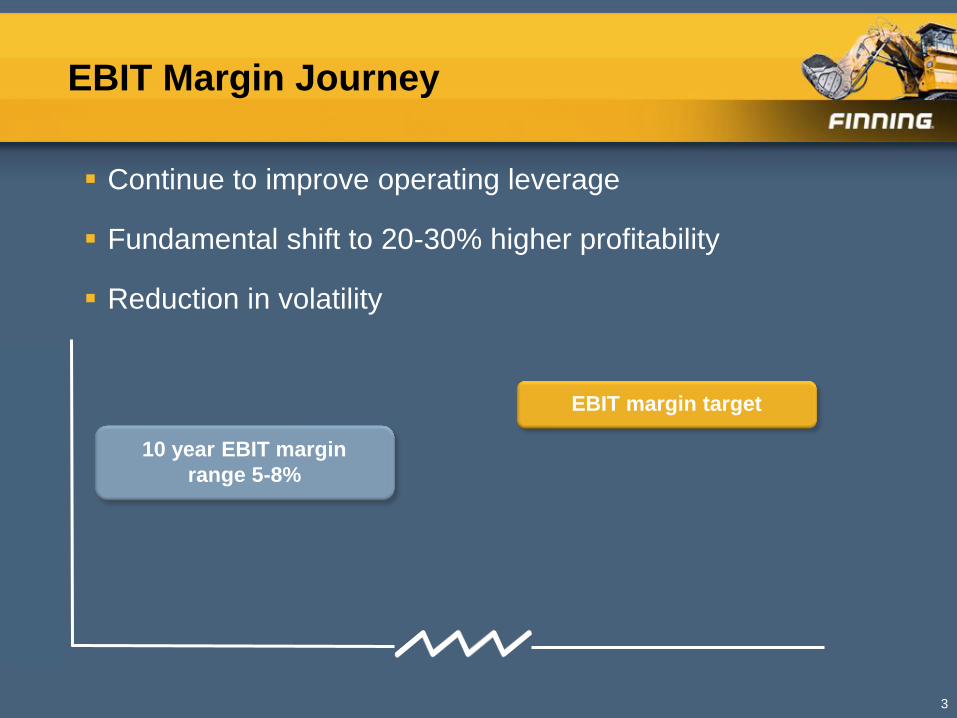
EBIT Margin Journey
Continue to improve operating leverage
Fundamental shift to 20-30% higher profitability
Reduction in volatility
3
EBIT margin target
10 year EBIT margin
range 5-8%
0
10
20
30
40
50
60
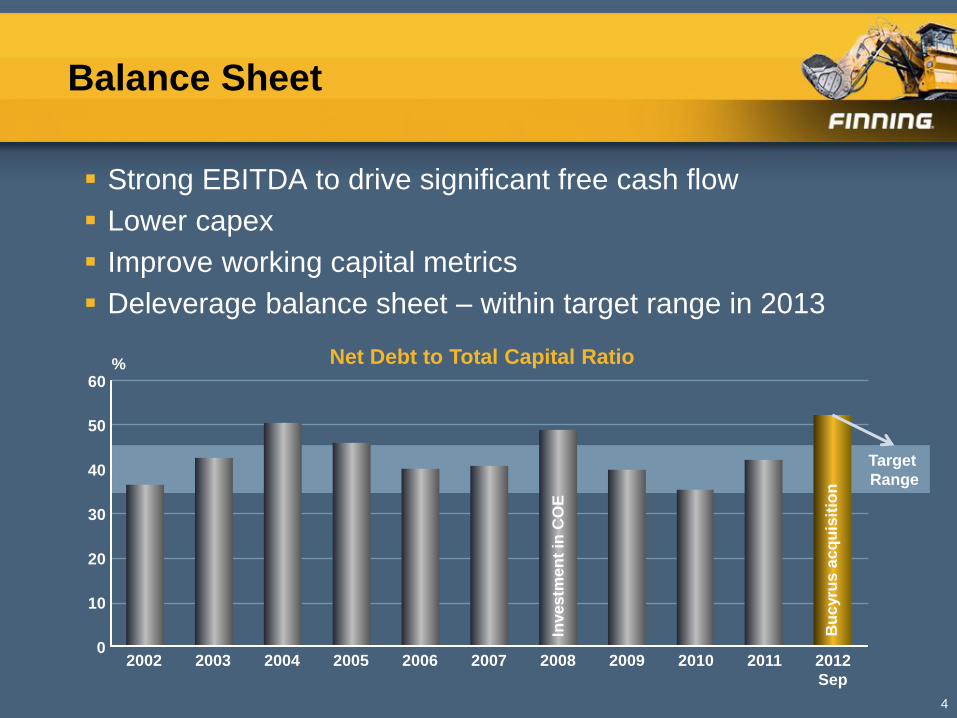
2002 2003 2004 2005 2006 2007 2008 2009 2010 2011 2012
Sep
Net Debt to Total Capital Ratio %
Balance Sheet
Strong EBITDA to drive significant free cash flow
Lower capex
Improve working capital metrics
Deleverage balance sheet – within target range in 2013
4
Target
Range
Bu
cyru
s a
cq
uis
itio
n
Inve
stm
en
t in
CO
E
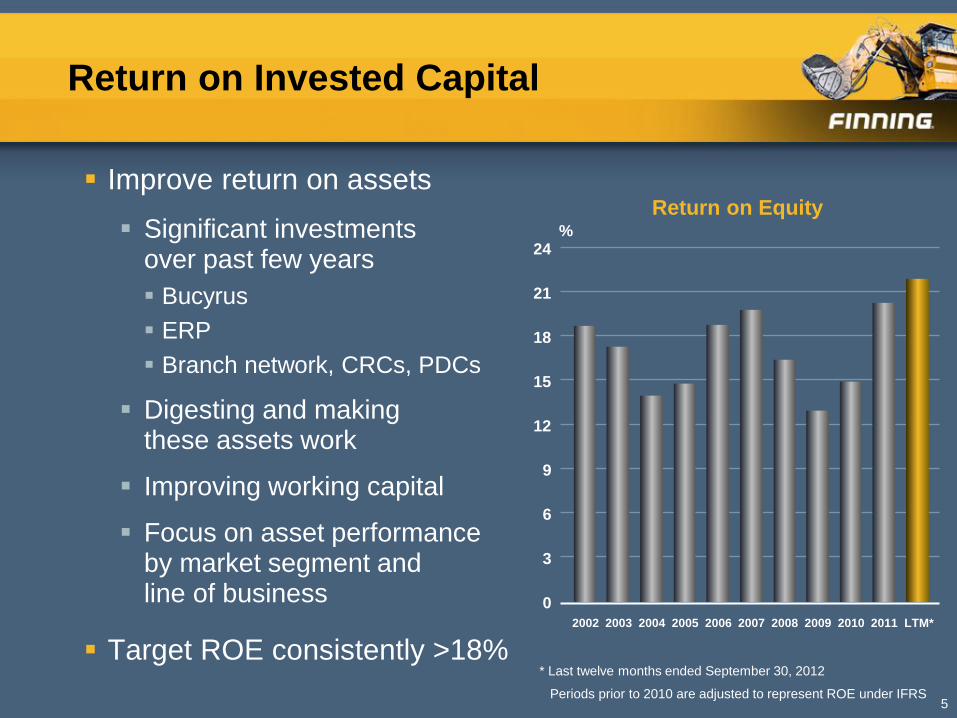
Return on Invested Capital
Improve return on assets
Significant investments over past few years
Bucyrus
ERP
Branch network, CRCs, PDCs
Digesting and making these assets work
Improving working capital
Focus on asset performance by market segment and line of business
Target ROE consistently >18%
5
* Last twelve months ended September 30, 2012
0
3
6
9
12
15
18
21
24
2002 2003 2004 2005 2006 2007 2008 2009 2010 2011 LTM*
Return on Equity %
Periods prior to 2010 are adjusted to represent ROE under IFRS
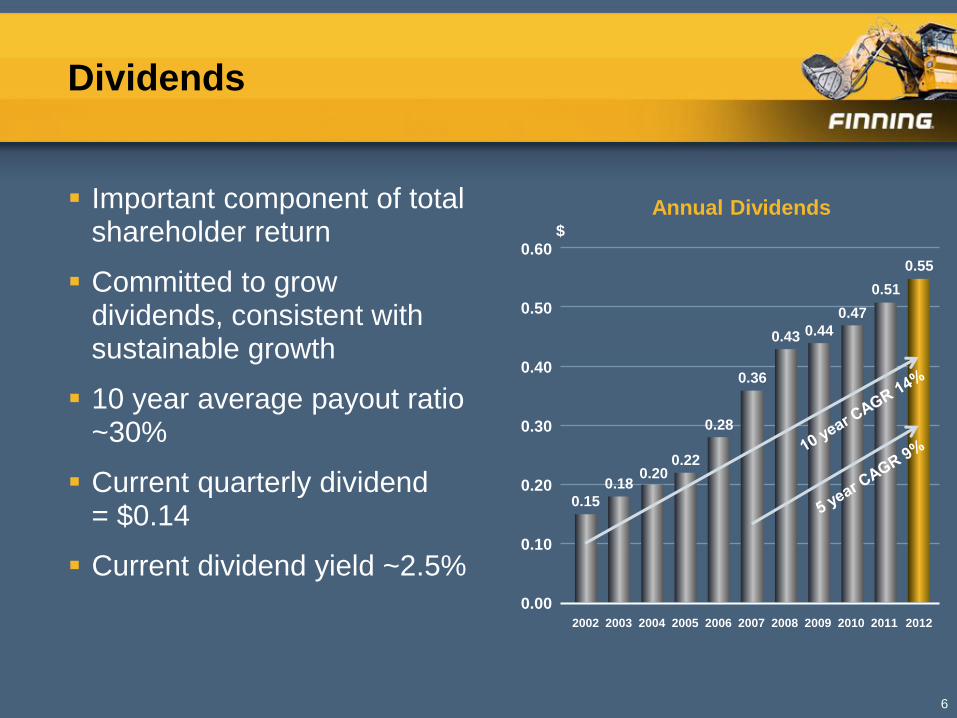
Dividends
Important component of total shareholder return
Committed to grow dividends, consistent with sustainable growth
10 year average payout ratio ~30%
Current quarterly dividend = $0.14
Current dividend yield ~2.5%
6
0.00
0.10
0.20
0.30
0.40
0.50
0.60
2002 2003 2004 2005 2006 2007 2008 2009 2010 2011 2012
Annual Dividends $
0.15
0.18 0.20
0.22
0.28
0.36
0.43 0.44
0.47
0.51
0.55
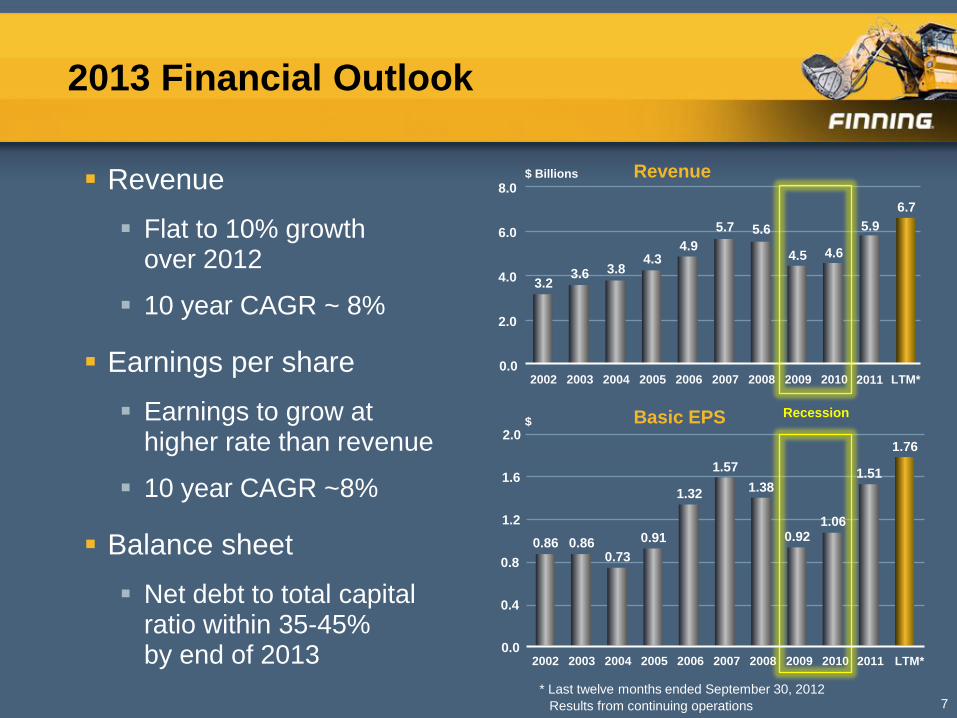
2013 Financial Outlook
Revenue
Flat to 10% growth over 2012
10 year CAGR ~ 8%
Earnings per share
Earnings to grow at higher rate than revenue
10 year CAGR ~8%
Balance sheet
Net debt to total capital ratio within 35-45% by end of 2013
7
$ Billions
* Last twelve months ended September 30, 2012
Revenue
Basic EPS
0.0
2.0
4.0
6.0
8.0
2002 2003 2004 2005 2006 2007 2008 2009 2010 LTM* 2011
0.0
0.4
0.8
1.2
1.6
2002 2003 2004 2005 2006 2007 2008 2009 2010 LTM* 2011
2.0 $
3.2 3.6 3.8
4.3 4.9
5.7 5.6
4.5 4.6
5.9
6.7
0.86 0.86 0.73
0.91
1.32
1.57
1.38
0.92 1.06
1.51
1.76
Recession
Results from continuing operations
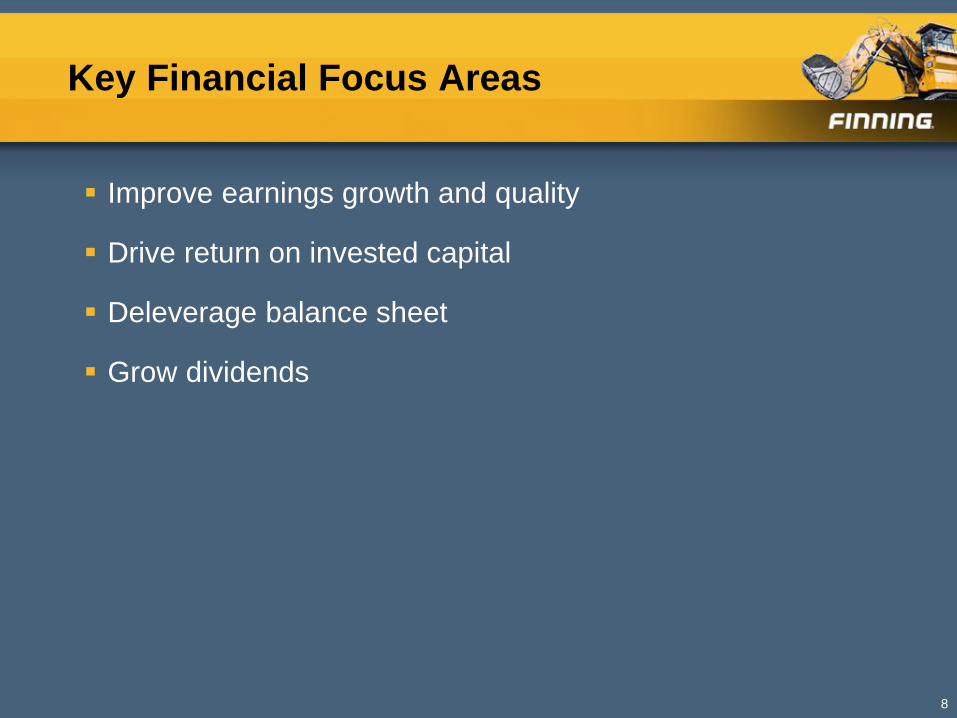
Key Financial Focus Areas
Improve earnings growth and quality
Drive return on invested capital
Deleverage balance sheet
Grow dividends
8

December 13, 2012
Investor Day
Juan Carlos Villegas, EVP and COO
Operational Excellence
Strategy Map
2
Global
Solutions
Provider
Operational
Excellence
Solidify
Foundation
S
T
R
A
T
E
G
I
C
G
R
O
W
T
H
Vision Providing unrivalled services that earn customer loyalty, we will be CAT’s best
global business partner.
Acquisition(s)
Power Systems
Core/BCP
Leadership
Disciplined Growth EBIT Improvement Balance Sheet Deleverage High Performance/
Engagement
Sales & Solutions
Service & Parts
Supply Chain
Safety
Systems
Operational
Excellence 5 x S
Mining Solutions
Operating
Leverage
Ultimate
Intermediate
Short-term

Operational Excellence
Maintain local customer focus
Align organizational structure to strategy
Consistently apply leading practices which add value
Leverage expertise of Finning’s regions
Share learning across organization
Focus on margin expansion
3
Customer Centric
Culture
Operational Discipline
and Efficiency
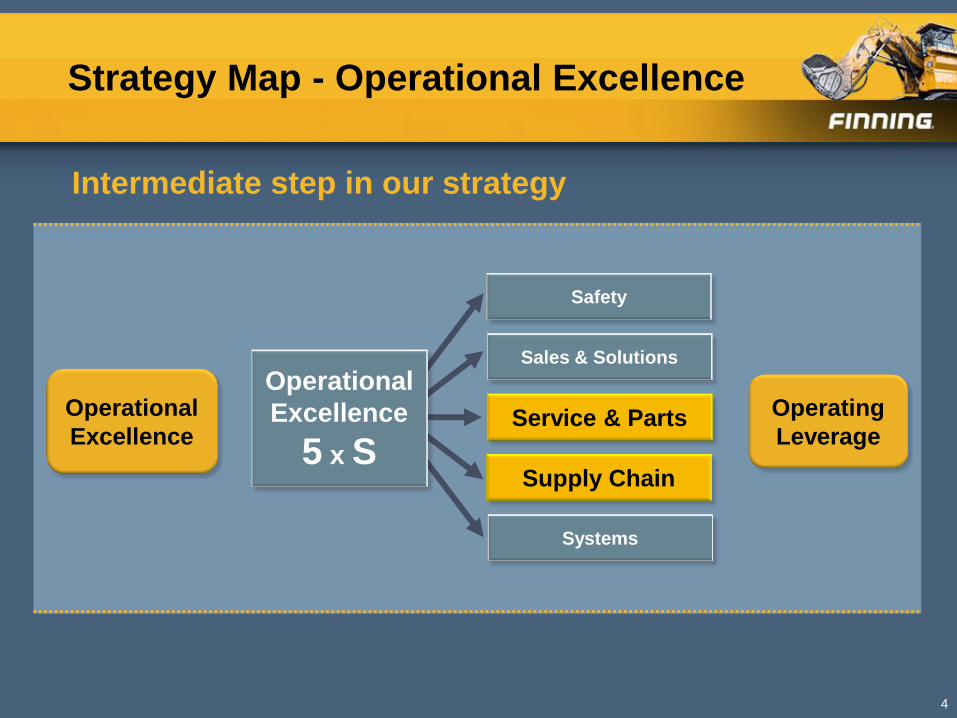
Strategy Map - Operational Excellence
Intermediate step in our strategy
4
Operational
Excellence
Sales & Solutions
Service & Parts
Supply Chain
Safety
Systems
Operational
Excellence
5 x S
Operating
Leverage
Safety
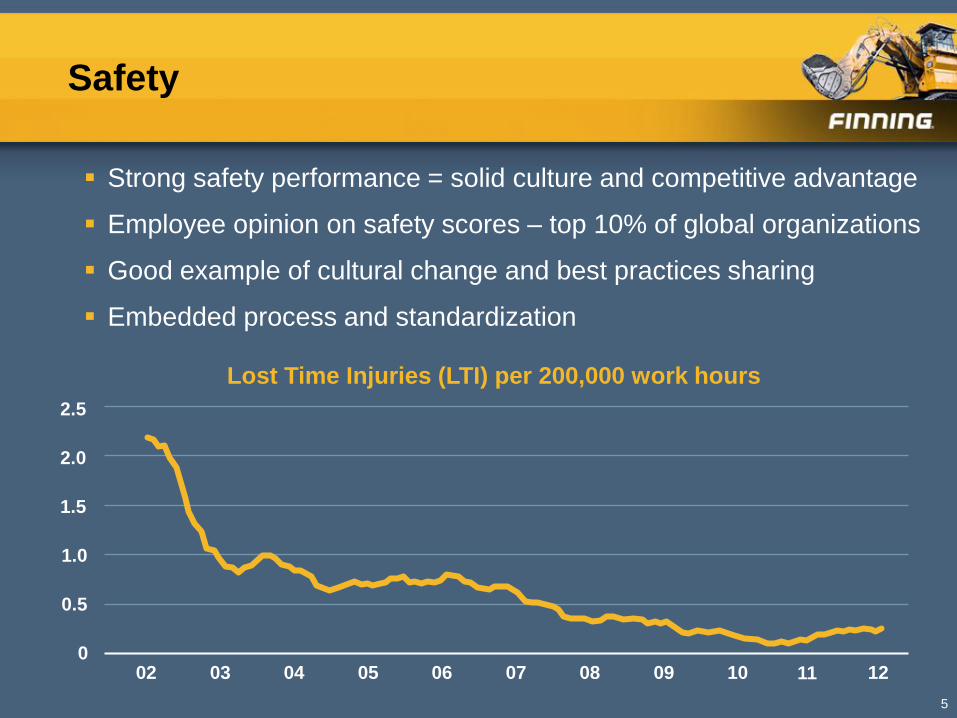
Strong safety performance = solid culture and competitive advantage
Employee opinion on safety scores – top 10% of global organizations
Good example of cultural change and best practices sharing
Embedded process and standardization
5
Lost Time Injuries (LTI) per 200,000 work hours
0
0.5
1.0
1.5
2.0
2.5
02 03 04 05 06 07 08 09 10 12 11
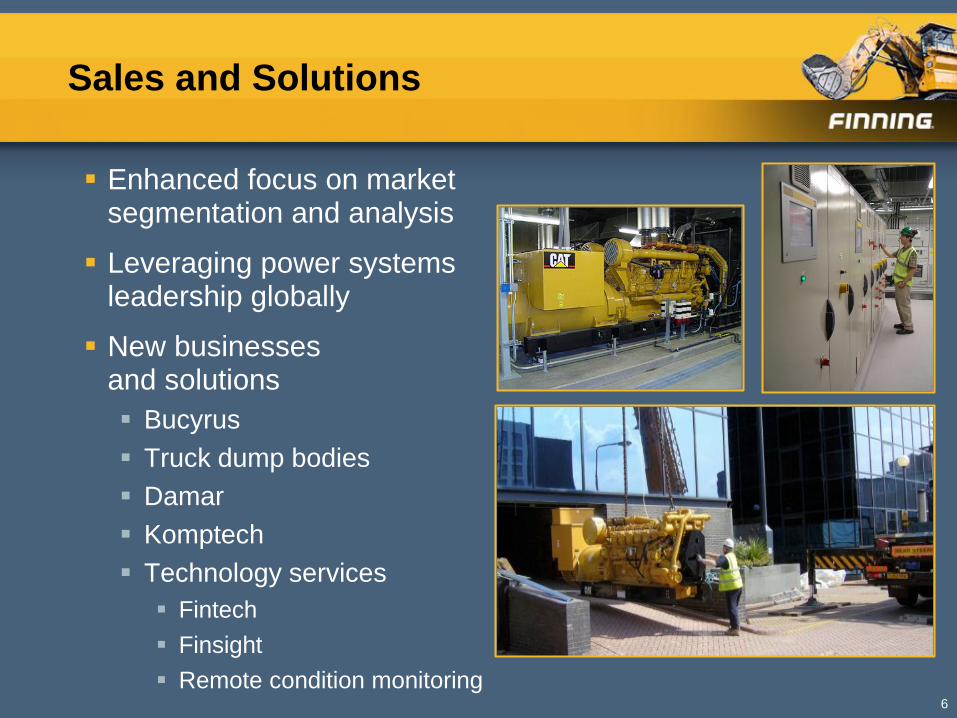
Sales and Solutions
Enhanced focus on market segmentation and analysis
Leveraging power systems leadership globally
New businesses and solutions
Bucyrus
Truck dump bodies
Damar
Komptech
Technology services
Fintech
Finsight
Remote condition monitoring 6
Sales and Solutions – Bucyrus Update
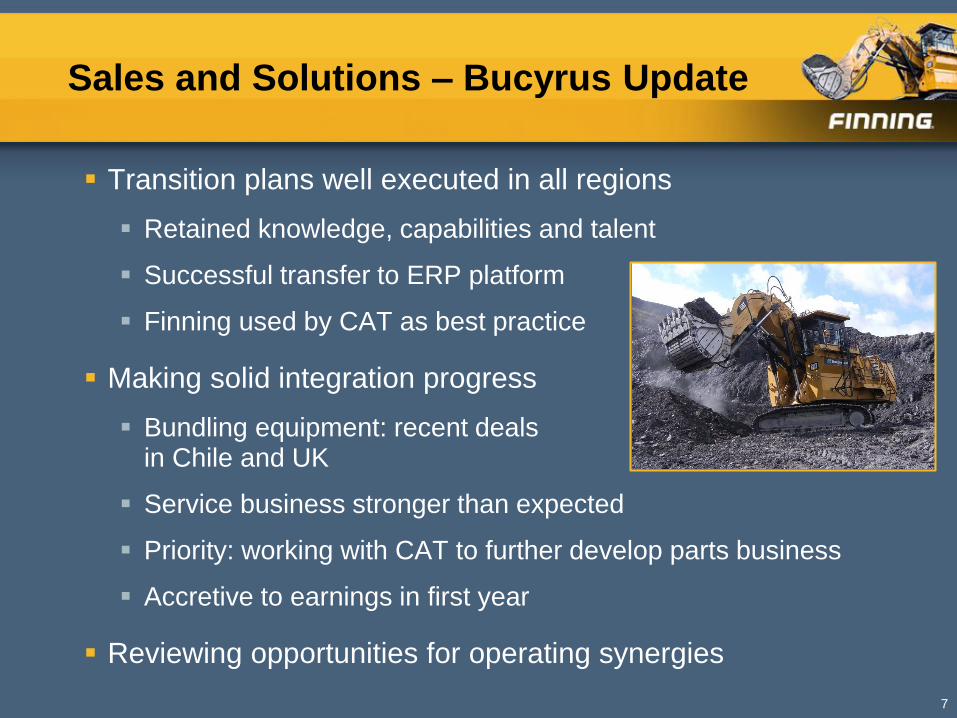
Transition plans well executed in all regions
Retained knowledge, capabilities and talent
Successful transfer to ERP platform
Finning used by CAT as best practice
Making solid integration progress
Bundling equipment: recent deals in Chile and UK
Service business stronger than expected
Priority: working with CAT to further develop parts business
Accretive to earnings in first year
Reviewing opportunities for operating synergies
7
Service and Parts
Service productivity
Customer centric culture to be balanced with operating discipline
Leverage asset investments from past five years: La Negra, COE and Fort MacKay
Lean manufacturing applied to our business - Caterpillar Production System (CPS)
Capacity planning and equipment scheduling
Global service productivity team
Application of shared learning and best practices
Experts from each region working together to enhance global performance
Outcome: improved customer service and profitability 8
Supply Chain
Building sustainable, efficient and consistent supply chain
Standardized, rigorous processes with common metrics
Sharing leading practices across the regions
Regional leads are Global Supply Chain Council members
End-to-end processes include Caterpillar
Improving inventory planning process
Sustainable benefits
Faster inventory turns while maintaining service levels
Shorter cash-to-cash cycle
Reduced working capital levels over business cycle
Improved asset utilization
Improving customer service and satisfaction
9
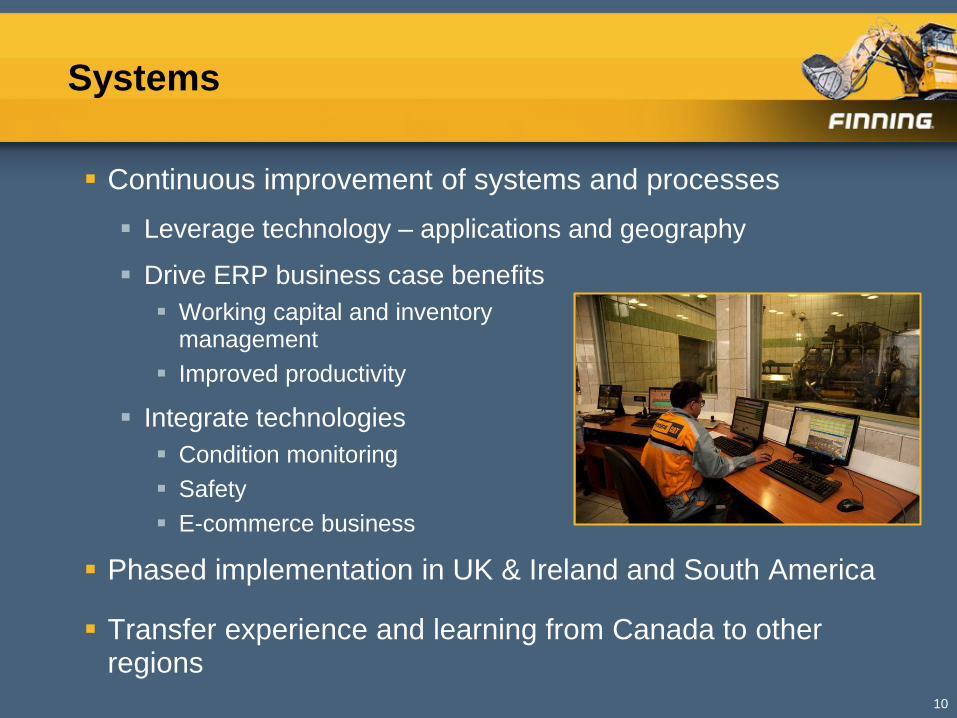
Systems
Continuous improvement of systems and processes
Leverage technology – applications and geography
Drive ERP business case benefits
Working capital and inventory management
Improved productivity
Integrate technologies
Condition monitoring
Safety
E-commerce business
Phased implementation in UK & Ireland and South America
Transfer experience and learning from Canada to other regions
10
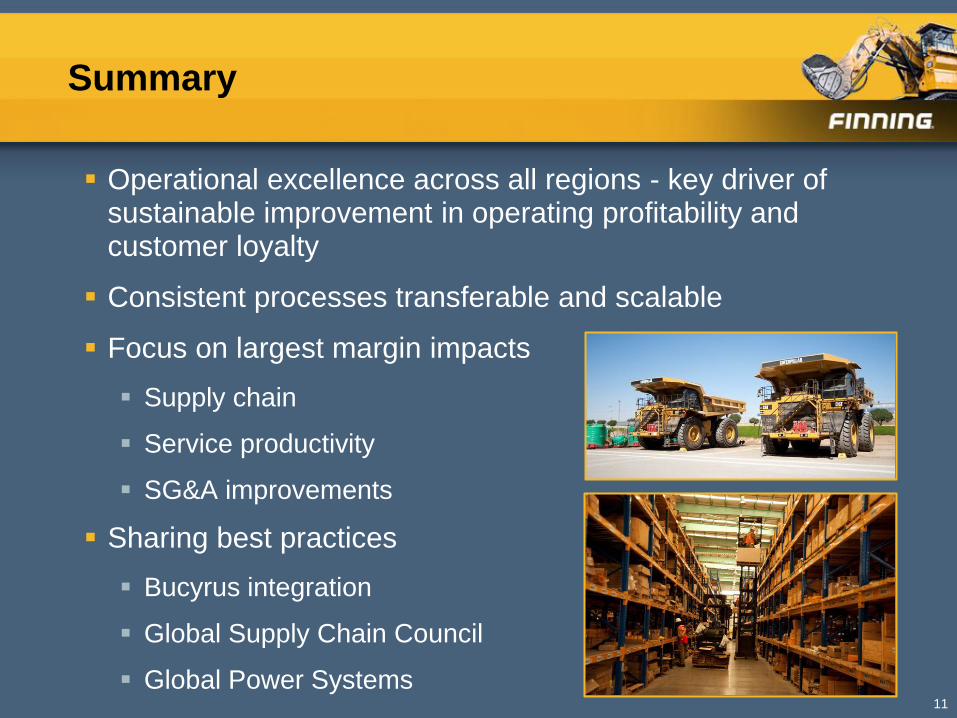
Summary
Operational excellence across all regions - key driver of sustainable improvement in operating profitability and customer loyalty
Consistent processes transferable and scalable
Focus on largest margin impacts
Supply chain
Service productivity
SG&A improvements
Sharing best practices
Bucyrus integration
Global Supply Chain Council
Global Power Systems 11

December 13, 2012
Investor Day
Andy Fraser, President, Finning Canada
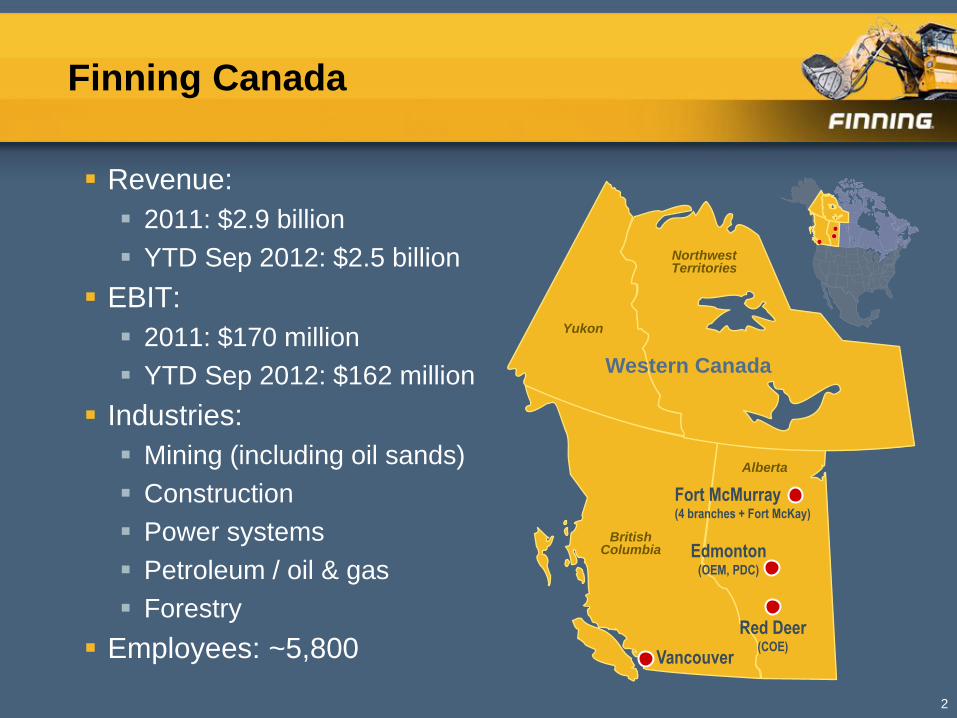
Finning Canada
Revenue:
2011: $2.9 billion
YTD Sep 2012: $2.5 billion
EBIT:
2011: $170 million
YTD Sep 2012: $162 million
Industries:
Mining (including oil sands)
Construction
Power systems
Petroleum / oil & gas
Forestry
Employees: ~5,800
2
Vancouver
Edmonton (OEM, PDC)
Fort McMurray (4 branches + Fort McKay)
Western Canada
Red Deer (COE)
British Columbia
Alberta
Yukon
Northwest Territories
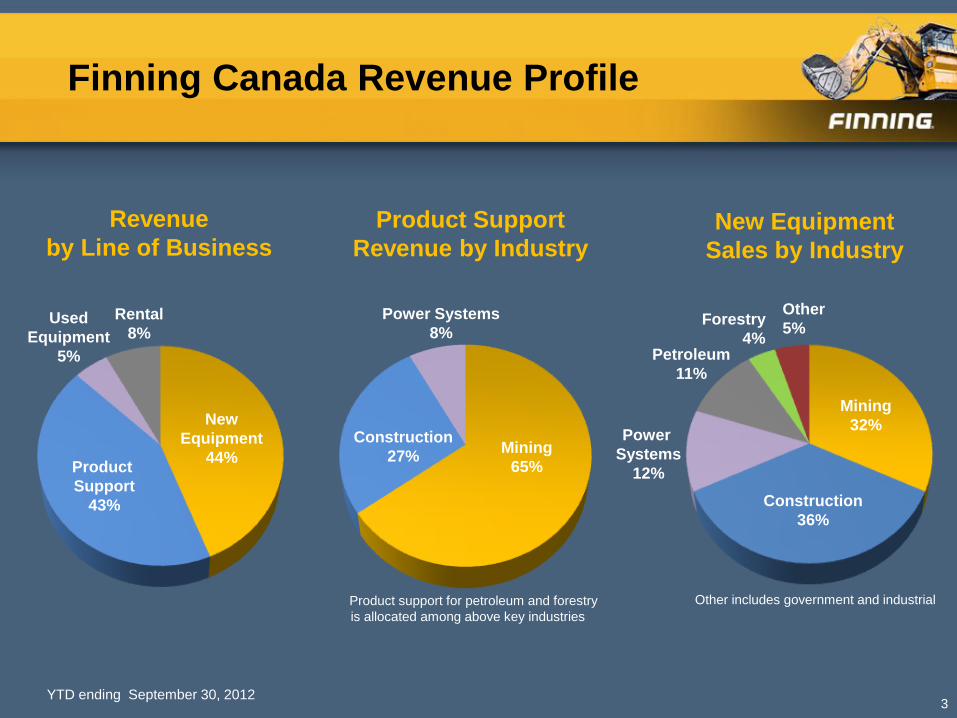
Finning Canada Revenue Profile
3
Mining
32% Power
Systems
12%
Construction
36%
Mining
65%
Power Systems
8%
Construction
27%
Product Support
Revenue by Industry New Equipment
Sales by Industry
Forestry
4%
Other
5%
Petroleum
11%
Revenue
by Line of Business
New
Equipment
44% Product
Support
43%
Used
Equipment
5%
Rental
8%
Other includes government and industrial Product support for petroleum and forestry
is allocated among above key industries
YTD ending September 30, 2012
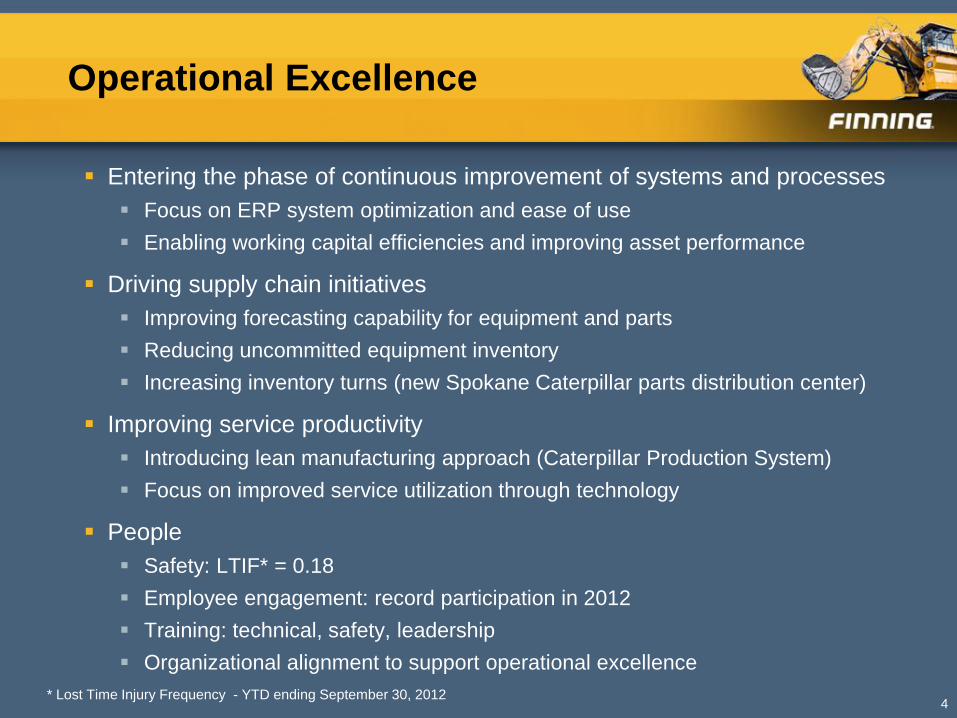
Operational Excellence
Entering the phase of continuous improvement of systems and processes
Focus on ERP system optimization and ease of use
Enabling working capital efficiencies and improving asset performance
Driving supply chain initiatives
Improving forecasting capability for equipment and parts
Reducing uncommitted equipment inventory
Increasing inventory turns (new Spokane Caterpillar parts distribution center)
Improving service productivity
Introducing lean manufacturing approach (Caterpillar Production System)
Focus on improved service utilization through technology
People
Safety: LTIF* = 0.18
Employee engagement: record participation in 2012
Training: technical, safety, leadership
Organizational alignment to support operational excellence
4 * Lost Time Injury Frequency - YTD ending September 30, 2012
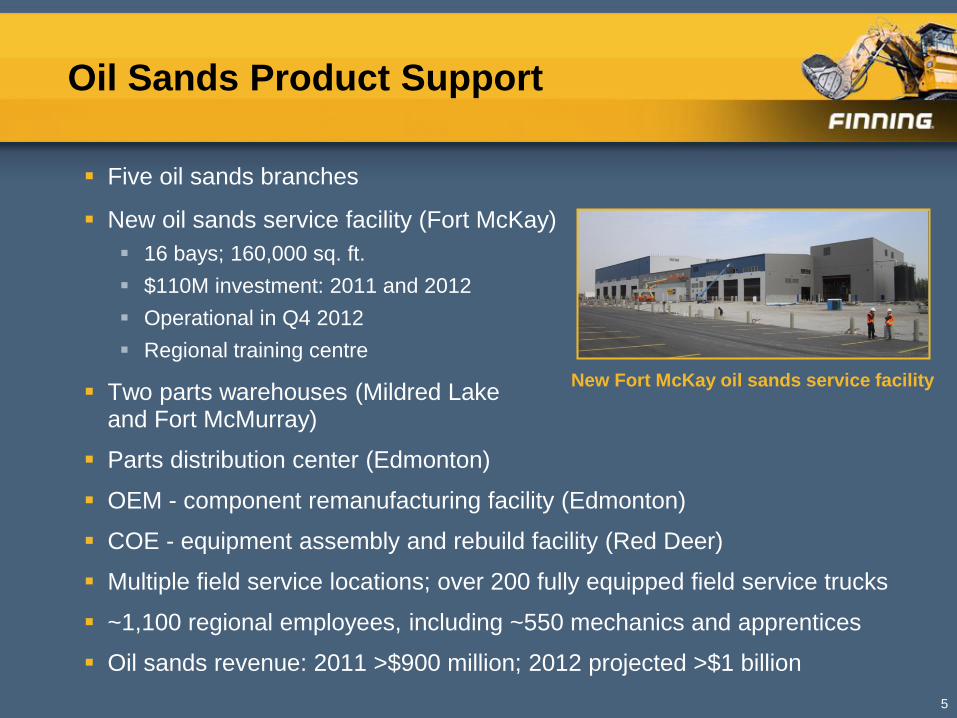
Oil Sands Product Support
Five oil sands branches
New oil sands service facility (Fort McKay)
16 bays; 160,000 sq. ft.
$110M investment: 2011 and 2012
Operational in Q4 2012
Regional training centre
Two parts warehouses (Mildred Lake and Fort McMurray)
Parts distribution center (Edmonton)
OEM - component remanufacturing facility (Edmonton)
COE - equipment assembly and rebuild facility (Red Deer)
Multiple field service locations; over 200 fully equipped field service trucks
~1,100 regional employees, including ~550 mechanics and apprentices
Oil sands revenue: 2011 >$900 million; 2012 projected >$1 billion
5
New Fort McKay oil sands service facility
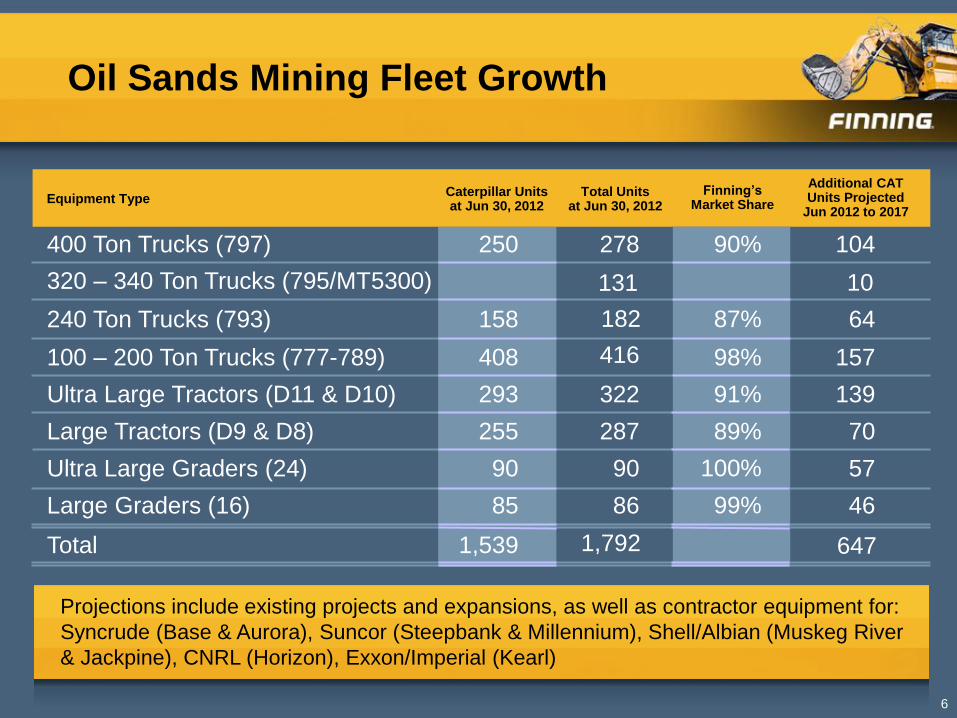
Oil Sands Mining Fleet Growth
6
99%
100%
89%
91%
98%
87%
90%
1,539
85
90
255
293
408
158
250
320 – 340 Ton Trucks (795/MT5300)
Total
Large Graders (16)
Ultra Large Graders (24)
Large Tractors (D9 & D8)
Ultra Large Tractors (D11 & D10)
100 – 200 Ton Trucks (777-789)
240 Ton Trucks (793)
400 Ton Trucks (797)
46
57
70
139
157
64
104
86
90
287
322
416
278
Finning’s Market Share
Caterpillar Units at Jun 30, 2012
Equipment Type Total Units
at Jun 30, 2012
Additional CAT Units Projected
Jun 2012 to 2017
647
131
182
1,792
Projections include existing projects and expansions, as well as contractor equipment for:
Syncrude (Base & Aurora), Suncor (Steepbank & Millennium), Shell/Albian (Muskeg River
& Jackpine), CNRL (Horizon), Exxon/Imperial (Kearl)
10
Construction and Power Systems
Heavy construction
Continued investment in infrastructure
Alberta – ring roads, airports, LRT in Calgary and Edmonton
British Columbia – Evergreen Line Rapid Transit, Coquitlam to Vancouver; Interior to Lower Mainland (ILM) Transmission Project, Nicola to Coquitlam
Numerous pipeline projects in Western Canada through 2020
Forestry
US housing starts improving
Diversified markets
Power systems
Petroleum / oil & gas
Slower activity due to lower well fracturing and servicing
EPG and rental power
Solid demand, particularly in mining
Strong customer value proposition with integrated product offering
7
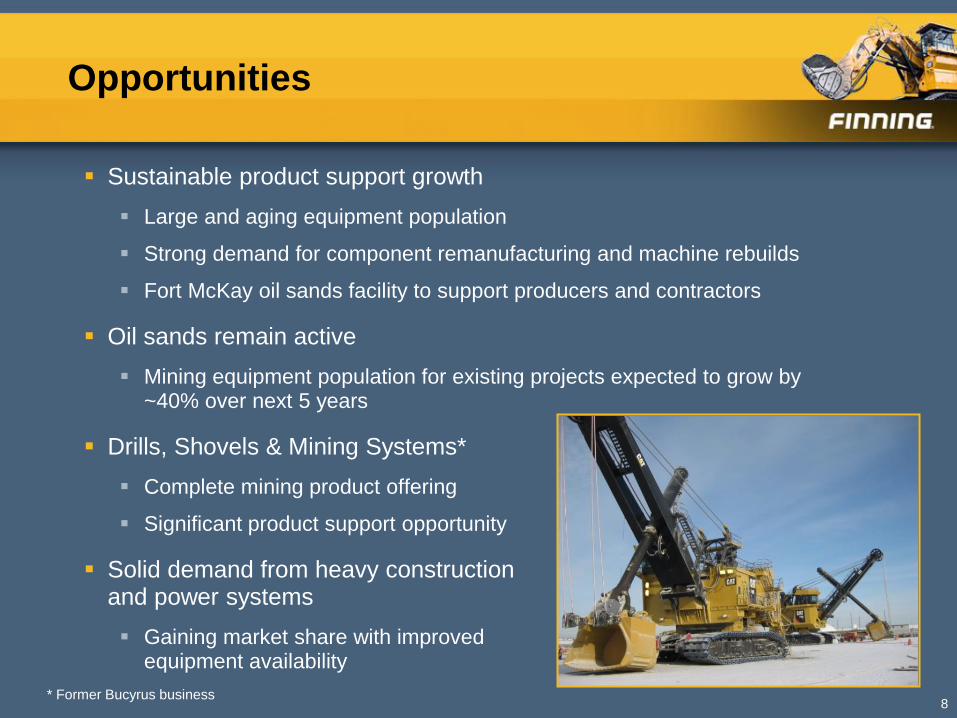
Opportunities
Sustainable product support growth
Large and aging equipment population
Strong demand for component remanufacturing and machine rebuilds
Fort McKay oil sands facility to support producers and contractors
Oil sands remain active
Mining equipment population for existing projects expected to grow by ~40% over next 5 years
Drills, Shovels & Mining Systems*
Complete mining product offering
Significant product support opportunity
Solid demand from heavy construction and power systems
Gaining market share with improved equipment availability
8 * Former Bucyrus business
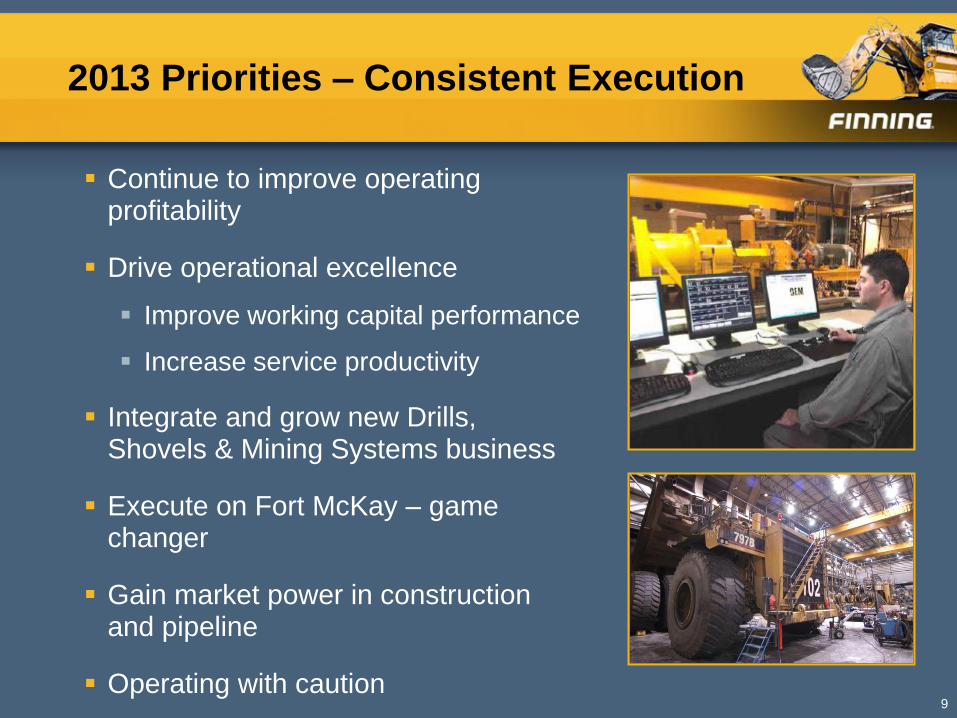
2013 Priorities – Consistent Execution
Continue to improve operating profitability
Drive operational excellence
Improve working capital performance
Increase service productivity
Integrate and grow new Drills, Shovels & Mining Systems business
Execute on Fort McKay – game changer
Gain market power in construction and pipeline
Operating with caution 9
Market Outlook
Expect stable oil sands activity
Robust product support business, including component remanufacturing and machine overhaul
Producers taking more balanced view on capital projects and expansions
Other mining
Solid demand from copper and thermal coal
Metallurgical coal customers remain cautious
Favourable outlook for heavy construction in BC and Alberta
Significant infrastructure projects underway
Mining and energy related construction projects, including pipelines
Oil & gas and forestry activity expected to be similar to 2012 10
Summary
Key markets remain constructive
Capturing revenue opportunities in slow growth environment
Monitoring customer activity closely
Managing business with more conservatism
Leveraging investments to deliver customer value
Growing parts and service business for Drills, Shovels & Mining Systems
Developing and training people
Focus on rigorous and consistent execution
Driving operational excellence
Improving EBIT margin performance
11
December 13, 2012
Investor Day
Marcello Marchese, President, Finning South America
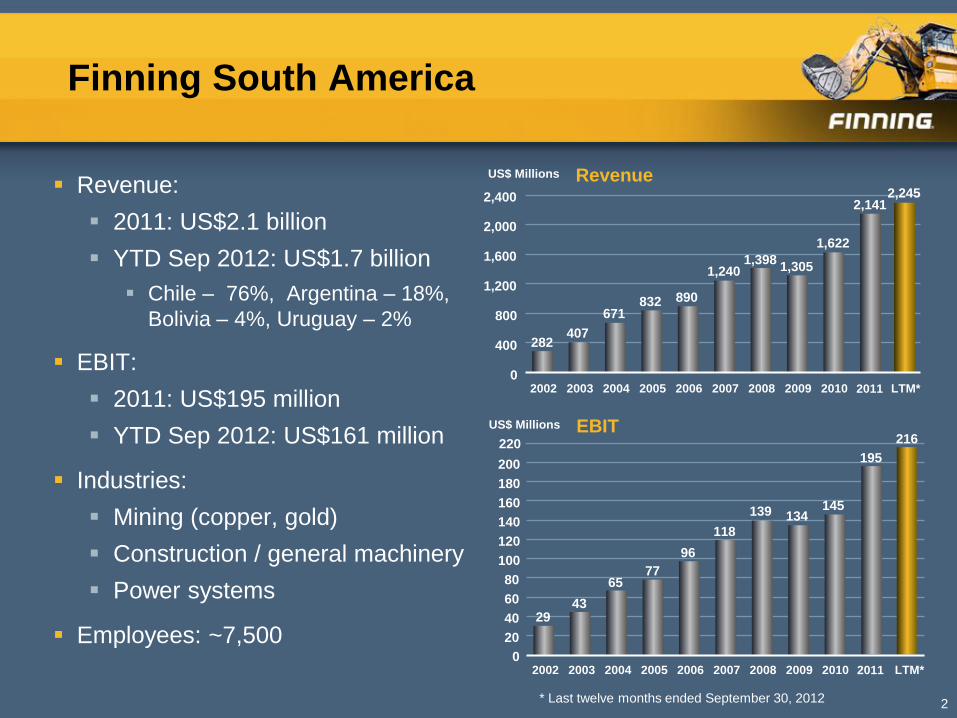
Finning South America
Revenue:
2011: US$2.1 billion
YTD Sep 2012: US$1.7 billion
Chile – 76%, Argentina – 18%,
Bolivia – 4%, Uruguay – 2%
EBIT:
2011: US$195 million
YTD Sep 2012: US$161 million
Industries:
Mining (copper, gold)
Construction / general machinery
Power systems
Employees: ~7,500
2
Revenue
EBIT
282 407
671 832 890
1,240 1,398
1,305
1,622
2,141
0
400
800
1,200
1,600
2,000
2,400
2002 2003 2004 2005 2006 2007 2008 2009 2010 LTM* 2011
2,245
29 43
65 77
96
118
139 134 145
195
0
20
40
60
80
100
120
140
160
180
200
2002 2003 2004 2005 2006 2007 2008 2009 2010 LTM* 2011
216 220
* Last twelve months ended September 30, 2012
US$ Millions
US$ Millions

FINSA Revenue Profile
3
Mining
39%
Power
Systems
13%
Construction
45%
Mining
81%
Power Systems
6% Construction
13%
Product Support
Revenue by Industry New Equipment
Sales by Industry
Other
3%
Revenue
by Line of Business
New
Equipment
44% Product
Support
51%
Used
Equipment
2%
Rental
3%
Other incudes forestry, industrial,
government
YTD ending September 30, 2012
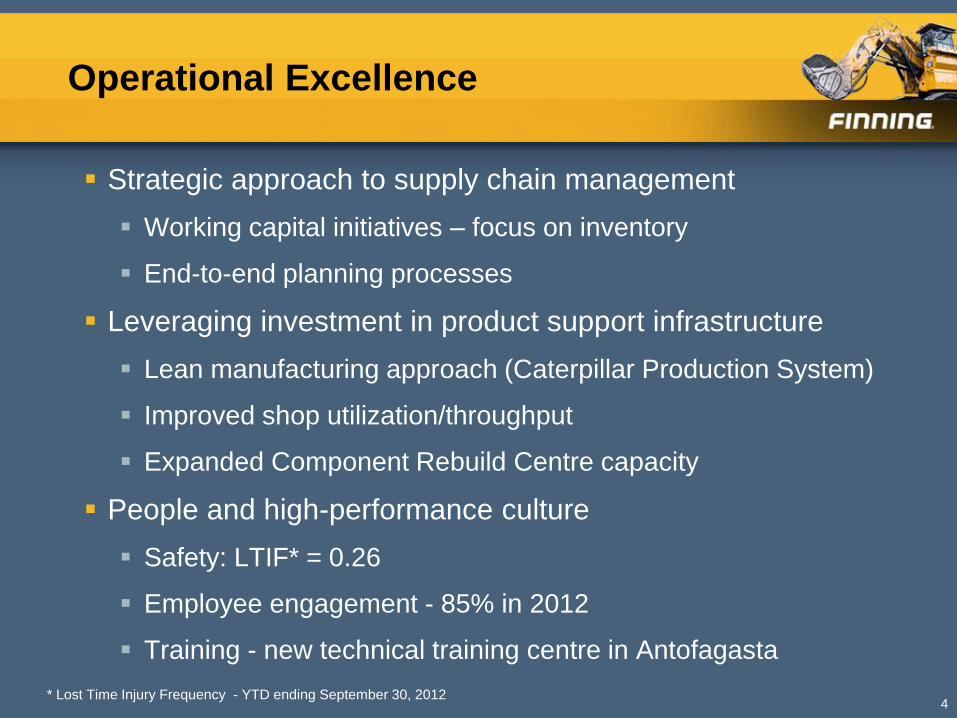
Operational Excellence
Strategic approach to supply chain management
Working capital initiatives – focus on inventory
End-to-end planning processes
Leveraging investment in product support infrastructure
Lean manufacturing approach (Caterpillar Production System)
Improved shop utilization/throughput
Expanded Component Rebuild Centre capacity
People and high-performance culture
Safety: LTIF* = 0.26
Employee engagement - 85% in 2012
Training - new technical training centre in Antofagasta
4 * Lost Time Injury Frequency - YTD ending September 30, 2012
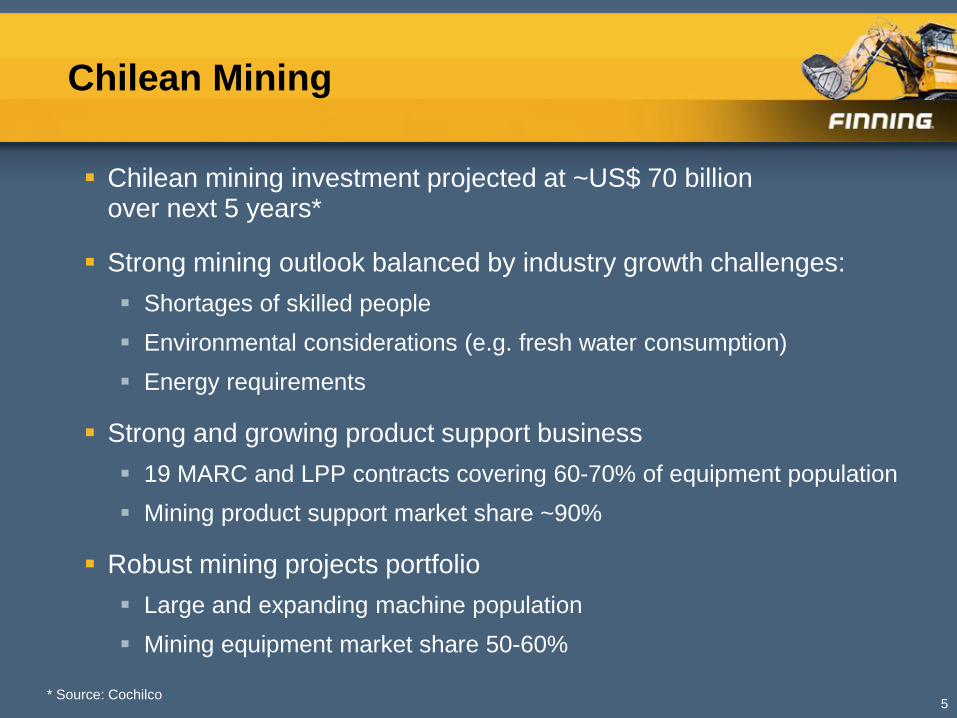
Chilean Mining
Chilean mining investment projected at ~US$ 70 billion over next 5 years*
Strong mining outlook balanced by industry growth challenges:
Shortages of skilled people
Environmental considerations (e.g. fresh water consumption)
Energy requirements
Strong and growing product support business
19 MARC and LPP contracts covering 60-70% of equipment population
Mining product support market share ~90%
Robust mining projects portfolio
Large and expanding machine population
Mining equipment market share 50-60%
5 * Source: Cochilco
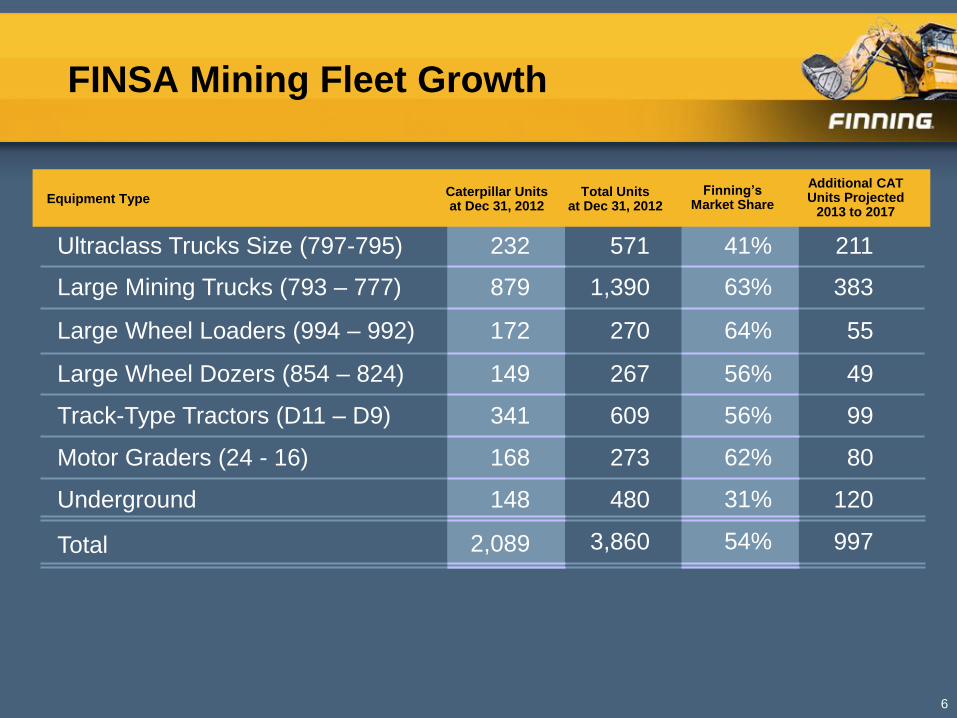
FINSA Mining Fleet Growth
54%
31%
62%
56%
56%
64%
63%
41%
879
149
172
232
Large Mining Trucks (793 – 777)
Total
Underground
Motor Graders (24 - 16)
Track-Type Tractors (D11 – D9)
Large Wheel Dozers (854 – 824)
Large Wheel Loaders (994 – 992)
Ultraclass Trucks Size (797-795)
383
997
120
80
99
49
55
211
1,390
3,860
480
273
609
267
270
571
6
Finning’s Market Share
Caterpillar Units at Dec 31, 2012
Equipment Type Total Units
at Dec 31, 2012
Additional CAT Units Projected
2013 to 2017
2,089
148
168
341
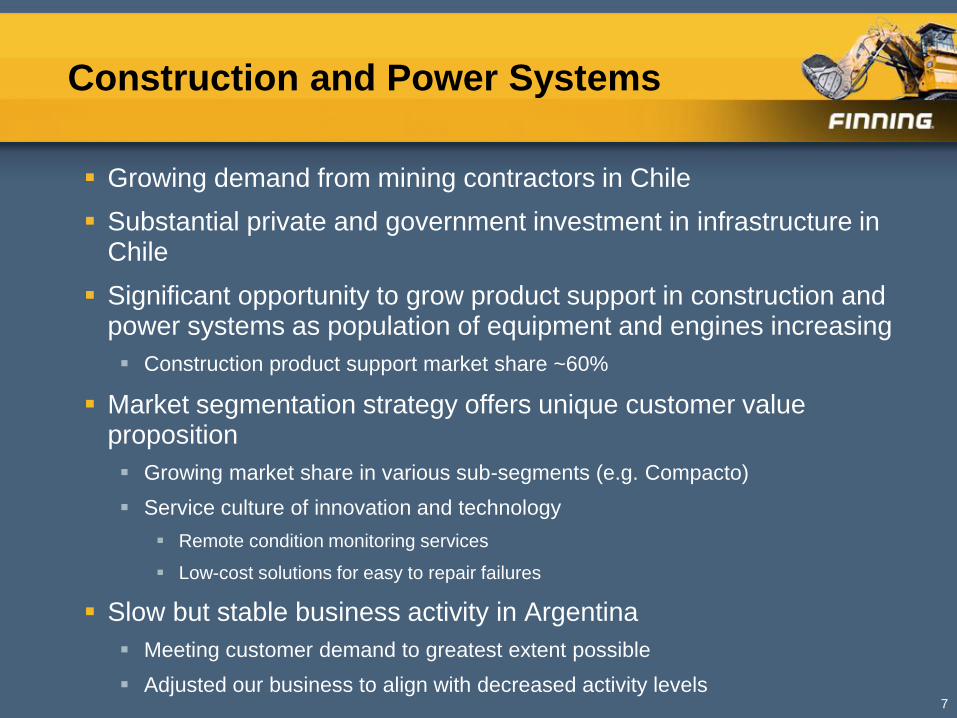
Construction and Power Systems
Growing demand from mining contractors in Chile
Substantial private and government investment in infrastructure in Chile
Significant opportunity to grow product support in construction and power systems as population of equipment and engines increasing
Construction product support market share ~60%
Market segmentation strategy offers unique customer value proposition
Growing market share in various sub-segments (e.g. Compacto)
Service culture of innovation and technology
Remote condition monitoring services
Low-cost solutions for easy to repair failures
Slow but stable business activity in Argentina
Meeting customer demand to greatest extent possible
Adjusted our business to align with decreased activity levels
7
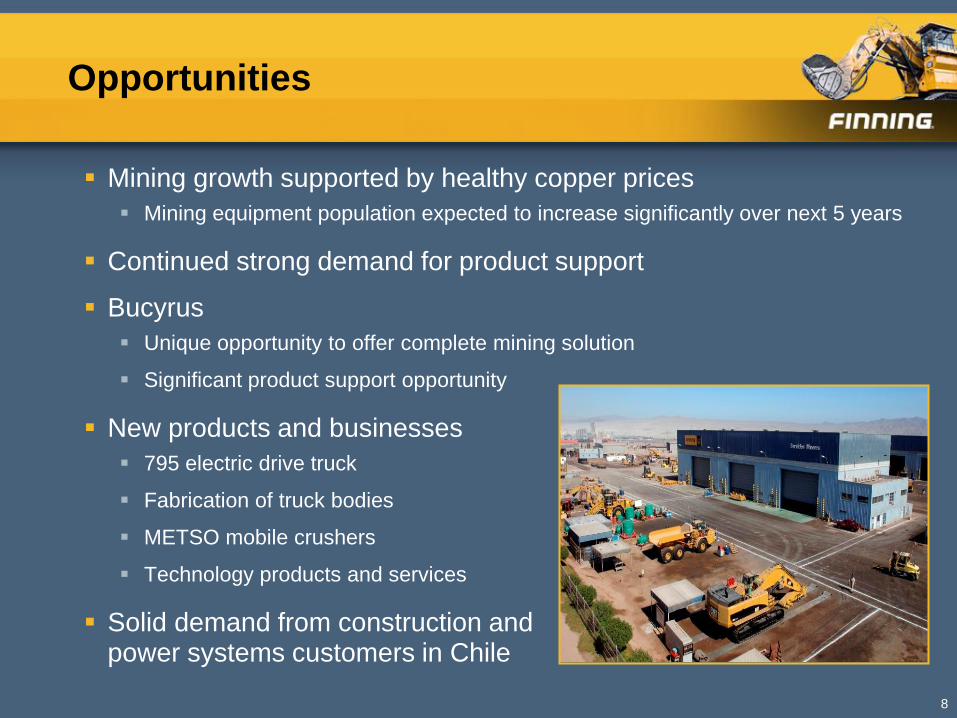
Opportunities
Mining growth supported by healthy copper prices
Mining equipment population expected to increase significantly over next 5 years
Continued strong demand for product support
Bucyrus
Unique opportunity to offer complete mining solution
Significant product support opportunity
New products and businesses
795 electric drive truck
Fabrication of truck bodies
METSO mobile crushers
Technology products and services
Solid demand from construction and power systems customers in Chile
8
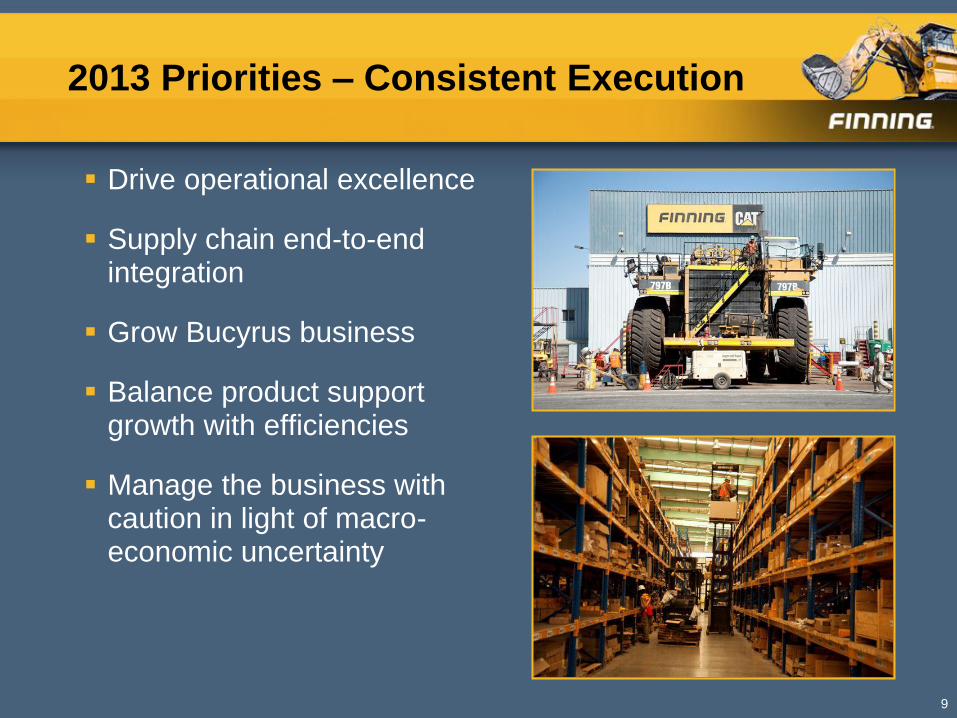
2013 Priorities – Consistent Execution
Drive operational excellence
Supply chain end-to-end integration
Grow Bucyrus business
Balance product support growth with efficiencies
Manage the business with caution in light of macro-economic uncertainty
9
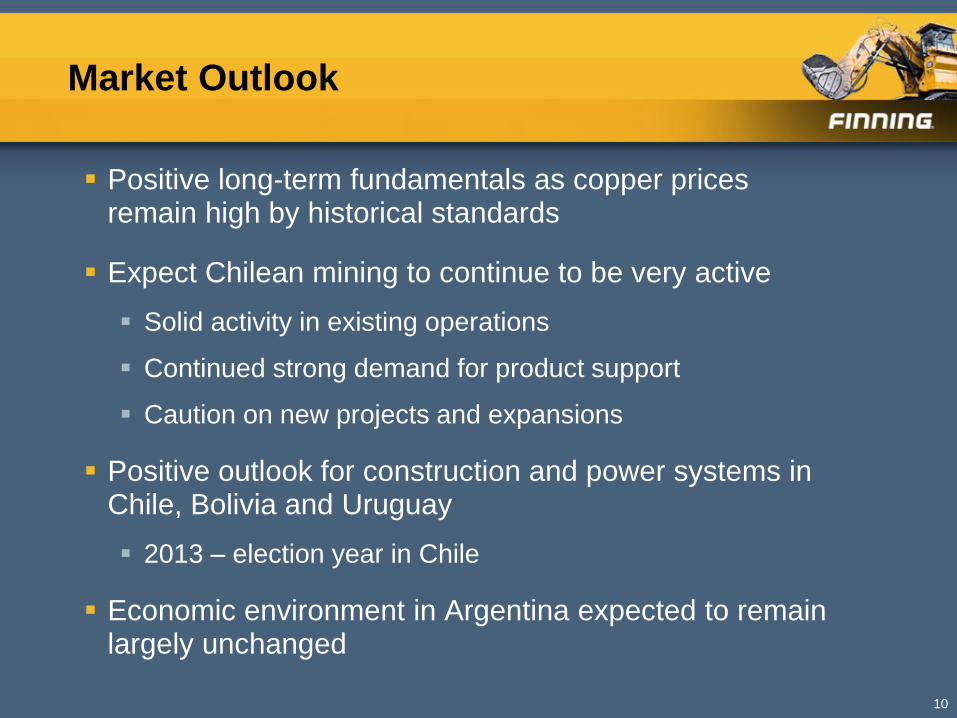
Market Outlook
Positive long-term fundamentals as copper prices remain high by historical standards
Expect Chilean mining to continue to be very active
Solid activity in existing operations
Continued strong demand for product support
Caution on new projects and expansions
Positive outlook for construction and power systems in Chile, Bolivia and Uruguay
2013 – election year in Chile
Economic environment in Argentina expected to remain largely unchanged
10
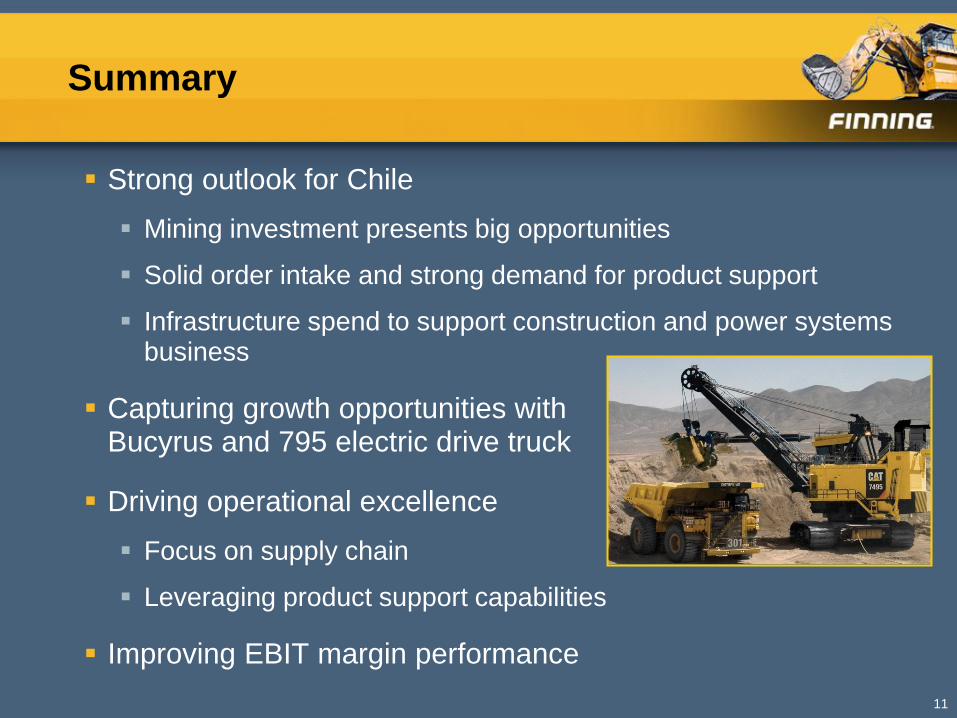
Summary
Strong outlook for Chile
Mining investment presents big opportunities
Solid order intake and strong demand for product support
Infrastructure spend to support construction and power systems business
Capturing growth opportunities with Bucyrus and 795 electric drive truck
Driving operational excellence
Focus on supply chain
Leveraging product support capabilities
Improving EBIT margin performance
11

December 13, 2012
Investor Day
Neil Dickinson, Managing Director, Finning UK & Ireland
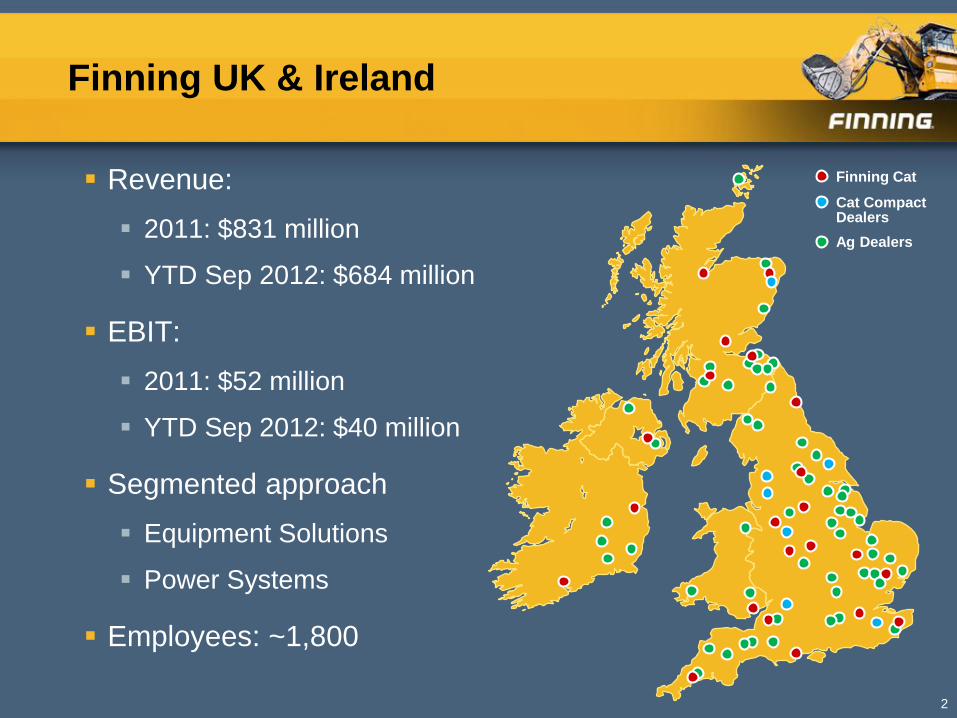
Finning UK & Ireland
Revenue:
2011: $831 million
YTD Sep 2012: $684 million
EBIT:
2011: $52 million
YTD Sep 2012: $40 million
Segmented approach
Equipment Solutions
Power Systems
Employees: ~1,800
2
Finning Cat
Cat Compact Dealers
Ag Dealers
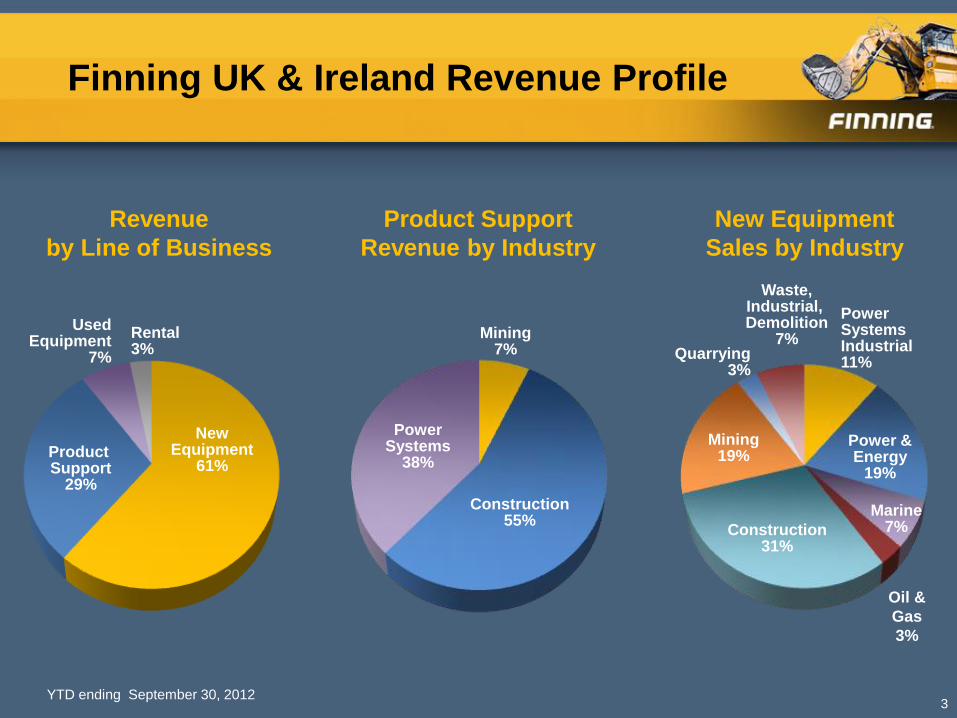
Finning UK & Ireland Revenue Profile
3
Power Systems
38%
Construction 55%
Product Support
Revenue by Industry
New Equipment
Sales by Industry
Mining 7%
Revenue
by Line of Business
New Equipment
61% Product Support
29%
Used Equipment
7%
Rental 3%
Power Systems Industrial 11%
Power & Energy
19%
Marine 7%
Oil &
Gas
3%
Construction 31%
Mining 19%
Quarrying 3%
Waste, Industrial, Demolition
7%
YTD ending September 30, 2012
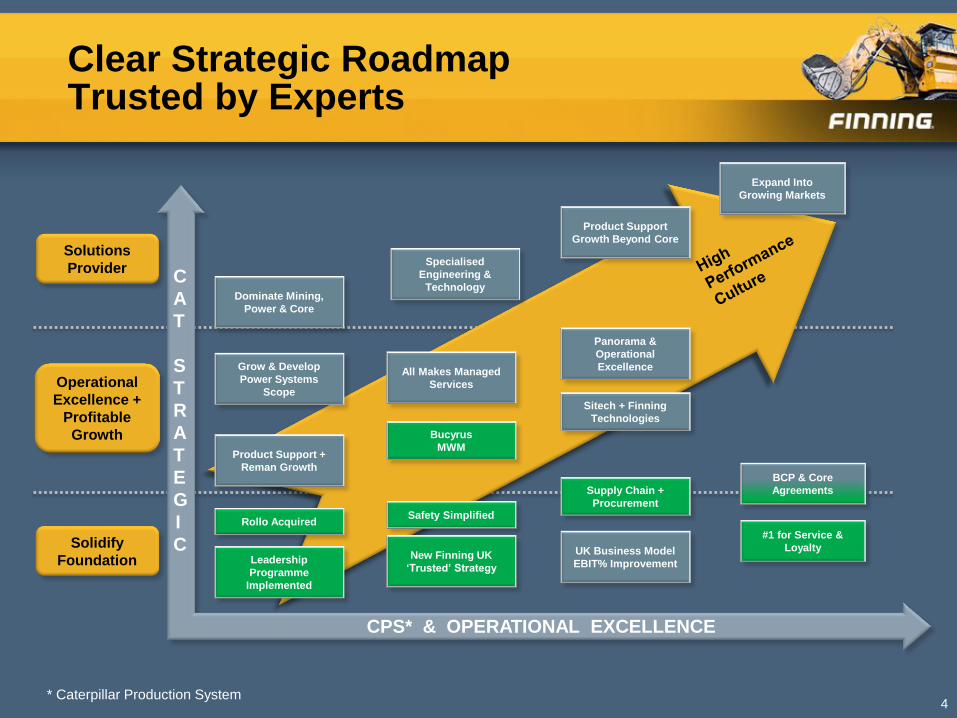
Clear Strategic Roadmap Trusted by Experts
4
Solutions
Provider
Operational
Excellence +
Profitable
Growth
Solidify
Foundation
Specialised
Engineering &
Technology Dominate Mining,
Power & Core
Product Support
Growth Beyond Core
Expand Into
Growing Markets
Sitech + Finning
Technologies
Grow & Develop
Power Systems
Scope
Product Support +
Reman Growth
Supply Chain +
Procurement
Bucyrus
MWM
Leadership
Programme
Implemented
Rollo Acquired
Panorama &
Operational
Excellence
Safety Simplified
New Finning UK
‘Trusted’ Strategy
UK Business Model
EBIT% Improvement
All Makes Managed
Services
BCP & Core
Agreements
#1 for Service &
Loyalty
C
A
T
S
T
R
A
T
E
G
I
C
CPS* & OPERATIONAL EXCELLENCE
* Caterpillar Production System
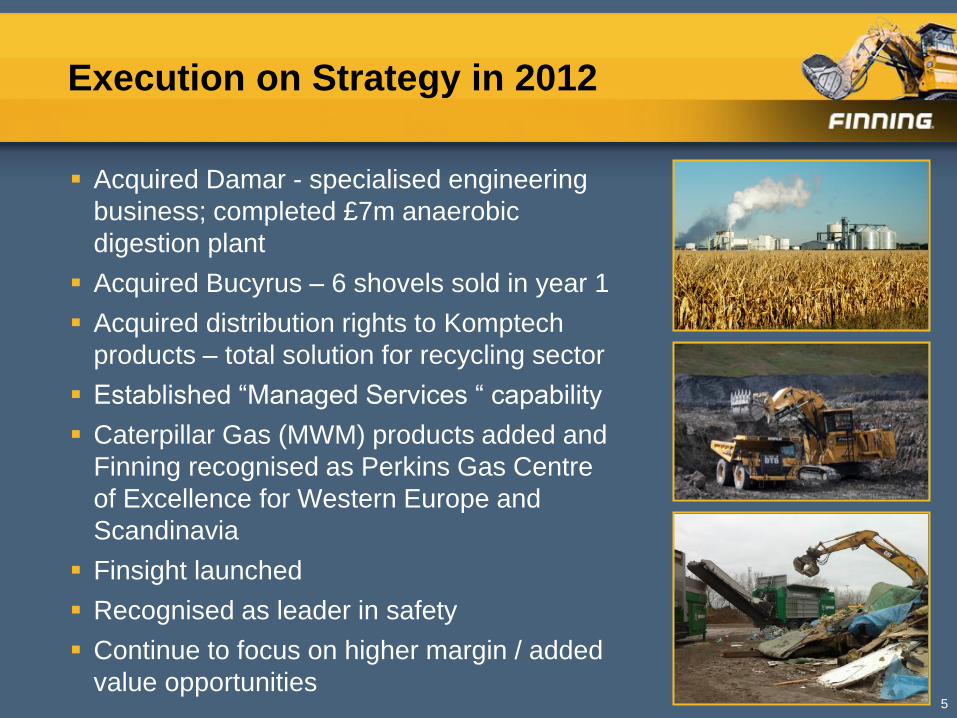
Execution on Strategy in 2012
Acquired Damar - specialised engineering
business; completed £7m anaerobic
digestion plant
Acquired Bucyrus – 6 shovels sold in year 1
Acquired distribution rights to Komptech
products – total solution for recycling sector
Established “Managed Services “ capability
Caterpillar Gas (MWM) products added and
Finning recognised as Perkins Gas Centre
of Excellence for Western Europe and
Scandinavia
Finsight launched
Recognised as leader in safety
Continue to focus on higher margin / added
value opportunities
5
Operational Excellence Strategic Focus
Driving supply chain initiatives
Outsourced national distribution centre
Revised ordering processes - Lane 1
Focused on EBIT margin improvement
Focus on SG&A
Review procurement contracts
Defined benefit pension plan closed
Headcount rationalisation
Utility costs
Caterpillar Production System (CPS) – eliminating waste
6
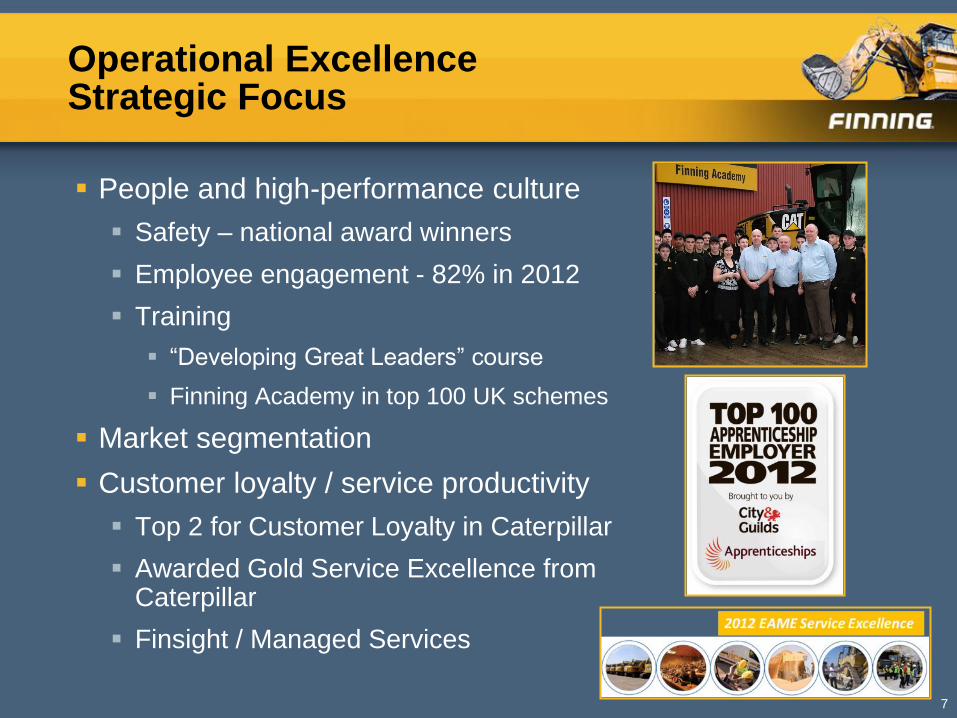
Operational Excellence Strategic Focus
People and high-performance culture
Safety – national award winners
Employee engagement - 82% in 2012
Training
“Developing Great Leaders” course
Finning Academy in top 100 UK schemes
Market segmentation
Customer loyalty / service productivity
Top 2 for Customer Loyalty in Caterpillar
Awarded Gold Service Excellence from Caterpillar
Finsight / Managed Services
7
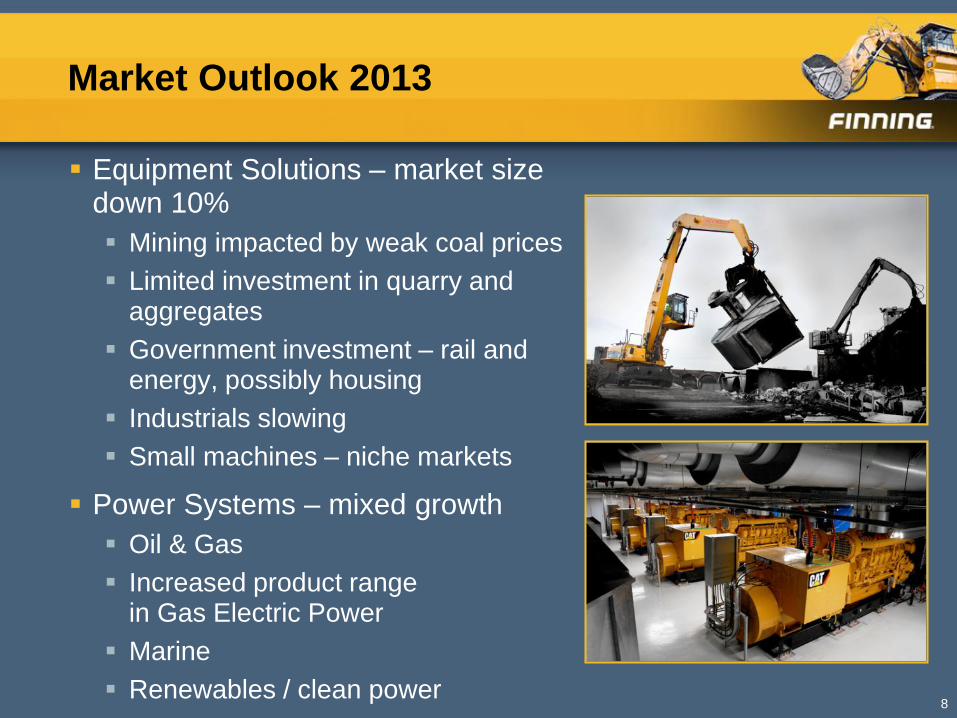
Market Outlook 2013
Equipment Solutions – market size down 10%
Mining impacted by weak coal prices
Limited investment in quarry and aggregates
Government investment – rail and energy, possibly housing
Industrials slowing
Small machines – niche markets
Power Systems – mixed growth
Oil & Gas
Increased product range in Gas Electric Power
Marine
Renewables / clean power
8
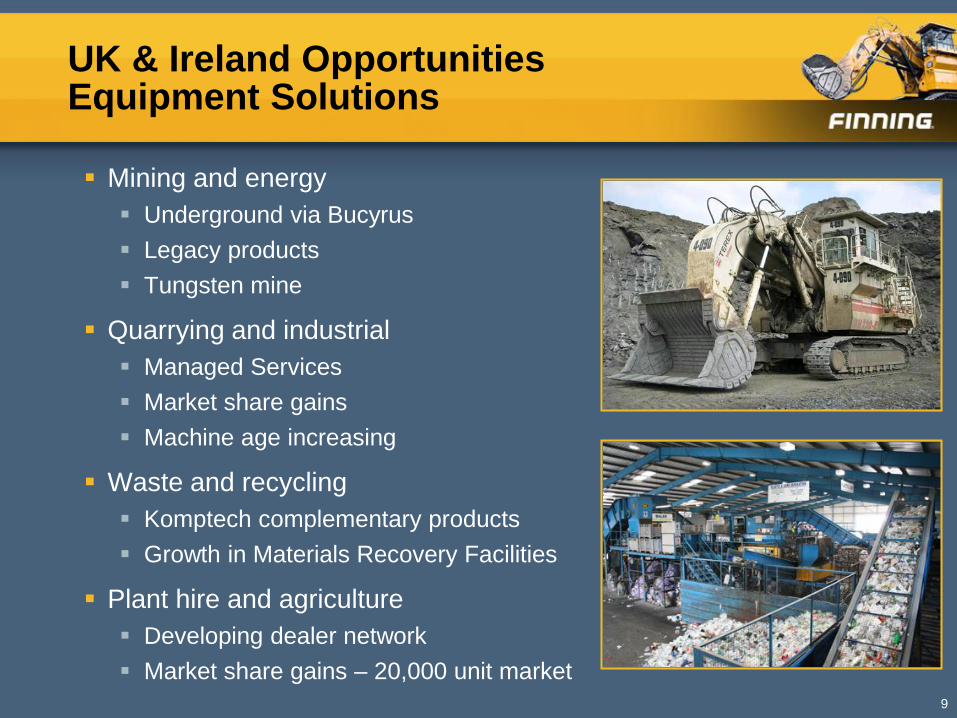
UK & Ireland Opportunities Equipment Solutions
Mining and energy
Underground via Bucyrus
Legacy products
Tungsten mine
Quarrying and industrial
Managed Services
Market share gains
Machine age increasing
Waste and recycling
Komptech complementary products
Growth in Materials Recovery Facilities
Plant hire and agriculture
Developing dealer network
Market share gains – 20,000 unit market
9
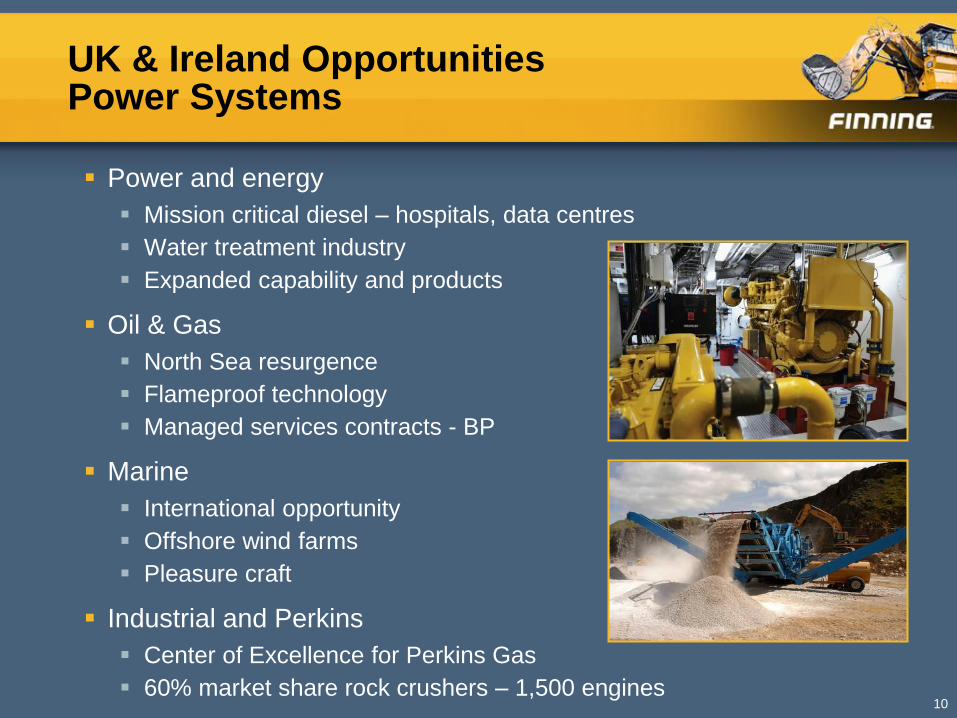
UK & Ireland Opportunities Power Systems
Power and energy
Mission critical diesel – hospitals, data centres
Water treatment industry
Expanded capability and products
Oil & Gas
North Sea resurgence
Flameproof technology
Managed services contracts - BP
Marine
International opportunity
Offshore wind farms
Pleasure craft
Industrial and Perkins
Center of Excellence for Perkins Gas
60% market share rock crushers – 1,500 engines 10
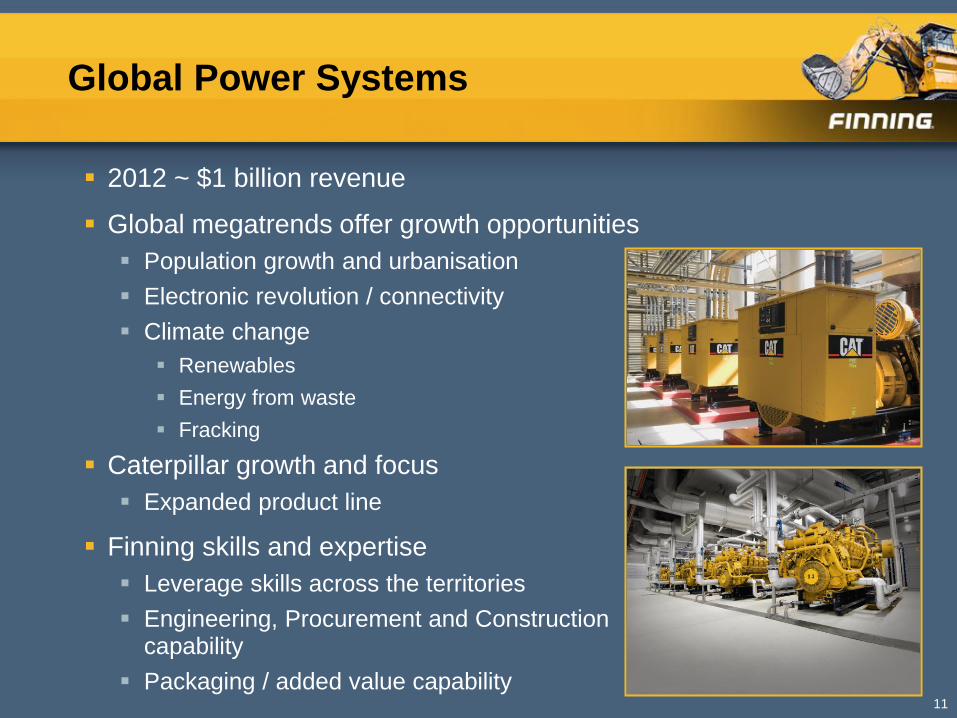
Global Power Systems
2012 ~ $1 billion revenue
Global megatrends offer growth opportunities
Population growth and urbanisation
Electronic revolution / connectivity
Climate change
Renewables
Energy from waste
Fracking
Caterpillar growth and focus
Expanded product line
Finning skills and expertise
Leverage skills across the territories
Engineering, Procurement and Construction capability
Packaging / added value capability 11
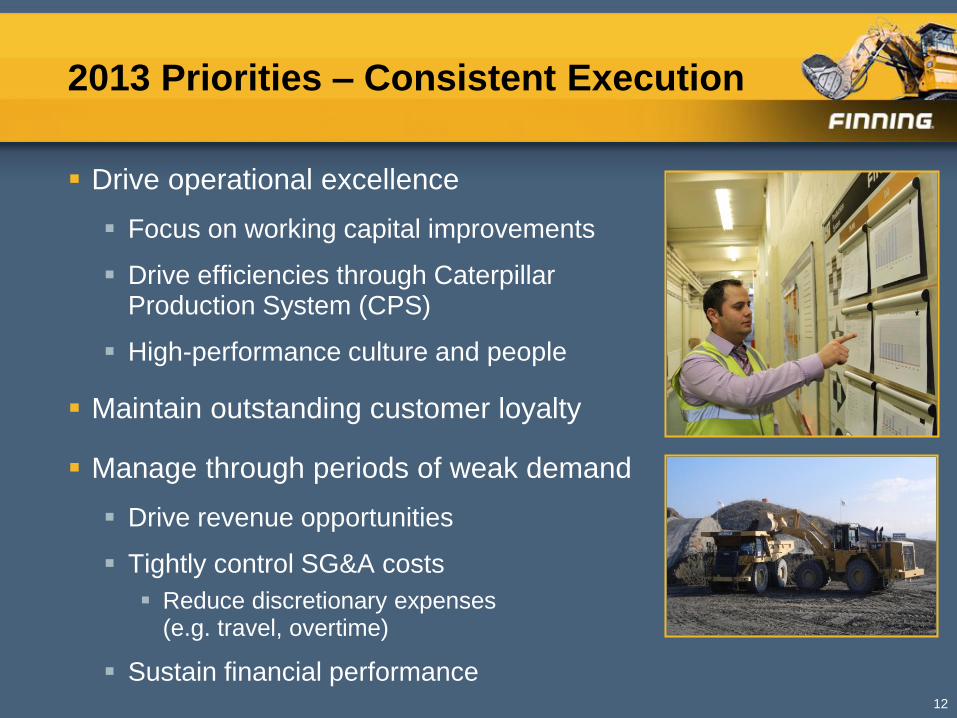
2013 Priorities – Consistent Execution
Drive operational excellence
Focus on working capital improvements
Drive efficiencies through Caterpillar Production System (CPS)
High-performance culture and people
Maintain outstanding customer loyalty
Manage through periods of weak demand
Drive revenue opportunities
Tightly control SG&A costs
Reduce discretionary expenses (e.g. travel, overtime)
Sustain financial performance 12
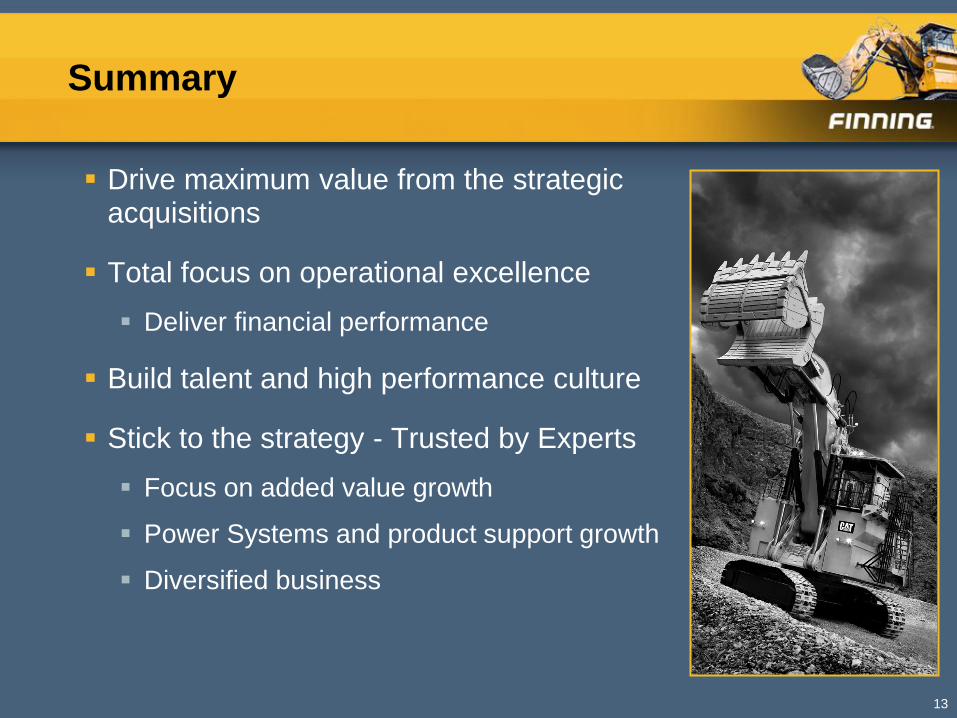
Summary
Drive maximum value from the strategic acquisitions
Total focus on operational excellence
Deliver financial performance
Build talent and high performance culture
Stick to the strategy - Trusted by Experts
Focus on added value growth
Power Systems and product support growth
Diversified business
13

December 13, 2012
Investor Day
Mike Waites, President and CEO
Summary
Business Conditions
Market conditions and customer confidence vary by region
Canada – stable activity levels; uncertain outlook
South America – positive long-term fundamentals; solid outlook
UK & Ireland – challenging economic landscape; some pockets of
strength
Operating with caution
Monitoring business activity closely
Taking prudent steps to manage business with more conservatism
Reducing uncommitted inventory
Carefully managing new orders
Controlling SG&A expenses
2
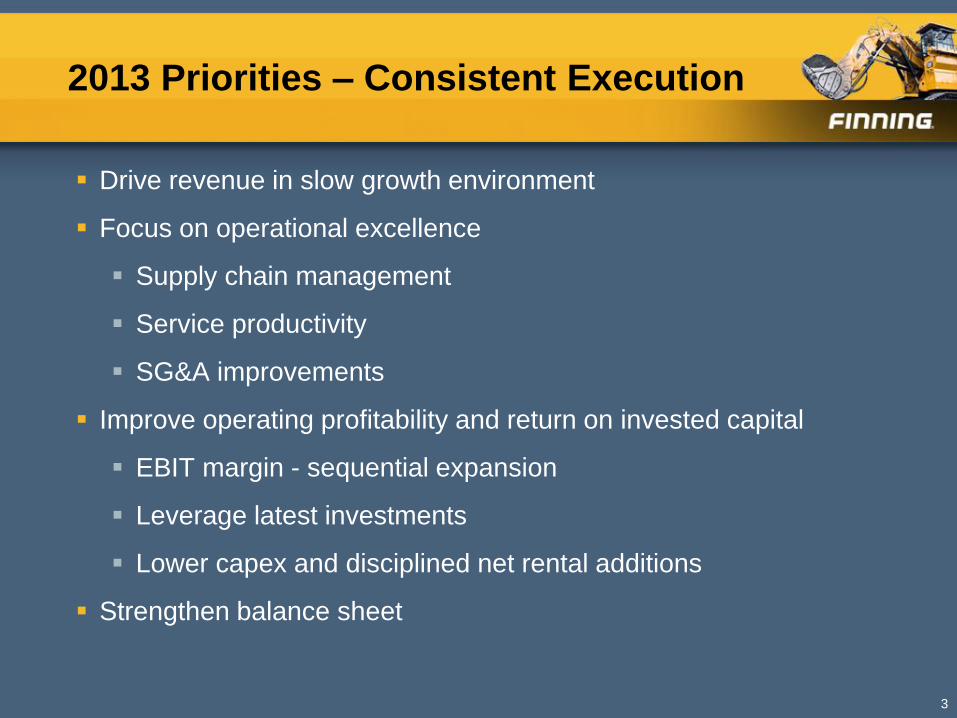
2013 Priorities – Consistent Execution
3
Drive revenue in slow growth environment
Focus on operational excellence
Supply chain management
Service productivity
SG&A improvements
Improve operating profitability and return on invested capital
EBIT margin - sequential expansion
Leverage latest investments
Lower capex and disciplined net rental additions
Strengthen balance sheet