Embed Size (px)
Citation preview
Investor Day
19 November 2019
ASX: QAN
US OTC: QABSY

Building on our sustainable competitive advantage
Qantas Investor Day 2019 | 3
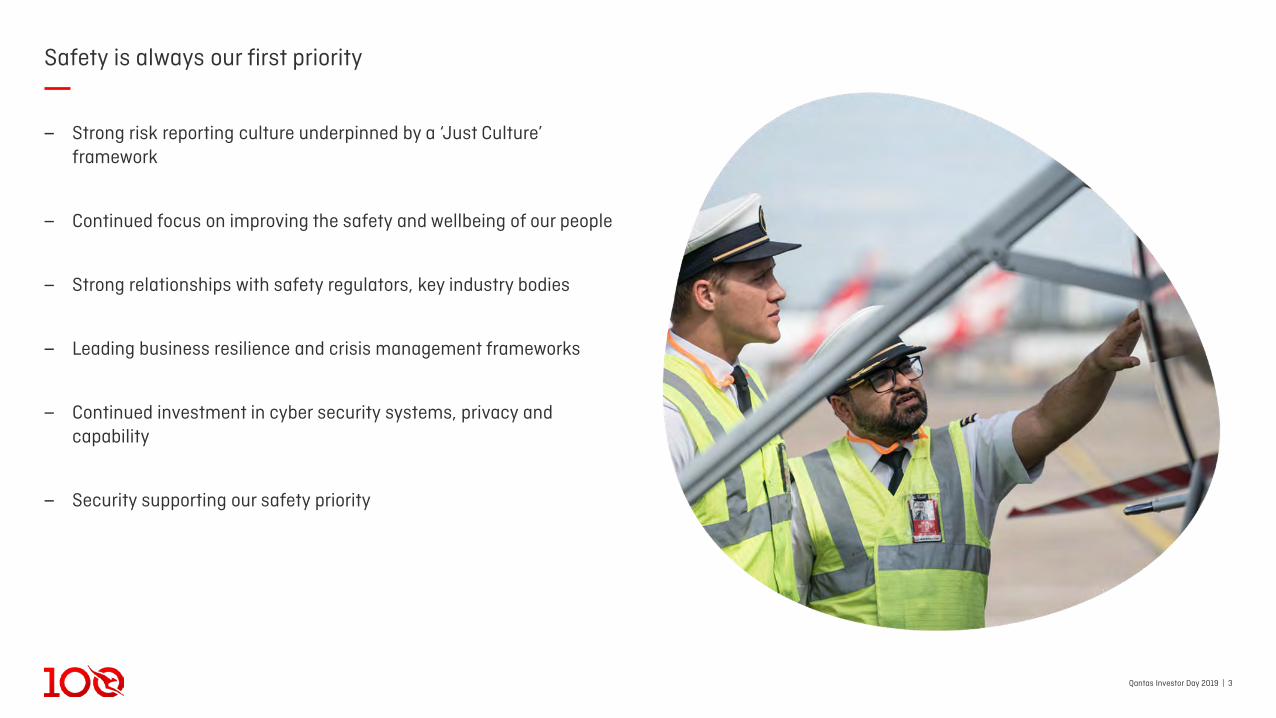
Safety is always our first priority
‒ Strong risk reporting culture underpinned by a ‘Just Culture’ framework
‒ Continued focus on improving the safety and wellbeing of our people
‒ Strong relationships with safety regulators, key industry bodies
‒ Leading business resilience and crisis management frameworks
‒ Continued investment in cyber security systems, privacy and capability
‒ Security supporting our safety priority
Qantas Investor Day 2019 | 41. IATA, ‘Industry Economic Performance Jun 2019. Net post tax profits in USD. 2. IATA, ‘IATA Forecast Predicts 8.2 billion Air Travelers in 2037’, 24 Oct 2018. Annual forecast growth refers to average annual growth.
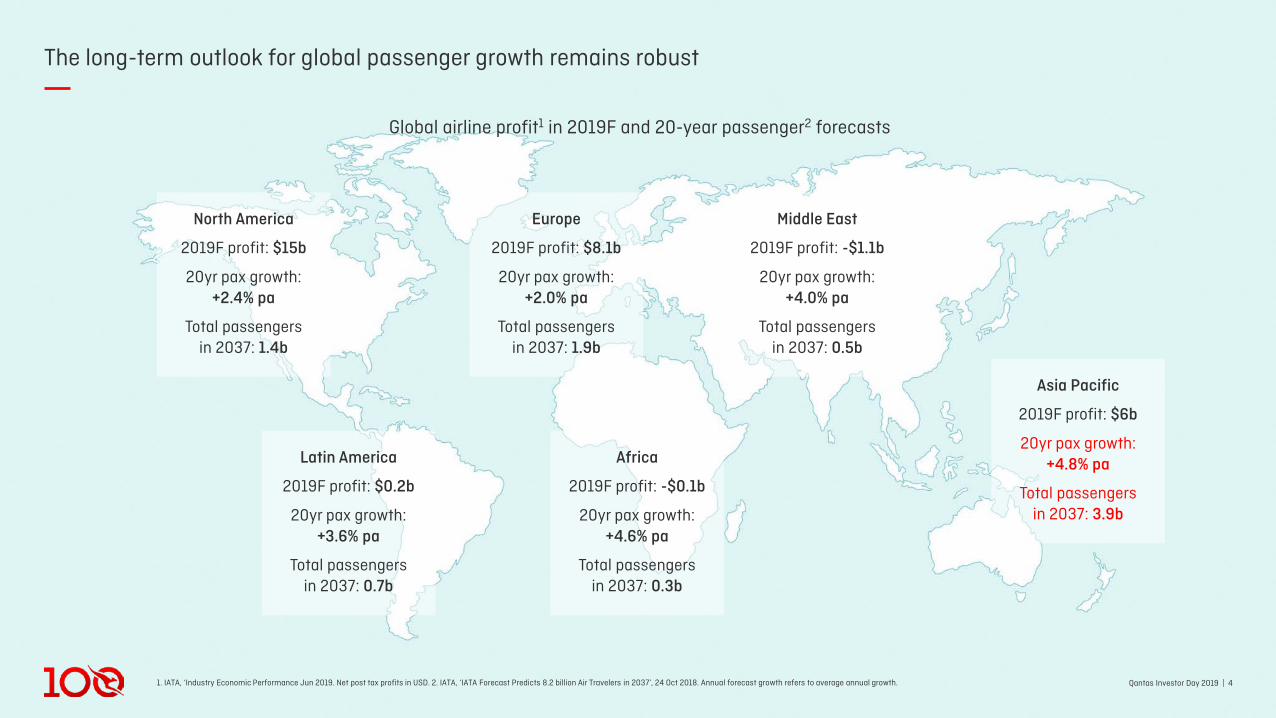
The long-term outlook for global passenger growth remains robust
Qantas Investor Day 2019 | 4
North America
2019F profit: $15b
20yr pax growth:+2.4% pa
Total passengers in 2037: 1.4b
Global airline profit1 in 2019F and 20-year passenger2 forecasts
Latin America
2019F profit: $0.2b
20yr pax growth:+3.6% pa
Total passengers in 2037: 0.7b
Europe
2019F profit: $8.1b
20yr pax growth:+2.0% pa
Total passengers in 2037: 1.9b
Africa
2019F profit: -$0.1b
20yr pax growth:+4.6% pa
Total passengers in 2037: 0.3b
Middle East
2019F profit: -$1.1b
20yr pax growth:+4.0% pa
Total passengers in 2037: 0.5b
Asia Pacific
2019F profit: $6b
20yr pax growth:+4.8% pa
Total passengers in 2037: 3.9b
Qantas Investor Day 2019 | 5
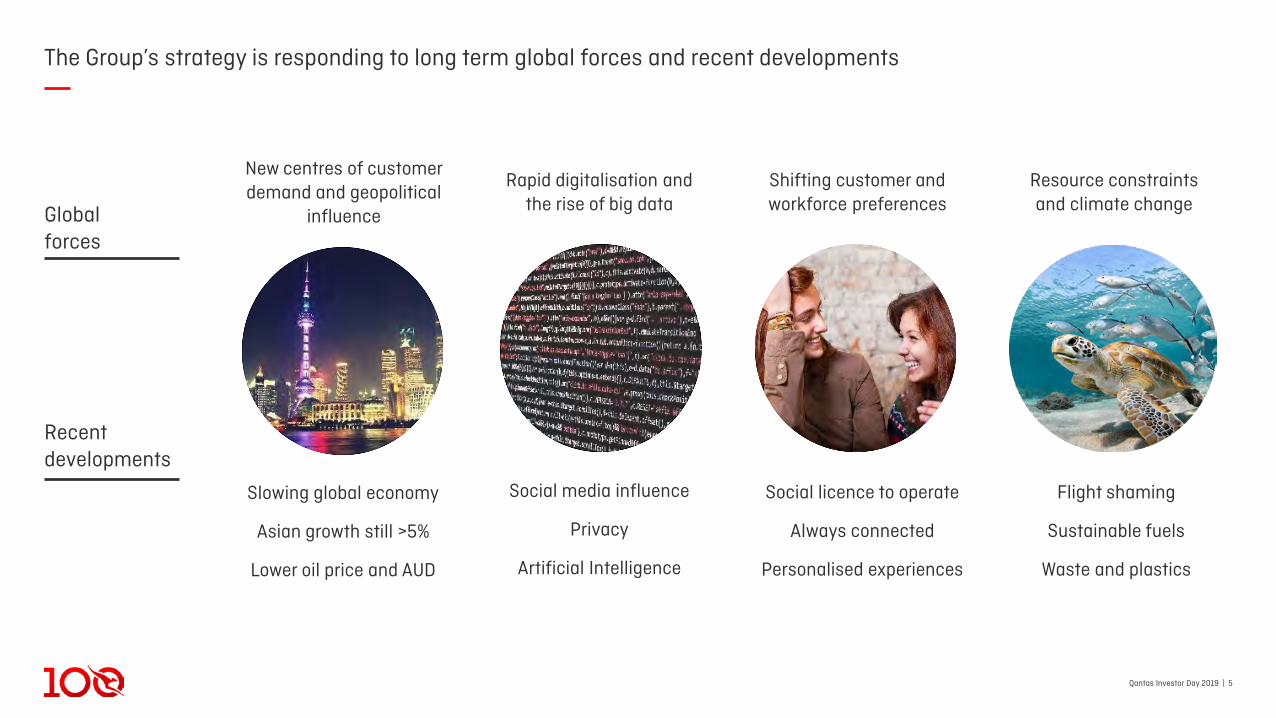
The Group’s strategy is responding to long term global forces and recent developments
Slowing global economy
Asian growth still >5%
Lower oil price and AUD
Rapid digitalisation and the rise of big data
Shifting customer and workforce preferences
Resource constraints and climate change
Social media influence
Privacy
Artificial Intelligence
Social licence to operate
Always connected
Personalised experiences
Flight shaming
Sustainable fuels
Waste and plastics
Globalforces
Recentdevelopments
New centres of customer demand and geopolitical
influence
Qantas Investor Day 2019 | 6
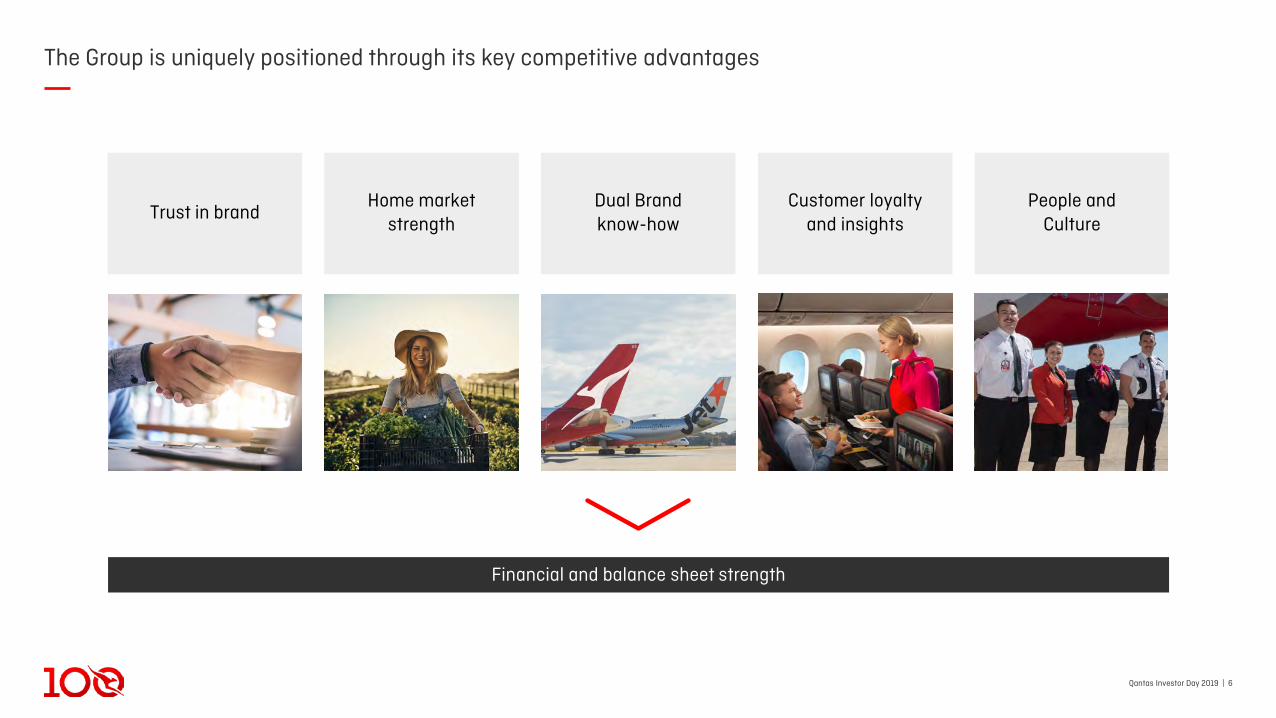
The Group is uniquely positioned through its key competitive advantages
Dual Brand know-how
Customer loyaltyand insights
Home market strength
Trust in brandPeople and
Culture
Financial and balance sheet strength
Qantas Investor Day 2019 | 7
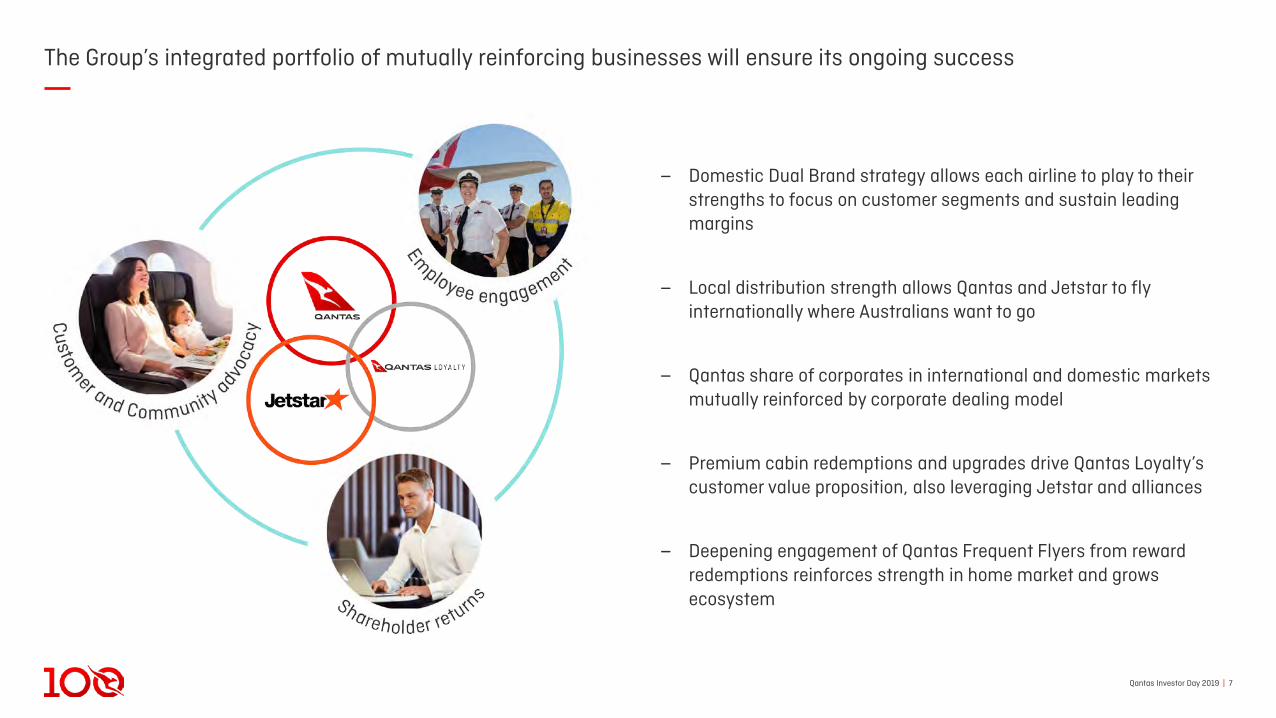
The Group’s integrated portfolio of mutually reinforcing businesses will ensure its ongoing success
‒ Domestic Dual Brand strategy allows each airline to play to their strengths to focus on customer segments and sustain leading margins
‒ Local distribution strength allows Qantas and Jetstar to fly internationally where Australians want to go
‒ Qantas share of corporates in international and domestic markets mutually reinforced by corporate dealing model
‒ Premium cabin redemptions and upgrades drive Qantas Loyalty’s customer value proposition, also leveraging Jetstar and alliances
‒ Deepening engagement of Qantas Frequent Flyers from reward redemptions reinforces strength in home market and grows ecosystem
Qantas Investor Day 2019 | 8
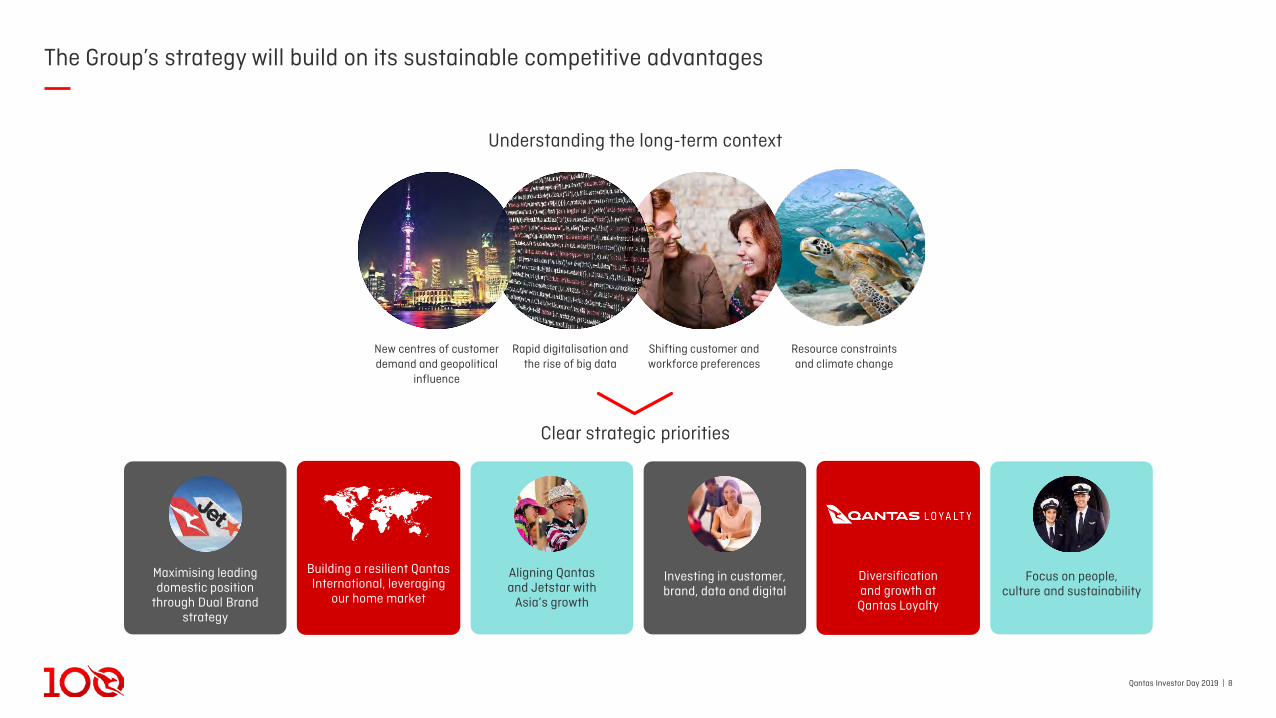
Focus on people,culture and sustainability
Diversification and growth at Qantas Loyalty
Investing in customer, brand, data and digital
Aligning Qantasand Jetstar with
Asia’s growth
Maximising leading domestic position
through Dual Brand strategy
The Group’s strategy will build on its sustainable competitive advantages
Building a resilient Qantas International, leveraging
our home market
Clear strategic priorities
Understanding the long-term context
New centres of customer demand and geopolitical
influence
Rapid digitalisation andthe rise of big data
Shifting customer and workforce preferences
Resource constraints and climate change

Qantas Investor Day 2019 | 9
Positioned to deliver higher domestic operating margins
‒ Sound market structure
‒ Stable operating environment and growing economy
‒ Each Group brand has a sustainable competitive advantage
‒ Sophisticated Dual Brand strategy magnifies advantages
‒ Flexibility in fleet, brand and operating platforms
‒ Focus on driving margin expansion particularly through cost reduction
Qantas Investor Day 2019 | 101. Project Sunrise remains subject to rigorous business case hurdles.
Building a resilient Qantas International
‒ Transforming into a fit and competitive business
‒ Home market distribution strength
‒ Playing to our strengths flying where premium customers want to go
‒ Leveraging partnerships to extend the network
‒ Already harnessing new fleet technology for further advantage
‒ Will be further transformed even before Sunrise1
Qantas Investor Day 2019 | 11
Playing to competitive advantages to align with Asia’s growth
‒ Both brands fly where Australians want to go
‒ Connectivity with own networks and partners
‒ Exporting low cost and Dual Brand know-how
‒ Leveraging local strengths for inbound market
‒ Strong position in Japan – world’s 4th largest airline market
‒ A321LR and A321XLR flexibility to open up new opportunities
Qantas Investor Day 2019 | 12
Investing to drive superior customer experiences
‒ Customers are always at the centre of our thinking
‒ The brands are a key source of competitive advantage
‒ Centenary program will drive further brand equity
‒ Continuing to invest in both physical and digital experiences
‒ Strengthening customer relationship via AI powered personalization
‒ Greater control over content through improved distribution model
‒ Heightened focus on disruption management, reward and recognition
Qantas Investor Day 2019 | 13
Diversification and growth of Qantas Loyalty earnings
‒ Qantas Loyalty is uniquely advantaged locally and globally
‒ Evolved from a frequent flyer program to a consumer loyalty ecosystem
‒ Business with a track record of growth, innovation and resilience
‒ Investing in member experience
‒ Deepening and expanding coalition program
‒ Launching and scaling new consumer direct businesses
‒ Driving to $500-600m EBIT in FY22
Qantas Investor Day 2019 | 14
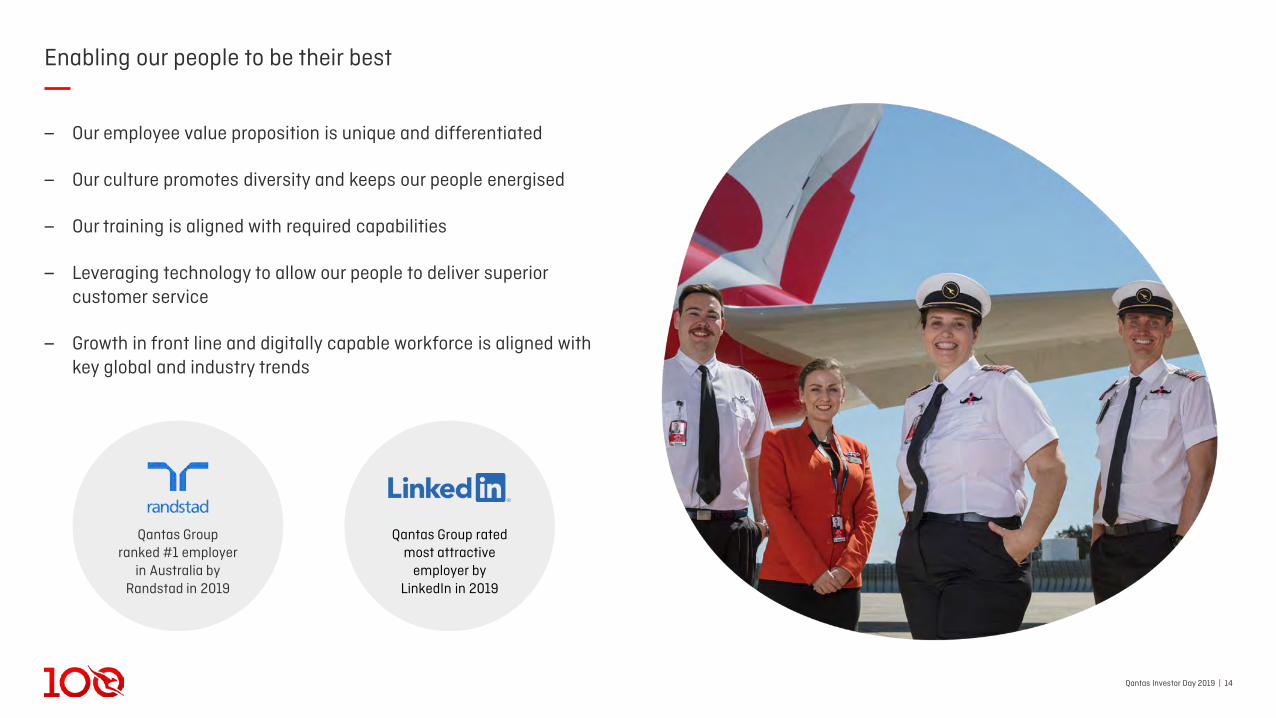
Enabling our people to be their best
‒ Our employee value proposition is unique and differentiated
‒ Our culture promotes diversity and keeps our people energised
‒ Our training is aligned with required capabilities
‒ Leveraging technology to allow our people to deliver superior customer service
‒ Growth in front line and digitally capable workforce is aligned with key global and industry trends
Qantas Group rated most attractive
employer by LinkedIn in 2019
Qantas Group ranked #1 employer
in Australia byRandstad in 2019
Qantas Investor Day 2019 | 15
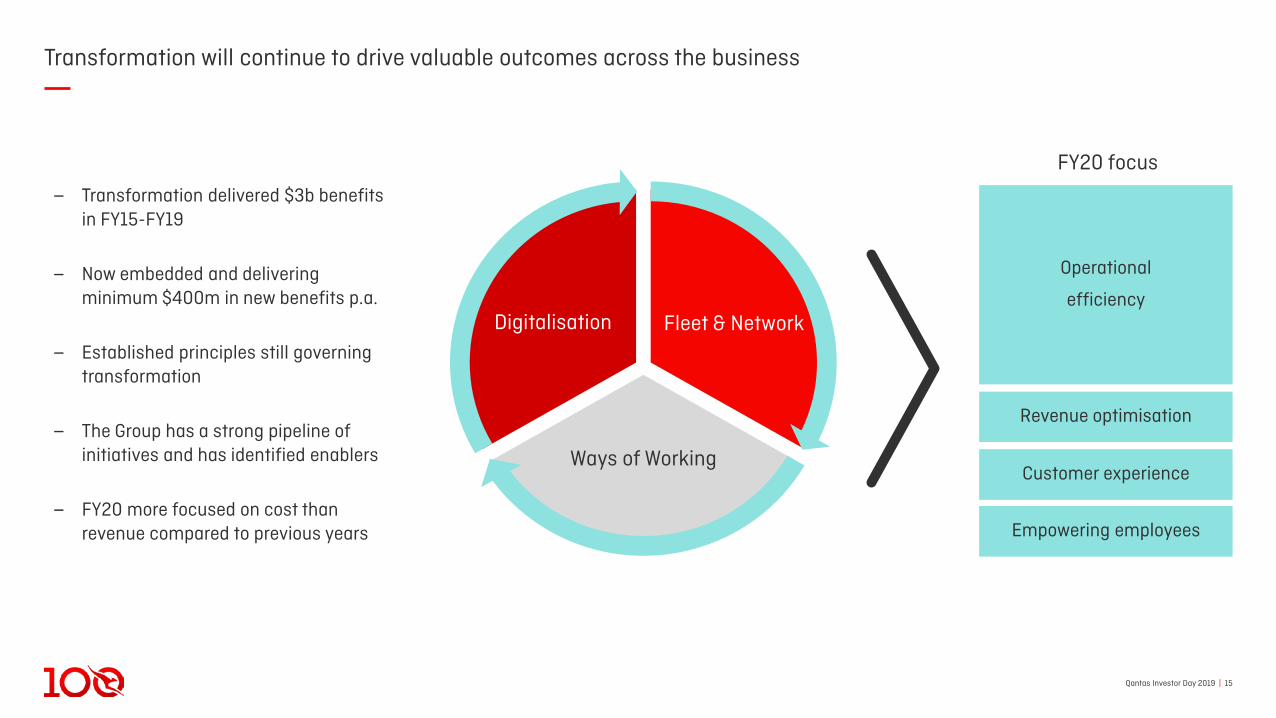
Transformation will continue to drive valuable outcomes across the business
‒ Transformation delivered $3b benefits in FY15-FY19
‒ Now embedded and delivering minimum $400m in new benefits p.a.
‒ Established principles still governing transformation
‒ The Group has a strong pipeline of initiatives and has identified enablers
‒ FY20 more focused on cost than revenue compared to previous years
Operational
efficiency
Ways of Working
Fleet & NetworkDigitalisation
Revenue optimisation
Customer experience
Empowering employees
FY20 focus
Qantas Investor Day 2019 | 16
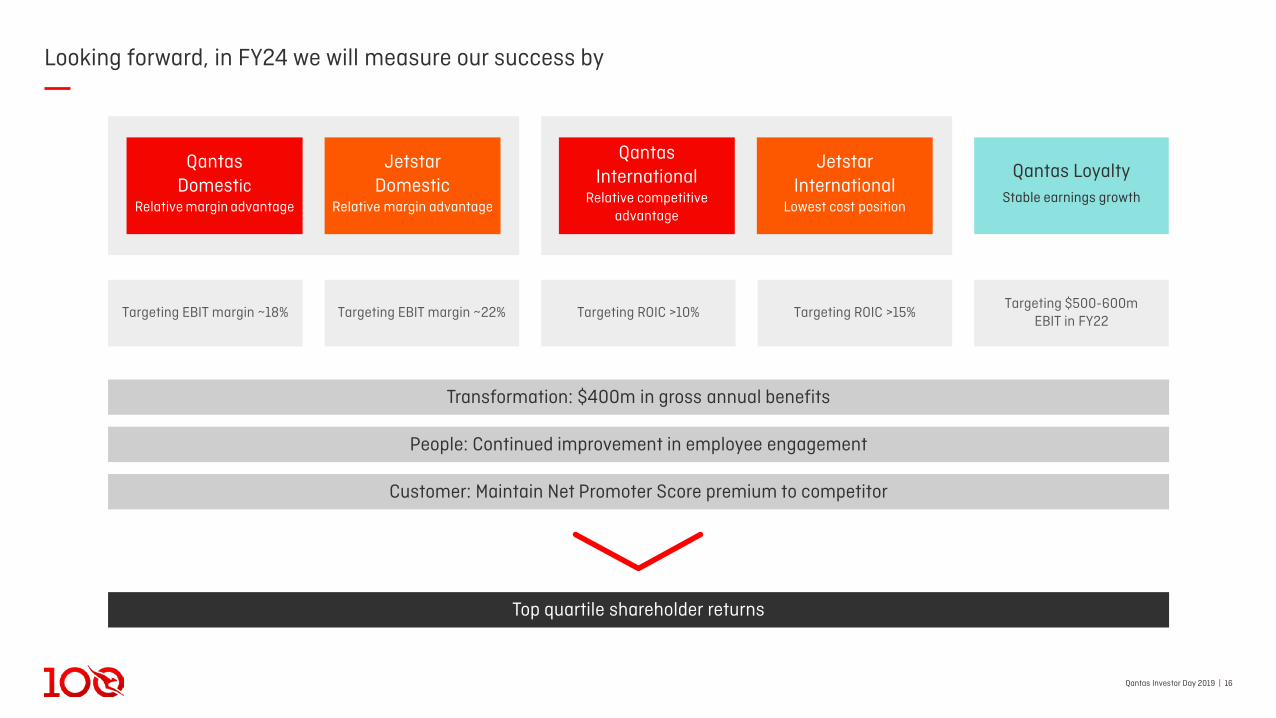
Looking forward, in FY24 we will measure our success by
Targeting $500-600m EBIT in FY22
Targeting ROIC >15%
Qantas Domestic
Relative margin advantage
Jetstar Domestic
Relative margin advantage
Qantas International
Relative competitive advantage
Jetstar International
Lowest cost position
Qantas LoyaltyStable earnings growth
Targeting ROIC >10%Targeting EBIT margin ~22%Targeting EBIT margin ~18%
Top quartile shareholder returns
Customer: Maintain Net Promoter Score premium to competitor
People: Continued improvement in employee engagement
Transformation: $400m in gross annual benefits
Qantas Investor Day 2019 | 171. Combined direct and indirect economic and tourism contribution in FY19. Source: Deloitte Access Economics.
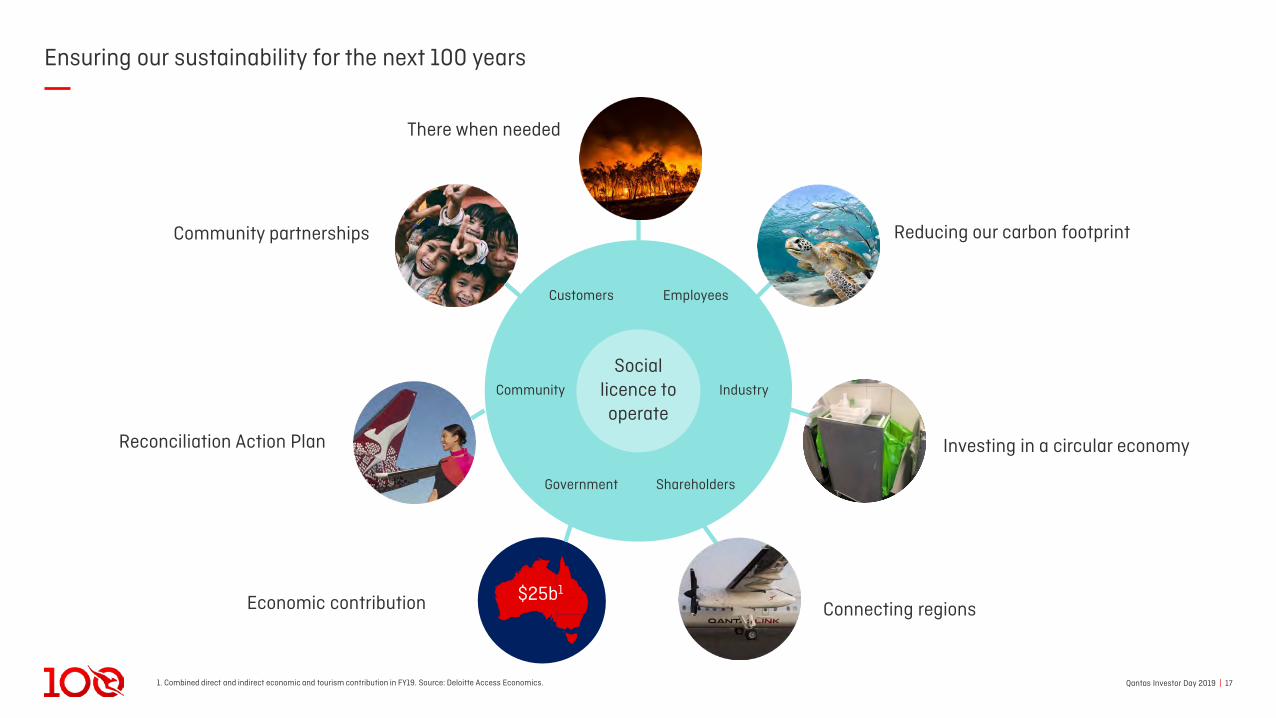
Ensuring our sustainability for the next 100 years
Employees
Industry
ShareholdersGovernment
Community
Customers
Reducing our carbon footprint
Economic contribution
Reconciliation Action Plan
Connecting regions
Social licence to operate
Community partnerships
There when needed
Investing in a circular economy
$25b1

Qantas Investor Day 2019 | 18
Acting responsibly
Qantas Investor Day 2019 | 191. Combined direct and indirect economic and tourism contribution in FY19. Source: Deloitte Access Economics.
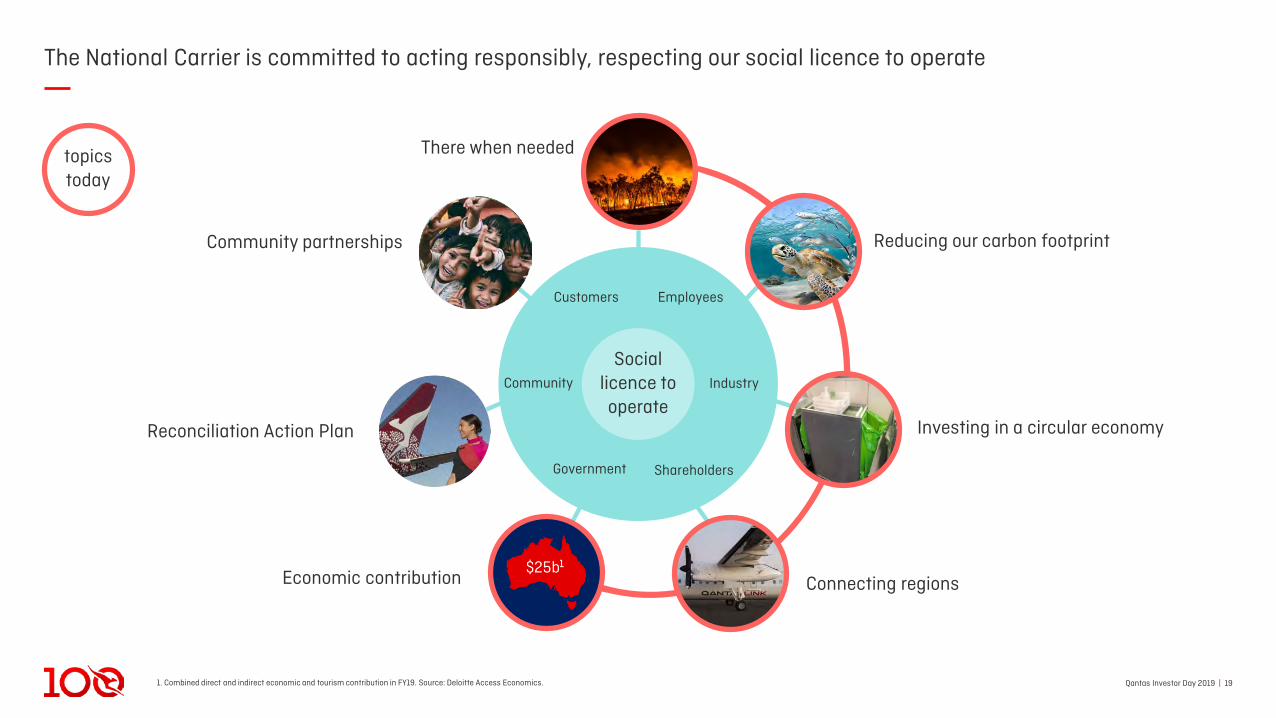
The National Carrier is committed to acting responsibly, respecting our social licence to operate
topicstoday
Employees
Industry
ShareholdersGovernment
Community
Customers
Reducing our carbon footprint
Economic contribution
Investing in a circular economyReconciliation Action Plan
Connecting regions
Social licence to operate
Community partnerships
There when needed
Qantas Investor Day 2019 | 201. Intergovernmental Panel on Climate Change.
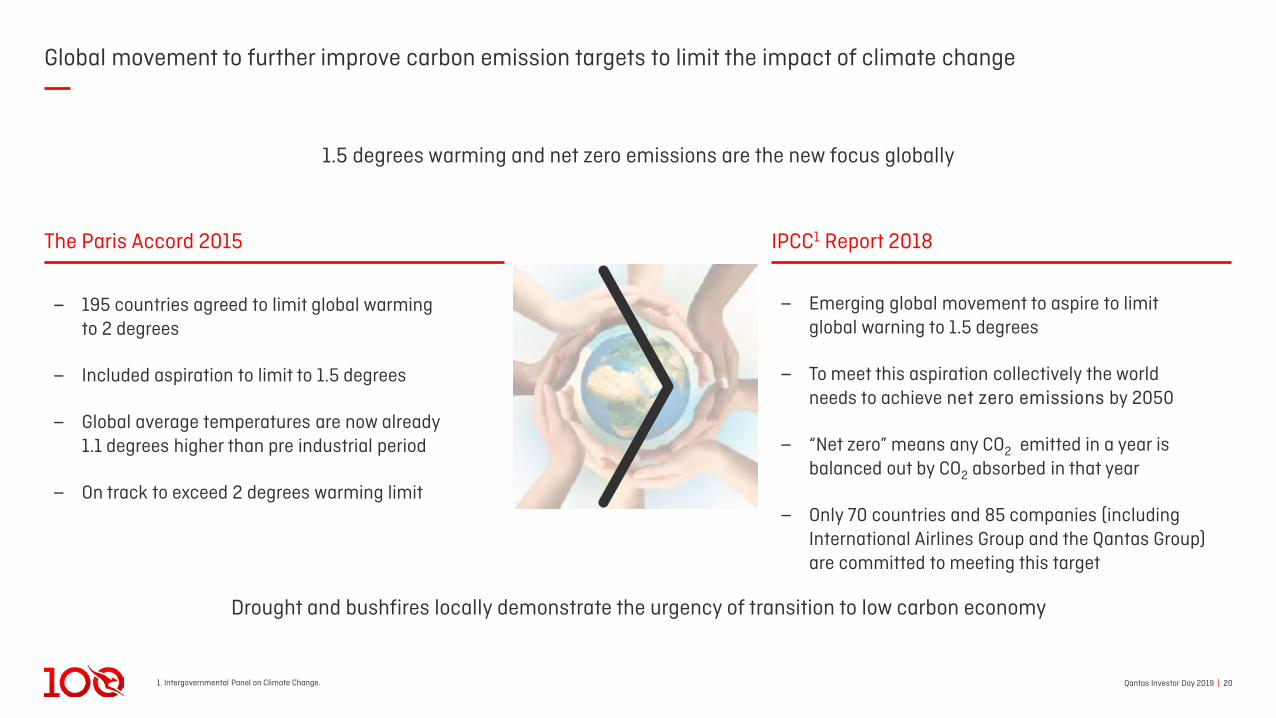
Global movement to further improve carbon emission targets to limit the impact of climate change
1.5 degrees warming and net zero emissions are the new focus globally
‒ Emerging global movement to aspire to limitglobal warning to 1.5 degrees
‒ To meet this aspiration collectively the world needs to achieve net zero emissions by 2050
‒ “Net zero” means any CO2 emitted in a year is balanced out by CO2 absorbed in that year
‒ Only 70 countries and 85 companies (includingInternational Airlines Group and the Qantas Group) are committed to meeting this target
The Paris Accord 2015
‒ 195 countries agreed to limit global warmingto 2 degrees
‒ Included aspiration to limit to 1.5 degrees
‒ Global average temperatures are now already1.1 degrees higher than pre industrial period
‒ On track to exceed 2 degrees warming limit
IPCC1 Report 2018
Drought and bushfires locally demonstrate the urgency of transition to low carbon economy
Qantas Investor Day 2019 | 211. Source: Net-zero emissions energy systems, Steven J. Davis et al published in Science 29 Jun 2018
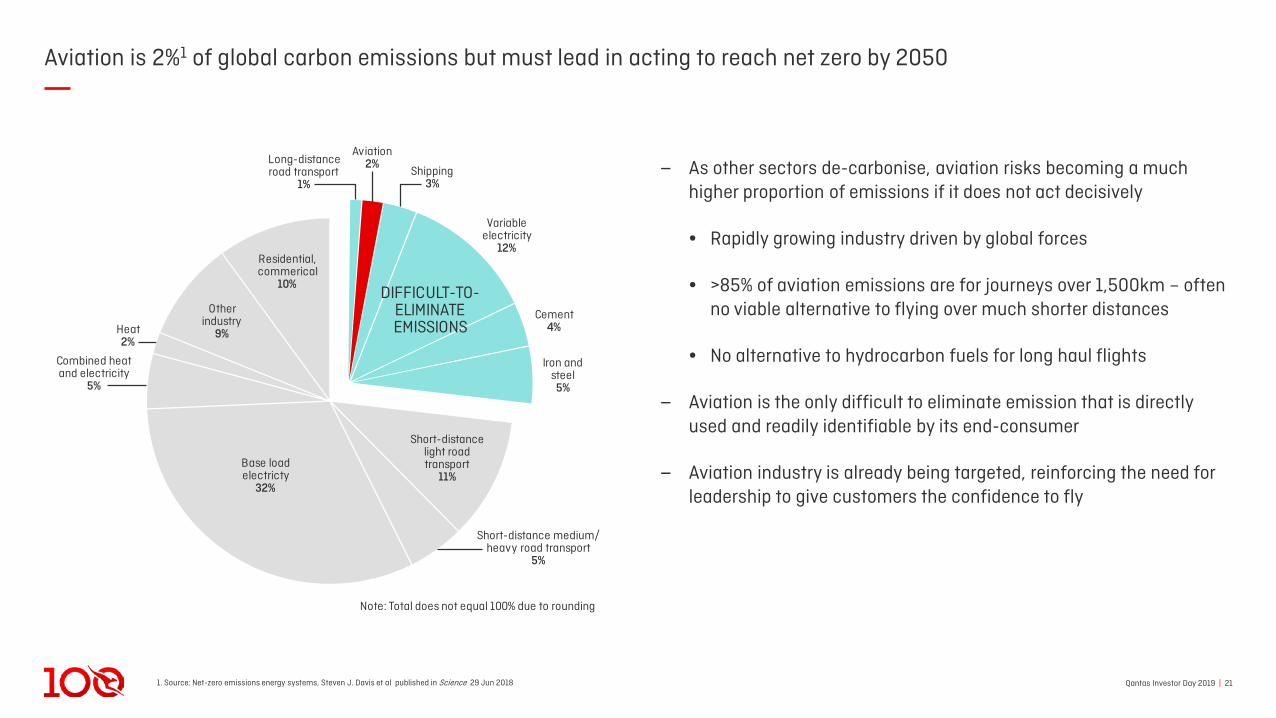
Aviation is 2%1 of global carbon emissions but must lead in acting to reach net zero by 2050
‒ As other sectors de-carbonise, aviation risks becoming a much higher proportion of emissions if it does not act decisively
• Rapidly growing industry driven by global forces
• >85% of aviation emissions are for journeys over 1,500km – often no viable alternative to flying over much shorter distances
• No alternative to hydrocarbon fuels for long haul flights
‒ Aviation is the only difficult to eliminate emission that is directly used and readily identifiable by its end-consumer
‒ Aviation industry is already being targeted, reinforcing the need for leadership to give customers the confidence to fly
Base load electricty
32%
Short-distance light road transport
11%
Short-distance medium/ heavy road transport
5%
Note: Total does not equal 100% due to rounding
DIFFICULT-TO- ELIMINATE EMISSIONS
Combined heat and electricity
5%
Other industry
9%
Residential, commerical
10%
Long-distance road transport
1%
Aviation2%
Shipping3%
Variable electricity
12%
Cement4%
Iron and steel5%
Heat2%

Qantas Investor Day 2019 | 221. Small emitters include Least Developed Countries, Small Island Developing States and Landlocked Developing Countries.
CORSIA is an encouraging start, but industry target of 50% reduction in net emissions does not go far enough
Carbon Offsetting and Reduction Scheme for International Airlines (CORSIA)
‒ The airline industry mechanism to reduce global emissions, adopted in 2016 by the International Civil Aviation Organisation (ICAO)
‒ From 2019 airlines began monitoring and verifying their emissions baselines
‒ During the voluntary phase (between 2021-2026), airlines operating in States that have signed up to CORSIA will purchase offsets for any growth in international emissions between these States
‒ This includes Qantas and covers most of our international destinations
‒ From 2027 CORSIA will become mandatory – with exemptions for some small emitters1 who can join voluntarily
Qantas Investor Day 2019 | 23
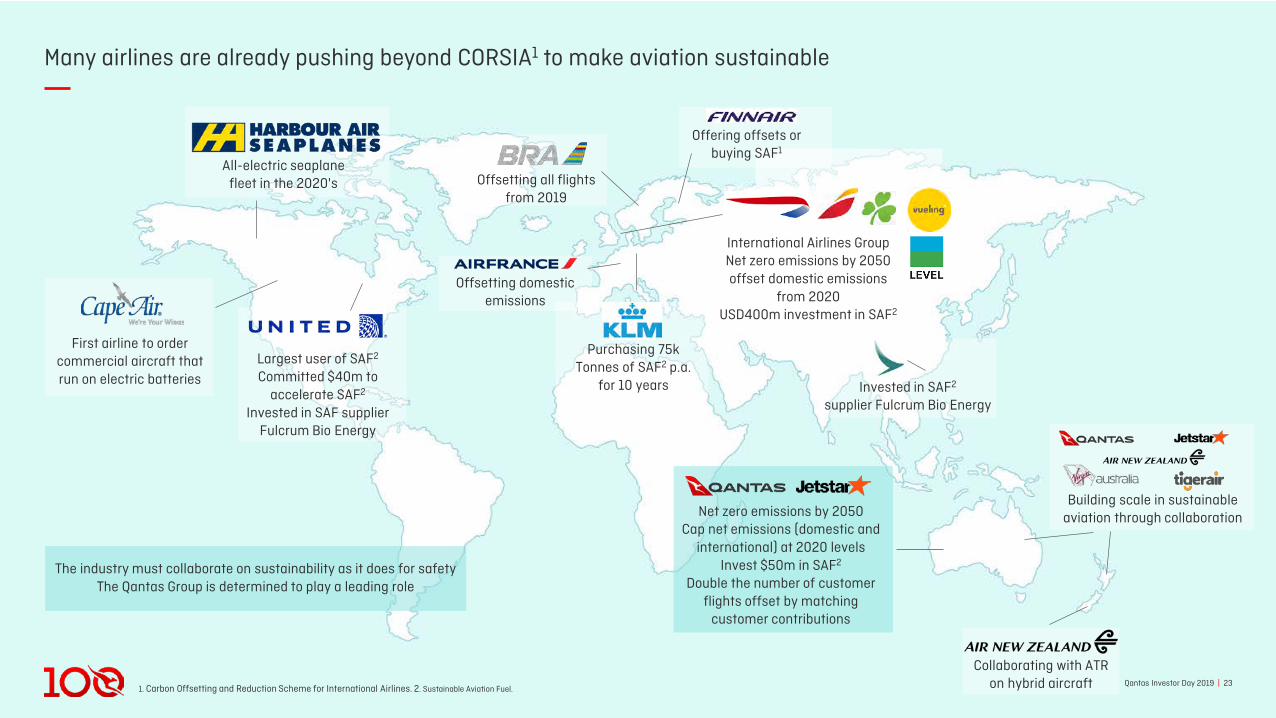
Many airlines are already pushing beyond CORSIA1 to make aviation sustainable
Qantas Investor Day 2019 | 23
All-electric seaplane fleet in the 2020's
Collaborating with ATR on hybrid aircraft
Offsetting all flights from 2019
Offsetting domestic emissions
Largest user of SAF2
Committed $40m to accelerate SAF2
Invested in SAF supplier Fulcrum Bio Energy
1. Carbon Offsetting and Reduction Scheme for International Airlines. 2. Sustainable Aviation Fuel.
Offering offsets orbuying SAF1
Purchasing 75k Tonnes of SAF2 p.a.
for 10 years Invested in SAF2
supplier Fulcrum Bio Energy
The industry must collaborate on sustainability as it does for safety The Qantas Group is determined to play a leading role
International Airlines GroupNet zero emissions by 2050offset domestic emissions
from 2020USD400m investment in SAF2
First airline to order commercial aircraft that run on electric batteries
Building scale in sustainable aviation through collaborationNet zero emissions by 2050
Cap net emissions (domestic and international) at 2020 levels
Invest $50m in SAF2
Double the number of customer flights offset by matching
customer contributions
Qantas Investor Day 2019 | 24
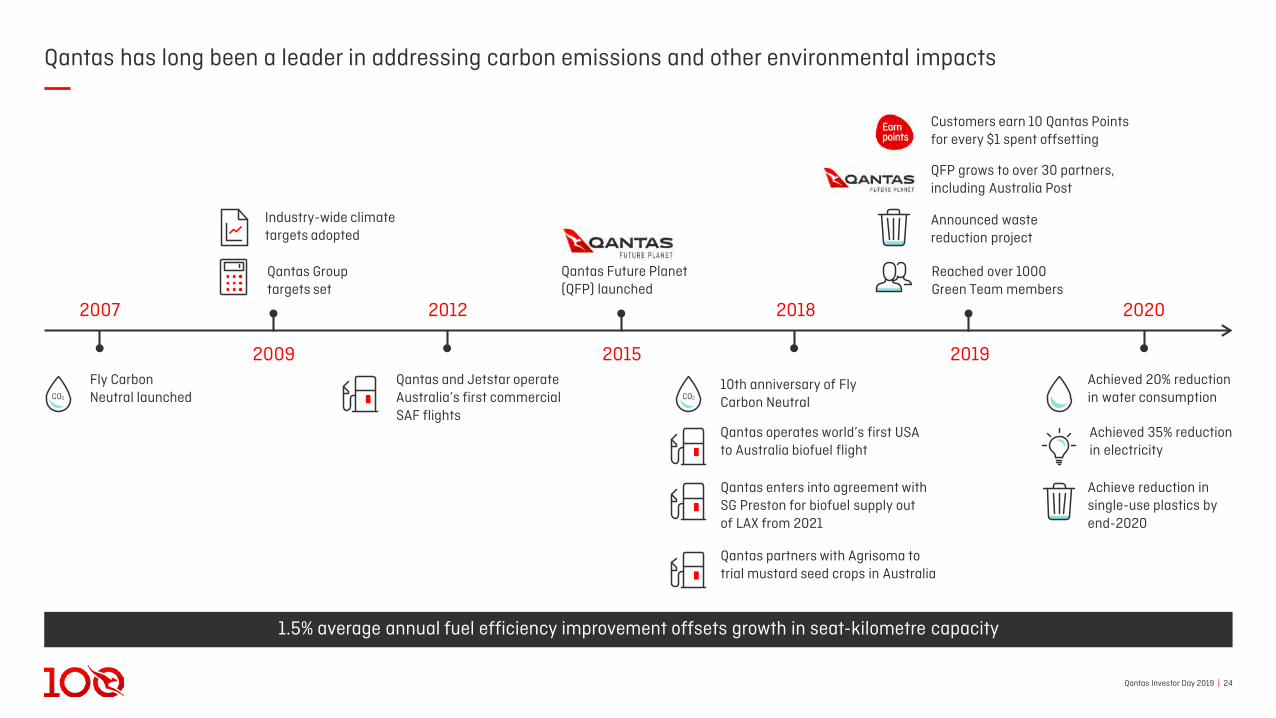
Qantas has long been a leader in addressing carbon emissions and other environmental impacts
1.5% average annual fuel efficiency improvement offsets growth in seat-kilometre capacity
2009 2015
2018
2019
2020
Fly CarbonNeutral launched
Qantas Future Planet (QFP) launched
Reached over 1000 Green Team members
Achieved 20% reduction in water consumption
Announced waste reduction project
Achieved 35% reduction in electricity
Achieve reduction in single-use plastics by end-2020
2012
Industry-wide climate targets adopted
Qantas and Jetstar operate Australia’s first commercial SAF flights
Qantas Group targets set
2007
Customers earn 10 Qantas Points for every $1 spent offsetting
QFP grows to over 30 partners, including Australia Post
Qantas operates world’s first USAto Australia biofuel flight
10th anniversary of Fly Carbon Neutral
Qantas partners with Agrisoma to trial mustard seed crops in Australia
Qantas enters into agreement with SG Preston for biofuel supply outof LAX from 2021
Qantas Investor Day 2019 | 25
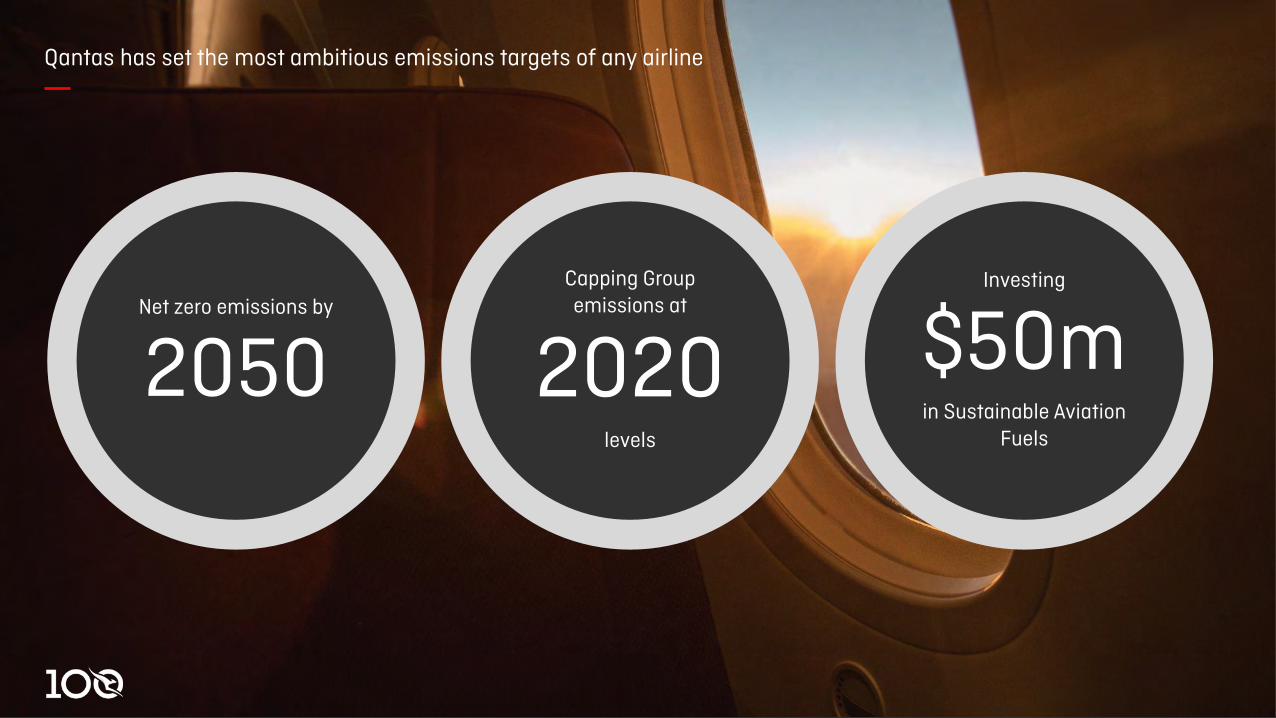
Qantas has set the most ambitious emissions targets of any airline
Net zero emissions by
2050Investing
$50min Sustainable Aviation
Fuels
Capping Group emissions at
2020levels
Qantas Investor Day 2019 | 261. Sustainable Aviation Fuel.
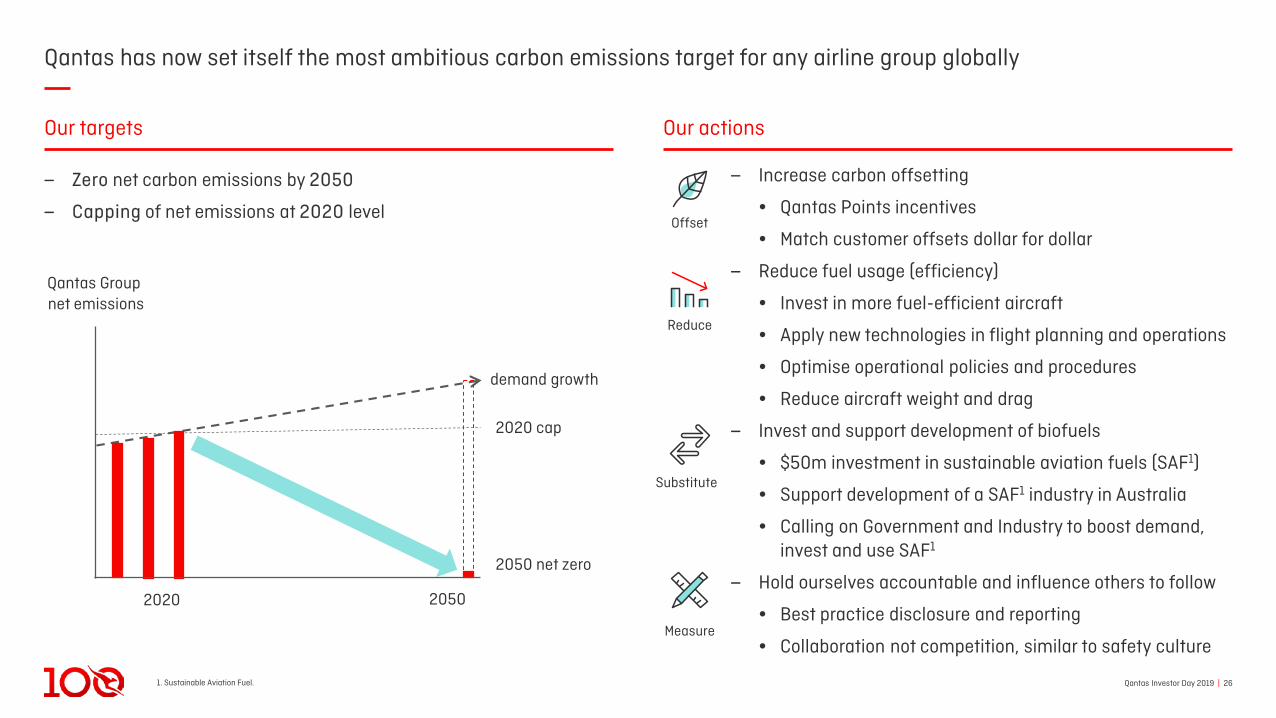
Qantas has now set itself the most ambitious carbon emissions target for any airline group globally
‒ Increase carbon offsetting
• Qantas Points incentives
• Match customer offsets dollar for dollar
‒ Reduce fuel usage (efficiency)
• Invest in more fuel-efficient aircraft
• Apply new technologies in flight planning and operations
• Optimise operational policies and procedures
• Reduce aircraft weight and drag
‒ Invest and support development of biofuels
• $50m investment in sustainable aviation fuels (SAF1)
• Support development of a SAF1 industry in Australia
• Calling on Government and Industry to boost demand, invest and use SAF1
‒ Hold ourselves accountable and influence others to follow
• Best practice disclosure and reporting
• Collaboration not competition, similar to safety culture
‒ Zero net carbon emissions by 2050
‒ Capping of net emissions at 2020 levelOffset
Reduce
Substitute
Our targets Our actions
2020 2050
Qantas Group net emissions
demand growth
2020 cap
2050 net zero
Measure
Qantas Investor Day 2019 | 271. Sustainable Aviation Fuel.
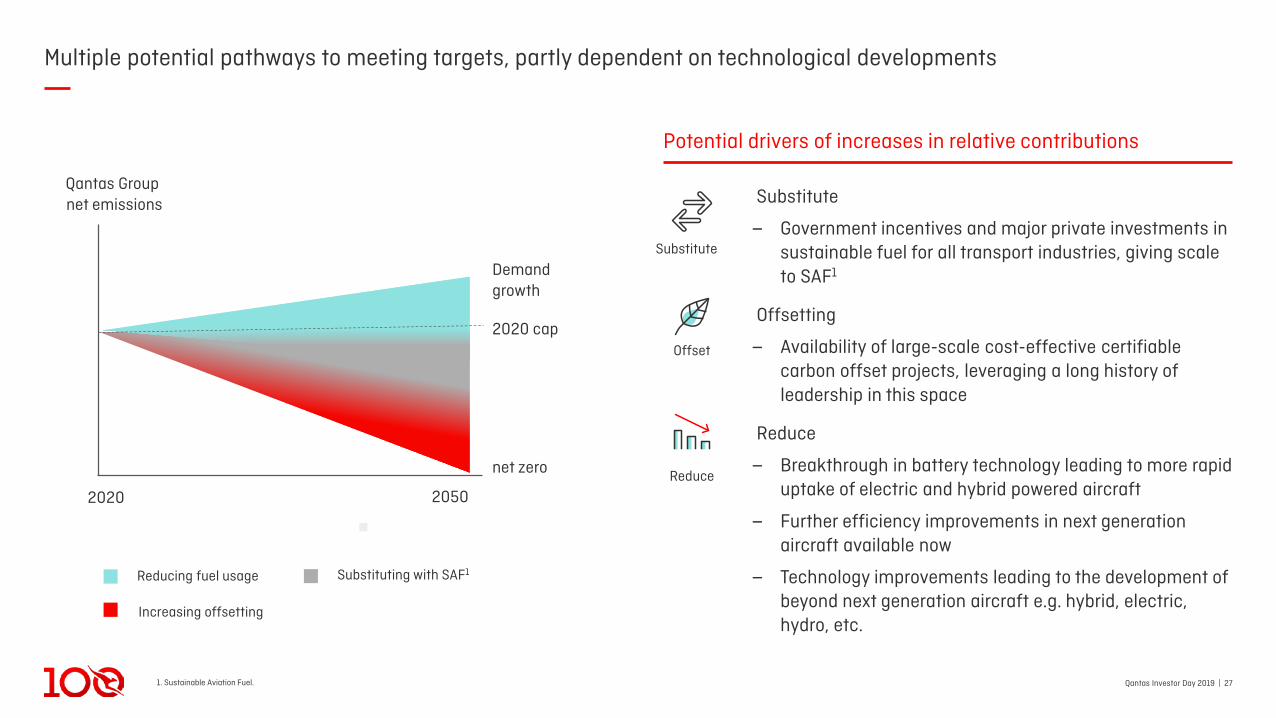
Multiple potential pathways to meeting targets, partly dependent on technological developments
Reducing fuel usage Substituting with SAF1
Increasing offsetting
Offset
Reduce
Potential drivers of increases in relative contributions
Substitute
Substitute
‒ Government incentives and major private investments in sustainable fuel for all transport industries, giving scale to SAF1
Offsetting
‒ Availability of large-scale cost-effective certifiable carbon offset projects, leveraging a long history of leadership in this space
Reduce
‒ Breakthrough in battery technology leading to more rapid uptake of electric and hybrid powered aircraft
‒ Further efficiency improvements in next generation aircraft available now
‒ Technology improvements leading to the development of beyond next generation aircraft e.g. hybrid, electric, hydro, etc.
Demand growth
net zero
2020 cap
2020 2050
Qantas Group net emissions
Qantas Investor Day 2019 | 281. Source: https://www.qantas.com/au/en/qantas-group/delivering-today/financial-and-non-financial-metrics.html.
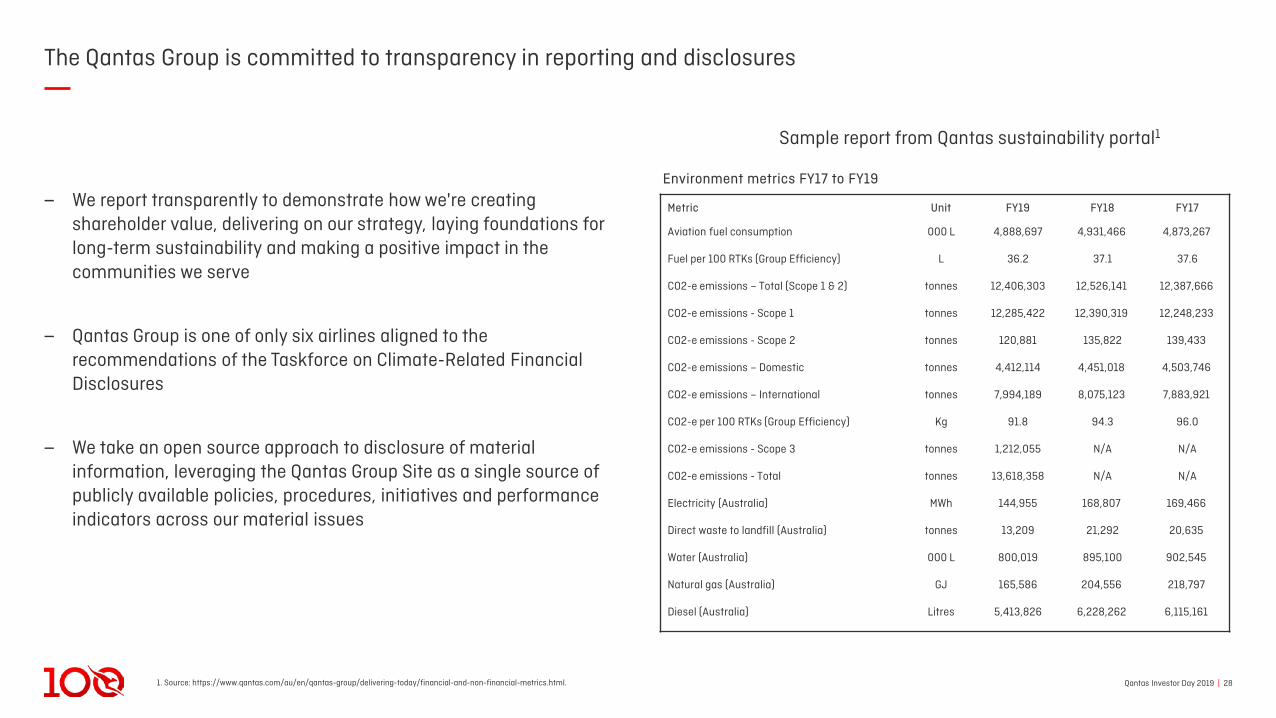
The Qantas Group is committed to transparency in reporting and disclosures
‒ We report transparently to demonstrate how we're creating shareholder value, delivering on our strategy, laying foundations for long-term sustainability and making a positive impact in the communities we serve
‒ Qantas Group is one of only six airlines aligned to the recommendations of the Taskforce on Climate-Related Financial Disclosures
‒ We take an open source approach to disclosure of material information, leveraging the Qantas Group Site as a single source of publicly available policies, procedures, initiatives and performance indicators across our material issues
Metric Unit FY19 FY18 FY17
Aviation fuel consumption 000 L 4,888,697 4,931,466 4,873,267
Fuel per 100 RTKs (Group Efficiency) L 36.2 37.1 37.6
CO2-e emissions – Total (Scope 1 & 2) tonnes 12,406,303 12,526,141 12,387,666
CO2-e emissions - Scope 1 tonnes 12,285,422 12,390,319 12,248,233
CO2-e emissions - Scope 2 tonnes 120,881 135,822 139,433
CO2-e emissions – Domestic tonnes 4,412,114 4,451,018 4,503,746
CO2-e emissions – International tonnes 7,994,189 8,075,123 7,883,921
CO2-e per 100 RTKs (Group Efficiency) Kg 91.8 94.3 96.0
CO2-e emissions - Scope 3 tonnes 1,212,055 N/A N/A
CO2-e emissions - Total tonnes 13,618,358 N/A N/A
Electricity (Australia) MWh 144,955 168,807 169,466
Direct waste to landfill (Australia) tonnes 13,209 21,292 20,635
Water (Australia) 000 L 800,019 895,100 902,545
Natural gas (Australia) GJ 165,586 204,556 218,797
Diesel (Australia) Litres 5,413,826 6,228,262 6,115,161
Environment metrics FY17 to FY19
Sample report from Qantas sustainability portal1
Qantas Investor Day 2019 | 29
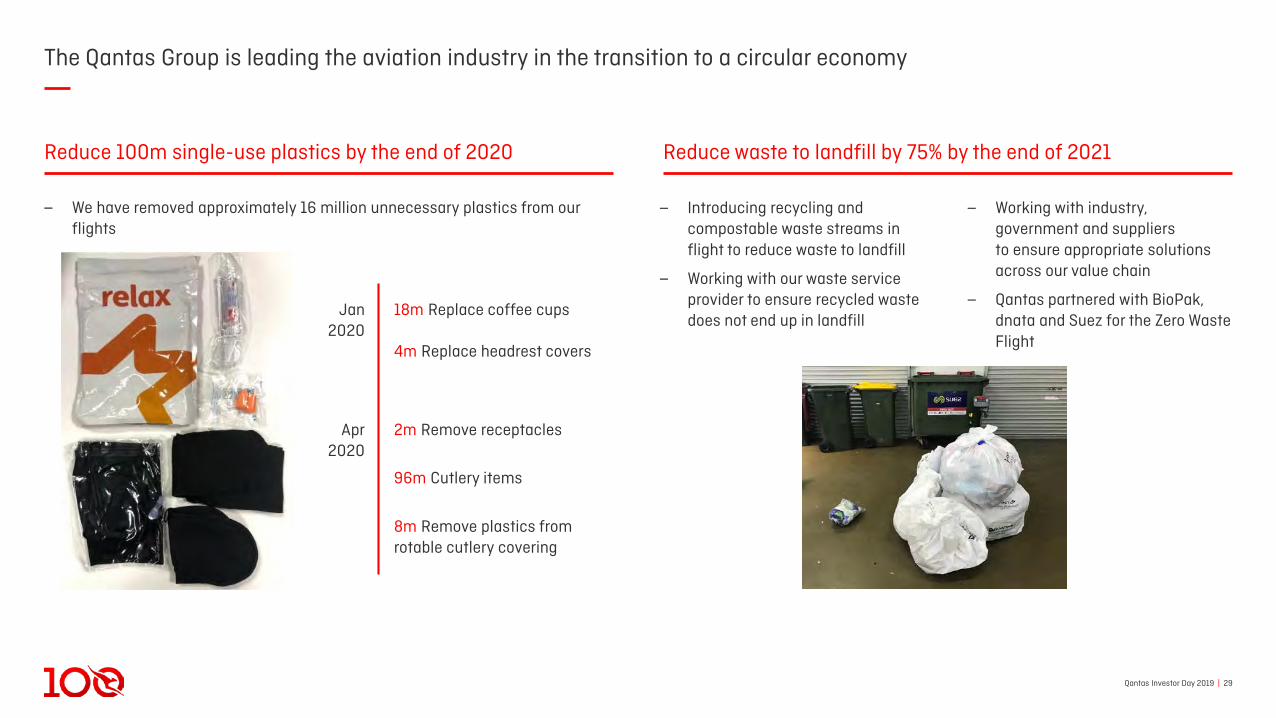
The Qantas Group is leading the aviation industry in the transition to a circular economy
Jan2020
Apr2020
4m Replace headrest covers
18m Replace coffee cups
2m Remove receptacles
96m Cutlery items
8m Remove plastics fromrotable cutlery covering
‒ Introducing recycling and compostable waste streams in flight to reduce waste to landfill
‒ Working with our waste service provider to ensure recycled waste does not end up in landfill
‒ Working with industry, government and suppliersto ensure appropriate solutions across our value chain
‒ Qantas partnered with BioPak, dnata and Suez for the Zero Waste Flight
‒ We have removed approximately 16 million unnecessary plastics from our flights
Reduce 100m single-use plastics by the end of 2020 Reduce waste to landfill by 75% by the end of 2021
Qantas Investor Day 2019 | 301. Combined direct and indirect economic contribution in FY19. Source: Deloitte Access Economics. 2. Permanent staff employed by the Qantas Group. 3. Source: Deloitte Access Economics. 4. Combined direct and indirect economic tourism contribution in FY19. Source: Deloitte Access Economics. 5. Includes corporate tax, payroll tax, fringe benefits tax, goods and services tax, personal income tax for employees, withholding tax and ticket taxes, fees and charges. Source: 2018 Qantas Voluntary Tax Transparency Code Report.
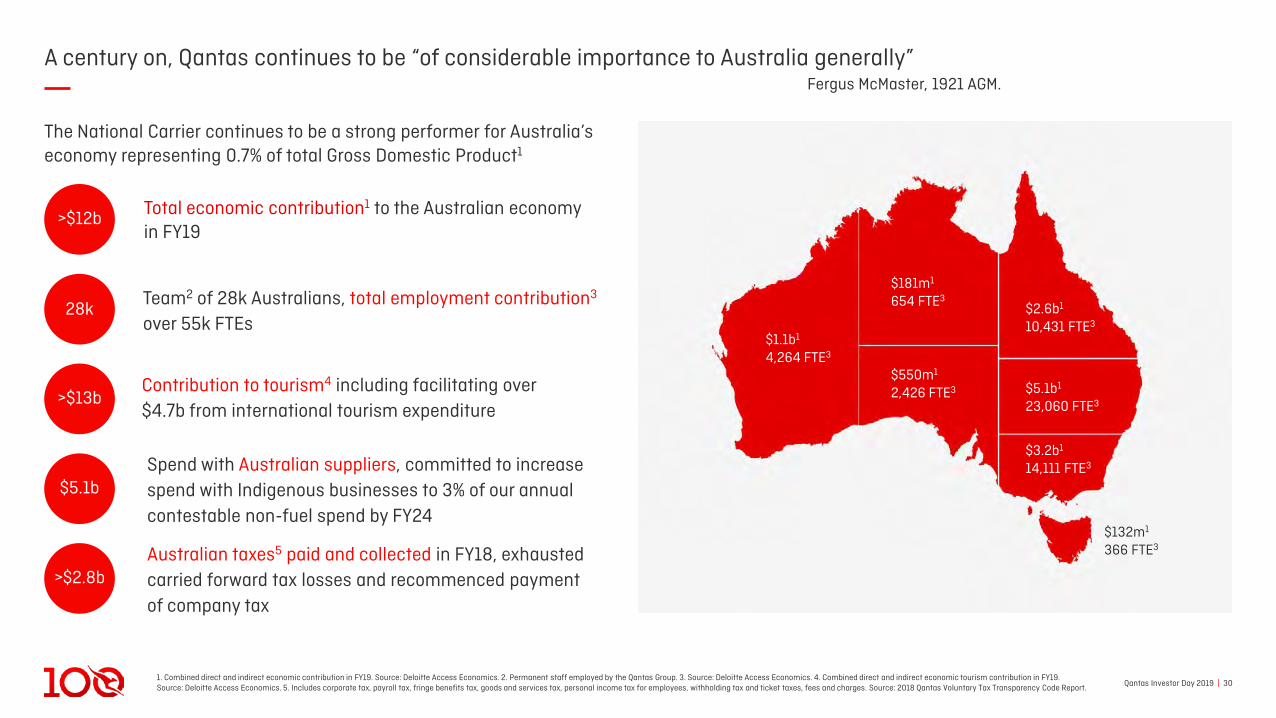
A century on, Qantas continues to be “of considerable importance to Australia generally”
Total economic contribution1 to the Australian economy in FY19
Team2 of 28k Australians, total employment contribution3
over 55k FTEs
>$12b
28k
Spend with Australian suppliers, committed to increase spend with Indigenous businesses to 3% of our annual contestable non-fuel spend by FY24
$5.1b
Contribution to tourism4 including facilitating over$4.7b from international tourism expenditure
>$13b
Australian taxes5 paid and collected in FY18, exhausted carried forward tax losses and recommenced payment of company tax
>$2.8b
The National Carrier continues to be a strong performer for Australia’s economy representing 0.7% of total Gross Domestic Product1
$1.1b1
4,264 FTE3
$181m1
654 FTE3
$550m1
2,426 FTE3 $5.1b1
23,060 FTE3
$3.2b1
14,111 FTE3
$2.6b1
10,431 FTE3
$132m1
366 FTE3
Fergus McMaster, 1921 AGM.

Qantas Investor Day 2019 | 311. As at 31 Oct 2019. 2. As at 31 Dec 2018.
Qantas supports regional Australia
‒ Partnering with Rural Aid to help fund hay bales, water trucking, groceries and mental health counsellors for farming communities
‒ Provided a total donation of $3m to date2
‒ Operated two special fundraising charter flights from Sydney to Longreach and Tamworth
‒ Supporting employees to join Rural Aid’s Farm Rescue program and volunteer their time
‒ Hosted monthly “Chops for Change” pop-upsat various Australian lounges
‒ $5m commitment over five years
‒ 1,200+ submissions received from across regional Australia
Successful recipients announced in November include:
‒ Red Dust Role Models, Alice Springs
‒ Outback Futures, Regional Queensland
‒ Lifeline Central West, Dubbo
‒ Taken action to make travel more accessiblefor residents of remote and regional Australia
‒ Discounted Fares for Residents Program having meaningful impact on communities
‒ Over 25,000 tickets sold1
‒ Airfare capping in place to give residents pricing certainty for last minute travel
Regional fares Regional grants Drought initiative
Qantas Investor Day 2019 | 32
‒ The Qantas Group plans to capture and consolidate its position as a leader. This means leadership in sustainable aviation, supporting and standing up for regional Australia and continuing to engage on critical social and economic issues
‒ The world in which we operate demands more of us in our 100th year. Trends like flight shaming point to what we know about customers expecting businesses to step up on climate change. We also face greater investor scrutiny and have regulatory measures on our doorstep. And, we understand the physical and transitional risks to our business under different climate futures
‒ We are responding by investing in key areas like sustainable aviation fuel, the circular economy, renewable energy, electric vehicles and carbon offsetting. We use these levers to create impact, meet expectations and stay ahead of the rest
The opportunity for leadership
Disciplined application of our Financial Framework
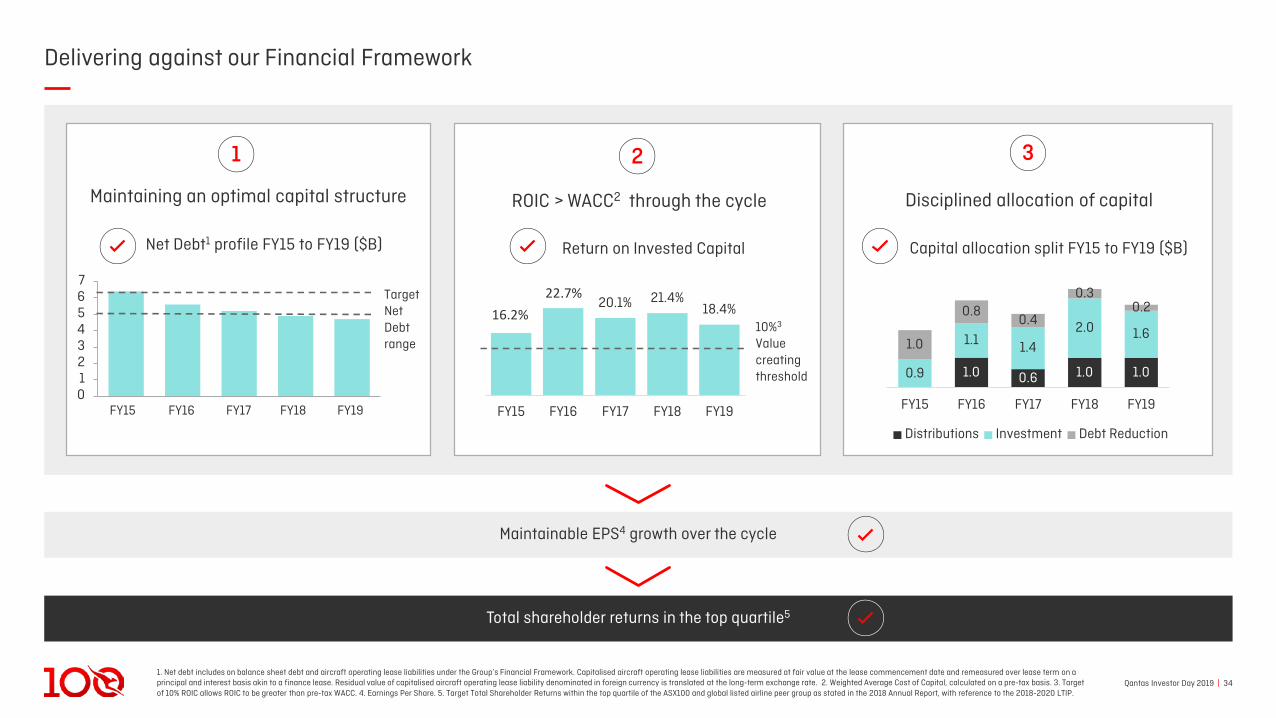
Qantas Investor Day 2019 | 341. Net debt includes on balance sheet debt and aircraft operating lease liabilities under the Group’s Financial Framework. Capitalised aircraft operating lease liabilities are measured at fair value at the lease commencement date and remeasured over lease term on a principal and interest basis akin to a finance lease. Residual value of capitalised aircraft operating lease liability denominated in foreign currency is translated at the long-term exchange rate. 2. Weighted Average Cost of Capital, calculated on a pre-tax basis. 3. Target of 10% ROIC allows ROIC to be greater than pre-tax WACC. 4. Earnings Per Share. 5. Target Total Shareholder Returns within the top quartile of the ASX100 and global listed airline peer group as stated in the 2018 Annual Report, with reference to the 2018-2020 LTIP.
Delivering against our Financial Framework
Disciplined allocation of capital
16.2%22.7%
20.1% 21.4%18.4%
FY15 FY16 FY17 FY18 FY19
10%3
Valuecreating threshold
Net Debt1 profile FY15 to FY19 ($B)
01234567
FY18FY16FY15 FY17 FY19
TargetNet Debt range
Capital allocation split FY15 to FY19 ($B)
Total shareholder returns in the top quartile5
Maintainable EPS4 growth over the cycle
1.0 0.6 1.0 1.0 0.9
1.1 1.4
2.0 1.6 1.0
0.8 0.4
0.3 0.2
FY15 FY16 FY17 FY18 FY19
Distributions Investment Debt Reduction
Return on Invested Capital
ROIC > WACC2 through the cycleMaintaining an optimal capital structure
1 2 3
Qantas Investor Day 2019 | 35
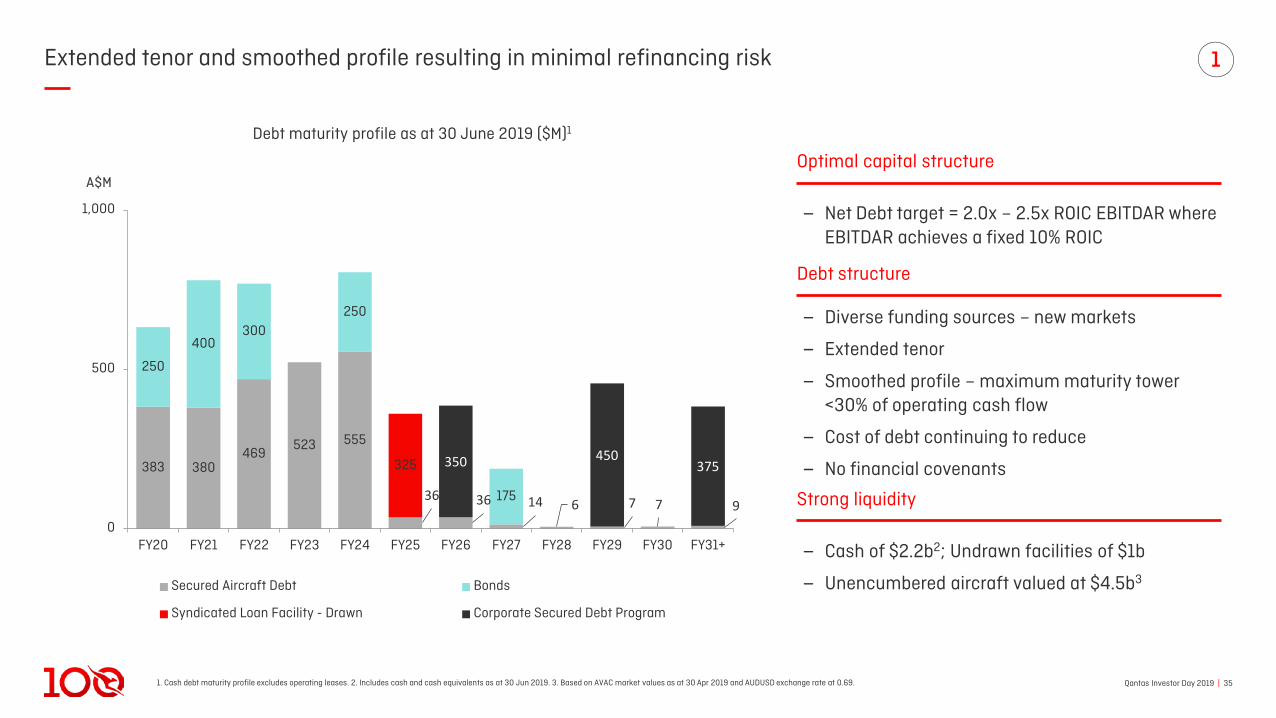
383 380469
523 555
36 36 14 6 7 7 9
250
400300
250
175
325 350 450375
0
500
1,000
FY20 FY21 FY22 FY23 FY24 FY25 FY26 FY27 FY28 FY29 FY30 FY31+
A$M
Secured Aircraft Debt Bonds
Syndicated Loan Facility - Drawn Corporate Secured Debt Program
1. Cash debt maturity profile excludes operating leases. 2. Includes cash and cash equivalents as at 30 Jun 2019. 3. Based on AVAC market values as at 30 Apr 2019 and AUDUSD exchange rate at 0.69.
Extended tenor and smoothed profile resulting in minimal refinancing risk
Debt maturity profile as at 30 June 2019 ($M)1
‒ Net Debt target = 2.0x – 2.5x ROIC EBITDAR where EBITDAR achieves a fixed 10% ROIC
‒ Diverse funding sources – new markets
‒ Extended tenor
‒ Smoothed profile – maximum maturity tower <30% of operating cash flow
‒ Cost of debt continuing to reduce
‒ No financial covenants
Optimal capital structure
‒ Cash of $2.2b2; Undrawn facilities of $1b
‒ Unencumbered aircraft valued at $4.5b3
Strong liquidity
Debt structure
1
Qantas Investor Day 2019 | 36
0
1
2
3
4
5
6
7
Moo
dy's
Deb
t to
EB
ITD
A
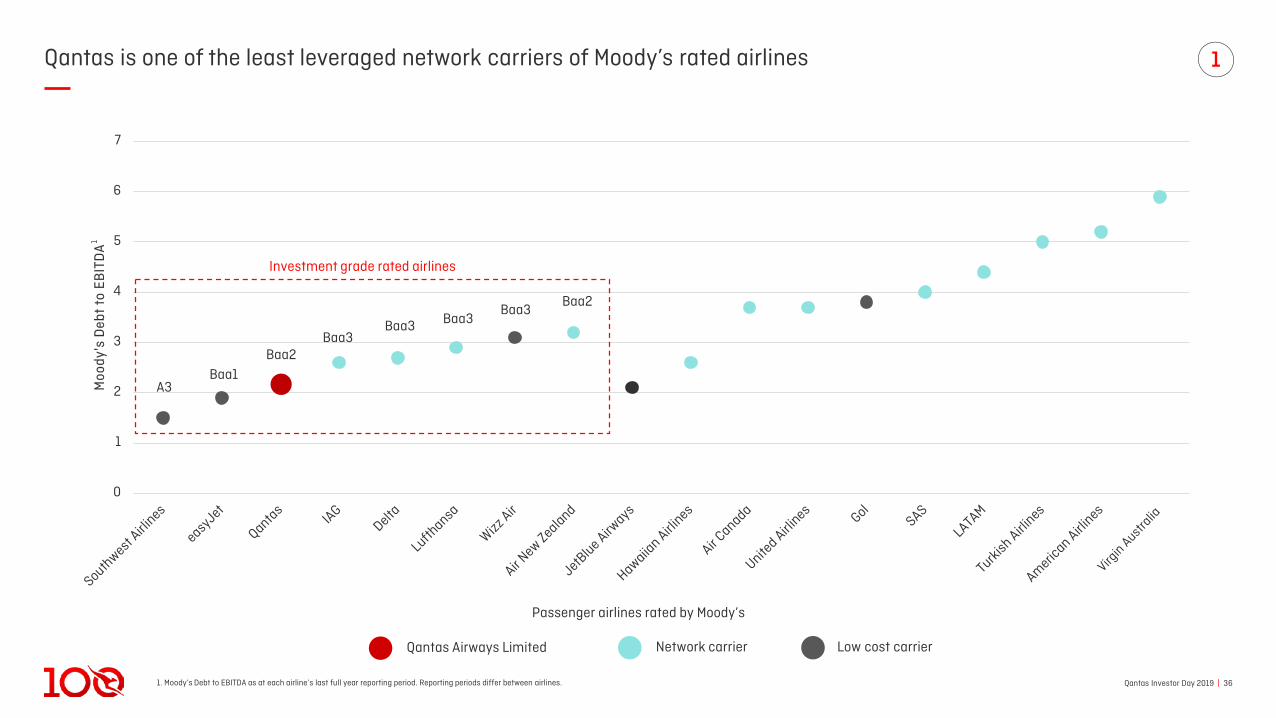
1. Moody’s Debt to EBITDA as at each airline’s last full year reporting period. Reporting periods differ between airlines.
Qantas is one of the least leveraged network carriers of Moody’s rated airlines
Passenger airlines rated by Moody’s
Baa1Baa2
A3
Baa3Baa2
Baa3
Baa3Baa3
Network carrier Low cost carrier
1
Investment grade rated airlines
Qantas Airways Limited
1
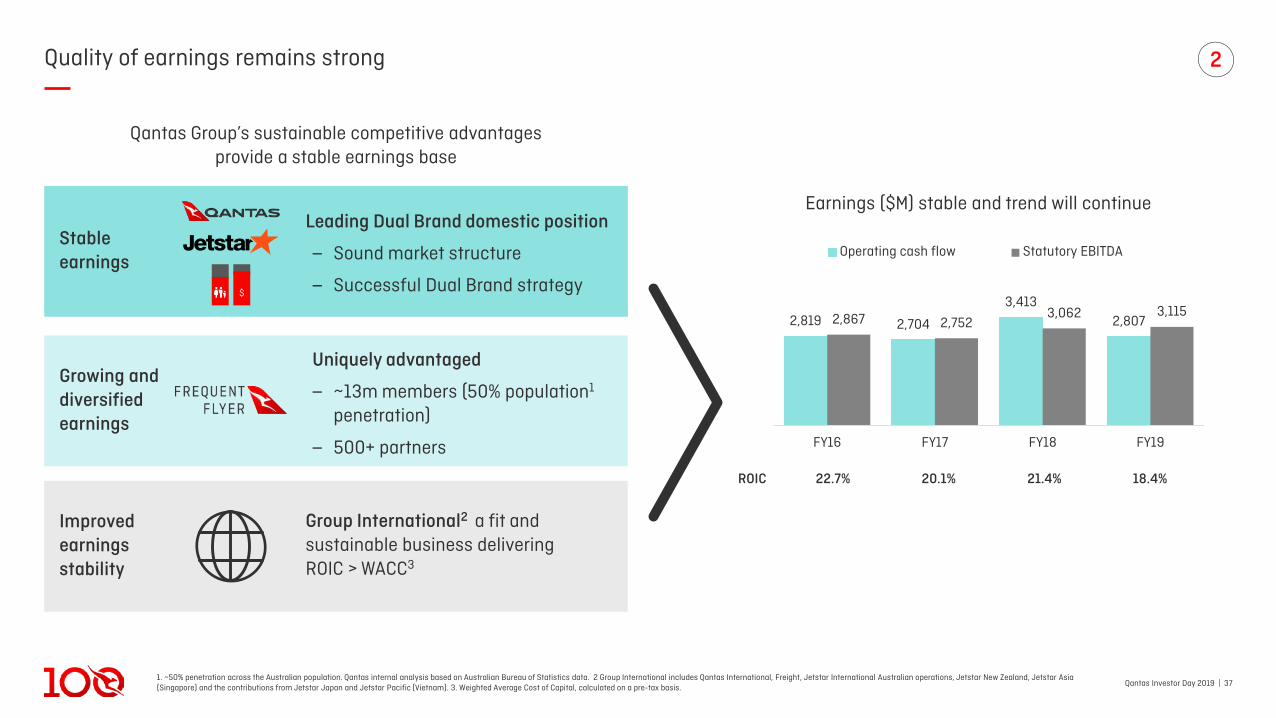
Qantas Investor Day 2019 | 371. ~50% penetration across the Australian population. Qantas internal analysis based on Australian Bureau of Statistics data. 2 Group International includes Qantas International, Freight, Jetstar International Australian operations, Jetstar New Zealand, Jetstar Asia (Singapore) and the contributions from Jetstar Japan and Jetstar Pacific (Vietnam). 3. Weighted Average Cost of Capital, calculated on a pre-tax basis.
Quality of earnings remains strong
Leading Dual Brand domestic position
‒ Sound market structure
‒ Successful Dual Brand strategy
Qantas Group’s sustainable competitive advantagesprovide a stable earnings base
Uniquely advantaged
‒ ~13m members (50% population1
penetration)
‒ 500+ partners
Group International2 a fit and sustainable business deliveringROIC > WACC3
Stable earnings
Growing and diversified earnings
Improved earnings stability
Earnings ($M) stable and trend will continue
2,819 2,704
3,4132,8072,867 2,752
3,062 3,115
FY16 FY17 FY18 FY19
Operating cash flow Statutory EBITDA
ROIC 22.7% 20.1% 21.4% 18.4%
$
2
Qantas Investor Day 2019 | 38
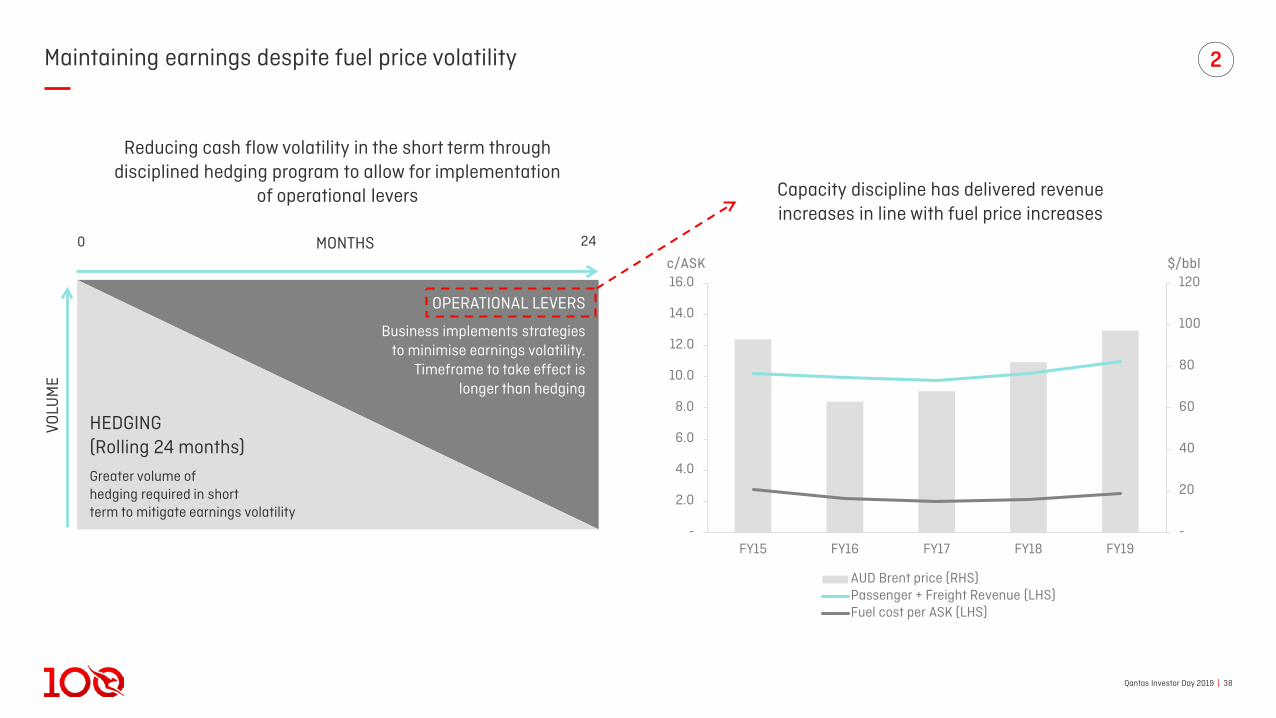
Maintaining earnings despite fuel price volatility
MONTHS0
VOLU
ME
Reducing cash flow volatility in the short term through disciplined hedging program to allow for implementation
of operational levers Capacity discipline has delivered revenue increases in line with fuel price increases
24
HEDGING(Rolling 24 months)
Greater volume of hedging required in shortterm to mitigate earnings volatility
OPERATIONAL LEVERS
Business implements strategies to minimise earnings volatility.
Timeframe to take effect is longer than hedging
c/ASK $/bbl
2
-
20
40
60
80
100
120
-
2.0
4.0
6.0
8.0
10.0
12.0
14.0
16.0
FY15 FY16 FY17 FY18 FY19
AUD Brent price (RHS)Passenger + Freight Revenue per ASK (LHS)Fuel cost per ASK (LHS)
(LHS)

Qantas Investor Day 2019 | 39
Our business and strategy is diverse enough to manage currency fluctuations
‒ Stronger demand environment
‒ Higher fuel
‒ Demand increases for outbound international travel
‒ Australian market more profitable for international competitors
• Increased competitor capacity
‒ Weaker demand environment
‒ Lower fuel
‒ Demand reduces for outbound international travel
‒ Australian market less profitable for international competitors
• Reduced competitor capacity
1.000.50 0.75Average long term AUDUSD rate
2
Focussed on financial strength and margin advantage in all operating environments
Qantas Investor Day 2019 | 401. Estimated annual base dividend FY20 onward.
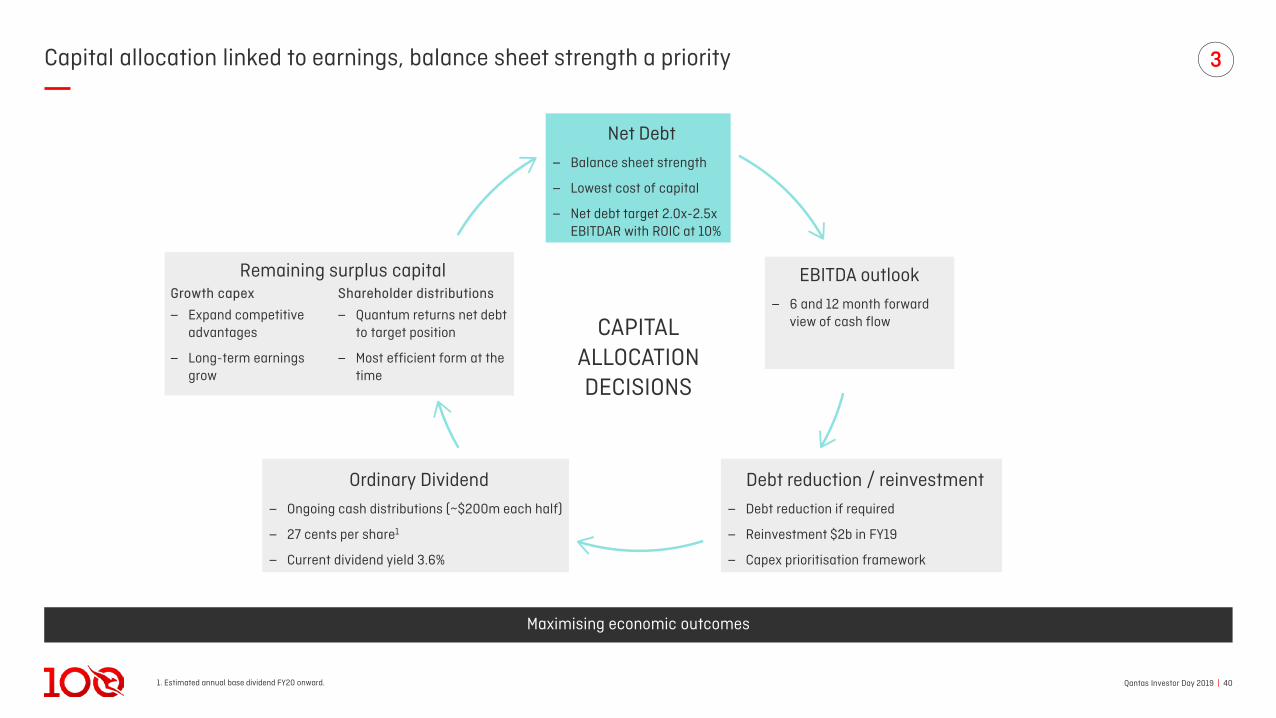
Capital allocation linked to earnings, balance sheet strength a priority
Maximising economic outcomes
Net Debt
‒ Balance sheet strength
‒ Lowest cost of capital
‒ Net debt target 2.0x-2.5x EBITDAR with ROIC at 10%
CAPITALALLOCATIONDECISIONS
EBITDA outlook
‒ 6 and 12 month forward view of cash flow
Debt reduction / reinvestment
‒ Debt reduction if required
‒ Reinvestment $2b in FY19
‒ Capex prioritisation framework
Ordinary Dividend
‒ Ongoing cash distributions (~$200m each half)
‒ 27 cents per share1
‒ Current dividend yield 3.6%
Remaining surplus capitalShareholder distributions
‒ Quantum returns net debtto target position
‒ Most efficient form at the time
Growth capex
‒ Expand competitive advantages
‒ Long-term earnings grow
3
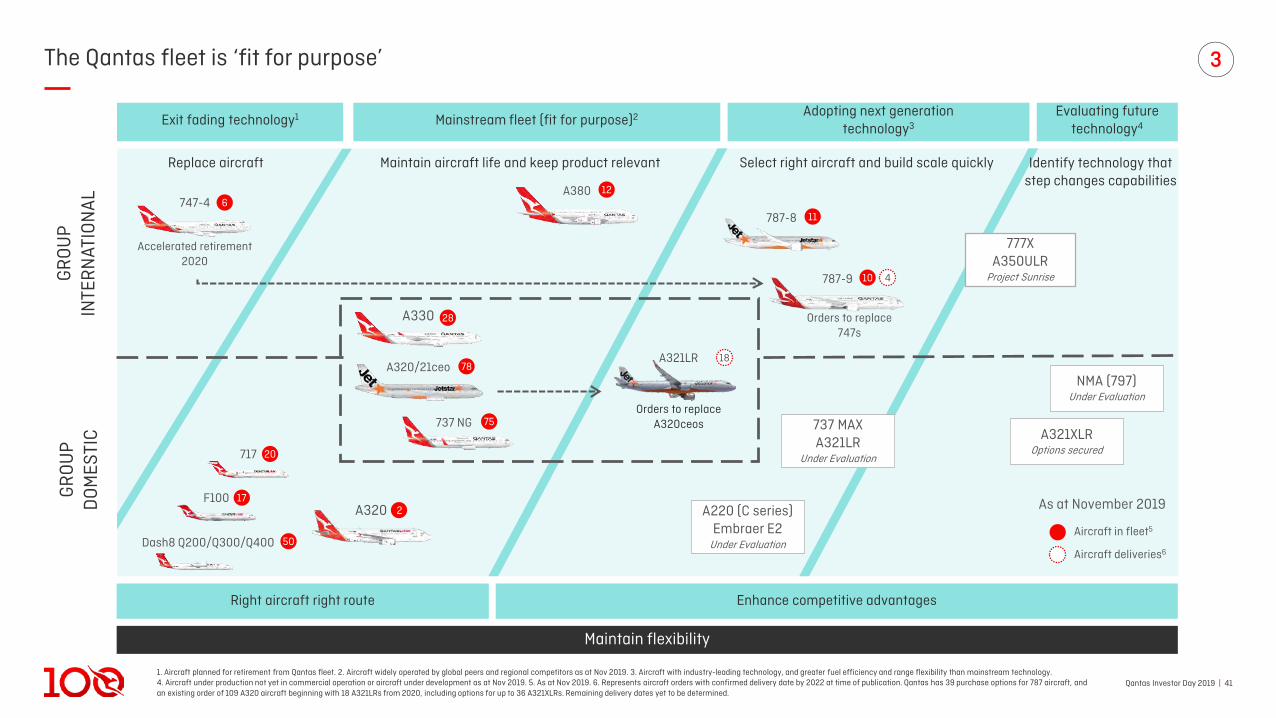
Qantas Investor Day 2019 | 411. Aircraft planned for retirement from Qantas fleet. 2. Aircraft widely operated by global peers and regional competitors as at Nov 2019. 3. Aircraft with industry-leading technology, and greater fuel efficiency and range flexibility than mainstream technology. 4. Aircraft under production not yet in commercial operation or aircraft under development as at Nov 2019. 5. As at Nov 2019. 6. Represents aircraft orders with confirmed delivery date by 2022 at time of publication. Qantas has 39 purchase options for 787 aircraft, and an existing order of 109 A320 aircraft beginning with 18 A321LRs from 2020, including options for up to 36 A321XLRs. Remaining delivery dates yet to be determined.
The Qantas fleet is ‘fit for purpose’
Exit fading technology1 Mainstream fleet (fit for purpose)2 Adopting next generationtechnology3
Evaluating futuretechnology4
747-4 6
Accelerated retirement 2020
A380 12
A330 28
A320/21ceo 78
737 NG 75
717 20
F100 17
Dash8 Q200/Q300/Q400 50
787-8 11
A321LR 18
Orders to replace A320ceos
Orders to replace 747s
787-9 10 4
A220 (C series)Embraer E2
Under Evaluation
A321XLROptions secured
NMA (797)Under Evaluation
Aircraft in fleet5
Aircraft deliveries6
2A320
Maintain flexibility
Select right aircraft and build scale quicklyMaintain aircraft life and keep product relevant
GR
OU
P IN
TER
NAT
ION
AL
GR
OU
P D
OM
ESTI
C
Replace aircraft
As at November 2019
Right aircraft right route Enhance competitive advantages
Identify technology that step changes capabilities
777X A350ULR
Project Sunrise
737 MAXA321LR
Under Evaluation
3
Qantas Investor Day 2019 | 42
-
0.5
1.0
1.5
2.0
2.5
FY20
1. Based on 2018 dollars and AUDUSD exchange rate at 0.75. 2. All A321LR aircraft.
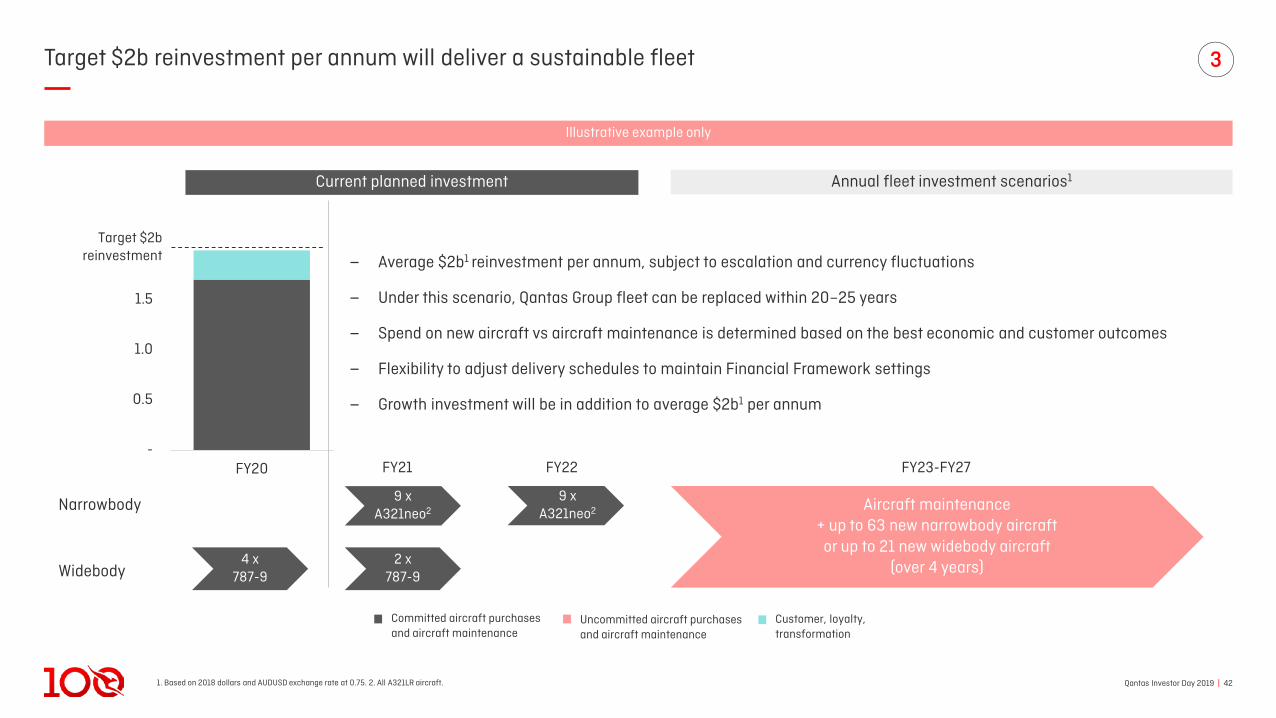
Target $2b reinvestment per annum will deliver a sustainable fleet
Current planned investment Annual fleet investment scenarios1
Narrowbody
Widebody
9 x A321neo2
9 x A321neo2
4 x787-9
2 x787-9
Illustrative example only
Target $2b reinvestment
Committed aircraft purchases and aircraft maintenance
Uncommitted aircraft purchases and aircraft maintenance
Customer, loyalty, transformation
Aircraft maintenance + up to 63 new narrowbody aircraftor up to 21 new widebody aircraft
(over 4 years)
‒ Average $2b1 reinvestment per annum, subject to escalation and currency fluctuations
‒ Under this scenario, Qantas Group fleet can be replaced within 20–25 years
‒ Spend on new aircraft vs aircraft maintenance is determined based on the best economic and customer outcomes
‒ Flexibility to adjust delivery schedules to maintain Financial Framework settings
‒ Growth investment will be in addition to average $2b1 per annum
3
FY21 FY22 FY23-FY27
Qantas Investor Day 2019 | 43
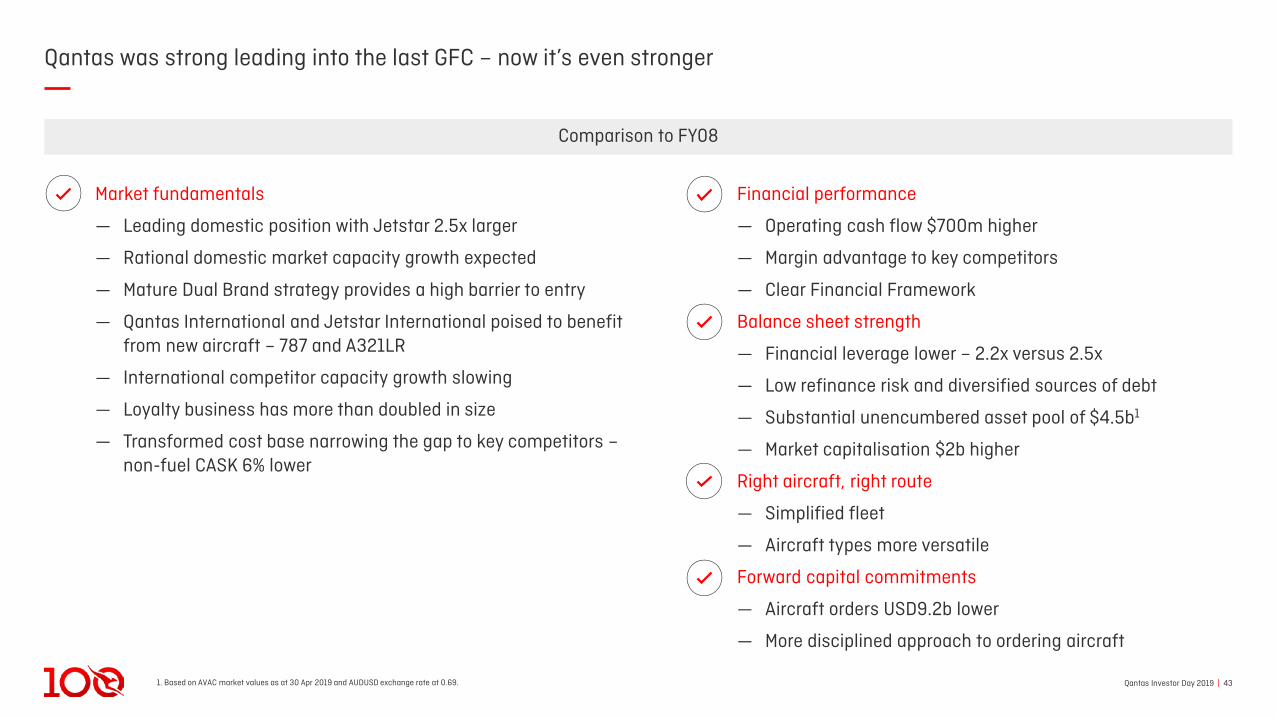
Qantas was strong leading into the last GFC – now it’s even stronger
Financial performance
— Operating cash flow $700m higher
— Margin advantage to key competitors
— Clear Financial Framework
Balance sheet strength
— Financial leverage lower – 2.2x versus 2.5x
— Low refinance risk and diversified sources of debt
— Substantial unencumbered asset pool of $4.5b1
— Market capitalisation $2b higher
Right aircraft, right route
— Simplified fleet
— Aircraft types more versatile
Forward capital commitments
— Aircraft orders USD9.2b lower
— More disciplined approach to ordering aircraft
Market fundamentals
— Leading domestic position with Jetstar 2.5x larger
— Rational domestic market capacity growth expected
— Mature Dual Brand strategy provides a high barrier to entry
— Qantas International and Jetstar International poised to benefit from new aircraft – 787 and A321LR
— International competitor capacity growth slowing
— Loyalty business has more than doubled in size
— Transformed cost base narrowing the gap to key competitors –non-fuel CASK 6% lower
Comparison to FY08
1. Based on AVAC market values as at 30 Apr 2019 and AUDUSD exchange rate at 0.69.
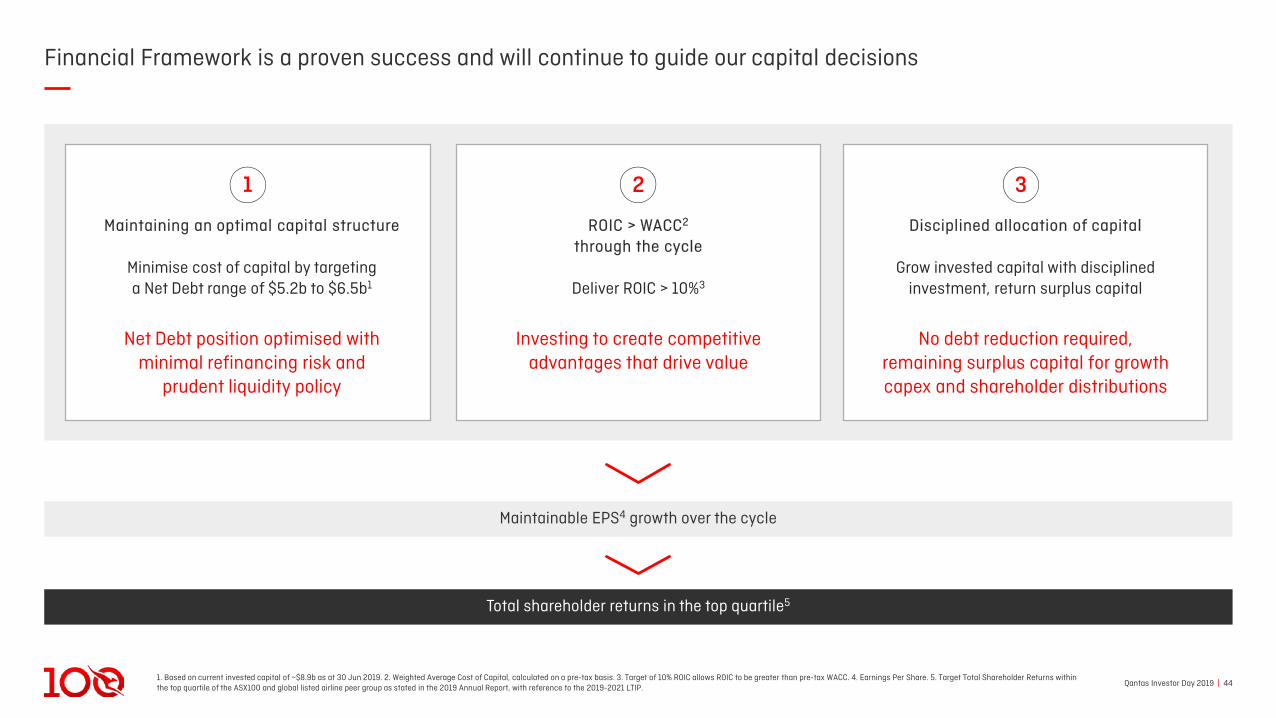
Qantas Investor Day 2019 | 441. Based on current invested capital of ~$8.9b as at 30 Jun 2019. 2. Weighted Average Cost of Capital, calculated on a pre-tax basis. 3. Target of 10% ROIC allows ROIC to be greater than pre-tax WACC. 4. Earnings Per Share. 5. Target Total Shareholder Returns within the top quartile of the ASX100 and global listed airline peer group as stated in the 2019 Annual Report, with reference to the 2019-2021 LTIP.
Financial Framework is a proven success and will continue to guide our capital decisions
Maintaining an optimal capital structure
Minimise cost of capital by targetinga Net Debt range of $5.2b to $6.5b1
Net Debt position optimised withminimal refinancing risk and
prudent liquidity policy
1
ROIC > WACC2
through the cycle
Deliver ROIC > 10%3
Investing to create competitive advantages that drive value
2
Disciplined allocation of capital
Grow invested capital with disciplined investment, return surplus capital
No debt reduction required, remaining surplus capital for growth capex and shareholder distributions
3
Total shareholder returns in the top quartile5
Maintainable EPS4 growth over the cycle

Transformation: Past, presentand future
Qantas Investor Day 2019 | 46
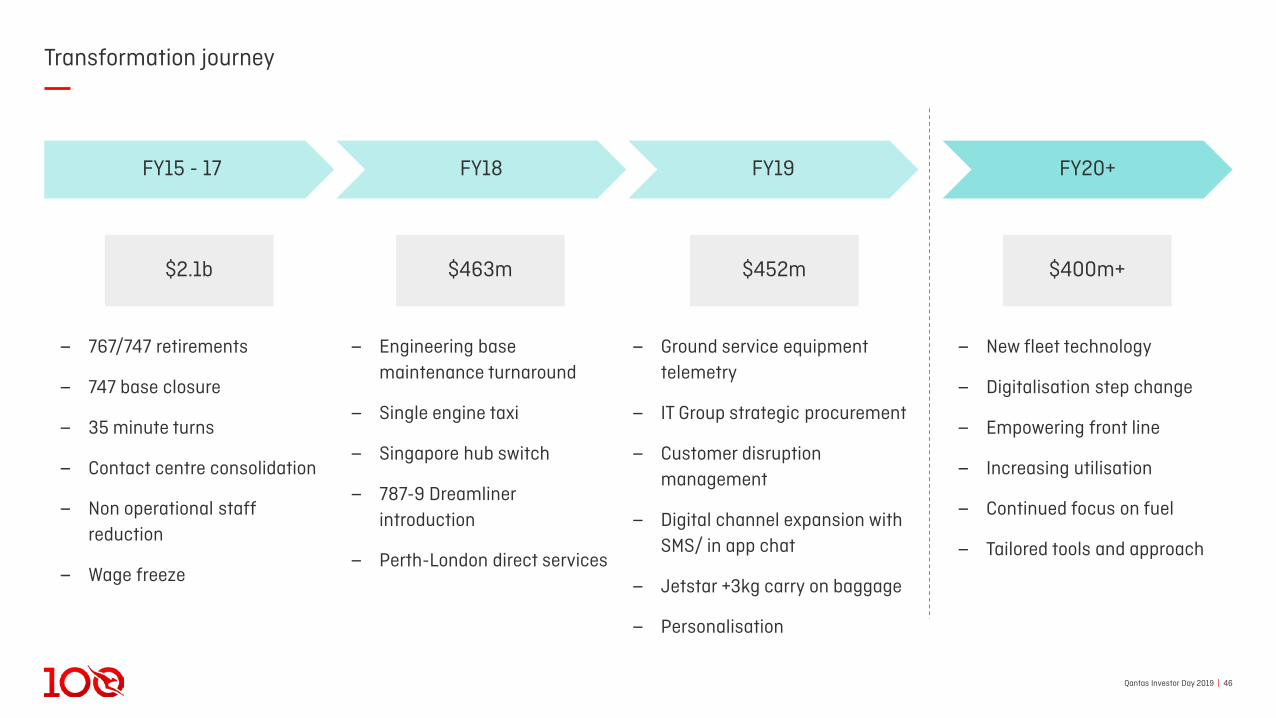
Transformation journey
$2.1b $463m $452m
FY15 - 17 FY18 FY19
$400m+
FY20+
‒ Engineering base maintenance turnaround
‒ Single engine taxi
‒ Singapore hub switch
‒ 787-9 Dreamliner introduction
‒ Perth-London direct services
‒ Ground service equipment telemetry
‒ IT Group strategic procurement
‒ Customer disruption management
‒ Digital channel expansion with SMS/ in app chat
‒ Jetstar +3kg carry on baggage
‒ Personalisation
‒ New fleet technology
‒ Digitalisation step change
‒ Empowering front line
‒ Increasing utilisation
‒ Continued focus on fuel
‒ Tailored tools and approach
‒ 767/747 retirements
‒ 747 base closure
‒ 35 minute turns
‒ Contact centre consolidation
‒ Non operational staff reduction
‒ Wage freeze
Qantas Investor Day 2019 | 47
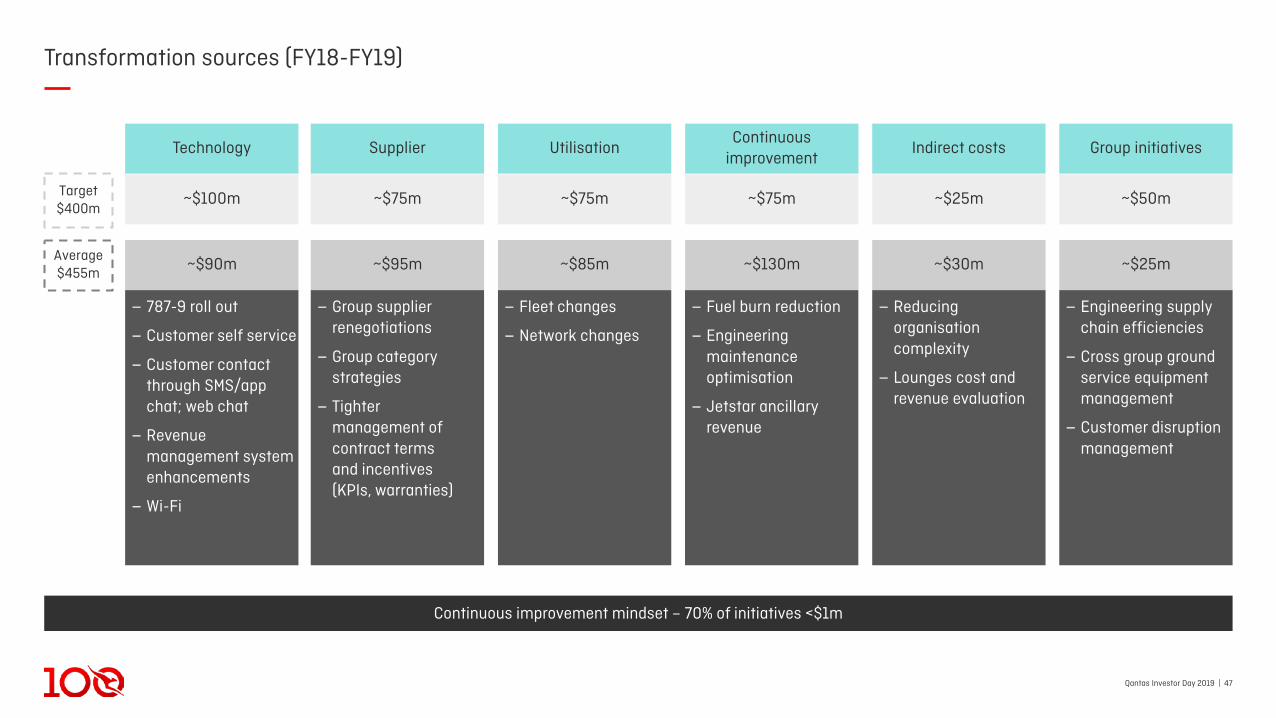
Transformation sources (FY18-FY19)
Target$400m
Average$455m
Technology
~$100m
~$90m
Continuous improvement mindset – 70% of initiatives <$1m
Supplier
~$75m
~$95m
‒ Group supplier renegotiations
‒ Group category strategies
‒ Tightermanagement of contract termsand incentives(KPIs, warranties)
Utilisation
~$75m
~$85m
‒ Fleet changes
‒ Network changes
Continuous improvement
~$75m
~$130m
‒ Fuel burn reduction
‒ Engineering maintenance optimisation
‒ Jetstar ancillary revenue
Indirect costs
~$25m
~$30m
‒ Reducing organisation complexity
‒ Lounges cost and revenue evaluation
Group initiatives
~$50m
~$25m
‒ Engineering supply chain efficiencies
‒ Cross group ground service equipment management
‒ Customer disruption management
‒ 787-9 roll out
‒ Customer self service
‒ Customer contact through SMS/app chat; web chat
‒ Revenue management system enhancements
‒ Wi-Fi
Qantas Investor Day 2019 | 48
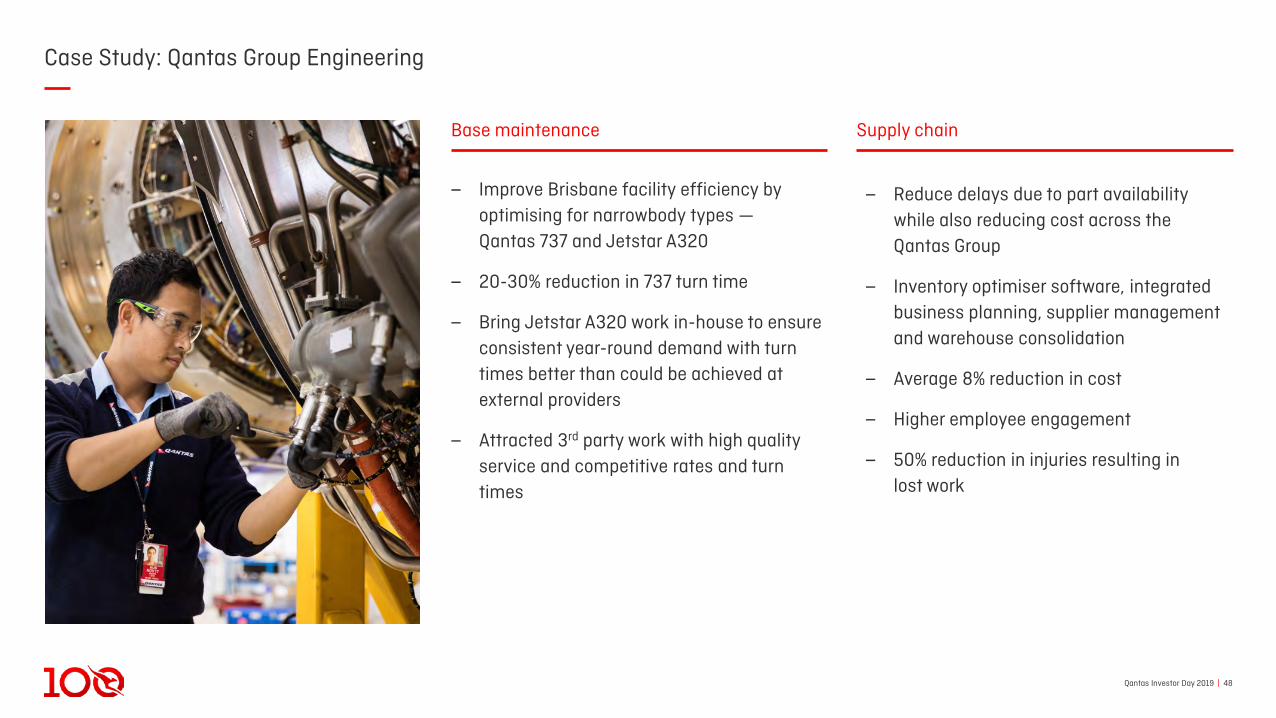
Case Study: Qantas Group Engineering
‒ Improve Brisbane facility efficiency by optimising for narrowbody types —Qantas 737 and Jetstar A320
‒ 20-30% reduction in 737 turn time
‒ Bring Jetstar A320 work in-house to ensure consistent year-round demand with turn times better than could be achieved at external providers
‒ Attracted 3rd party work with high quality service and competitive rates and turn times
‒ Reduce delays due to part availability while also reducing cost across the Qantas Group
‒ Inventory optimiser software, integrated business planning, supplier management and warehouse consolidation
‒ Average 8% reduction in cost
‒ Higher employee engagement
‒ 50% reduction in injuries resulting inlost work
Base maintenance Supply chain
Qantas Investor Day 2019 | 49
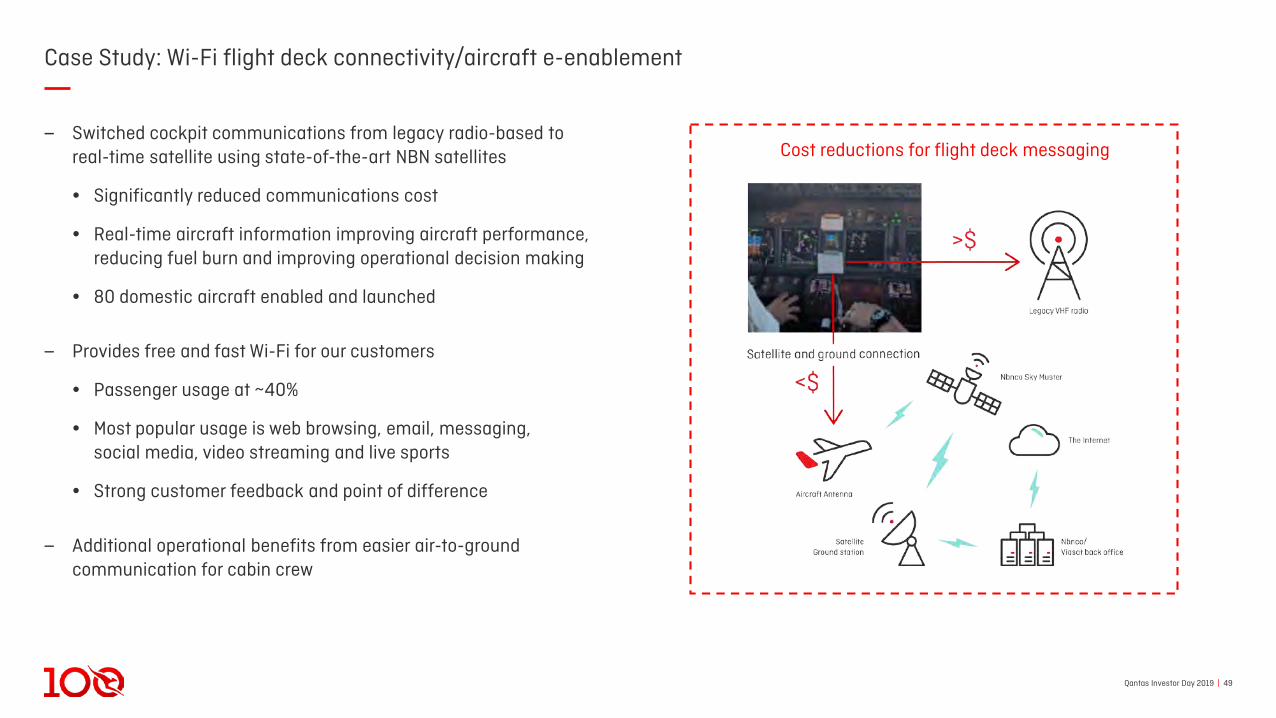
Case Study: Wi-Fi flight deck connectivity/aircraft e-enablement
‒ Switched cockpit communications from legacy radio-based to real-time satellite using state-of-the-art NBN satellites
• Significantly reduced communications cost
• Real-time aircraft information improving aircraft performance, reducing fuel burn and improving operational decision making
• 80 domestic aircraft enabled and launched
‒ Provides free and fast Wi-Fi for our customers
• Passenger usage at ~40%
• Most popular usage is web browsing, email, messaging,social media, video streaming and live sports
• Strong customer feedback and point of difference
‒ Additional operational benefits from easier air-to-ground communication for cabin crew
Cost reductions for flight deck messaging
Qantas Investor Day 2019 | 50
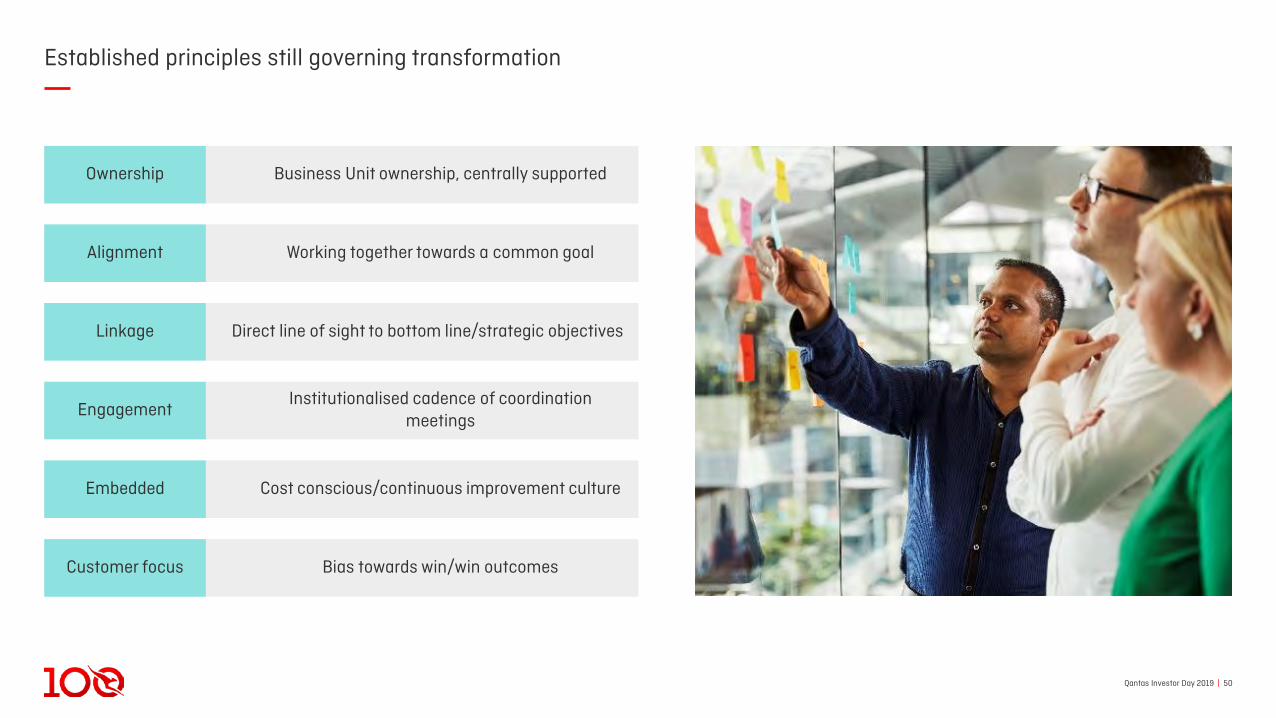
Established principles still governing transformation
Business Unit ownership, centrally supportedOwnership
Working together towards a common goalAlignment
Direct line of sight to bottom line/strategic objectivesLinkage
Cost conscious/continuous improvement cultureEmbedded
Institutionalised cadence of coordination meetings
Engagement
Bias towards win/win outcomesCustomer focus
Qantas Investor Day 2019 | 511. Intelligent Process Automation. 2. Artificial Intelligence.
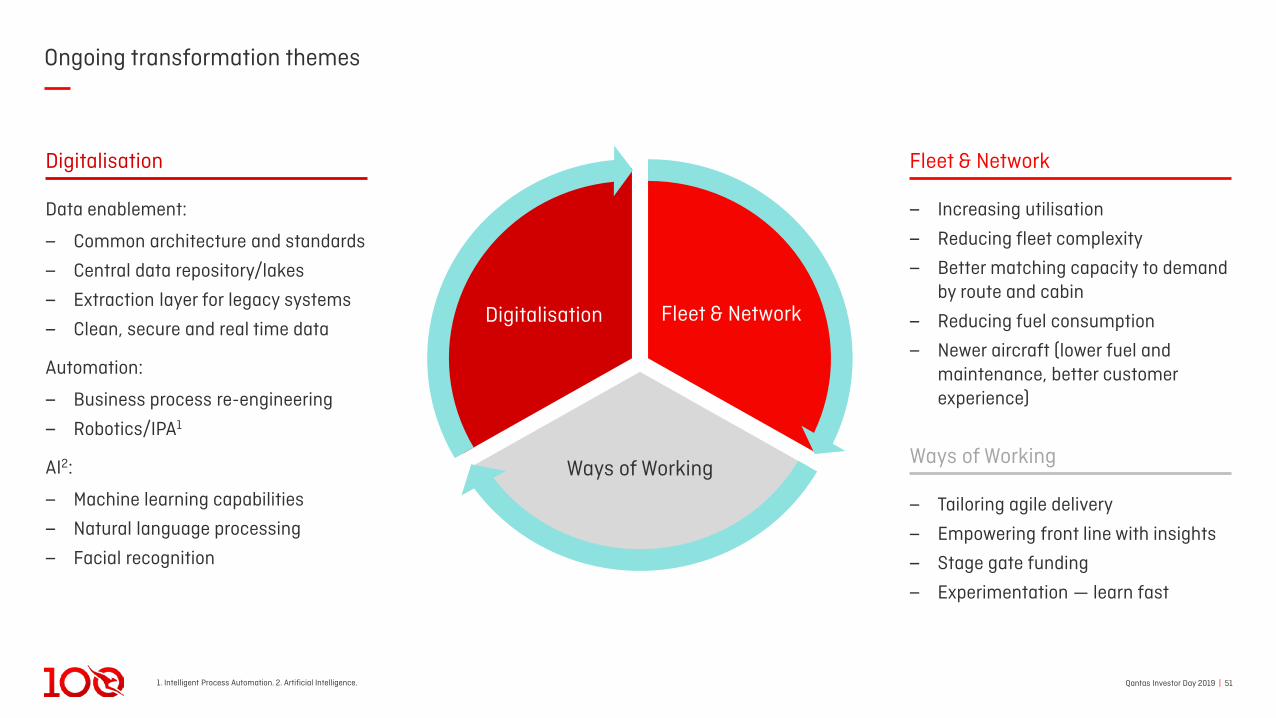
Ongoing transformation themes
Ways of Working
Fleet & NetworkDigitalisation
‒ Increasing utilisation
‒ Reducing fleet complexity
‒ Better matching capacity to demand by route and cabin
‒ Reducing fuel consumption
‒ Newer aircraft (lower fuel and maintenance, better customer experience)
Fleet & Network
‒ Tailoring agile delivery
‒ Empowering front line with insights
‒ Stage gate funding
‒ Experimentation — learn fast
Ways of Working
Data enablement:
‒ Common architecture and standards
‒ Central data repository/lakes
‒ Extraction layer for legacy systems
‒ Clean, secure and real time data
Automation:
‒ Business process re-engineering
‒ Robotics/IPA1
AI2:
‒ Machine learning capabilities
‒ Natural language processing
‒ Facial recognition
Digitalisation
Qantas Investor Day 2019 | 521. Artificial Intelligence. 2. Accelerated Processing Unit. 3. Ground Services Equipment. 4. Intelligent Process Automation.
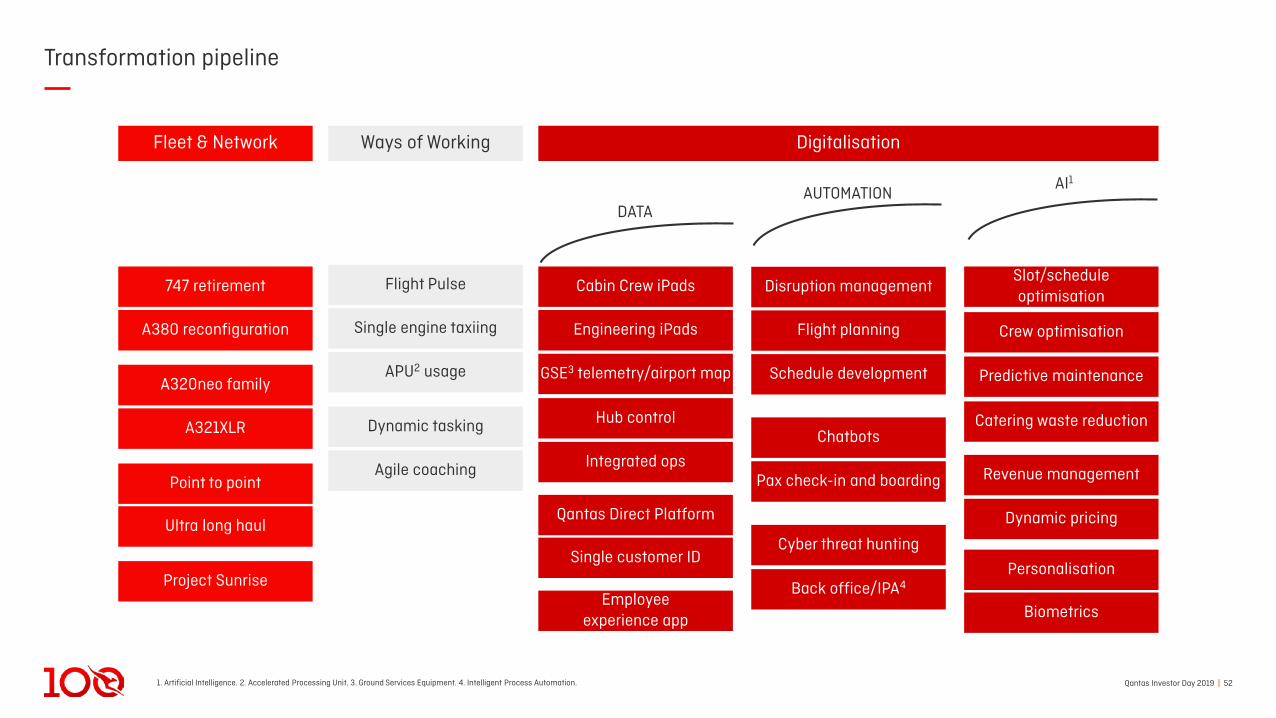
Transformation pipeline
DATAAUTOMATION
AI1
Fleet & Network Ways of Working Digitalisation
747 retirement
Point to point
A380 reconfiguration
A321XLR
A320neo family
Ultra long haul
Project Sunrise
Dynamic tasking
Single engine taxiing
Flight Pulse
Agile coaching
APU2 usage
Flight planning
Schedule development
Disruption management
Chatbots
Pax check-in and boarding
Cyber threat hunting
Back office/IPA4
Revenue management
Personalisation
Crew optimisation
Slot/schedule optimisation
Dynamic pricing
Biometrics
Predictive maintenance
Catering waste reduction
Qantas Direct Platform
Cabin Crew iPads
GSE3 telemetry/airport map
Engineering iPads
Single customer ID
Hub control
Integrated ops
Employee experience app

Qantas Investor Day 2019 | 53
Case study: Frontline empowerment
‒ Airport mapping system integrates Ground Services Equipment telemetry with operations status
‒ Allows controller to allocate equipment in real-time
‒ Ground Services Equipment readiness for high aircraft utilisation
‒ Multiple asset types on airport ramp at any time
‒ Enables better safety outcomes, maintenance plans, equipment rationalisation and fuel benefits
‒ Integrated operations app directly links frontline to Ops Centre increasing situational awareness
‒ Empowers frontline for best customer service
‒ Enables proactive management of delay causes
‒ Increases workforce productivity and engagement
‒ Green initiative — reduces paper based reporting
Above the Wing Below the Wing

Qantas Investor Day 2019 | 541. Artificial Intelligence.
Case study: Revenue management technology
‒ Better decisions to recommend the right price at the right time
‒ Internal application developed utilising Qantas expertise and relationships with leading universities:
• Leveraging datasets
• Opportunities unlocked via AI1 (machine learning)
• Scalability and agility utilising technology such as cloud computing
‒ Enhancements deliver tangible benefits:
• Return on investment of 8x
• Quicker decision making increasing number of price points driving greater efficiency and revenue
• Lower cost of R&D by utilising in-house and university expertise
‒ Further opportunities to evolve with additional data, real time price evaluation and offer creation capability within our digital channels
Qantas Investor Day 2019 | 551. Sydney Kingsford Smith Airport. 2. Brisbane Airport. 3. Los Angeles International Airport.
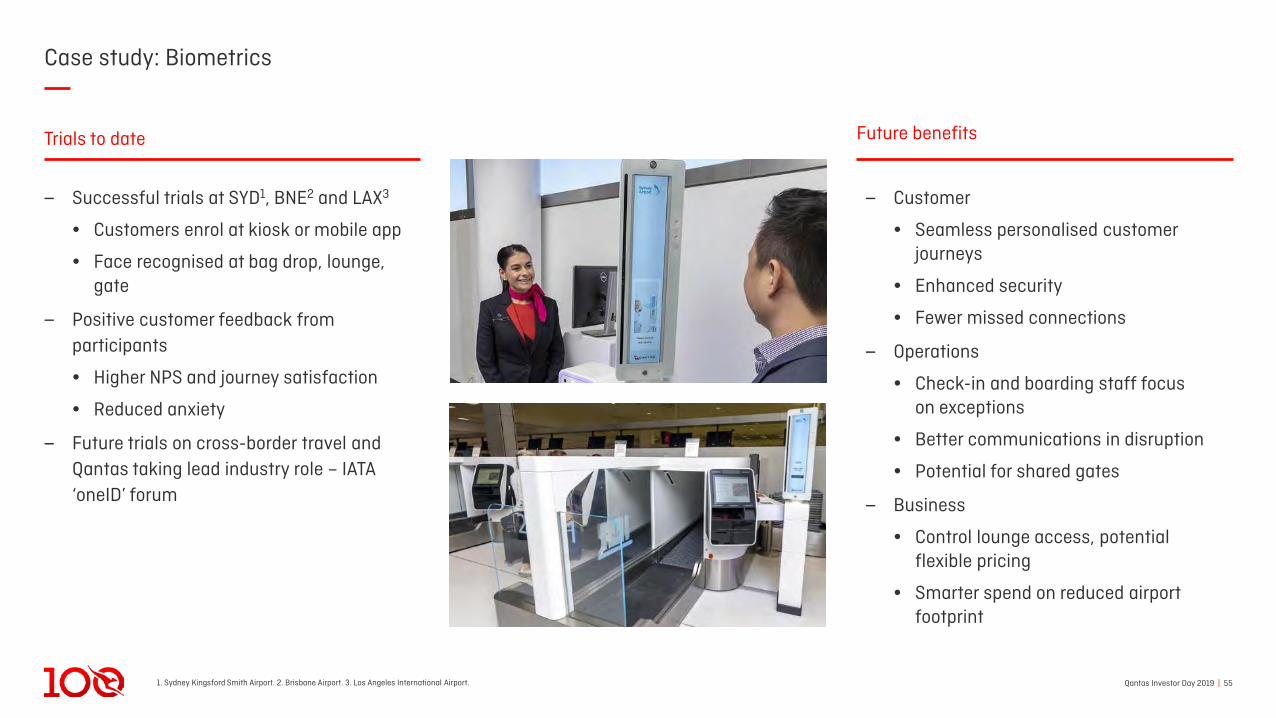
Case study: Biometrics
‒ Successful trials at SYD1, BNE2 and LAX3
• Customers enrol at kiosk or mobile app
• Face recognised at bag drop, lounge, gate
‒ Positive customer feedback from participants
• Higher NPS and journey satisfaction
• Reduced anxiety
‒ Future trials on cross-border travel and Qantas taking lead industry role – IATA ‘oneID’ forum
‒ Customer
• Seamless personalised customer journeys
• Enhanced security
• Fewer missed connections
‒ Operations
• Check-in and boarding staff focuson exceptions
• Better communications in disruption
• Potential for shared gates
‒ Business
• Control lounge access, potentialflexible pricing
• Smarter spend on reduced airport footprint
Trials to date Future benefits
Qantas Investor Day 2019 | 561. Artificial Intelligence.
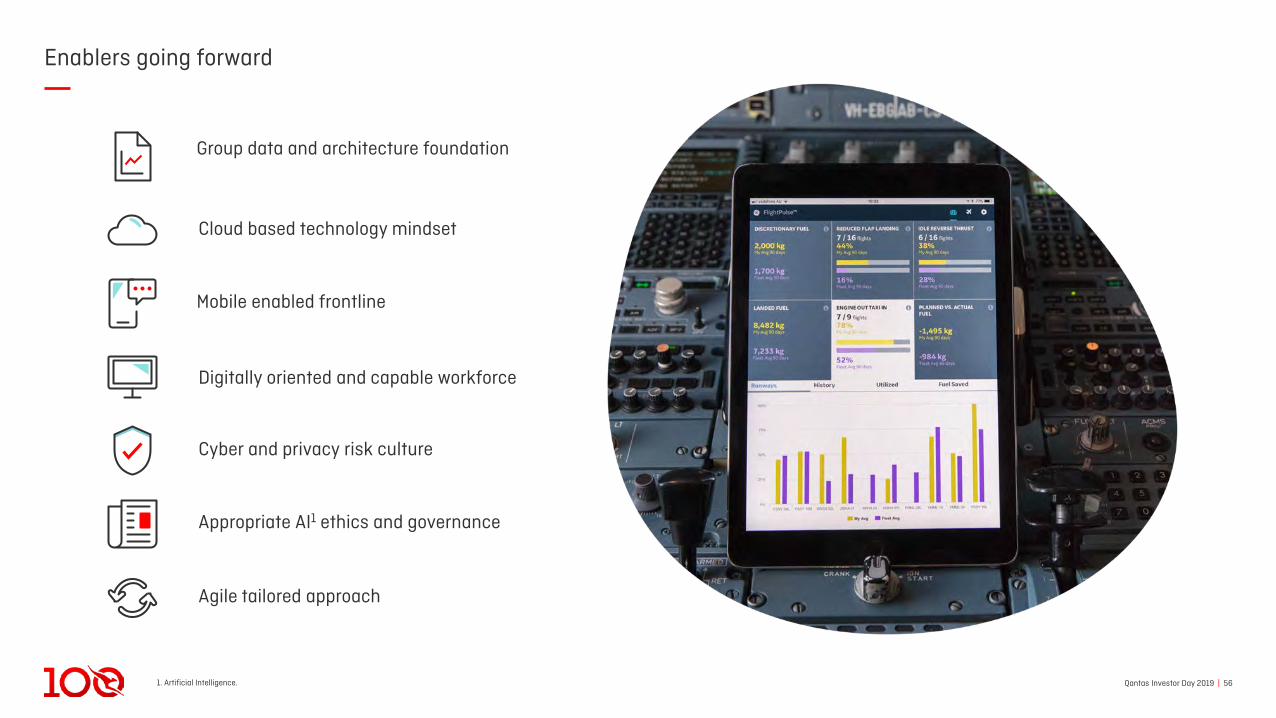
Enablers going forward
Cloud based technology mindset
Mobile enabled frontline
Digitally oriented and capable workforce
Cyber and privacy risk culture
Appropriate AI1 ethics and governance
Agile tailored approach
Group data and architecture foundation

Qantas Investor Day 2019 | 57
Transformation summary
‒ Proven track record of delivery
‒ Robust transformation pipeline and emerging areas for benefit realisation
‒ Clear link to outcomes and strategic objectives
‒ Established principles still governing transformation
‒ Commitment to minimum $400m in new benefits per annum
‒ FY20 more focussed on cost than revenue compared to previous years
Operational
efficiency
Ways of Working
Fleet & NetworkDigitalisation
Revenue optimisation
Customer experience
Empowering employees
FY20 focus
Qantas Investor Day 2019 | 58
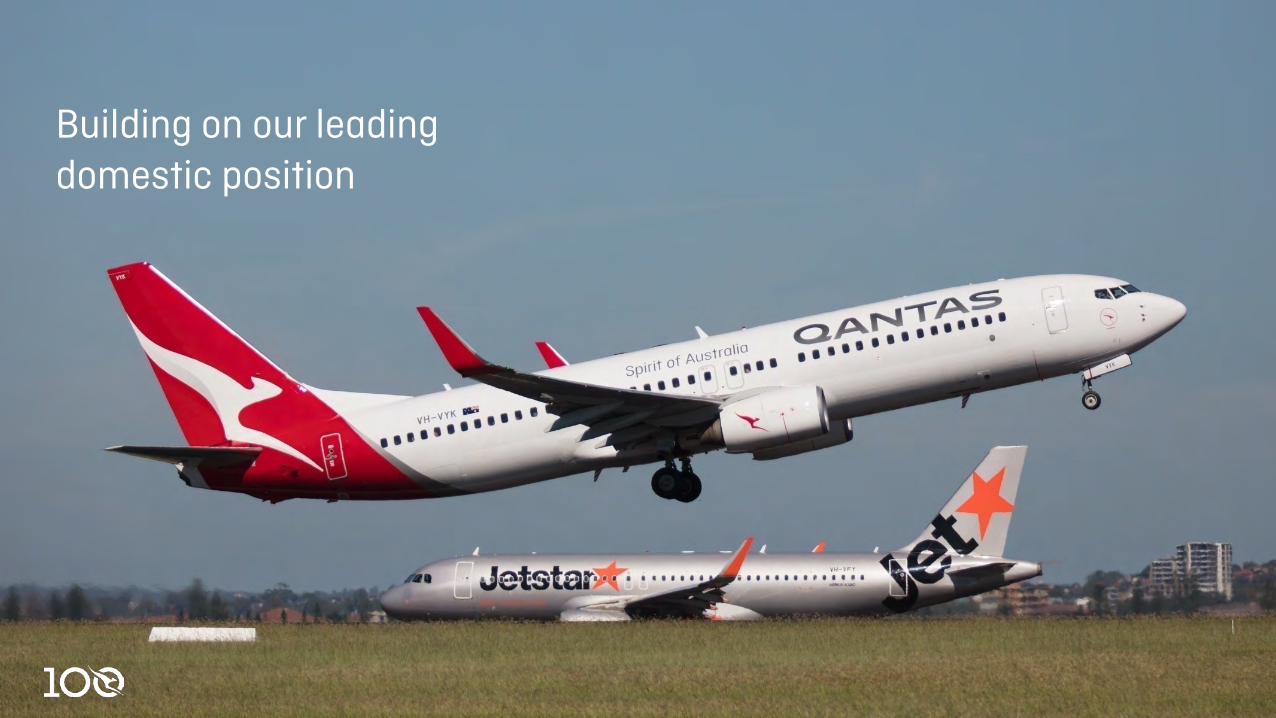
Building on our leading domestic position

Qantas Investor Day 2019 | 591. In real terms. 2. SYD; Sydney Kingsford Smith Airport. MEL; Melbourne Tullamarine Airport. BNE; Brisbane Airport. Busiest domestic routes globally. Source: OAG Aviation Worldwide Limited ‘Busiest Routes 2019’ report. 3. Passenger segments flown FY19. Source: BITRE. 4. Growth versus prior year. Source: BITRE.
Structural advantage in the Australian domestic market
Domestic market capacity evolution (ASK)4Market dynamics and stability
‒ Australian economy stable and resilient over the long term
‒ Population concentrated in large cities separated by large distances
‒ Two airline groups have 98% capacity share, customer well served; two full service and two low cost carriers in market
‒ Fares 30% lower now than 13 years ago1
‒ Market capacity has been increasingly disciplined over last 5 years
Infrastructure factors
‒ Sydney and Melbourne airports are becoming increasingly constrained; SYD-MEL is the 2nd busiest and SYD-BNE the 12th busiest route globally2
‒ 44% of domestic journeys3 touch SYD2 where the Group has 50% of slots
‒ Western Sydney Airport to provide future relief, but Kingsford-Smith Airport to still be business traveller preferred
‒ Alternative technologies not economically attractive
FY18FY13 FY14FY12 FY19
1.7%
FY15 FY16 FY17
7.5%
2.2%
(-1.4%)
0.7%
(-0.5%)
0.1% 0.0%
Year on year capacity growth

Qantas Investor Day 2019 | 60
Improved leadership position on key success measures
1. Qantas Group share is comprised of Qantas Domestic and Jetstar Domestic. EBIT in FY19 restated for changes associated with the first time adoption of AASB 15. 2. Others is comprised of Virgin Australia Domestic and Tigerair Australia using published data for FY19. 3. Small-to-Medium Enterprise.
Growing the domestic contribution
Domestic market EBIT evolution ($B)
FY17
0.2
FY15
1.3
0.60.8
FY16
0.1
0.10.2
0.91.1
FY18
1.0
FY19
0.7
1.0 0.9
1.1
Others2Qantas Group1
Customer satisfactionNet Promoter Score advantage
Profit shareMargin advantage
Network advantageCorporate market share
SME3 market share Resource market shareLow fares penetration
0.1
Qantas Investor Day 2019 | 61
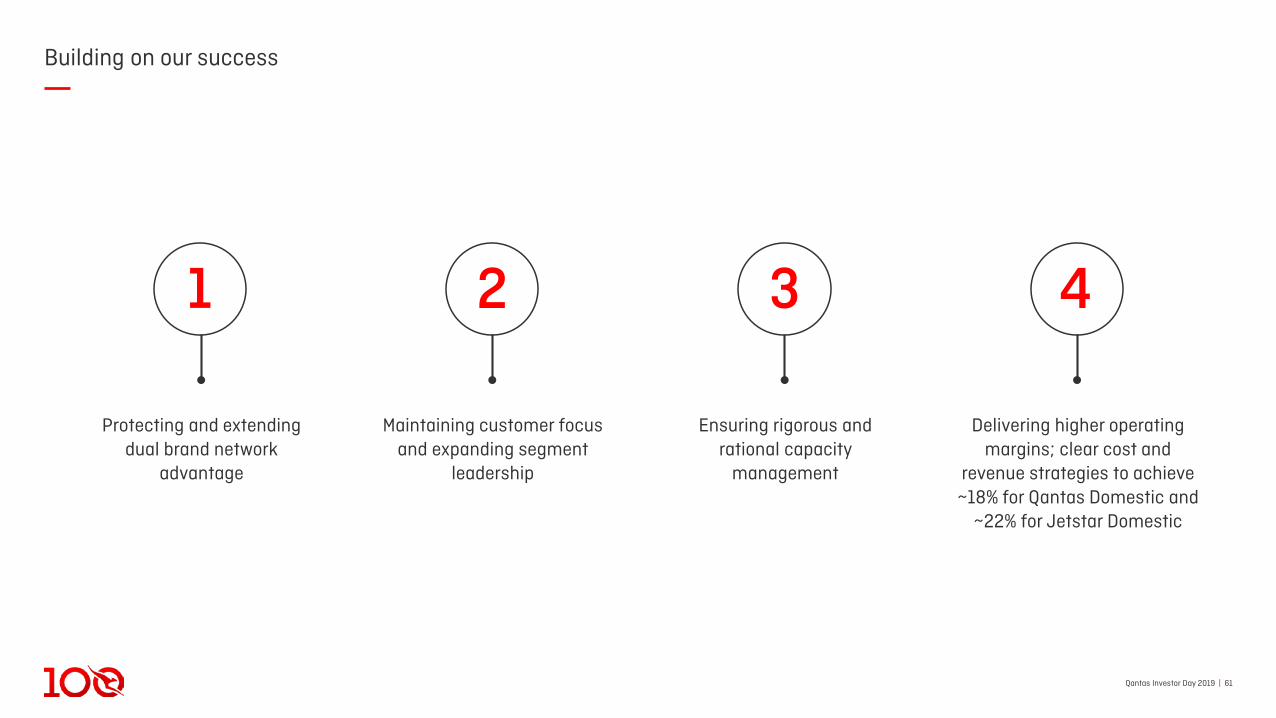
Building on our success
1 2 3 4
Protecting and extending dual brand network
advantage
Maintaining customer focus and expanding segment
leadership
Ensuring rigorous and rational capacity
management
Delivering higher operating margins; clear cost and
revenue strategies to achieve ~18% for Qantas Domestic and
~22% for Jetstar Domestic

Qantas Investor Day 2019 | 62
Continuously evolving our uniquely integrated network advantage
Leading business proposition
‒ Best frequency and schedule, including peak and super-peak hours
‒ Strongest domestic and international connectivity
‒ Most resource sector services in Western Australia and Queensland
Leading leisure proposition
‒ Most seats to top domestic and international leisure destinations
‒ Growing premium leisure footprint
‒ Largest low cost offer on all major leisure markets
Integrated Dual Brand strategy and management
‒ Joint views of demand
‒ Alignment to customer segmentation
‒ Extensive collaboration
1
Qantas Investor Day 2019 | 631. FY19 share of Qantas Domestic total revenue. 2. On Time Performance. 3. FY19 share of Jetstar Domestic total revenue.
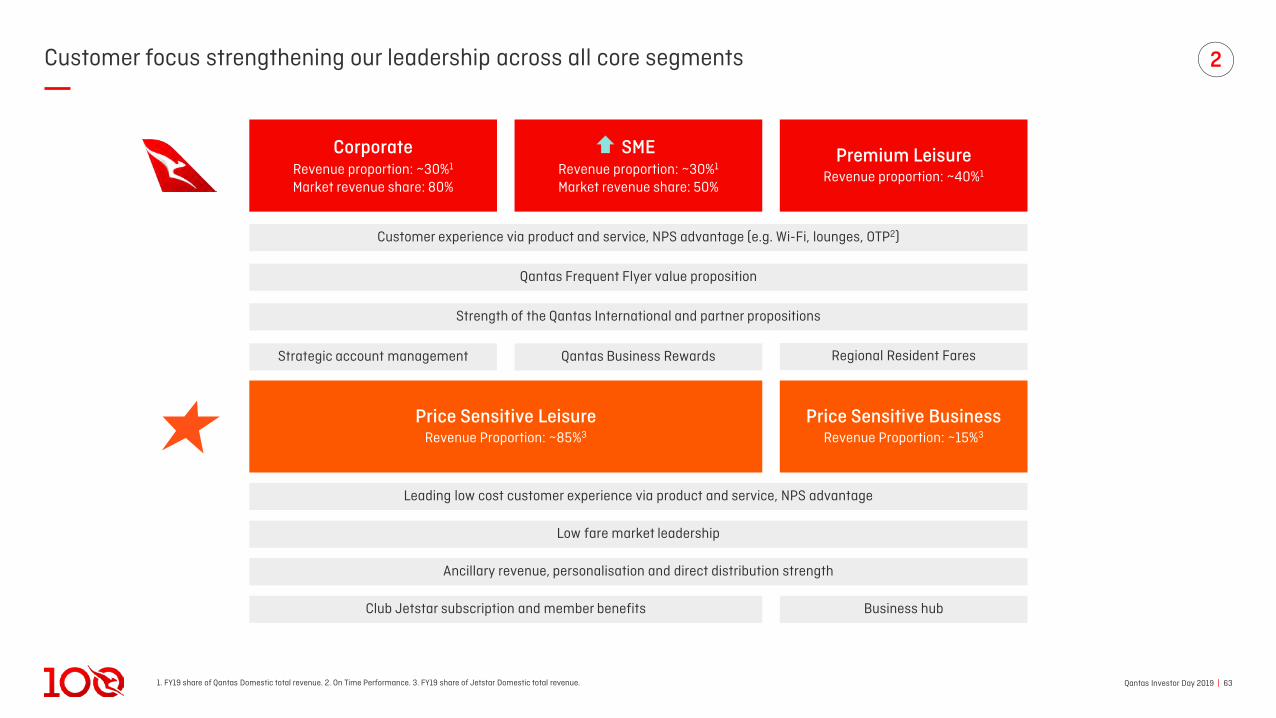
Customer focus strengthening our leadership across all core segments 2
Customer experience via product and service, NPS advantage (e.g. Wi-Fi, lounges, OTP2)
Strength of the Qantas International and partner propositions
Strategic account management Qantas Business Rewards Regional Resident Fares
Qantas Frequent Flyer value proposition
Price Sensitive LeisureRevenue Proportion: ~85%3
Price Sensitive BusinessRevenue Proportion: ~15%3
Leading low cost customer experience via product and service, NPS advantage
Low fare market leadership
Club Jetstar subscription and member benefits Business hub
Ancillary revenue, personalisation and direct distribution strength
CorporateRevenue proportion: ~30%1
Market revenue share: 80%
SMERevenue proportion: ~30%1
Market revenue share: 50%
Premium LeisureRevenue proportion: ~40%1
Qantas Investor Day 2019 | 64
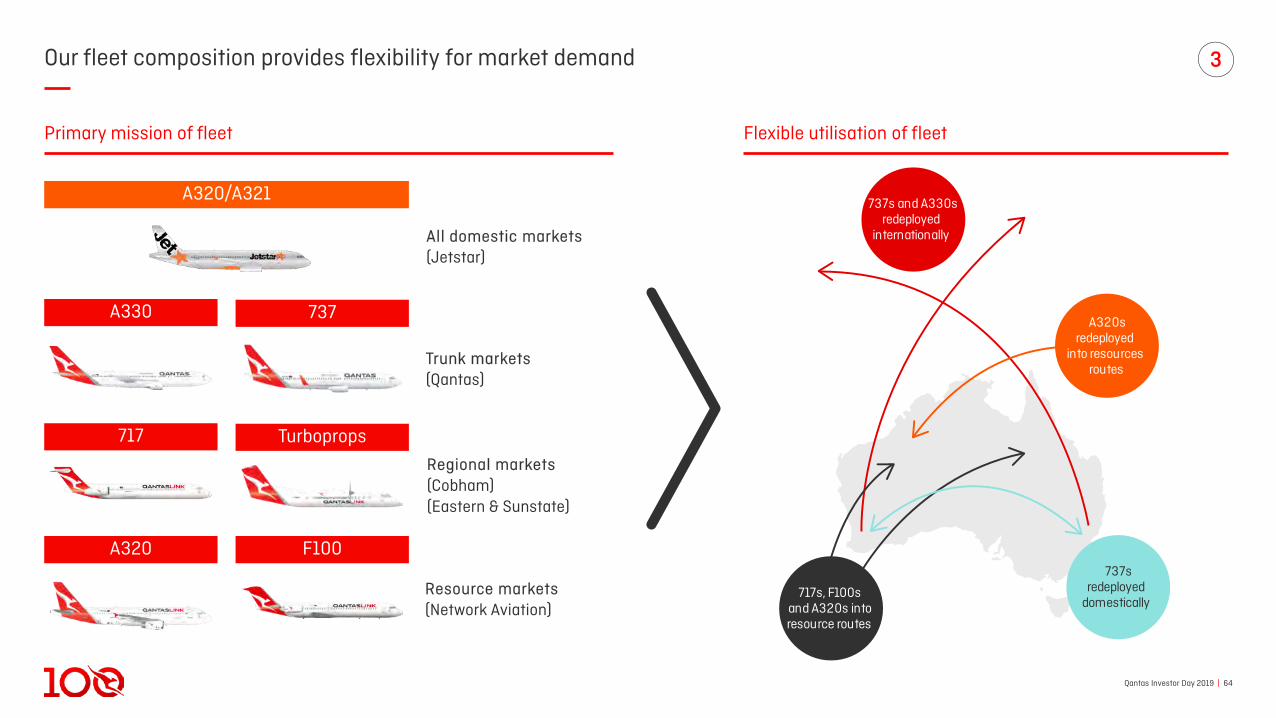
Our fleet composition provides flexibility for market demand 3
Turboprops
A320/A321
737A330
Trunk markets(Qantas)
Regional markets(Cobham)(Eastern & Sunstate)
All domestic markets(Jetstar)
717
Primary mission of fleet Flexible utilisation of fleet
F100A320
Resource markets(Network Aviation)
A320sredeployed
into resourcesroutes
737s redeployed
domestically717s, F100s
and A320s into resource routes
737s and A330s redeployed
internationally
Qantas Investor Day 2019 | 651. Domestic ASKs. Source: internal estimates of forward operating capacity growth based on BITRE published schedules and typical rates of cancellation. 2. Domestic market ASKs flown. Source: BITRE.
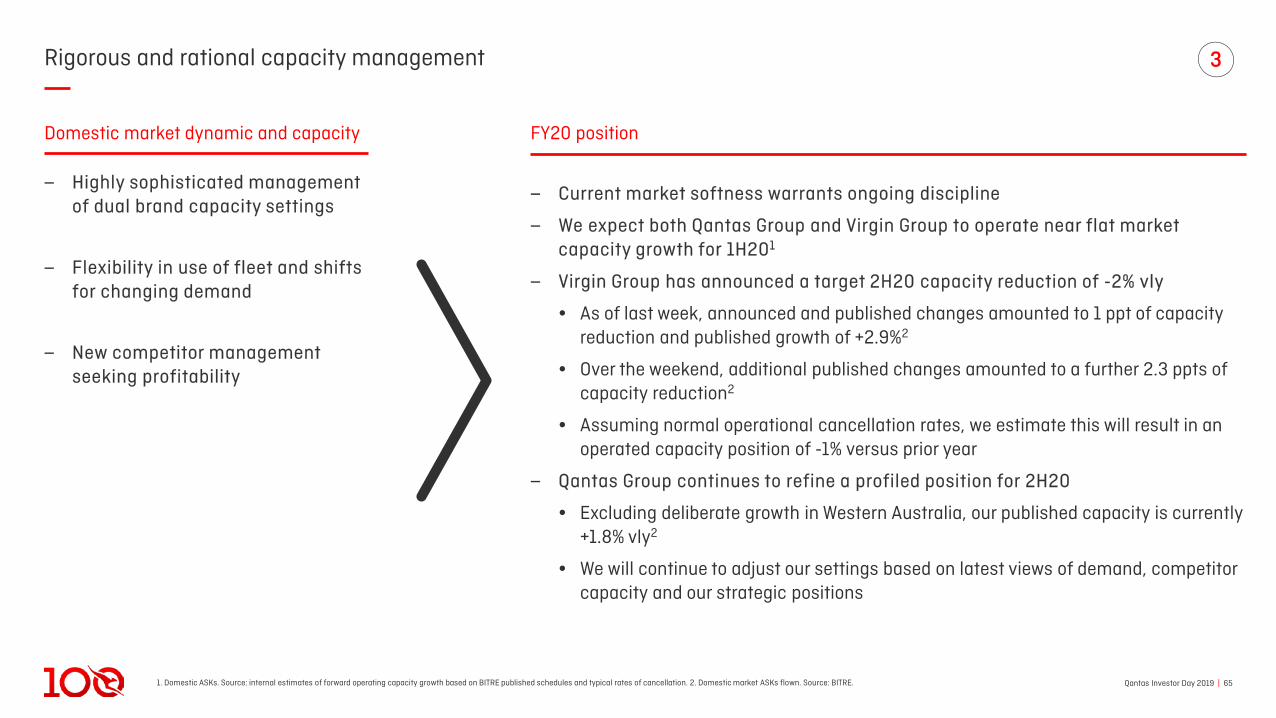
Rigorous and rational capacity management
‒ Highly sophisticated management of dual brand capacity settings
‒ Flexibility in use of fleet and shifts for changing demand
‒ New competitor management seeking profitability
3
Domestic market dynamic and capacity FY20 position
‒ Current market softness warrants ongoing discipline
‒ We expect both Qantas Group and Virgin Group to operate near flat market capacity growth for 1H201
‒ Virgin Group has announced a target 2H20 capacity reduction of -2% vly
• As of last week, announced and published changes amounted to 1 ppt of capacity reduction and published growth of +2.9%2
• Over the weekend, additional published changes amounted to a further 2.3 ppts of capacity reduction2
• Assuming normal operational cancellation rates, we estimate this will result in an operated capacity position of -1% versus prior year
‒ Qantas Group continues to refine a profiled position for 2H20
• Excluding deliberate growth in Western Australia, our published capacity is currently +1.8% vly2
• We will continue to adjust our settings based on latest views of demand, competitor capacity and our strategic positions
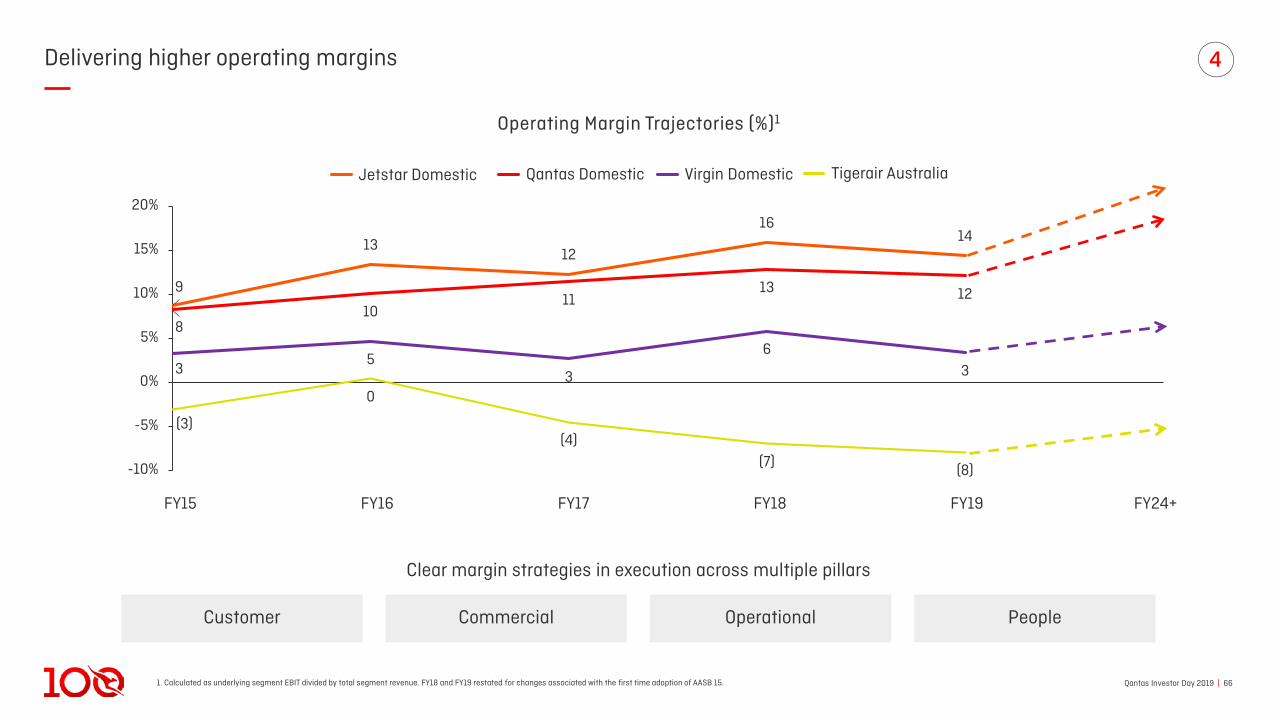
Qantas Investor Day 2019 | 661. Calculated as underlying segment EBIT divided by total segment revenue. FY18 and FY19 restated for changes associated with the first time adoption of AASB 15.
Delivering higher operating margins 4
810
1113 12
35
3
63
9
1312
1614
(3)
0
(4)(7) (8)-10%
-5%
0%
5%
10%
15%
20%
FY17FY16FY15 FY18 FY19
Customer Commercial Operational People
Clear margin strategies in execution across multiple pillars
Operating Margin Trajectories (%)1
Qantas Domestic Virgin DomesticJetstar Domestic Tigerair Australia
FY24+
Qantas Investor Day 2019 | 67
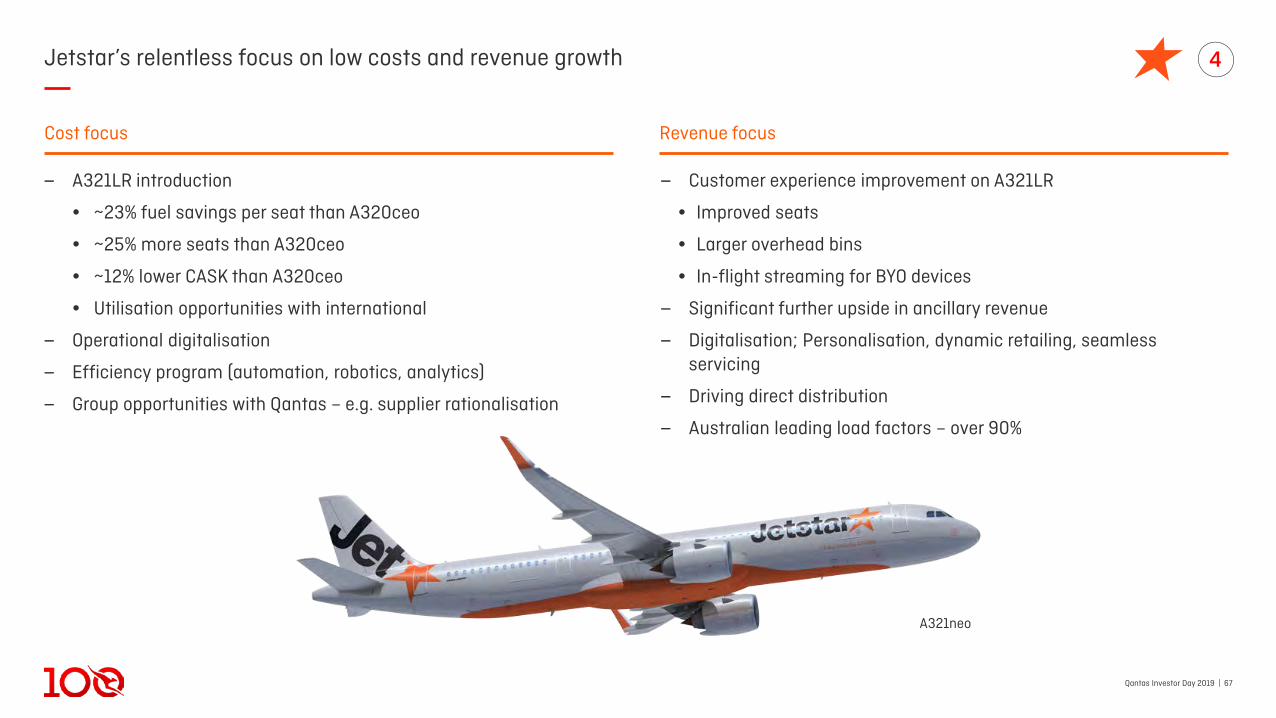
Jetstar’s relentless focus on low costs and revenue growth
‒ Customer experience improvement on A321LR
• Improved seats
• Larger overhead bins
• In-flight streaming for BYO devices
‒ Significant further upside in ancillary revenue
‒ Digitalisation; Personalisation, dynamic retailing, seamless servicing
‒ Driving direct distribution
‒ Australian leading load factors – over 90%
‒ A321LR introduction
• ~23% fuel savings per seat than A320ceo
• ~25% more seats than A320ceo
• ~12% lower CASK than A320ceo
• Utilisation opportunities with international
‒ Operational digitalisation
‒ Efficiency program (automation, robotics, analytics)
‒ Group opportunities with Qantas – e.g. supplier rationalisation
4
A321neo
Cost focus Revenue focus
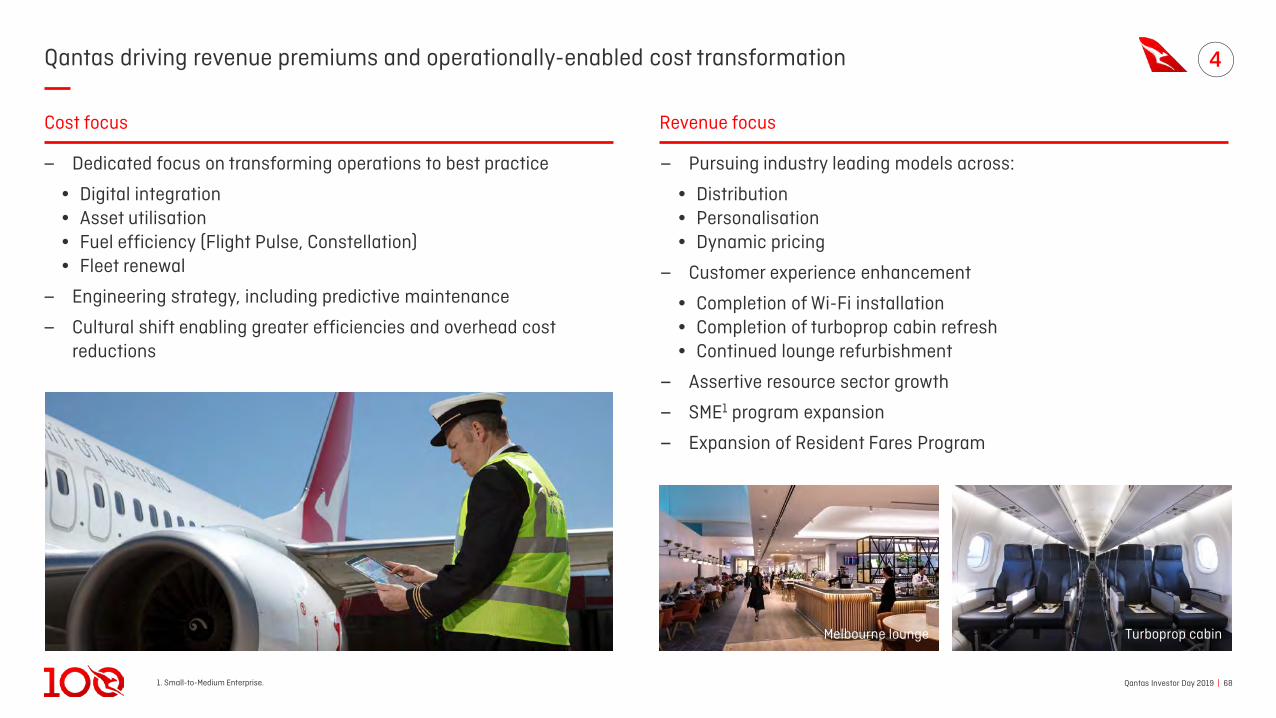
Qantas Investor Day 2019 | 681. Small-to-Medium Enterprise.
Qantas driving revenue premiums and operationally-enabled cost transformation
‒ Pursuing industry leading models across:
• Distribution• Personalisation• Dynamic pricing
‒ Customer experience enhancement
• Completion of Wi-Fi installation• Completion of turboprop cabin refresh• Continued lounge refurbishment
‒ Assertive resource sector growth
‒ SME1 program expansion
‒ Expansion of Resident Fares Program
‒ Dedicated focus on transforming operations to best practice
• Digital integration• Asset utilisation• Fuel efficiency (Flight Pulse, Constellation)• Fleet renewal
‒ Engineering strategy, including predictive maintenance
‒ Cultural shift enabling greater efficiencies and overhead cost reductions
4
Cost focus Revenue focus
Melbourne lounge Turboprop cabin
Qantas Investor Day 2019 | 69
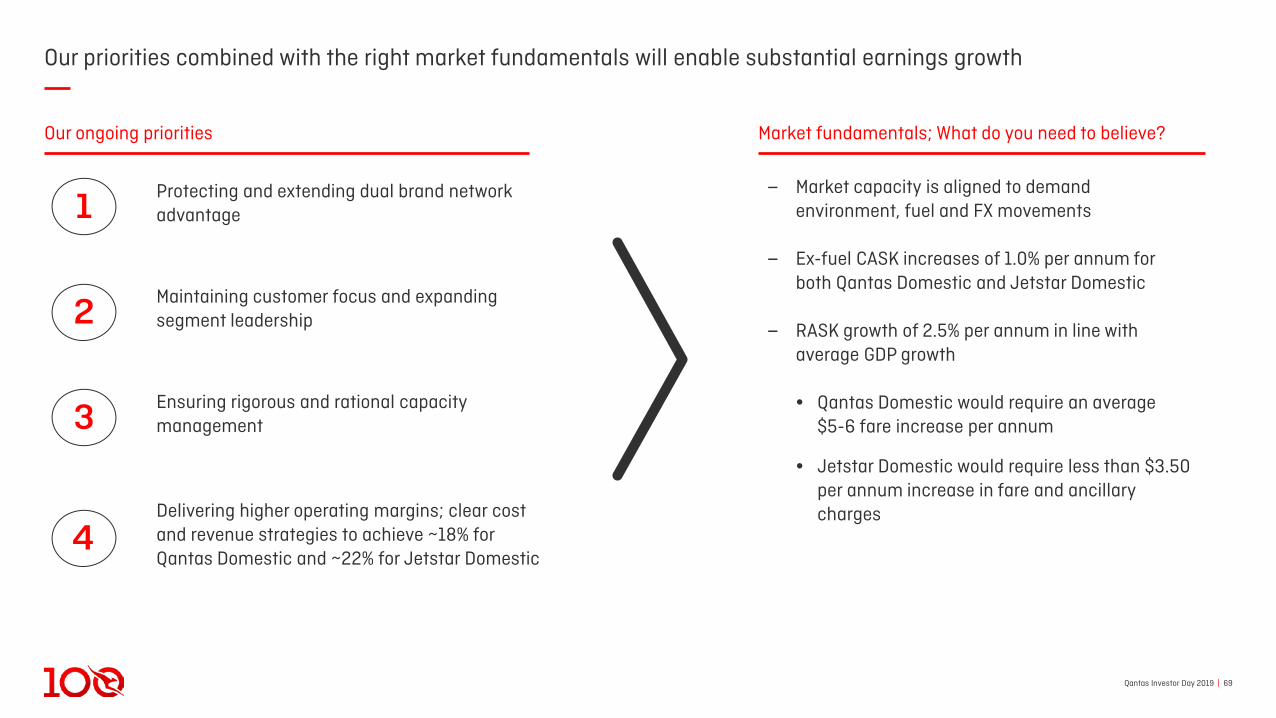
Our priorities combined with the right market fundamentals will enable substantial earnings growth
Delivering higher operating margins; clear cost and revenue strategies to achieve ~18% for Qantas Domestic and ~22% for Jetstar Domestic
4
Ensuring rigorous and rational capacity management3
Maintaining customer focus and expanding segment leadership2
Protecting and extending dual brand network advantage1
Our ongoing priorities Market fundamentals; What do you need to believe?
‒ Market capacity is aligned to demand environment, fuel and FX movements
‒ Ex-fuel CASK increases of 1.0% per annum for both Qantas Domestic and Jetstar Domestic
‒ RASK growth of 2.5% per annum in line with average GDP growth
• Qantas Domestic would require an average $5-6 fare increase per annum
• Jetstar Domestic would require less than $3.50 per annum increase in fare and ancillary charges

Qantas International:Building sustainable advantage
Qantas Investor Day 2019 | 711. Transformation benefits from FY15 to FY19 inclusive. 2. Weighted Average Cost of Capital, calculated on a pre-tax basis.
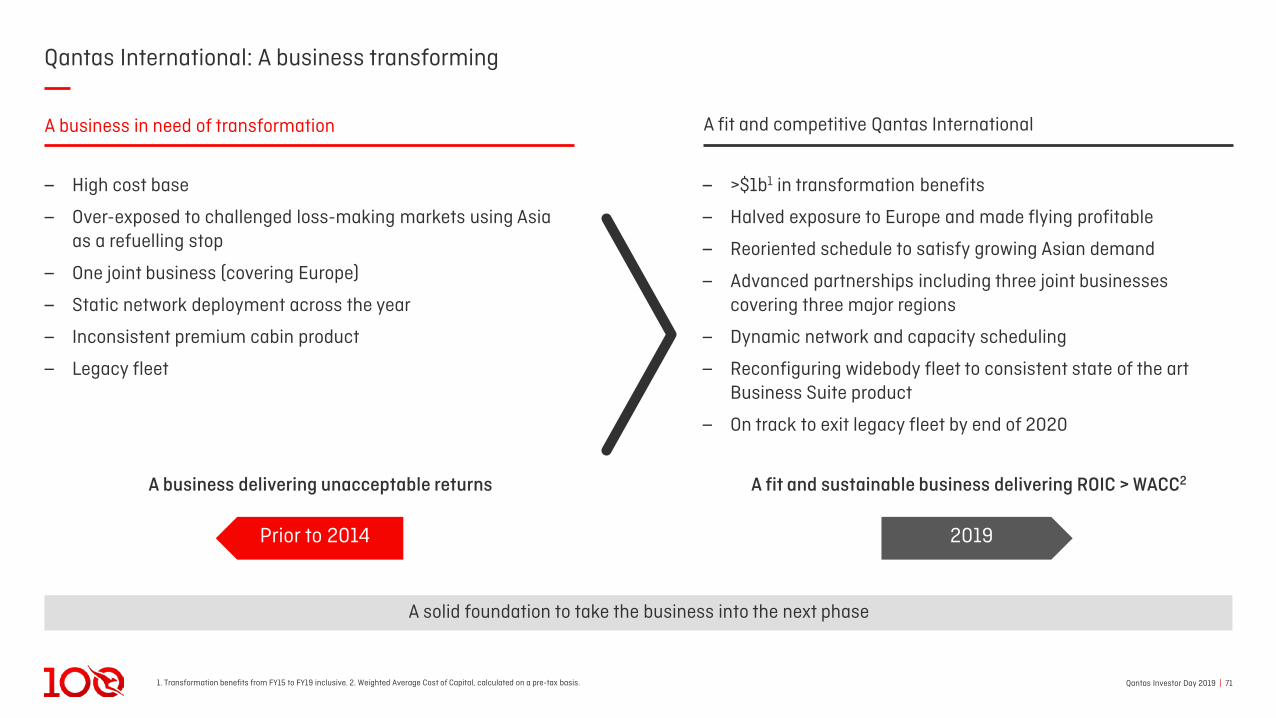
Qantas International: A business transforming
‒ >$1b1 in transformation benefits
‒ Halved exposure to Europe and made flying profitable
‒ Reoriented schedule to satisfy growing Asian demand
‒ Advanced partnerships including three joint businesses covering three major regions
‒ Dynamic network and capacity scheduling
‒ Reconfiguring widebody fleet to consistent state of the art Business Suite product
‒ On track to exit legacy fleet by end of 2020
‒ High cost base
‒ Over-exposed to challenged loss-making markets using Asia as a refuelling stop
‒ One joint business (covering Europe)
‒ Static network deployment across the year
‒ Inconsistent premium cabin product
‒ Legacy fleet
2019Prior to 2014
A solid foundation to take the business into the next phase
A fit and competitive Qantas InternationalA business in need of transformation
A business delivering unacceptable returns A fit and sustainable business delivering ROIC > WACC2
Qantas Investor Day 2019 | 72
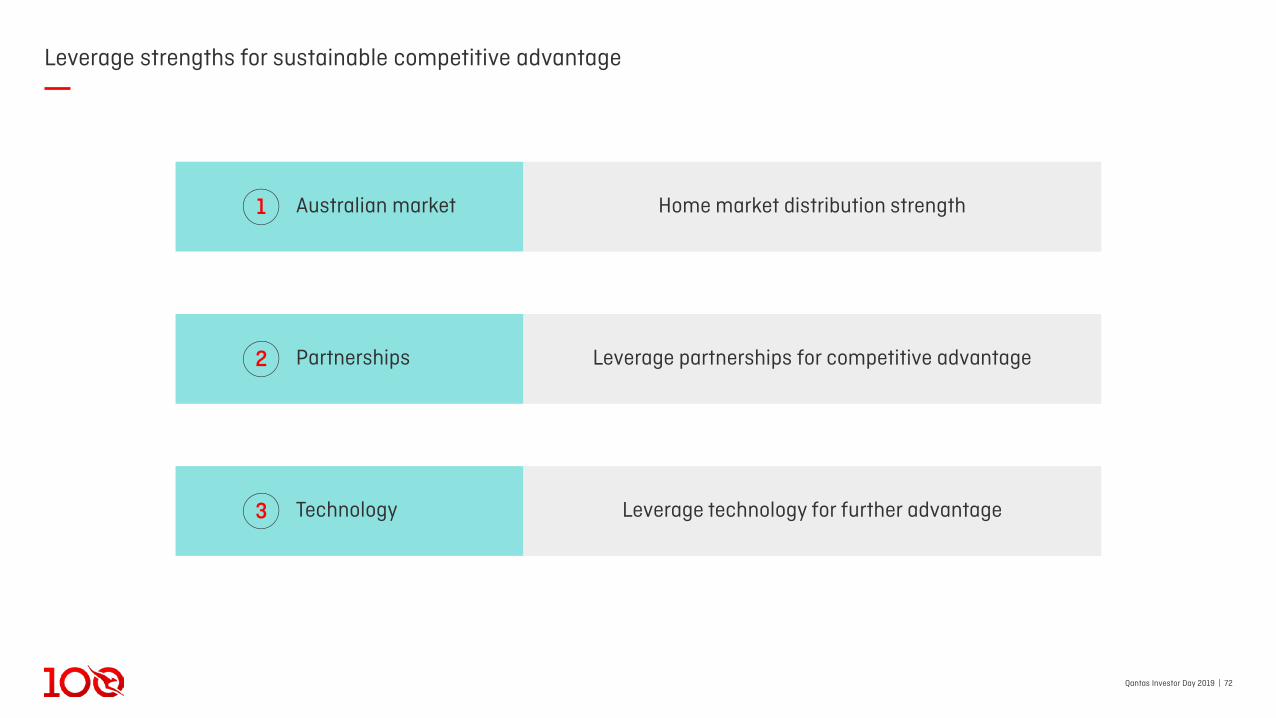
Leverage strengths for sustainable competitive advantage
Home market distribution strength
Leverage partnerships for competitive advantagePartnerships
Australian market
Leverage technology for further advantageTechnology
1
2
3
Qantas Investor Day 2019 | 731. Small-to-Medium Enterprise.
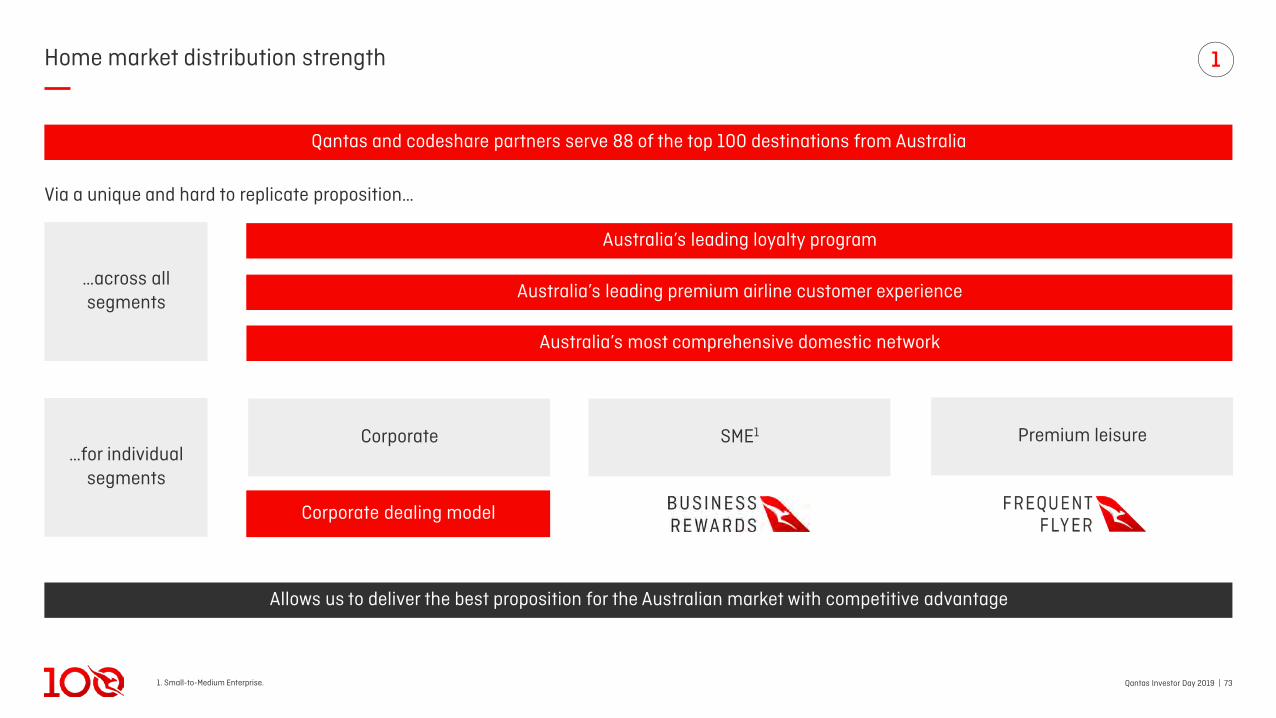
Home market distribution strength
Australia’s leading premium airline customer experience
Australia’s most comprehensive domestic network
Australia’s leading loyalty program
…across all segments
…for individual segments
Corporate SME1 Premium leisure
Corporate dealing model
Via a unique and hard to replicate proposition…
Qantas and codeshare partners serve 88 of the top 100 destinations from Australia
Allows us to deliver the best proposition for the Australian market with competitive advantage
1
Qantas Investor Day 2019 | 741. Ranked by number of Qantas International passengers originating from Australia for twelve months ended Jun 2019. Source: RADAR. 2. Small-to-Medium Enterprise.
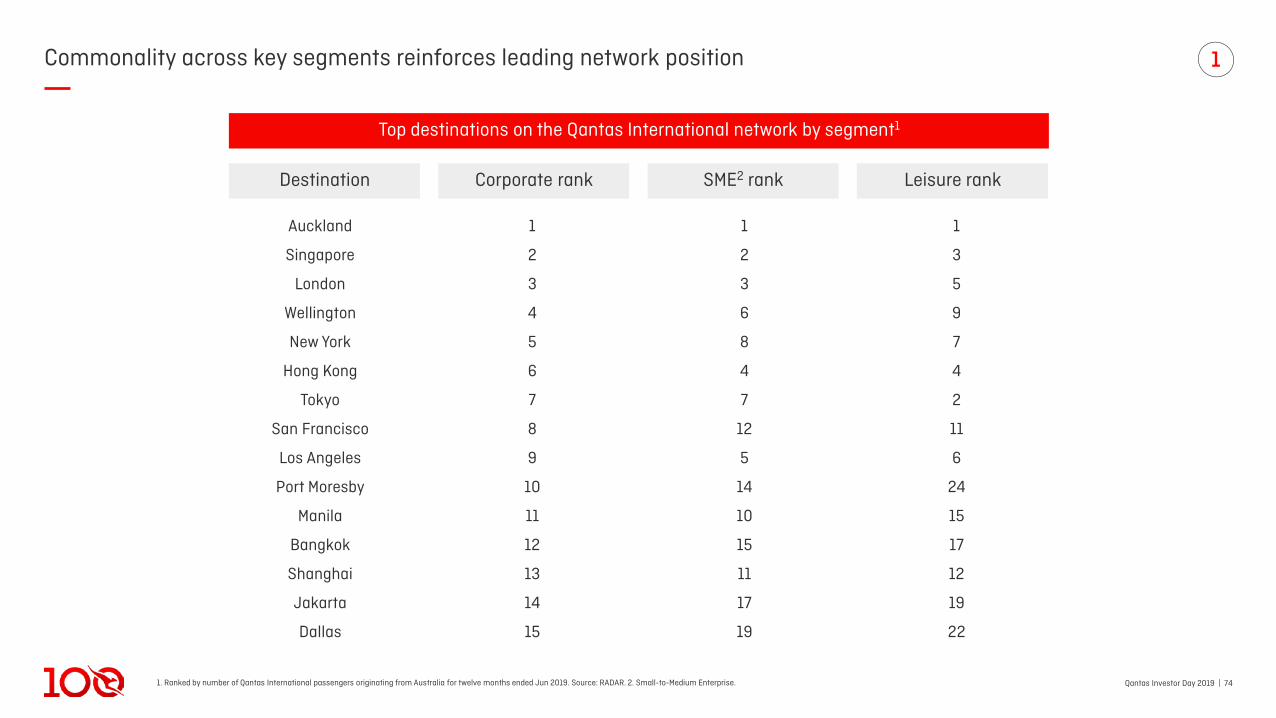
Commonality across key segments reinforces leading network position
Auckland 1 1 1
Singapore 2 2 3
London 3 3 5
Wellington 4 6 9
New York 5 8 7
Hong Kong 6 4 4
Tokyo 7 7 2
San Francisco 8 12 11
Los Angeles 9 5 6
Port Moresby 10 14 24
Manila 11 10 15
Bangkok 12 15 17
Shanghai 13 11 12
Jakarta 14 17 19
Dallas 15 19 22
Top destinations on the Qantas International network by segment1
Corporate rank SME2 rank Leisure rankDestination
1
Qantas Investor Day 2019 | 75
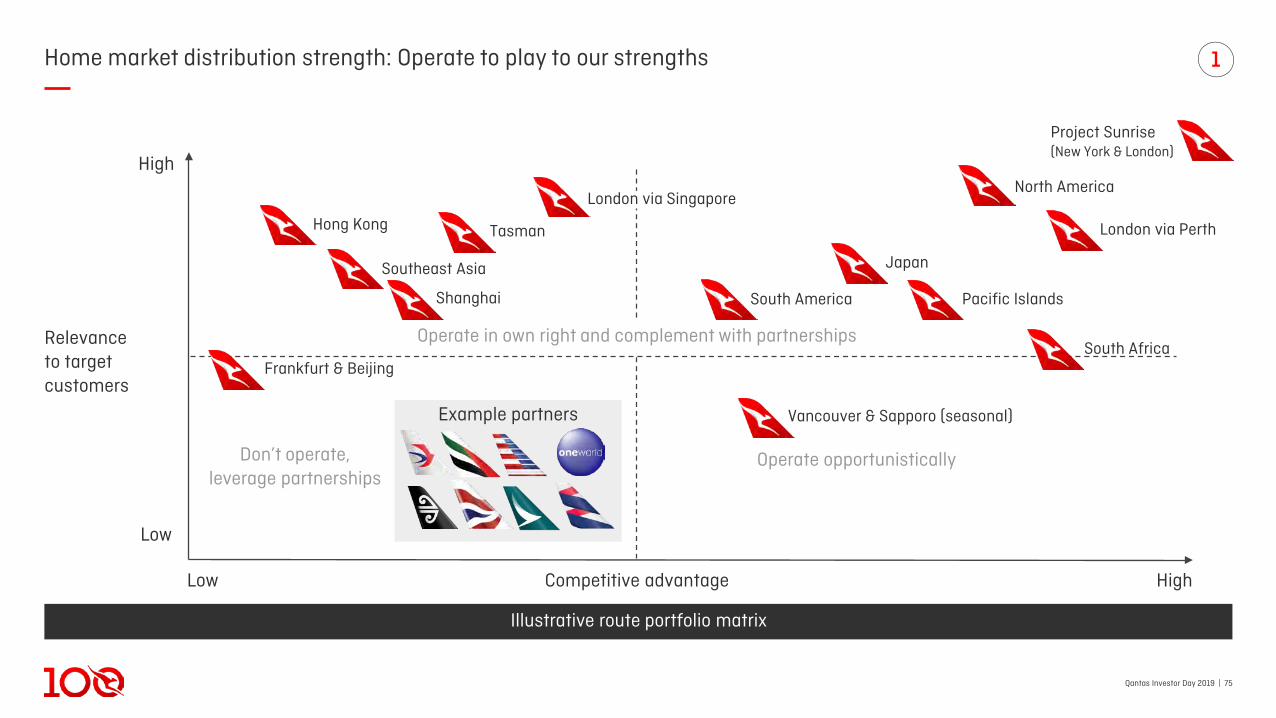
South Africa
Home market distribution strength: Operate to play to our strengths
Competitive advantage
Relevance to target customers
Don’t operate, leverage partnerships
Operate in own right and complement with partnerships
HighLow
Low
High
Hong Kong
London via Singapore
Southeast Asia
Tasman London via Perth
North America
Japan
South America Pacific IslandsShanghai
Vancouver & Sapporo (seasonal)
Project Sunrise(New York & London)
Frankfurt & Beijing
Example partners
1
Illustrative route portfolio matrix
Operate opportunistically
Qantas Investor Day 2019 | 761. Billings from airline partnerships. FY19 figure. 2. Qantas revenue (Domestic and International) associated with airline partners in FY19: Qantas ticketed revenue with an airline partner segment less cost of partner segments, partner airline sales on Qantas operated services, codeshare commissions and revenue from block space operations.
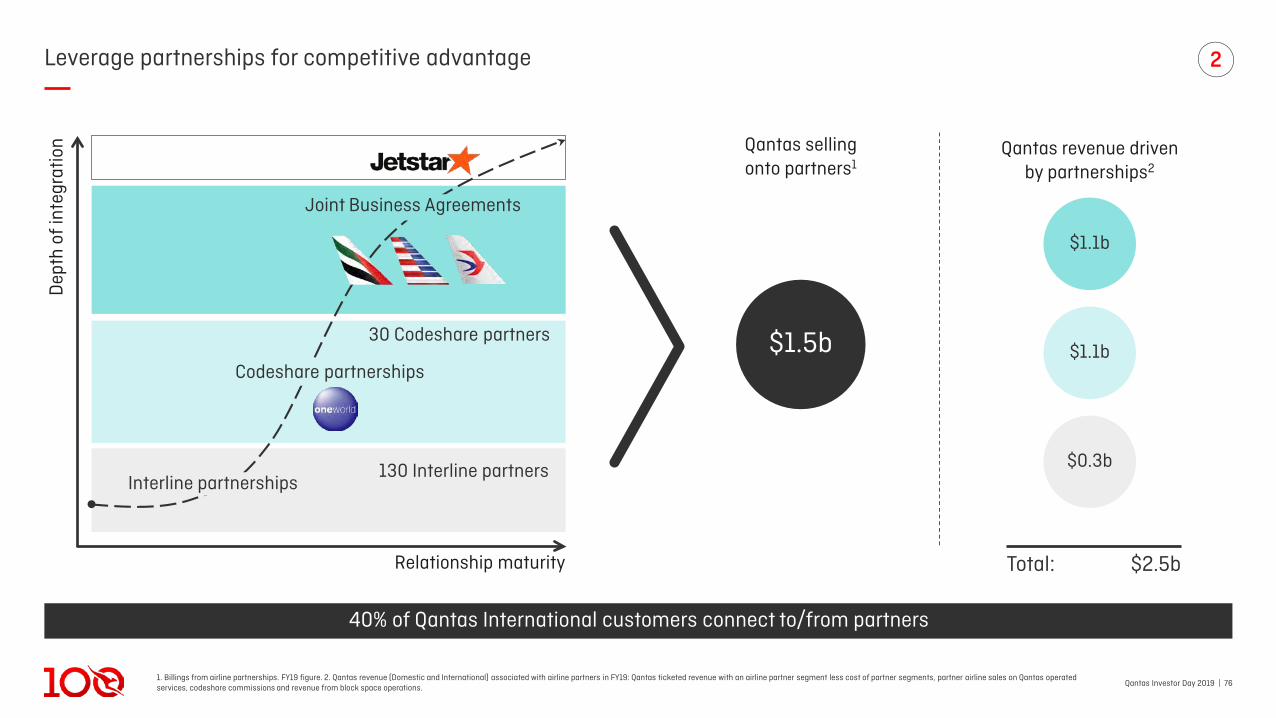
Leverage partnerships for competitive advantage
40% of Qantas International customers connect to/from partners
Dep
th o
f int
egra
tion
Relationship maturity
30 Codeshare partners
130 Interline partners
Qantas sellingonto partners1
$2.5bTotal:
Qantas revenue drivenby partnerships2
$1.5b
$1.1b
$1.1b
$0.3b
Joint Business Agreements
Codeshare partnerships
Interline partnerships
2

Qantas Investor Day 2019 | 771. Qantas (QF) coded destinations. 2. Codeshare also covers Singapore and Christchurch (excluded from count). 3. Codeshare also covers Singapore (excluded from count). 4.Defined by capacity, revenue and network. 5. Count of passenger segments for FY19.
Leverage partnerships for competitive advantage: Joint business partners
‒ 50 destinations1 across Europe,the Middle East and Africa2
‒ One-stop proposition via Dubai
‒ Thin routes not viable for Qantasto operate in own right
‒ 1.8m passengers travelling across partnership5
Emirates American Airlines China Eastern
Leverage distribution strength in Australia
Provides attractive network to key customer segments plus earn and burn opportunities for Qantas Frequent Flyers
‒ 109 destinations1 across North America, on track to double vs pre-partnership
‒ #1 Position on the Pacific4
‒ Flying into key American hubs creates “funnel” of traffic onto Pacific routes
‒ 100 million AAdvantage members, complementing Qantas Frequent Flyer member base in Australia
‒ 25 destinations1 in China3
‒ Provides improved access to largest inbound market to Australia
‒ Annual passenger volumes have more than doubled since commencement
2
Qantas Investor Day 2019 | 78
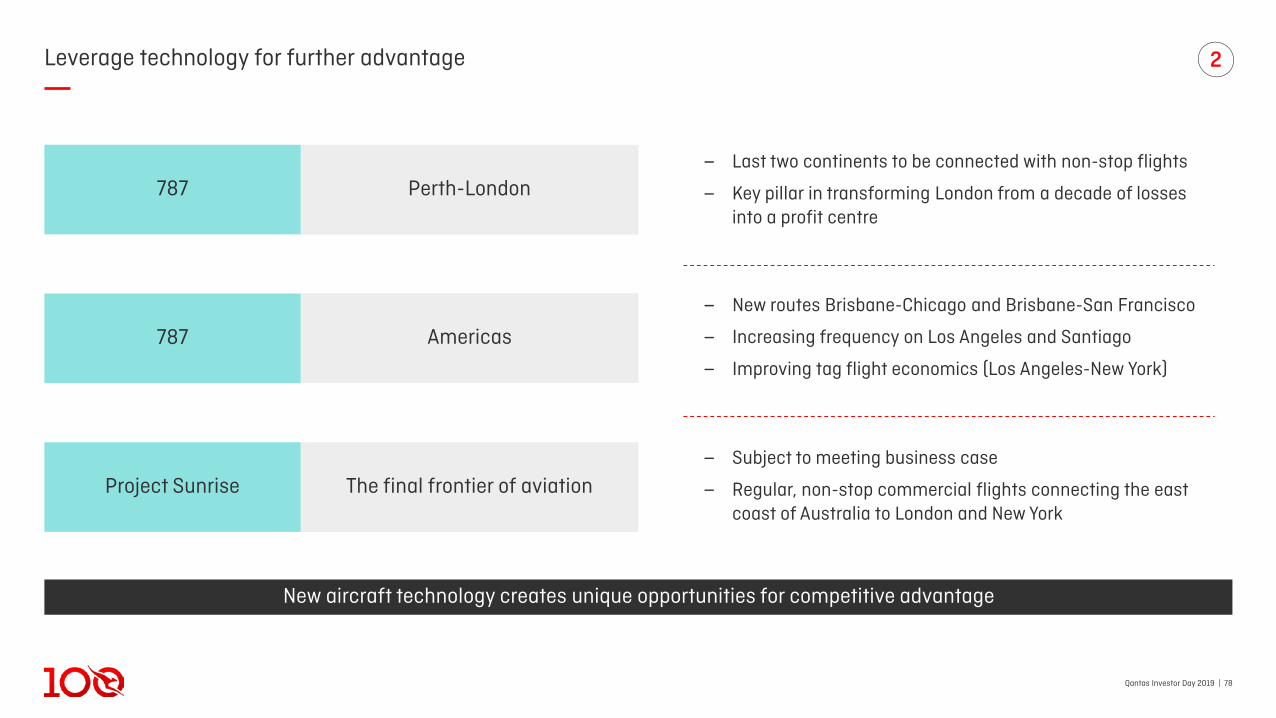
Leverage technology for further advantage
‒ Last two continents to be connected with non-stop flights
‒ Key pillar in transforming London from a decade of losses into a profit centre
Perth-London
Americas787
787
The final frontier of aviationProject Sunrise
New aircraft technology creates unique opportunities for competitive advantage
‒ New routes Brisbane-Chicago and Brisbane-San Francisco
‒ Increasing frequency on Los Angeles and Santiago
‒ Improving tag flight economics (Los Angeles-New York)
‒ Subject to meeting business case
‒ Regular, non-stop commercial flights connecting the east coast of Australia to London and New York
2
Qantas Investor Day 2019 | 791. Average fare comparison versus one-stop via Singapore for year ended Jul 2019.
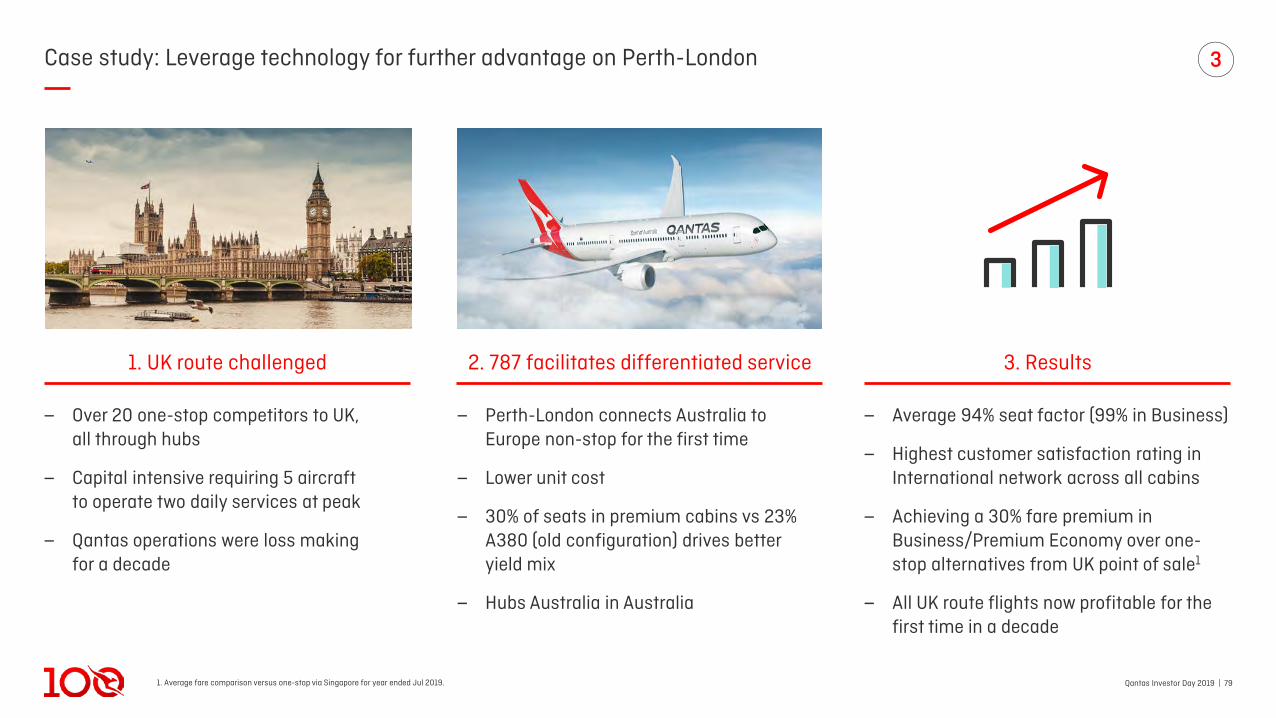
Case study: Leverage technology for further advantage on Perth-London
‒ Average 94% seat factor (99% in Business)
‒ Highest customer satisfaction rating in International network across all cabins
‒ Achieving a 30% fare premium in Business/Premium Economy over one-stop alternatives from UK point of sale1
‒ All UK route flights now profitable for the first time in a decade
‒ Over 20 one-stop competitors to UK,all through hubs
‒ Capital intensive requiring 5 aircraftto operate two daily services at peak
‒ Qantas operations were loss makingfor a decade
1. UK route challenged 2. 787 facilitates differentiated service 3. Results
‒ Perth-London connects Australia to Europe non-stop for the first time
‒ Lower unit cost
‒ 30% of seats in premium cabins vs 23% A380 (old configuration) drives better yield mix
‒ Hubs Australia in Australia
3
Qantas Investor Day 2019 | 80
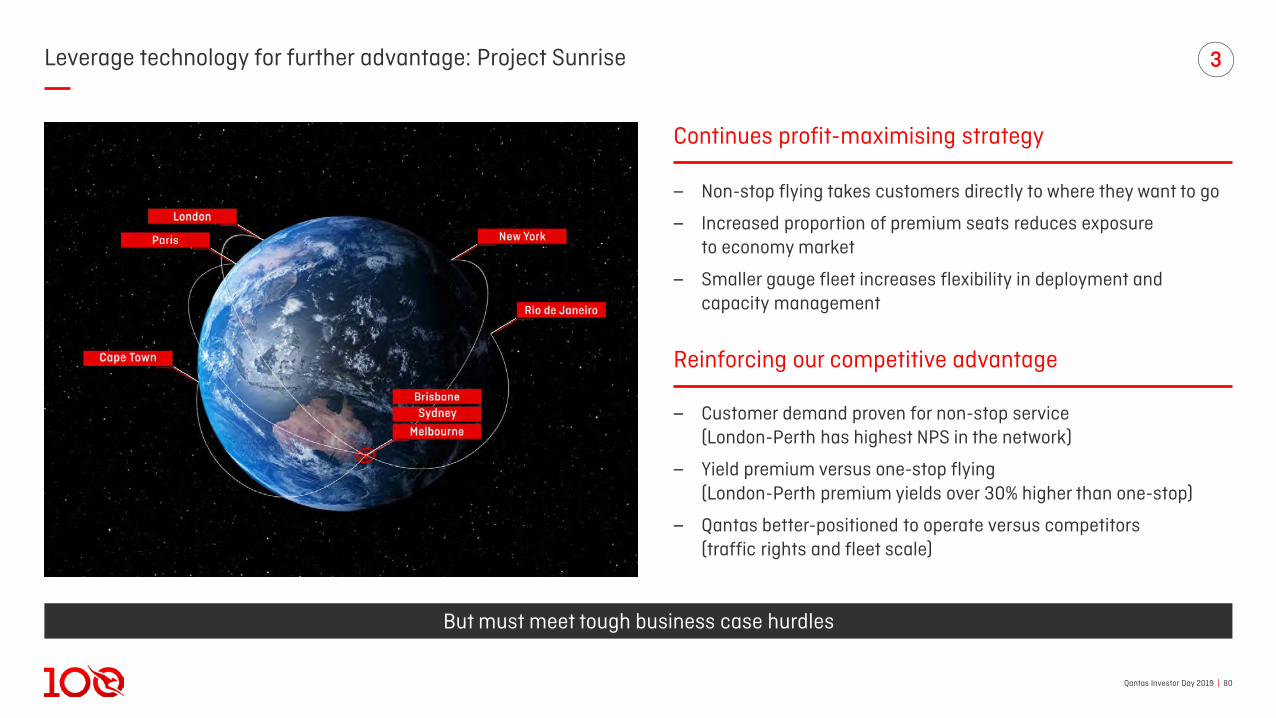
Leverage technology for further advantage: Project Sunrise
‒ Customer demand proven for non-stop service(London-Perth has highest NPS in the network)
‒ Yield premium versus one-stop flying(London-Perth premium yields over 30% higher than one-stop)
‒ Qantas better-positioned to operate versus competitors (traffic rights and fleet scale)
‒ Non-stop flying takes customers directly to where they want to go
‒ Increased proportion of premium seats reduces exposureto economy market
‒ Smaller gauge fleet increases flexibility in deployment andcapacity management
But must meet tough business case hurdles
Reinforcing our competitive advantage
Continues profit-maximising strategy
3
Qantas Investor Day 2019 | 811. FY13 vs FY20 forecast. 2. Unit cost comparison between 747 and 787. 3. Weighted Average Cost of Capital, calculated on a pre-tax basis.
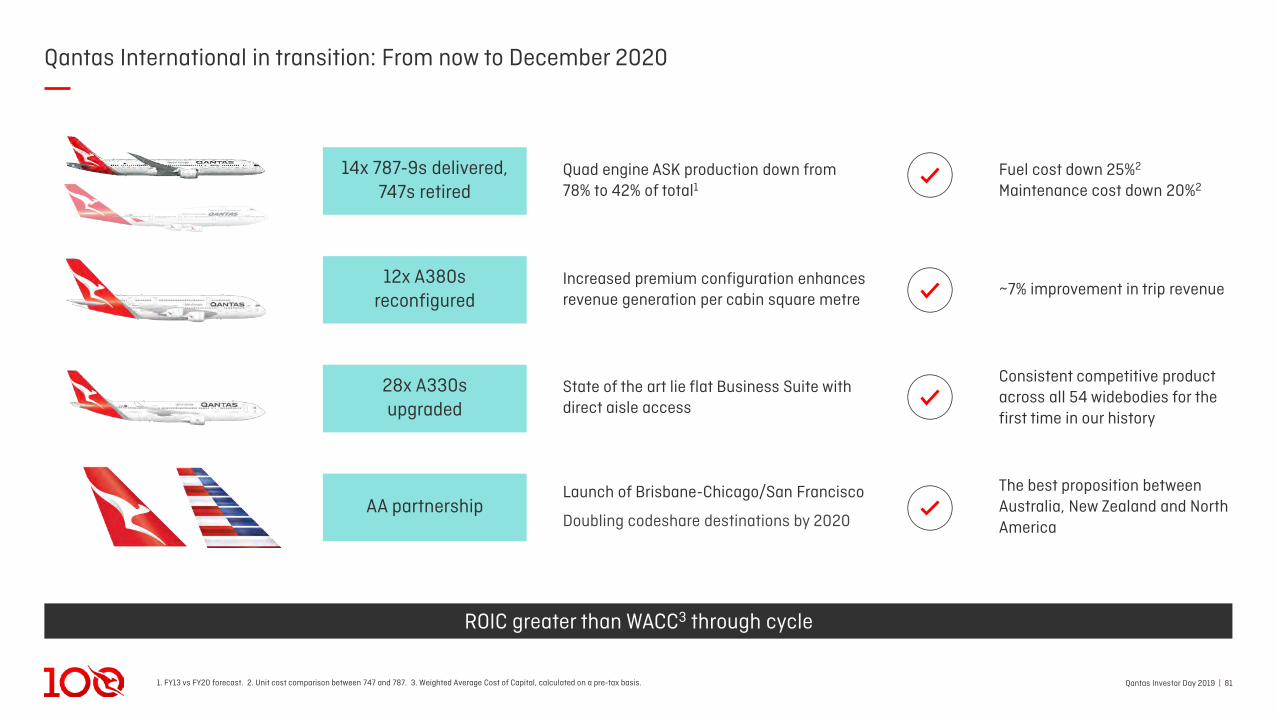
Qantas International in transition: From now to December 2020
AA Partnership
Increased premium configuration enhances revenue generation per cabin square metre
Quad engine ASK production down from 78% to 42% of total1
State of the art lie flat Business Suite with direct aisle access
Fuel cost down 25%2
Maintenance cost down 20%2
~7% improvement in trip revenue
Consistent competitive product across all 54 widebodies for the first time in our history
The best proposition between Australia, New Zealand and North America
ROIC greater than WACC3 through cycle
14x 787-9s delivered, 747s retired
12x A380sreconfigured
28x A330s upgraded
AA partnershipLaunch of Brisbane-Chicago/San Francisco
Doubling codeshare destinations by 2020

Aligning Qantasand Jetstar withAsia’s growth
Qantas Investor Day 2019 | 831. Based on: IATA 20-year Passenger Forecast is developed by IATA and Tourism Economics
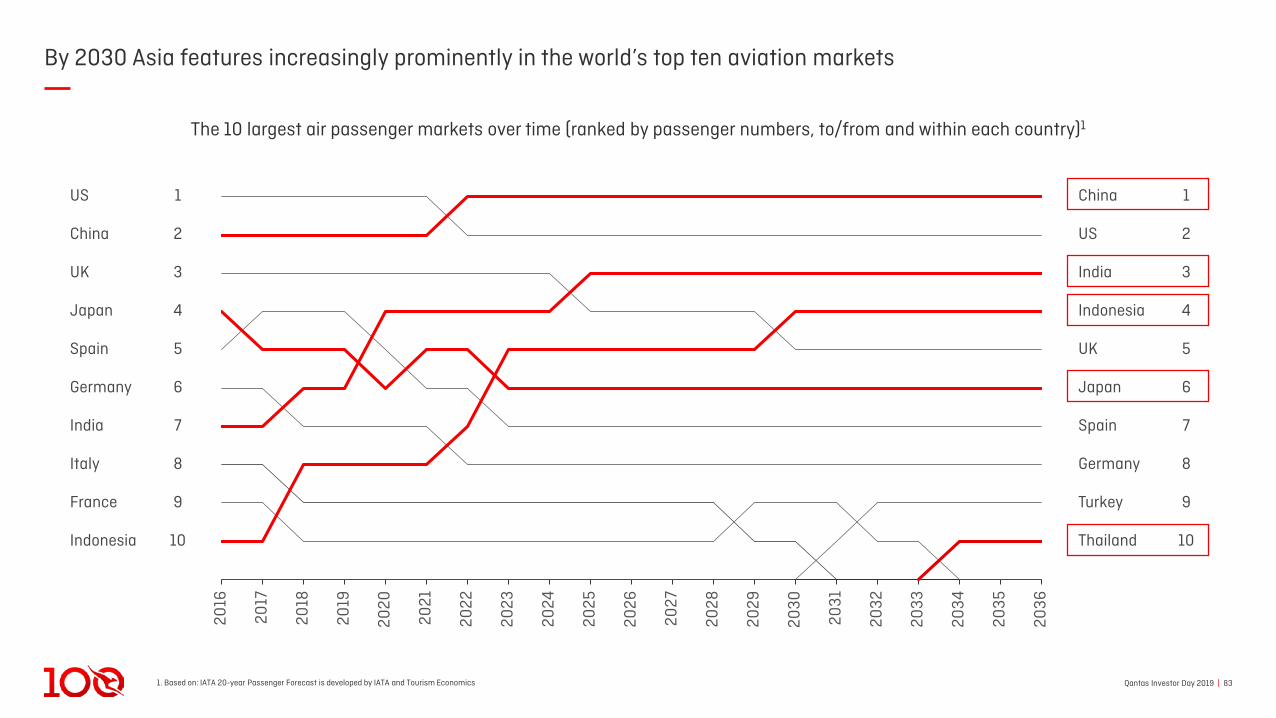
By 2030 Asia features increasingly prominently in the world’s top ten aviation markets
2021
2017
2033
2019
2023
2016
2018
2027
2020
2022
2024
2025
2026
2028
2029
2030
2031
2032
2034
2035
2036
The 10 largest air passenger markets over time (ranked by passenger numbers, to/from and within each country)1
US 1
China 2
UK 3
Japan 4
Spain 5
Germany 6
India 7
Italy 8
France 9
Indonesia 10
China 1
US 2
India 3
Indonesia 4
UK 5
Japan 6
Spain 7
Germany 8
Turkey 9
Thailand 10
Qantas Investor Day 2019 | 841. Short term arrivals and departures. Source: Austrade – Tourism Research Australia National Tourism Forecast (2017-2027).
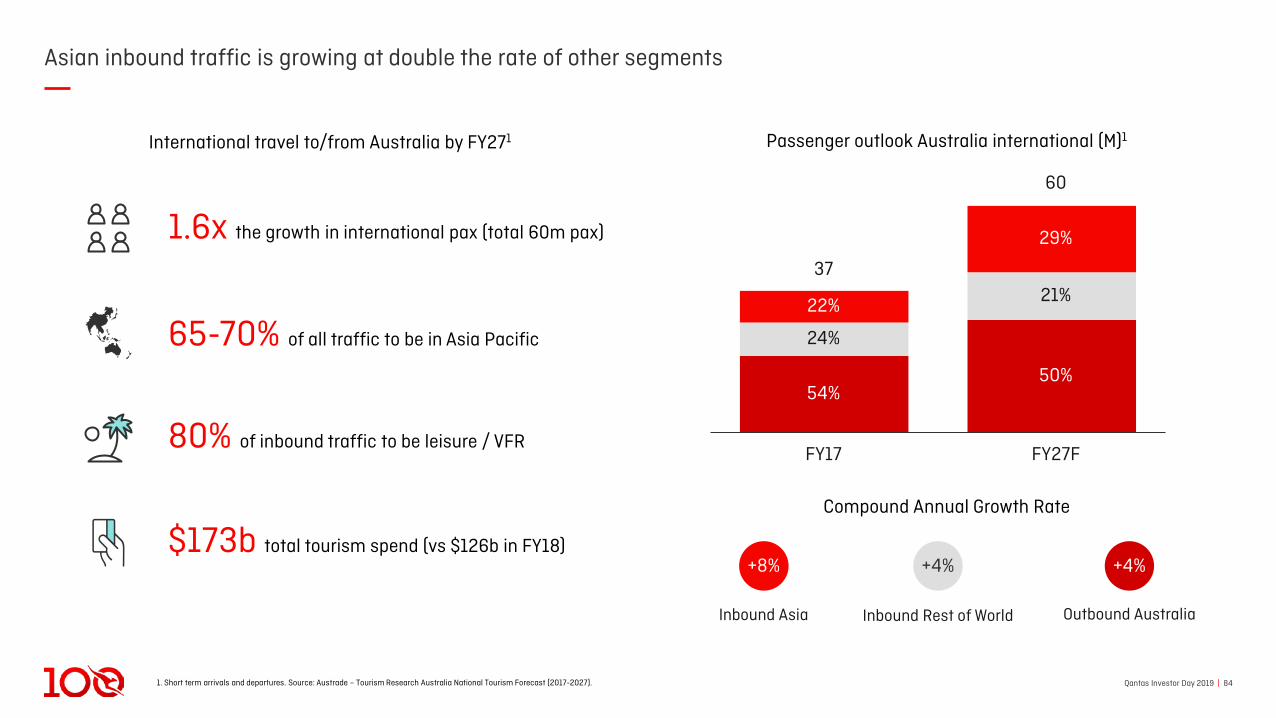
Asian inbound traffic is growing at double the rate of other segments
Passenger outlook Australia international (M)1International travel to/from Australia by FY271
22%
24%
54%
FY17
50%
FY27F
29%
60
3721%
Compound Annual Growth Rate
Inbound Rest of World Outbound AustraliaInbound Asia
+8% +4% +4%
65-70% of all traffic to be in Asia Pacific
80% of inbound traffic to be leisure / VFR
$173b total tourism spend (vs $126b in FY18)
1.6x the growth in international pax (total 60m pax)
Qantas Investor Day 2019 | 85
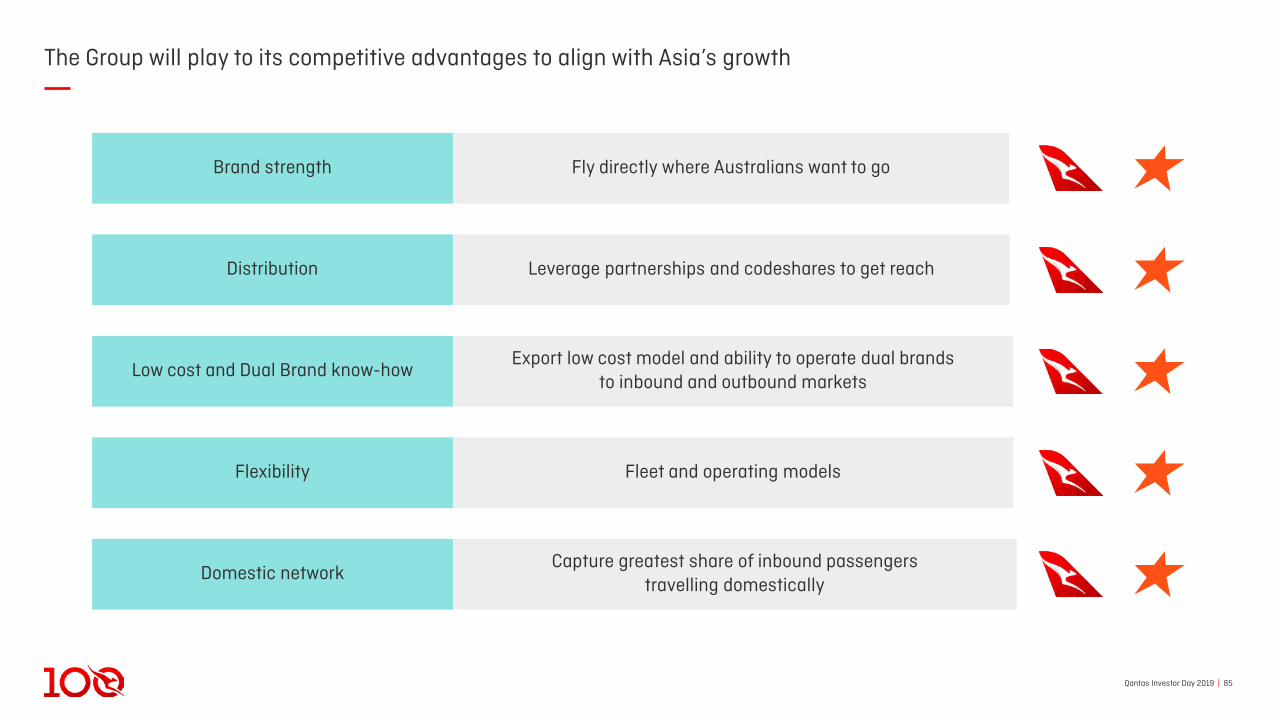
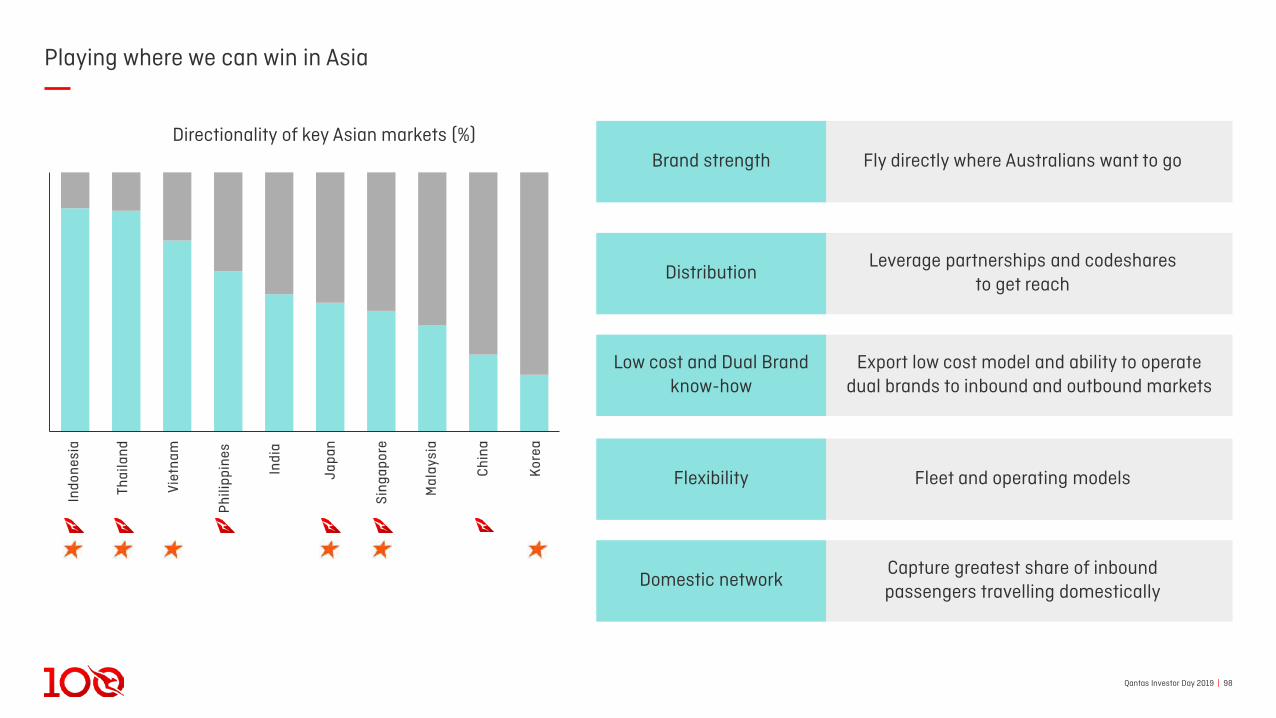
The Group will play to its competitive advantages to align with Asia’s growth
Fly directly where Australians want to goBrand strength
Leverage partnerships and codeshares to get reachDistribution
Export low cost model and ability to operate dual brandsto inbound and outbound markets
Low cost and Dual Brand know-how
Fleet and operating modelsFlexibility
Capture greatest share of inbound passengerstravelling domestically
Domestic network
Qantas Investor Day 2019 | 861. Short-term visitor arrivals (FY19, seasonally-adjusted). Source: Australian Bureau of Statistics. 2. Short-term resident departures (FY19, seasonally-adjusted). Source: Australian Bureau of Statistics.
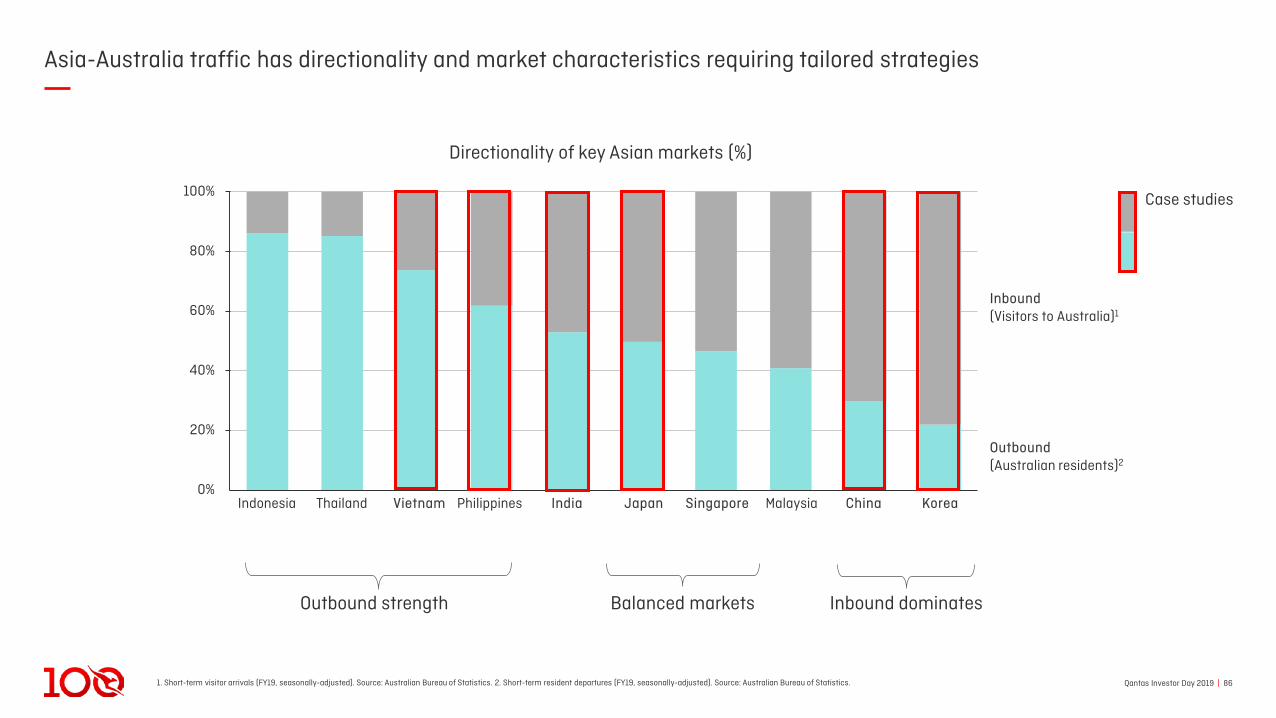
Asia-Australia traffic has directionality and market characteristics requiring tailored strategies
0%
20%
40%
60%
80%
100%
VietnamIndonesia Thailand SingaporePhilippines India Japan ChinaMalaysia Korea
Inbound(Visitors to Australia)1
Outbound(Australian residents)2
Directionality of key Asian markets (%)
Case studies
Outbound strength Balanced markets Inbound dominates
Qantas Investor Day 2019 | 87
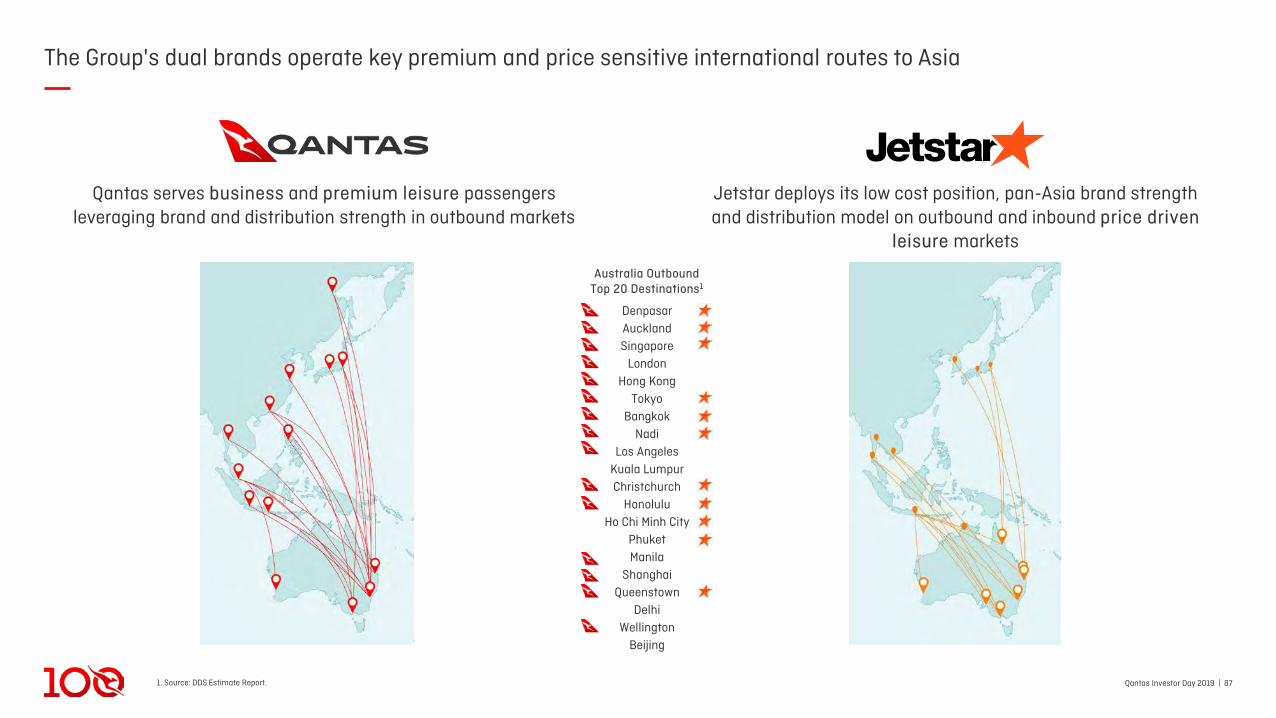
The Group's dual brands operate key premium and price sensitive international routes to Asia
Jetstar deploys its low cost position, pan-Asia brand strengthand distribution model on outbound and inbound price driven
leisure markets
Qantas serves business and premium leisure passengersleveraging brand and distribution strength in outbound markets
1. Source: DDS Estimate Report.
Australia OutboundTop 20 Destinations1
DenpasarAucklandSingapore
LondonHong Kong
TokyoBangkok
NadiLos Angeles
Kuala LumpurChristchurch
HonoluluHo Chi Minh City
PhuketManila
ShanghaiQueenstown
DelhiWellington
Beijing

Qantas Investor Day 2019 | 88
‒ Jetstar Asia is the 2nd largest low cost carrier in Singapore
‒ Offers bundle of food, entertainment and through-checked baggage
‒ Top connections from London to Kuala Lumpur, Bangkok, Bali and Phuket
‒ Connections with Qantas up 72%1 in FY19 and growing
‒ London-Singapore profitable for first time in a decade
‒ New competitive product on Qantas A330 and A380
1. Jetstar Asia connections with Qantas Airways through Singapore.
The Group is evolving the role of Singapore as a hub underpinned by strong point to point traffic
Qantas Investor Day 2019 | 89
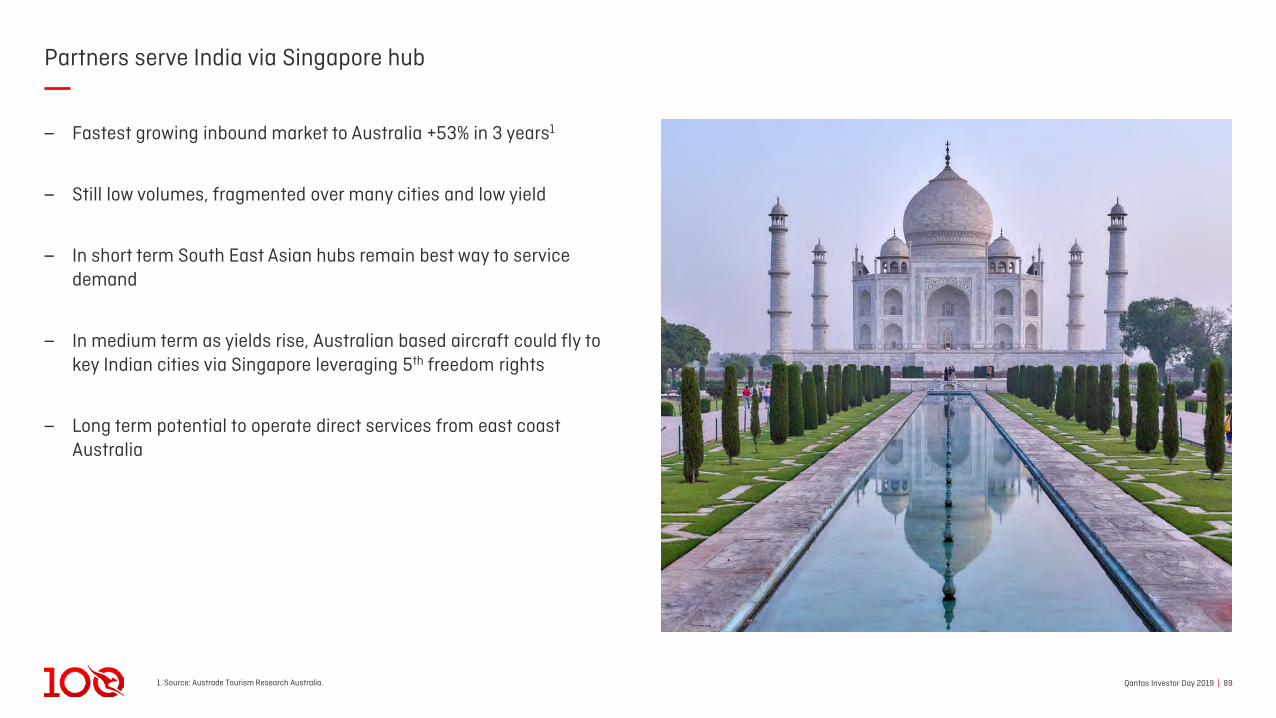
‒ Fastest growing inbound market to Australia +53% in 3 years1
‒ Still low volumes, fragmented over many cities and low yield
‒ In short term South East Asian hubs remain best way to service demand
‒ In medium term as yields rise, Australian based aircraft could fly to key Indian cities via Singapore leveraging 5th freedom rights
‒ Long term potential to operate direct services from east coast Australia
1. Source: Austrade Tourism Research Australia.
Partners serve India via Singapore hub
Qantas Investor Day 2019 | 90
The Group participates only where it can be profitable in the Chinese market
‒ Operate Australia-China routes only where Group has competitive advantage
• Service Australia premium customer demand to Shanghai andHong Kong
• Niche freight provider on the Australia/China/USA triangleand into Macau
‒ Operate Asian Jetstar branded airlines into China leveragingtheir home markets
‒ Leverage partnerships to service China inbound and beyond outbound gateways
• Joint Business with China Eastern
• Codeshare with China Southern
• oneworld relationship including interline with Cathay Pacific

Qantas Investor Day 2019 | 911. HAN; Noi Bai International Airport Hanoi, SGN; Tan Son Nhat International Airport Ho Chi Minh. 2. Source: BITRE.
Vietnam has substantial growth but very challenging market dynamics
‒ Several aggressive, well-funded entrants that are unconstrained by need to protect legacy businesses
‒ Land grab mentality - Vietjet order book of 350 aircraft, Bamboo Airways plans to triple in size
‒ AirAsia has wound down Vietnam entry plan for the 4th time
‒ Population 97m with 70% under 35 years of age
‒ Rapidly increasing propensity to travel as GDP per capita rises
‒ Geography highly amenable to air travel
‒ HAN-SGN1 6th busiest route in the world
‒ Inbound tourism booming (especially from Korea, Japan and China notwithstanding past 12 months)
‒ Manufacturing boom in response to China-US trade war
2015 2016
78
Vietnam capacity (ASK B)2
2017 2018 2019
95111
129151+18% p.a.
Bamboo Airways launch
Growing substantially Very challenging market
Qantas Investor Day 2019 | 92
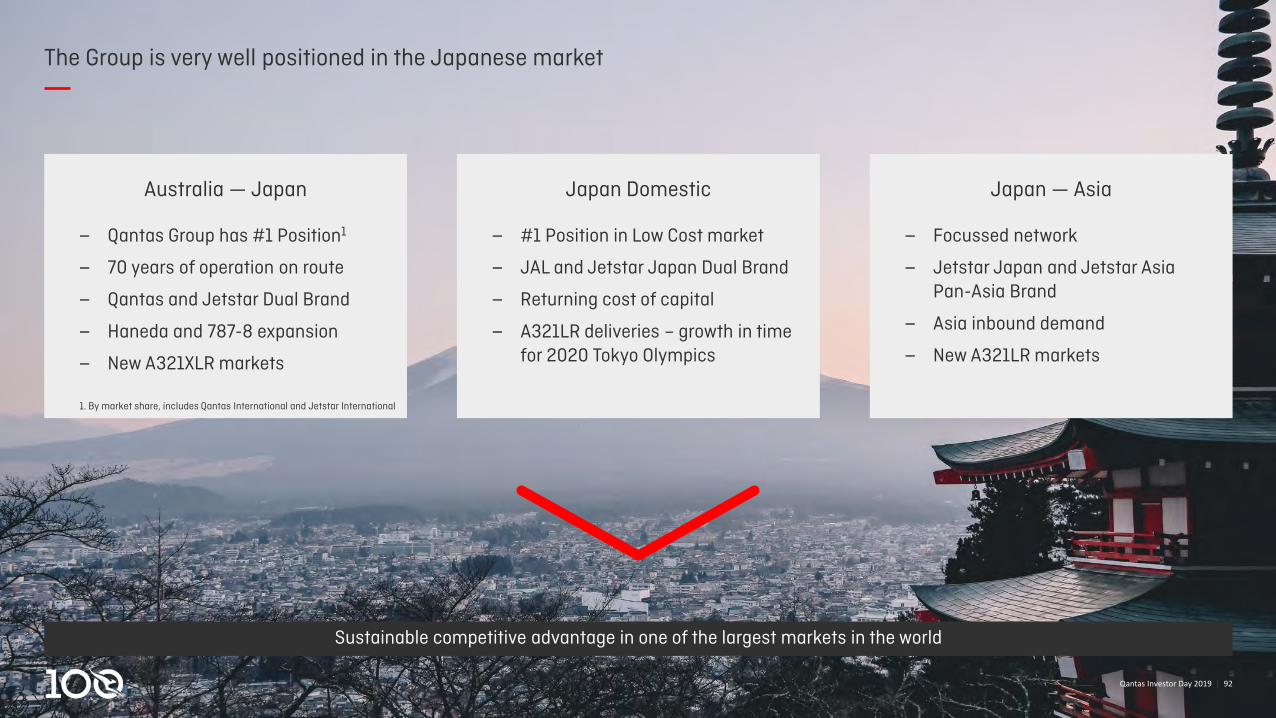
The Group is very well positioned in the Japanese market
‒ Qantas Group has #1 Position1
‒ 70 years of operation on route
‒ Qantas and Jetstar Dual Brand
‒ Haneda and 787-8 expansion
‒ New A321XLR markets
1. By market share, includes Qantas International and Jetstar International
Australia — Japan
‒ Focussed network
‒ Jetstar Japan and Jetstar AsiaPan-Asia Brand
‒ Asia inbound demand
‒ New A321LR markets
Japan — Asia
‒ #1 Position in Low Cost market
‒ JAL and Jetstar Japan Dual Brand
‒ Returning cost of capital
‒ A321LR deliveries – growth in time for 2020 Tokyo Olympics
Japan Domestic
Qantas Investor Day 2019 | 92
Sustainable competitive advantage in one of the largest markets in the world
Qantas Investor Day 2019 | 931. Northern Hemisphere Winter 2019. 2. ASKs. Source: BITRE. NH; All Nippon Airways. JL; Japan Airlines, JQ; Jetstar International, QF; Qantas International.
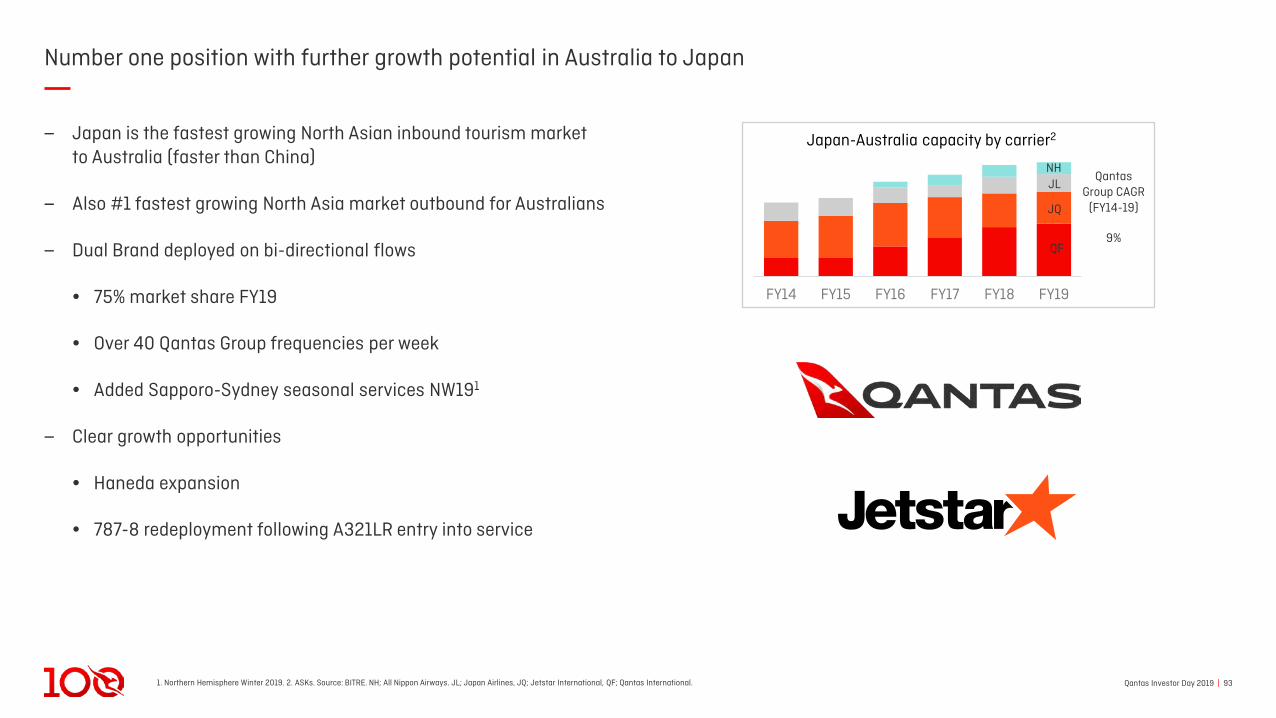
Number one position with further growth potential in Australia to Japan
‒ Japan is the fastest growing North Asian inbound tourism marketto Australia (faster than China)
‒ Also #1 fastest growing North Asia market outbound for Australians
‒ Dual Brand deployed on bi-directional flows
• 75% market share FY19
• Over 40 Qantas Group frequencies per week
• Added Sapporo-Sydney seasonal services NW191
‒ Clear growth opportunities
• Haneda expansion
• 787-8 redeployment following A321LR entry into service
FY14 FY15 FY16 FY17 FY18 FY19
NH
Japan-Australia capacity by carrier2
Qantas Group CAGR
(FY14-19)
9%QF
JQ
JL

Qantas Investor Day 2019 | 941. 2019. Source: Nielsen report.
Japan Domestic – Competitively advantaged position in world’s fifth largest aviation market
‒ Stable, highly profitable Japan domestic market
‒ Jetstar Japan is the #1 domestic low cost carrier
• First mover advantage, in the market since 2012
• Scale advantage with 16 destinations and 24 routes
• Highly recognised – in the top 65 brands for Japan1
• ROIC>10% in FY19 – able to self-fund growth
• Leveraging Dual Brand know-how with Japan Airlines
‒ Room to grow low cost carrier penetration to 30% (3x growth)
• Potential for 60+ aircraft (bigger than Jetstar in Australia)
• Targeting 35 aircraft by FY24
3
13
1820 20 21 22
2528
35
FY12 FY16FY13 FY14 FY15 FY17 FY19FY18 FY20 FY24
Jetstar Japan A320 aircraft
Qantas Investor Day 2019 | 95
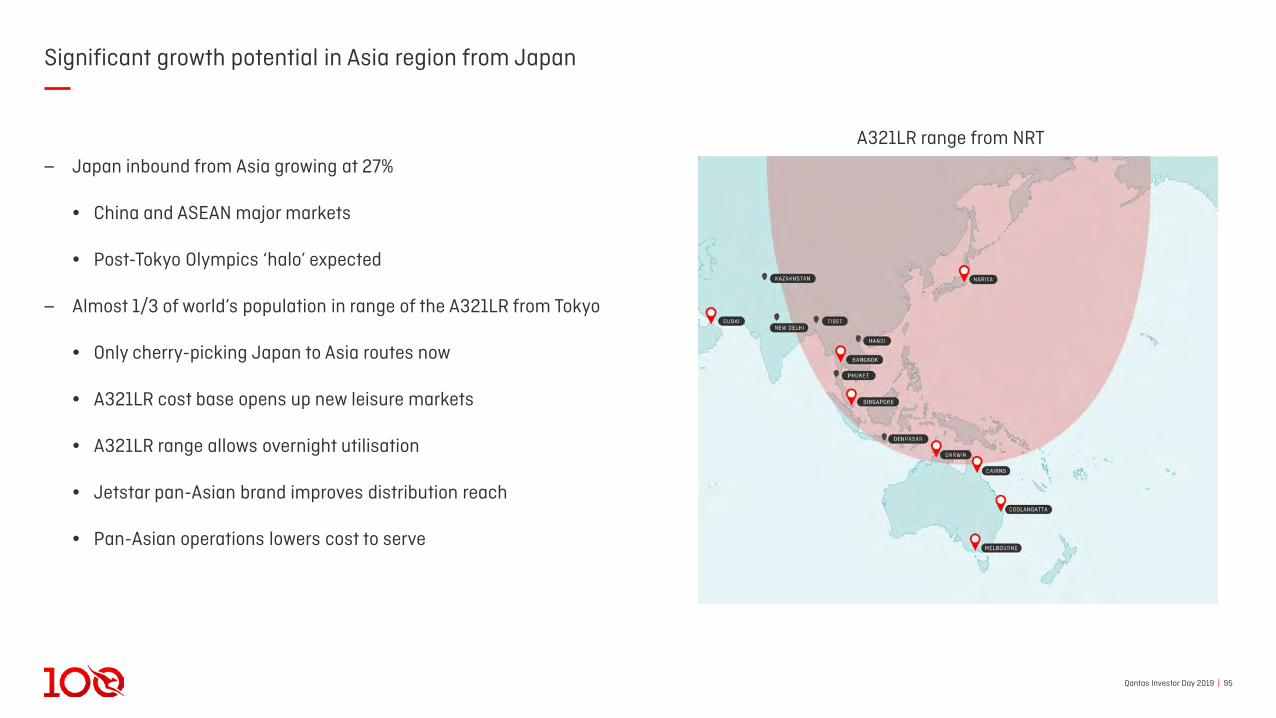
Significant growth potential in Asia region from Japan
‒ Japan inbound from Asia growing at 27%
• China and ASEAN major markets
• Post-Tokyo Olympics ‘halo’ expected
‒ Almost 1/3 of world’s population in range of the A321LR from Tokyo
• Only cherry-picking Japan to Asia routes now
• A321LR cost base opens up new leisure markets
• A321LR range allows overnight utilisation
• Jetstar pan-Asian brand improves distribution reach
• Pan-Asian operations lowers cost to serve
A321LR range from NRT
Qantas Investor Day 2019 | 961. Low Cost Carrier. 2. Source: Centre for Asia Pacific Aviation Report.
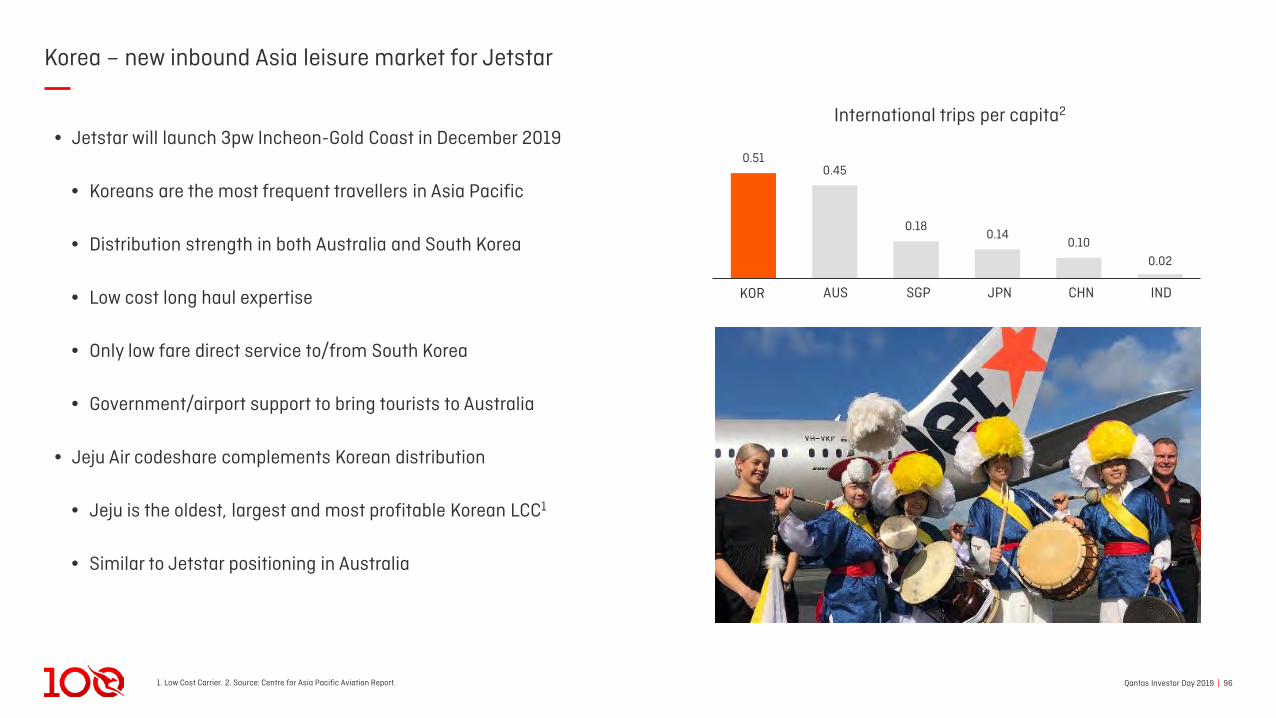
Korea – new inbound Asia leisure market for Jetstar
• Jetstar will launch 3pw Incheon-Gold Coast in December 2019
• Koreans are the most frequent travellers in Asia Pacific
• Distribution strength in both Australia and South Korea
• Low cost long haul expertise
• Only low fare direct service to/from South Korea
• Government/airport support to bring tourists to Australia
• Jeju Air codeshare complements Korean distribution
• Jeju is the oldest, largest and most profitable Korean LCC1
• Similar to Jetstar positioning in Australia
0.510.45
0.180.14
0.10
0.02
INDJPNSGPKOR AUS CHN
International trips per capita2

Qantas Investor Day 2019 | 971. Jetstar International ASKs, Compound Annual Growth Rate FY20 to FY22.
Jetstar fleet strategy underpins profitable growth in Asian markets
A321LR can operate domestic by day and international overnight for “free” international
growth and higher utilisationLower risk
A321LRs will unlock lower trip costs and 787 redeployment on longer routes
Lower cost
Deepen existing international markets, develop emerging markets and grow new partnership
markets9% 3 year CAGR1
Qantas Investor Day 2019 | 98
Playing where we can win in Asia
Capture greatest share of inbound passengers travelling domestically
Fly directly where Australians want to go
Export low cost model and ability to operate dual brands to inbound and outbound markets
Brand strength
Low cost and Dual Brand know-how
Domestic network
Leverage partnerships and codeshares to get reach
Distribution
Fleet and operating modelsFlexibility
Directionality of key Asian markets (%)
Viet
nam
Indo
nesi
a
Thai
land
Sin
gapo
re
Phi
lippi
nes
Indi
a
Japa
n
Chi
na
Mal
aysi
a
Kor
ea

Qantas Investor Day 2019 | 99
Investing in Customer, Brand, Data and Digital to continue to deliver a sustainable competitive advantage
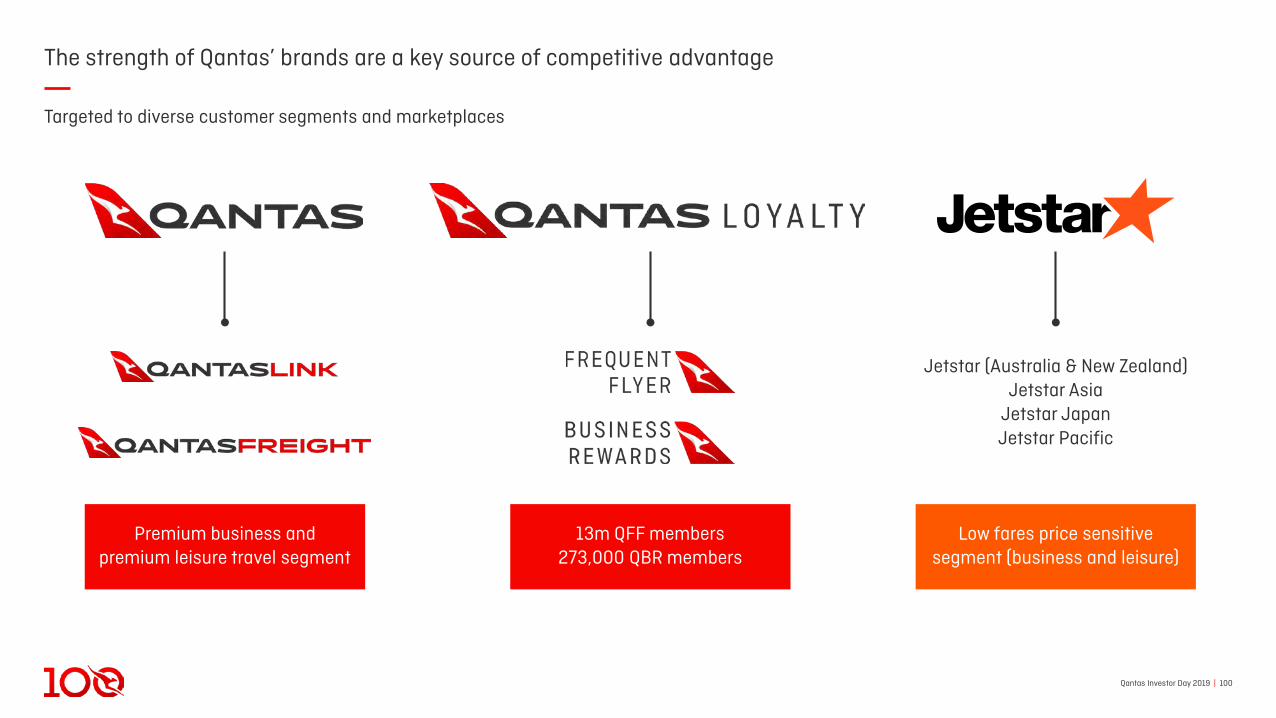
Qantas Investor Day 2019 | 100
The strength of Qantas’ brands are a key source of competitive advantage
Targeted to diverse customer segments and marketplaces
Jetstar (Australia & New Zealand)Jetstar Asia
Jetstar JapanJetstar Pacific
Premium business and premium leisure travel segment
13m QFF members273,000 QBR members
Low fares price sensitive segment (business and leisure)

Qantas Investor Day 2019 | 1011. Source: Qantas customer research programs.
Customers are at the centre of our thinking
‒ Qantas: Most trusted corporate brand in Australia
‒ Jetstar: Most trusted low cost carrier in Australia
‒ Half of Australians claim Qantas as the #1 business supporting the Australian Community
‒ Qantas and Qantas Frequent Flyer: Significant advantage in NPS over domestic competitors
‒ Qantas: Record NPS results for 787 international flights, particularly Perth-London
‒ Jetstar: Record NPS results in Australia and Asia
‒ Jetstar: Most preferred LCC in Australia for domestic and international travel
‒ Qantas: Most preferred carrier for domestic and international travel
Trust1
NPS
Preference
Customer
Customer feedback
Insights

Qantas Investor Day 2019 | 1021. Source: Dynata, Q4FY19, Corporate Trust Research (Jun 2019). Respondents who scored 7-10 on the question “Overall, how much do you trust the following individual businesses operating in Australia today, where ‘1’ means you don’t trust them at all, and ‘10’ means you have a lot of trust in them?”.
Qantas continues to be in a unique position for trust in Australian businesses
Trust in the Qantas brand remains a key competitive advantage1
63%
53%-56%
38%-42%
32%-37%
30%
35%
40%
45%
50%
55%
60%
65%
70%
Qantas Group Supermarkets/other full service airlines
Telecommunications,resources, petrol
Banks, insurance
Range for operators in industries
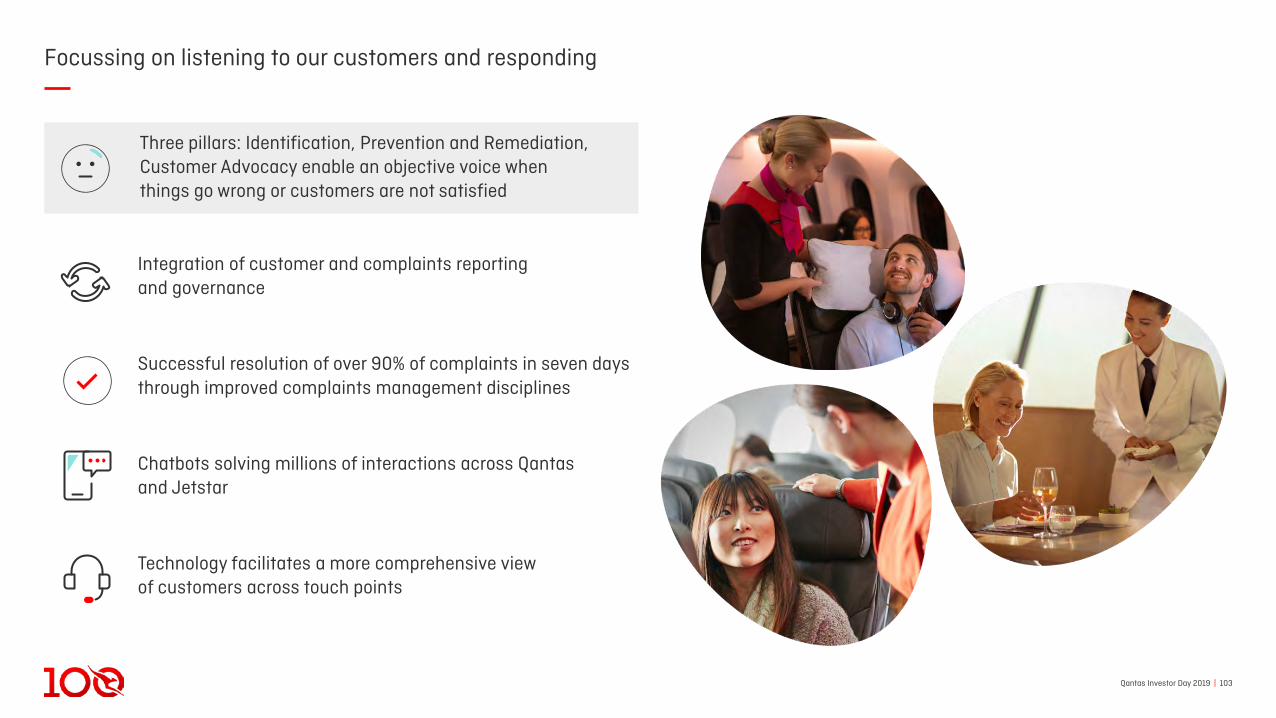
Qantas Investor Day 2019 | 103
Focussing on listening to our customers and responding
Three pillars: Identification, Prevention and Remediation, Customer Advocacy enable an objective voice when things go wrong or customers are not satisfied
Integration of customer and complaints reportingand governance
Successful resolution of over 90% of complaints in seven days through improved complaints management disciplines
Chatbots solving millions of interactions across Qantasand Jetstar
Technology facilitates a more comprehensive viewof customers across touch points
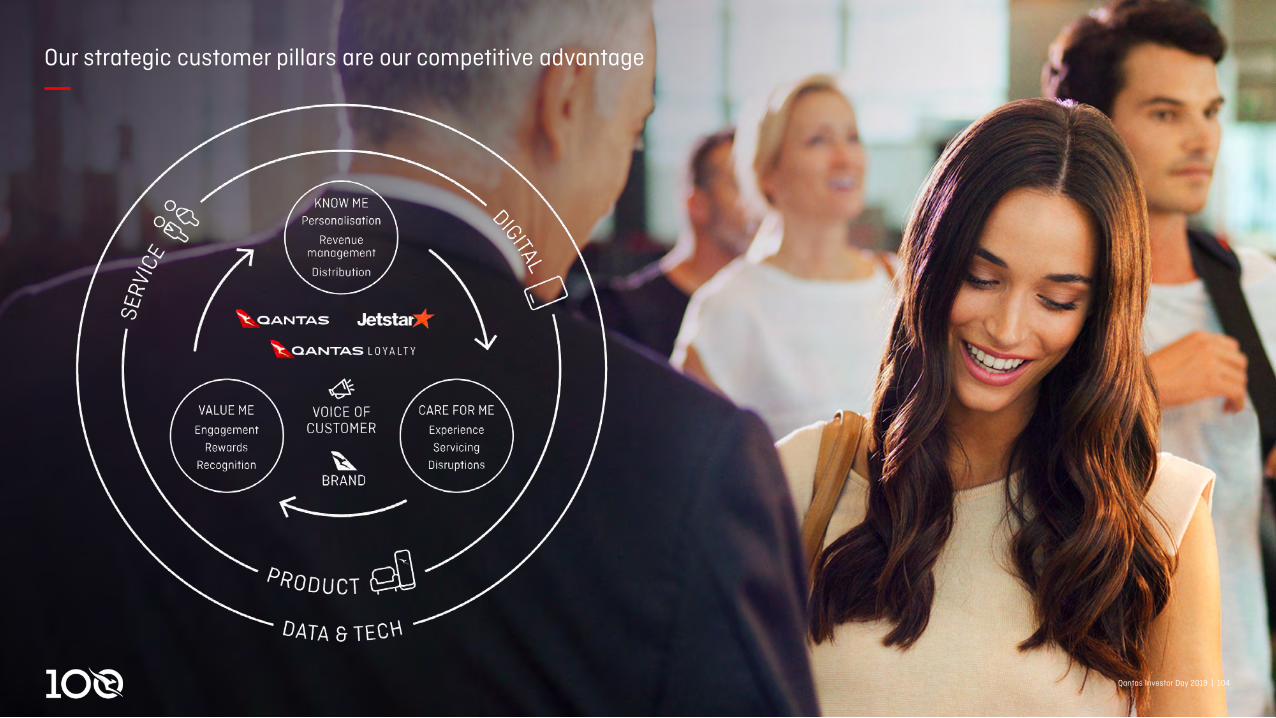
Qantas Investor Day 2019 | 104
Our strategic customer pillars are our competitive advantage
Qantas Investor Day 2019 | 104
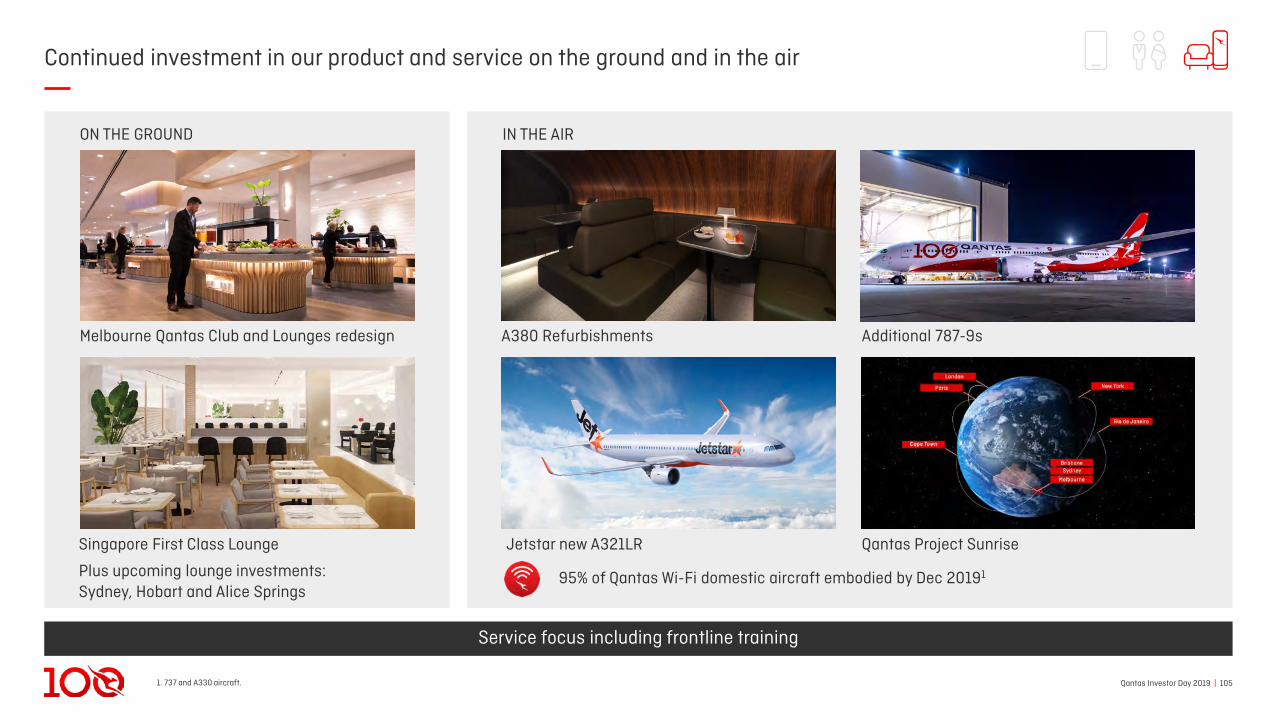
Qantas Investor Day 2019 | 1051. 737 and A330 aircraft.
Continued investment in our product and service on the ground and in the air
A380 Refurbishments
Jetstar new A321LR
Additional 787-9s
Qantas Project Sunrise
95% of Qantas Wi-Fi domestic aircraft embodied by Dec 20191
IN THE AIR
Service focus including frontline training
Melbourne Qantas Club and Lounges redesign
Singapore First Class Lounge
Plus upcoming lounge investments:Sydney, Hobart and Alice Springs
ON THE GROUND
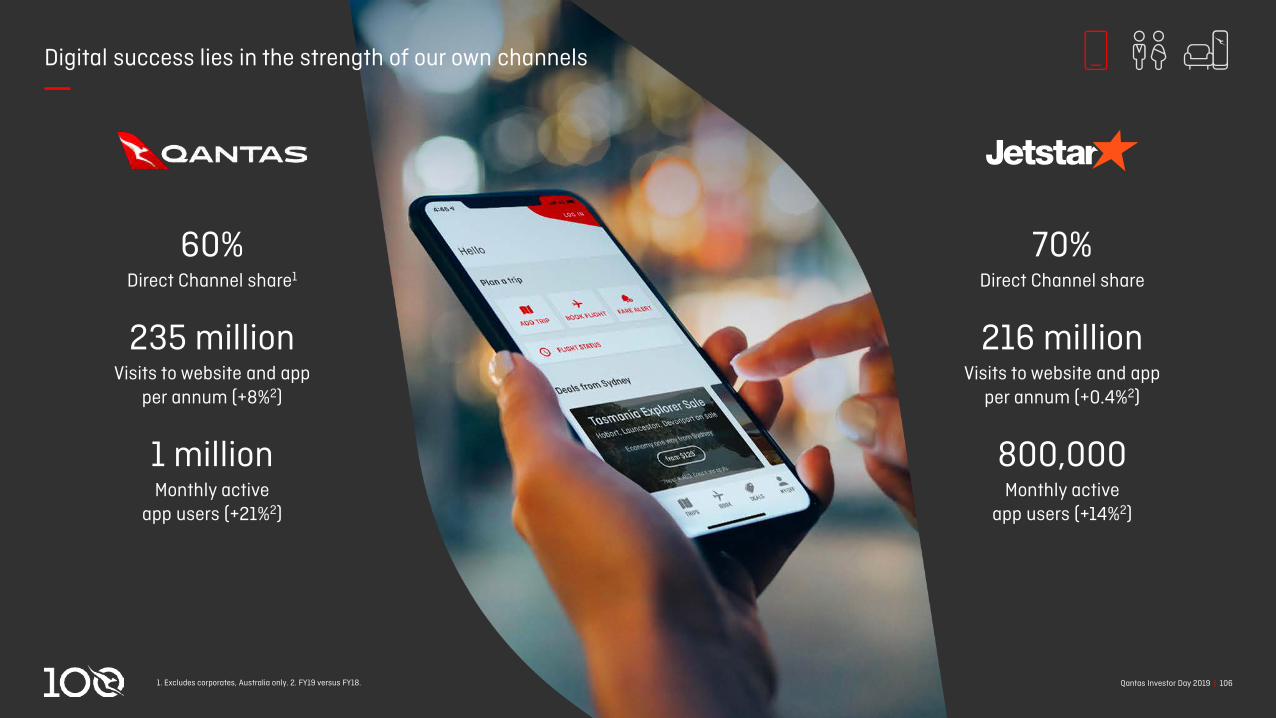
Qantas Investor Day 2019 | 1061. Excludes corporates, Australia only. 2. FY19 versus FY18.
Digital success lies in the strength of our own channels
70%Direct Channel share
216 millionVisits to website and app
per annum (+0.4%2)
800,000Monthly active
app users (+14%2)
60%Direct Channel share1
235 millionVisits to website and app
per annum (+8%2)
1 millionMonthly active
app users (+21%2)

Qantas Investor Day 2019 | 107
Case study: Jetstar Ancillary revenue growth
Ancillary revenue growth enabled through digital website enhancements allowing us to personalise the information we provide our customers and introduce new products and services that better suit their needs
+3kg carry-on baggage (upgrade from the standard 7kgcarry-on baggage to 10kg), 600,000 customers taken up
372,000 Club Jetstar members (+37% growth), savingmembers $30m in fares, seat selection and baggage
Optimised and improved bundles — optimised bag, meal,seat selection and flex options
Relaunch Manage My Booking to optimise postbooking and journey management
73% of bookings with Jetstar add an Ancillary ProductFY20Forecast
FutureFY19FY17 FY18
+1%
+8%
+8%
Ancillary revenueyield growth
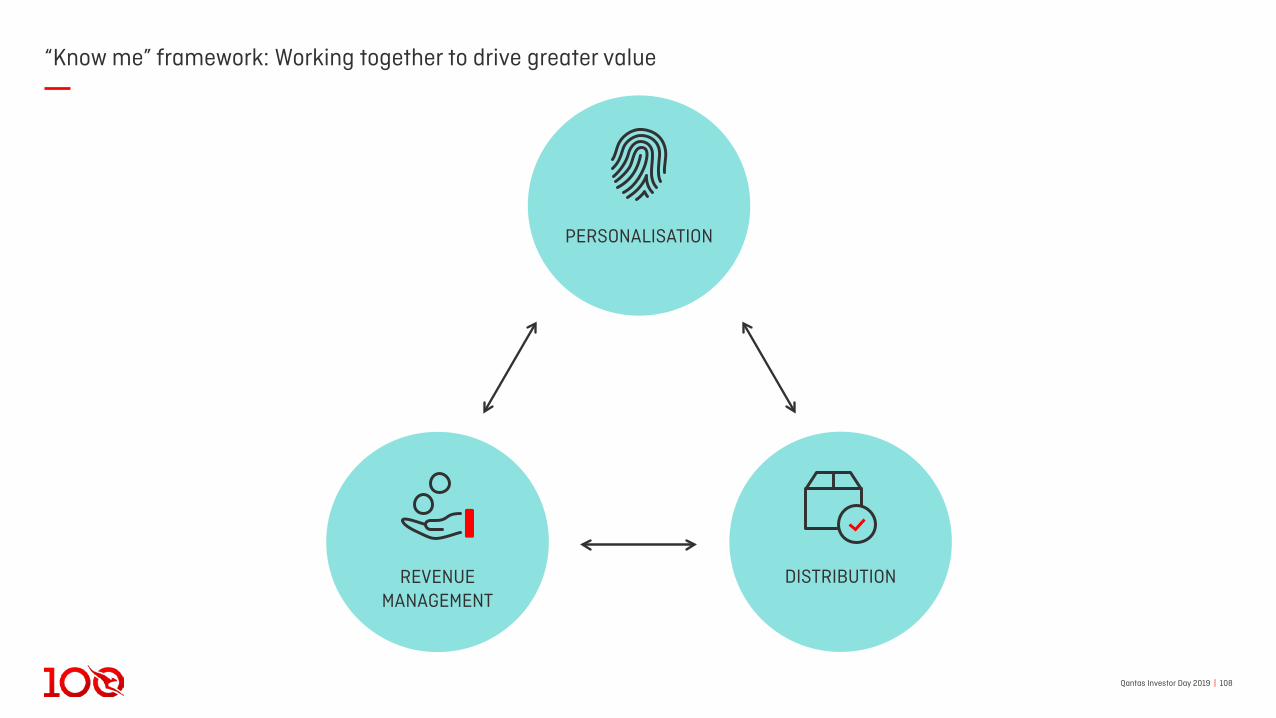
Qantas Investor Day 2019 | 108
DISTRIBUTIONREVENUE MANAGEMENT
“Know me” framework: Working together to drive greater value
PERSONALISATION
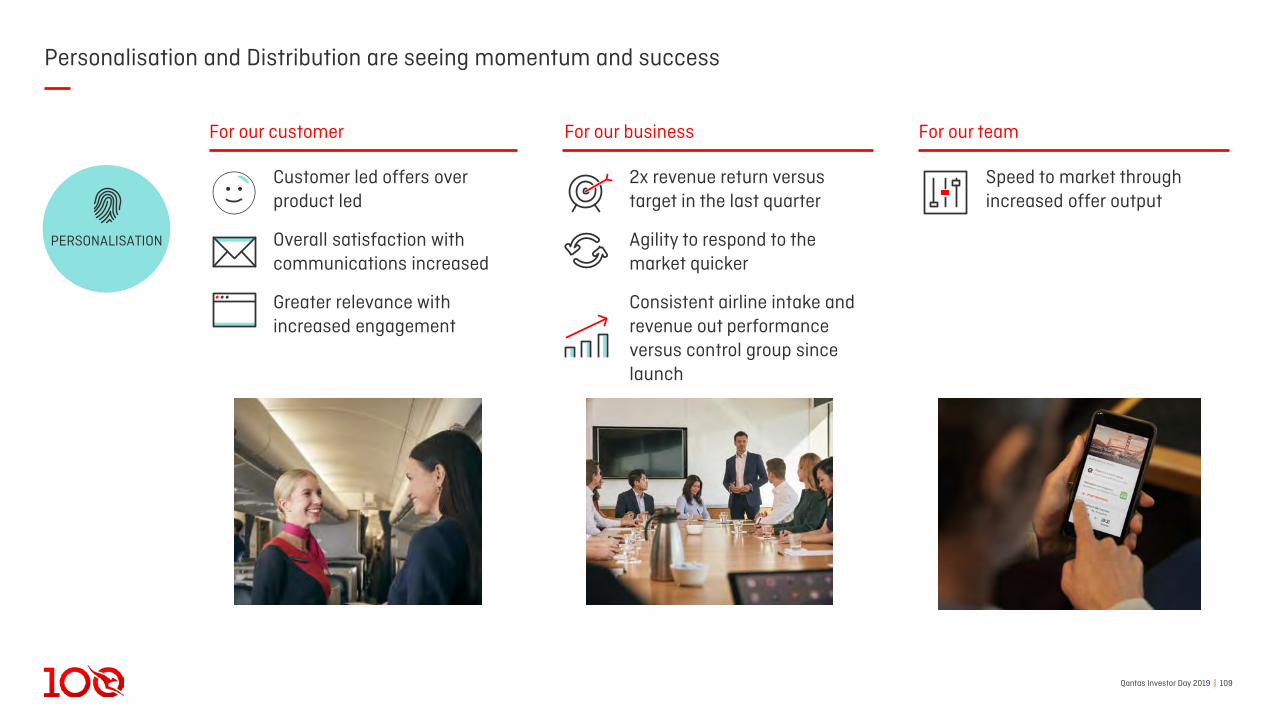
Qantas Investor Day 2019 | 109
Personalisation and Distribution are seeing momentum and success
2x revenue return versus target in the last quarter
Agility to respond to themarket quicker
Consistent airline intake and revenue out performance versus control group since launch
Speed to market through increased offer output
PERSONALISATION
Customer led offers over product led
Overall satisfaction with communications increased
Greater relevance with increased engagement
For our business For our team For our customer
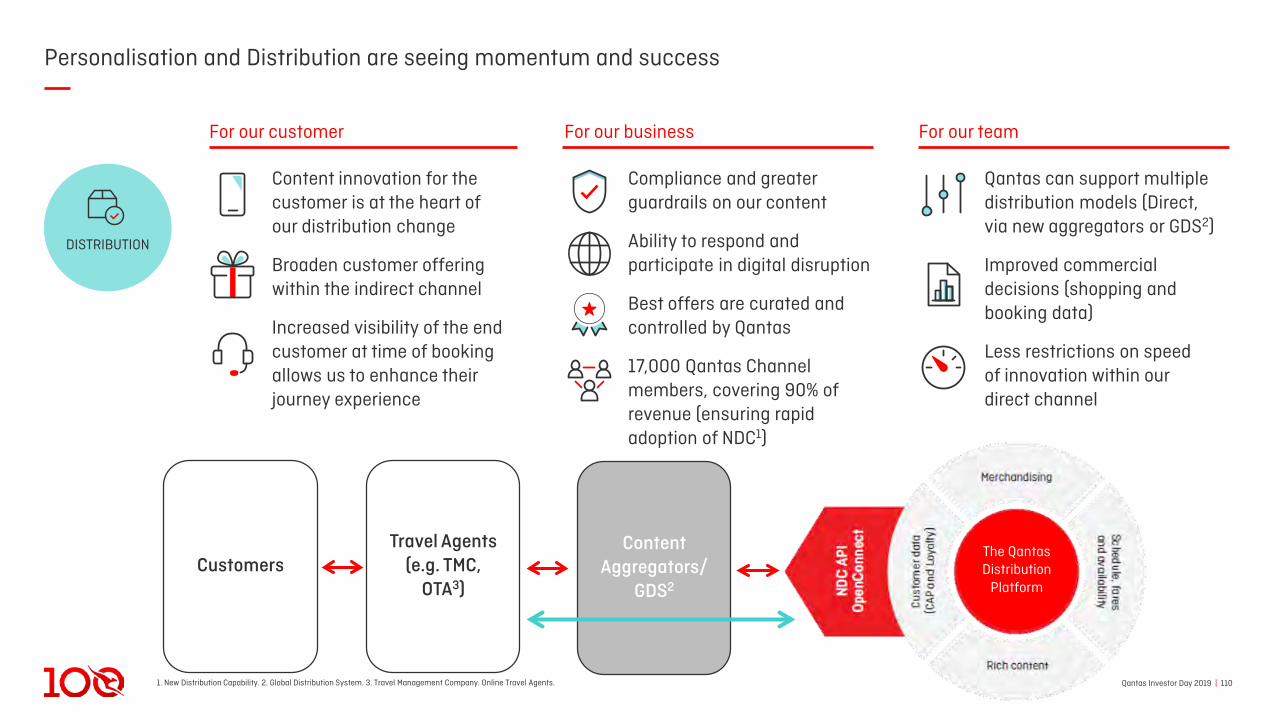
Qantas Investor Day 2019 | 1101. New Distribution Capability. 2. Global Distribution System. 3. Travel Management Company. Online Travel Agents.
Personalisation and Distribution are seeing momentum and success
For our business For our team
Compliance and greater guardrails on our content
Ability to respond and participate in digital disruption
Best offers are curated and controlled by Qantas
17,000 Qantas Channel members, covering 90% of revenue (ensuring rapid adoption of NDC1)
DISTRIBUTION
Qantas can support multiple distribution models (Direct, via new aggregators or GDS2)
Improved commercial decisions (shopping andbooking data)
Less restrictions on speedof innovation within ourdirect channel
For our customer
Content innovation for the customer is at the heart ofour distribution change
Broaden customer offering within the indirect channel
Increased visibility of the end customer at time of booking allows us to enhance their journey experience
The Qantas Distribution
Platform
CustomersTravel Agents
(e.g. TMC, OTA3)
Content Aggregators/
GDS2
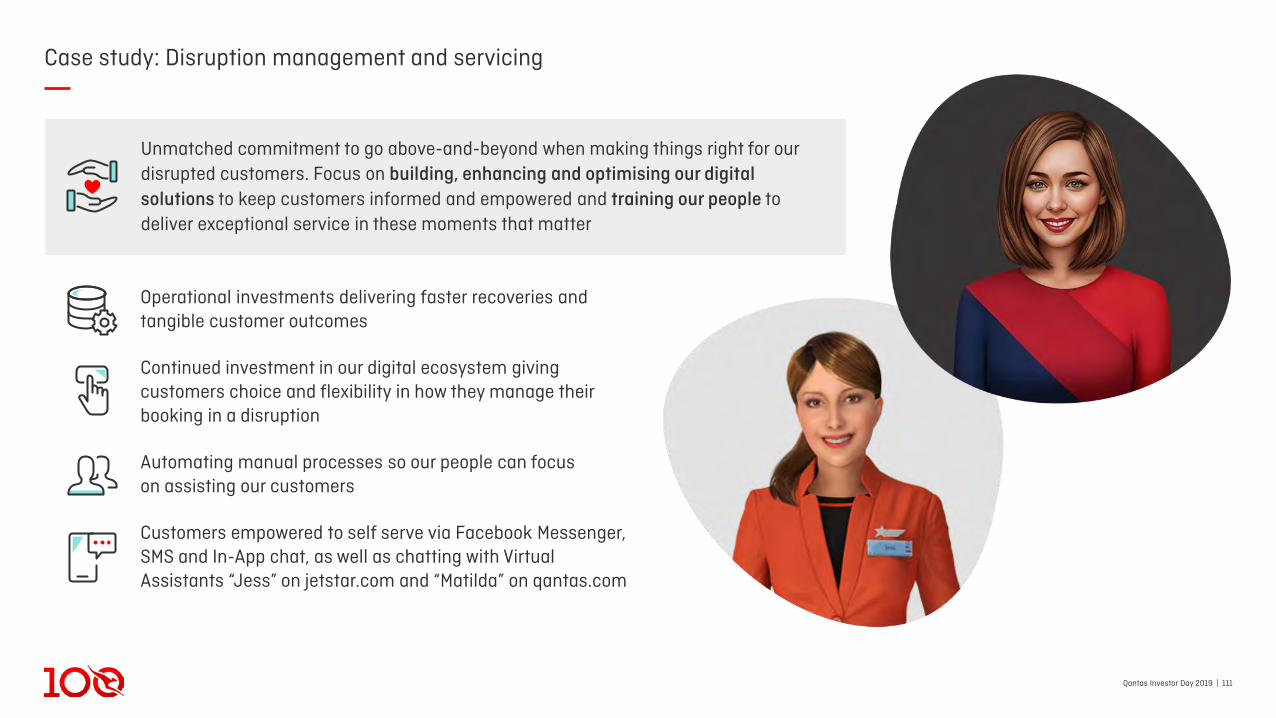
Qantas Investor Day 2019 | 111
Case study: Disruption management and servicing
Unmatched commitment to go above-and-beyond when making things right for our disrupted customers. Focus on building, enhancing and optimising our digital solutions to keep customers informed and empowered and training our people to deliver exceptional service in these moments that matter
Operational investments delivering faster recoveries and tangible customer outcomes
Continued investment in our digital ecosystem giving customers choice and flexibility in how they manage their booking in a disruption
Automating manual processes so our people can focuson assisting our customers
Customers empowered to self serve via Facebook Messenger, SMS and In-App chat, as well as chatting with Virtual Assistants “Jess” on jetstar.com and “Matilda” on qantas.com
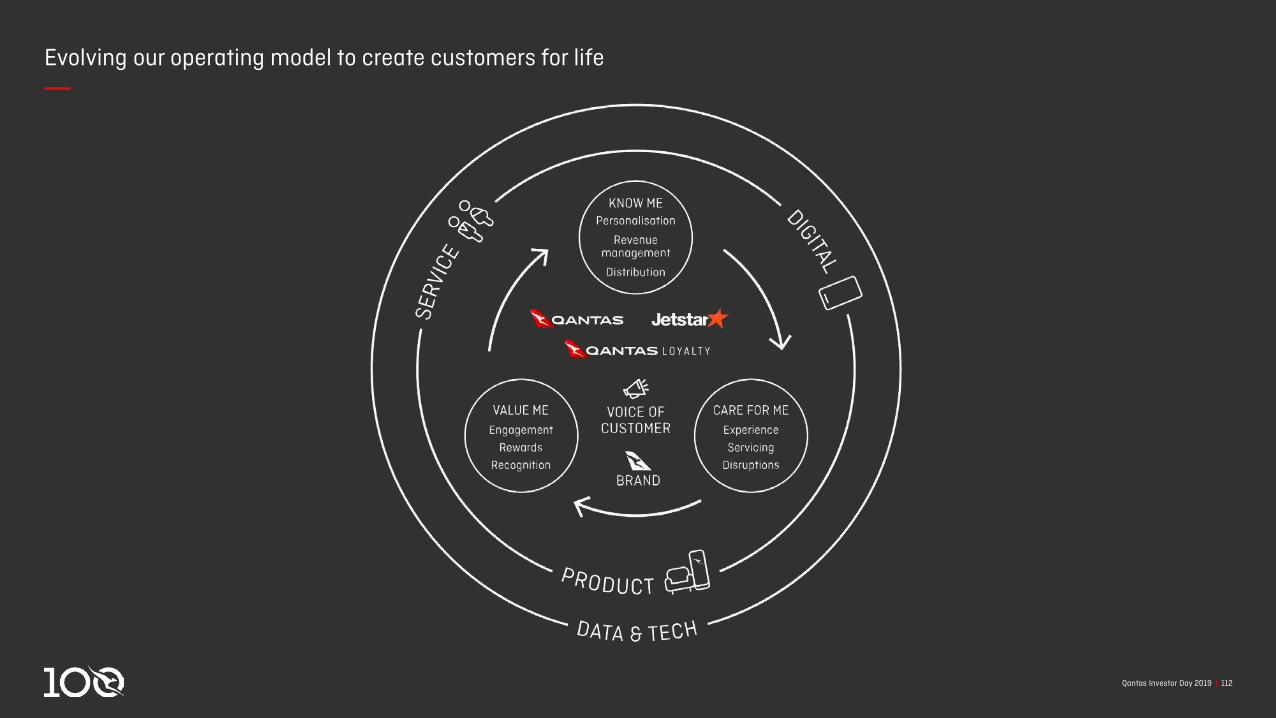
Qantas Investor Day 2019 | 112
Evolving our operating model to create customers for life
Qantas Investor Day 2019 | 113
The Qantas Loyalty roadmap to FY22: Accelerating towards $500-600m
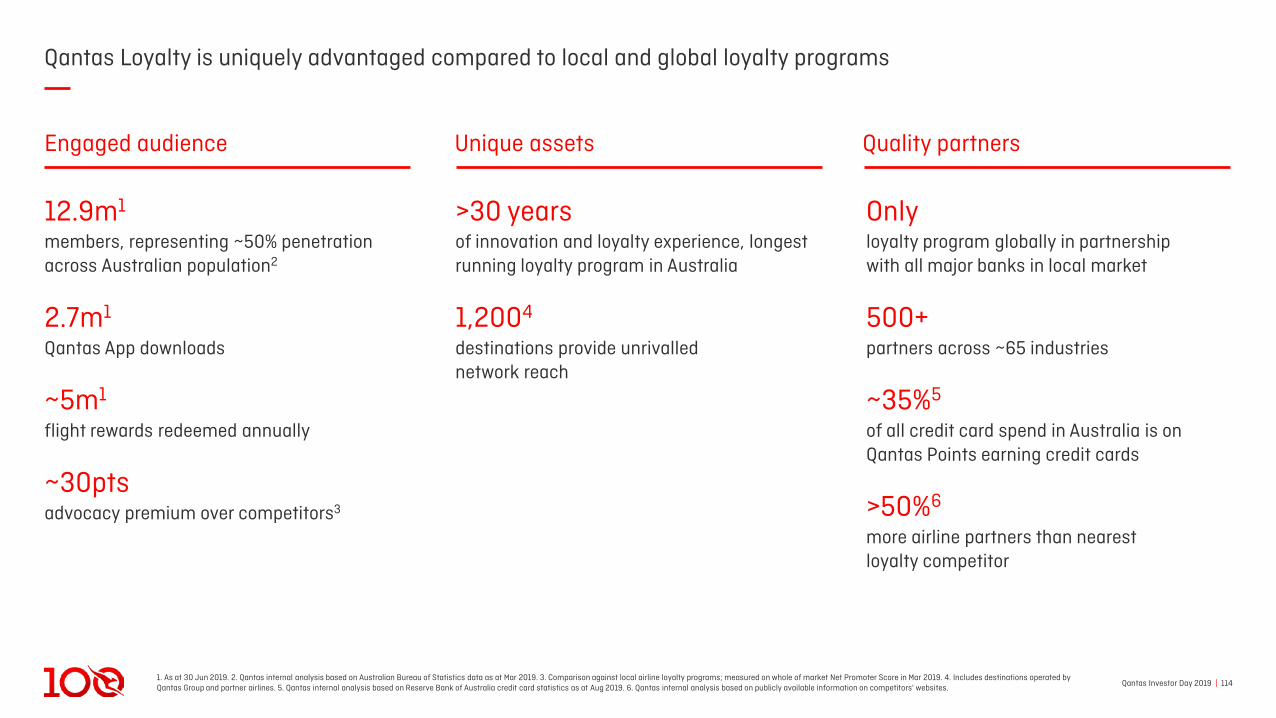
Qantas Investor Day 2019 | 1141. As at 30 Jun 2019. 2. Qantas internal analysis based on Australian Bureau of Statistics data as at Mar 2019. 3. Comparison against local airline loyalty programs; measured on whole of market Net Promoter Score in Mar 2019. 4. Includes destinations operated by Qantas Group and partner airlines. 5. Qantas internal analysis based on Reserve Bank of Australia credit card statistics as at Aug 2019. 6. Qantas internal analysis based on publicly available information on competitors' websites.
Qantas Loyalty is uniquely advantaged compared to local and global loyalty programs
12.9m1
members, representing ~50% penetration across Australian population2
2.7m1
Qantas App downloads
~5m1
flight rewards redeemed annually
~30ptsadvocacy premium over competitors3
>30 years of innovation and loyalty experience, longest running loyalty program in Australia
1,2004
destinations provide unrivallednetwork reach
Onlyloyalty program globally in partnership with all major banks in local market
500+partners across ~65 industries
~35%5
of all credit card spend in Australia is on Qantas Points earning credit cards
>50%6
more airline partners than nearest loyalty competitor
Engaged audience Unique assets Quality partners
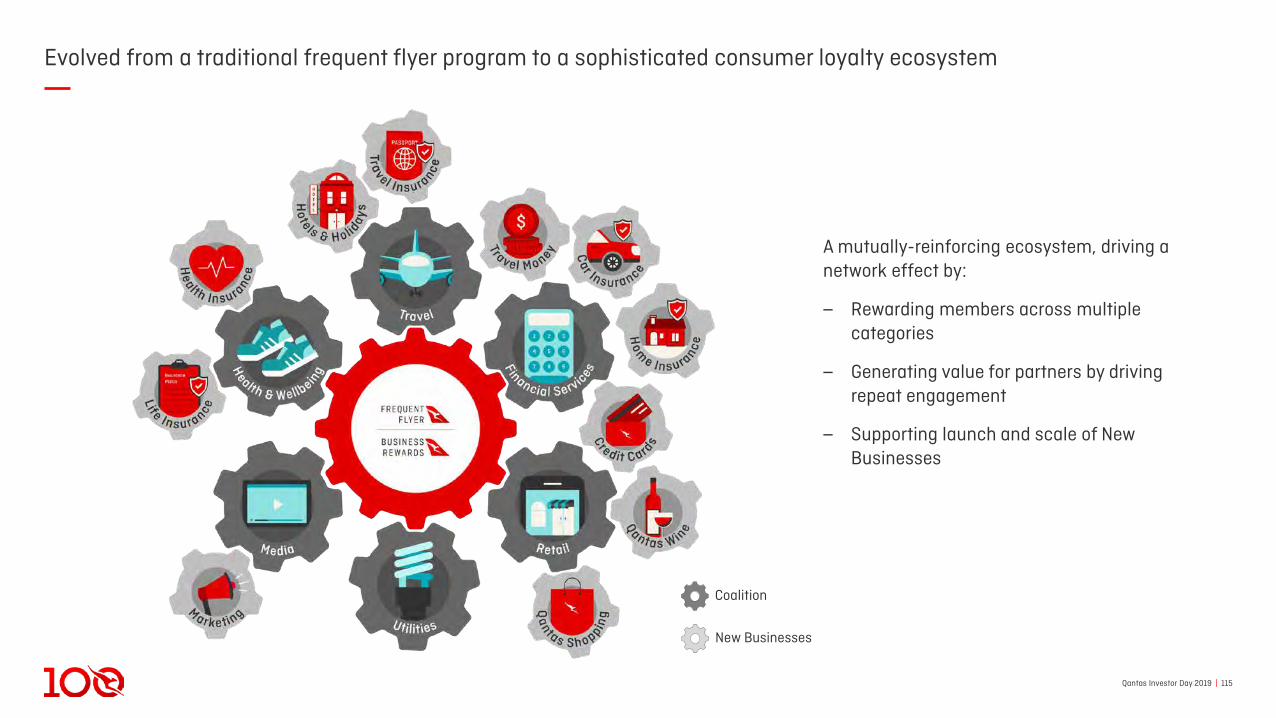
Qantas Investor Day 2019 | 115
Evolved from a traditional frequent flyer program to a sophisticated consumer loyalty ecosystem
A mutually-reinforcing ecosystem, driving a network effect by:
‒ Rewarding members across multiple categories
‒ Generating value for partners by driving repeat engagement
‒ Supporting launch and scale of NewBusinesses
New Businesses
Coalition
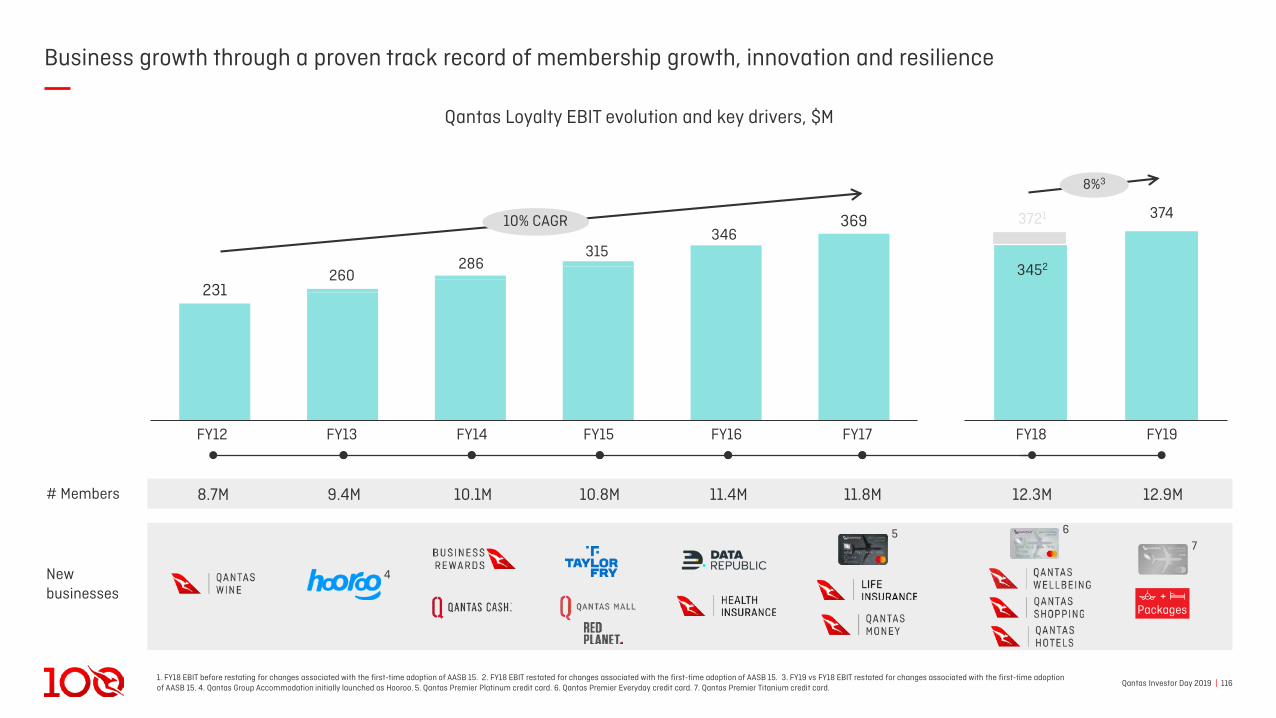
Qantas Investor Day 2019 | 116
Qantas Loyalty EBIT evolution and key drivers, $M
1. FY18 EBIT before restating for changes associated with the first-time adoption of AASB 15. 2. FY18 EBIT restated for changes associated with the first-time adoption of AASB 15. 3. FY19 vs FY18 EBIT restated for changes associated with the first-time adoptionof AASB 15. 4. Qantas Group Accommodation initially launched as Hooroo. 5. Qantas Premier Platinum credit card. 6. Qantas Premier Everyday credit card. 7. Qantas Premier Titanium credit card.
Business growth through a proven track record of membership growth, innovation and resilience
# Members 8.7M 9.4M 10.1M 10.8M 11.4M 11.8M 12.3M 12.9M
New businesses
231
369
FY18
260
FY12 FY16FY15 FY17FY13
286
FY14 FY19
315346
372110% CAGR
3452
374
8%3
5
4
67
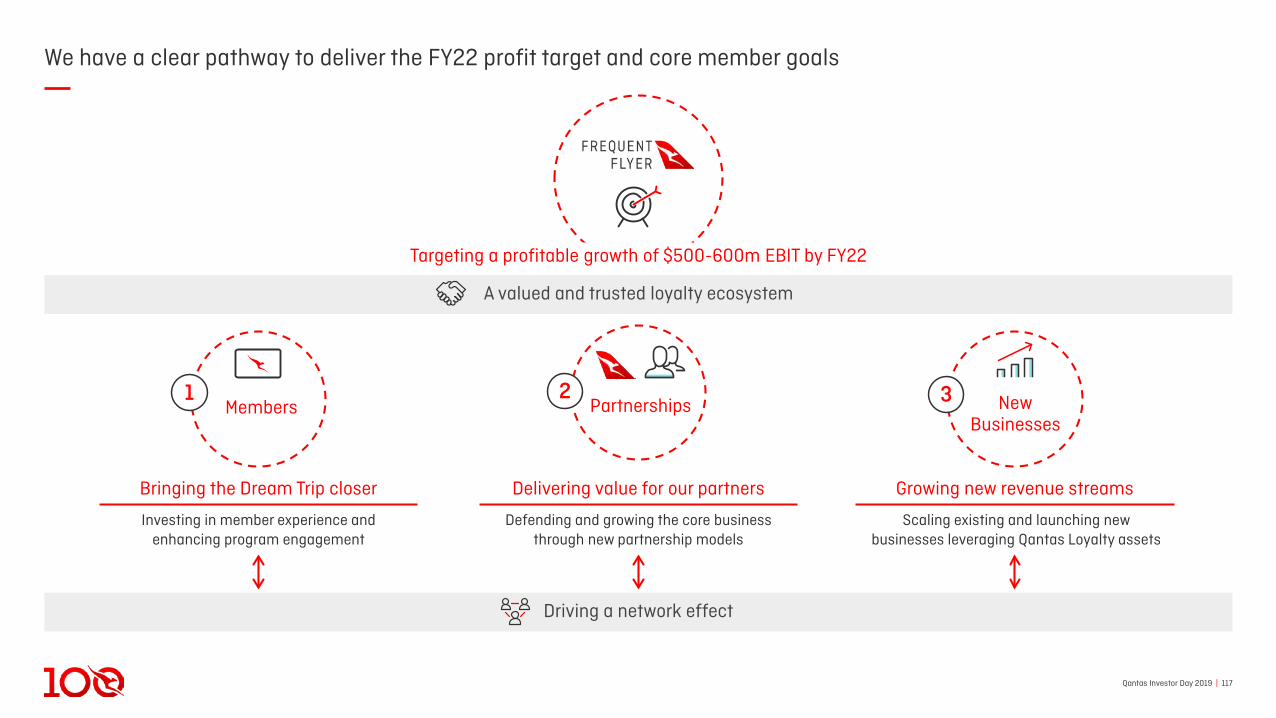
Qantas Investor Day 2019 | 117
We have a clear pathway to deliver the FY22 profit target and core member goals
Driving a network effect
Investing in member experience and enhancing program engagement
Targeting a profitable growth of $500-600m EBIT by FY22
Defending and growing the core business through new partnership models
Scaling existing and launching new businesses leveraging Qantas Loyalty assets
Bringing the Dream Trip closer Delivering value for our partners Growing new revenue streams
A valued and trusted loyalty ecosystem
Members Partnerships New Businesses
1 2 3
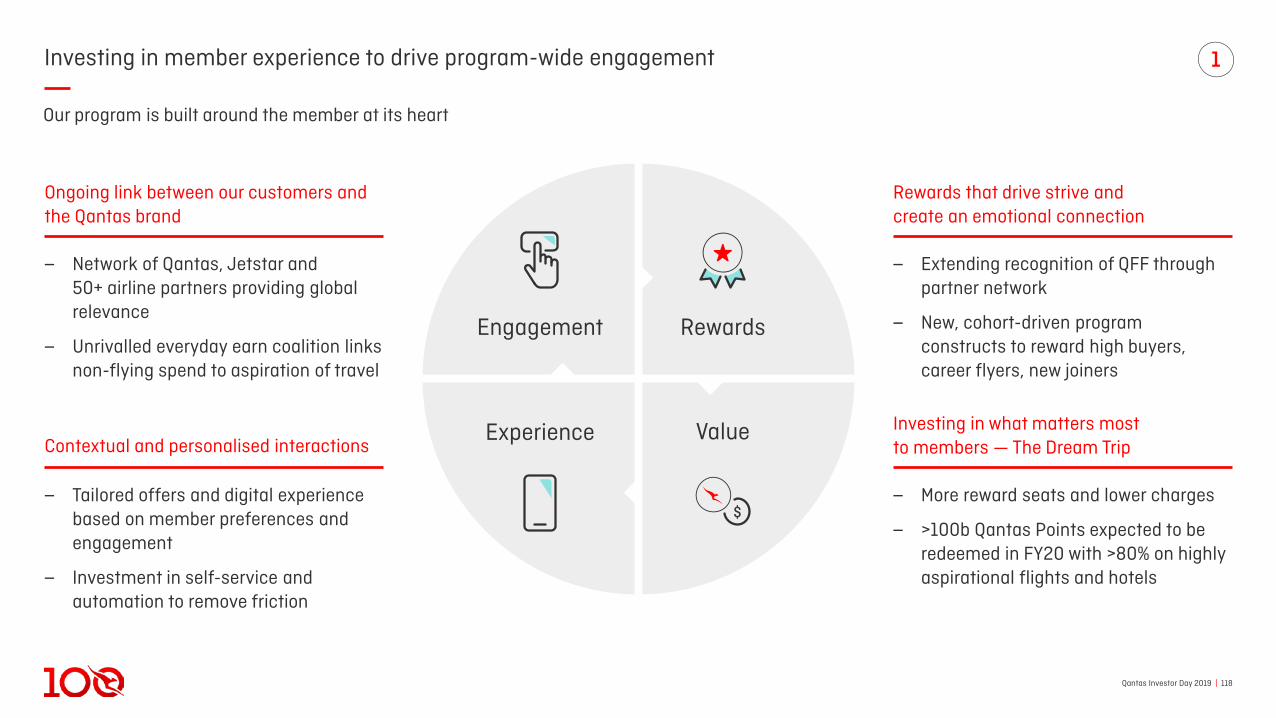
Qantas Investor Day 2019 | 118
Investing in member experience to drive program-wide engagement
‒ Extending recognition of QFF through partner network
‒ New, cohort-driven program constructs to reward high buyers, career flyers, new joiners
Rewards that drive strive andcreate an emotional connection
‒ More reward seats and lower charges
‒ >100b Qantas Points expected to be redeemed in FY20 with >80% on highly aspirational flights and hotels
Investing in what matters mostto members — The Dream Trip
‒ Network of Qantas, Jetstar and 50+ airline partners providing global relevance
‒ Unrivalled everyday earn coalition links non-flying spend to aspiration of travel
Ongoing link between our customers andthe Qantas brand
‒ Tailored offers and digital experience based on member preferences and engagement
‒ Investment in self-service andautomation to remove friction
Contextual and personalised interactions
Rewards
Value
Engagement
Experience
$
Our program is built around the member at its heart
1
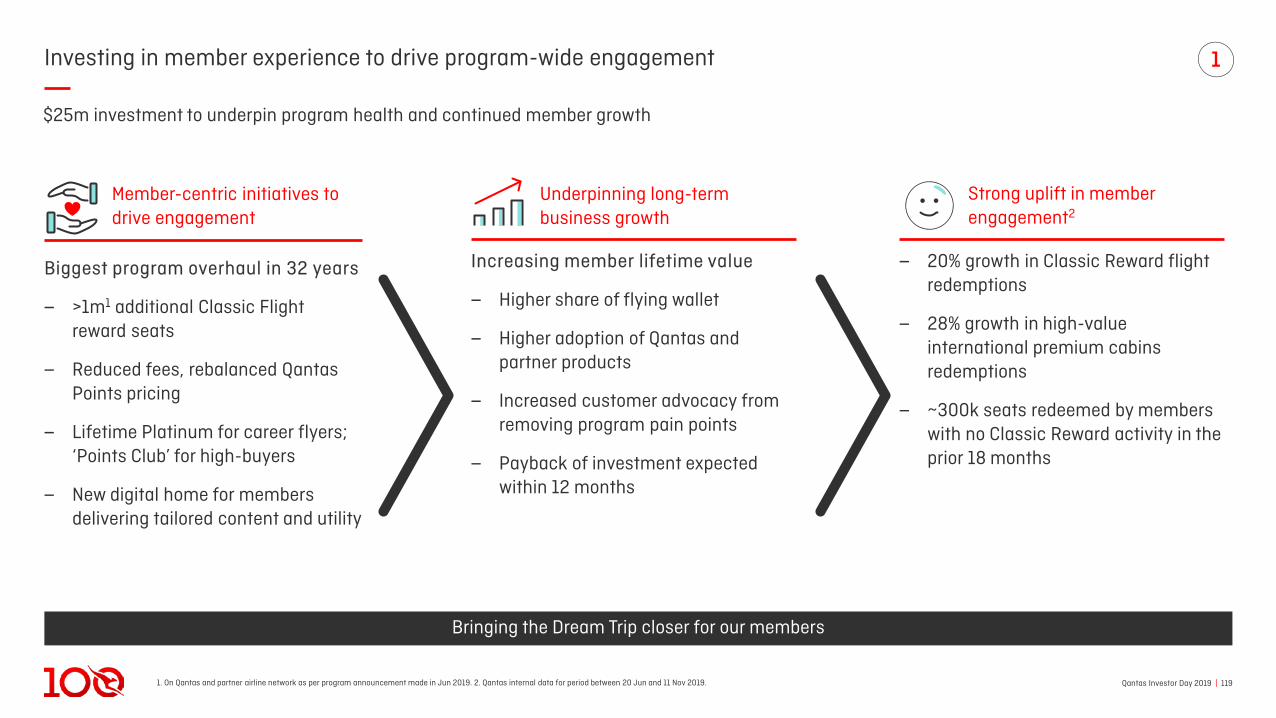
Qantas Investor Day 2019 | 1191. On Qantas and partner airline network as per program announcement made in Jun 2019. 2. Qantas internal data for period between 20 Jun and 11 Nov 2019.
Investing in member experience to drive program-wide engagement 1
Biggest program overhaul in 32 years
‒ >1m1 additional Classic Flightreward seats
‒ Reduced fees, rebalanced Qantas Points pricing
‒ Lifetime Platinum for career flyers; ‘Points Club’ for high-buyers
‒ New digital home for members delivering tailored content and utility
Member-centric initiatives to drive engagement
Underpinning long-term business growth
Increasing member lifetime value
‒ Higher share of flying wallet
‒ Higher adoption of Qantas and partner products
‒ Increased customer advocacy from removing program pain points
‒ Payback of investment expected within 12 months
Bringing the Dream Trip closer for our members
$25m investment to underpin program health and continued member growth
Strong uplift in member engagement2
‒ 20% growth in Classic Reward flight redemptions
‒ 28% growth in high-value international premium cabins redemptions
‒ ~300k seats redeemed by members with no Classic Reward activity in the prior 18 months
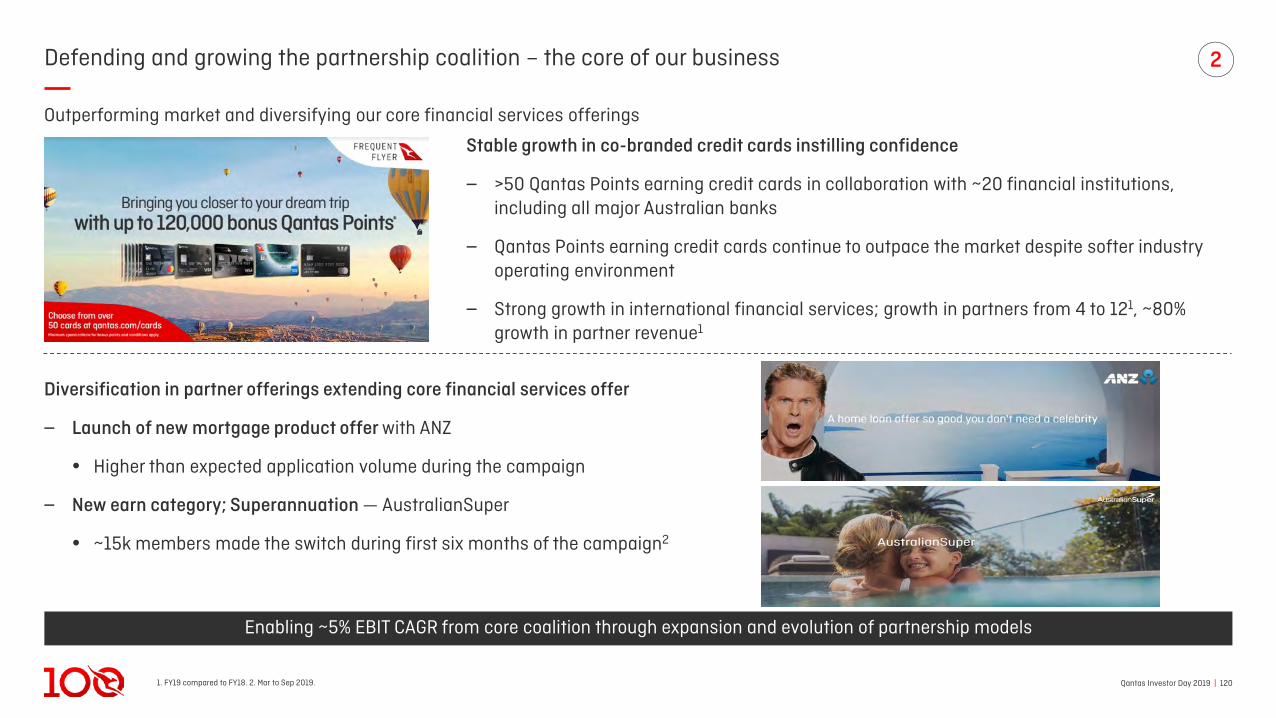
Qantas Investor Day 2019 | 1201. FY19 compared to FY18. 2. Mar to Sep 2019.
Defending and growing the partnership coalition – the core of our business 2
Outperforming market and diversifying our core financial services offerings
Stable growth in co-branded credit cards instilling confidence
‒ >50 Qantas Points earning credit cards in collaboration with ~20 financial institutions, including all major Australian banks
‒ Qantas Points earning credit cards continue to outpace the market despite softer industry operating environment
‒ Strong growth in international financial services; growth in partners from 4 to 121, ~80% growth in partner revenue1
Diversification in partner offerings extending core financial services offer
‒ Launch of new mortgage product offer with ANZ
• Higher than expected application volume during the campaign
‒ New earn category; Superannuation — AustralianSuper
• ~15k members made the switch during first six months of the campaign2
Enabling ~5% EBIT CAGR from core coalition through expansion and evolution of partnership models
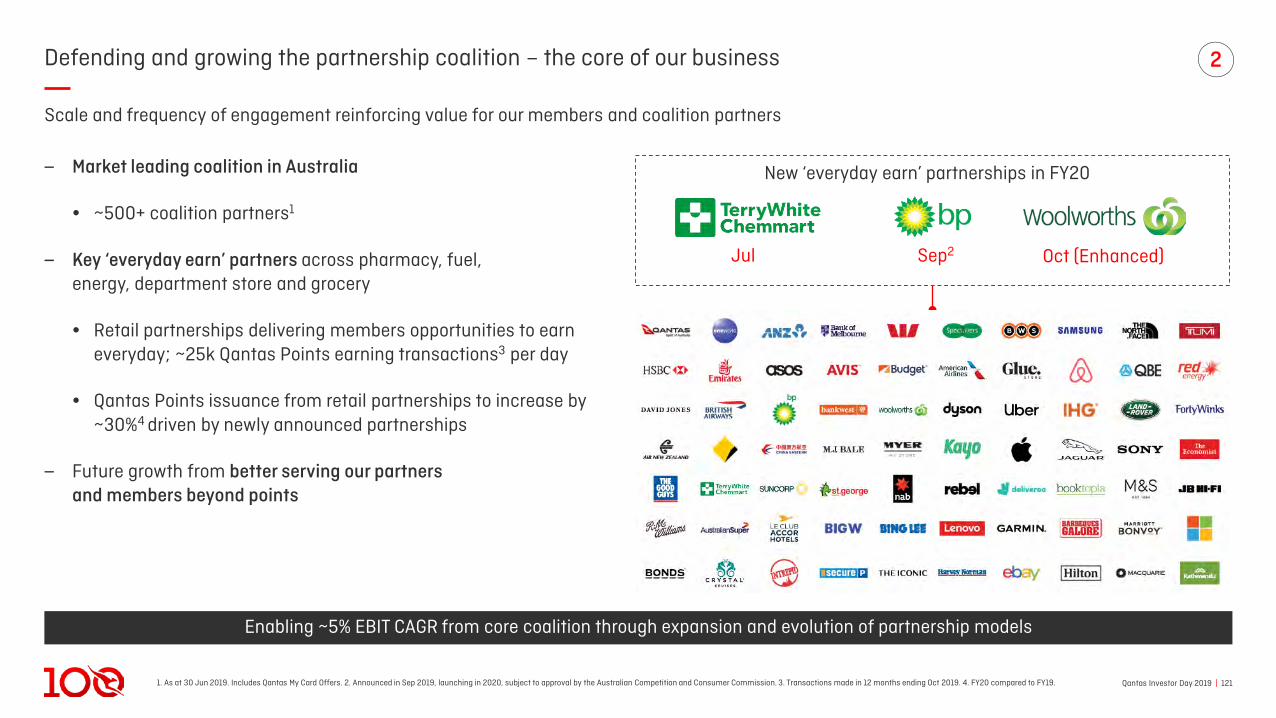
Qantas Investor Day 2019 | 1211. As at 30 Jun 2019. Includes Qantas My Card Offers. 2. Announced in Sep 2019, launching in 2020, subject to approval by the Australian Competition and Consumer Commission. 3. Transactions made in 12 months ending Oct 2019. 4. FY20 compared to FY19.
Defending and growing the partnership coalition – the core of our business
‒ Market leading coalition in Australia
• ~500+ coalition partners1
‒ Key ‘everyday earn’ partners across pharmacy, fuel,energy, department store and grocery
• Retail partnerships delivering members opportunities to earn everyday; ~25k Qantas Points earning transactions3 per day
• Qantas Points issuance from retail partnerships to increase by ~30%4 driven by newly announced partnerships
‒ Future growth from better serving our partnersand members beyond points
Enabling ~5% EBIT CAGR from core coalition through expansion and evolution of partnership models
New ‘everyday earn’ partnerships in FY20
Jul Sep2 Oct (Enhanced)
2
Scale and frequency of engagement reinforcing value for our members and coalition partners
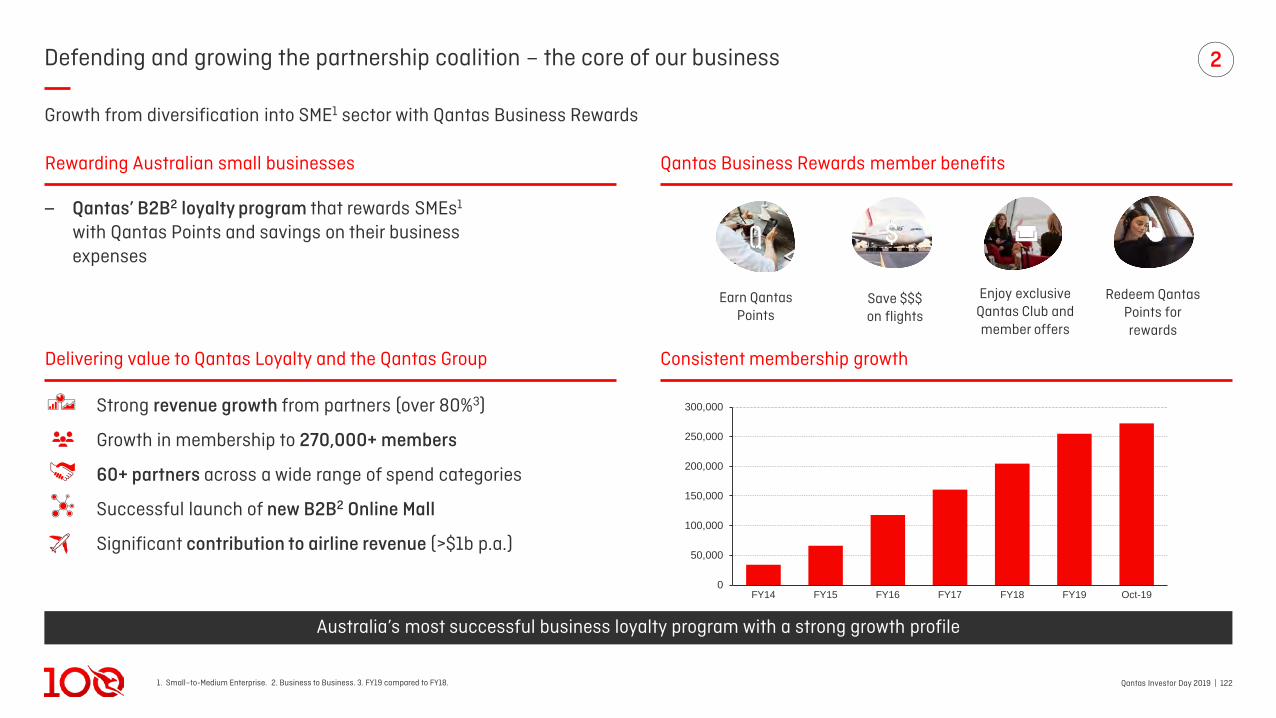
Qantas Investor Day 2019 | 1221. Small–to-Medium Enterprise. 2. Business to Business. 3. FY19 compared to FY18.
Defending and growing the partnership coalition – the core of our business
Australia’s most successful business loyalty program with a strong growth profile
Growth from diversification into SME1 sector with Qantas Business Rewards
‒ Qantas’ B2B2 loyalty program that rewards SMEs1
with Qantas Points and savings on their business expenses
Strong revenue growth from partners (over 80%3)
Growth in membership to 270,000+ members
60+ partners across a wide range of spend categories
Successful launch of new B2B2 Online Mall
Significant contribution to airline revenue (>$1b p.a.)
Earn Qantas Points
Save $$$on flights
Enjoy exclusive Qantas Club andmember offers
Redeem Qantas Points for rewards
Qantas Business Rewards member benefitsRewarding Australian small businesses
Consistent membership growthDelivering value to Qantas Loyalty and the Qantas Group
0
50,000
100,000
150,000
200,000
250,000
300,000
FY14 FY17FY15 FY16 FY18 FY19 Oct-19
2
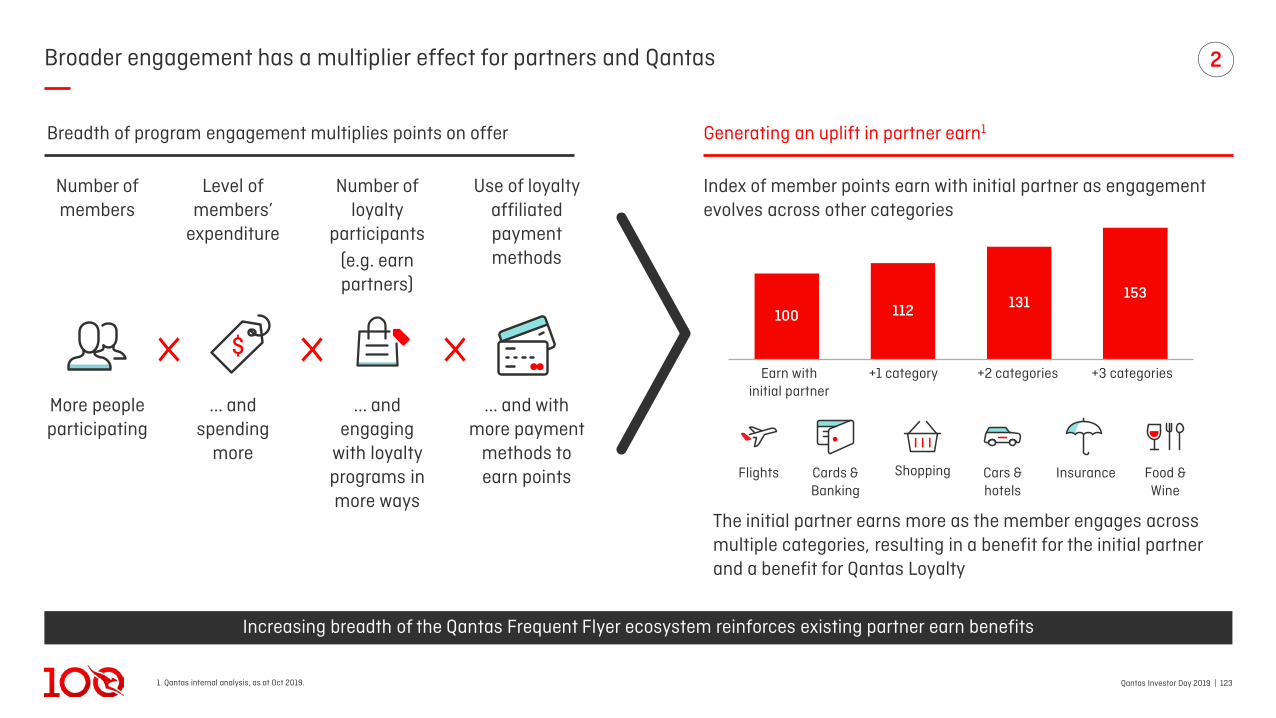
Qantas Investor Day 2019 | 1231. Qantas internal analysis, as at Oct 2019.
Broader engagement has a multiplier effect for partners and Qantas 2
Generating an uplift in partner earn1Breadth of program engagement multiplies points on offer
Number of members
Level of members’
expenditure
Number of loyalty
participants (e.g. earn partners)
Use of loyalty affiliated payment methods
More people participating
... and spending
more
... and engaging
with loyalty programs in more ways
... and with more payment
methods to earn points
Index of member points earn with initial partner as engagement evolves across other categories
The initial partner earns more as the member engages across multiple categories, resulting in a benefit for the initial partner and a benefit for Qantas Loyalty
100 112 131 153
Earn withinitial partner
+1 category +2 categories +3 categories
Flights Cards & Banking
Shopping Cars & hotels
Insurance Food & Wine
Increasing breadth of the Qantas Frequent Flyer ecosystem reinforces existing partner earn benefits
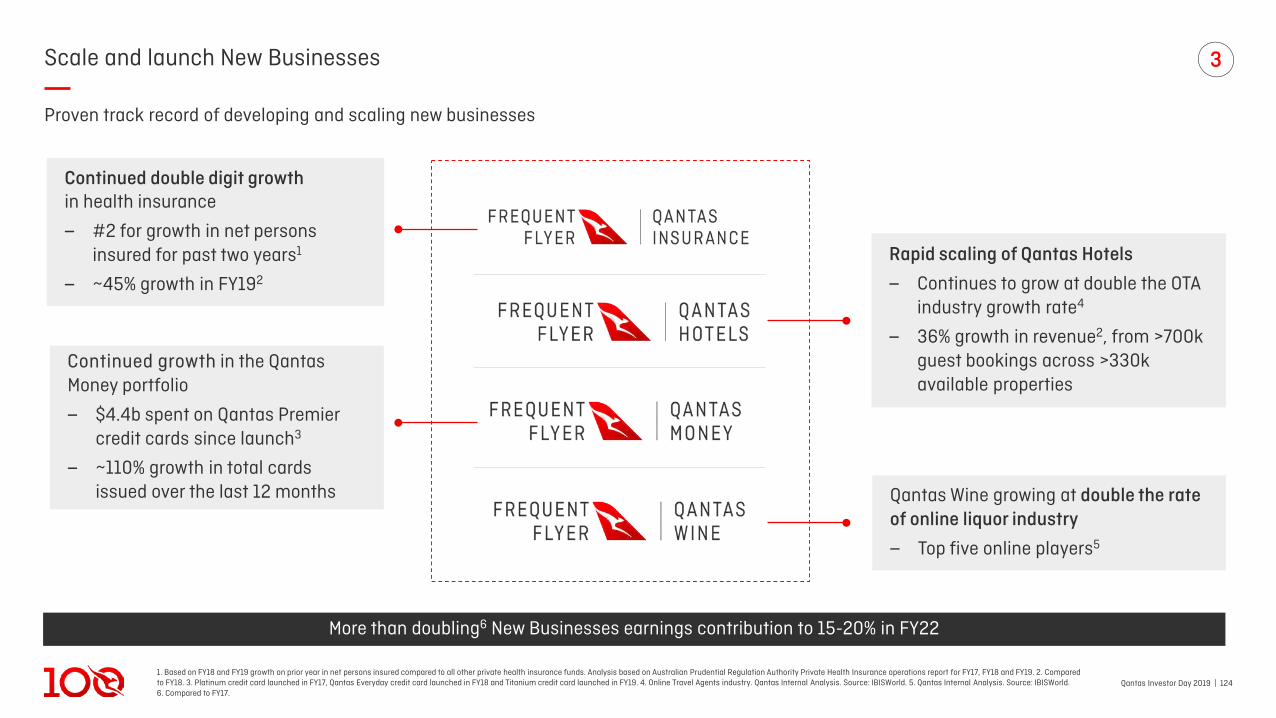
Qantas Investor Day 2019 | 1241. Based on FY18 and FY19 growth on prior year in net persons insured compared to all other private health insurance funds. Analysis based on Australian Prudential Regulation Authority Private Health Insurance operations report for FY17, FY18 and FY19. 2. Compared to FY18. 3. Platinum credit card launched in FY17, Qantas Everyday credit card launched in FY18 and Titanium credit card launched in FY19. 4. Online Travel Agents industry. Qantas Internal Analysis. Source: IBISWorld. 5. Qantas Internal Analysis. Source: IBISWorld. 6. Compared to FY17.
Scale and launch New Businesses 3
Proven track record of developing and scaling new businesses
Continued growth in the Qantas Money portfolio
‒ $4.4b spent on Qantas Premier credit cards since launch3
‒ ~110% growth in total cards issued over the last 12 months
Rapid scaling of Qantas Hotels
‒ Continues to grow at double the OTA industry growth rate4
‒ 36% growth in revenue2, from >700k guest bookings across >330k available properties
Qantas Wine growing at double the rate of online liquor industry
‒ Top five online players5
More than doubling6 New Businesses earnings contribution to 15-20% in FY22
Continued double digit growthin health insurance
‒ #2 for growth in net persons insured for past two years1
‒ ~45% growth in FY192

Qantas Investor Day 2019 | 1251. Based on industry gross earned premium in FY19. Source: The Australian Prudential Regulation Authority.
Scale and launch New Businesses 3
Our latest launch extends our Insurance portfolio
Understanding our latest venture
Disruptive growth partner— Auto and General is Australia’s fastest growing motor and home insurer. They bring their expertise,
underwriting of risk and claims management to the partnership in
this $10b1 industry
Price competitiveposition in market
Compelling member experience— drives effective member
acquisition and engagement leveraging QFF data and
digital capabilities
Market differentiated proposition driving positive
behaviour in an engaged manner (e.g. Qantas Points for safety)
RewardsInsights
Members
Digital
Evolution of the Qantas Insurance portfolio
Travel insurance
Healthinsurance
Lifeinsurance
Carinsurance
Homeinsurance
In market To be introduced in 2020
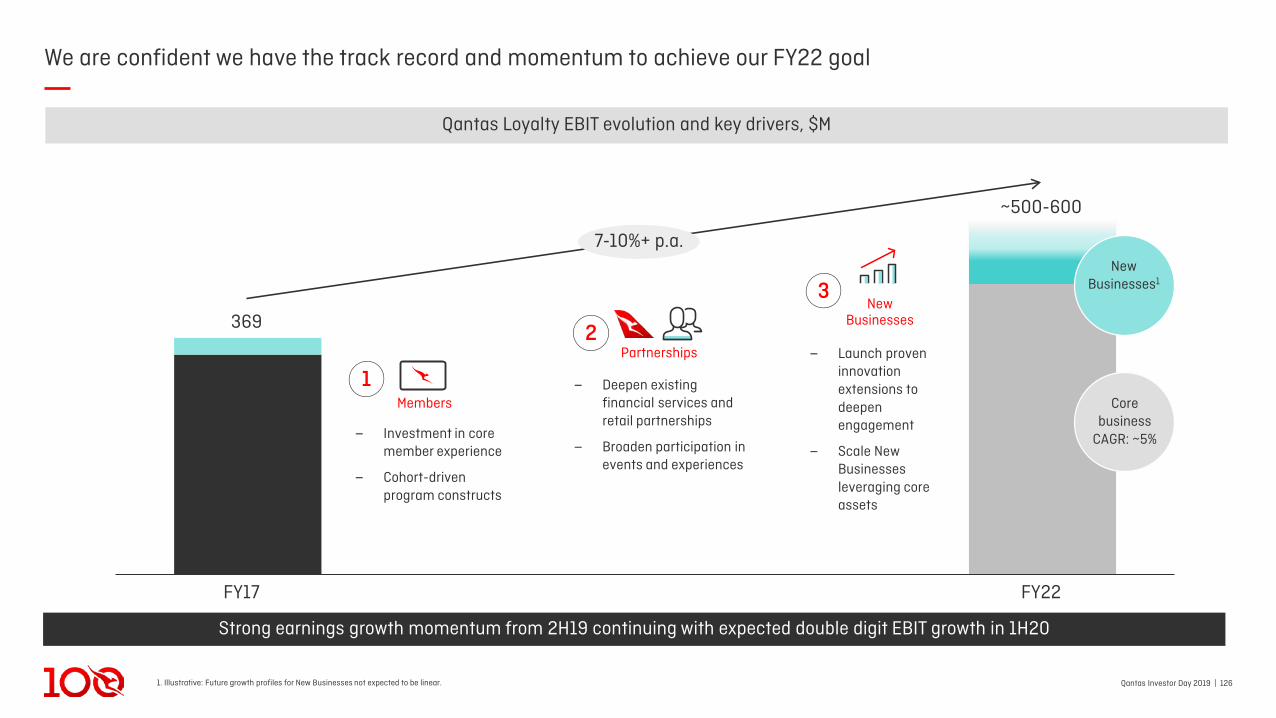
Qantas Investor Day 2019 | 126
Qantas Loyalty EBIT evolution and key drivers, $M
1. Illustrative: Future growth profiles for New Businesses not expected to be linear.
We are confident we have the track record and momentum to achieve our FY22 goal
369
FY17 FY22
~500-600
7-10%+ p.a.
‒ Investment in core member experience
‒ Cohort-driven program constructs
‒ Deepen existing financial services and retail partnerships
‒ Broaden participation in events and experiences
‒ Launch proven innovation extensions to deepen engagement
‒ Scale New Businesses leveraging core assets
Core business
CAGR: ~5%
1
2
3
Members
Partnerships
New Businesses
New Businesses1
Strong earnings growth momentum from 2H19 continuing with expected double digit EBIT growth in 1H20

Qantas Investor Day 2019 | 1271. Recognition is split across time of issuance and time of redemption.
Unique assets and capabilities have enabled diversified sources of value
Core points sale
Share of revenue from
New Businesses
Core points sales – generates points margin Margin is only generated on ‘external points’(unique to other airline loyalty programs)
Price sold to our Partners
Cost of the point
Breakage Overall contribution
Margin on point1
Breakage
redemption margin
Marketing revenue
Points issued
~60%
~40% InternalPrice = cost
ExternalPrice > cost
Qantas, Jetstar
~500+ partners
+
Creating value for our partners
• Customer acquisition
• Customer retention
• Increased share of wallet
Qantas Investor Day 2019 | 128
People and Culture
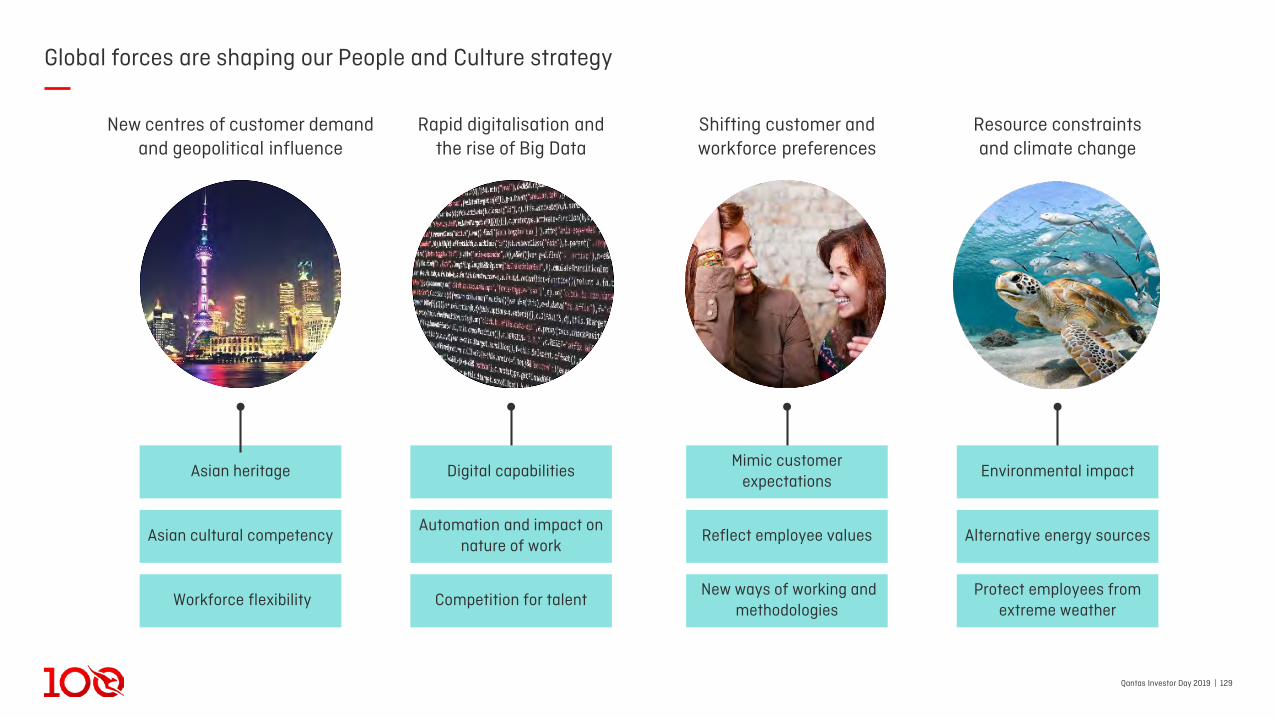
Qantas Investor Day 2019 | 129
Global forces are shaping our People and Culture strategy
Asian cultural competency
Asian heritage
Workforce flexibility
New centres of customer demand and geopolitical influence
Rapid digitalisation and the rise of Big Data
Shifting customer and workforce preferences
Resource constraints and climate change
Alternative energy sources
Protect employees from extreme weather
Environmental impact Mimic customer
expectations
New ways of working and methodologies
Reflect employee valuesAutomation and impact on
nature of work
Digital capabilities
Competition for talent
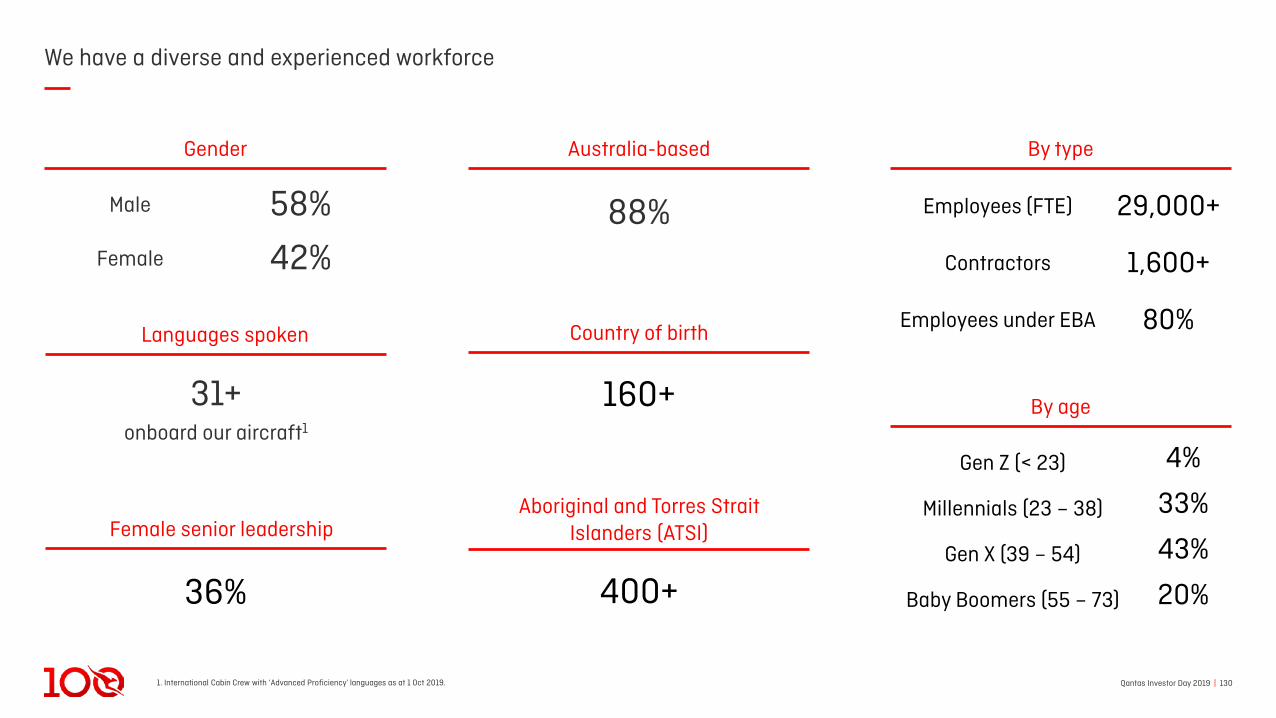
Qantas Investor Day 2019 | 1301. International Cabin Crew with ‘Advanced Proficiency’ languages as at 1 Oct 2019.
We have a diverse and experienced workforce
88%
Australia-based By typeGender
Languages spoken
31+onboard our aircraft1
Female senior leadership
36%
160+
Country of birth
400+
Aboriginal and Torres Strait Islanders (ATSI)
By age
Gen Z (< 23) 4%
Millennials (23 – 38) 33%
Gen X (39 – 54) 43%
Baby Boomers (55 – 73) 20%
Employees (FTE) 29,000+
Contractors 1,600+
Employees under EBA 80%
Male 58%Female 42%
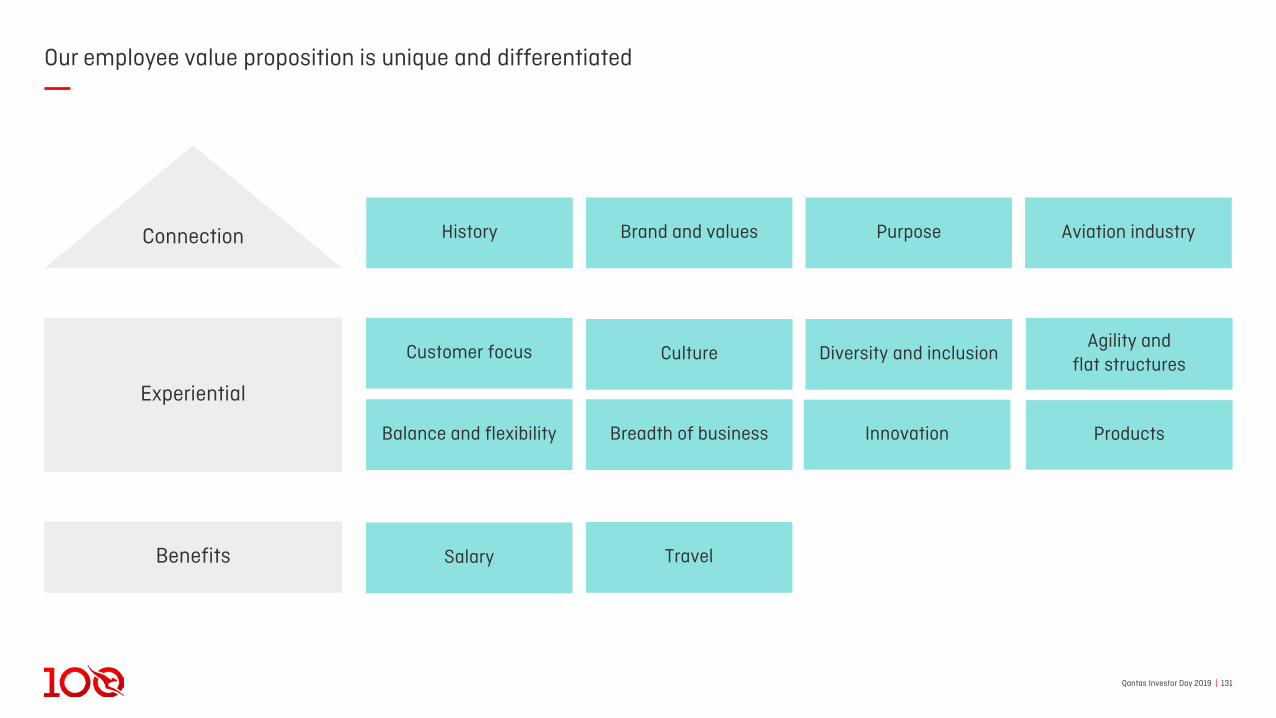
Qantas Investor Day 2019 | 131
Our employee value proposition is unique and differentiated
Connection
Experiential
Benefits
History
CultureAgility and
flat structures
Travel
Customer focus Diversity and inclusion
Balance and flexibility Breadth of business Innovation Products
Purpose
Salary
Aviation industryBrand and values
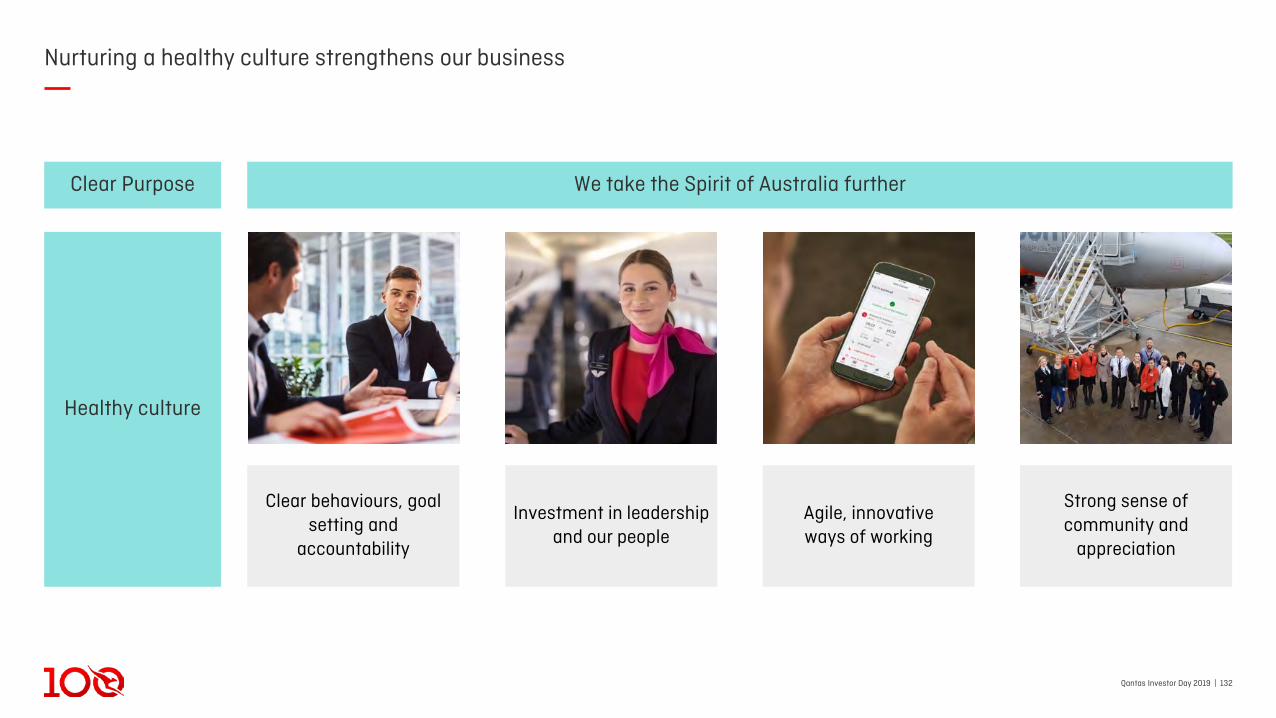
Qantas Investor Day 2019 | 132
Nurturing a healthy culture strengthens our business
Clear Purpose
Healthy culture
We take the Spirit of Australia further
Agile, innovativeways of working
Investment in leadership and our people
Clear behaviours, goal setting and
accountability
Strong sense of community and
appreciation
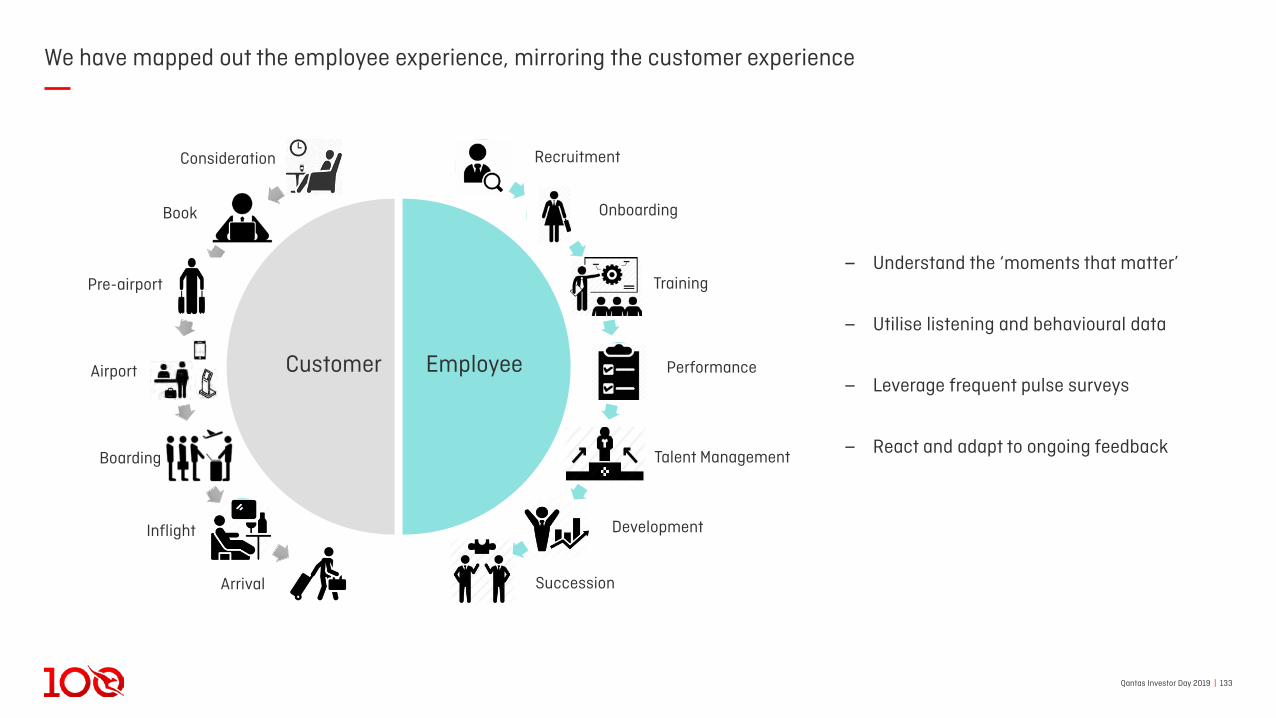
Qantas Investor Day 2019 | 133
We have mapped out the employee experience, mirroring the customer experience
2
3
4
5
6
7
810
11
12
13
14
15
16
EmployeeCustomer
Consideration
Book
Airport
Boarding
Inflight
Arrival
Recruitment
Onboarding
Training
Performance
Talent Management
Development
Succession
‒ Understand the ‘moments that matter’
‒ Utilise listening and behavioural data
‒ Leverage frequent pulse surveys
‒ React and adapt to ongoing feedback
Pre-airport

Qantas Investor Day 2019 | 1341. Source: Boeing 2019 Pilot and Technical Outlook.
We are actively pursuing employee growth in areas aligned to global forces
Qantas Group digital workforce
FY19 FY24
Governance & Leadership
Digital Marketing
Data Analytics
Digital Product
Digital Software Engineering
~1,600
~2,300
+45%
‒ High demand driven by digitalisation and the rise of Big Data
‒ Competition for talent for digitally capable workforce
‒ Digital workers tend to be Millennials with different expectations of the employee experience and career progression
‒ Requirement for reskilling to ensure sufficient supply
‒ Specific employee value proposition developed to recruit and retain capabilities
‒ Pilot demand driven by rapid growth in Asia
‒ Increasing competition for talent from other industries
‒ Pilot Academy established to grow supply and encourage careers in industry
‒ Opportunity to leverage geography, Australian operating environment and Qantas brand to train pilots for other airlines, particularly in Asia-Pacific
Global pilot incremental demand1
2019-2038World Demand: 804,000
212,000North America
54,000Latin America
148,000Europe
27,000Russia & Central Asia
266,000Asia-Pacific29,000
Africa
68,000Middle East
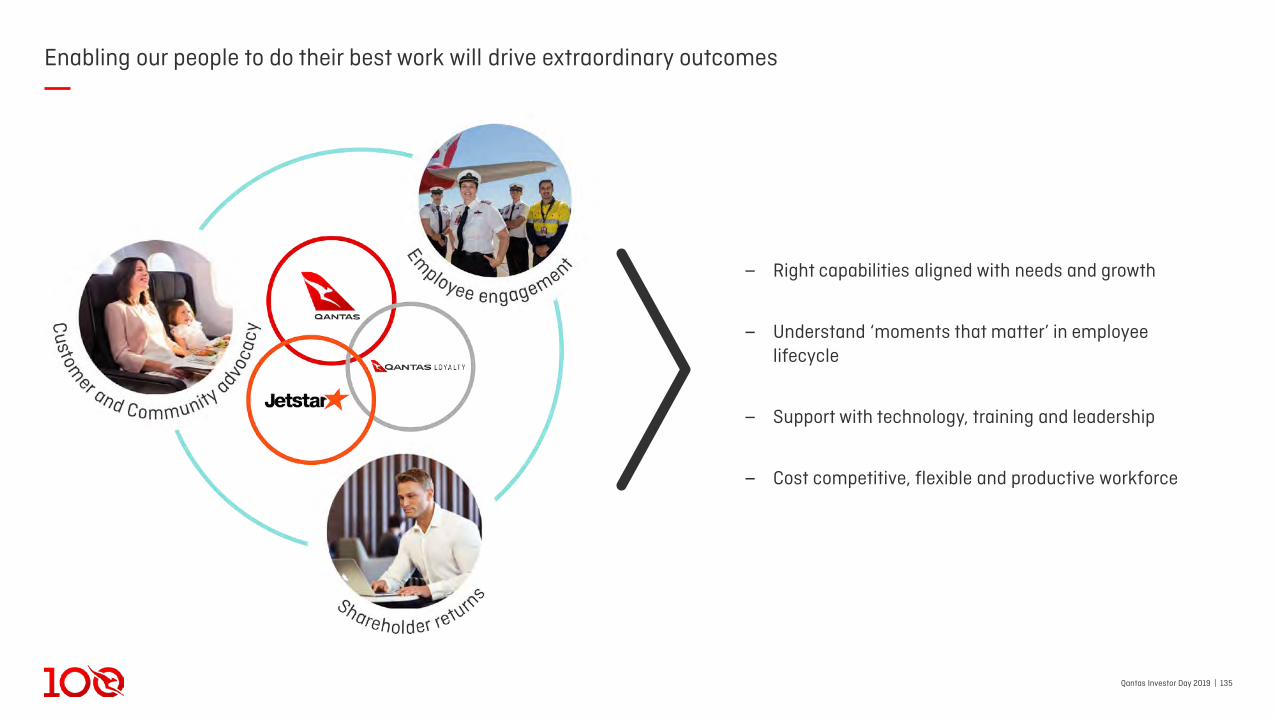
Qantas Investor Day 2019 | 135
Enabling our people to do their best work will drive extraordinary outcomes
‒ Right capabilities aligned with needs and growth
‒ Understand ‘moments that matter’ in employee lifecycle
‒ Support with technology, training and leadership
‒ Cost competitive, flexible and productive workforce
CEO Wrap Up
100 Years of The Spirit of Australia
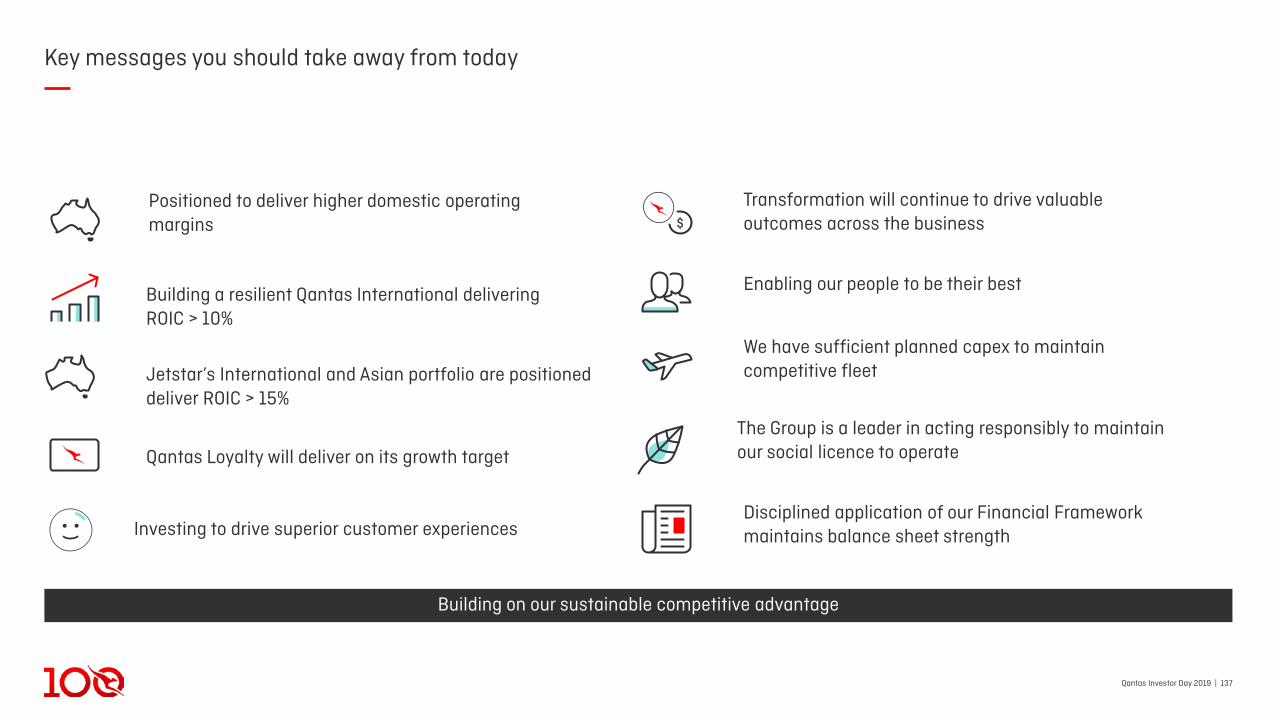
Qantas Investor Day 2019 | 137
Key messages you should take away from today
Positioned to deliver higher domestic operating margins
Building a resilient Qantas International delivering ROIC > 10%
Enabling our people to be their best
Transformation will continue to drive valuable outcomes across the business
Building on our sustainable competitive advantage
$
Jetstar’s International and Asian portfolio are positioned deliver ROIC > 15%
Qantas Loyalty will deliver on its growth target
Disciplined application of our Financial Framework maintains balance sheet strengthInvesting to drive superior customer experiences
We have sufficient planned capex to maintain competitive fleet
The Group is a leader in acting responsibly to maintainour social licence to operate
Qantas Investor Day 2019 | 138
Disclaimer and ASIC guidance
This Presentation has been prepared by Qantas Airways Limited (ABN 16 009 661 901) (Qantas). While every effort has been made to check the accuracy of the information in this document, it may not be free from errors and you should make your own enquiries to verify any information you wish to rely on, as appropriate for your own requirements.
Summary information This Presentation contains a general summary of information about Qantas and its subsidiaries (Qantas Group) and their activities as at 19 November 2019, or as otherwise stated. The information in this Presentation does not purport to be complete. It should be read in conjunction with the Qantas Group’s other periodic and continuous disclosure announcements lodged with the Australian Securities Exchange, which are available at www.asx.com.au.
Not financial product advice This Presentation is for information purposes only and is not financial product or investment advice or a recommendation to acquire Qantas shares. It has been prepared without taking into account the objectives, financial situation or needs of individuals. Before making an investment decision prospective investors should consider the appropriateness of the information having regard to their own objectives, financial situation and needs and should seek independent legal and taxation advice appropriate to their jurisdiction. Qantas is not licensed to provide financial product advice in respect of Qantas shares. Cooling off rights do not apply to the acquisition of Qantas shares.
Not tax adviceTax implications for individual shareholders will depend on the circumstances of the particular shareholder. Shareholders should therefore seek their own professional advice in relation to their tax position. Neither Qantas nor any of its officers, employees, agents, affiliates or advisers assumes any liability or responsibility the tax consequences of shareholder decisions or actions.
Financial data All dollar values are in Australian dollars (A$) and financial data is presented within the six months ended 30 June 2019 unless otherwise stated.
Future performance To the extent that the information in this Presentation contains any forward-looking statements, opinions and estimates, these are the reasonably held, subjective views of Qantas as at the relevant date, and may be based on assumptions and contingencies which are subject to unforeseen change. Any statements about market and industry trends are based on interpretations of current market conditions. This information is presented as a general guide only and should not be relied upon as an indication or guarantee of future projections, earnings or performance.
Investment in shares are subject to investment risks and other known and unknown risks, many of which are outside the control of the Qantas Group.
No representation or warranty, express or implied, is given as to the accuracy, completeness or correctness, likelihood of achievement or reasonableness of any forecasts, prospects or returns contained in this Presentation nor is any obligation assumed to update such information.
Before making an investment decision, you should consider, whether the investment is appropriate in light of your particular investment needs, objectives and circumstances and seek independent professional tax, financial or legal advice as appropriate.
Past performance
Past performance information given in this Presentation is given for illustrative purposes only and should not be relied upon as (and is not) an indication of future performance.
Not an offer This Presentation is not, and should not be considered, an offer or an invitation to acquire Qantas shares or any other financial products.
ASIC GUIDANCEIn December 2011 ASIC issued Regulatory Guide 230. To comply with this Guide, Qantas is required to make a clear statement about whether information disclosed in documents other than the financial report has been audited or reviewed in accordance with Australian Auditing Standards. In line with previous years, this Presentation is unaudited. Notwithstanding this, the Presentation contains disclosures which are extracted or derived from the consolidated Financial Report for the full year ended 30 June 2019 which has been audited by the Group’s Independent Auditor.