Embed Size (px)
Citation preview

Investments in Building Citywide Out-of-School-Time Systems: A Six-City StudyCheryl Hayes, Christianne Lind, Jean Baldwin Grossman, Nichole Stewart, Sharon Deich, Andrew Gersick, Jennifer McMaken and Margo Campbell
Commissioned by The Wallace Foundation
Synopsis


Public/Private Ventures’ Out-of-School-Time Cost Study Team
The Finance Project’s Out-of-School-Time Cost Study Team
Margo Campbell Soumya BhatAndrew Gersick Sharon DeichJean Baldwin Grossman Cheryl HayesJennifer McMaken Christianne Lind
Nanette RelaveNichole Stewart
Cheryl Hayes
Christianne Lind
Jean Baldwin Grossman
Nichole Stewart
Sharon Deich
Andrew Gersick
Jennifer McMaken
Margo Campbell
Investments in Building Citywide Out-of-School-Time Systems: A Six-City Study
Synopsis
Commissioned by The Wallace Foundation

Board of Directors
Matthew T. McGuire, ChairPrincipal
Origami Capital Partners, LLCYvonne Chan
Principal Vaughn Learning Center
The Honorable Renée Cardwell Hughes
Judge, Court of Common Pleas The First Judicial District, Philadelphia, PA
Christine L. James-BrownPresident and CEO
Child Welfare League of America
Robert J. LaLondeProfessor
The University of ChicagoJohn A. Mayer, Jr.
Retired, Chief Financial Officer J. P. Morgan & Co.
Anne Hodges MorganConsultant to Foundations
Siobhan NicolauPresident
Hispanic Policy Development Project
Marion PinesSenior Fellow
Institute for Policy Studies Johns Hopkins University
Clayton S. RoseSenior Lecturer
Harvard Business SchoolCay Stratton
Special Adviser UK Commission for Employment and Skills
Sudhir VenkateshWilliam B. Ransford
Professor of Sociology Columbia University
William Julius WilsonLewis P. and Linda L.
Geyser University Professor Harvard University
Research Advisory Committee
Jacquelynne S. Eccles, ChairUniversity of Michigan
Robert GrangerWilliam T. Grant Foundation
Robinson HollisterSwarthmore College
Reed LarsonUniversity of Illinois
Jean E. RhodesUniversity of Massachusetts,
BostonThomas Weisner
UCLA
Public/Private Ventures is a national leader in creating and strengthening programs that improve lives in low-income communities. We do this in three ways:
innovationWe work with leaders in the field to identify promising existing programs or develop new ones.
researchWe rigorously evaluate these programs to determine what is effective and what is not.
actionWe reproduce model programs in new locations, provide technical assistance where needed and inform policymakers and practitioners about what works.
P/PV is a 501(c)(3) nonprofit, nonpartisan organization with offices in Philadelphia, New York City and Oakland. For more information, please visit www.ppv.org.
The Finance ProjectHelping leaders finance and sustain initiatives that lead to better futures for children, families and communities.
The Finance Project is an independent nonprofit research, consulting, technical assistance, and training firm for public and private sector leaders nationwide. We specialize in help-ing leaders plan and implement financing and sustainability strategies for initiatives that benefit children, families and communities. Through a broad array of products, tools and services, we help leaders make smart investment decisions, develop sound financing strategies, and build solid partner-ships. To learn more, visit www.financeproject.org.
The Wallace FoundationThe Wallace Foundation seeks to support and share effective ideas and practices that expand learning and enrichment opportunities for all people. Its three current objectives are:
• Strengthen education leadership to improve student achievement,
• Improve after-school learning opportunities and
• Build appreciation and demand for the arts.
For more information and research on these and other related topics, please visit Wallace’s Knowledge Center at www.wallacefoundation.org.
To fulfill its mission, The Wallace Foundation often commis-sions research and supports the creation of various publica-tions. In all cases, the findings and recommendations of individual reports are solely those of their authors.

Investments in Building Citywide Out-of-School-Time Systems: A Six-City Study Synopsis 1
Out-of-school-time (OST) programs play a vital role in many children’s academic and social development. To address the grow-ing demand for and interest in these activities, a number of US cities have initiated efforts to create OST “systems”—coherent, shared infrastructures designed to support, coordinate and sustain OST programs citywide.
For emerging system-building efforts to succeed, policymakers, city leaders and funders need lessons, ideas and information to guide their investments in system planning, start-up and ongoing operations. This knowledge can assist these decision-makers as they assemble the necessary staff and funding to get their own efforts off the ground.
To meet this need, The Wallace Foundation com-missioned The Finance Project and Public/Private Ventures to conduct a study of the investments six cities—Boston, Charlotte, Chicago, Denver, New York City and Seattle—made in building OST systems. Using a case-study approach, this study explores:
• Strategies and activities commonly pursued in building citywide OST systems;
• Monetary and in-kind investments associated with these efforts;
• Variations in investments from city to city; and
• Options for financing system-building efforts.
The study’s findings can inform OST system-building efforts across the country—by helping stakeholders understand the potential roles and functions of OST systems, the range of resources needed to build a solid infrastructure and the vari-ety of funding sources that can be tapped for system development and maintenance.
This is a summary of the final report in a series documenting the costs of OST programs and the city-level systems that support them. Below we briefly present the framework we used to categorize system costs, and lay out the key findings. A brief
description of the systems in each of the six cities— as they stood at the time of the study—can be found on page 4. This synopsis and the full report serve as a companion to two previous resources: The Cost of Quality Out-of-School-Time Programs,1 which provides detailed information on both the average out-of-pocket expenditures and the average full cost of a wide range of quality OST programs; and an online “cost calculator”2 that enables users to generate tailored cost estimates for many different types of OST programs. This report builds on these resources by discussing the strategies and system-level investments made to support OST program-ming in the same six cities where we previously gathered program-cost data.
A Conceptual Framework for OST System Building
Currently, there is no accepted model for building an effective OST system, so defining what a well-functioning, coordinated system consists of—as well as outlining how to plan, operate and sustain such a system—remains a critical goal for OST researchers.3 By carefully documenting the specific actions city leaders took to strengthen their OST system, this study further refines the conceptual framework other researchers have used to think about such systems.4 Our research suggests that cities strengthen their OST infrastructure by pur-suing four major strategies:
• Providing leadership and vision;
• Improving program quality;
• Expanding access to and participation in quality programs; and
• Financing and sustaining citywide programming and infrastructure.
These broad strategies are aimed at achieving the overarching goals of the cities’ OST systems and can encompass a variety of specific approaches and activities—from establishing governing bodies and developing quality standards to creating resource and referral systems and exploring funding options. Table 1 on the next page outlines the types of activi-ties city leaders undertook as part of these four larger strategies.

2 Investments in Building Citywide Out-of-School-Time Systems: A Six-City Study Synopsis
Table 1Conceptual Framework for OST System-Building Efforts
Strategies
ProvidingLeadership and Vision
ImprovingProgram Quality
Expanding Access toand Participation in Quality
Programs
Financing and Sustaining Citywide Programming and
Infrastructure
Activities
•Individual leaders, usually mayors, who use their position and influence to focus attention on the need for OST programs, bring people together, mobi-lize public- and private-sector resources and spearhead efforts to develop mechanisms for providing systematic guidance, management and support;
•Citywide governing bodies that lead, advise and monitor system-building efforts;
•OST intermediaries, generally independent nonprofit organiza-tions established outside city government that foster collabo-ration and coordination among public- and private-sector stake-holders and mobilize resources;
•Partnerships and collaborations among local individuals and organizations that have a stake in OST, which enable them to pool knowledge and resources to support shared system-building goals; and
•Business planning by the system leaders that identifies system-building needs, priori-ties and the core strategies and activities to be pursued.
•Technical assistance, training, higher education and profes-sional development for OST program staff;
•Alignment of OST program-ming with school curricula to ensure that OST offerings reinforce what students learn in the classroom;
•Quality standards and evalu-ation initiatives to assess pro-gram effectiveness; and
•Data management systems to compile and organize informa-tion on OST programs and their operations.
•City-level resource and referral systems to facilitate access to existing programs;
•Market research by system leaders to better understand the needs and preferences of local families and communities;
•Outreach to families to increase awareness of OST opportunities;
•Program innovation to attract and better serve diverse popula-tions of local children and youth; and
•Building facilities and securing rent-free space for OST pro-grams throughout the city.
•Training and technical assis-tance to help OST programs develop and diversify funds;
•Exploring funding options to support and sustain OST initia-tives;
•Advocacy at the state and local levels to build public support and influence OST policy and funding decisions; and
•Business planning to lay the groundwork for the organizational and financial sustainability of OST system-building efforts.
Study Findings in Brief
We found no single blueprint for building success-ful OST systems. In many ways, city-level system-building efforts are charting new ground. The six cities examined in this study are among the leaders in a national movement to develop effective OST systems. Yet even today, not one has what could be called a fully formed system. Nevertheless, dur-ing the study period—October through December 2007—the initiatives in these cities had matured to a stage such that their experiences could provide leaders in other localities with useful ideas, informa-tion and lessons concerning investments in system planning, start-up and ongoing operations.
A number of key findings related to investments in each of the four primary strategies for city-level OST system building emerged from our study:
• There is no “right” cost or investment for build-ing citywide OST systems. Rather, costs depend on the desired scale of the system, the strategies and activities employed, the available resources, and whether the system can leverage existing efforts or needs to be built from scratch. We found wide variations in the amount of resources and the proportions of investments that city lead-ers devoted to the four key strategies for system building we identified.
Investments in Building Citywide Out-of-School-Time Systems: A Six-City Study Synopsis 3
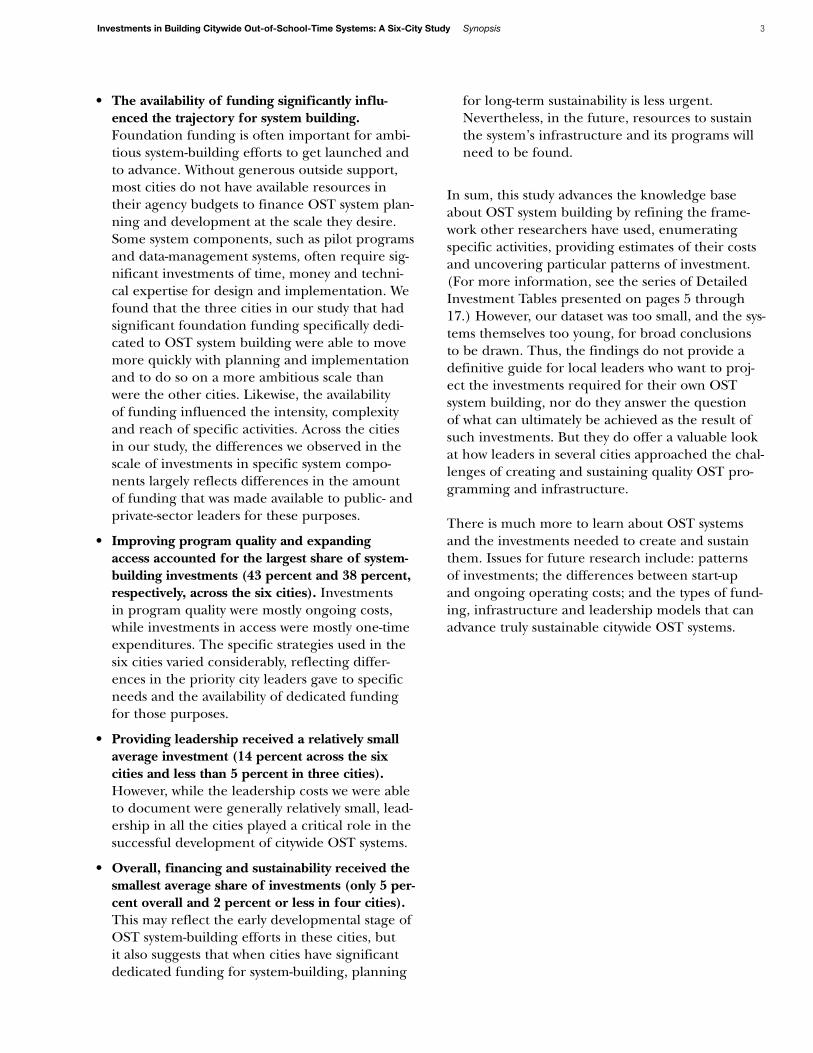
• The availability of funding significantly influ-enced the trajectory for system building. Foundation funding is often important for ambi-tious system-building efforts to get launched and to advance. Without generous outside support, most cities do not have available resources in their agency budgets to finance OST system plan-ning and development at the scale they desire. Some system components, such as pilot programs and data-management systems, often require sig-nificant investments of time, money and techni-cal expertise for design and implementation. We found that the three cities in our study that had significant foundation funding specifically dedi-cated to OST system building were able to move more quickly with planning and implementation and to do so on a more ambitious scale than were the other cities. Likewise, the availability of funding influenced the intensity, complexity and reach of specific activities. Across the cities in our study, the differences we observed in the scale of investments in specific system compo-nents largely reflects differences in the amount of funding that was made available to public- and private-sector leaders for these purposes.
• Improving program quality and expanding access accounted for the largest share of system-building investments (43 percent and 38 percent, respectively, across the six cities). Investments in program quality were mostly ongoing costs, while investments in access were mostly one-time expenditures. The specific strategies used in the six cities varied considerably, reflecting differ-ences in the priority city leaders gave to specific needs and the availability of dedicated funding for those purposes.
• Providing leadership received a relatively small average investment (14 percent across the six cities and less than 5 percent in three cities). However, while the leadership costs we were able to document were generally relatively small, lead-ership in all the cities played a critical role in the successful development of citywide OST systems.
• Overall, financing and sustainability received the smallest average share of investments (only 5 per-cent overall and 2 percent or less in four cities). This may reflect the early developmental stage of OST system-building efforts in these cities, but it also suggests that when cities have significant dedicated funding for system-building, planning
for long-term sustainability is less urgent. Nevertheless, in the future, resources to sustain the system’s infrastructure and its programs will need to be found.
In sum, this study advances the knowledge base about OST system building by refining the frame-work other researchers have used, enumerating specific activities, providing estimates of their costs and uncovering particular patterns of investment. (For more information, see the series of Detailed Investment Tables presented on pages 5 through 17.) However, our dataset was too small, and the sys-tems themselves too young, for broad conclusions to be drawn. Thus, the findings do not provide a definitive guide for local leaders who want to proj-ect the investments required for their own OST system building, nor do they answer the question of what can ultimately be achieved as the result of such investments. But they do offer a valuable look at how leaders in several cities approached the chal-lenges of creating and sustaining quality OST pro-gramming and infrastructure.
There is much more to learn about OST systems and the investments needed to create and sustain them. Issues for future research include: patterns of investments; the differences between start-up and ongoing operating costs; and the types of fund-ing, infrastructure and leadership models that can advance truly sustainable citywide OST systems.

4 Investments in Building Citywide Out-of-School-Time Systems: A Six-City Study Synopsis
Summary of Cities and Their Systems
Boston is a midsize city with school enrollment (grades K-12) of 85,371 children5 and approximately 1,000 OST pro-grams.6 At the time of our study, its system was decentralized, having developed over decades from a number of separate OST organizations and initiatives, including Making the Most of Out-of-School Time (MOST).7 Boston’s recent system-building efforts were spearheaded by schools, nonprofit organizations and foundations that provided support to some, but not all, OST programs.
Charlotte is a midsize city with school enrollment of 115,927 students.8 Although its OST system was relatively young and still relatively decentralized at the time of this study, an intermediary was spearheading the system-building efforts. Additional leadership was provided by the school district, local government and philanthropy. The city-county structure of the Charlotte-Mecklenburg area has important implications for the organization and financing of the system. Much of the quality improvement activity was aimed at 109 school districts’ After School Enrichment Program (ASEP) sites, which served more than 6,000 students.
Chicago is a large city with school enrollment of 479,746 children.9 Like Boston, Chicago was involved in early system-building efforts through MOST. Over time, Chicago’s system has expanded to include all 1,300 publicly funded OST pro-grams in the city, serving 25,000 children. At the time of the study, the system was centrally but jointly coordinated by the Chicago Department of Family & Support Services, Office of Children and Youth Services and After School Matters. The mayor, leaders from an array of city agencies, public schools, community-based nonprofit organizations, local universities and advocacy organizations were all involved in the system.
Denver is a midsize city with school enrollment of 85,268 students10 and more than 700 OST programs.11 Denver has had a long history of OST system building. At the time of our study, city leaders were transitioning to a more centralized system based in Denver’s public schools. The mayor and city officials, as well as the city’s youth-serving organizations, played key roles in supporting and advancing system-building efforts.
New York City is a large city with more than 1.39 million school enrollees.12 New York City’s system-building efforts date back to 1998, with the launch of The After-School Corporation (TASC), an OST intermediary, with support from the Soros Foundation. Recently the system has become centralized under the city’s Department of Youth and Community Development. It is now one of the largest municipally financed OST systems in the country, serving around 78,000 youth a year.
Seattle is a midsize city with school enrollment of 59,100 students.13 Ninety percent of public elementary schools offered licensed school-age programs operated by community providers, and all middle and K–8 schools were associated with OST programs provided by a Parks and Recreation Department/YMCA partnership. Its 30-year history of establishing OST programs in public schools and its involvement with MOST makes it home to one of the oldest system-building efforts in the US. At the time of our study, the system was decentralized but coordinated by a state-level intermediary that con-vened stakeholders, including staff from the City of Seattle, the Parks and Recreation Department, Seattle Public Schools and major OST providers (such as YMCA of Greater Seattle and Associated Recreation Council).
This report is part of a series documenting the costs of out-of-school-time programs and the city-level systems that support them. For more information, visit www.ppv.org, www.financeproject.org or www.wallacefoundation.org.
The Cost of Quality Out-of-School-Time Programs provides detailed information on both the average out-of-pocket expenditures and average full cost (including the value of in-kind contributions) of a wide range of quality out-of-school-time programs.
The Out-of-School-Time Program Cost Calculator is a tool that will enable users to generate tailored cost estimates for many different types of out-of-school-time programs. Available at www.wallacefoundation.org/cost-of-quality.
Investment in Building Out-of-School-Time Systems: A Six-City Study examines the resource investments cities can make to support local out-of-school-time programs.

Detailed Investment Tables
6 Investments in Building Citywide Out-of-School-Time Systems: A Six-City Study Synopsis
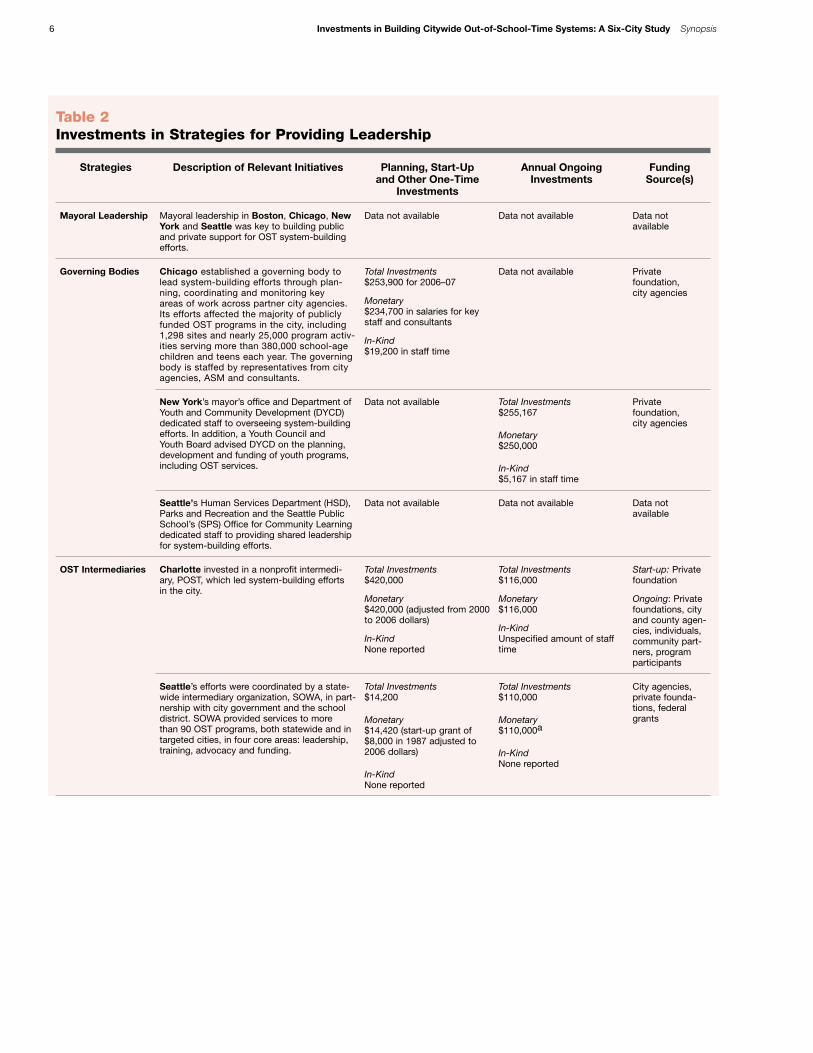
Table 2Investments in Strategies for Providing Leadership
Strategies Description of Relevant Initiatives Planning, Start-Up and Other One-Time
Investments
Annual Ongoing Investments
Funding Source(s)
Mayoral Leadership Mayoral leadership in Boston, Chicago, New York and Seattle was key to building public and private support for OST system-building efforts.
Data not available Data not available Data not available
Governing Bodies Chicago established a governing body to lead system-building efforts through plan-ning, coordinating and monitoring key areas of work across partner city agencies. Its efforts affected the majority of publicly funded OST programs in the city, including 1,298 sites and nearly 25,000 program activ-ities serving more than 380,000 school-age children and teens each year. The governing body is staffed by representatives from city agencies, ASM and consultants.
Total Investments$253,900 for 2006–07
Monetary$234,700 in salaries for key staff and consultants
In-Kind$19,200 in staff time
Data not available Private foundation, city agencies
New York’s mayor’s office and Department of Youth and Community Development (DYCD) dedicated staff to overseeing system-building efforts. In addition, a Youth Council and Youth Board advised DYCD on the planning, development and funding of youth programs, including OST services.
Data not available Total Investments$255,167
Monetary$250,000
In-Kind$5,167 in staff time
Private foundation, city agencies
Seattle’s Human Services Department (HSD), Parks and Recreation and the Seattle Public School’s (SPS) Office for Community Learning dedicated staff to providing shared leadership for system-building efforts.
Data not available Data not available Data not available
OST Intermediaries Charlotte invested in a nonprofit intermedi-ary, POST, which led system-building efforts in the city.
Total Investments$420,000
Monetary$420,000 (adjusted from 2000 to 2006 dollars)
In-KindNone reported
Total Investments$116,000
Monetary$116,000
In-KindUnspecified amount of staff time
Start-up: Private foundation
Ongoing: Private foundations, city and county agen-cies, individuals, community part-ners, program participants
Seattle’s efforts were coordinated by a state-wide intermediary organization, SOWA, in part-nership with city government and the school district. SOWA provided services to more than 90 OST programs, both statewide and in targeted cities, in four core areas: leadership, training, advocacy and funding.
Total Investments$14,200
Monetary$14,420 (start-up grant of $8,000 in 1987 adjusted to 2006 dollars)
In-KindNone reported
Total Investments$110,000
Monetary$110,000a
In-KindNone reported
City agencies, private founda-tions, federal grants
Investments in Building Citywide Out-of-School-Time Systems: A Six-City Study Synopsis 7
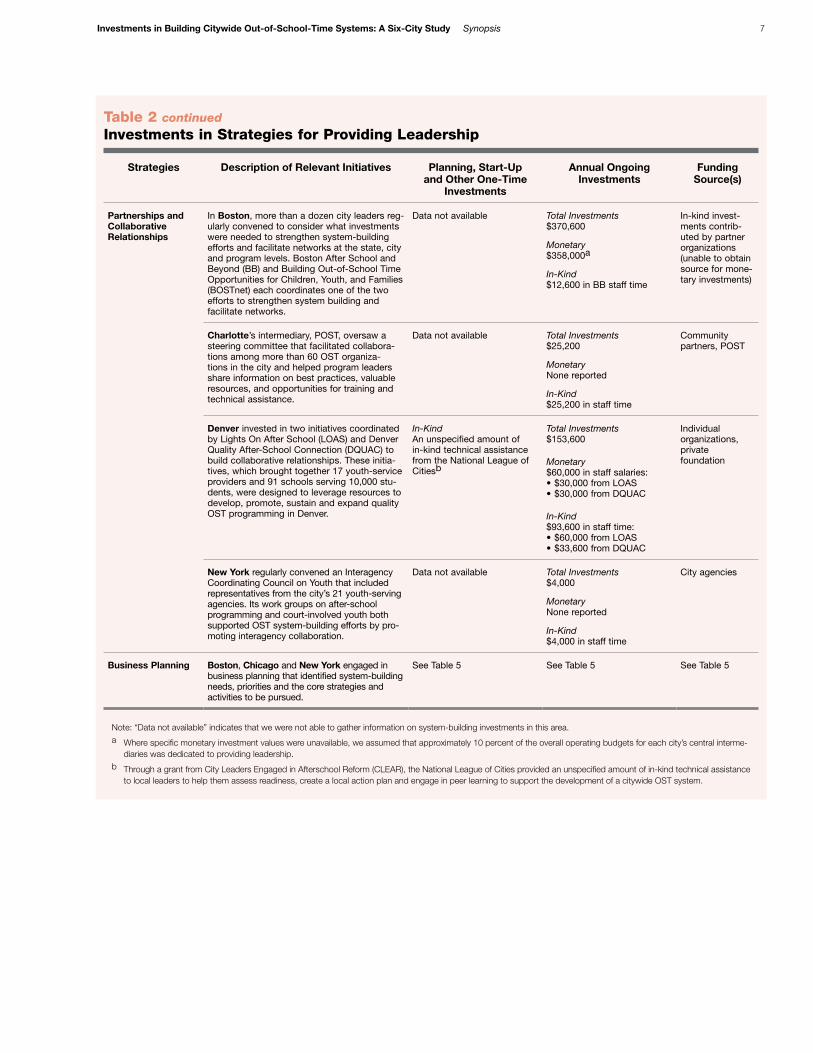
Table 2 continuedInvestments in Strategies for Providing Leadership
Strategies Description of Relevant Initiatives Planning, Start-Up and Other One-Time
Investments
Annual Ongoing Investments
Funding Source(s)
Partnerships and Collaborative Relationships
In Boston, more than a dozen city leaders reg-ularly convened to consider what investments were needed to strengthen system-building efforts and facilitate networks at the state, city and program levels. Boston After School and Beyond (BB) and Building Out-of-School Time Opportunities for Children, Youth, and Families (BOSTnet) each coordinates one of the two efforts to strengthen system building and facilitate networks.
Data not available Total Investments$370,600
Monetary$358,000a
In-Kind$12,600 in BB staff time
In-kind invest-ments contrib-uted by partner organizations (unable to obtain source for mone-tary investments)
Charlotte’s intermediary, POST, oversaw a steering committee that facilitated collabora-tions among more than 60 OST organiza-tions in the city and helped program leaders share information on best practices, valuable resources, and opportunities for training and technical assistance.
Data not available Total Investments$25,200
MonetaryNone reported
In-Kind$25,200 in staff time
Community partners, POST
Denver invested in two initiatives coordinated by Lights On After School (LOAS) and Denver Quality After-School Connection (DQUAC) to build collaborative relationships. These initia-tives, which brought together 17 youth-service providers and 91 schools serving 10,000 stu-dents, were designed to leverage resources to develop, promote, sustain and expand quality OST programming in Denver.
In-KindAn unspecified amount of in-kind technical assistance from the National League of Citiesb
Total Investments$153,600
Monetary$60,000 in staff salaries:•$30,000 from LOAS •$30,000 from DQUAC
In-Kind$93,600 in staff time:•$60,000 from LOAS•$33,600 from DQUAC
Individual organizations, private foundation
New York regularly convened an Interagency Coordinating Council on Youth that included representatives from the city’s 21 youth-serving agencies. Its work groups on after-school programming and court-involved youth both supported OST system-building efforts by pro-moting interagency collaboration.
Data not available Total Investments$4,000
MonetaryNone reported
In-Kind$4,000 in staff time
City agencies
Business Planning Boston, Chicago and New York engaged in business planning that identified system-building needs, priorities and the core strategies and activities to be pursued.
See Table 5 See Table 5 See Table 5
Note: “Data not available” indicates that we were not able to gather information on system-building investments in this area. a Where specific monetary investment values were unavailable, we assumed that approximately 10 percent of the overall operating budgets for each city’s central interme-
diaries was dedicated to providing leadership.b Through a grant from City Leaders Engaged in Afterschool Reform (CLEAR), the National League of Cities provided an unspecified amount of in-kind technical assistance
to local leaders to help them assess readiness, create a local action plan and engage in peer learning to support the development of a citywide OST system.
8 Investments in Building Citywide Out-of-School-Time Systems: A Six-City Study Synopsis
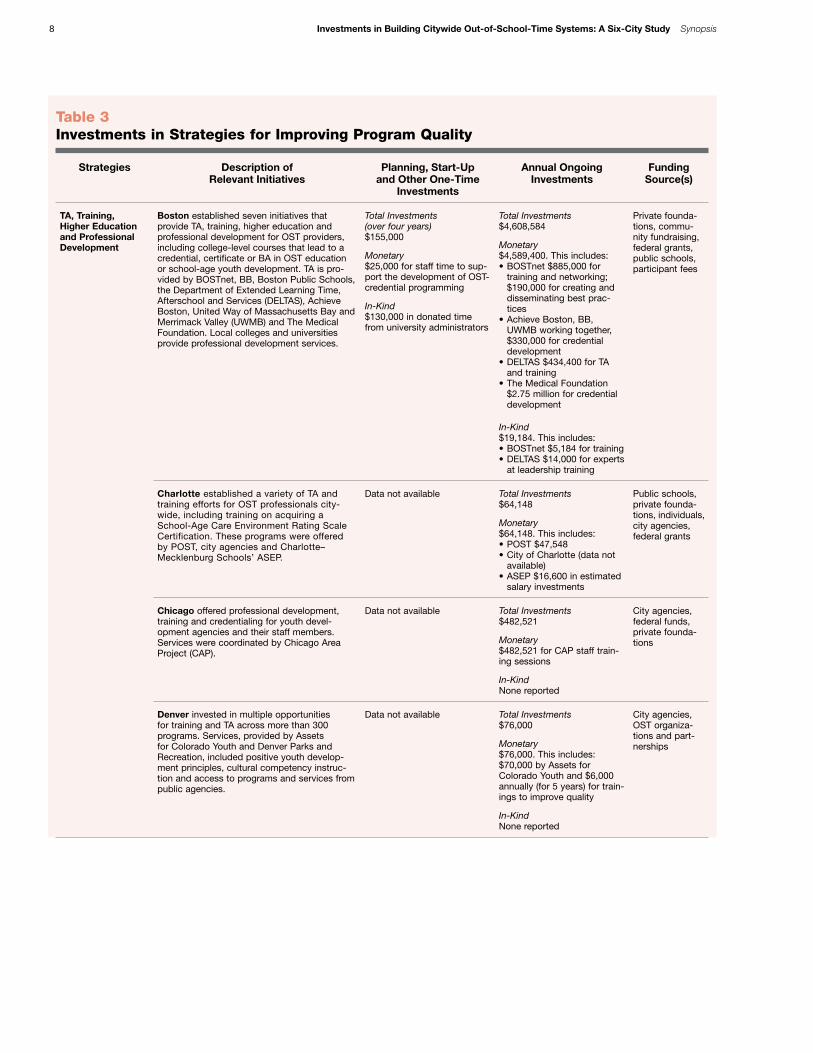
Table 3Investments in Strategies for Improving Program Quality
Strategies Description of Relevant Initiatives
Planning, Start-Up and Other One-Time
Investments
Annual Ongoing Investments
Funding Source(s)
TA, Training, Higher Education and Professional Development
Boston established seven initiatives that provide TA, training, higher education and professional development for OST providers, including college-level courses that lead to a credential, certificate or BA in OST education or school-age youth development. TA is pro-vided by BOSTnet, BB, Boston Public Schools, the Department of Extended Learning Time, Afterschool and Services (DELTAS), Achieve Boston, United Way of Massachusetts Bay and Merrimack Valley (UWMB) and The Medical Foundation. Local colleges and universities provide professional development services.
Total Investments (over four years)$155,000
Monetary$25,000 for staff time to sup-port the development of OST-credential programming
In-Kind$130,000 in donated time from university administrators
Total Investments$4,608,584
Monetary$4,589,400. This includes:•BOSTnet $885,000 for
training and networking; $190,000 for creating and disseminating best prac-tices
•Achieve Boston, BB, UWMB working together, $330,000 for credential development
•DELTAS $434,400 for TA and training
•The Medical Foundation $2.75 million for credential development
In-Kind$19,184. This includes: •BOSTnet $5,184 for training•DELTAS $14,000 for experts
at leadership training
Private founda-tions, commu-nity fundraising, federal grants, public schools, participant fees
Charlotte established a variety of TA and training efforts for OST professionals city-wide, including training on acquiring a School-Age Care Environment Rating Scale Certification. These programs were offered by POST, city agencies and Charlotte–Mecklenburg Schools’ ASEP.
Data not available Total Investments$64,148
Monetary$64,148. This includes:•POST $47,548•City of Charlotte (data not
available)•ASEP $16,600 in estimated
salary investments
Public schools, private founda-tions, individuals, city agencies, federal grants
Chicago offered professional development, training and credentialing for youth devel-opment agencies and their staff members. Services were coordinated by Chicago Area Project (CAP).
Data not available Total Investments$482,521
Monetary$482,521 for CAP staff train-ing sessions
In-KindNone reported
City agencies, federal funds, private founda-tions
Denver invested in multiple opportunities for training and TA across more than 300 programs. Services, provided by Assets for Colorado Youth and Denver Parks and Recreation, included positive youth develop-ment principles, cultural competency instruc-tion and access to programs and services from public agencies.
Data not available Total Investments$76,000
Monetary$76,000. This includes: $70,000 by Assets for Colorado Youth and $6,000 annually (for 5 years) for train-ings to improve quality
In-KindNone reported
City agencies, OST organiza-tions and part-nerships

Investments in Building Citywide Out-of-School-Time Systems: A Six-City Study Synopsis 9
Table 3 continuedInvestments in Strategies for Improving Program Quality
Strategies Description of Relevant Initiatives
Planning, Start-Up and Other One-Time
Investments
Annual Ongoing Investments
Funding Source(s)
TA, Training, Higher Education and Professional Development(continued)
New York, through Partnership for After School Education (PASE), TASC and DYCD, developed eight unique training and TA oppor-tunities for OST staff members in a variety of topic areas. These services are supplemented with professional development opportunities in the form of college-level courses that lead to a certificate or BA in OST education or youth studies. A joint initiative of DYCD and New York State Afterschool Network (NYSAN) also established a Professional Development Institute to train staff members across several city and state agencies.
Total Investments$150,000
Monetary$150,000. This includes: DYCD $50,000 for a Best Practices Conference and $100,000 for a Professional Development Institute
In-KindNone reported
Total Investments$13,444,077
Monetary$13,156,000. This includes:•PASE $2.2 million for TA
and training•TASC $6 million for TA and
training and $1.7 million for the professional degree program
•DYCD $2.3 million for TA and training and $331,000 for the credential program
•Department of Education (DOE) $625,000 for TA focused on fiscal and grant management
In-Kind$288,077 in donated staff time
Government agencies, private foundations, individuals
Seattle matched trainers from SOWA with more than 90 programs on an ongoing basis to help them develop and meet yearly goals. The city also conducted research to build knowl-edge of professional-development needs and capacities in the field.
Total Investments$439,000
Monetary$439,000 for SOWA work-force study
In-KindNone reported
Total Investments$970,538
Monetary$970,538. This includes SOWA $79,338 for training program; $264,000 for train-ers; $43,950 for manager salaries (15% of managers’ full-time salaries); $56,250 for staff (25% of employees’ full-time salaries); and $527,000 for research and workforce study
In-KindNone reported
Federal, state and local government agencies, private foundations, fees from contracting organizations
Aligning OST Programming with School District Curricula
Boston funded nine schools through a UWMB initiative to coordinate OST activities with school curricula.
Data not available Total Investments$68,000
Monetary$68,000. This includes UWMB $33,000 for school-CBO partnerships and $35,000 for managers of extended learn-ing services
In-KindNone reported
Private foundation
Charlotte’s ASEP offered an aligned curriculum that was provided to participating schools and community partners.
See Chapter 5 in the full report
See Chapter 5 in the full report
See Chapter 5 in the full report
New York’s DYCD worked to promote collabo-ration between schools and OST providers that operate rent-free in school facilities.
Data not available Total Investments$17,800
MonetaryNone reported
In-Kind$17,800 in donated staff time
City agencies
10 Investments in Building Citywide Out-of-School-Time Systems: A Six-City Study Synopsis
Table 3 continuedInvestments in Strategies for Improving Program Quality
Strategies Description of Relevant Initiatives
Planning, Start-Up and Other One-Time
Investments
Annual Ongoing Investments
Funding Source(s)
Aligning OST Programming with School District Curricula (continued)
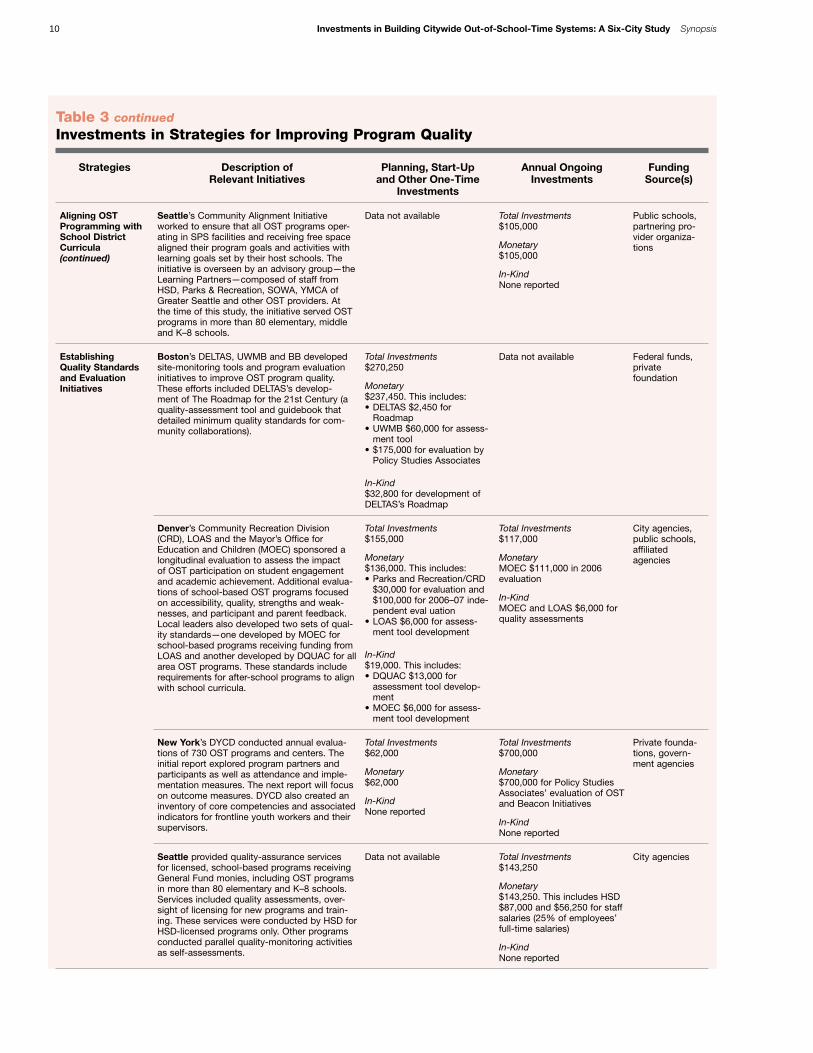
Seattle’s Community Alignment Initiative worked to ensure that all OST programs oper-ating in SPS facilities and receiving free space aligned their program goals and activities with learning goals set by their host schools. The initiative is overseen by an advisory group—the Learning Partners—composed of staff from HSD, Parks & Recreation, SOWA, YMCA of Greater Seattle and other OST providers. At the time of this study, the initiative served OST programs in more than 80 elementary, middle and K–8 schools.
Data not available Total Investments$105,000
Monetary$105,000
In-KindNone reported
Public schools, partnering pro-vider organiza-tions
Establishing Quality Standards and Evaluation Initiatives
Boston’s DELTAS, UWMB and BB developed site-monitoring tools and program evaluation initiatives to improve OST program quality. These efforts included DELTAS’s develop-ment of The Roadmap for the 21st Century (a quality-assessment tool and guidebook that detailed minimum quality standards for com-munity collaborations).
Total Investments$270,250
Monetary$237,450. This includes:•DELTAS $2,450 for
Roadmap •UWMB $60,000 for assess-
ment tool •$175,000 for evaluation by
Policy Studies Associates
In-Kind$32,800 for development of DELTAS’s Roadmap
Data not available Federal funds, private foundation
Denver’s Community Recreation Division (CRD), LOAS and the Mayor’s Office for Education and Children (MOEC) sponsored a longitudinal evaluation to assess the impact of OST participation on student engagement and academic achievement. Additional evalua-tions of school-based OST programs focused on accessibility, quality, strengths and weak-nesses, and participant and parent feedback. Local leaders also developed two sets of qual-ity standards—one developed by MOEC for school-based programs receiving funding from LOAS and another developed by DQUAC for all area OST programs. These standards include requirements for after-school programs to align with school curricula.
Total Investments$155,000
Monetary$136,000. This includes:•Parks and Recreation/CRD
$30,000 for evaluation and $100,000 for 2006–07 inde-pendent eval uation
•LOAS $6,000 for assess-ment tool development
In-Kind$19,000. This includes:•DQUAC $13,000 for
assessment tool develop-ment
•MOEC $6,000 for assess-ment tool development
Total Investments$117,000
MonetaryMOEC $111,000 in 2006 evaluation
In-KindMOEC and LOAS $6,000 for quality assessments
City agencies, public schools, affiliated agencies
New York’s DYCD conducted annual evalua-tions of 730 OST programs and centers. The initial report explored program partners and participants as well as attendance and imple-mentation measures. The next report will focus on outcome measures. DYCD also created an inventory of core competencies and associated indicators for frontline youth workers and their supervisors.
Total Investments$62,000
Monetary $62,000
In-KindNone reported
Total Investments$700,000
Monetary$700,000 for Policy Studies Associates’ evaluation of OST and Beacon Initiatives
In-KindNone reported
Private founda-tions, govern-ment agencies
Seattle provided quality-assurance services for licensed, school-based programs receiving General Fund monies, including OST programs in more than 80 elementary and K–8 schools. Services included quality assessments, over-sight of licensing for new programs and train-ing. These services were conducted by HSD for HSD-licensed programs only. Other programs conducted parallel quality-monitoring activities as self-assessments.
Data not available Total Investments$143,250
Monetary$143,250. This includes HSD $87,000 and $56,250 for staff salaries (25% of employees’ full-time salaries)
In-KindNone reported
City agencies
Investments in Building Citywide Out-of-School-Time Systems: A Six-City Study Synopsis 11
Table 3 continuedInvestments in Strategies for Improving Program Quality
Strategies Description of Relevant Initiatives
Planning, Start-Up and Other One-Time
Investments
Annual Ongoing Investments
Funding Source(s)
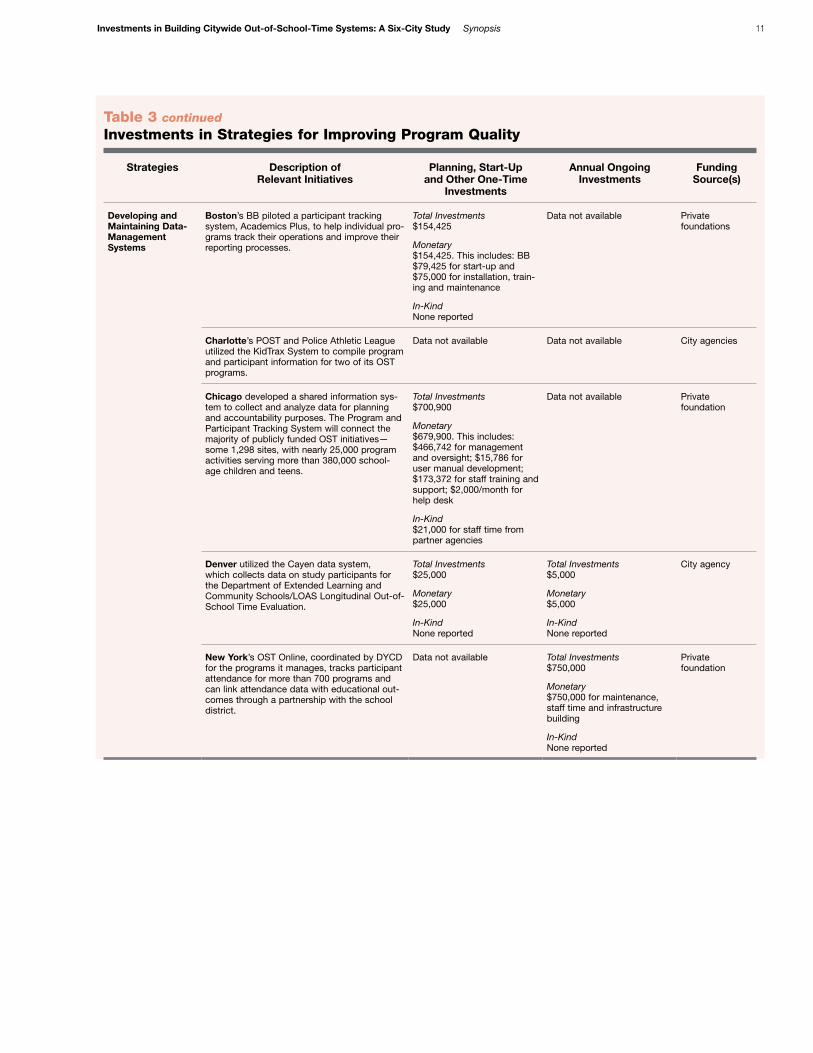
Developing and Maintaining Data-Management Systems
Boston’s BB piloted a participant tracking system, Academics Plus, to help individual pro-grams track their operations and improve their reporting processes.
Total Investments$154,425
Monetary$154,425. This includes: BB $79,425 for start-up and $75,000 for installation, train-ing and maintenance
In-KindNone reported
Data not available Private foundations
Charlotte’s POST and Police Athletic League utilized the KidTrax System to compile program and participant information for two of its OST programs.
Data not available Data not available City agencies
Chicago developed a shared information sys-tem to collect and analyze data for planning and accountability purposes. The Program and Participant Tracking System will connect the majority of publicly funded OST initiatives—some 1,298 sites, with nearly 25,000 program activities serving more than 380,000 school-age children and teens.
Total Investments$700,900
Monetary$679,900. This includes: $466,742 for management and oversight; $15,786 for user manual development; $173,372 for staff training and support; $2,000/month for help desk
In-Kind$21,000 for staff time from partner agencies
Data not available Private foundation
Denver utilized the Cayen data system, which collects data on study participants for the Department of Extended Learning and Community Schools/LOAS Longitudinal Out-of-School Time Evaluation.
Total Investments$25,000
Monetary$25,000
In-KindNone reported
Total Investments$5,000
Monetary$5,000
In-KindNone reported
City agency
New York’s OST Online, coordinated by DYCD for the programs it manages, tracks participant attendance for more than 700 programs and can link attendance data with educational out-comes through a partnership with the school district.
Data not available Total Investments$750,000
Monetary$750,000 for maintenance, staff time and infrastructure building
In-KindNone reported
Private foundation
12 Investments in Building Citywide Out-of-School-Time Systems: A Six-City Study Synopsis
Table 4Investments in Strategies for Expanding Access to and Participation in OST Programming
Strategies Description of Relevant Initiatives
Planning, Start-Up and Other One-Time
Investments
Annual Ongoing Investments
Funding Source(s)
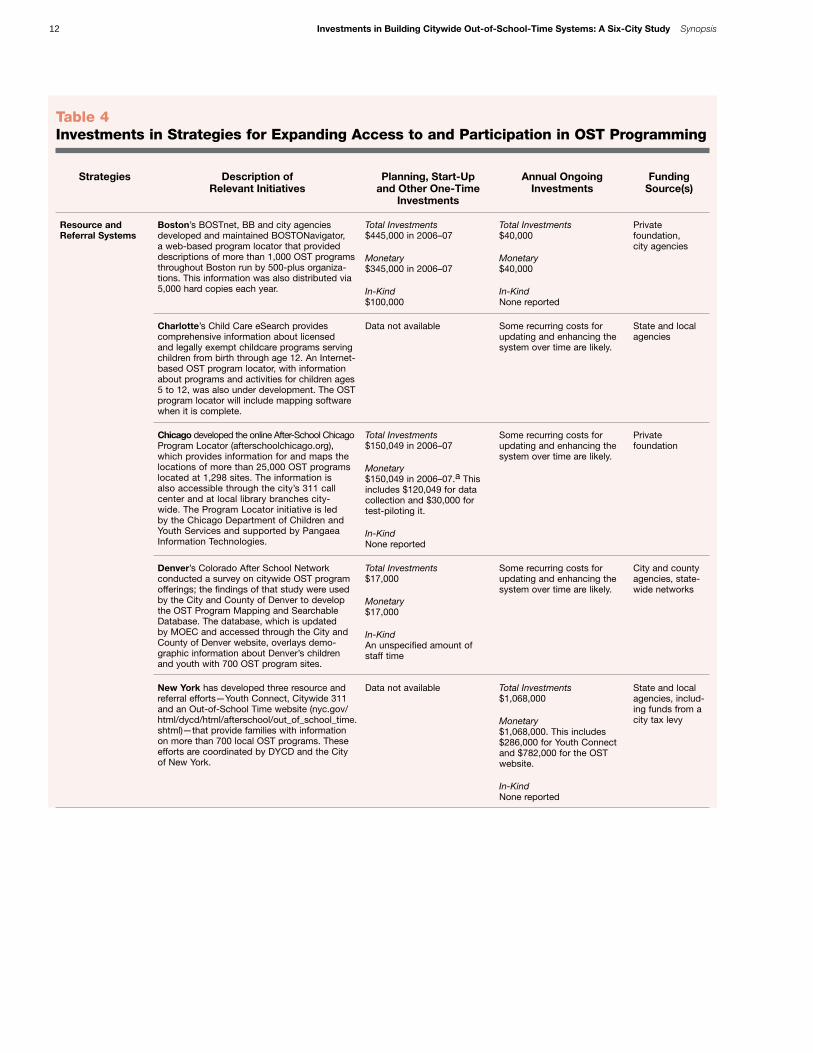
Resource and Referral Systems
Boston’s BOSTnet, BB and city agencies developed and maintained BOSTONavigator, a web-based program locator that provided descriptions of more than 1,000 OST programs throughout Boston run by 500-plus organiza-tions. This information was also distributed via 5,000 hard copies each year.
Total Investments$445,000 in 2006–07
Monetary$345,000 in 2006–07
In-Kind$100,000
Total Investments$40,000
Monetary$40,000
In-KindNone reported
Private foundation, city agencies
Charlotte’s Child Care eSearch provides comprehensive information about licensed and legally exempt childcare programs serving children from birth through age 12. An Internet-based OST program locator, with information about programs and activities for children ages 5 to 12, was also under development. The OST program locator will include mapping software when it is complete.
Data not available Some recurring costs for updating and enhancing the system over time are likely.
State and local agencies
Chicago developed the online After-School Chicago Program Locator (afterschoolchicago.org), which provides information for and maps the locations of more than 25,000 OST programs located at 1,298 sites. The information is also accessible through the city’s 311 call center and at local library branches city-wide. The Program Locator initiative is led by the Chicago Department of Children and Youth Services and supported by Pangaea Information Technologies.
Total Investments$150,049 in 2006–07
Monetary$150,049 in 2006–07.a This includes $120,049 for data collection and $30,000 for test-piloting it.
In-KindNone reported
Some recurring costs for updating and enhancing the system over time are likely.
Private foundation
Denver’s Colorado After School Network conducted a survey on citywide OST program offerings; the findings of that study were used by the City and County of Denver to develop the OST Program Mapping and Searchable Database. The database, which is updated by MOEC and accessed through the City and County of Denver website, overlays demo-graphic information about Denver’s children and youth with 700 OST program sites.
Total Investments$17,000
Monetary$17,000
In-KindAn unspecified amount of staff time
Some recurring costs for updating and enhancing the system over time are likely.
City and county agencies, state-wide networks
New York has developed three resource and referral efforts—Youth Connect, Citywide 311 and an Out-of-School Time website (nyc.gov/html/dycd/html/afterschool/out_of_school_time.shtml)—that provide families with information on more than 700 local OST programs. These efforts are coordinated by DYCD and the City of New York.
Data not available Total Investments$1,068,000
Monetary$1,068,000. This includes $286,000 for Youth Connect and $782,000 for the OST website.
In-KindNone reported
State and local agencies, includ-ing funds from a city tax levy
Investments in Building Citywide Out-of-School-Time Systems: A Six-City Study Synopsis 13
Table 4 continuedInvestments in Strategies for Expanding Access to and Participation in OST Programming
Strategies Description of Relevant Initiatives
Planning, Start-Up and Other One-Time
Investments
Annual Ongoing Investments
Funding Source(s)
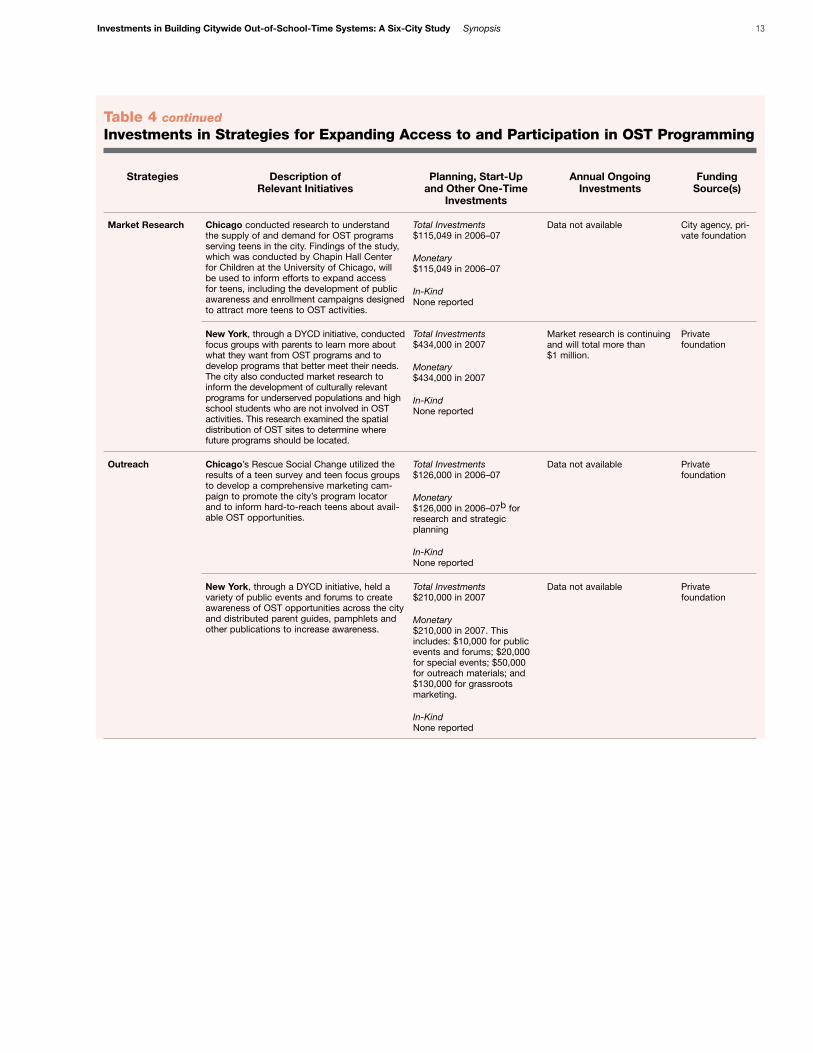
Market Research Chicago conducted research to understand the supply of and demand for OST programs serving teens in the city. Findings of the study, which was conducted by Chapin Hall Center for Children at the University of Chicago, will be used to inform efforts to expand access for teens, including the development of public awareness and enrollment campaigns designed to attract more teens to OST activities.
Total Investments$115,049 in 2006–07
Monetary$115,049 in 2006–07
In-KindNone reported
Data not available City agency, pri-vate foundation
New York, through a DYCD initiative, conducted focus groups with parents to learn more about what they want from OST programs and to develop programs that better meet their needs. The city also conducted market research to inform the development of culturally relevant programs for underserved populations and high school students who are not involved in OST activities. This research examined the spatial distribution of OST sites to determine where future programs should be located.
Total Investments$434,000 in 2007
Monetary$434,000 in 2007
In-KindNone reported
Market research is continuing and will total more than $1 million.
Private foundation
Outreach Chicago’s Rescue Social Change utilized the results of a teen survey and teen focus groups to develop a comprehensive marketing cam-paign to promote the city’s program locator and to inform hard-to-reach teens about avail-able OST opportunities.
Total Investments$126,000 in 2006–07
Monetary$126,000 in 2006–07b for research and strategic planning
In-KindNone reported
Data not available Private foundation
New York, through a DYCD initiative, held a variety of public events and forums to create awareness of OST opportunities across the city and distributed parent guides, pamphlets and other publications to increase awareness.
Total Investments$210,000 in 2007
Monetary$210,000 in 2007. This includes: $10,000 for public events and forums; $20,000 for special events; $50,000 for outreach materials; and $130,000 for grassroots marketing.
In-KindNone reported
Data not available Private foundation
14 Investments in Building Citywide Out-of-School-Time Systems: A Six-City Study Synopsis
Table 4 continuedInvestments in Strategies for Expanding Access to and Participation in OST Programming
Strategies Description of Relevant Initiatives
Planning, Start-Up and Other One-Time
Investments
Annual Ongoing Investments
Funding Source(s)
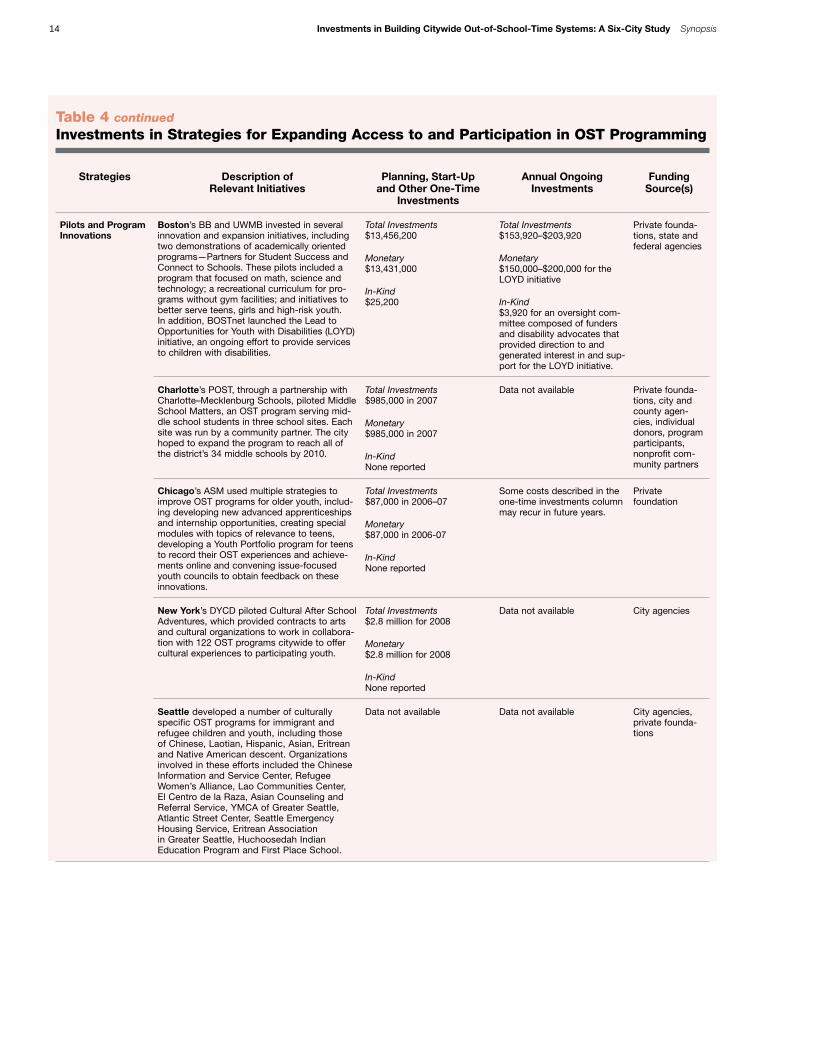
Pilots and Program Innovations
Boston’s BB and UWMB invested in several innovation and expansion initiatives, including two demonstrations of academically oriented programs—Partners for Student Success and Connect to Schools. These pilots included a program that focused on math, science and technology; a recreational curriculum for pro-grams without gym facilities; and initiatives to better serve teens, girls and high-risk youth. In addition, BOSTnet launched the Lead to Opportunities for Youth with Disabilities (LOYD) initiative, an ongoing effort to provide services to children with disabilities.
Total Investments$13,456,200
Monetary$13,431,000
In-Kind$25,200
Total Investments$153,920–$203,920
Monetary$150,000–$200,000 for the LOYD initiative
In-Kind$3,920 for an oversight com-mittee composed of funders and disability advocates that provided direction to and generated interest in and sup-port for the LOYD initiative.
Private founda-tions, state and federal agencies
Charlotte’s POST, through a partnership with Charlotte–Mecklenburg Schools, piloted Middle School Matters, an OST program serving mid-dle school students in three school sites. Each site was run by a community partner. The city hoped to expand the program to reach all of the district’s 34 middle schools by 2010.
Total Investments$985,000 in 2007
Monetary$985,000 in 2007
In-KindNone reported
Data not available Private founda-tions, city and county agen-cies, individual donors, program participants, nonprofit com-munity partners
Chicago’s ASM used multiple strategies to improve OST programs for older youth, includ-ing developing new advanced apprenticeships and internship opportunities, creating special modules with topics of relevance to teens, developing a Youth Portfolio program for teens to record their OST experiences and achieve-ments online and convening issue-focused youth councils to obtain feedback on these innovations.
Total Investments$87,000 in 2006–07
Monetary$87,000 in 2006-07
In-KindNone reported
Some costs described in the one-time investments column may recur in future years.
Private foundation
New York’s DYCD piloted Cultural After School Adventures, which provided contracts to arts and cultural organizations to work in collabora-tion with 122 OST programs citywide to offer cultural experiences to participating youth.
Total Investments$2.8 million for 2008
Monetary$2.8 million for 2008
In-KindNone reported
Data not available City agencies
Seattle developed a number of culturally specific OST programs for immigrant and refugee children and youth, including those of Chinese, Laotian, Hispanic, Asian, Eritrean and Native American descent. Organizations involved in these efforts included the Chinese Information and Service Center, Refugee Women’s Alliance, Lao Communities Center, El Centro de la Raza, Asian Counseling and Referral Service, YMCA of Greater Seattle, Atlantic Street Center, Seattle Emergency Housing Service, Eritrean Association in Greater Seattle, Huchoosedah Indian Education Program and First Place School.
Data not available Data not available City agencies, private founda-tions
Investments in Building Citywide Out-of-School-Time Systems: A Six-City Study Synopsis 15
Table 4 continuedInvestments in Strategies for Expanding Access to and Participation in OST Programming
Strategies Description of Relevant Initiatives
Planning, Start-Up and Other One-Time
Investments
Annual Ongoing Investments
Funding Source(s)
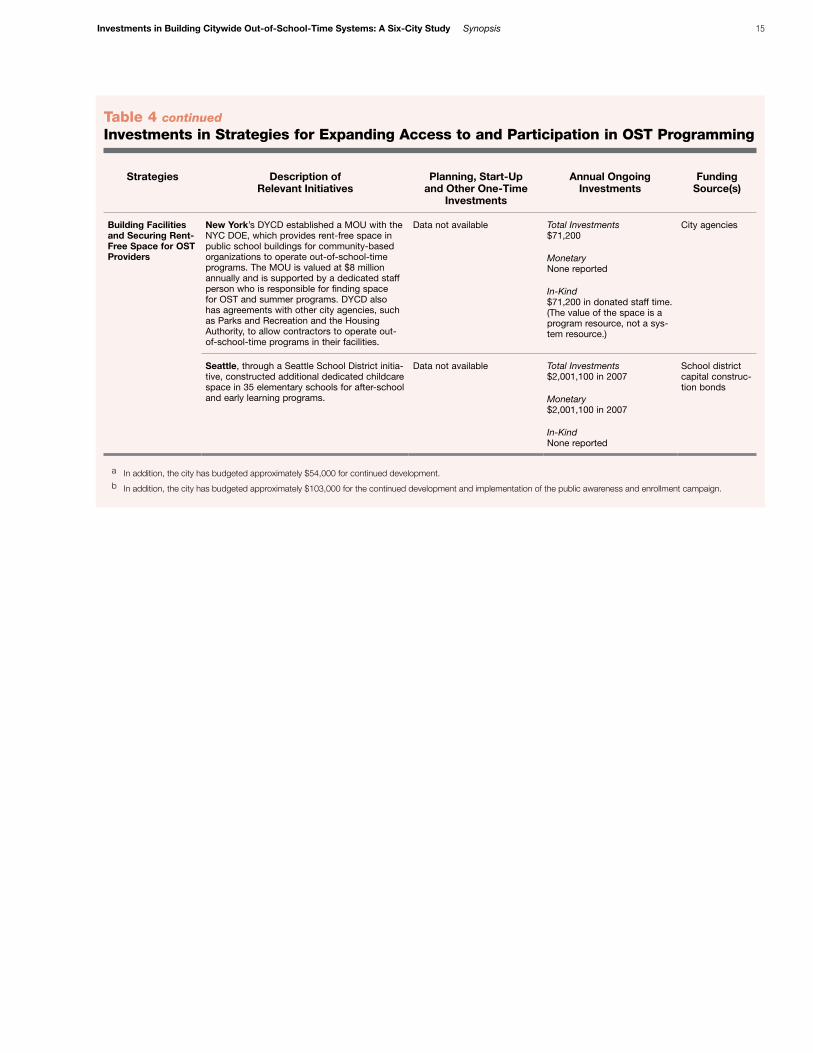
Building Facilities and Securing Rent-Free Space for OST Providers
New York’s DYCD established a MOU with the NYC DOE, which provides rent-free space in public school buildings for community-based organizations to operate out-of-school-time programs. The MOU is valued at $8 million annually and is supported by a dedicated staff person who is responsible for finding space for OST and summer programs. DYCD also has agreements with other city agencies, such as Parks and Recreation and the Housing Authority, to allow contractors to operate out-of-school-time programs in their facilities.
Data not available Total Investments$71,200
MonetaryNone reported
In-Kind$71,200 in donated staff time. (The value of the space is a program resource, not a sys-tem resource.)
City agencies
Seattle, through a Seattle School District initia-tive, constructed additional dedicated childcare space in 35 elementary schools for after-school and early learning programs.
Data not available Total Investments$2,001,100 in 2007
Monetary$2,001,100 in 2007
In-KindNone reported
School district capital construc-tion bonds
a In addition, the city has budgeted approximately $54,000 for continued development.b In addition, the city has budgeted approximately $103,000 for the continued development and implementation of the public awareness and enrollment campaign.
16 Investments in Building Citywide Out-of-School-Time Systems: A Six-City Study Synopsis
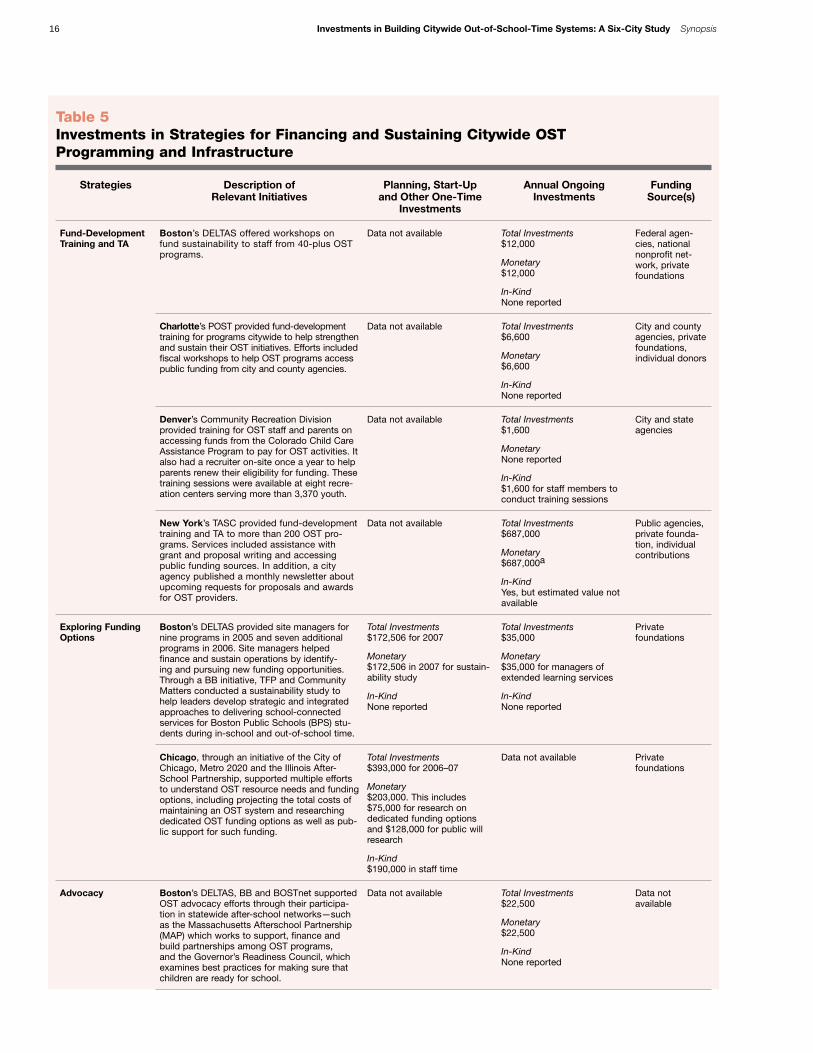
Table 5Investments in Strategies for Financing and Sustaining Citywide OST Programming and Infrastructure
Strategies Description of Relevant Initiatives
Planning, Start-Up and Other One-Time
Investments
Annual Ongoing Investments
Funding Source(s)
Fund-Development Training and TA
Boston’s DELTAS offered workshops on fund sustainability to staff from 40-plus OST programs.
Data not available Total Investments$12,000
Monetary$12,000
In-KindNone reported
Federal agen-cies, national nonprofit net-work, private foundations
Charlotte’s POST provided fund-development training for programs citywide to help strengthen and sustain their OST initiatives. Efforts included fiscal workshops to help OST programs access public funding from city and county agencies.
Data not available Total Investments$6,600
Monetary$6,600
In-KindNone reported
City and county agencies, private foundations, individual donors
Denver’s Community Recreation Division provided training for OST staff and parents on accessing funds from the Colorado Child Care Assistance Program to pay for OST activities. It also had a recruiter on-site once a year to help parents renew their eligibility for funding. These training sessions were available at eight recre-ation centers serving more than 3,370 youth.
Data not available Total Investments$1,600
MonetaryNone reported
In-Kind$1,600 for staff members to conduct training sessions
City and state agencies
New York’s TASC provided fund-development training and TA to more than 200 OST pro-grams. Services included assistance with grant and proposal writing and accessing public funding sources. In addition, a city agency published a monthly newsletter about upcoming requests for proposals and awards for OST providers.
Data not available Total Investments$687,000
Monetary$687,000a
In-KindYes, but estimated value not available
Public agencies, private founda-tion, individual contributions
Exploring Funding Options
Boston’s DELTAS provided site managers for nine programs in 2005 and seven additional programs in 2006. Site managers helped finance and sustain operations by identify-ing and pursuing new funding opportunities. Through a BB initiative, TFP and Community Matters conducted a sustainability study to help leaders develop strategic and integrated approaches to delivering school-connected services for Boston Public Schools (BPS) stu-dents during in-school and out-of-school time.
Total Investments$172,506 for 2007
Monetary$172,506 in 2007 for sustain-ability study
In-KindNone reported
Total Investments$35,000
Monetary$35,000 for managers of extended learning services
In-KindNone reported
Private foundations
Chicago, through an initiative of the City of Chicago, Metro 2020 and the Illinois After-School Partnership, supported multiple efforts to understand OST resource needs and funding options, including projecting the total costs of maintaining an OST system and researching dedicated OST funding options as well as pub-lic support for such funding.
Total Investments$393,000 for 2006–07
Monetary$203,000. This includes $75,000 for research on dedicated funding options and $128,000 for public will research
In-Kind$190,000 in staff time
Data not available Private foundations
Advocacy Boston’s DELTAS, BB and BOSTnet supported OST advocacy efforts through their participa-tion in statewide after-school networks—such as the Massachusetts Afterschool Partnership (MAP) which works to support, finance and build partnerships among OST programs, and the Governor’s Readiness Council, which examines best practices for making sure that children are ready for school.
Data not available Total Investments$22,500
Monetary$22,500
In-KindNone reported
Data not available
Investments in Building Citywide Out-of-School-Time Systems: A Six-City Study Synopsis 17
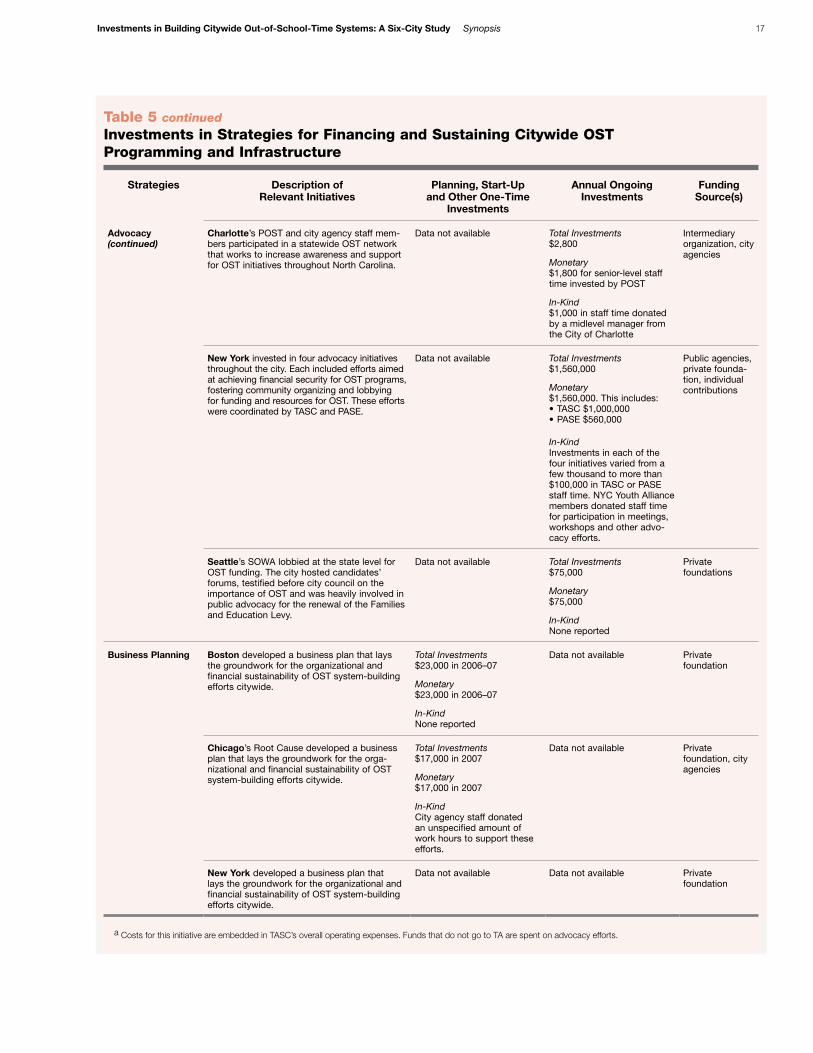
Table 5 continuedInvestments in Strategies for Financing and Sustaining Citywide OST Programming and Infrastructure
Strategies Description of Relevant Initiatives
Planning, Start-Up and Other One-Time
Investments
Annual Ongoing Investments
Funding Source(s)
Advocacy (continued)
Charlotte’s POST and city agency staff mem-bers participated in a statewide OST network that works to increase awareness and support for OST initiatives throughout North Carolina.
Data not available Total Investments$2,800
Monetary$1,800 for senior-level staff time invested by POST
In-Kind$1,000 in staff time donated by a midlevel manager from the City of Charlotte
Intermediary organization, city agencies
New York invested in four advocacy initiatives throughout the city. Each included efforts aimed at achieving financial security for OST programs, fostering community organizing and lobbying for funding and resources for OST. These efforts were coordinated by TASC and PASE.
Data not available Total Investments$1,560,000
Monetary$1,560,000. This includes:•TASC $1,000,000•PASE $560,000
In-KindInvestments in each of the four initiatives varied from a few thousand to more than $100,000 in TASC or PASE staff time. NYC Youth Alliance members donated staff time for participation in meetings, workshops and other advo-cacy efforts.
Public agencies, private founda-tion, individual contributions
Seattle’s SOWA lobbied at the state level for OST funding. The city hosted candidates’ forums, testified before city council on the importance of OST and was heavily involved in public advocacy for the renewal of the Families and Education Levy.
Data not available Total Investments$75,000
Monetary$75,000
In-KindNone reported
Private foundations
Business Planning Boston developed a business plan that lays the groundwork for the organizational and financial sustainability of OST system-building efforts citywide.
Total Investments$23,000 in 2006–07
Monetary$23,000 in 2006–07
In-KindNone reported
Data not available Private foundation
Chicago’s Root Cause developed a business plan that lays the groundwork for the orga-nizational and financial sustainability of OST system-building efforts citywide.
Total Investments$17,000 in 2007
Monetary $17,000 in 2007
In-KindCity agency staff donated an unspecified amount of work hours to support these efforts.
Data not available Private foundation, city agencies
New York developed a business plan that lays the groundwork for the organizational and financial sustainability of OST system-building efforts citywide.
Data not available Data not available Private foundation
a Costs for this initiative are embedded in TASC’s overall operating expenses. Funds that do not go to TA are spent on advocacy efforts.
18 Investments in Building Citywide Out-of-School-Time Systems: A Six-City Study Synopsis
Endnotes
1 Grossman, Jean Baldwin, Christianne Lind, Cheryl Hayes, Jennifer McMaken and Andrew Gersick. 2009. The Cost of Quality Out-of-School-Time Programs. Philadelphia, PA: Public/Private Ventures.
2 Available at www.wallacefoundation.org/cost-of-quality.
3 Halpern, Robert. 2003. The Challenge of System-Building in the After-School Field: Lessons from Experience. Wellesley, MA: National Institute on Out-of-School Time.
4 See, for example, Hall, Georgia and Brooke Harvey. 2002. Building and Sustaining Citywide Afterschool Initiatives: Experiences of the Cross-Cities Network Citywide Afterschool Initiatives. Wellesley, MA: National Institute on Out-of-School Time. See also Halpern, Robert. 2003. See also Halpern et al. 2001. Evaluation of the MOST (Making the Most of Out-of-School Time) Initiative: Final Report and Summary of Findings. Chicago: Chapin Hall Center for Children at the University of Chicago. See also Ouellette, Mark et al. 2005. The Afterschool Hours: A New Focus for America’s Cities. Washington, DC: National League of Cities. See also Proscio, Tony. 2006. The Final Report of the After School Project: Making the Most of the Day. Princeton, NJ: The Robert Wood Johnson Foundation. See also Proscio, Tony and Basil J. Whiting. 2004. After-School Grows Up: How Four Large American Cities Approach Scale and Quality in After-School Programs: Executive Summary and Overview. New York: The After School Project. See also Wright, Elisabeth. 2005. Supporting Student Success: A Governor’s Guide to Extra Learning Opportunities (ELOs). Washington, DC: National Governors Association Center for Best Practices.
5 US Census Bureau. 2005-2007. “Boston City, Massachusetts. Selected Social Characteristics in the United States, American Community Survey 3-Year Estimates.”
6 Personal communication, Steven Pratt, Boston and Beyond, 2006.
7 MOST was a seven-year (1993–99) system-building initia-tive launched in Boston, Chicago and Seattle by the Wallace Foundation. Under the umbrella of one or more lead agencies, each MOST city brought together the stakeholders in its OST system to set priorities, engage in joint planning, share informa-tion, coordinate activities and develop citywide strategies for addressing OST challenges.
8 US Census Bureau. 2005-2007. “Charlotte City, North Carolina. Selected Social Characteristics in the United States, American Community Survey 3-Year Estimates.”
9 US Census Bureau. 2005-2007. “Chicago City, Illinois. Selected Social Characteristics in the United States, American Community Survey 3-Year Estimates.”
10 US Census Bureau. 2005-2007. “Denver City, Colorado. Selected Social Characteristics in the United States, American Community Survey 3-Year Estimates.”
11 See http://www.denvergov.org/denvermaps/report.asp?rpt=aschl&cat=cgov.
12 US Census Bureau. 2005-2007. “New York City, New York. Selected Social Characteristics in the United States, American Community Survey 3-Year Estimates.”
13 US Census Bureau. 2005-2007. “Seattle City, Washington. Selected Social Characteristics in the United States, American Community Survey 3-Year Estimates.”
Acknowledgments
We are indebted to many people who helped make this study possible. Most importantly, we are extremely grateful to the following OST leaders in Boston, Charlotte, Chicago, Denver, New York City and Seattle for their willingness to share infor-mation, insights and lessons learned about system-building efforts in their cities: Maryellen Coffey, Dishon Mills, Gil G. Noam, Stephen M. Pratt, Peg Sprague, Nicole K. DeVillers, Betty Jackson, Janice Allen Jackson, Colette Jeffries, Pat Mason, Kim Nguyen, Barb Pellin, Janet Singerman, Stephanie Small, Pam Syfert, Claire Tate, Stanley Watkins, Mary Ellen Caron, James Chesire, Cheri Francis, Nikki Hale, Giacomo Mancuso, Kelley Pasatta, Kauser S. Razvi, Harold Richman, David Sinski, Shirley Farnsworth, Fred Franko, Phillip A. Gonring, María Guajardo, Mark Messenbaugh, Dolores Moreno, Maxine Quintana, Art Rimando, Catherine Wise, Yael Bat-Chava, Mary Bleiberg, Christopher Caruso, Cathleen M. Collins, Danielle DiMare, Lucy Friedman, Janet T. Kelley, Jeanne B. Mullgrav, Jane Quinn, Hildy Simmons, Marcia Smith, Michelle Yanche, Lori Chisholm, Janet Frieling, Terrance Hayes, Melissa Hines, Donna Hudson, Charlotte Jahn, Bea Kelleigh, Lauren Lee, Erica Mullen, Mari Offenbecher, Gerard T. (Sid) Sidorowicz, Lisa M. Taylor, Margie Viall and Billie Young.
A national advisory group of OST experts provided invaluable feedback on the study design, including Nicole Gallant, The Atlantic Philanthropies; Audrey Hutchinson, National League of Cities Institute for Youth, Education, and Families; Priscilla M. D. Little, Harvard Family Research Project, Out-of-School Time Learning and Development Initiative; Harold Richman, Chapin Hall Center for Children, University of Chicago; and Juanita B. Wade, DC Education Compact, Fannie Mae Foundation. Other experts assisted us by reviewing and com-menting on the findings; their input helped us understand our results more thoroughly and shape the report’s presenta-tion. This group included Ellen S. Gannett, Georgia Hall and Karen Lachance of the National Institute on Out-of-School Time; Laura LaCroix-Dalluhn, Youth Community Connections; Brenda McLaughlin, National Center for Summer Learning; and Robert Stonehill, Learning Point Associates.
The Wallace Foundation was instrumental in supporting and funding this study. Edward Pauly and Zakia Redd of the foun-dation’s research and evaluation office worked closely with us throughout the research process, providing insightful guidance and feedback along the way. Along with colleagues Nancy M. Devine, Sheila Murphy, Dara Rose, Erin Brownfield and Pamela Mendels, they also reviewed and commented on early drafts of this report. We are very grateful for their contributions.
Several people assisted with the final publication of this report. They include Chelsea Farley and Laura Johnson from Public/Private Ventures, as well as Angel Butts, who skillfully edited and refined the text. We are also grateful to Penelope Malish and her staff for designing the report.

v
September 2009
Public/Private Ventures2000 Market Street, Suite 600Philadelphia, PA 19103Tel: (215) 557-4400Fax: (215) 557-4469
New York OfficeThe Chanin Building122 East 42nd Street, 42nd FloorNew York, NY 10168Tel: (212) 822-2400Fax: (212) 949-0439
California OfficeLake Merritt Plaza, Suite 15501999 Harrison StreetOakland, CA 94612Tel: (510) 273-4600Fax: (510) 273-4619
www.ppv.org
The Finance Project1401 New York Avenue NW, Suite 800 Washington, DC 20005Tel: (202) 587-1000Fax: (202) 628-4205www.financeproject.org
The Wallace Foundation5 Penn Plaza, 7th FloorNew York, NY 10001Tel: (212) 251-9700Fax: (212) 679-6990www.wallacefoundation.org