Embed Size (px)
Citation preview

2005
Morgan Stanley Investment Management
Investment Management Journal
01 Asset-liability risks and portable alphaJohn S. Coates, Ph.D., CFA—Managing Director
Every so often, there is a development in the world of finance that results in a major paradigm shift. Currently, we find ourselves in the midst of a very unusual situation in which three such shifts are emerging simultaneously. Each can have a significant impact on the management of the investment portfolios of pensionfunds, endowments and foundations.
09 Emerging markets: All grown up? Paul Psaila, CFA—Executive Director
Emerging market equities have been among the best performing asset classes over the last few years. This has led observers to wonder whether this current bout of outperformance will again end in tears or if the emerging markets have moved on to a more mature plane. We lean toward the latter of these two scenarios, as we believe emerging markets are well into a stage we would characterize as “young adulthood.”
15 The case for a strategic allocation to global real estate securitiesTed Bigman—Managing Director Christina Chiu—Associate
Real estate has gained increased acceptance among institutional investors as a distinct asset class that deserves a permanent strategic allocation in a multi-asset classportfolio. However, only a limited number have incorporated international exposureinto their overall real estate allocations. We believe the global real estate market has evolved such that institutional investors would benefit from a strategic allocation to global real estate, particularly through the listed property markets.
35 Countdown conundrumJoseph McAlinden, CFA—Managing DirectorWarren Hatch, Ph.D., CFA—Vice President
Low long-term interest rates, high oil prices and a red-hot housing market have been the dominant themes in the current business cycle for a surprisingly long time. Their return to equilibrium as the fundamentally strong economic expansionmatures could offer new opportunities for other asset classes, particularly U.S. common stocks.
Volume1
Issue 2
IS05-01016F-N11/05
© 2005 Morgan Stanley. Investments and services are offered throughMorgan Stanley DW Inc., member SIPC.
Morgan Stanley Investment Management (“MSIM”) is the asset managementdivision of Morgan Stanley. Assets are managed by teams representing differentMSIM legal entities with offices in New York, Philadelphia, Houston, Chicago,London, Amsterdam, Singapore, Tokyo and Mumbai.
LITRAK: MSIM
JRNL 12/05
CLF: 79527

Please direct any comments or questions about theMorgan Stanley Investment Management Journal to:
Daniel P. DonnellyManaging [email protected]
ABOUT THE AUTHORS
John S. Coates, Ph.D., CFA Managing DirectorJack is co-business group head of Morgan Stanley AIP.He joined Morgan Stanley AIP in 2000 and has morethan 20 years of investment experience. Jack receivedboth a bachelor’s and a master’s degree in aerospace engineering from the Georgia Institute of Technology.He received an M.B.A. as a Wharton Fellow from the University of Pennsylvania and a Ph.D. from theUniversity of Washington.
Paul Psaila, CFAExecutive DirectorPaul is a portfolio manager for the Emerging MarketsEquity portfolios, focusing on global analytics. Hejoined Morgan Stanley in 1994 and has 11 years ofinvestment experience. Paul received a B.A. in politicalscience from Brandeis University and a master’s degreein economics and Latin American studies from the School of Advanced International Studies of Johns Hopkins University.
Ted BigmanManaging DirectorTed is head of Global Real Estate Securities, the firm’sreal estate securities investment management business.He joined Morgan Stanley in 1995 and has 18 years ofinvestment experience. Ted received a B.A. in economicsfrom Brandeis University and an M.B.A. from HarvardBusiness School.
Christina Chiu AssociateChristina is a securities analyst on the Global RealEstate Securities team, responsible for research and analytical support for the firm’s real estate securitiesinvestment management business. She joined MorganStanley in 2002 and has three years of investment experience. Christina received a B.S. summa cum laudein finance and accounting from New York University’sStern School of Business.
Joseph McAlinden, CFA Managing DirectorJoe is chief investment officer, directing the daily activities of the firm’s investment department. He joinedMorgan Stanley in 1995 and has more than 30 years of investment experience. Joe received a B.A. cum laudein economics from Rutgers University.
Warren Hatch, Ph.D., CFA Vice PresidentWarren is an investment strategist and co-portfoliomanager of the Allocator Fund. He joined MorganStanley in 1999 and has six years of investment experience. Warren received a B.A. in history from the University of Utah, an M.A. in Russian and international policy studies from the Monterey Instituteof International Studies, and a Ph.D. in political science from the University of Oxford.
The forecasts and opinions in this piece are not necessarily those of Morgan Stanley InvestmentManagement and may not actually come to pass.Information in this report does not pertain to anyMorgan Stanley product and is not a solicitation for any product. The views expressed are those of the authors at the time of writing and are subject to change based on market, economic and other conditions. They should not be construed as recommendations, but as illustrations of broader economic themes. All information contained within is based on past performance and is not intended to be indicative of future results. All information is subject to change.
Morgan Stanley does not provide tax advice. The taxinformation contained herein is general and is notexhaustive by nature. It was not intended or writtento be used, and it cannot be used by any taxpayer,for the purpose of avoiding penalties that may beimposed on the taxpayer under U.S. federal tax laws.Federal and state laws are complex and constantlychanging. You should always consult your own legalor tax advisor for information concerning yourindividual situation.
Equity securities are more volatile than bonds and subject to greater risks. Small and mid-sized companystocks involve greater risks than those customarilyassociated with larger companies. Bonds are subject to interest rate, price and credit risks. Prices tend to be inversely affected by changes in interest rates.Unlike stocks and bonds, U.S. Treasury securities are guaranteed as to payment of principal and interest if held to maturity. REITs are more susceptible to the risks generally associated with investments in realestate. Note that it is not possible to invest in a market index.
THIS MATERIAL IS PREPARED FOR INSTITUTIONAL INVESTOR USE ONLY.It may not be reproduced, shown or quoted to members of the general public or used in written form as sales literature; any such use would be in violation of the NASD Conduct Rules.

PG.01
Every now and then, there is a development in the world of finance that results in a major paradigm shift. Examples include the introduction of present value as a tool in financial decision making,1 the Modigliani-Miller hypotheses regarding capital structure2 and the introduction of modern portfolio theory in investing.3
Today we are in the midst of a very unusual situation in which three paradigm shiftsare emerging simultaneously. Each can have a significant impact on the managementof the investment portfolios of pension funds, endowments and foundations.
The first of these developments is a growing focus on various types of asset-liabilityrisk. The second is the recognition that defined benefit plan and endowment orfoundation assets and liabilities are part of the capital structure of the sponsoringentity. They are thus subject to both corporate or trust financial principles and optimal portfolio theory. The third development is the use of various portable alphafinancial engineering techniques to raise investment returns, reduce financing costsand/or facilitate the reduction of various risks, such as asset-liability risks.
Jack would like to thank Charles Stucke and Scott Gregory, executive directors of MorganStanley Alternative Investment Partners, for their significant contributions to our portablealpha programs and to this article.
Asset-liability risks and portable alpha
John S. Coates, Ph.D., CFAManaging DirectorMorgan Stanley Alternative Investment Partners

2 • Investment Management Journal Fall 2005
securities that experience rising values as inflationrises. Inflation-linked bonds might not increaseyield relative to nominal bonds, but they canreduce inflation risk. Also, in a volatile interest-rateenvironment, they can have low correlations withnominal bonds and, thus, provide a risk-reducingportfolio benefit.
Changing demographics. While interest-rate and inflation risks can be quantified and mitigated by various investment strategies, the impacts ofcertain demographic factors generally cannot.Various effects such as the length of plan partici-pant employment, early retirement programs andincreases in longevity can affect defined benefit liabilities. For example, as plan beneficiaries livelonger, benefit payments will continue beyond the dates originally indicated by demographic projections. Medical and other advances cannot be easily forecasted, and this risk cannot be wellhedged (although a market for longevity risk transfer is emerging, and the risk can be offset to some extent if a pension plan is overfunded).
ASSET-LIABILITY MATCHING ON THE RISE
One of a chief financial officer’s tasks is to developan attractive overall capital structure for the firm.Experiences in difficult financial markets, coupledwith scrutiny from investors and analysts, havecaused a growing trend to view a pension programas part of the overall capital structure.
Recent and expected accounting, regulatory and rating agency changes have combined with underfunding of pension plans to cause CFOs to increasingly recognize and deal with the implications for the plan sponsor’s shareholders of the mismatch between defined benefit pensionfund assets and plan liabilities. For example, rela-tively new Securities and Exchange Commissionreporting rules require increased disclosure of pension assets and liabilities. In addition, ratingagencies are beginning to treat unfunded portionsof pension plans as debt-like and might be expected to assign an equity-like risk to significant asset-liability mismatches. The resulting higherimplied leverage puts pressure on companies’credit ratings and associated financing costs, whichalso can increase the volatility of a company’s common stock.
RISKS OF DEFINED BENEFIT PENSION PLANS
We begin with a discussion of the impacts of thesedevelopments on corporate defined benefit pensionplans. Traditionally, pension fund managers oftentended to measure risk in terms of asset portfoliovolatility and relative deviation from the averagepension fund asset mix. Many maintained a classic60/40 mix of stocks and bonds—a decision oftensupported by efficient frontier studies and advicefrom consultants.
Having a “typical” asset mix was often thought tobe a safe harbor from criticism by the Departmentof Labor, which enforces ERISA (the EmployeeRetirement Income Security Act of 1974, the federal law that governs the operation of most private benefit plans). Specifically, a typical mix was viewed as appropriate given ERISA’s prudentman rules; however, a prudent mix for one fund is not necessarily the best mix for another with a different plan liability structure. There are a number of fundamental risk factors that can raisethe unfunded liabilities, potentially increase cashcontributions from the sponsor and call for a tailored optimal asset mix. Several of the moreimportant of these factors are as follows.
Interest rates. An environment of changing interestrates can affect assets and liabilities in differentways and adversely impact a plan’s funded status.For example, falling interest rates increase the present value of liabilities, but the impact on assetvalues can vary quite a bit depending upon theasset mix and macroeconomic environment. This is a typical form of asset-liability mismatch.
Even interest-rate exposures as measured by duration of assets and liabilities can change in different ways as interest rates change because theyhave different convexities and/or key rate duration profiles. This risk can be offset significantly with ahigher allocation to fixed income or other assets inthe pension fund that have durations similar to the liabilities in terms of magnitude and characteristics.
Rising inflation. Rising inflation can also have different impacts on assets and liabilities, particu-larly to the extent a defined benefit plan has inflation-linked benefits, such as cost-of-living provisions. This impact can be mitigated with

Volume 1, Issue 2 Investment Management Journal • 3
Asset-liability mismatch can create risk that is even greater than most rising-interest-rate scenarioshave on a company’s cost of borrowing. Yet, many companies manage their interest rate exposure more carefully than their pension fund asset-liability risk.
Some pension fund managers believe that equitieshave a long duration. They also like the higherexpected long-term returns from equities. However,the duration of equities can be shorter and morevariable than one might expect. In fact, it can be negative at times. Furthermore, funding rulesdo not adequately compensate for relatively short-term (several years) variability in effectiveduration of equity portfolios. This dilemma can be magnified when low stock prices affect both the funding deficit and the company’s ability toraise equity financing.
OTHER ARGUMENTS SUPPORTING HIGHER FIXEDINCOME ALLOCATIONS
In a 1980 paper entitled “The Tax Consequencesof Long-Run Pension Policy,” Fischer Blackshowed that there would be an increase in shareholder value if a pension fund would shift to investing primarily in fixed income securitiesand the sponsoring company would issue bonds at the corporate level to buy back its own shares.5
A related argument is the Modigliani-Millerhypothesis that a company’s stock value will not be increased by actions that shareholders could dothemselves.6 For example, in the absence of taxes or bankruptcy considerations, the hypothesisimplies that the asset mix in a pension fund isirrelevant to the degree that shareholders couldadjust their stock and bond positions to offset or replicate those in the pension fund. In a worldwith taxes, however, the mix becomes important,since interest income in a U.S. pension fund isnontaxable, while individual shareholders would betaxed if they owned bonds. There is less advantageto a fund owning equities since shareholders caninvest in them on their own with low capital gainand dividend taxes.
Accounting rules are expected to evolve in the United States to become more similar to those in Europe that reduce the flexibility to smoothreturns over a period of years and that requireannual marks-to-market of both assets and liabilities. In addition, funding rules are likely to be strengthened and will require more rapidfunding of shortfalls.
We believe that these developments are causing as many as half—or perhaps even more—of U.S.defined benefit pension plan sponsors to considerat least some degree of asset-liability matching.Governments around the world are planningincreased issuance of long-maturity bonds, partlyin anticipation of future demand for the extended-duration securities that asset-liability matching will require.
THE IMPACT OF EQUITIES
Pension fund managers historically have usedmean-variance efficient frontier optimizations as guidance for setting an asset mix. However, theresults of such optimizations are extremely sensitiveto input assumptions of the expected returns,volatilities and correlations of the various assetclasses. These optimizations use asset return volatility (variance) as the measure of risk. Usingasset-liability duration and inflation mismatches as risk measures would suggest higher allocations to long-duration fixed income and inflation-linkedsecurities, with lower allocations to equity.
Not only does a typical 60% allocation to equityexacerbate the asset-liability risk of many funds,but the effective total equity exposure in institu-tional portfolios might be greater than many managers realize. For example, research by Marty Leibowitz and Anthony Bova of MorganStanley indicates that 90% or more of the volatilityof U.S. pension funds is attributable to U.S. stockbeta, even with total equity allocations much less than 90%.4 Furthermore, the effective equityexposure can become even higher in times of unusual market stress.

A number of companies are expected to follow the lead of General Motors Corporation by issuingdebt at the corporate level to help fund their pension plans as part of a tax arbitrage.7 In a particularly interesting Harvard Business Schoolcase, the U.K. company Boots Group issued bondsat the company level, where the interest wasdeductible, while investing exclusively in fixedincome in the pension fund to take advantage of the tax treatment in both the pension fund and the company. Harvard contended that this resulted in an approximate 6% increase in the market capitalization of Boots.8
WHAT ABOUT PUBLIC PENSION PLANS?
We believe public plans could also reduce the risk of interest-rate movements and inflation by shiftingto an asset-liability framework, and it would be in the interest of taxpayers to do this. In addition, the public budgeting process strongly favors predictability and stability in cost structures, including the cost of benefit payments. Therefore,an asset-liability matching model could be helpfulin the process.
However, public pension funding depends upon political factors in many cases—ERISA does notgovern public sector plans. Public plans tend tohave pressures from employees (e.g., throughunions) to raise benefits, and they have pressures to limit tax increases (e.g., through elected repre-sentatives). But the interests of future taxpayers, who must ultimately pay for any shortfalls, are underrepresented.
As a result, there tends to be excessive risk in these systems. Participants favor policies that grantbenefit improvements when a public plan is in a surplus position. Politicians favor policies that deferfunding or that reduce long-term indicated funding,in some cases via higher expected return/higher risk assets.
But when a public plan subsequently moves to adeficit, it is typically much more difficult to reducebenefits or raise taxes to fund adequately. And pub-lic pension deficits are very high on average. Theaggregate funding ratio was estimated to be 88%
4 • Investment Management Journal Fall 2005
in 2004, but the amount of underfunding would beabout twice as large if public plans used the sameaccounting rules as those used by private plans.9
WHAT ABOUT ENDOWMENTS AND FOUNDATIONS?
Endowments and foundations do not have thesame capital structure or ERISA issues as pensionplans. However, they do encounter other issueswith similar risks. Many endowments and foundations have donation goals that are somewhatpredictable and spending requirements that are relatively consistent year after year. Endowmentsand foundations with annual spending policiesdetermined by a fixed percentage of a multi-yearaverage can be forced to sell low and buy highwhen they use a high allocation to equities. Theyalso face inflation risk to the extent their spendingneeds rise over time with inflation.
For example, a college endowment might berequired to deliver a somewhat consistent flow of funds to its campus, or a foundation might have a need to maintain a particular ongoing research or charity program. Endowments and foundationsare generally interested in strategies that are likelyto generate relatively high and consistent real rates of return to maintain the ongoing funding of their programs. While equities are expected todeliver reasonable long-term real rates of return,their volatility introduces near-term risk to theendowment’s or foundation’s capital base and mightnot provide returns that will be adequately high or increase with inflation. Despite the consequencesof this volatility on the future of the institution,stakeholders are often very reluctant to acceptreductions in funding for campus, research or charity programs. Furthermore, reductions in suchfunding can have serious long-term consequencesfor the mission of the institution. Small to medium-sized endowments and foundations, or those with spending needs that are relatively inflexible and above current real interest rates, canbe particularly sensitive to near-term volatility risk.
In addition, many nonprofit organizations issue debt securities, which create additional defined liabilities. While tax law prohibits the direct

Volume 1, Issue 2 Investment Management Journal • 5
funds search for higher returns among asset classes that even further exacerbate the asset-liability mismatch. For example, they might include anallocation to certain types of difficult-to-hedgenon-U.S. securities when their liabilities aredenominated in dollars, or they might look tomicro-cap or emerging market stocks with higherexpected returns, but also with higher volatility.
INCREASED INTEREST IN PORTABLE ALPHA
This brings us to the third paradigm shift. In the last year or two there has been an incredibleincrease in interest in portable alpha as a way toadd expected return to all asset classes, includingfixed income and inflation-protected securities—the very investments that can reduce the risks thatwould otherwise exist. This can be seen from the large number of articles and conferences during 2005 on the specific topic of portablealpha. A 2005 survey indicated that 33% of the large companies surveyed are using portable alpha programs, with another 23% consideringthem—15% of the public funds surveyed areusing portable alpha, with a staggering 37% considering them.10 Many corporate pension funds,endowments and foundations have portable alpha programs; and at least one large public plan has a long history of investing in alternatives in general,and over three years of experience with a majorsuccessful portable alpha program.11
There is a growing recognition of the importanceof using a risk budget for alpha rather than beta,and tailoring the asset mix to better match liabilities. Portable alpha can help investors in their efforts to achieve the best of both worlds—a reduction in various types of asset-liability mismatch while generating high expected returns,even in a low-interest-rate environment.
We discussed the concept of portable alpha atlength in the previous issue of the Morgan StanleyInvestment Management Journal; what follows is an overview of the basics and its applicationwithin defined benefit plans, endowments and foundations.
matching of investment assets to specific tax-exempt bond issues, rating agencies, bondunderwriters and letter-of-credit providers clearlyassess the capital structure of an endowment orfoundation fund. For many private, nonprofit institutions, the strength of the institution relativeto spending needs is the primary source of creditand, consequently, access to capital.
CATCH-22
All of this fits nicely with the concept of increasing the use of long-duration fixed incomeand inflation-protected securities to reduce asset-liability risks. However, the problem is that thevery fixed income and inflation-protected securitiesthat might help institutional investors reduce these risks are not generally projected to generatereturns sufficient to meet their needs for benefit payments or other spending requirements.
This might not be a problem if one could findactive investment managers capable of generatingadequately high and consistent levels of excessreturns (i.e., alpha) to facilitate more asset-liabilitymatching. But the alpha-generating ability of most traditional managers is often limited.Typically, these managers operate in very efficientmarkets (e.g., large-cap U.S. stocks and bonds), are not willing to take positions that deviate verysignificantly from those in their evaluation bench-marks, and are long-only investors. Since they do not sell short, the most they can do to reflect a belief that a security will underperform is tounderweight it or exclude it from their portfolio.
In addition, returns among traditional managers in a given asset class tend to be highly correlated, so a portfolio of such managers offers limiteddiversification benefits. This can be particularlynotable during major negative market events.
When investors using a traditional approach cannot find active managers whose alphas over passive benchmarks are sufficient, they often seek returns and/or alpha in asset classes that arenot ideal for their objectives. As a result, many

6 • Investment Management Journal Fall 2005
The result is a superior mix of alphas, while stillachieving the desired aggregate betas. Althoughportable alpha can be difficult to implement andcan add new management requirements, there are distinct advantages compared to traditionalportfolio management:
Universe. Investors are not forced to seek alphaonly from managers within the target asset classes, opening a vast field of possible high-alphastrategies, such as certain types of hedge funds, private equity and opportunistic real estate, as wellas a few traditional strategies.
Markets. The least efficient markets typically offer the best opportunities for alpha, but theymight entail too much market risk for an investor.Portable alpha lets investors offset undesired exposures and/or capitalize on alpha from sourcesthat do not have undesired market risks.
Objectives. An investor might reduce total portfolio risk by shifting the asset mix to one better suited to its risk objectives. For example, an allocation to equities could be reduced andfixed income and inflation-linked exposuresincreased, while also increasing the expected returnto help achieve asset-liability duration matching, as well as inflation protection and a reduction in volatility.
Efficiency. Portable alpha allows selection of alpha-generating managers without regard to their assetclass. Alpha-generating managers often have lowcorrelations with each other and can be combinedinto very efficient, risk-controlled portfolios.
Risk. By separating alpha and beta decisions, onecan allocate different amounts of a risk budget toeach. For example, the alpha component can belarge or small, unrelated to the amounts of theasset classes to which the alpha is transported. Aninitial small allocation to the alpha source might be increased as cumulative alpha is generated.
The traditional approach to institutional invest-ment management is epitomized by engaging a committee to set target asset classes, and thenchoosing index funds or active managers withineach class in the hope of finding those that are able to generate alphas above the passive asset classreturns. For example, to fill a target equity alloca-tion, investors would search only among equitymanagers; similarly, for a bond allocation, theywould search only among bond managers.
By focusing exclusively on managers within each class, however, investors limit the universe of strategies and managers from which to select and, hence, the opportunities to find the desiredlevels of alpha. Allocations to managers capable of generating the greatest alphas are excluded ifthey do not fit within the confines of the chosenasset classes.
Portable alpha is quite different. It is predicated upon the notion that portfolio objectives can be best achieved when asset class decisions andmanager selections are made independently. It is further based upon the separation of market-based and skill-based returns, and allocating mostof a fund’s active management risk budget to alpha sources.
A typical portable alpha strategy begins by selecting a well-diversified portfolio of the bestalpha-generating managers, regardless of the assetclasses in which they operate, with adequate consideration given to liquidity constraints. Oncean attractive mix of managers is identified, theembedded market exposures (betas) in the portfolioare assessed. The investor then creates an overlay,employing futures, options, swaps or other contractsto add or subtract exposures to particular assetclasses in order to achieve the desired total asset allocation. The objective is to set the overlayexposures so that they and the exposures embeddedin the alpha sources aggregate to the investor’s target exposures.

Volume 1, Issue 2 Investment Management Journal • 7
top-performing managers. During our more than20 years of intense focus on locating alpha—both as a plan sponsor and a fund of funds manager—we have found the most compelling sources to be various types of alternative investments, such as selected subcategories of hedge funds, private equity and opportunistic real estate.
The most attractive alternative strategies are continually changing. Further, the return disper-sion between the best and worst performing strategies and managers can be very large in thefield of the high alpha-generating alternatives, and the relative performance relationships among managers can change dramatically over long periods of time—even for “successful” managers with long track records. Therefore, multi-manager,diversified alpha engines provide key strategicadvantages in a portable alpha structure.
An investor must have access to the best managers,and thoroughly understand each strategy and conduct extensive investment, staffing, process and operational due diligence on candidate managers.Experience-based qualitative evaluations of themanager must be conducted as a complement toquantitative analyses. Managers of portfolios ofalternatives and portable alpha strategies shouldcontinually monitor existing managers and searchfor attractive new ideas and managers. Correlationsamong managers must be analyzed in order tooptimize portfolio efficiency and risk. Investorsmust also consider each manager’s capacity andevaluate the impact on returns of cash flows intothe strategy. Furthermore, fees must be carefullyevaluated relative to the projected alpha.
A fund of funds approach can be one attractiveway for many investors to achieve these multipletasks in a one-stop manner.
Fees. With portable alpha, investors typically pay higher fees only to managers with the ability to add alpha, with much lower costs for beta exposures.
Another attractive element of portable alpha is that alpha can be transported to virtually any assetclass—including cash, all types of equity and fixedincome, tactical allocation and other categories—through the sophisticated use of derivatives andother financial instruments. This is importantbecause different pension plans, endowments andfoundations will have different benefit liability and spending rule characteristics and, thus, different beta requirements for true matching.
Alpha may be transported (1) to any market indexfor which well-functioning derivatives marketsexist, (2) to any asset class that can be replicatedrelatively closely using baskets of securities or (3) to any asset class for which an active or passivemanager exists. A single, diversified portfolio of alpha-generating strategies can be transported to multiple benchmarks simultaneously, making the process of alpha generation more efficient than would be the case if alpha had to be foundseparately for each asset class.
There are many advanced forms of portable alpha.These include a mixed hedge fund/private equityalpha engine, the use of some of the alpha for principal protection, and the addition of global tactical allocation to improve the shape of thereturn distribution, to name but a few.
FINDING ALPHA
Locating, analyzing and accessing investments for an alpha-generating portfolio is very labor- andskill-intensive. The investor must have access to acontinual stream of new ideas for alpha generation,along with relationships with and access to

8 • Investment Management Journal Fall 2005
CONCLUSION
We are still in the early stages of what we expect tobe a massive shift to better asset-liability matchingby pension funds, endowments and foundations,with portable alpha as a financial engineering tool to achieve better matching while seeking to generate high levels of return. This is likely toresult in higher allocations to long-duration fixedincome and inflation-protected securities. It mightalso result in decreased borrowing costs by defined benefit sponsors, endowments and foundations.
Investors are likely to increase their search forsources of alpha, but the search is very skill- and labor-intensive. It requires a great deal of experience, extensive investment and operationsdue diligence, and access to the best strategies and managers.
Portable alpha strategies can help improve portfolioperformance, in terms of return and risk, for institutional investors of all stripes. By dissectingreturns into their underlying components—alphaand beta—and then seeking to optimize resultsfrom each component separately, investors canmeaningfully increase return potential while main-taining a level of market risk more appropriate totheir objectives.
TRANSPORTING ALPHA AND MANAGING BETAS
Once an attractive alpha-generating portfolio isconstructed, an array of tools can be used to estimate the market exposures embedded in theportfolio. Even so-called market-neutral funds havesome embedded betas that must be consideredwhen constructing an overlay. Although there aremathematical techniques to estimate embeddedbetas, the betas tend to fluctuate, can be indirectand relate to other variables, can be the result ofskill that is desirable, and/or can be the result of other nuances. A certain degree of judgment is required to determine when fluctuations are temporary noise and when they reflect a truechange in the underlying economic betas.
After assessing the amounts and typical patterns of betas embedded in an alpha portfolio, aninvestor can implement the desired amount ofadditional beta exposures using futures, options or swaps on the desired target indices. Determiningwhich instruments to use and the correct amountsrequires precise analysis of multiple factors, including pricing, basis risk, optionality and cash management of derivative settlements.
The embedded beta exposures of an alpha portfolio can change over time, and the sum of the embedded and derivative exposures will drift as markets move and alpha is generated. Ongoingmonitoring and periodic adjustments of the overlayare necessary to address such effects. The decisionof how often and by what degree to adjust theoverlay can be complicated, but it is manageable.
Swaps, futures, options and other instruments used in a portable alpha strategy can have quite different cash settlement requirements that need to be managed closely. For example, a swap into a fund of funds will usually require only quarterlyinterest payments, with the gain or loss on thefund of funds settled either at final expiration or, at the option of the investor, earlier. Futures, in contrast, require daily settlements.
1 Fisher, I., The Theory of Interest (1930), New York: Macmillan.
2 Modigliani, F. and M. Miller, “The Cost of Capital, Corporation Finance and the Theory of Investment,” American Economic Review, vol. 48, no. 3 (1958), p. 261–297.
3 Markowitz, H., “Portfolio Selection,” The Journal of Finance, vol. 7, no. 1 (1952), p. 77–91.
4 Leibowitz, M. and A. Bova, “Allocation Betas,” Financial Analysts Journal,vol. 61, no. 4 (2005), p. 70–82.
5 Black, F., “The Tax Consequences of Long-Run Pension Policy,” Financial AnalystsJournal, vol. 36 (1980), p. 21–28.
6 Modigliani, F. and M. Miller, “The Cost of Capital, Corporation Finance and the Theory of Investment,” American Economic Review, vol. 48, no. 3 (1958), p. 261–297.
7 Calio, V., “Others Expected to Hitch Ride on GM Funding Idea,” Pensions & Investments, 22 August 2005, p. 3, 28.
8 Capon, A., “Balancing Act,” Institutional Investor, July 2005, p. 42–43.
9 “Their Own Worst Enemy,” Plan Sponsor, August 2005, p. 57.
10 Chernoff, J., “Lower Returns Put Portable Alpha in Better Light,” Pensions & Investments Online (www.pionline.com), 11 July 2005.
11 “PennSERS ‘Pretty Happy’ with Program,” Pensions & Investments, 4 April 2005.

PG.09
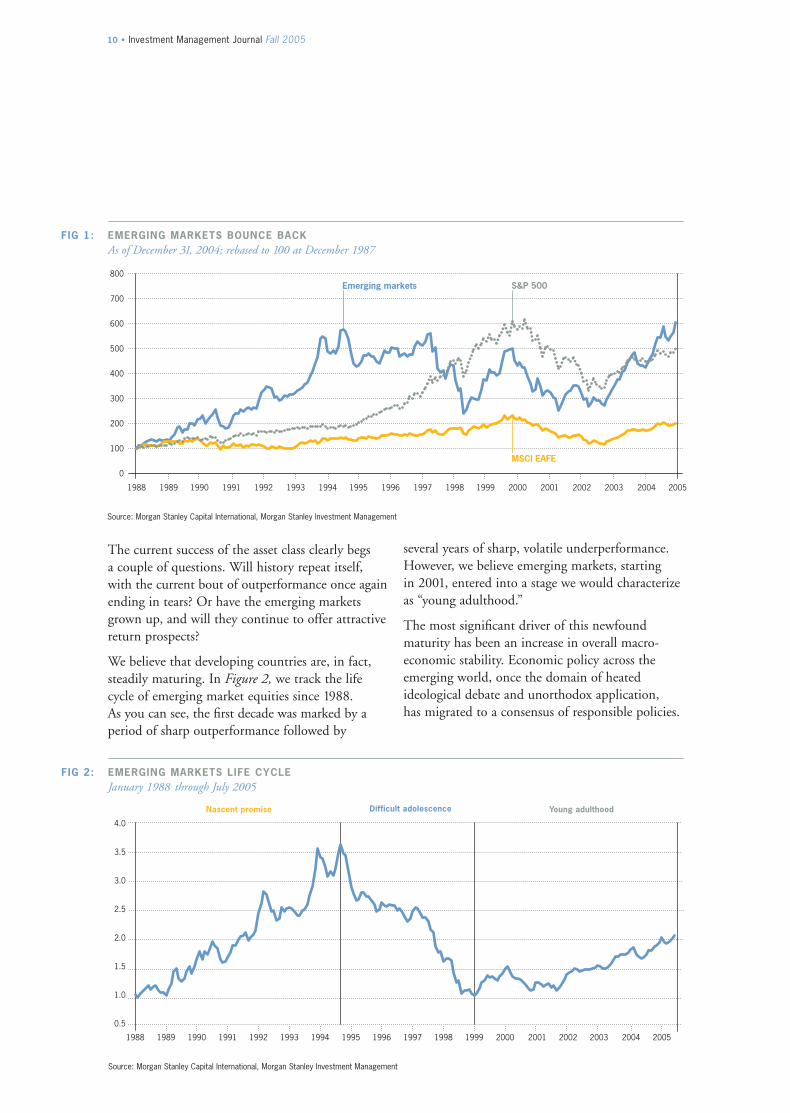
Emerging market equities have been among the best performing asset classes overthe last few years. The MSCI Emerging Markets Index posted a 14.63% annualizedreturn over the five-year period ended October 31, 2005, versus a decline in theS&P 500 Index and flattish European markets. This outperformance has intensifiedover the past three years, with emerging market equities returning 33.59% perannum. (Data sourced from FactSet and MSCI.)
Investors have seen this before. The emerging markets posted spectacular gains from 1992 to 1997. This success, however, was short-lived; a series of crises hit the devel-oping world beginning in 1997, leading to a period of dramatic underperformance. In some cases, investors lost more than 75% (in U.S. dollar terms) of their prior market gains during this period. (See Figure 1.)
Emerging markets: All grown up?
Paul Psaila, CFAExecutive DirectorMorgan Stanley Investment Management
10 • Investment Management Journal Fall 2005
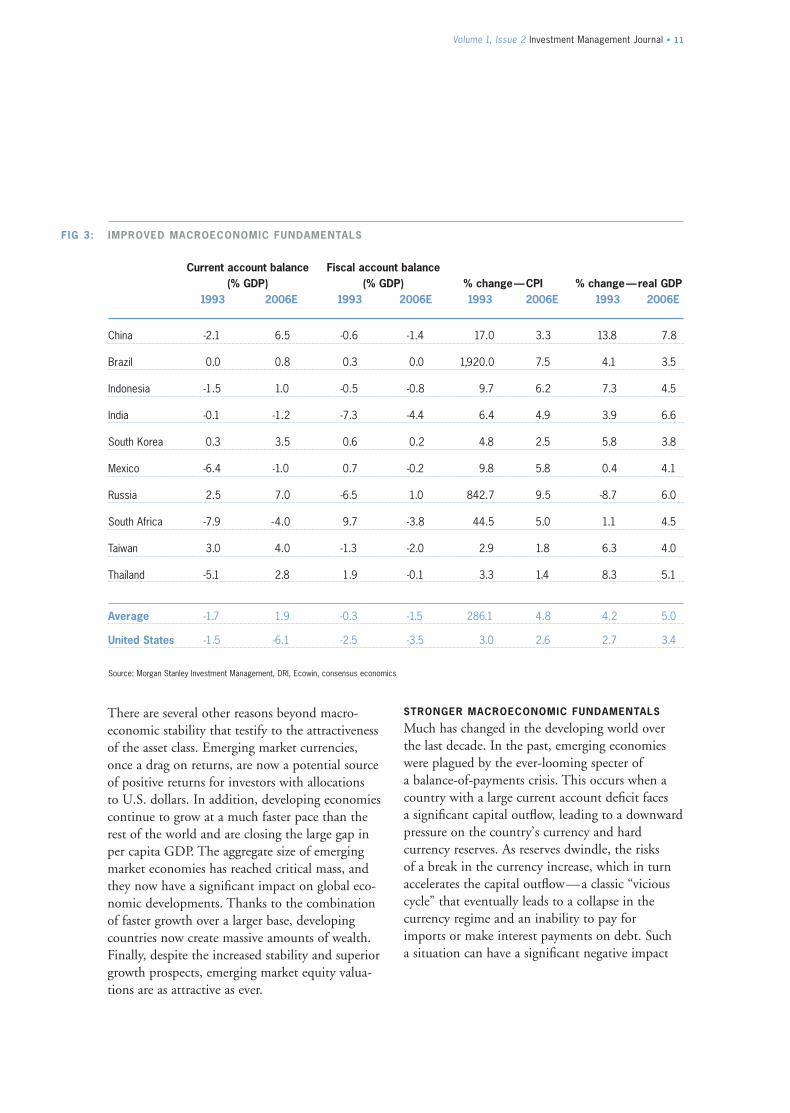
several years of sharp, volatile underperformance.However, we believe emerging markets, starting in 2001, entered into a stage we would characterize as “young adulthood.”
The most significant driver of this newfound maturity has been an increase in overall macro-economic stability. Economic policy across theemerging world, once the domain of heated ideological debate and unorthodox application, has migrated to a consensus of responsible policies.
The current success of the asset class clearly begs a couple of questions. Will history repeat itself,with the current bout of outperformance once againending in tears? Or have the emerging marketsgrown up, and will they continue to offer attractivereturn prospects?
We believe that developing countries are, in fact,steadily maturing. In Figure 2, we track the lifecycle of emerging market equities since 1988. As you can see, the first decade was marked by a period of sharp outperformance followed by
0
100
200
300
400
500
600
700
800Emerging markets S&P 500
MSCI EAFE
1988 1989 1990 1991 1992 1993 1994 1995 1996 1997 1998 1999 2000 2001 2002 2003 2004 2005
FIG 1: EMERGING MARKETS BOUNCE BACKAs of December 31, 2004; rebased to 100 at December 1987
Source: Morgan Stanley Capital International, Morgan Stanley Investment Management
4.0
3.5
3.0
2.5
2.0
1.5
1.0
0.5
Nascent promise Young adulthoodDifficult adolescence
200520042003200220012000199919981997199619951994199319921991199019891988
FIG 2: EMERGING MARKETS LIFE CYCLEJanuary 1988 through July 2005
Source: Morgan Stanley Capital International, Morgan Stanley Investment Management
Volume 1, Issue 2 Investment Management Journal • 11
STRONGER MACROECONOMIC FUNDAMENTALS
Much has changed in the developing world overthe last decade. In the past, emerging economieswere plagued by the ever-looming specter of a balance-of-payments crisis. This occurs when acountry with a large current account deficit faces a significant capital outflow, leading to a downwardpressure on the country’s currency and hard currency reserves. As reserves dwindle, the risks of a break in the currency increase, which in turnaccelerates the capital outflow—a classic “viciouscycle” that eventually leads to a collapse in the currency regime and an inability to pay for imports or make interest payments on debt. Such a situation can have a significant negative impact
There are several other reasons beyond macro-economic stability that testify to the attractiveness of the asset class. Emerging market currencies, once a drag on returns, are now a potential sourceof positive returns for investors with allocations to U.S. dollars. In addition, developing economiescontinue to grow at a much faster pace than therest of the world and are closing the large gap inper capita GDP. The aggregate size of emergingmarket economies has reached critical mass, andthey now have a significant impact on global eco-nomic developments. Thanks to the combinationof faster growth over a larger base, developingcountries now create massive amounts of wealth.Finally, despite the increased stability and superiorgrowth prospects, emerging market equity valua-tions are as attractive as ever.
FIG 3: IMPROVED MACROECONOMIC FUNDAMENTALS
Current account balance Fiscal account balance(% GDP) (% GDP) % change—CPI % change—real GDP
1993 2006E 1993 2006E 1993 2006E 1993 2006E
China -2.1 6.5 -0.6 -1.4 17.0 3.3 13.8 7.8
Brazil 0.0 0.8 0.3 0.0 1,920.0 7.5 4.1 3.5
Indonesia -1.5 1.0 -0.5 -0.8 9.7 6.2 7.3 4.5
India -0.1 -1.2 -7.3 -4.4 6.4 4.9 3.9 6.6
South Korea 0.3 3.5 0.6 0.2 4.8 2.5 5.8 3.8
Mexico -6.4 -1.0 0.7 -0.2 9.8 5.8 0.4 4.1
Russia 2.5 7.0 -6.5 1.0 842.7 9.5 -8.7 6.0
South Africa -7.9 -4.0 9.7 -3.8 44.5 5.0 1.1 4.5
Taiwan 3.0 4.0 -1.3 -2.0 2.9 1.8 6.3 4.0
Thailand -5.1 2.8 1.9 -0.1 3.3 1.4 8.3 5.1
Average -1.7 1.9 -0.3 -1.5 286.1 4.8 4.2 5.0
United States -1.5 -6.1 -2.5 -3.5 3.0 2.6 2.7 3.4
Source: Morgan Stanley Investment Management, DRI, Ecowin, consensus economics

12 • Investment Management Journal Fall 2005
rating agencies represent more than 50% of the J.P. Morgan Emerging Markets Bond Index(EMBI); ten years ago, that number stood at less than 5%. While developing economies are still more likely to run into trouble than their developed counterparts, systemic risk hasclearly declined.
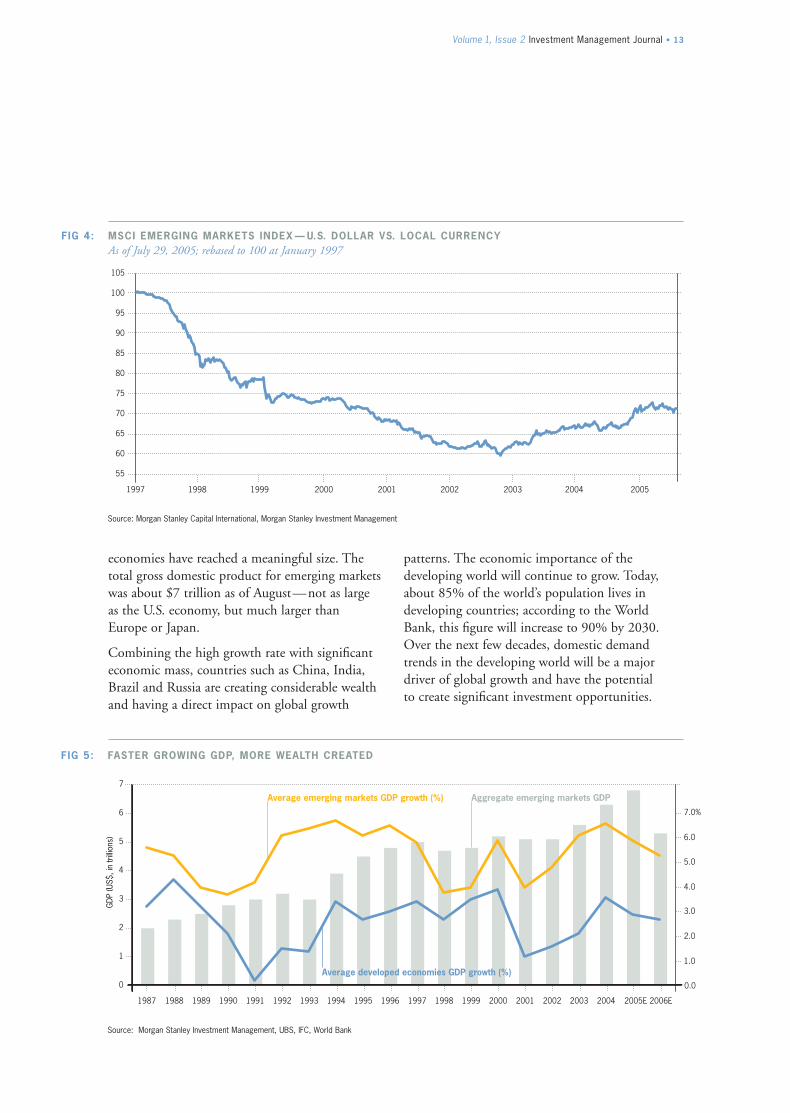
POTENTIAL FOR CURRENCY APPRECIATION
In the past, U.S. dollar-based investors typically lost significant value due to adverse currency movements in the emerging markets. However, the fundamentals of emerging market currencieshave improved dramatically in recent years. In the period before the currency crises, many emerging markets ran large current accountdeficits, a common precursor to a balance of payments crisis. Today, in aggregate, the emergingmarkets are running significant current accountsurpluses and are net creditors to the rest of theworld. The growth in developing-country currentaccount surpluses is the diametric opposite of the deterioration in the U.S. current account. Inaddition, foreign direct investment continues toflow into the developing world, attracted by higherreturn potential; these long-term capital inflowsshould continue to support positive currencyreturns. Given these factors, we think U.S. dollar-based investors are in a position to benefit frommovements in emerging market currencies.
SUPERIOR ECONOMIC GROWTH RATES
Since the end of World War II, developing countries have been growing at a much faster ratethan those in the developed world; IMF data pegs the average annual growth rates in the emergingmarkets at double that of developed markets overthe last two decades. Even during periods of recession, such as the 1991 global slowdown, thisgrowth premium persisted. As the result of this strong and consistent expansion, developing
on a variety of macroeconomic measures. The 1997run on the Thai baht, which eventually spread to other economies and became known as the “Asian flu,” is one recent example of such a crisis.
Since that difficult period, the majority of developing economies have adopted floating currency regimes, which help to absorb externalshocks and to prevent a crisis in a single countryfrom spreading. In 2001, for example, Turkey’sfixed exchange rate system collapsed under theweight of capital outflows, leading to an 8% dropin GDP and a spike in inflation to 75%. However,few investors outside the country can recall theevent. The crisis did not spread, and Turkey hasrecovered to become one of the best performingmarkets in the world since then.
Having learned their lessons the hard way, mostgovernments are implementing conservative fiscalpolicy and independent monetary policy. Largebudget deficits and hyperinflation have beenreplaced by stable growth and price stability. In the 1980s, for example, developing countries ranlarge budget deficits; the International MonetaryFund (IMF) estimates the average budget deficitwas over 6%, which led to high levels of inflation.Average inflation, however, has fallen from around30% in 1995 to only 7% today, resulting in lowerinterest rates in virtually every developing country.
Emerging market debt spreads, one indicator of the overall macroeconomic health of the asset class, have tightened to unprecedented levels. As of August, average spreads were only 270 basis points above U.S. Treasuries. While some of thistightening may be due to such external factors asabundant global liquidity, developing countries in general have improved their credit ratings.According to Fitch, 75% of emerging market countries have positive liquid ratios—i.e., theirtotal hard currency debt outstanding is less thantheir export receipts. Countries whose sovereigndebt is ranked investment grade by the major
Volume 1, Issue 2 Investment Management Journal • 13
Source: Morgan Stanley Capital International, Morgan Stanley Investment Management
105
100
95
90
85
80
75
70
65
60
55
1997 1998 1999 2000 2001 2002 2003 2004 2005
FIG 4: MSCI EMERGING MARKETS INDEX — U.S. DOLLAR VS. LOCAL CURRENCYAs of July 29, 2005; rebased to 100 at January 1997
patterns. The economic importance of the developing world will continue to grow. Today,about 85% of the world’s population lives in developing countries; according to the WorldBank, this figure will increase to 90% by 2030.Over the next few decades, domestic demandtrends in the developing world will be a majordriver of global growth and have the potential to create significant investment opportunities.
economies have reached a meaningful size. Thetotal gross domestic product for emerging marketswas about $7 trillion as of August—not as large as the U.S. economy, but much larger than Europe or Japan.
Combining the high growth rate with significanteconomic mass, countries such as China, India,Brazil and Russia are creating considerable wealthand having a direct impact on global growth
Source: Morgan Stanley Investment Management, UBS, IFC, World Bank
2005E 2006E2004
0.0
20032002200120001999199819971996199519941993199219911990198919881987
Average emerging markets GDP growth (%) Aggregate emerging markets GDP
Average developed economies GDP growth (%)0
1
2
3
4
5
6
7
GDP
(US$
, in
trilli
ons)
7.0%
6.0
5.0
4.0
3.0
2.0
1.0
FIG 5: FASTER GROWING GDP, MORE WEALTH CREATED
14 • Investment Management Journal Fall 2005
ALL GROWN UP? MAYBE NOT, BUT GETTING THERE
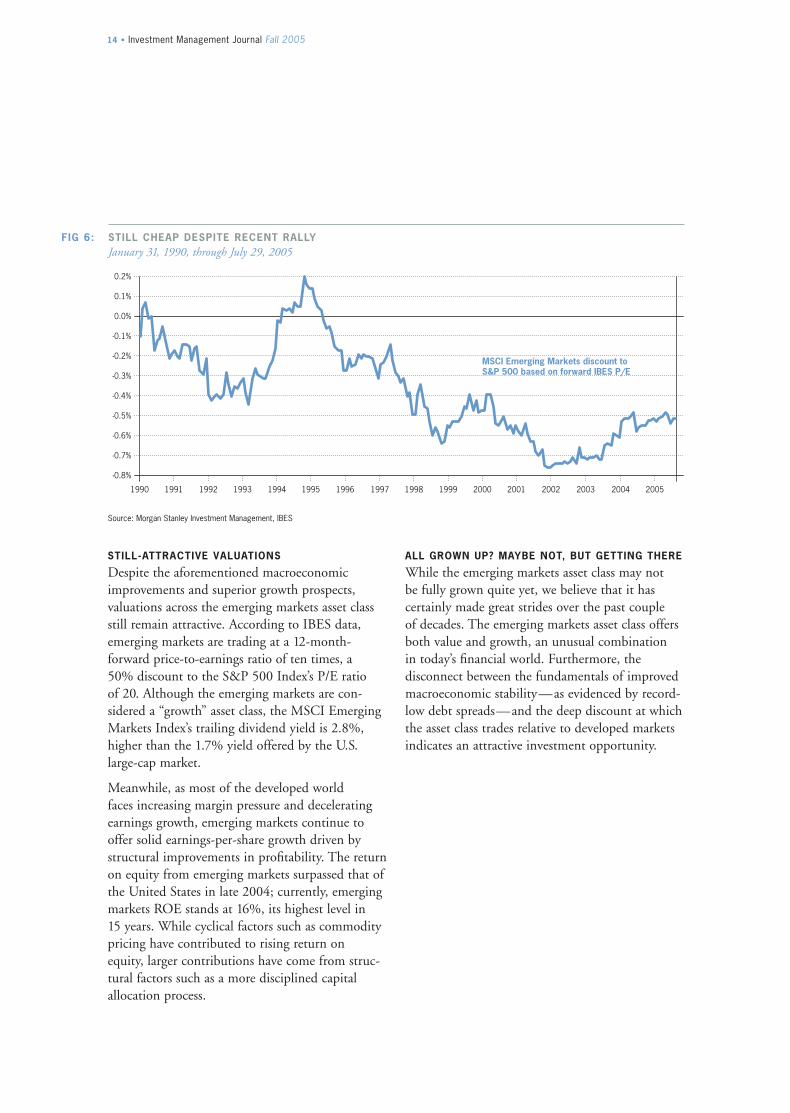
While the emerging markets asset class may not be fully grown quite yet, we believe that it has certainly made great strides over the past couple of decades. The emerging markets asset class offersboth value and growth, an unusual combination in today’s financial world. Furthermore, the disconnect between the fundamentals of improvedmacroeconomic stability—as evidenced by record-low debt spreads—and the deep discount at whichthe asset class trades relative to developed marketsindicates an attractive investment opportunity.
STILL-ATTRACTIVE VALUATIONS
Despite the aforementioned macroeconomicimprovements and superior growth prospects, valuations across the emerging markets asset classstill remain attractive. According to IBES data, emerging markets are trading at a 12-month-forward price-to-earnings ratio of ten times, a 50% discount to the S&P 500 Index’s P/E ratio of 20. Although the emerging markets are con-sidered a “growth” asset class, the MSCI EmergingMarkets Index’s trailing dividend yield is 2.8%,higher than the 1.7% yield offered by the U.S.large-cap market.
Meanwhile, as most of the developed world faces increasing margin pressure and decelerating earnings growth, emerging markets continue tooffer solid earnings-per-share growth driven bystructural improvements in profitability. The returnon equity from emerging markets surpassed that ofthe United States in late 2004; currently, emergingmarkets ROE stands at 16%, its highest level in 15 years. While cyclical factors such as commoditypricing have contributed to rising return on equity, larger contributions have come from struc-tural factors such as a more disciplined capital allocation process.
Source: Morgan Stanley Investment Management, IBES
-0.8%
-0.7%
-0.6%
-0.5%
-0.4%
-0.3%
-0.2%
-0.1%
0.0%
0.1%
0.2%
1990 1991 1992 1993 1994 1995 1996 1997 1998 1999 2000 2001 2002 2003 2004 2005
MSCI Emerging Markets discount to S&P 500 based on forward IBES P/E
FIG 6: STILL CHEAP DESPITE RECENT RALLYJanuary 31, 1990, through July 29, 2005

Christina ChiuAssociateMorgan Stanley Investment Management
Ted BigmanManaging DirectorMorgan Stanley Investment Management
In recent years, real estate has received a heightened level of interest from institutional investors due to various reasons, including its attractive risk-adjustedreturns, the diversification benefits from its low correlation with other investmentclasses, and the modest expected returns for the broader equity and fixed incomemarkets. As a result, real estate has gained increased acceptance as a distinct assetclass that deserves a permanent strategic allocation in a multi-asset class portfolio.
The case for a strategic allocation to global real estate securities
PG.15
16 • Investment Management Journal Fall 2005
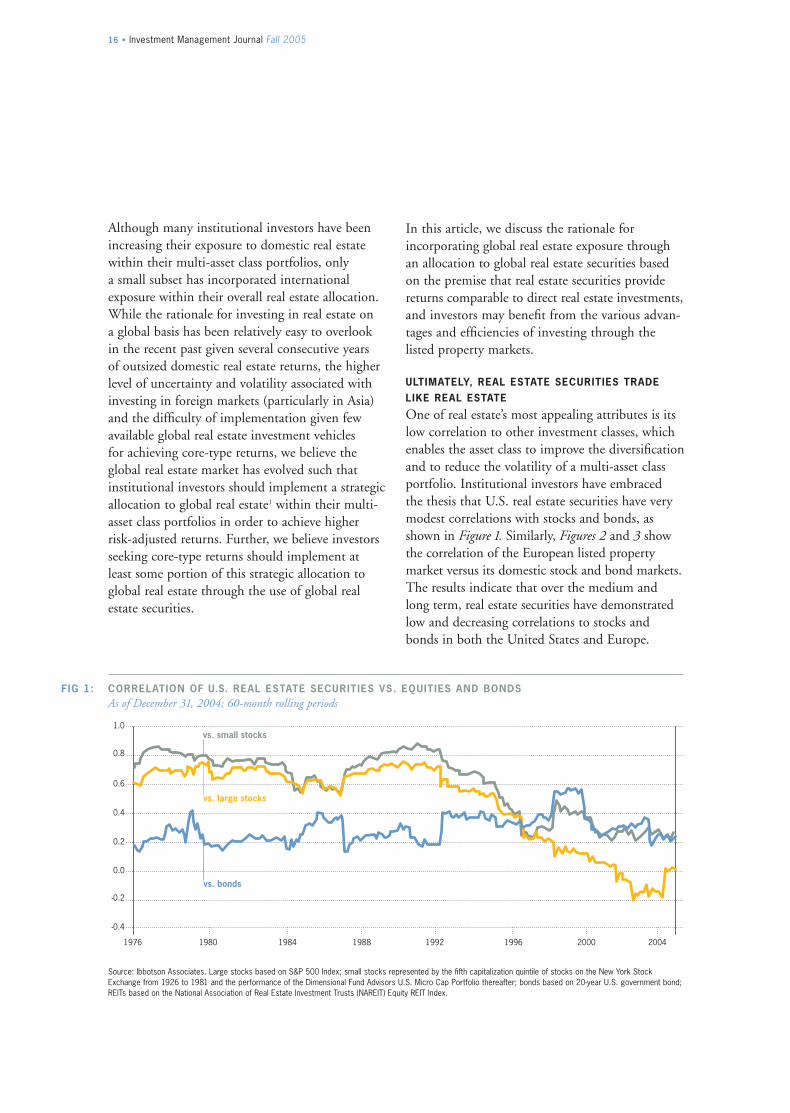
Source: Ibbotson Associates. Large stocks based on S&P 500 Index; small stocks represented by the fifth capitalization quintile of stocks on the New York Stock Exchange from 1926 to 1981 and the performance of the Dimensional Fund Advisors U.S. Micro Cap Portfolio thereafter; bonds based on 20-year U.S. government bond;REITs based on the National Association of Real Estate Investment Trusts (NAREIT) Equity REIT Index.
20042000199619921988198419801976
-0.4
-0.2
0.0
0.2
0.4
0.6
0.8
1.0vs. small stocks
vs. large stocks
vs. bonds
FIG 1: CORRELATION OF U.S. REAL ESTATE SECURITIES VS. EQUITIES AND BONDS As of December 31, 2004; 60-month rolling periods
In this article, we discuss the rationale for incorporating global real estate exposure throughan allocation to global real estate securities basedon the premise that real estate securities providereturns comparable to direct real estate investments,and investors may benefit from the various advan-tages and efficiencies of investing through the listed property markets.
ULTIMATELY, REAL ESTATE SECURITIES TRADELIKE REAL ESTATE
One of real estate’s most appealing attributes is itslow correlation to other investment classes, whichenables the asset class to improve the diversificationand to reduce the volatility of a multi-asset classportfolio. Institutional investors have embraced the thesis that U.S. real estate securities have very modest correlations with stocks and bonds, asshown in Figure 1. Similarly, Figures 2 and 3 showthe correlation of the European listed property market versus its domestic stock and bond markets.The results indicate that over the medium andlong term, real estate securities have demonstratedlow and decreasing correlations to stocks andbonds in both the United States and Europe.
Although many institutional investors have beenincreasing their exposure to domestic real estatewithin their multi-asset class portfolios, only a small subset has incorporated international exposure within their overall real estate allocation.While the rationale for investing in real estate on a global basis has been relatively easy to overlook in the recent past given several consecutive years of outsized domestic real estate returns, the higherlevel of uncertainty and volatility associated withinvesting in foreign markets (particularly in Asia)and the difficulty of implementation given fewavailable global real estate investment vehicles for achieving core-type returns, we believe theglobal real estate market has evolved such thatinstitutional investors should implement a strategicallocation to global real estate1 within their multi-asset class portfolios in order to achieve higher risk-adjusted returns. Further, we believe investorsseeking core-type returns should implement at least some portion of this strategic allocation toglobal real estate through the use of global realestate securities.

Volume 1, Issue 2 Investment Management Journal • 17
Source: Global Property Research, Datastream
20042003200119991997199519931991 200520022000199819961992 19941990
-0.4
-0.2
0.0
0.2
0.4
0.6
0.8
Three-year total return correlation
Five-year total return correlation
FIG 3: CORRELATION OF EUROPEAN REAL ESTATE SECURITIES VS. BONDSProperty shares vs. JP Morgan European Bond Index; as of September 30, 2005
Source: Global Property Research, MSCI, Morgan Stanley
20052004200320022001200019991998
0.4
0.5
0.6
0.7
0.8
Ten-year total return correlation
FIG 2: CORRELATION OF EUROPEAN REAL ESTATE SECURITIES VS. EQUITIES Property shares vs. MSCI European Equity Index; as of September 30, 2005
18 • Investment Management Journal Fall 2005
Source: Global Property Research, Investment Property Databank
20051999199519911985 1987 1989 1993 1997 2001 20031983
100
300
500
700
900
1,100
IPD U.K. Property Index (direct)
GPR U.K. Index (indirect)
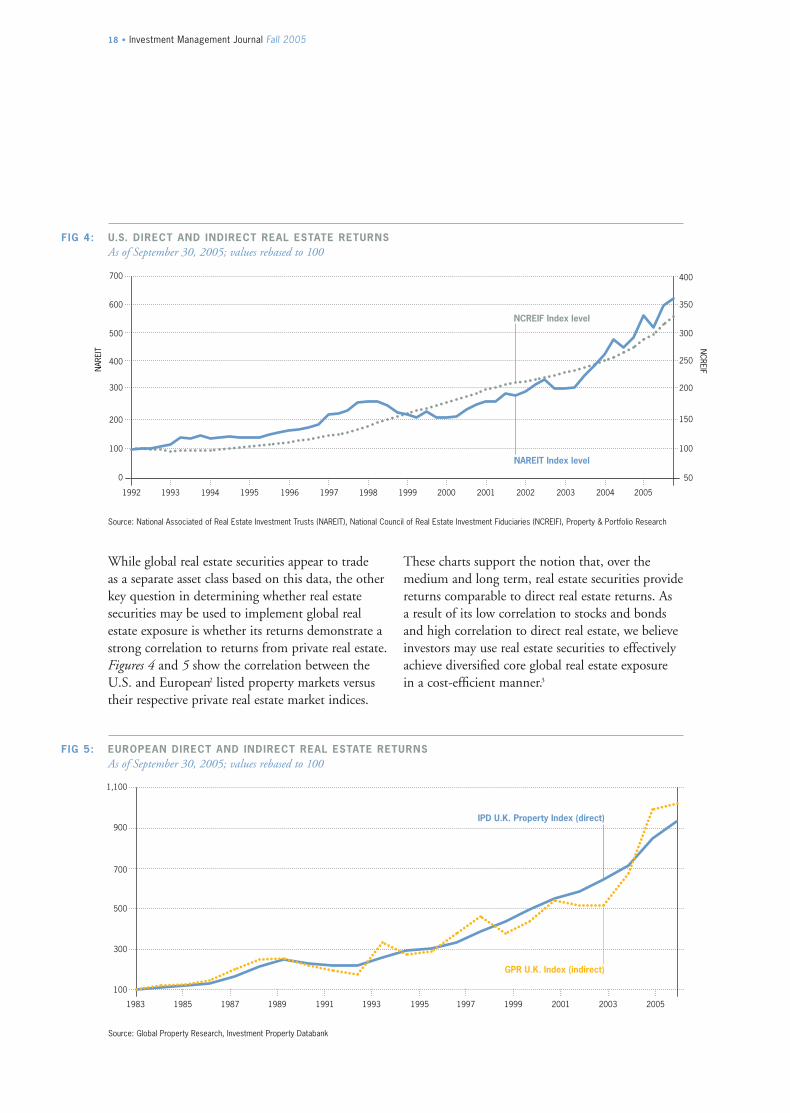
FIG 5: EUROPEAN DIRECT AND INDIRECT REAL ESTATE RETURNSAs of September 30, 2005; values rebased to 100
Source: National Associated of Real Estate Investment Trusts (NAREIT), National Council of Real Estate Investment Fiduciaries (NCREIF), Property & Portfolio Research
1999199719951993 1994 1996 1998 2000 2001 2002 2003 2004 20051992
0
100
200
300
400
500
600
700
100
200
300
400
50
150
250
350
NAREIT Index level
NCREIF Index level
NAR
EIT N
CREIF
FIG 4: U.S. DIRECT AND INDIRECT REAL ESTATE RETURNSAs of September 30, 2005; values rebased to 100
These charts support the notion that, over themedium and long term, real estate securities providereturns comparable to direct real estate returns. As a result of its low correlation to stocks and bondsand high correlation to direct real estate, we believeinvestors may use real estate securities to effectivelyachieve diversified core global real estate exposure in a cost-efficient manner.3
While global real estate securities appear to trade as a separate asset class based on this data, the otherkey question in determining whether real estatesecurities may be used to implement global realestate exposure is whether its returns demonstrate astrong correlation to returns from private real estate.Figures 4 and 5 show the correlation between theU.S. and European2 listed property markets versustheir respective private real estate market indices.

Volume 1, Issue 2 Investment Management Journal • 19
FIG 6: CORRELATION OF LISTED PROPERTY MARKETS1993 –3Q05
Country North America Europe Asia (ex-Australia) Australia
North America 1.00 0.49 0.33 0.40
Europe 1.00 0.34 0.51
Asia (ex-Australia) 1.00 0.43
Australia 1.00
Source: Global Property Research, Morgan StanleyNote: Data provided in U.S. dollars
FIG 7: HISTORICAL RETURNS AND RISK OF LISTED PROPERTY MARKETS1993 –3Q05
Country Historical return Standard deviation
U.S. 15.9% 15.3%
Europe 15.6 14.4
Asia (ex-Australia) 7.2 33.1
Australia 18.4 18.3
Source: Global Property Research, Morgan StanleyNote: Data provided in U.S. dollars
the listed property markets in North America,Europe, Asia ex-Australia and Australia,4 furtherdemonstrating that expanding from a domestic-only real estate portfolio to a global real estateportfolio enhances these diversification benefits.These results make intuitive sense because realestate is a highly localized business with real estatesupply and tenant demand characteristics withineach market driven predominantly by local market fundamentals.
Since real estate cycles do not tend to evolve intandem across the globe, investing on a global basis expands the investment scope from purelydomestic to include international markets, whichin turn provides the possibility to gain exposure toreal estate markets that are positioned in differentphases of the real estate cycle.
WHY MAKE A STRATEGIC ALLOCATION TO GLOBAL REAL ESTATE SECURITIES?
There are two key reasons why investors shouldincorporate international exposure within theiroverall real estate allocation. First, as real estate is a highly localized business, investors may improvethe diversification benefits of their overall realestate allocation and potentially enhance returnsthrough active portfolio management. Second, a review of the historical returns provided by theglobal listed property markets suggests that aninternational allocation may increase the expectedrisk-adjusted returns over a domestic-only portfolio.
Lack of correlation between regions meansenhanced diversification benefits. It has alreadybeen demonstrated that the diversification benefitsof a multi-asset class portfolio are improved withthe addition of real estate, as real estate securitiestrade as a separate asset class with low and de-creasing correlation to stocks and bonds. Figure 6shows the low correlations between returns from
We believe the diversity in the cyclical stages for the different regions provides investors with the opportunity to add value and to enhance performance across a global real estate securitiesportfolio. Specifically, an active portfolio managercan alter regional allocations based on near-termopportunities as well as long-term expectations in an effort to achieve better risk-adjusted returnsby overweighting those regions, countries andproperty sectors at different phases of the real estate cycle with the strongest fundamentals and growth prospects and most favorablerisk/return characteristics.
Better risk-adjusted returns versus domestic-onlyportfolio. Figure 7 provides the historical risk andreturn results of the global listed property marketssince the beginning of the modern REIT era5
in the United States. From the perspective of aU.S. investor, when compared to the U.S. listedproperty market over this period, the Europeanlisted property market has provided slightly higherreturns with comparable risk while the Australianlisted property market has provided higher returnswith modestly higher risk; the Asia ex-Australialisted property market, in contrast, has providedhistorically lower returns with substantially morerisk. While these results obviously support theinclusion of Europe and Australia in a domestic-only real estate portfolio, the lower relative historical risk-adjusted returns for Asia ex-Australiado not appear to make a compelling case forinvesting in this region.
We believe the historical risk and return profile of the Asia ex-Australia listed property market maynot be representative of the favorable prospects forthe region going forward. Over the past decade, this market has experienced an exceptionally highlevel of volatility due to a variety of factors thathave negatively impacted the performance of theoverall Asian region, including economic weakness,the Asian financial crisis and the SARS outbreak.These unfavorable conditions have adverselyimpacted underlying real estate fundamentals and thus the performance of the listed propertycompanies. We believe the Asia ex-Australia listedproperty market may provide better returns going
20 • Investment Management Journal Fall 2005
Singapore 5.1%
Australia 38.8%
31.1% Japan
0.3% New Zealand
Hong Kong 24.7%
Greece 0.2%
U.K. 45.9%
4.9% Sweden
7.0% Spain
2.4% Belgium
3.1% Switzerland
1.0% Finland
2.3% Italy
3.1% Germany
Denmark 0.6%
Austria 5.0%
6.5% Canada
France 10.4%
93.5% U.S.
14.1% Netherlands
North American index
European index
Asian index
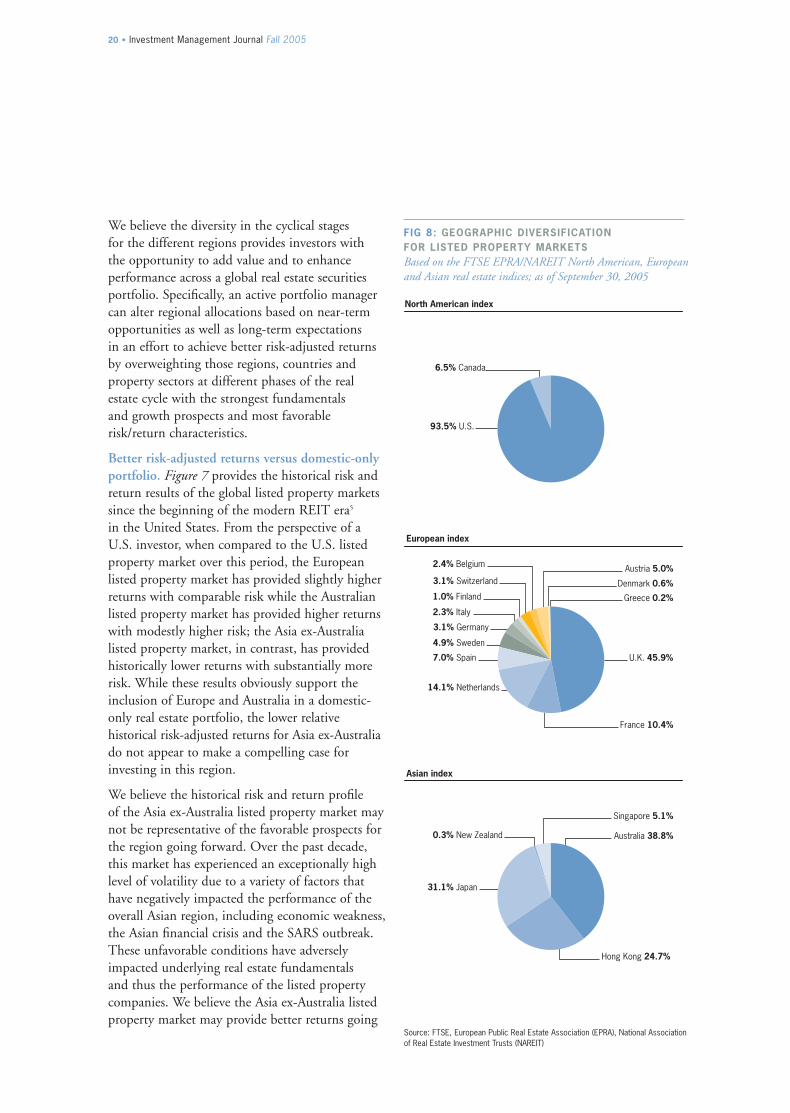
FIG 8: GEOGRAPHIC DIVERSIFICATION FOR LISTED PROPERTY MARKETS Based on the FTSE EPRA/NAREIT North American, Europeanand Asian real estate indices; as of September 30, 2005
Source: FTSE, European Public Real Estate Association (EPRA), National Associationof Real Estate Investment Trusts (NAREIT)
Volume 1, Issue 2 Investment Management Journal • 21
forward with lower volatility than experienced overthe past decade due to improved real estate funda-mentals and an improved investment universe.
A LOOK AT THE GLOBAL REAL ESTATE SECURITIES INVESTMENT UNIVERSE
The global real estate securities market has experienced significant growth in recent years,driven mostly by 1) the high level of interest fromand investment activity by investors attracted to real estate, 2) proactive regulatory changes toimprove and create structures for public real estateinvestment and 3) its recent success, as measuredby the strong performance of the sector. In 2003and 2004, the FTSE European Public Real EstateAssociation/National Association of Real EstateInvestment Trusts (FTSE EPRA/NAREIT) GlobalReal Estate Index6 generated total returns (as measured in U.S. dollars) of 40.5% and 38.0%,respectively. As a result of this significant priceappreciation, coupled with successful initial publicofferings and follow-on equity offerings, the mar-ket capitalization of the global real estate securitiesmarket has more than doubled over the past severalyears. The free float market capitalization of theFTSE EPRA/NAREIT Global Real Estate Indexhas increased from US$264 billion at the end of2002 to US$362 billion in 2003, US$505 billionin 2004 and further to US$609 billion as ofSeptember 2005.
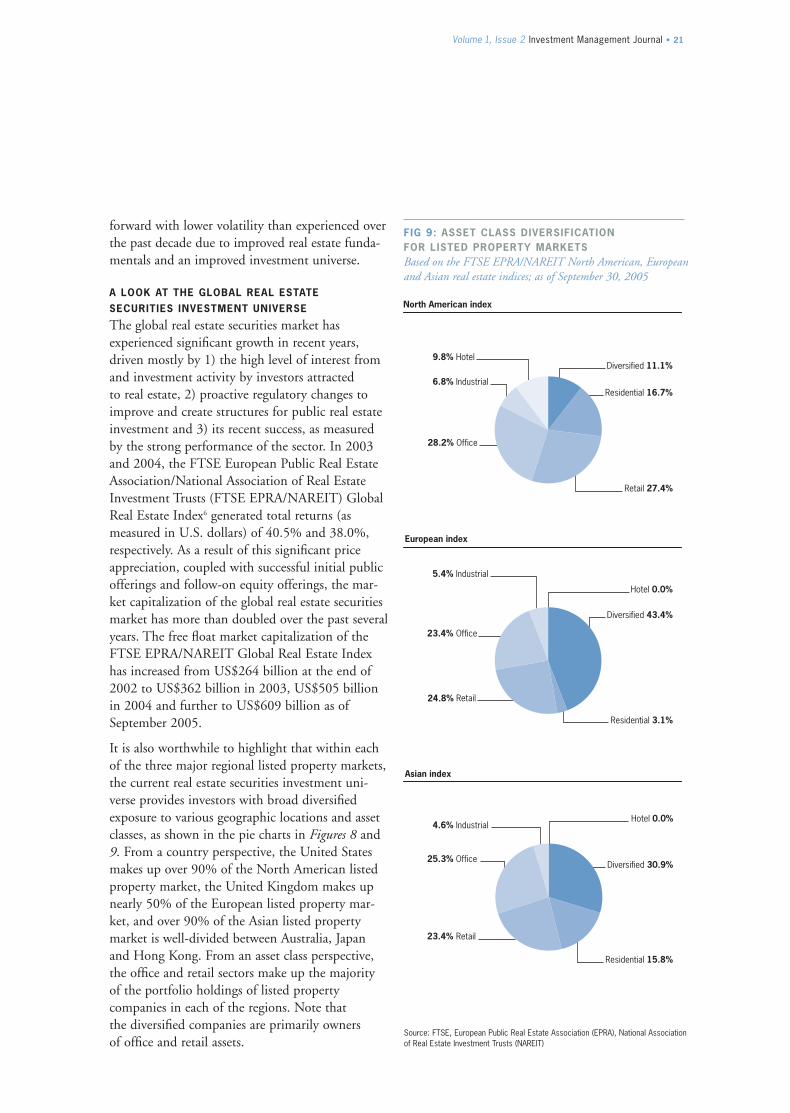
It is also worthwhile to highlight that within eachof the three major regional listed property markets,the current real estate securities investment uni-verse provides investors with broad diversifiedexposure to various geographic locations and assetclasses, as shown in the pie charts in Figures 8 and9. From a country perspective, the United Statesmakes up over 90% of the North American listedproperty market, the United Kingdom makes upnearly 50% of the European listed property mar-ket, and over 90% of the Asian listed propertymarket is well-divided between Australia, Japanand Hong Kong. From an asset class perspective,the office and retail sectors make up the majorityof the portfolio holdings of listed property companies in each of the regions. Note that the diversified companies are primarily owners of office and retail assets.
Hotel 0.0%
Diversified 30.9%25.3% Office
4.6% Industrial
Residential 15.8%
Diversified 43.4%
Hotel 0.0%
23.4% Office
Residential 3.1%
5.4% Industrial
9.8% HotelDiversified 11.1%
Residential 16.7%6.8% Industrial
28.2% Office
24.8% Retail
23.4% Retail
Retail 27.4%
North American index
European index
Asian index
FIG 9: ASSET CLASS DIVERSIFICATION FOR LISTED PROPERTY MARKETS Based on the FTSE EPRA/NAREIT North American, Europeanand Asian real estate indices; as of September 30, 2005
Source: FTSE, European Public Real Estate Association (EPRA), National Associationof Real Estate Investment Trusts (NAREIT)

22 • Investment Management Journal Fall 2005
FIG 10: SUMMARY OF GLOBAL REAL ESTATE BENCHMARKSAs of September 30, 2005
S&P/CitigroupFTSE EPRA/NAREIT BMI WorldGlobal Real Estate GPR General GPR 250 Property UBS Global Real Estate
Provider FTSE GPR/Kempen GPR/Kempen S&P/Citigroup UBS
Index Comparison
Constituent weight Global Investors OnlyNA: 53% NA: 45% NA: 48% NA: 50% NA: 53% NA: 62%Europe: 19% Europe: 21% Europe: 19% Europe: 18% Europe: 19% Europe: 21%Asia: 28% Asia: 34% Asia: 33% Asia: 32% Asia: 28% Asia: 17%
Total market US$609 bn US$686 bn US$521 bn US$577 bn US$609 bn US$517 bncapitalization (free float) (market cap) (free float) (free float) (free float) (free float)
Number of countries NA: 2 NA: 2 NA: 2 NA: 2 NA: 2 NA: 2Europe: 13 Europe: 13 Europe: 11 Europe: 14 Europe: 13 Europe: 11Asia: 5 Asia: 7 Asia: 6 Asia: 5 Asia: 5 Asia: 5
Inclusion Criteria
Real estate activity >75% of EBITDA >75% >75% >50% Classified by business type:(excludes financing operating profit operating profit sales “Investor” if >70% total and homebuilding) revenues from real estate
rental income; otherwise“Developer/Other”
Size On free float basis; Global: Global: Global: As defined byNA: >US$200 mm >US$50 mm >US$50 mm >US$100 mm FTSE EPRA/NAREITEurope: >€50 mm market cap free float free floatAsia: >US$200 mm
Liquidity On annual basis; N/A 250 most N/A As defined by NA: >US$100 mm liquid stocks FTSE EPRA/NAREITEurope: >€25 mmAsia: >US$100 mm
Index Construction
Country Primary listing Dominant Dominant Primary listing As defined by allocation asset base asset base FTSE EPRA/NAREIT
Weighting Free float Market cap Free float Free float Free float
Frequency Daily Monthly Daily Daily Daily
Revision Quarterly by an Monthly Quarterly Annual Quarterlyfrequency advisory committee
per continent
Source: Morgan Stanley Investment Management, FTSE, Global Property Research, S&P/Citigroup, UBS
Volume 1, Issue 2 Investment Management Journal • 23
INVESTMENT UNIVERSE POISED TO CONTINUE TO ALLOW FOR SIGNIFICANT GROWTH
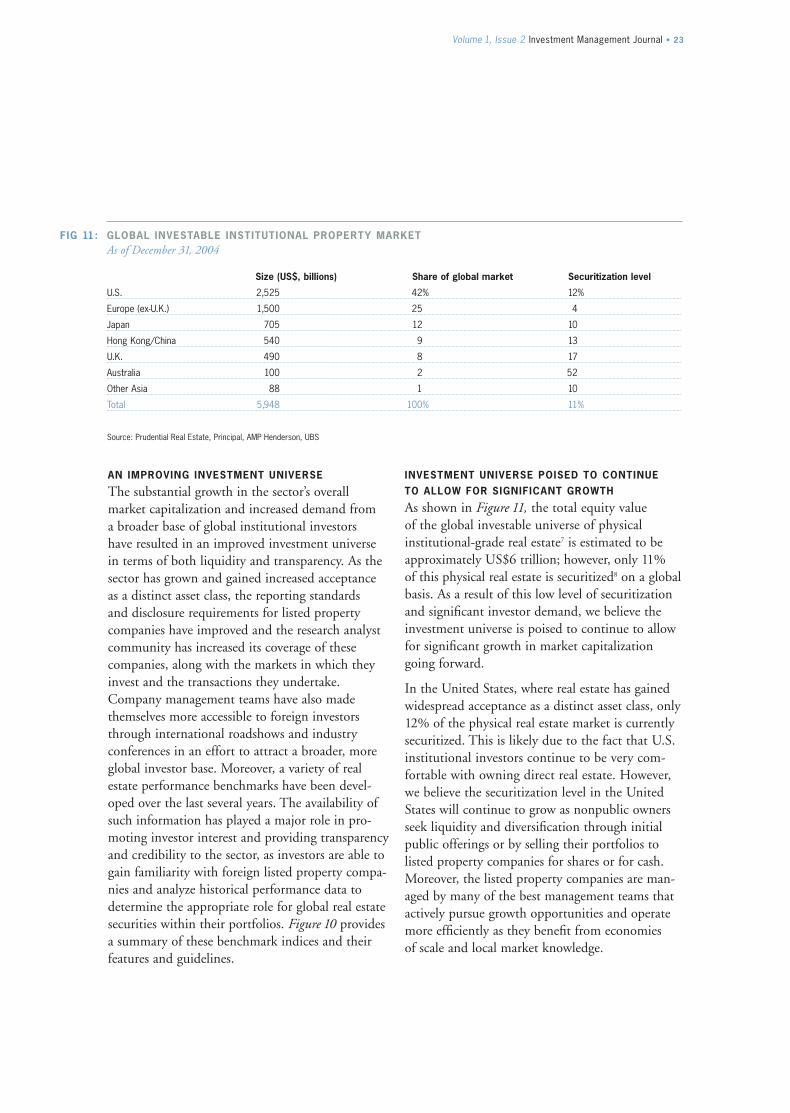
As shown in Figure 11, the total equity value of the global investable universe of physical institutional-grade real estate7 is estimated to beapproximately US$6 trillion; however, only 11% of this physical real estate is securitized8 on a globalbasis. As a result of this low level of securitizationand significant investor demand, we believe theinvestment universe is poised to continue to allowfor significant growth in market capitalizationgoing forward.
In the United States, where real estate has gainedwidespread acceptance as a distinct asset class, only12% of the physical real estate market is currentlysecuritized. This is likely due to the fact that U.S.institutional investors continue to be very com-fortable with owning direct real estate. However,we believe the securitization level in the UnitedStates will continue to grow as nonpublic ownersseek liquidity and diversification through initialpublic offerings or by selling their portfolios to listed property companies for shares or for cash.Moreover, the listed property companies are man-aged by many of the best management teams thatactively pursue growth opportunities and operatemore efficiently as they benefit from economies of scale and local market knowledge.
AN IMPROVING INVESTMENT UNIVERSE
The substantial growth in the sector’s overall market capitalization and increased demand from a broader base of global institutional investors have resulted in an improved investment universe in terms of both liquidity and transparency. As thesector has grown and gained increased acceptanceas a distinct asset class, the reporting standards and disclosure requirements for listed propertycompanies have improved and the research analystcommunity has increased its coverage of these companies, along with the markets in which theyinvest and the transactions they undertake.Company management teams have also madethemselves more accessible to foreign investorsthrough international roadshows and industry conferences in an effort to attract a broader, moreglobal investor base. Moreover, a variety of realestate performance benchmarks have been devel-oped over the last several years. The availability ofsuch information has played a major role in pro-moting investor interest and providing transparencyand credibility to the sector, as investors are able togain familiarity with foreign listed property compa-nies and analyze historical performance data todetermine the appropriate role for global real estatesecurities within their portfolios. Figure 10 providesa summary of these benchmark indices and theirfeatures and guidelines.
FIG 11: GLOBAL INVESTABLE INSTITUTIONAL PROPERTY MARKETAs of December 31, 2004
Size (US$, billions) Share of global market Securitization level
U.S. 2,525 42% 12%
Europe (ex-U.K.) 1,500 25 4
Japan 705 12 10
Hong Kong/China 540 9 13
U.K. 490 8 17
Australia 100 2 52
Other Asia 88 1 10
Total 5,948 100% 11%
Source: Prudential Real Estate, Principal, AMP Henderson, UBS
24 • Investment Management Journal Fall 2005
Introduction and development of REIT marketswill be a major catalyst for growth. One of themajor catalysts for the securitization of real estateover the last decade and in recent years has beenthe proliferation of tax-efficient real estate owner-ship structures in countries around the world. Atpresent, the three most established public REIT9
markets are in the United States, which first intro-duced real estate investment trusts in 1960, eventhough the modern REIT era did not begin untilthe early 1990s; Australia, which created listedproperty trusts, known as LPTs, in 1972; and theNetherlands, which introduced fiscal investmentinstitutions, known as Dutch BIs, in 1969. As a result of the success of these markets and in an effort to promote institutional real estate investment and remain competitive in the global financial markets, a number of countries through-out Europe and Asia have adopted or are planningto adopt legislation authorizing the creation ofREIT structures. Since 2001, France, Japan,Singapore and Hong Kong have enacted REIT legislation. In addition, the United Kingdom andGermany are actively considering the introductionof these vehicles.
CATEGORIES OF LISTED PROPERTY MARKETS IN CURRENT GLOBAL INVESTMENT UNIVERSE
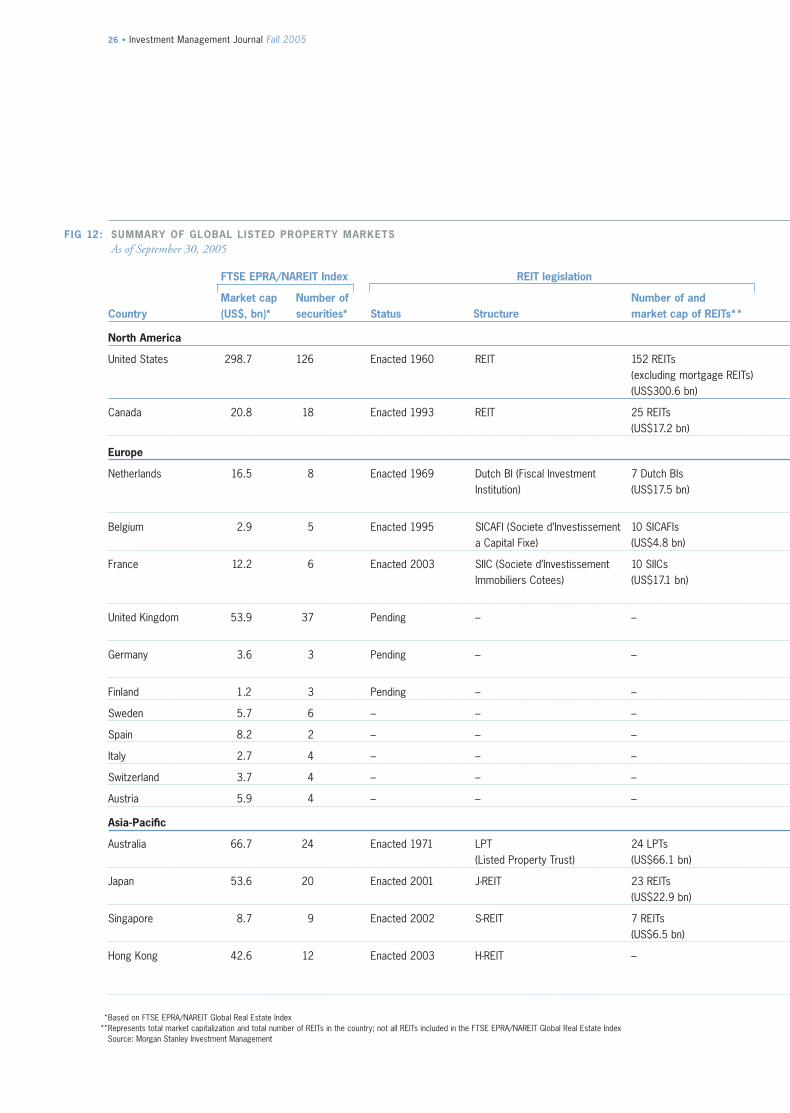
In order to summarize the various types of listedproperty markets in the current global investmentuniverse, we have identified five categories of markets, with key differentiating factors beingwhether these markets are developed10 versus undeveloped, whether tax-efficient REIT owner-ship structures have been introduced, and whetherthe companies within these markets are internallyor externally managed. Figure 12 on pages 26 and 27 provides a summary of the global listedproperty markets, including the size of the variouslisted property markets, as well as which countrieshave enacted REIT legislation.
The very low level of securitization in continentalEurope is primarily due to an under-securitizedGerman listed property market. Germany is thelargest real estate market in continental Europe, but real estate is predominantly owned by Germancorporations and open-end property funds, ratherthan by listed property companies. This securitiza-tion level may increase substantially if the Germangovernment successfully introduces a tax-efficientREIT structure and provides tax incentives both for open-end funds to convert to REITs and forcorporations to sell their assets to REITs for shares.In the United Kingdom, the long-awaited intro-duction of a tax-efficient REIT structure shouldresult in a higher level of securitization, as realestate owners would be able to access tax-efficientliquidity through the U.K. REIT market ratherthan through property funds registered in the tax-efficient U.K. offshore real estate markets.
In Asia ex-Australia, the securitization of real estatehas increased significantly in recent years, primarilydue to the rapid development of REIT markets inthis region. There continues to be proactive regula-tory changes to promote the further growth of thelisted property sector. There is also a trend towardthe privatization of government-owned assets andcorporate restructurings involving the disposition of real estate assets, which should fuel the externalgrowth prospects of the listed property sector.
At the other end of the spectrum, over 50% of theAustralian physical real estate market is securitized,as real estate securities have long been accepted as a distinct asset class by Australian institutionalinvestors; in fact, the listed property sector makesup approximately 10% of its broader equity market. While the securitization of real estate inAustralia is not likely to increase substantially goingforward, we believe this high level of securitizationdemonstrates the market growth potential for theglobal listed property markets. As a result, we are optimistic with our expectations for continuedgrowth of the investable universe of global realestate securities.
Volume 1, Issue 2 Investment Management Journal • 25
to the very strong demand from domestic yield-oriented investors given Japan’s very low bondyields. More recently, the beginning of a long-awaited property market recovery has fueled thegrowth of the sector. In Singapore, there are sevenS-REITs at present, and the market capitalizationhas increased from US$260 million in 2002 toUS$7 billion as of September 2005. The rapidgrowth of the S-REIT market has been supportedby favorable government measures, including taxexemption on S-REIT distributions to individuals,the reduction of the withholding tax rate on S-REIT distributions from 20% to 10% for a five-year period, the waiver of stamp tax dutieson properties transferred into S-REITs for a five-year period and the recent increase in theleverage limit from 30% to 60% of total assets.
Despite the significant growth of the REIT markets in Japan and Singapore, however, the listed property market continues to be dominatedby REOCs.11 This is actually unsurprising given the REITs in these markets are externally managedand are therefore limited to the ownership of realestate properties. In contrast, REOCs are internally managed, are often the external managers for theseREITs, and tend to sell their more mature, stabi-lized assets into these REITs to generate proceedsto pursue higher-return opportunities. As a result,the organic growth prospects for the internallymanaged REOCs are generally far superior to that of the externally managed REITs.
The market capitalization of the Hong Kong listed property sector totaled US$43 billion as of September 2005.12 Despite enacting REIT legis-lation in 2003, however, there are currently no listed REITs due to the structure’s previously overlyrestrictive limitations on geography and leverage. Infact, the sponsor of Fortune REIT, a Hong Kongbased company that owns assets in Hong Kong,opted to list this retail REIT in Singapore ratherthan in Hong Kong due to its relatively more flexi-ble guidelines. Subsequently, in an effort to make
Developed listed property markets that offer tax-efficient structures. The first category is developed listed property markets that offer tax-efficient structures with internally managedproperty companies. This category includes thethree most established public REIT markets atpresent: the U.S. REIT market, the Australian LPT market and the Dutch BI market. The listedproperty companies within each of these marketsare internally managed, which means they are not solely ownership vehicles that pay management fees to third-party entities. Rather, these companieshave internal management teams in place to create value through internal and external growthopportunities. It is noteworthy that prior to 2004, the Australian LPTs were predominantlyexternally managed companies; however, LPTs have recently shifted towards an internally man-aged structure similar to the U.S. REIT model,whereby the externally managed trust and theexternal management entity have merged to forman internally managed trust.
Developed listed property markets that have recently introduced externally managed tax-efficient structures. The second category is developed listed property markets that haverecently introduced tax-efficient structures withexternally managed property companies, but arestill dominated by the traditional non-REIT listedproperty companies (i.e., real estate operating com-panies, or REOCs). This category includes Japan, which introduced the Japanese REIT (J-REIT) structure in 2001; Singapore, which introduced the Singapore REIT (S-REIT) structure in 2002; and Hong Kong, which introduced theHong Kong REIT (H-REIT) structure in 2003.
The market capitalization of the REIT sectors inboth Japan and Singapore has grown very rapidlysince their introduction. At present, there are 23 J-REITs in the sector, and the market capitaliza-tion has increased from US$260 million in 2001 to US$23 billion as of September 2005. The success of the J-REIT market may be attributed
26 • Investment Management Journal Fall 2005
FIG 12: SUMMARY OF GLOBAL LISTED PROPERTY MARKETSAs of September 30, 2005
FTSE EPRA/NAREIT Index REIT legislation
Market cap Number of Number of and Country (US$, bn)* securities* Status Structure market cap of REITs**
North America
United States 298.7 126 Enacted 1960 REIT 152 REITs (excluding mortgage REITs) (US$300.6 bn)
Canada 20.8 18 Enacted 1993 REIT 25 REITs (US$17.2 bn)
Europe
Netherlands 16.5 8 Enacted 1969 Dutch BI (Fiscal Investment 7 Dutch BIsInstitution) (US$17.5 bn)
Belgium 2.9 5 Enacted 1995 SICAFI (Societe d’Investissement 10 SICAFIsa Capital Fixe) (US$4.8 bn)
France 12.2 6 Enacted 2003 SIIC (Societe d’Investissement 10 SIICsImmobiliers Cotees) (US$17.1 bn)
United Kingdom 53.9 37 Pending – –
Germany 3.6 3 Pending – –
Finland 1.2 3 Pending – –
Sweden 5.7 6 – – –
Spain 8.2 2 – – –
Italy 2.7 4 – – –
Switzerland 3.7 4 – – –
Austria 5.9 4 – – –
Asia-Pacific
Australia 66.7 24 Enacted 1971 LPT 24 LPTs(Listed Property Trust) (US$66.1 bn)
Japan 53.6 20 Enacted 2001 J-REIT 23 REITs(US$22.9 bn)
Singapore 8.7 9 Enacted 2002 S-REIT 7 REITs(US$6.5 bn)
Hong Kong 42.6 12 Enacted 2003 H-REIT –
*Based on FTSE EPRA/NAREIT Global Real Estate Index**Represents total market capitalization and total number of REITs in the country; not all REITs included in the FTSE EPRA/NAREIT Global Real Estate Index
Source: Morgan Stanley Investment Management
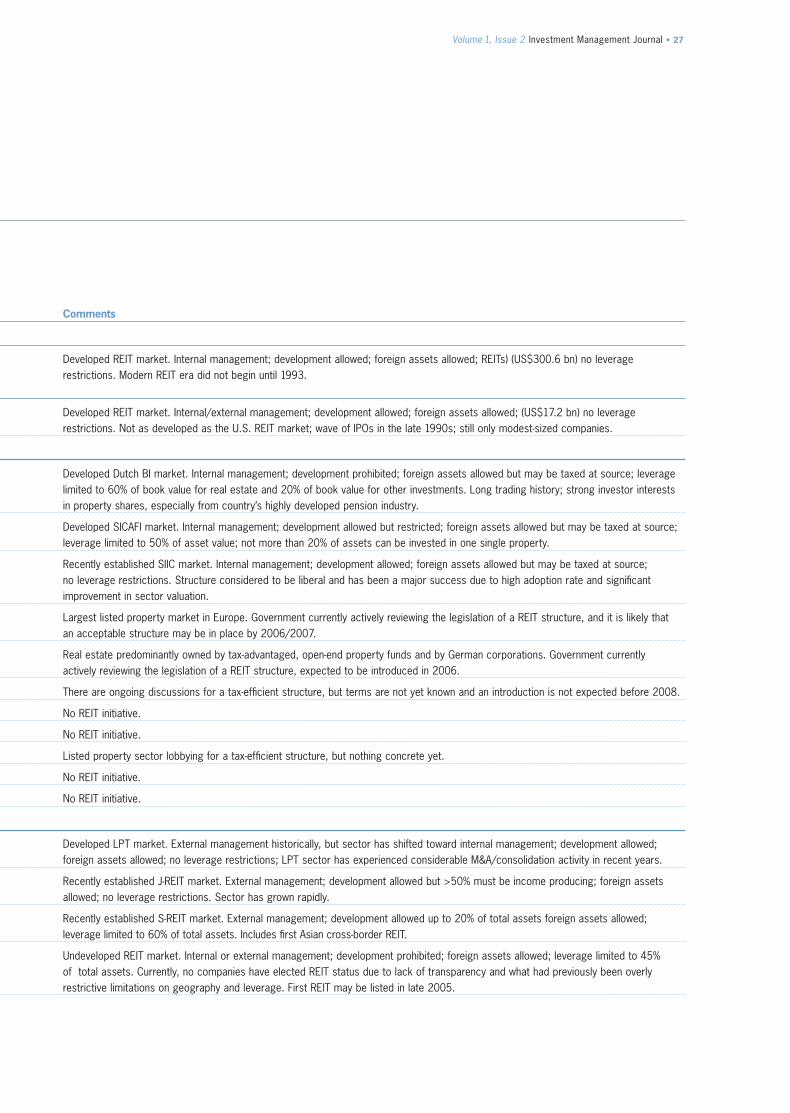
Volume 1, Issue 2 Investment Management Journal • 27
Comments
Developed REIT market. Internal management; development allowed; foreign assets allowed; REITs) (US$300.6 bn) no leverage restrictions. Modern REIT era did not begin until 1993.
Developed REIT market. Internal/external management; development allowed; foreign assets allowed; (US$17.2 bn) no leverage restrictions. Not as developed as the U.S. REIT market; wave of IPOs in the late 1990s; still only modest-sized companies.
Developed Dutch BI market. Internal management; development prohibited; foreign assets allowed but may be taxed at source; leveragelimited to 60% of book value for real estate and 20% of book value for other investments. Long trading history; strong investor interestsin property shares, especially from country’s highly developed pension industry.
Developed SICAFI market. Internal management; development allowed but restricted; foreign assets allowed but may be taxed at source; leverage limited to 50% of asset value; not more than 20% of assets can be invested in one single property.
Recently established SIIC market. Internal management; development allowed; foreign assets allowed but may be taxed at source; no leverage restrictions. Structure considered to be liberal and has been a major success due to high adoption rate and significant improvement in sector valuation.
Largest listed property market in Europe. Government currently actively reviewing the legislation of a REIT structure, and it is likely that an acceptable structure may be in place by 2006/2007.
Real estate predominantly owned by tax-advantaged, open-end property funds and by German corporations. Government currently actively reviewing the legislation of a REIT structure, expected to be introduced in 2006.
There are ongoing discussions for a tax-efficient structure, but terms are not yet known and an introduction is not expected before 2008.
No REIT initiative.
No REIT initiative.
Listed property sector lobbying for a tax-efficient structure, but nothing concrete yet.
No REIT initiative.
No REIT initiative.
Developed LPT market. External management historically, but sector has shifted toward internal management; development allowed;foreign assets allowed; no leverage restrictions; LPT sector has experienced considerable M&A/consolidation activity in recent years.
Recently established J-REIT market. External management; development allowed but >50% must be income producing; foreign assetsallowed; no leverage restrictions. Sector has grown rapidly.
Recently established S-REIT market. External management; development allowed up to 20% of total assets foreign assets allowed;leverage limited to 60% of total assets. Includes first Asian cross-border REIT.
Undeveloped REIT market. Internal or external management; development prohibited; foreign assets allowed; leverage limited to 45% of total assets. Currently, no companies have elected REIT status due to lack of transparency and what had previously been overly restrictive limitations on geography and leverage. First REIT may be listed in late 2005.
28 • Investment Management Journal Fall 2005
REIT markets mature, the primary valuation metric will shift from dividend yield spread toP/NAV, which is the primary metric for real estatesecurities in most established real estate markets.
Developed listed property markets that have recently introduced internally managed tax-efficient structures. The third category is developed listed property markets that haverecently introduced tax-efficient structures withinternally managed property companies. To date,the key market in this category includes onlyFrance, which enacted its REIT structure—Societes d’Investissements Immobiliers Cotees(SIIC)—in 2003 to promote foreign investment in its listed property companies. The tax-efficientSIIC structure is considered to be liberal in terms of its guidelines and restrictions, and itsintroduction has been a major success in terms of being well received by both listed property companies and investors. All of the major listedproperty companies have adopted this structure,and the valuation of the sector has improved significantly from a perpetual historical average discount to reported NAV, to an approximate 35% premium as of September 2005. The growthof the SIIC sector continues to be supported byfavorable government measures, including the newtax regime for capital gains tax (CGT) approved bythe French Senate in January 2005. Temporarilyuntil 2007, property asset acquisitions paid for inshares by SIICs will result in CGT for the seller at a 16.5% rate payable in four annual installments,instead of the normal 34% CGT rate. SIICs willtherefore have an important competitive edge topay for assets with their shares, which should leadto further growth of the sector. The French listedproperty market is very similar to the markets inthe first category and should be classified withthose markets once the SIIC sector becomes more established.
its REIT structure more competitive, Hong Kongmodified its legislation in early 2005 to allow REITsto invest in properties outside of Hong Kong andutilize higher levels of leverage. Hong Kong maysee its first listed REIT in late 2005 if the HongKong Housing Authority proceeds with its highlyanticipated initial public offering of The LinkREIT. With an expected market capitalization ofmore than US$3 billion, The Link REIT wouldbecome the largest REIT in Asia ex-Australia.
It is interesting to note that the majority ofinvestors in these recently established REITs tend to be yield-focused, and a key valuation metric forthese REIT investors is the dividend yield spread tobenchmark interest rates implied by the prevailingshare price. As a result, this investor base may have contributed to the higher recent correlation of these REIT markets to interest rates; however, we believe this impact will be short term in nature.After all, historical data suggests that real estatesecurities may trade in a similar fashion to particu-lar segments of the market for some period of time,but not for the medium or long term, whereby realestate securities have traded as a separate assetclass—as real estate. Given the low correlationbetween bonds and real estate securities over themedium and long term, an investor’s effectivenessin investing based on the dividend yield spread to benchmark interest rates tends to be limited to a short-term period.
The more rigorous, enduring valuation metric for dedicated, longer-term investors tends to be a comparison of share price to the net asset value(NAV) of the property companies, or underlyingvalue of the property companies’ assets (P/NAV).This seems logical given the high correlationbetween the performance of real estate securitiesand private real estate values over the medium andlong term. This, in turn, should ultimately validatethe long-term correlation between the performanceof real estate securities and private real estate values. We believe that as these recently introduced
Volume 1, Issue 2 Investment Management Journal • 29
through the U.K. REIT market rather than throughexternally managed property funds registered in the tax-efficient U.K. offshore real estate markets(specifically, the British Channel Islands). As aresult, the U.K. listed property sector may experi-ence a significant increase in investment by thosewho currently invest in the growing number of tax-efficient offshore funds, thereby actually increasingthe overall tax revenues for the government.
Under the second alternative, the Internal Trustmodel, the real estate assets would be held in atrust structure with a separate management entityattached to it, and the real estate rental incomestream would be characterized and taxed as rentsrather than as dividends, thus avoiding any issue of dividend withholding tax leakage.
Under both alternatives, it is anticipated that inter-nal or external management, development activityand overseas investments would all be allowed inorder to encourage maximum participation in theU.K. REIT market. Nevertheless, once a feasiblestructure is determined, a key factor for the successand growth of the U.K. REIT market is the conversion charge imposed on listed property companies that choose to adopt the structure orcapital gains tax imposed on real estate owners selling assets into the structure. Obviously, anunimposing conversion tax charge and the provi-sion of various tax incentives to encourage the saleof real estate assets to REITs, as provided in bothFrance and Singapore, should promote the success of the U.K. REIT market. The introduction of a tax-efficient structure in the United Kingdom isparticularly significant because the U.K. listedproperty sector currently makes up approximately46% of the FTSE EPRA European Real EstateIndex and 9% of the FTSE EPRA/NAREITGlobal Real Estate Index.
Of note, over the last year, there have been two major takeovers of French SIICs by Spanish property companies, both prompted in part by the unforeseen tax loophole of the new SIIC legisla-tion, whereby the French government is unable to collect dividend withholding taxes from theseSpanish property companies as a result of with-holding tax treaties between these countries. This unanticipated side effect has caused both the United Kingdom and Germany—as describedbelow within the fourth and fifth categories of listed property markets, respectively—to postpone theintroduction of their REIT legislations to 2006 or2007 as they evaluate various alternative structuresto prevent the loss of dividend tax revenues.
Developed listed property markets that do not yet offer tax-efficient structures. The U.K. is the key market in the fourth category, which isdeveloped listed property markets with internallymanaged property companies that do not yet offertax-efficient structures. The U.K. government hasbeen reviewing the legislation of a tax-efficientREIT structure for several years; although it washighly anticipated that a structure would be intro-duced by 2005, the aforementioned potential taxshortcoming has resulted in a postponement untillate 2006 or early 2007.
The property industry has presented two structuralalternatives to the treasury: the Tax ExemptCompany model and the Internal Trust model.The Tax Exempt Company model would be in line with other REIT markets globally, wherebyreal estate rental income streams are exempt from taxation at the corporate level and taxed at theinvestor level when distributed in the form of dividends. Although this structure does not directlyresolve the withholding tax leakage issue, the property industry argues that this structure wouldresult in relatively little, if any, reduction in overalltax revenues. The rationale is that the introductionof the Tax Exempt REIT structure will enable real estate owners to access tax-efficient liquidity

30 • Investment Management Journal Fall 2005
Undeveloped listed property markets that do not yet offer tax-efficient structures. Germany is the key market in the fifth category, which isundeveloped listed property markets that do not yet offer tax-efficient structures. Similar to theUnited Kingdom, the German government hasbeen evaluating the introduction of a tax-efficientREIT structure, but has postponed its decision inlight of the potential loss of dividend withholdingtaxes. Nevertheless, the market continues to antici-pate the introduction of a tax-efficient REIT structure by 2006.
Two models are currently under consideration: the Segregated model and the Unified model. TheSegregated model is similar to the Internal Trustmodel in the United Kingdom, whereby real estateassets are held in a trust vehicle with a managemententity stapled to it, and income would be distrib-uted in the form of rents and not as dividends.Under the Unified model, REIT legislation wouldprovide for a directly enforceable distribution claimby the German REIT shareholders, which wouldtechnically classify this distribution as a “tax deduc-tion” for the trust, and not as a dividend payout.All German REIT shareholders—both foreign anddomestic—would then have to pay taxes on thesedistributions, as they are not classified as dividendincome and therefore are not subject to inter-national dividend withholding tax treaties.
The introduction of a REIT structure in Germany would be a significant development, as the country represents the largest real estate market in continental Europe in terms of physical institutional-grade real estate value, but currently represents only 3% of the FTSE EPRA EuropeanReal Estate Index and less than 1% of the FTSEEPRA/NAREIT Global Real Estate Index.Institutional-quality real estate is predominantlyowned by German corporations, with the majorcompanies owning more than US$145 billion of real estate on their balance sheets, and tax-advantaged, open-end property funds, whichtotaled US$108 billion as of September 2005.
The introduction of a REIT structure is antici-pated to be well-received by German investors whoare already accustomed to investing in real estatethrough open-end property funds. Moreover, giventhe corruption scandals that erupted in the secondhalf of 2004 regarding the externally managedopen-end property funds, German investors arelikely to welcome an internally managed REITstructure that provides better corporate governance,transparency, liquidity, and total return prospects,albeit with a higher level of volatility than open-end property funds. Nevertheless, significant factors that will impact the success of the GermanREIT market once a structure is introducedinclude the charge imposed on open-end propertyfunds converting to a REIT structure and the provision of tax incentives to encourage the sale of real estate assets to REITs, as well as the tax benefits to German investors.
REAL ESTATE INVESTMENT OPTIONS
Over the past decade, institutional investors havegradually increased their exposure to real estatewithin their multi-asset class portfolios, as the sec-tor has increasingly gained acceptance as a distinctasset class with compelling historical return anddiversification attributes. This exposure has prima-rily been achieved through direct investments indomestic properties, generally through an advisorfor a commingled or separate account; investmentshave also been made in domestic listed propertycompanies, as well as domestic opportunistic prop-erty funds. Despite increasing their exposure todomestic real estate, however, only a small subsetof institutional investors has incorporated interna-tional exposure within their overall real estate allocation, predominantly through investments in international opportunistic property funds.

Volume 1, Issue 2 Investment Management Journal • 31
securities. Moreover, by investing through realestate securities, investors may benefit from the various advantages and efficiencies of investingthrough the listed property markets.
It is also worth mentioning that until recently, it has been difficult to achieve core-type real estatereturns through direct real estate investments in certain regions of the world, namely Asia, asmost direct investment opportunities have beenopportunistic in nature. In recent months, severaldirect real estate funds targeting core-type returnsfrom Asian property investments have beenlaunched. Nevertheless, the availability of suchinvestment vehicles continues to be somewhat limited, and we believe the listed property sectorcontinues to be the simplest and most effectiveapproach to achieving core-type real estate returnswithin this region.
We believe the global real estate market has evolvedsubstantially in recent years such that institutionalinvestors should implement a strategic allocation to global real estate within their multi-asset classportfolios in order to potentially achieve higherrisk-adjusted returns. After all, institutionalinvestors have long recognized the value in expand-ing their stock and bond exposure to internationalmarkets. We believe this approach should beapplied in a parallel fashion for investing in inter-national real estate markets.
Given the various real estate investment optionsavailable, comparing investment vehicles by expected return and risk, as shown in Figure 13,can be useful. From a risk/return perspective,investments in global listed property companies are placed above domestic listed property compa-nies, offering higher returns with modestly highervolatility versus domestic listed property compa-nies, but significantly enhanced diversification benefits, as highlighted in this article. Hence, webelieve institutional investors seeking core-type real estate returns should implement at least some portion of this strategic allocation to global realestate through the use of global real estate
Expected volatility
Expe
cted
retu
rns
Core (Direct)
Core+/Value-added (Direct)
Domestic Listed Property Companies (REITs / REOCs)
Global Listed Property Companies
Opportunistic—Domestic (Direct)
Opportunistic—International (Direct)
FIG 13: REAL ESTATE INVESTMENT IMPLEMENTATION OPTIONS
Source: Morgan Stanley Investment Management

32 • Investment Management Journal Fall 2005
REAL ESTATE SECURITIES OFFER EFFICIENCIESAND SUPERIOR LIQUIDITY
Investing in global real estate securities is the mostefficient means of achieving diversified, core realestate exposure to various international marketsand sectors. As demonstrated earlier, over the medium and long term, real estate securities provide returns comparable to direct real estatereturns. However, whereas direct real estate invest-ments are generally capital-intensive and illiquid,an investment in real estate securities requires aminimal nominal investment to achieve diversifiedexposure, involves lower administrative and trans-action costs, and provides much better liquidity.Moreover, the liquidity generally afforded by real estate securities enables investors to tacticallyincrease or decrease allocations to real estate segments at different phases of the real estate cyclein a cost-effective and timely manner. As a result,through active portfolio management, investorsmay enhance portfolio returns by taking advantageof differences in relative valuation between different real estate sectors and markets. Additional efficiencies provided by real estate securities includeaccess to diversified, professionally managed, largereal estate portfolios and the potential to benefitfrom economies of scale and local market knowl-edge, which may be invaluable in certain sectors.
ADDRESSING RECENT INVESTOR CONCERNS
While we believe investors should make a strategicallocation to global real estate securities, someinvestors have expressed reservations. We address a few of these below.
Higher volatility versus direct real estate. Despiteproviding returns similar to private real estate, onekey concern of institutional investors is that realestate securities provide those returns with a higherdegree of volatility. We note the following threepoints regarding this concern. First, private realestate volatility tends to be artificially depressedsince the valuations are appraisal-based and aremeasured infrequently, typically only on a quar-terly or annual basis. Second, while the volatility is still higher even with an appropriate adjustmentfor the former point, the higher volatility associ-ated with real estate securities may be viewed as thecost of superior liquidity as compared to direct realestate investments. Investors with a strategic alloca-tion to both direct and indirect real estate will have greater flexibility for profit-taking, portfolio rebalancing, and tactical and strategic allocationsthrough their indirect real estate allocation. Thisasset allocation flexibility, in turn, may contributeto the higher level of volatility for real estate securi-ties. Third, the liquidity of real estate securities alsoattracts a constituency of non-dedicated investorswho invest in real estate on a tactical basis; this istypically due to reasons such as the sector’s strongrecent performance or the increased inclusion of listed property companies in broader equity market indices (such as the S&P 500 Index, which currently includes nine REITs,13 two of whichwere added this year). While these allocations from non-dedicated investors have contributed to theimproved liquidity of the listed property sector, it has inevitably added to the volatility of the sector as well.

Volume 1, Issue 2 Investment Management Journal • 33
Recent outsized performance. It may be worthnoting that although the global listed property sector has outperformed the broader equity markets in recent years, over the medium and longterm, real estate securities should be expected tooutperform bonds but not the broader equity mar-kets. We believe the recent outsized performancemay reflect a secular shift in valuations for realestate, as the sector has gained acceptance as a distinct asset class and benefited from increasedstrategic (as opposed to tactical) allocations byinstitutional investors based on a careful study of the benefits of making an allocation to realestate. As a result, we believe the sector need notexperience declines to revert to mean historicalreturns, and the investment universe should continue to offer attractive risk-adjusted returnsand experience significant growth in market capitalization as the level of real estate securitiza-tion increases going forward.
CONCLUSION: RECOMMENDING A STRATEGICALLOCATION TO GLOBAL REAL ESTATE SECURITIES
Given the benefits of investing in real estate on a global basis, as well as the significant growthpotential of the global listed property markets, webelieve investors should make a strategic allocationto global real estate securities within their multi-asset class portfolios. The approximately US$600billion global real estate securities market providesinvestors with a significant investment universe toachieve diversified exposure to real estate propertieson a global basis. With the current global invest-ment universe of REITs and REOCs representingless than 15% of the global investable universe of physical institutional-grade real estate, the invest-ment universe is poised to continue to allow for
Recent correlation to interest rates. Another concern raised by institutional investors is that realestate has very recently exhibited a higher level of correlation to interest rates than it has historically.This has led investors to question whether its inclusion can truly provide significant diversifica-tion benefits to a multi-asset class portfolio. We maintain that while real estate valuations maydemonstrate some relationship to interest ratemovements in the short term, over the mediumand long term, the performance of real estate securities will be most highly correlated to changes in underlying real estate asset valuations, as shown previously in Figures 4 and 5 on page 18.
The higher level of correlation evidenced recentlymay be attributed largely to the fact that the sectorhas gained increased acceptance as a distinct assetclass. While this is clearly a positive in terms ofimproved liquidity and growth for the sector, theimplication going forward is that real estate willlikely continue to demonstrate a more meaningfulrelationship to the risk-free rate14 than it has histor-ically. This should not be surprising, as expectedreturns for all established asset classes should besomewhat influenced by changes in the risk-freerate. Despite this recent higher level of correlation tointerest rates, however, we believe it is important to keep in mind that unlike bonds, which in mostcases have predetermined coupon payments that donot adjust to changes in economic conditions, realestate assets have dynamic cash flows, which canimprove or deteriorate based on changes in eco-nomic conditions, albeit with a lag. Hence, to the extent interest rates increase due to improve-ments in the economy, real estate cash flows mayimprove commensurately from the resulting posi-tive impact on real estate fundamentals, which mayoffset the potential declines in capital values fromhigher interest rates.

34 • Investment Management Journal Fall 2005
1 In this article, investing in global real estate refers to investing in all three majorregions of the world: North America, Europe and Asia. Hence, for U.S. investorsalready invested in domestic real estate, this means expanding their real estateallocation to include Europe and Asia; for investors not already invested in realestate, this means initiating a real estate allocation to include North America,Europe and Asia.
2 The correlation between the U.K. listed property market (as represented by the GPR U.K. Index) and U.K. private real estate market (as represented by the IPD U.K.Property Index) is used as a proxy for Europe since historical data for the overallEuropean private real estate market is not available. We believe the U.K. marketmay be used as an acceptable proxy since it makes up nearly 50% of the Europeanlisted property market and is the most established real estate market in Europe.
3 Comparable exhibits for Asia are not provided in this article, as historical data forthe Asian bond markets and private real estate markets are not readily available In Asia, the correlation between the listed property markets and equity markets is higher than in the United States and Europe, as real estate securities make up a larger percentage of the Asian equity markets. However, similar to the UnitedStates and Europe, we believe this correlation will decline over time as the Asianlisted property markets continue to develop.
4 Australia is generally classified as part of the Asian region. However, for certainanalyses, Asia is divided between Asia ex-Australia and Australia due to material differences in historical risk and return results, as well as meaningful differences in market characteristics, as the Australian LPT sector is a firmly established listedproperty market, whereas the Asian listed property markets are developing.
5 It is generally accepted that the modern REIT era in the United States began in 1993 when the number of companies in the U.S. REIT sector grew to 135 from 89 in 1992 and the market capitalization of the sector more than doubled to $26.1 billion from $11.1 billion in 1992. (Source: NAREIT)
6 The FTSE EPRA/NAREIT Global Real Estate Index consists of the largest and most heavily traded real estate securities in Asia, Europe and North America. As of September 30, 2005, there were a total of 296 securities in the index. A comparison of the various global benchmark indices is provided in Figure 10.
7 “Institutional-grade real estate” is defined as real estate of sufficient quality andsector to be held for investment purposes by institutional investors.
8 The term “securitized” refers to the percentage of real estate held by listed property companies.
9 In this article, tax-efficient real estate investment vehicles will be generally referredto as REITs (as termed in the United States), even though different countries usealternative names to denote these vehicles and the characteristics of these structures may vary from country to country.
10 In this article, “developed” real estate markets refer to markets where an investormay create a diversified real estate portfolio by buying securities in listed propertycompanies within that market.
11 Market capitalization based on constituents in the FTSE EPRA/NAREIT Global RealEstate Index. Market capitalization of all REOCs in Japan, Singapore and Hong Kong(including those REOCs that do not meet the inclusion criteria of the FTSEEPRA/NAREIT Global Real Estate Index) totaled approximately US$105 billion,US$20 billion and US$135 billion, respectively.
12 Ibid.
13 The nine REITs included in the S&P 500 Index are: Equity Office (in 2001), EquityResidential (2001), Plum Creek Timber (2002), Simon Property (2002), AIMCO(2003), ProLogis (2003), Archstone-Smith (2004), Vornado (2005) and PublicStorage (2005).
14 The “risk-free rate” generally refers to the yield on each country’s respective long-term government bond.
significant growth in market capitalization goingforward. Global real estate securities may provideinvestors with attractive risk-adjusted returns andthe potential to enhance portfolio diversificationdue to its low correlation to other asset classes.Moreover, as real estate is a highly localized businesswith low correlations among different regions,investing on a global basis enables investors to further improve the diversification benefits of theiroverall real estate allocation. Investors may alsoenhance these returns through active portfoliomanagement by tactically overweighting real estatesegments and stocks with the strongest propertyfundamentals and most attractive relative valuations.
We have already witnessed an increased willingnessby institutional investors to make a strategic allocation to global real estate securities based on a careful analysis of the enhancements afforded byits inclusion within a multi-asset class portfolio,and expect this to continue as the global real estatemarket continues to evolve and gain acceptance as a distinct asset class.

Countdown conundrum
Joseph McAlinden, CFAManaging DirectorMorgan Stanley Investment Management
Warren Hatch, Ph.D., CFAVice PresidentMorgan Stanley Investment Management
The world’s greatest central banker is rarely trumped by the economic data. In 2005, however, it happened three times.
First it was the bond market. In a keynote address to Congress early in the year,Federal Reserve Chairman Alan Greenspan questioned the wisdom of the bond markets, labeling the persistence of low long-term interest rates a “conundrum” and a “short-term aberration.”1 Three months later, long-term interest rates were essen-tially unchanged. Oil was next. In the spring, during a lengthy discourse to theEconomic Club of New York about the mechanics of the petroleum futures marketsand the virtues of alternative fuels, Greenspan made the case for a cap in long-termoil prices. Two months later, oil futures were up $20 and making new highs. Finally,Greenspan took on housing. In his autumn swan song at the annual gathering ofcentral bankers in Jackson Hole, Wyoming, Greenspan commented on the froth hesaw developing in residential real estate and hinted darkly that national home prices
PG.35

36 • Investment Management Journal Fall 2005
The U.S. Federal Reserve began raising short-termrates in June 2004 off a multi-decade low of 1.0%.At the time, long-term interest rates were muchhigher, at 4.8%, resulting in a steep yield curvethat pointed to solid economic growth ahead. As the Fed continued tightening, most observersexpected long-term interest rates to move higher,too; instead, rates actually declined, reaching a low of 3.9% and generally remaining in a relativelytight range of 4.0% to 4.5% thereafter. The Fed’smeasured, 25-basis-point-per-meeting pace of policy tightening would put the federal funds rateat 4.5% by early 2006; if long-term rates fail tobreak out of their recent range, the yield curvecould conceivably invert.
The behavior of the yield curve appears to be outof step with the current stage of the business cycle.As the cycle matures, the Fed can be expected totighten more aggressively. At this stage of the cur-rent cycle, however, the monetary authorities aremerely trying to find a “neutral” level of interestrates—that is, one that supports economic growthwithout overstimulating and causing inflationarypressures. Instead of inverting, the yield curveshould be sloping gently upward at this point, consistent with strong economic growth.
Some experts argue that rates have been held down by permanently lower inflation expectations.Others suggest that underfunded corporate pension plans are to blame. Another camp faultsthe Fed chair himself: the “Greenspan put” keepslong-term interest rates low because the bond market knows the Fed will act promptly to cutrates if the economy seriously weakens. All of those ideas are probably part of the answer. In his“conundrum” speech, Greenspan went throughseveral of the alternative hypotheses, all of whichwere “credible to one degree or extent” to accountfor the depressed term premium. But since theinterest-rate disconnect is global in nature, not justaffecting the United States, a significant part of thecause is probably global, too. Long-term rates havebeen low in most countries around the world,whether their central banks were tightening short
could decline for the first time since the Depression.The very next month, new building permits hit a30-year high. Little heed, it would seem, was beingpaid to Greenspan’s concerns about “growing market exuberance.”
Greenspan last warned of “irrational exuberance” in a 1996 speech about the equity markets. He was eventually proved correct—four years later,when stocks peaked in early 2000. While it mightnot take quite that long this time, we too havebeen perplexed by the persistence of low long-terminterest rates, high oil prices and the red-hot housing market, particularly in light of the economy’s remarkable stability through these crosscurrents. But as the business cycle matures, thereare signs that bonds, oil and housing could be atmajor inflection points. After casting a critical eyeon each of these conundrums (and liberally expanding on Greenspan’s original use of the term),we explore how their return to equilibrium willpresent new challenges to the economy—and to Greenspan’s pending successor as Fed chair,Benjamin Bernanke. We conclude with observa-tions about the new opportunities that a reversionto the mean can present for other asset classes, particularly U.S. common stocks.
BOND BUGABOO
Normally, the yield curve—the difference betweenshort- and long-term interest rates—is a timelygauge of the economy’s health. Early in a businesscycle, the curve tends to be relatively steep, as thecentral bank keeps short-term interest rates lowand long-term rates begin to rise in anticipation of economic recovery. Mid-cycle, as the economy is humming along, the curve typically slopes gently upward. Toward the end of a business cycle,a flattening—and eventually inverted—yield curveis typical: While interest rates are rising at all maturities, the central bank is aggressively raisingshort-term rates even faster in an effort to cool anoverheating economy. At that point, saving tendsto go up, spending goes down and economicgrowth contracts. After inflationary pressures havebeen wrung from the economy, the central bankbegins easing rates and the cycle begins anew.
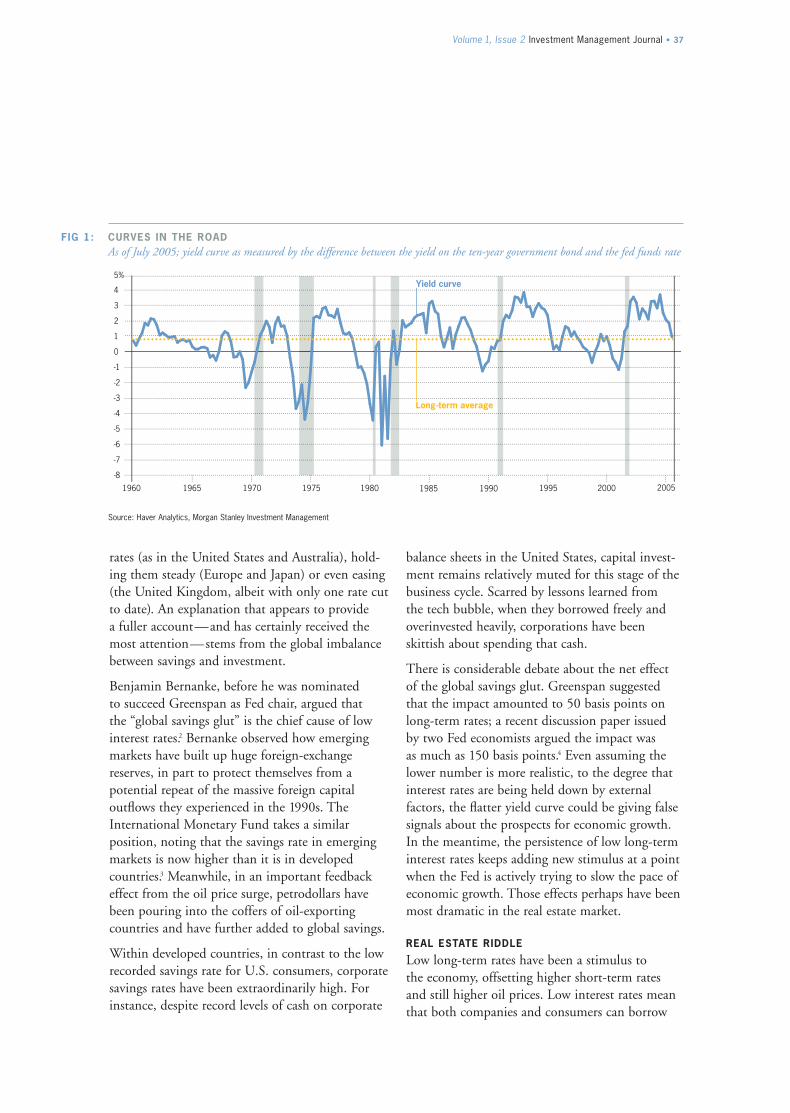
Volume 1, Issue 2 Investment Management Journal • 37
Source: Haver Analytics, Morgan Stanley Investment Management
2005200019951990198519801975197019651960
-8
-7
-6
-5
-4
-3
-2
-1
0
1
2
3
4
5%Yield curve
Long-term average
FIG 1: CURVES IN THE ROADAs of July 2005; yield curve as measured by the difference between the yield on the ten-year government bond and the fed funds rate
balance sheets in the United States, capital invest-ment remains relatively muted for this stage of thebusiness cycle. Scarred by lessons learned from the tech bubble, when they borrowed freely andoverinvested heavily, corporations have been skittish about spending that cash.
There is considerable debate about the net effect of the global savings glut. Greenspan suggestedthat the impact amounted to 50 basis points onlong-term rates; a recent discussion paper issued by two Fed economists argued the impact was as much as 150 basis points.4 Even assuming thelower number is more realistic, to the degree thatinterest rates are being held down by external factors, the flatter yield curve could be giving falsesignals about the prospects for economic growth.In the meantime, the persistence of low long-terminterest rates keeps adding new stimulus at a pointwhen the Fed is actively trying to slow the pace ofeconomic growth. Those effects perhaps have beenmost dramatic in the real estate market.
REAL ESTATE RIDDLE
Low long-term rates have been a stimulus to the economy, offsetting higher short-term rates and still higher oil prices. Low interest rates mean that both companies and consumers can borrow
rates (as in the United States and Australia), hold-ing them steady (Europe and Japan) or even easing (the United Kingdom, albeit with only one rate cut to date). An explanation that appears to provide a fuller account—and has certainly received themost attention—stems from the global imbalancebetween savings and investment.
Benjamin Bernanke, before he was nominated to succeed Greenspan as Fed chair, argued that the “global savings glut” is the chief cause of low interest rates.2 Bernanke observed how emergingmarkets have built up huge foreign-exchangereserves, in part to protect themselves from apotential repeat of the massive foreign capital outflows they experienced in the 1990s. TheInternational Monetary Fund takes a similar position, noting that the savings rate in emergingmarkets is now higher than it is in developed countries.3 Meanwhile, in an important feedbackeffect from the oil price surge, petrodollars havebeen pouring into the coffers of oil-exportingcountries and have further added to global savings.
Within developed countries, in contrast to the lowrecorded savings rate for U.S. consumers, corporatesavings rates have been extraordinarily high. Forinstance, despite record levels of cash on corporate

38 • Investment Management Journal Fall 2005
Source: Haver Analytics, Morgan Stanley Investment Management
stock market bubble—now believes housing is a bubble and argues that overleveraged U.S.homeowners are vulnerable to a sharp downturn in home prices of as much as 50%.7 The Economistdubbed the worldwide rise in house prices “thebiggest bubble in history.”8 Many observers citeJapan’s property boom and bust of the 1980s andearly 1990s as a cautionary tale. Land prices inTokyo declined for 15 straight years before postingtheir first annual gain in 2005. The recent experi-ence of both the United Kingdom and Australia is also sobering: Their economies softened drama-tically after housing fever began to cool.
However, these recent examples in foreign markets provide inadequate comparisons with theUnited States. Real estate prices in Australia andthe United Kingdom, for example, soared far higher over comparable time spans—by a factor of two in the case of the United Kingdom—than they have in the United States. In addition,variable-rate mortgages are the norm in thosecountries, making their consumers far more sensitive to interest-rate changes. While adjustable-rate mortgages have increased in popularity in theUnited States, they still account for only about a fifth of all outstanding mortgages.
cheaply. The effect is perhaps most dramatic forAmerica’s homeowners, as low interest rates havekept down the cost of buying and owning homes.Home sales are at record highs, and more Americansown their homes than ever before. Furthermore,home prices have soared over the past decade,while inventories remain at multi-decade lows.Many households have taken advantage of risingprices and lower rates to extract equity from theirhomes. A recent Fed paper co-authored byGreenspan himself (only his second paper duringhis tenure as Fed chair) put the total amount ofequity extraction at nearly $800 billion in 2004, or about 10% of disposable personal income.5
All told, housing construction and residential consumption have been important offsets to theweakness in investment, helping to keep the economy growing briskly.
Some experts look at the data and see little evidence of a bubble; for example, one Fed studyargues that housing prices have been fully justifiedby the fundamentals.6 Other pundits see the samedata as a proof of a bubble and warn of the direimpact it will have on the global economy once itpops. Robert Shiller—famous for timing his bookIrrational Exuberance with the 2000 peak in the
U.S. House Price Index
U.K.: NationwideBuilding Society
House Index
Australia: Housing Price Index
50
100
150
200
200520042003200220012000199919981997199619951994199319921991
FIG 2: THROUGH THE ROOFAs of June 2005; long-term average indexed to 100

Volume 1, Issue 2 Investment Management Journal • 39
There is also another factor to consider. New houses in the United States are bigger and better,with larger yards, fancier kitchens and biggergarages. Based on the raw numbers alone, newhome prices soared 70% between 1995 and 2005(see Figure 3). After adjusting for the improvedquality and accounting for inflation, however, newU.S. home prices grew 21% over the past decade, orabout 2% each year—not exactly bubble territory.
To be sure, there are clear risks in the U.S. housingsector. Some coastal markets, for example, appearoverextended. Government regulators also are taking a closer look at the use of esoteric financinginstruments like interest-only loans. Meanwhile,the shift to home ownership has softened the rentalmarket and exerted pressure on property owners toconvert rental properties into ownership properties;as higher long-term rates push the costs of homeownership back up, the supply of rentals could becontracting just as rental demand begins to recover.
Given these risks, the housing sector is likely toslow down, but we are still unconvinced that thehousing sector is a bubble about to pop. Oil prices,however, are a different story.
ENERGY ENIGMA
In August 2005, West Texas crude hit an all-timehigh above $70—well over seven standard devia-tions above its two-decade average of $22. Evenafter that record-busting surge, however, investorexpectations continued to climb higher still. For instance, noncommercial traders accounted for a majority of the activity in the oil futures andoptions market; in August 2005, their share oftrading reached a multi-year high of 51%. Theywere overwhelmingly net long in their futures positions, indicating the expectation of higherprices down the road. Wall Street strategists similarly remained overwhelmingly bullish on oil and energy as well.
The case for higher oil prices over the long-termseems ironclad: a scarce resource plus global growthshould equal higher prices. Over shorter periods of time, however, cyclical forces can move prices up and down sharply. In the past year or two, oil prices received an added lift from heightened global uncertainty, low petroleum inventories andaccelerating demand from China. Since then, thedisruptions from Hurricane Katrina and HurricaneRita notwithstanding, supply pressures lessenedconsiderably. By the summer of 2005, oil inven-tories in the United States were higher than they
Source: Haver Analytics, Morgan Stanley Investment Management
200520001995199019851980
120
110
130
140
100
150
120
110
130
90
80
160
New home prices, adjusted for inflationNew home prices, adjusted for inflation and quality improvements
FIG 3: HOME IMPROVEMENTAs of June 2005; indexed to 100 in 1980; deflated using CPI ex-shelter

40 • Investment Management Journal Fall 2005
oil shale, tar sands and liquefied gas. Greenspan setout similar views when he spoke to the EconomicsClub of New York in early 2005.10 Canada has oneof the world’s largest concentrations of tar sands,an industry that already accounts for one out of sixnew jobs in that country.11 The abundance of addi-tional energy sources suggests that there should bea cap on the long-run equilibrium price of oil asmarket forces of supply and demand play out.
In the meantime, almost as surprising as the persis-tence of high oil prices has been the relatively mutedeffect the spike has had on the U.S. economy.
REMARKABLE RESILIENCE
Oil prices should eventually retreat, although the persistence of high prices behooves observers to be cautious about predicting the exact timing.In the meantime, the economy has shown amazingresilience in the face of the real impact of higherenergy prices. As long as the Fed refrains fromaggressive tightening, this resilience would appearto be the rule rather than the exception.
The research firm ISI calculated that the cost of oil to America’s consumers will total $190 billion in 2005. According to the Federal Reserve, the $30 per barrel oil spike shaved about 50 basispoints from GDP in 2004 and could subtract 75 basis points in 2005. Despite these hits, quar-terly GDP growth has averaged a solid 3.7% sincethe beginning of 2004 (certainly due in part to the offset from the strong housing sector), withplenty of growth momentum still in the pipeline.
The economy was further challenged by the devas-tation wrought by hurricanes Katrina and Rita,which pushed energy prices up and consumer confidence down. Risk Management Solutions, anindependent insurance research firm, set an initialestimate of $60 billion of insured losses from thesestorms, with total losses of at least $125 billion.Rebuilding efforts, however, were quick to beginand could more than equal the losses. According to Alec Phillips, Washington analyst for GoldmanSachs, $75 billion of fiscal spending was already inthe pipeline just a few weeks after Katrina hit land,with the final tally expected to reach as high as$200 billion.
had been since 1999, when oil was $10 a barrel. For most of 2005, Chinese oil imports were relatively flat on a year-over-year basis. But even as those cyclical forces eased, oil prices kept goinghigher. Clearly, other forces were also at work.
The recent oil surge has more than a passing resemblance to another bubble that, at the time,caught many investors by surprise before it finallypopped (see Figure 4). From the start of 1997 untilits peak in early 2000, the Nasdaq rose a whopping291%; oil shot up an almost equally whopping237% over an equivalent period since the start of 2002.
Bubbles evolve on solid fundamentals—at first.The trouble comes when short-term trends areextrapolated into the future and thereby becomedetached from the fundamentals. In the case of the tech boom, major secular changes had been setin motion by important innovations in computersand other technologies. While the surge in produc-tivity that began at the time continues to this day,the high hopes embodied by the Nasdaq at 5,000proved to be well beyond what was justified by the technological revolution. Amazingly, a similarstory appears to be unfolding in the oil market just a few years later.
As recently as 1999, West Texas crude was as cheapas it had been since before the oil shocks of theearly 1970s, hovering just above $10 a barrel. Whenprices were that low, the energy sector sufferedfrom underinvestment, guaranteeing that risingdemand would sooner or later bump up againstsluggish supply to drive prices higher. Back then,however, some analysts argued that structural forceswould keep prices low in perpetuity. (The Economistfamously ran a cover story predicting that oil would drop to $5 a barrel—this issue appeared on newsstands almost precisely at the bottom of the market.9)
Today, the recovery in oil prices can supportrenewed investment in energy, and not only inpetroleum. As independent oil analyst MichaelLynch points out, many additional sources of energy have now become profitable, including

Volume 1, Issue 2 Investment Management Journal • 41
Indeed, the ultimate impact of the hurricanes on the broad economy could be to smooth out its growth trajectory. Some of the strength in the second half of this year could be pushed into the first half of next; this would increase the odds that the Fed might continue raising rates at a fewmore meetings, but it also improves the earnings outlook. The phenomenal corporate earnings cycle,as a result, could be prolonged a few more quarters.Throughout the current expansion, analysts haveconsistently underestimated the strength of profitsgrowth. According to Ian Scott, Lehman Brothers’global strategist, analysts have upgraded their earnings estimates for a record 27 months in a row. The analysts may have a few more months of surprises in store for them.
STOCK SURPRISE
Remarkably, year-over-year corporate earningsgrowth has been in the double digits for 13 consecutive quarters. That is the longest suchrun in 80 years of S&P 500 earnings history.According to S&P’s analysts, there are at leastanother five quarters of double-digit earnings stillto come. Back in 2003, analysts were forecasting
earnings of just $65 for all of 2005. By mid-year2005, that estimate was increased to more than$77 and, despite some headwinds from a strongerdollar and slowing global growth, actual earningscould be even higher.
In the current cycle, stocks have lagged earningsgrowth significantly. In the three years since theOctober 2002 low, stocks were up 52%, while earnings were up 75%. The net effect brought valuations down markedly. By mid-June, the price-to-earnings ratio for the S&P 500 had notcheddown to 17.5, the lowest level in a decade. Basedon the historical relationship with inflation, webelieve valuations could come up a little to 18.Thus, with projected earnings of around $77, the S&P 500 could reach 1,400 over the next fewquarters—an advance of 13% from current levels,although still lower than its all-time high of 1,527of March 2000. For the Dow, record earnings pershare of $650 in 2005 and a P/E ratio of 18 couldlift the world’s most famous index to a new high of 11,800 within the next 12 months.
100
50
150
200
250
300
350
2011201020092008200720062005200420032002
200520042003200220012000199919981997
Nasdaq (top axis)Oil (bottom axis)
FIG 4: LOOK FAMILIAR?As of August 2005; indexed to 100
Source: Haver Analytics, Morgan Stanley Investment Management
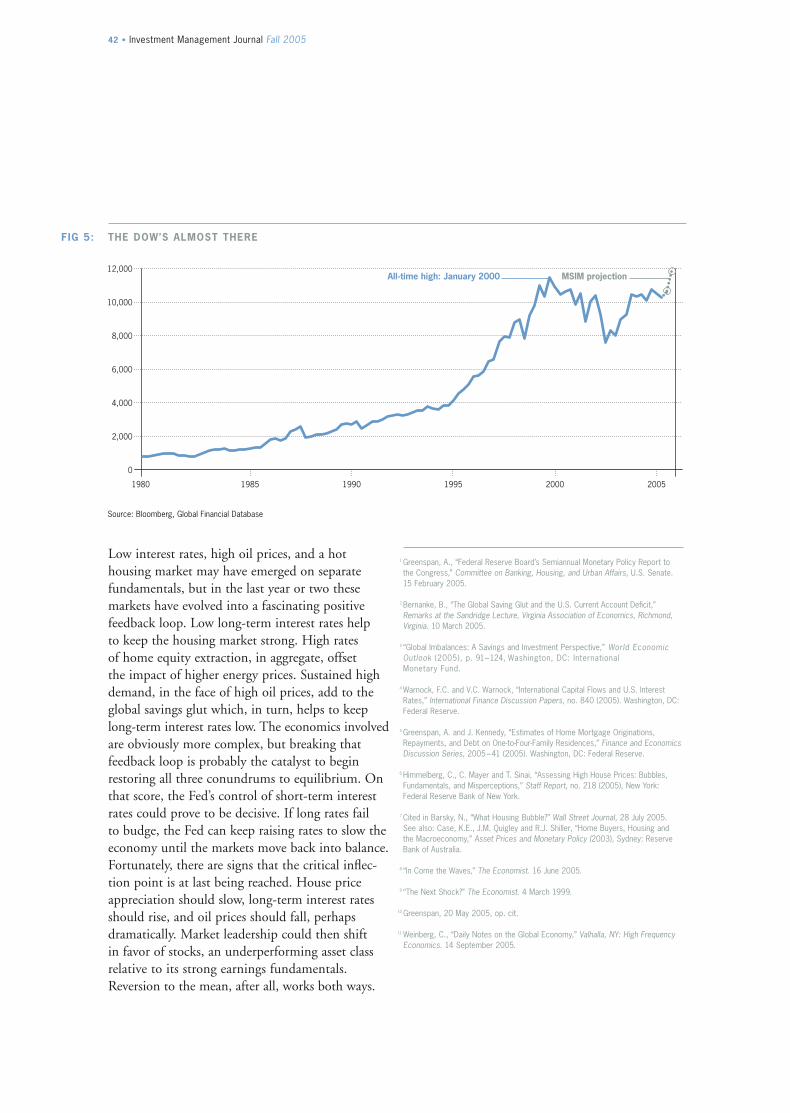
1 Greenspan, A., “Federal Reserve Board’s Semiannual Monetary Policy Report to the Congress,” Committee on Banking, Housing, and Urban Affairs, U.S. Senate.15 February 2005.
2 Bernanke, B., “The Global Saving Glut and the U.S. Current Account Deficit,”Remarks at the Sandridge Lecture, Virginia Association of Economics, Richmond,Virginia. 10 March 2005.
3 “Global Imbalances: A Savings and Investment Perspective,” World EconomicOutlook (2005), p. 91–124, Washington, DC: International Monetary Fund.
4 Warnock, F.C. and V.C. Warnock, “International Capital Flows and U.S. Interest Rates,” International Finance Discussion Papers, no. 840 (2005). Washington, DC:Federal Reserve.
5 Greenspan, A. and J. Kennedy, “Estimates of Home Mortgage Originations,Repayments, and Debt on One-to-Four-Family Residences,” Finance and EconomicsDiscussion Series, 2005–41 (2005). Washington, DC: Federal Reserve.
6 Himmelberg, C., C. Mayer and T. Sinai, “Assessing High House Prices: Bubbles,Fundamentals, and Misperceptions,” Staff Report, no. 218 (2005), New York:Federal Reserve Bank of New York.
7 Cited in Barsky, N., “What Housing Bubble?” Wall Street Journal, 28 July 2005. See also: Case, K.E., J.M. Quigley and R.J. Shiller, “Home Buyers, Housing and the Macroeconomy,” Asset Prices and Monetary Policy (2003), Sydney: ReserveBank of Australia.
8 “In Come the Waves,” The Economist. 16 June 2005.
9 “The Next Shock?” The Economist. 4 March 1999.
10 Greenspan, 20 May 2005, op. cit.
11 Weinberg, C., “Daily Notes on the Global Economy,” Valhalla, NY: High FrequencyEconomics. 14 September 2005.
42 • Investment Management Journal Fall 2005
Source: Bloomberg, Global Financial Database
Low interest rates, high oil prices, and a hot housing market may have emerged on separate fundamentals, but in the last year or two thesemarkets have evolved into a fascinating positivefeedback loop. Low long-term interest rates help to keep the housing market strong. High rates of home equity extraction, in aggregate, offset the impact of higher energy prices. Sustained highdemand, in the face of high oil prices, add to theglobal savings glut which, in turn, helps to keeplong-term interest rates low. The economics involvedare obviously more complex, but breaking thatfeedback loop is probably the catalyst to beginrestoring all three conundrums to equilibrium. Onthat score, the Fed’s control of short-term interestrates could prove to be decisive. If long rates fail to budge, the Fed can keep raising rates to slow theeconomy until the markets move back into balance.Fortunately, there are signs that the critical inflec-tion point is at last being reached. House priceappreciation should slow, long-term interest ratesshould rise, and oil prices should fall, perhaps dramatically. Market leadership could then shift in favor of stocks, an underperforming asset classrelative to its strong earnings fundamentals.Reversion to the mean, after all, works both ways.
FIG 5: THE DOW’S ALMOST THERE
200520001995199019851980
0
2,000
4,000
6,000
8,000
10,000
12,000All-time high: January 2000 MSIM projection

Please direct any comments or questions about theMorgan Stanley Investment Management Journal to:
Daniel P. DonnellyManaging [email protected]
ABOUT THE AUTHORS
John S. Coates, Ph.D., CFA Managing DirectorJack is co-business group head of Morgan Stanley AIP.He joined Morgan Stanley AIP in 2000 and has morethan 20 years of investment experience. Jack receivedboth a bachelor’s and a master’s degree in aerospace engineering from the Georgia Institute of Technology.He received an M.B.A. as a Wharton Fellow from the University of Pennsylvania and a Ph.D. from theUniversity of Washington.
Paul Psaila, CFAExecutive DirectorPaul is a portfolio manager for the Emerging MarketsEquity portfolios, focusing on global analytics. Hejoined Morgan Stanley in 1994 and has 11 years ofinvestment experience. Paul received a B.A. in politicalscience from Brandeis University and a master’s degreein economics and Latin American studies from the School of Advanced International Studies of Johns Hopkins University.
Ted BigmanManaging DirectorTed is head of Global Real Estate Securities, the firm’sreal estate securities investment management business.He joined Morgan Stanley in 1995 and has 18 years ofinvestment experience. Ted received a B.A. in economicsfrom Brandeis University and an M.B.A. from HarvardBusiness School.
Christina Chiu AssociateChristina is a securities analyst on the Global RealEstate Securities team, responsible for research and analytical support for the firm’s real estate securitiesinvestment management business. She joined MorganStanley in 2002 and has three years of investment experience. Christina received a B.S. summa cum laudein finance and accounting from New York University’sStern School of Business.
Joseph McAlinden, CFA Managing DirectorJoe is chief investment officer, directing the daily activities of the firm’s investment department. He joinedMorgan Stanley in 1995 and has more than 30 years of investment experience. Joe received a B.A. cum laudein economics from Rutgers University.
Warren Hatch, Ph.D., CFA Vice PresidentWarren is an investment strategist and co-portfoliomanager of the Allocator Fund. He joined MorganStanley in 1999 and has six years of investment experience. Warren received a B.A. in history from the University of Utah, an M.A. in Russian and international policy studies from the Monterey Instituteof International Studies, and a Ph.D. in political science from the University of Oxford.
The forecasts and opinions in this piece are not necessarily those of Morgan Stanley InvestmentManagement and may not actually come to pass.Information in this report does not pertain to anyMorgan Stanley product and is not a solicitation for any product. The views expressed are those of the authors at the time of writing and are subject to change based on market, economic and other conditions. They should not be construed as recommendations, but as illustrations of broader economic themes. All information contained within is based on past performance and is not intended to be indicative of future results. All information is subject to change.
Morgan Stanley does not provide tax advice. The taxinformation contained herein is general and is notexhaustive by nature. It was not intended or writtento be used, and it cannot be used by any taxpayer,for the purpose of avoiding penalties that may beimposed on the taxpayer under U.S. federal tax laws.Federal and state laws are complex and constantlychanging. You should always consult your own legalor tax advisor for information concerning yourindividual situation.
Equity securities are more volatile than bonds and subject to greater risks. Small and mid-sized companystocks involve greater risks than those customarilyassociated with larger companies. Bonds are subject to interest rate, price and credit risks. Prices tend to be inversely affected by changes in interest rates.Unlike stocks and bonds, U.S. Treasury securities are guaranteed as to payment of principal and interest if held to maturity. REITs are more susceptible to the risks generally associated with investments in realestate. Note that it is not possible to invest in a market index.
THIS MATERIAL IS PREPARED FOR INSTITUTIONAL INVESTOR USE ONLY.It may not be reproduced, shown or quoted to members of the general public or used in written form as sales literature; any such use would be in violation of the NASD Conduct Rules.

2005
Morgan Stanley Investment Management
Investment Management Journal
01 Asset-liability risks and portable alphaJohn S. Coates, Ph.D., CFA—Managing Director
Every so often, there is a development in the world of finance that results in a major paradigm shift. Currently, we find ourselves in the midst of a very unusual situation in which three such shifts are emerging simultaneously. Each can have a significant impact on the management of the investment portfolios of pensionfunds, endowments and foundations.
09 Emerging markets: All grown up? Paul Psaila, CFA—Executive Director
Emerging market equities have been among the best performing asset classes over the last few years. This has led observers to wonder whether this current bout of outperformance will again end in tears or if the emerging markets have moved on to a more mature plane. We lean toward the latter of these two scenarios, as we believe emerging markets are well into a stage we would characterize as “young adulthood.”
15 The case for a strategic allocation to global real estate securitiesTed Bigman—Managing Director Christina Chiu—Associate
Real estate has gained increased acceptance among institutional investors as a distinct asset class that deserves a permanent strategic allocation in a multi-asset classportfolio. However, only a limited number have incorporated international exposureinto their overall real estate allocations. We believe the global real estate market has evolved such that institutional investors would benefit from a strategic allocation to global real estate, particularly through the listed property markets.
35 Countdown conundrumJoseph McAlinden, CFA—Managing DirectorWarren Hatch, Ph.D., CFA—Vice President
Low long-term interest rates, high oil prices and a red-hot housing market have been the dominant themes in the current business cycle for a surprisingly long time. Their return to equilibrium as the fundamentally strong economic expansionmatures could offer new opportunities for other asset classes, particularly U.S. common stocks.
Volume1
Issue 2
IS05-01016F-N11/05
© 2005 Morgan Stanley. Investments and services are offered throughMorgan Stanley DW Inc., member SIPC.
Morgan Stanley Investment Management (“MSIM”) is the asset managementdivision of Morgan Stanley. Assets are managed by teams representing differentMSIM legal entities with offices in New York, Philadelphia, Houston, Chicago,London, Amsterdam, Singapore, Tokyo and Mumbai.