Embed Size (px)
Citation preview
Mutual fund shares are offered by Prudential Investment Management Services, LLC (PIMS), Three Gateway Center, 14th Floor,
Newark, NJ 07102-4077, a Prudential Financial company. Member FINRA/SIPC. Investment advisory services provided by Global
Portfolio Strategies, Inc., a Prudential Financial company.
Investment Fact Sheets
Please read all of the documents contained in this booklet (Click on a fund in the Table of Contents to be directed to that fund’s specific fact sheet)
TABLE OF CONTENTS PAGE
PruSecure (non-New York) 2 PruSecure (New York version) 3 MoneyMart Assets Series A 4 AST Preservation Asset Allocation 5 AST Balanced Asset Allocation 6 AST Capital Growth Asset Allocation 7 Target Total Return Bond Fund R 8 Prudential Government Income Fund R 9 Prudential High-Yield Fund R 10 Target Large Cap Growth Fund R 11 Prudential Jennison Growth Fund R 12 Prudential Stock Index Fund A 13 Prudential Jennison 20/20 Focus Fund R 14 Target Large Cap Value Fund R 15 Prudential Jennison Value Fund R 16 Prudential Jennison Mid Cap Growth Fund R 17 Target Small Cap Growth Fund R 18 Prudential Jennison Small Company Fund R 19 Target Small Cap Value Fund R 20 Target International Equity Fund R 21 Prudential Jennison Natural Resources Fund R 22 Prudential Jennison Utility Fund R 23 User’s Guide 24
0182258 0182258-00001-00 Exp. 12/30/2011 RSFS107
PruSecure Account Third Quarter 2010 Fund Fact Sheet
Key Facts ISSUER: The Prudential Insurance Company of America INVESTMENT ADVISER: Prudential Investment Management, Inc. FUND CATEGORY: Stable Value NET ASSETS: $6,281 Million INCEPTION DATE: January 1, 1982
Investor Risk Profile This Fund may be suitable for investors who seek: ■ Preservation of capital plus competitive
intermediate-term returns.
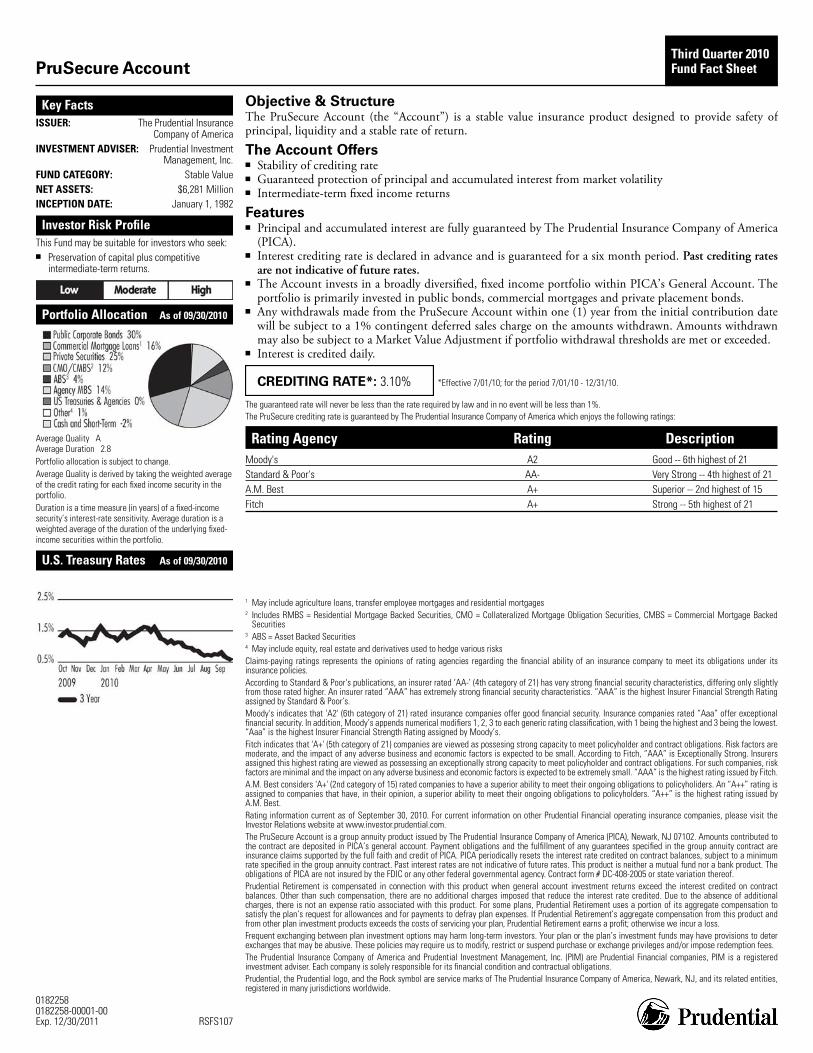
Portfolio Allocation As of 09/30/2010
Average Quality A Average Duration 2.8 Portfolio allocation is subject to change. Average Quality is derived by taking the weighted average of the credit rating for each fixed income security in the portfolio. Duration is a time measure (in years) of a fixed-income security’s interest-rate sensitivity. Average duration is a weighted average of the duration of the underlying fixed-income securities within the portfolio.
U.S. Treasury Rates As of 09/30/2010
Objective & Structure The PruSecure Account (the “Account”) is a stable value insurance product designed to provide safety ofprincipal, liquidity and a stable rate of return.
The Account Offers ■ Stability of crediting rate ■ Guaranteed protection of principal and accumulated interest from market volatility ■ Intermediate-term fixed income returns
Features ■ Principal and accumulated interest are fully guaranteed by The Prudential Insurance Company of America
(PICA). ■ Interest crediting rate is declared in advance and is guaranteed for a six month period. Past crediting rates
are not indicative of future rates. ■ The Account invests in a broadly diversified, fixed income portfolio within PICA’s General Account. The
portfolio is primarily invested in public bonds, commercial mortgages and private placement bonds. ■ Any withdrawals made from the PruSecure Account within one (1) year from the initial contribution date
will be subject to a 1% contingent deferred sales charge on the amounts withdrawn. Amounts withdrawnmay also be subject to a Market Value Adjustment if portfolio withdrawal thresholds are met or exceeded.
■ Interest is credited daily.
CREDITING RATE*: 3.10% *Effective 7/01/10; for the period 7/01/10 - 12/31/10.
The guaranteed rate will never be less than the rate required by law and in no event will be less than 1%. The PruSecure crediting rate is guaranteed by The Prudential Insurance Company of America which enjoys the following ratings:
Rating Agency Rating Description Moody's A2 Good -- 6th highest of 21 Standard & Poor's AA- Very Strong -- 4th highest of 21 A.M. Best A+ Superior -- 2nd highest of 15 Fitch A+ Strong -- 5th highest of 21
1 May include agriculture loans, transfer employee mortgages and residential mortgages 2 Includes RMBS = Residential Mortgage Backed Securities, CMO = Collateralized Mortgage Obligation Securities, CMBS = Commercial Mortgage Backed
Securities 3 ABS = Asset Backed Securities 4 May include equity, real estate and derivatives used to hedge various risks Claims-paying ratings represents the opinions of rating agencies regarding the financial ability of an insurance company to meet its obligations under itsinsurance policies. According to Standard & Poor's publications, an insurer rated ‘AA-’ (4th category of 21) has very strong financial security characteristics, differing only slightlyfrom those rated higher. An insurer rated “AAA” has extremely strong financial security characteristics. “AAA” is the highest Insurer Financial Strength Ratingassigned by Standard & Poor’s. Moody's indicates that 'A2' (6th category of 21) rated insurance companies offer good financial security. Insurance companies rated “Aaa” offer exceptionalfinancial security. In addition, Moody’s appends numerical modifiers 1, 2, 3 to each generic rating classification, with 1 being the highest and 3 being the lowest.“Aaa” is the highest Insurer Financial Strength Rating assigned by Moody’s. Fitch indicates that 'A+' (5th category of 21) companies are viewed as possesing strong capacity to meet policyholder and contract obligations. Risk factors aremoderate, and the impact of any adverse business and economic factors is expected to be small. According to Fitch, “AAA” is Exceptionally Strong. Insurersassigned this highest rating are viewed as possessing an exceptionally strong capacity to meet policyholder and contract obligations. For such companies, riskfactors are minimal and the impact on any adverse business and economic factors is expected to be extremely small. “AAA” is the highest rating issued by Fitch.A.M. Best considers 'A+' (2nd category of 15) rated companies to have a superior ability to meet their ongoing obligations to policyholiders. An “A++” rating isassigned to companies that have, in their opinion, a superior ability to meet their ongoing obligations to policyholders. “A++” is the highest rating issued byA.M. Best. Rating information current as of September 30, 2010. For current information on other Prudential Financial operating insurance companies, please visit theInvestor Relations website at www.investor.prudential.com. The PruSecure Account is a group annuity product issued by The Prudential Insurance Company of America (PICA), Newark, NJ 07102. Amounts contributed tothe contract are deposited in PICA’s general account. Payment obligations and the fulfillment of any guarantees specified in the group annuity contract areinsurance claims supported by the full faith and credit of PICA. PICA periodically resets the interest rate credited on contract balances, subject to a minimumrate specified in the group annuity contract. Past interest rates are not indicative of future rates. This product is neither a mutual fund nor a bank product. Theobligations of PICA are not insured by the FDIC or any other federal governmental agency. Contract form # DC-408-2005 or state variation thereof. Prudential Retirement is compensated in connection with this product when general account investment returns exceed the interest credited on contractbalances. Other than such compensation, there are no additional charges imposed that reduce the interest rate credited. Due to the absence of additionalcharges, there is not an expense ratio associated with this product. For some plans, Prudential Retirement uses a portion of its aggregate compensation tosatisfy the plan’s request for allowances and for payments to defray plan expenses. If Prudential Retirement’s aggregate compensation from this product andfrom other plan investment products exceeds the costs of servicing your plan, Prudential Retirement earns a profit; otherwise we incur a loss. Frequent exchanging between plan investment options may harm long-term investors. Your plan or the plan’s investment funds may have provisions to deterexchanges that may be abusive. These policies may require us to modify, restrict or suspend purchase or exchange privileges and/or impose redemption fees. The Prudential Insurance Company of America and Prudential Investment Management, Inc. (PIM) are Prudential Financial companies, PIM is a registeredinvestment adviser. Each company is solely responsible for its financial condition and contractual obligations. Prudential, the Prudential logo, and the Rock symbol are service marks of The Prudential Insurance Company of America, Newark, NJ, and its related entities,registered in many jurisdictions worldwide.
0161826 0161826-00001-07 Exp. 01/13/2012 RSFS106
PruSecure Account Third Quarter 2010 Fund Fact Sheet New York Version
Key Facts ISSUER: The Prudential Insurance Company of America INVESTMENT ADVISER: Prudential Investment Management, Inc. FUND CATEGORY: Stable Value NET ASSETS: $6,281 Million INCEPTION DATE: January 1, 1982
Investor Risk Profile This Fund may be suitable for investors who seek: ■ Preservation of capital plus competitive
intermediate-term returns.
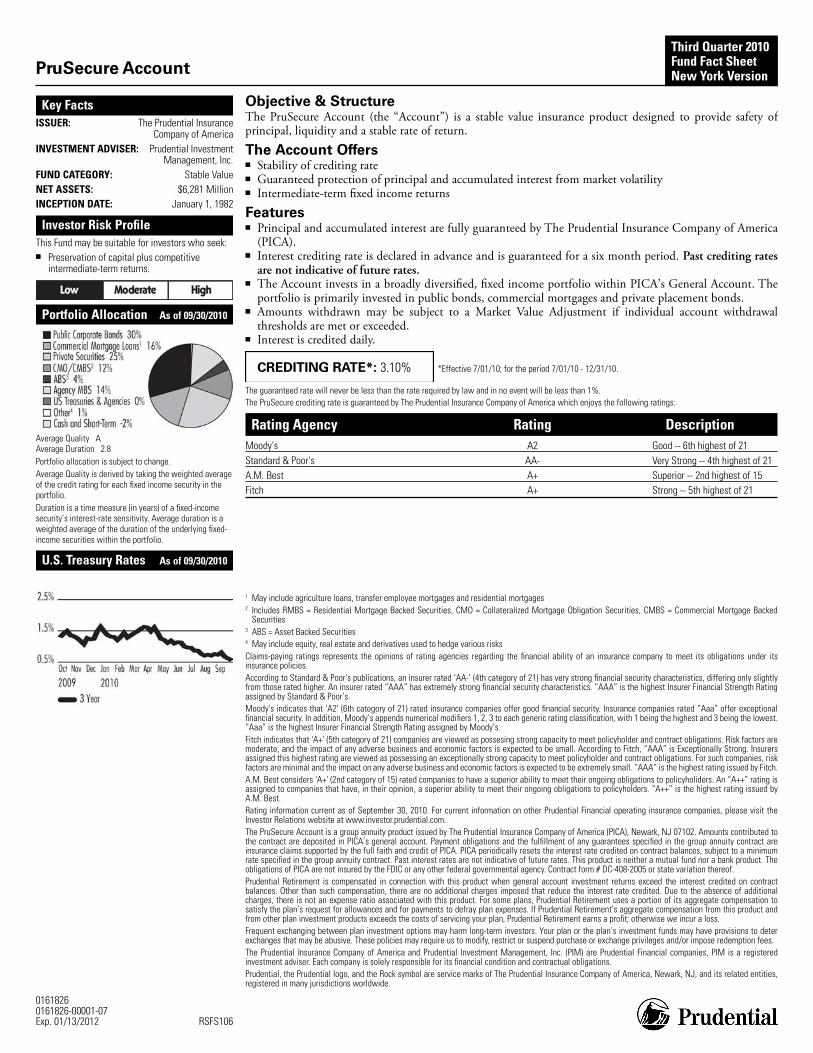
Portfolio Allocation As of 09/30/2010
Average Quality A Average Duration 2.8 Portfolio allocation is subject to change. Average Quality is derived by taking the weighted average of the credit rating for each fixed income security in the portfolio. Duration is a time measure (in years) of a fixed-income security’s interest-rate sensitivity. Average duration is a weighted average of the duration of the underlying fixed-income securities within the portfolio.
U.S. Treasury Rates As of 09/30/2010
Objective & Structure The PruSecure Account (the “Account”) is a stable value insurance product designed to provide safety ofprincipal, liquidity and a stable rate of return.
The Account Offers ■ Stability of crediting rate ■ Guaranteed protection of principal and accumulated interest from market volatility ■ Intermediate-term fixed income returns
Features ■ Principal and accumulated interest are fully guaranteed by The Prudential Insurance Company of America
(PICA). ■ Interest crediting rate is declared in advance and is guaranteed for a six month period. Past crediting rates
are not indicative of future rates. ■ The Account invests in a broadly diversified, fixed income portfolio within PICA’s General Account. The
portfolio is primarily invested in public bonds, commercial mortgages and private placement bonds. ■ Amounts withdrawn may be subject to a Market Value Adjustment if individual account withdrawal
thresholds are met or exceeded. ■ Interest is credited daily.
CREDITING RATE*: 3.10% *Effective 7/01/10; for the period 7/01/10 - 12/31/10.
The guaranteed rate will never be less than the rate required by law and in no event will be less than 1%. The PruSecure crediting rate is guaranteed by The Prudential Insurance Company of America which enjoys the following ratings:
Rating Agency Rating Description Moody's A2 Good -- 6th highest of 21 Standard & Poor's AA- Very Strong -- 4th highest of 21 A.M. Best A+ Superior -- 2nd highest of 15 Fitch A+ Strong -- 5th highest of 21
1 May include agriculture loans, transfer employee mortgages and residential mortgages 2 Includes RMBS = Residential Mortgage Backed Securities, CMO = Collateralized Mortgage Obligation Securities, CMBS = Commercial Mortgage Backed
Securities 3 ABS = Asset Backed Securities 4 May include equity, real estate and derivatives used to hedge various risks Claims-paying ratings represents the opinions of rating agencies regarding the financial ability of an insurance company to meet its obligations under itsinsurance policies. According to Standard & Poor's publications, an insurer rated ‘AA-’ (4th category of 21) has very strong financial security characteristics, differing only slightlyfrom those rated higher. An insurer rated “AAA” has extremely strong financial security characteristics. “AAA” is the highest Insurer Financial Strength Ratingassigned by Standard & Poor’s. Moody's indicates that 'A2' (6th category of 21) rated insurance companies offer good financial security. Insurance companies rated “Aaa” offer exceptionalfinancial security. In addition, Moody’s appends numerical modifiers 1, 2, 3 to each generic rating classification, with 1 being the highest and 3 being the lowest.“Aaa” is the highest Insurer Financial Strength Rating assigned by Moody’s. Fitch indicates that 'A+' (5th category of 21) companies are viewed as possesing strong capacity to meet policyholder and contract obligations. Risk factors aremoderate, and the impact of any adverse business and economic factors is expected to be small. According to Fitch, “AAA” is Exceptionally Strong. Insurersassigned this highest rating are viewed as possessing an exceptionally strong capacity to meet policyholder and contract obligations. For such companies, riskfactors are minimal and the impact on any adverse business and economic factors is expected to be extremely small. “AAA” is the highest rating issued by Fitch.A.M. Best considers 'A+' (2nd category of 15) rated companies to have a superior ability to meet their ongoing obligations to policyholiders. An “A++” rating isassigned to companies that have, in their opinion, a superior ability to meet their ongoing obligations to policyholders. “A++” is the highest rating issued byA.M. Best. Rating information current as of September 30, 2010. For current information on other Prudential Financial operating insurance companies, please visit theInvestor Relations website at www.investor.prudential.com. The PruSecure Account is a group annuity product issued by The Prudential Insurance Company of America (PICA), Newark, NJ 07102. Amounts contributed tothe contract are deposited in PICA’s general account. Payment obligations and the fulfillment of any guarantees specified in the group annuity contract areinsurance claims supported by the full faith and credit of PICA. PICA periodically resets the interest rate credited on contract balances, subject to a minimumrate specified in the group annuity contract. Past interest rates are not indicative of future rates. This product is neither a mutual fund nor a bank product. Theobligations of PICA are not insured by the FDIC or any other federal governmental agency. Contract form # DC-408-2005 or state variation thereof. Prudential Retirement is compensated in connection with this product when general account investment returns exceed the interest credited on contractbalances. Other than such compensation, there are no additional charges imposed that reduce the interest rate credited. Due to the absence of additionalcharges, there is not an expense ratio associated with this product. For some plans, Prudential Retirement uses a portion of its aggregate compensation tosatisfy the plan’s request for allowances and for payments to defray plan expenses. If Prudential Retirement’s aggregate compensation from this product andfrom other plan investment products exceeds the costs of servicing your plan, Prudential Retirement earns a profit; otherwise we incur a loss. Frequent exchanging between plan investment options may harm long-term investors. Your plan or the plan’s investment funds may have provisions to deterexchanges that may be abusive. These policies may require us to modify, restrict or suspend purchase or exchange privileges and/or impose redemption fees. The Prudential Insurance Company of America and Prudential Investment Management, Inc. (PIM) are Prudential Financial companies, PIM is a registeredinvestment adviser. Each company is solely responsible for its financial condition and contractual obligations. Prudential, the Prudential logo, and the Rock symbol are service marks of The Prudential Insurance Company of America, Newark, NJ, and its related entities,registered in many jurisdictions worldwide.

0163660
Third Quarter 2010 Fund Fact Sheet
Prudential MoneyMart Assets A
Key Facts INVESTMENT ADVISOR: Prudential Investments LLCFUND CATEGORY: Money Market - TaxableINDEX: USTREAS T-Bill Auction Ave 3 Mon®GROSS EXPENSE RATIO: 0.58% of Fund AssetsNET ASSETS: $601.0 MillionINCEPTION DATE: 6/1/1976TICKER SYMBOL: PBMXXSHARE CLASS: APORTFOLIO MANAGER:
Management Team
Portfolio Allocation As of 09/30/2010
Cash 100%
Annual Performance Fund Index 2009 2008 2007 2006 2005
0.27% 2.40% 4.95% 4.45% 2.59%
0.16% 1.51% 4.77% 5.06% 3.34%
Objective/DescriptionThe investment seeks maximum current income consistent with stability of capital and the maintenance of liquidity. The fund invests in short-term money market instruments such as obligations issued by the U.S. Government, its agencies and instrumentalities, commercial paper, asset-backed securities, funding agreements, variable rate demand notes, bills, notes and other obligations issued by banks, corporations and other companies, and obligations issued by foreign banks, companies or foreign governments, and municipal notes. It invests only in instruments with remaining maturities of 13 months or less and which are denominated in U.S. dollars. There is no assurance the objectives of the Fund will be met. Fixed income investment (bond) funds are subject to interest rate risk; their value will decline as interest rates rise. An investment in a money market fund is neither insured nor guaranteed by the Federal Deposit Insurance Corporation or any other government agency. Although the Fund seeks to preserve the value of your investment at $1.00 per share, it is possible to lose money by investing in the Fund. The yield quotation more closely reflects the current earnings of the Portfolio than the total return quotation
Performance(%) As of 09/30/2010
Cumulative Returns Average Annual Total Returns
QTD YTD 1 Year 3 Year 5 Year 10 Year Since
Inception Fund 0.01 0.02 0.04 1.29 2.57 2.27 NA The 7-Day Current Yield as of 09/30/2010 is 0.02% Index 0.04 0.10 0.12 0.90 2.50 2.43 ---
Such fees, if applicable to this fund, compensate Prudential Retirement for selling the fund’s shares and servicing your retirement plan. The fund’s expense ratio includes these fees. Other investment options may generate more or less revenue than the fees associated with this fund. If the aggregate revenue from your plan exceeds our associated costs, we earn a profit. Otherwise, we incur a loss. Other share classes of this fund may have a lower expense ratio, but your plan’s investment options do not include such shares to compensate us for distribution and plan servicing. Performance: The performance quoted represents past performance. The investment value and return will fluctuate so that an investment, when redeemed, may be worth more or less than original cost. Past performance does not guarantee future results. Current performance may be lower or higher than the performance quoted. For performance data current to the most recent month end, please call 1-877-778-2100. These performance results represent the change in net asset value of an investment over a stated period, assuming the reinvestment of dividends and capital gain distributions. Market Timing: Frequent exchanging of investment options may harm long-term investors. Your plan and/or the fund have policies to detect and deter exchanges that may be abusive. Those policies may require us to modify or suspend purchase or exchange privileges. Prospectus: Before investing, investors should carefully consider the investment objectives, risks, charges and expenses of this fund and other plan investment options. For more information about this fund, please call 1-877-778-2100 for a prospectus that contains this and other information. Please read the prospectus carefully before investing. The performance quoted above does not reflect sales charges that may apply when fund shares are purchased outside of a retirement plan. If such sales charges were reflected, performance may be lower. It is possible to lose money investing in securities. Benchmark performance including the index is unmanaged and cannot be invested in directly. See User Guide for Benchmark definitions. Shares of the registered mutual funds are offered by Prudential Investment Management Services LLC (PIMS), Three Gateway Center, 14th Floor, Newark, NJ 07102-4077. PIMS is a Prudential Financial company. Prudential, the Prudential logo, and the Rock symbol are service marks of The Prudential Insurance Company of America, Newark, NJ, and its related entities, registered in many jurisdictions worldwide.
Prudential Retirement Security AnnuityPrudential Retirement Security Annuity II Prudential IncomeFlex® Select sm AST Preservation Asset Allocation Portfolio
Key Facts – Portfolio
Investor Risk Profile
Third Quarter 2010 Fund Fact Sheet
ASTPAA AS8-DC/310
Performance (%) As of 9/30/2010
OBJECTIVE/DESCRIPTION
This Portfolio is one of a series of AST Asset Allocation Portfolios available as a variable investment option underPrudential Retirement Security Annuity and Prudential Retirement Security Annuity II (each, the Annuity). TheAnnuity is a variable annuity that features Prudential IncomeFlex® Selectsm, a guaranteed minimum withdrawalbenefit included for an additional fee. The Annuity also imposes insurance and administrative charges. For moredetails about IncomeFlex® Selectsm and other features and charges of the Annuity, please refer to the productprospectus.
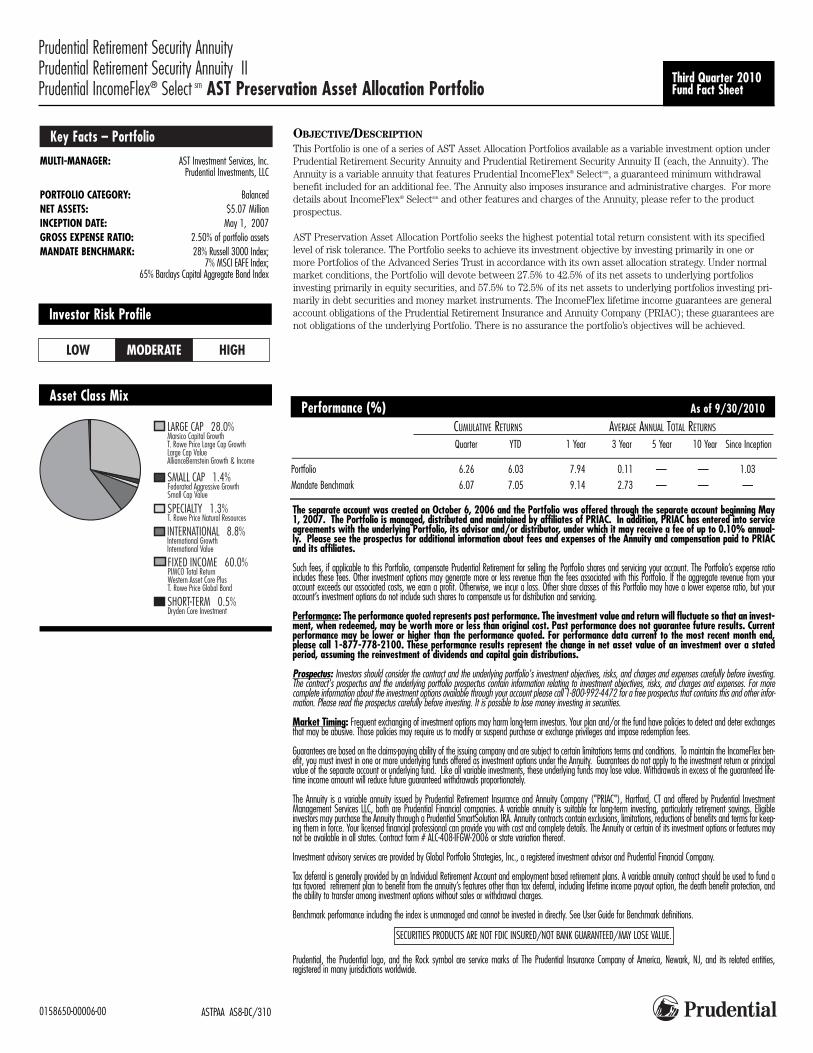
AST Preservation Asset Allocation Portfolio seeks the highest potential total return consistent with its specifiedlevel of risk tolerance. The Portfolio seeks to achieve its investment objective by investing primarily in one ormore Portfolios of the Advanced Series Trust in accordance with its own asset allocation strategy. Under normalmarket conditions, the Portfolio will devote between 27.5% to 42.5% of its net assets to underlying portfoliosinvesting primarily in equity securities, and 57.5% to 72.5% of its net assets to underlying portfolios investing pri-marily in debt securities and money market instruments. The IncomeFlex lifetime income guarantees are generalaccount obligations of the Prudential Retirement Insurance and Annuity Company (PRIAC); these guarantees arenot obligations of the underlying Portfolio. There is no assurance the portfolio’s objectives will be achieved.
Portfolio 6.26 6.03 7.94 0.11 — — 1.03
Mandate Benchmark 6.07 7.05 9.14 2.73 — — —
MULTI-MANAGER: AST Investment Services, Inc.Prudential Investments, LLC
PORTFOLIO CATEGORY: BalancedNET ASSETS: $5.07 MillionINCEPTION DATE: May 1, 2007GROSS EXPENSE RATIO: 2.50% of portfolio assetsMANDATE BENCHMARK: 28% Russell 3000 Index;
7% MSCI EAFE Index;65% Barclays Capital Aggregate Bond Index
SPECIALTY 1.3%T. Rowe Price Natural Resources
SHORT-TERM 0.5%Dryden Core Investment
LARGE CAP 28.0%Marsico Capital Growth T. Rowe Price Large Cap Growth Large Cap Value AllianceBernstein Growth & Income
SMALL CAP 1.4%Federated Aggressive Growth Small Cap Value
FIXED INCOME 60.0%PIMCO Total Return Western Asset Core Plus T. Rowe Price Global Bond
INTERNATIONAL 8.8%International Growth International Value
Asset Class Mix
0158650-00006-00
The separate account was created on October 6, 2006 and the Portfolio was offered through the separate account beginning May1, 2007. The Portfolio is managed, distributed and maintained by affiliates of PRIAC. In addition, PRIAC has entered into serviceagreements with the underlying Portfolio, its advisor and/or distributor, under which it may receive a fee of up to 0.10% annual-ly. Please see the prospectus for additional information about fees and expenses of the Annuity and compensation paid to PRIACand its affiliates.
Such fees, if applicable to this Portfolio, compensate Prudential Retirement for selling the Portfolio shares and servicing your account. The Portfolio’s expense ratioincludes these fees. Other investment options may generate more or less revenue than the fees associated with this Portfolio. If the aggregate revenue from youraccount exceeds our associated costs, we earn a profit. Otherwise, we incur a loss. Other share classes of this Portfolio may have a lower expense ratio, but youraccount’s investment options do not include such shares to compensate us for distribution and servicing.
Performance: The performance quoted represents past performance. The investment value and return will fluctuate so that an invest-ment, when redeemed, may be worth more or less than original cost. Past performance does not guarantee future results. Currentperformance may be lower or higher than the performance quoted. For performance data current to the most recent month end,please call 1-877-778-2100. These performance results represent the change in net asset value of an investment over a statedperiod, assuming the reinvestment of dividends and capital gain distributions.
Prospectus: Investors should consider the contract and the underlying portfolio's investment objectives, risks, and charges and expenses carefully before investing.The contract's prospectus and the underlying portfolio prospectus contain information relating to investment objectives, risks, and charges and expenses. For morecomplete information about the investment options available through your account please call 1-800-992-4472 for a free prospectus that contains this and other infor-mation. Please read the prospectus carefully before investing. It is possible to lose money investing in securities.
Market Timing: Frequent exchanging of investment options may harm long-term investors. Your plan and/or the fund have policies to detect and deter exchangesthat may be abusive. Those policies may require us to modify or suspend purchase or exchange privileges and impose redemption fees.
Guarantees are based on the claims-paying ability of the issuing company and are subject to certain limitations terms and conditions. To maintain the IncomeFlex ben-efit, you must invest in one or more underlying funds offered as investment options under the Annuity. Guarantees do not apply to the investment return or principalvalue of the separate account or underlying fund. Like all variable investments, these underlying funds may lose value. Withdrawals in excess of the guaranteed life-time income amount will reduce future guaranteed withdrawals proportionately.
The Annuity is a variable annuity issued by Prudential Retirement Insurance and Annuity Company ("PRIAC"), Hartford, CT and offered by Prudential InvestmentManagement Services LLC, both are Prudential Financial companies. A variable annuity is suitable for long-term investing, particularly retirement savings. Eligibleinvestors may purchase the Annuity through a Prudential SmartSolution IRA. Annuity contracts contain exclusions, limitations, reductions of benefits and terms for keep-ing them in force. Your licensed financial professional can provide you with cost and complete details. The Annuity or certain of its investment options or features maynot be available in all states. Contract form # ALC-408-IFGW-2006 or state variation thereof.
Investment advisory services are provided by Global Portfolio Strategies, Inc., a registered investment advisor and Prudential Financial Company.
Tax deferral is generally provided by an Individual Retirement Account and employment based retirement plans. A variable annuity contract should be used to fund atax favored retirement plan to benefit from the annuity’s features other than tax deferral, including lifetime income payout option, the death benefit protection, andthe ability to transfer among investment options without sales or withdrawal charges.
Benchmark performance including the index is unmanaged and cannot be invested in directly. See User Guide for Benchmark definitions.
SECURITIES PRODUCTS ARE NOT FDIC INSURED/NOT BANK GUARANTEED/MAY LOSE VALUE.
Prudential, the Prudential logo, and the Rock symbol are service marks of The Prudential Insurance Company of America, Newark, NJ, and its related entities, registered in many jurisdictions worldwide.
CUMULATIVE RETURNS AVERAGE ANNUAL TOTAL RETURNS
Quarter YTD 1 Year 3 Year 5 Year 10 Year Since Inception

Prudential Retirement Security AnnuityPrudential Retirement Security Annuity IIPrudential IncomeFlex® Select sm AST Balanced Asset Allocation Portfolio
Key Facts – Portfolio
Investor Risk Profile
Third Quarter 2010 Fund Fact Sheet
ASTCAA AS7-DC/310
Performance (%) As of 9/30/2010
OBJECTIVE/DESCRIPTION
This Portfolio is one of a series of AST Asset Allocation Portfolios available as a variable investment option underPrudential Retirement Security Annuity and Prudential Retirement Security Annuity II (each, the Annuity). TheAnnuity is a variable annuity that features Prudential IncomeFlex® Selectsm, a guaranteed minimum withdrawalbenefit included for an additional fee. The Annuity also imposes an insurance and administrative charges. Formore details about IncomeFlex® Selectsm and other features and charges of the Annuity, please refer to the product prospectus.
AST Balanced Asset Allocation Portfolio seeks the highest potential total return consistent with its specified levelof risk tolerance. The Portfolio seeks to achieve its investment objective by investing primarily in one or morePortfolios of the Advanced Series Trust in accordance with its own asset allocation strategy. Under normal mar-ket conditions, the Portfolio will devote between 52.5%-67.5%% of its net assets to underlying portfolios invest-ing primarily in equity securities, and 32.5%-47.5% of its net assets to underlying portfolios investing primarily indebt securities and money market instruments. The IncomeFlex lifetime income guarantees are general accountobligations of the Prudential Retirement Insurance and Annuity Company (PRIAC); these guarantees are notobligations of the underlying Portfolio. There is no assurance the portfolio’s objectives will be achieved.
Portfolio 8.55 4.70 7.77 -3.79 — — -2.50
Mandate Benchmark 8.09 6.33 9.47 -0.13 — — —
MULTI-MANAGER: AST Investment Services, Inc.Prudential Investments, LLC
PORTFOLIO CATEGORY: BalancedNET ASSETS: $12.37 MillionINCEPTION DATE: May 1, 2007GROSS EXPENSE RATIO: 2.53% of portfolio assetsMANDATE BENCHMARK: 48% Russell 3000 Index;
12% MSCI EAFE Index;40% Barclays Capital Aggregate Bond Index
Note: Prior to July 31, 2008: The Mandate Benchmark is 44% Russell3000 Index; 11% MSCI EAFE Index; 45% Lehman Brothers Aggregate BondIndex .
FIXED INCOME 36% PIMCO Total Return Bond WAMCO Core Plus FI High Yield T. Rowe Price Global Bond
LARGE CAP 44% Marsico Capital Growth T. Rowe Price LCG MFS Growth AllianceBernstein Growth & Income Large Cap Value DeAM Large Cap Value
INTERNATIONAL EQUITY 12% International Growth International Value Parametric Emerging Markets
MID/SMALL CAP 4% Neuberger Berman Mid Cap Growth Mid Cap Value Federated Aggressive Growth Small Cap Value
SPECIALTY 4% Global REIT T. Rowe Price Nat Resources
Asset Class Mix
0158647-00006-00
The separate account was created on October 6, 2006 and the Portfolio was offered through the separate account beginning May1, 2007. The Portfolio is managed, distributed and maintained by affiliates of PRIAC. In addition, PRIAC has entered into serviceagreements with the underlying Portfolio, its advisor and/or distributor, under which it may receive a fee of up to 0.10% annual-ly. Please see the prospectus for additional information about fees and expenses of the Annuity and compensation paid to PRIACand its affiliates. Such fees, if applicable to this Portfolio, compensate Prudential Retirement for selling the Portfolio shares and servicing your account. The Portfolio’s expense ratioincludes these fees. Other investment options may generate more or less revenue than the fees associated with this Portfolio. If the aggregate revenue from youraccount exceeds our associated costs, we earn a profit. Otherwise, we incur a loss. Other share classes of this Portfolio may have a lower expense ratio, but youraccount’s investment options do not include such shares to compensate us for distribution and servicing.
Performance: The performance quoted represents past performance. The investment value and return will fluctuate so that an invest-ment, when redeemed, may be worth more or less than original cost. Past performance does not guarantee future results. Currentperformance may be lower or higher than the performance quoted. For performance data current to the most recent month end,please call 1-877-778-2100. These performance results represent the change in net asset value of an investment over a statedperiod, assuming the reinvestment of dividends and capital gain distributions. Prospectus: Investors should consider the contract and the underlying portfolio's investment objectives, risks, and charges and expenses carefully before investing.The contract's prospectus and the underlying portfolio prospectus contain information relating to investment objectives, risks, and charges and expenses. For morecomplete information about the investment options available through your account please call 1-800-992-4472 for a free prospectus that contains this and other infor-mation. Please read the prospectus carefully before investing. It is possible to lose money investing in securities.
Market Timing: Frequent exchanging of investment options may harm long-term investors. Your plan and/or the fund have policies to detect and deter exchangesthat may be abusive. Those policies may require us to modify or suspend purchase or exchange privileges and impose redemption fees.
Guarantees are based on the claims-paying ability of the issuing company and are subject to certain limitations terms and conditions. To maintain the IncomeFlex ben-efit, you must invest in one or more underlying funds offered as investment options under the Annuity. Guarantees do not apply to the investment return or principalvalue of the separate account or underlying fund. Like all variable investments, these underlying funds may lose value. Withdrawals in excess of the guaranteed life-time income amount will reduce future guaranteed withdrawals proportionately.
The Annuity is a variable annuity issued by Prudential Retirement Insurance and Annuity Company ("PRIAC"), Hartford, CT and offered by Prudential InvestmentManagement Services LLC, both are Prudential Financial companies. A variable annuity is suitable for long-term investing, particularly retirement savings. Eligibleinvestors may purchase the Annuity through a Prudential SmartSolution IRA. Annuity contracts contain exclusions, limitations, reductions of benefits and terms for keep-ing them in force. Your licensed financial professional can provide you with cost and complete details. The Annuity or certain of its investment options or features maynot be available in all states. Contract form # ALC-408-IFGW-2006 or state variation thereof.
Investment advisory services are provided by Global Portfolio Strategies, Inc., a registered investment advisor and Prudential Financial Company.
Tax deferral is generally provided by an Individual Retirement Account and employment based retirement plans. A variable annuity contract should be used to fund atax favored retirement plan to benefit from the annuity’s features other than tax deferral, including lifetime income payout option, the death benefit protection, andthe ability to transfer among investment options without sales or withdrawal charges.
Benchmark performance including the index is unmanaged and cannot be invested in directly. See User Guide for Benchmark definitions.
SECURITIES PRODUCTS ARE NOT FDIC INSURED/NOT BANK GUARANTEED/MAY LOSE VALUE.
Prudential, the Prudential logo, and the Rock symbol are service marks of The Prudential Insurance Company of America, Newark, NJ, and its related entities, registered in many jurisdictions worldwide.
CUMULATIVE RETURNS AVERAGE ANNUAL TOTAL RETURNS
Quarter YTD 1 Year 3 Year 5 Year 10 Year Since Inception
Prudential Retirement Security AnnuityPrudential Retirement Security Annuity II Prudential IncomeFlex® Select sm AST Capital Growth Asset Allocation Portfolio
Key Facts – Portfolio
Investor Risk Profile
Third Quarter 2010 Fund Fact Sheet
ASTCGA AS5-DC/310
Performance (%) As of 9/30/2010
OBJECTIVE/DESCRIPTION
This Portfolio is one of a series of AST Asset Allocation Portfolios available as a variable investment option underPrudential Retirement Security Annuity and Prudential Retirement Security Annuity II (each, the Annuity). TheAnnuity is a variable annuity that features Prudential IncomeFlex® Selectsm, a guaranteed minimum withdrawal benefit included for an additional fee. The Annuity also imposes insurance and administrative charges. For moredetails about IncomeFlex® Selectsm and other features and charges of the Annuity, please refer to the productprospectus.
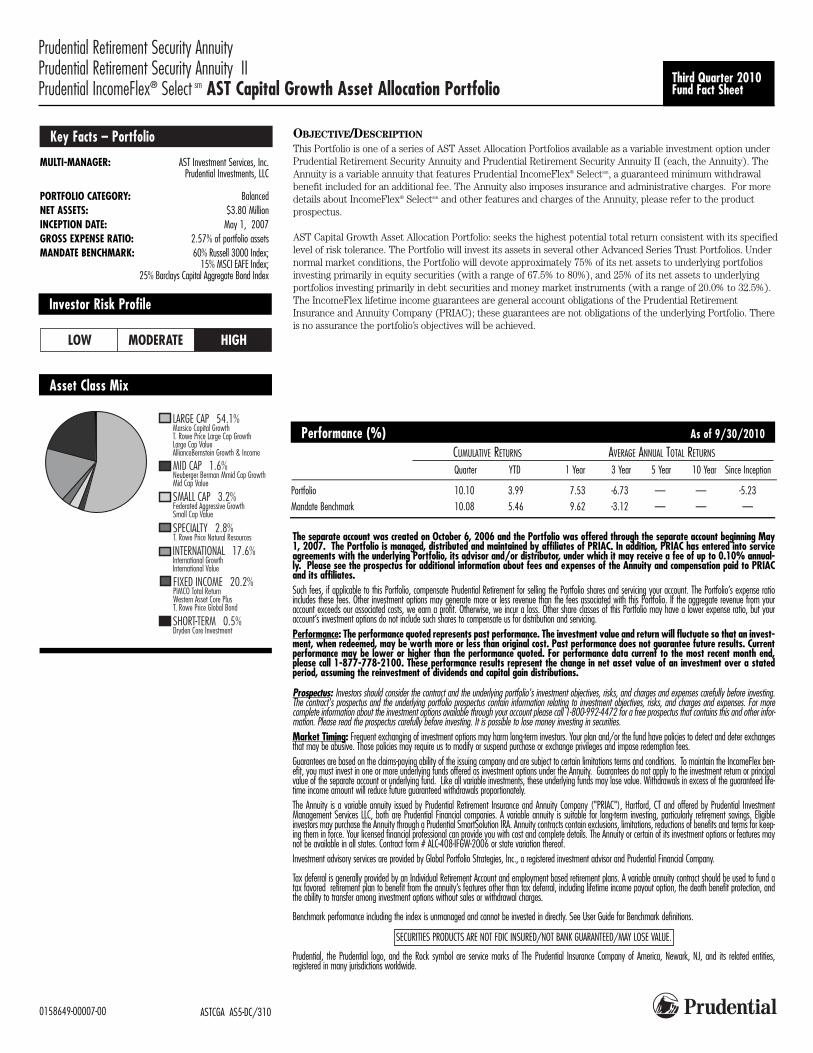
AST Capital Growth Asset Allocation Portfolio: seeks the highest potential total return consistent with its specifiedlevel of risk tolerance. The Portfolio will invest its assets in several other Advanced Series Trust Portfolios. Undernormal market conditions, the Portfolio will devote approximately 75% of its net assets to underlying portfoliosinvesting primarily in equity securities (with a range of 67.5% to 80%), and 25% of its net assets to underlyingportfolios investing primarily in debt securities and money market instruments (with a range of 20.0% to 32.5%).The IncomeFlex lifetime income guarantees are general account obligations of the Prudential RetirementInsurance and Annuity Company (PRIAC); these guarantees are not obligations of the underlying Portfolio. Thereis no assurance the portfolio’s objectives will be achieved.
Portfolio 10.10 3.99 7.53 -6.73 — — -5.23
Mandate Benchmark 10.08 5.46 9.62 -3.12 — — —
MULTI-MANAGER: AST Investment Services, Inc.Prudential Investments, LLC
PORTFOLIO CATEGORY: BalancedNET ASSETS: $3.80 MillionINCEPTION DATE: May 1, 2007GROSS EXPENSE RATIO: 2.57% of portfolio assetsMANDATE BENCHMARK: 60% Russell 3000 Index;
15% MSCI EAFE Index;25% Barclays Capital Aggregate Bond Index
SPECIALTY 2.8%T. Rowe Price Natural Resources
SHORT-TERM 0.5%Dryden Core Investment
LARGE CAP 54.1%Marsico Capital Growth T. Rowe Price Large Cap Growth Large Cap Value AllianceBernstein Growth & Income
SMALL CAP 3.2%Federated Aggressive Growth Small Cap Value
MID CAP 1.6%Neuberger Berman Mmid Cap GrowthMid Cap Value
FIXED INCOME 20.2%PIMCO Total Return Western Asset Core PlusT. Rowe Price Global Bond
INTERNATIONAL 17.6%International Growth International Value
Asset Class Mix
0158649-00007-00
The separate account was created on October 6, 2006 and the Portfolio was offered through the separate account beginning May1, 2007. The Portfolio is managed, distributed and maintained by affiliates of PRIAC. In addition, PRIAC has entered into serviceagreements with the underlying Portfolio, its advisor and/or distributor, under which it may receive a fee of up to 0.10% annual-ly. Please see the prospectus for additional information about fees and expenses of the Annuity and compensation paid to PRIACand its affiliates. Such fees, if applicable to this Portfolio, compensate Prudential Retirement for selling the Portfolio shares and servicing your account. The Portfolio’s expense ratioincludes these fees. Other investment options may generate more or less revenue than the fees associated with this Portfolio. If the aggregate revenue from youraccount exceeds our associated costs, we earn a profit. Otherwise, we incur a loss. Other share classes of this Portfolio may have a lower expense ratio, but youraccount’s investment options do not include such shares to compensate us for distribution and servicing.Performance: The performance quoted represents past performance. The investment value and return will fluctuate so that an invest-ment, when redeemed, may be worth more or less than original cost. Past performance does not guarantee future results. Currentperformance may be lower or higher than the performance quoted. For performance data current to the most recent month end,please call 1-877-778-2100. These performance results represent the change in net asset value of an investment over a statedperiod, assuming the reinvestment of dividends and capital gain distributions.
Prospectus: Investors should consider the contract and the underlying portfolio's investment objectives, risks, and charges and expenses carefully before investing.The contract's prospectus and the underlying portfolio prospectus contain information relating to investment objectives, risks, and charges and expenses. For morecomplete information about the investment options available through your account please call 1-800-992-4472 for a free prospectus that contains this and other infor-mation. Please read the prospectus carefully before investing. It is possible to lose money investing in securities. Market Timing: Frequent exchanging of investment options may harm long-term investors. Your plan and/or the fund have policies to detect and deter exchangesthat may be abusive. Those policies may require us to modify or suspend purchase or exchange privileges and impose redemption fees.Guarantees are based on the claims-paying ability of the issuing company and are subject to certain limitations terms and conditions. To maintain the IncomeFlex ben-efit, you must invest in one or more underlying funds offered as investment options under the Annuity. Guarantees do not apply to the investment return or principalvalue of the separate account or underlying fund. Like all variable investments, these underlying funds may lose value. Withdrawals in excess of the guaranteed life-time income amount will reduce future guaranteed withdrawals proportionately. The Annuity is a variable annuity issued by Prudential Retirement Insurance and Annuity Company ("PRIAC"), Hartford, CT and offered by Prudential InvestmentManagement Services LLC, both are Prudential Financial companies. A variable annuity is suitable for long-term investing, particularly retirement savings. Eligibleinvestors may purchase the Annuity through a Prudential SmartSolution IRA. Annuity contracts contain exclusions, limitations, reductions of benefits and terms for keep-ing them in force. Your licensed financial professional can provide you with cost and complete details. The Annuity or certain of its investment options or features maynot be available in all states. Contract form # ALC-408-IFGW-2006 or state variation thereof. Investment advisory services are provided by Global Portfolio Strategies, Inc., a registered investment advisor and Prudential Financial Company.
Tax deferral is generally provided by an Individual Retirement Account and employment based retirement plans. A variable annuity contract should be used to fund atax favored retirement plan to benefit from the annuity’s features other than tax deferral, including lifetime income payout option, the death benefit protection, andthe ability to transfer among investment options without sales or withdrawal charges.
Benchmark performance including the index is unmanaged and cannot be invested in directly. See User Guide for Benchmark definitions.
SECURITIES PRODUCTS ARE NOT FDIC INSURED/NOT BANK GUARANTEED/MAY LOSE VALUE.
Prudential, the Prudential logo, and the Rock symbol are service marks of The Prudential Insurance Company of America, Newark, NJ, and its related entities, registered in many jurisdictions worldwide.
CUMULATIVE RETURNS AVERAGE ANNUAL TOTAL RETURNS
Quarter YTD 1 Year 3 Year 5 Year 10 Year Since Inception
0159780-00006-00
Third Quarter 2010 Fund Fact Sheet
Target Total Return Bond Fund R Sub-Advised by Pacific Investment Management Company (PIMCO) Key Facts INVESTMENT ADVISOR: Prudential Investments
LLCFUND CATEGORY: Intermediate-Term BondINDEX: BarCap US Govt/Credit 5-
10 Yr TR USD®NET ASSETS: $101.0 MillionINCEPTION DATE: 1/5/1993TICKER SYMBOL: TTBRXGROSS EXPENSE RATIO: 1.57%PORTFOLIO MANAGER: Chris P. Dialynas
Investor Risk Profile
Morningstar Style BoxTM
Results of $10,000 Investment*
0
5,000
10,000
15,000
06 07 08 09 10
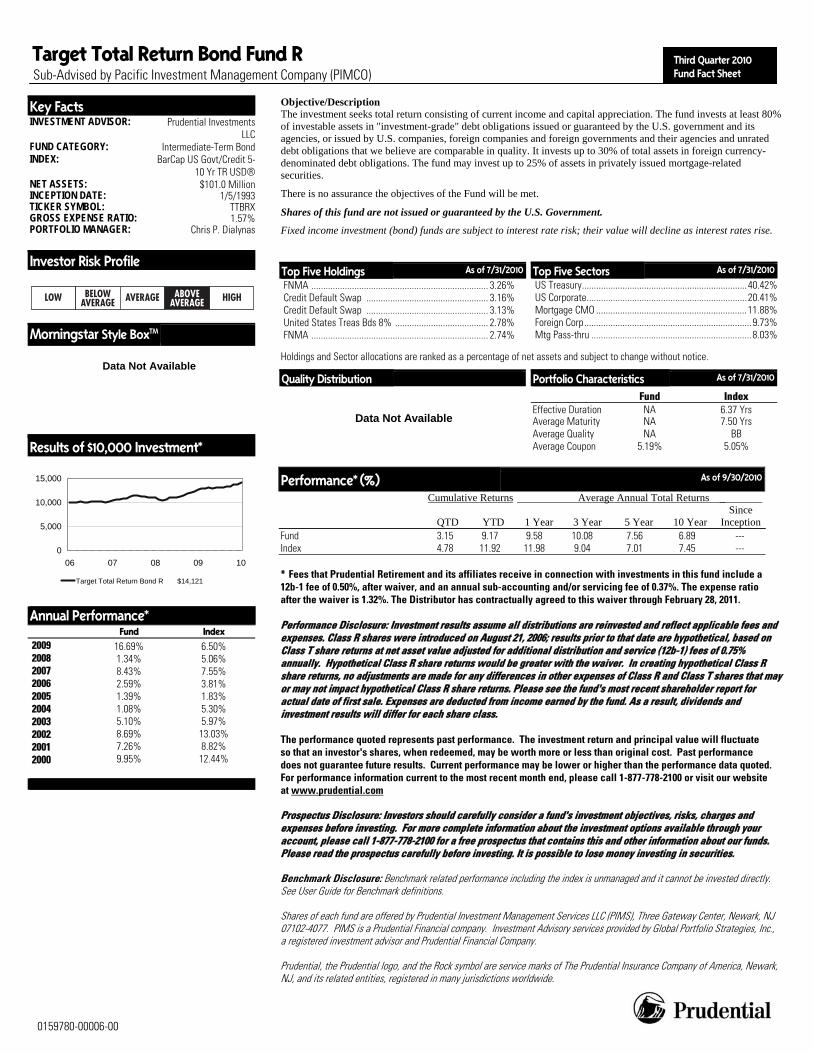
Target Total Return Bond R $14,121
Annual Performance* Fund Index 2009 2008 2007 2006 2005 2004 2003 2002 2001 2000
16.69% 1.34% 8.43% 2.59% 1.39% 1.08% 5.10% 8.69% 7.26% 9.95%
6.50% 5.06% 7.55% 3.81% 1.83% 5.30% 5.97%
13.03% 8.82%
12.44%
Objective/Description The investment seeks total return consisting of current income and capital appreciation. The fund invests at least 80% of investable assets in "investment-grade" debt obligations issued or guaranteed by the U.S. government and its agencies, or issued by U.S. companies, foreign companies and foreign governments and their agencies and unrated debt obligations that we believe are comparable in quality. It invests up to 30% of total assets in foreign currency-denominated debt obligations. The fund may invest up to 25% of assets in privately issued mortgage-related securities.
There is no assurance the objectives of the Fund will be met.
Shares of this fund are not issued or guaranteed by the U.S. Government.
Fixed income investment (bond) funds are subject to interest rate risk; their value will decline as interest rates rise.
Performance* (%) As of 9/30/2010
Cumulative Returns Average Annual Total Returns _
QTD YTD 1 Year 3 Year 5 Year 10 Year Since
InceptionFund 3.15 9.17 9.58 10.08 7.56 6.89 --- Index 4.78 11.92 11.98 9.04 7.01 7.45 --- * Fees that Prudential Retirement and its affiliates receive in connection with investments in this fund include a 12b-1 fee of 0.50%, after waiver, and an annual sub-accounting and/or servicing fee of 0.37%. The expense ratio after the waiver is 1.32%. The Distributor has contractually agreed to this waiver through February 28, 2011. Performance Disclosure: Investment results assume all distributions are reinvested and reflect applicable fees and expenses. Class R shares were introduced on August 21, 2006; results prior to that date are hypothetical, based on Class T share returns at net asset value adjusted for additional distribution and service (12b-1) fees of 0.75% annually. Hypothetical Class R share returns would be greater with the waiver. In creating hypothetical Class R share returns, no adjustments are made for any differences in other expenses of Class R and Class T shares that may or may not impact hypothetical Class R share returns. Please see the fund's most recent shareholder report for actual date of first sale. Expenses are deducted from income earned by the fund. As a result, dividends and investment results will differ for each share class. The performance quoted represents past performance. The investment return and principal value will fluctuate so that an investor's shares, when redeemed, may be worth more or less than original cost. Past performance does not guarantee future results. Current performance may be lower or higher than the performance data quoted. For performance information current to the most recent month end, please call 1-877-778-2100 or visit our website at www.prudential.com Prospectus Disclosure: Investors should carefully consider a fund's investment objectives, risks, charges and expenses before investing. For more complete information about the investment options available through your account, please call 1-877-778-2100 for a free prospectus that contains this and other information about our funds. Please read the prospectus carefully before investing. It is possible to lose money investing in securities. Benchmark Disclosure: Benchmark related performance including the index is unmanaged and it cannot be invested directly. See User Guide for Benchmark definitions. Shares of each fund are offered by Prudential Investment Management Services LLC (PIMS), Three Gateway Center, Newark, NJ 07102-4077. PIMS is a Prudential Financial company. Investment Advisory services provided by Global Portfolio Strategies, Inc., a registered investment advisor and Prudential Financial Company. Prudential, the Prudential logo, and the Rock symbol are service marks of The Prudential Insurance Company of America, Newark, NJ, and its related entities, registered in many jurisdictions worldwide.
Data Not Available
Top Five Holdings As of 7/31/2010
FNMA .......................................................................... 3.26% Credit Default Swap ................................................... 3.16% Credit Default Swap ................................................... 3.13% United States Treas Bds 8% ....................................... 2.78% FNMA .......................................................................... 2.74%
Top Five Sectors As of 7/31/2010
US Treasury ..................................................................... 40.42% US Corporate ................................................................... 20.41% Mortgage CMO ............................................................... 11.88%Foreign Corp ......................................................................9.73%
Mtg Pass-thru ................................................................... 8.03%
Quality Distribution
Data Not Available
Portfolio Characteristics As of 7/31/2010
Fund Index Effective Duration NA 6.37 YrsAverage Maturity NA 7.50 Yrs Average Quality NA BB Average Coupon 5.19% 5.05%
Holdings and Sector allocations are ranked as a percentage of net assets and subject to change without notice.

0158680-00006-00
Third Quarter 2010 Fund Fact Sheet Prudential Government Income R
Key Facts INVESTMENT ADVISOR: Prudential Investments
LLCFUND CATEGORY: Intermediate GovernmentINDEX: BarCap US Government
TR USD®NET ASSETS: $6.1 MillionINCEPTION DATE: 5/17/2004TICKER SYMBOL: JDRVXGROSS EXPENSE RATIO: 1.41%PORTFOLIO MANAGERS: Craig Dewling
Robert Tipp, CFARichard Piccirillo
Investor Risk Profile
Morningstar Style BoxTM As of 9/30/2010
The vertical axis represents the Fund's average credit quality as measured by Standard & Poor's rating service.
High >= AA Medium <AA and >=BBB Low <BBB
The horizontal axis represents the Fund's sensitivity to interest rates as measured by the average effective duration:
Ltd <=3.5 Yrs Mod > 3.5 Yrs and <=6 Yrs Ext > 6 Yrs
Results of $10,000 Investment*
0
5,000
10,000
15,000
04 05 06 07 08 09 10
Prudential Government Income R $13,618
Annual Performance* Fund Index 2009 2008 2007 2006 2005 2004 2003 2002 2001 2000
7.61% 3.17% 5.06% 2.91% 1.80% 2.49% 1.44% 9.60% 7.14% 10.98%
-2.20% 12.39% 8.66% 3.48% 2.65% 3.48% 2.36%
11.50% 7.23%
13.24%
Objective/Description The investment seeks current income. The fund invests at least 80% of assets in U.S. government securities, including U.S. treasury bills, notes, bonds, strips and other debt securities issued by the U.S. treasury, and obligations, including mortgage-related securities, issued or guaranteed by U.S. government agencies or instrumentalities. It normally invests up to 20% of assets in money market instruments, including commercial paper of U.S. companies, short-term obligations of banks, certificates of deposit, and banker's acceptances. The fund may invest in foreign bankdebt. There is no assurance that the objectives of the Fund will be met. Shares of this fund are not issued or guaranteed by the U.S. Government. Fixed income investment (bond) funds are subject to interest rate risk; their value will decline as interest rates rise. The guarantee on U.S. Government securities applies only to the underlying securities of the Fund’s portfolio and not to the value of the fund’s shares.
Performance*\(%) As of 9/30/2010
Cumulative Returns Average Annual Total Returns _
QTD YTD 1 Year 3 Year 5 Year 10 Year Since
InceptionFund 2.09 7.73 8.36 6.76 5.32 5.31 --- Index 2.52 8.05 6.97 7.20 6.10 6.19 --- * Fees that Prudential Retirement and its affiliates receive in connection with investments in this fund include a 12b-1 fee of 0.50%, after waiver, and an annual sub-accounting and/or servicing fee of 0.13%. The expense ratio after the waiver is 1.16%. The Distributor has contractually agreed to this waiver through June 30, 2011. Past performance does not guarantee future results. Current performance may be lower or higher than the performance data quoted. The performance quoted represents past performance. The investment return and principal value will fluctuate so that an investor's shares, when redeemed, may be worth more or less than original cost. Past performance does not guarantee future results. Current performance may be lower or higher than the performance data quoted. For performance information current to the most recent month end, please call 1-877-778-2100 or visit our website at www.prudential.com Performance Disclosure: Investment results assume all distributions are reinvested and reflect applicable fees and expenses. Class R shares were introduced on May 17, 2004; results prior to that date are hypothetical, based on Class A share returns at net asset value adjusted for additional distribution and service (12b-1) fees of 0.75% annually. Hypothetical waiver. In creating hypothetical Class R share returns, no adjustments are made for any differences in other expenses of Class R and Class A shares that may or may not impact hypothetical Class R share returns. Please see the fund's most recent shareholder report for actual date of first sale. Expenses are deducted from income earned by the fund. As a result, dividends and investment results will differ for each share class. Prospectus Disclosure: Investors should carefully consider a fund's investment objectives, risks, charges and expenses before investing. For more complete information about the investment options available through your account, please call 1-877-778-2100 for a free prospectus that contains this and other information about our funds. Please read the prospectus carefully before investing. It is possible to lose money investing in securities. Benchmark Disclosure: Benchmark related performance including the index is unmanaged and it cannot be invested directly. See User Guide for Benchmark definitions. Shares of each fund are offered by Prudential Investment Management Services LLC (PIMS), Three Gateway Center, Newark, NJ 07102-4077. PIMS is a Prudential Financial company. Investment Advisory services provided by Global Portfolio Strategies, Inc., a registered investment advisor and Prudential Financial Company. Prudential, the Prudential logo, and the Rock symbol are service marks of The Prudential Insurance Company of America, Newark, NJ, and its related entities, registered in many jurisdictions worldwide.
Top Five Holdings As of 8/31/2010
Prudential Core Short Corp Bond .............................. 12.54% Dryden Core Invest ...................................................... 5.34% US Treasury Note 0.375% .......................................... 5.05% FNMA .......................................................................... 5.00% FNMA .......................................................................... 4.92%
Top Five Sectors As of 8/31/2010
Mtg Pass-thru ................................................................. 24.60% US Agency ....................................................................... 24.52% Mortgage CMO ............................................................... 24.45%US Treasury .....................................................................16.53%
Asset-Backed .................................................................... 5.15%
Quality Distribution As of 8/31/2010
AAA 84.36%
AA 15.5%
A 0.14%
Portfolio Characteristics As of 8/31/2010
Fund Index Effective Duration 3.46 Yrs NAAverage Maturity NA NA Average Quality AAA NA Average Coupon 4.52% NA
Holdings and Sector allocations are ranked as a percentage of net assets and subject to change without notice.
0158684-00008-00
Third Quarter 2010 Fund Fact Sheet Prudential High-Yield R
Key Facts INVESTMENT ADVISOR: Prudential Investments
LLCFUND CATEGORY: High Yield BondINDEX: BofAML US HY Master II
TR USD®NET ASSETS: $11.4 MillionINCEPTION DATE: 6/3/2005TICKER SYMBOL: JDYRXGROSS EXPENSE RATIO: 1.41%PORTFOLIO MANAGERS: Stephen Haeckel
Terrence Wheat, CFARobert Spano, CFAPaul Appleby, CFA
Michael J. Collins, CFA
Investor Risk Profile
Morningstar Style BoxTM As of 9/30/2010
The vertical axis represents the Fund's average credit quality as measured by Standard & Poor's rating service.
High >= AA Medium <AA and >=BBB Low <BBB
The horizontal axis represents the Fund's sensitivity to interest rates as measured by the average effective duration:
Ltd <=3.5 Yrs Mod > 3.5 Yrs and <=6 Yrs Ext > 6 Yrs
Results of $10,000 Investment*
0
5,000
10,000
15,000
05 06 07 08 09 10
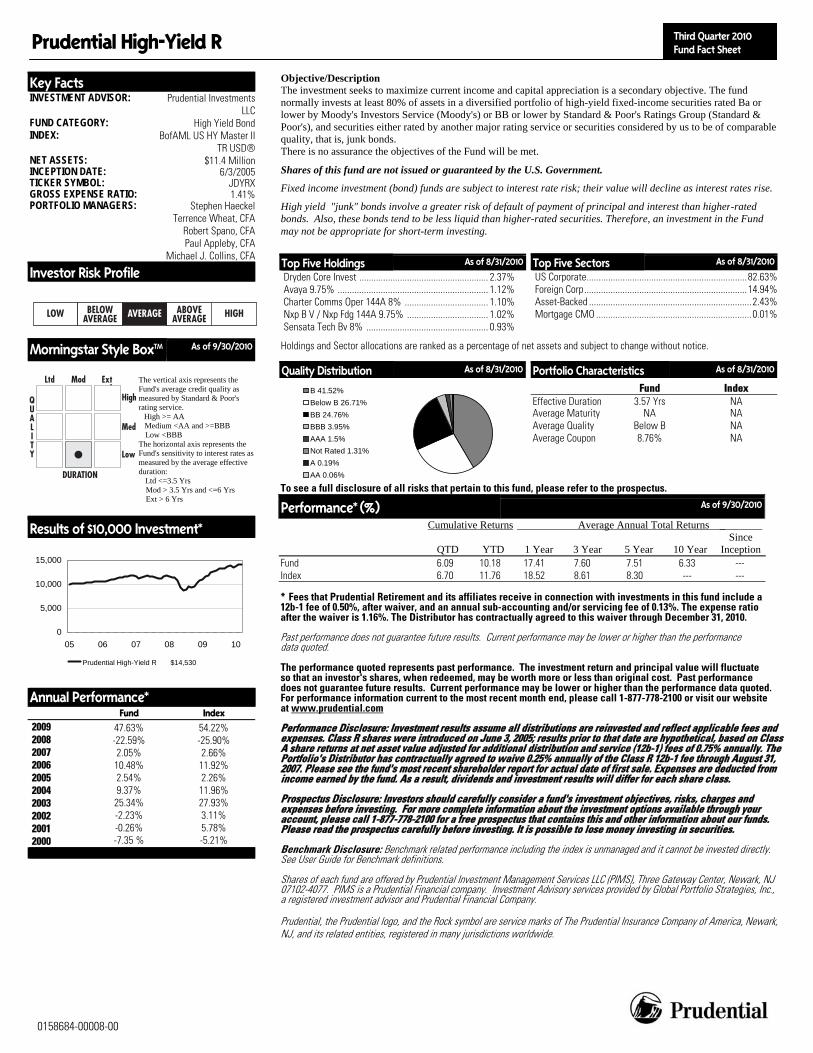
Prudential High-Yield R $14,530
Annual Performance* Fund Index 2009 2008 2007 2006 2005 2004 2003 2002 2001 2000
47.63% -22.59% 2.05% 10.48% 2.54% 9.37% 25.34% -2.23% -0.26% -7.35 %
54.22% -25.90% 2.66%
11.92% 2.26%
11.96% 27.93% 3.11% 5.78% -5.21%
Objective/Description The investment seeks to maximize current income and capital appreciation is a secondary objective. The fund normally invests at least 80% of assets in a diversified portfolio of high-yield fixed-income securities rated Ba or lower by Moody's Investors Service (Moody's) or BB or lower by Standard & Poor's Ratings Group (Standard & Poor's), and securities either rated by another major rating service or securities considered by us to be of comparable quality, that is, junk bonds. There is no assurance the objectives of the Fund will be met.
Shares of this fund are not issued or guaranteed by the U.S. Government.
Fixed income investment (bond) funds are subject to interest rate risk; their value will decline as interest rates rise.
High yield "junk" bonds involve a greater risk of default of payment of principal and interest than higher-rated bonds. Also, these bonds tend to be less liquid than higher-rated securities. Therefore, an investment in the Fund may not be appropriate for short-term investing.
To see a full disclosure of all risks that pertain to this fund, please refer to the prospectus.
Performance* (%) As of 9/30/2010
Cumulative Returns Average Annual Total Returns _
QTD YTD 1 Year 3 Year 5 Year 10 Year Since
InceptionFund 6.09 10.18 17.41 7.60 7.51 6.33 --- Index 6.70 11.76 18.52 8.61 8.30 --- --- * Fees that Prudential Retirement and its affiliates receive in connection with investments in this fund include a 12b-1 fee of 0.50%, after waiver, and an annual sub-accounting and/or servicing fee of 0.13%. The expense ratio after the waiver is 1.16%. The Distributor has contractually agreed to this waiver through December 31, 2010. Past performance does not guarantee future results. Current performance may be lower or higher than the performance data quoted. The performance quoted represents past performance. The investment return and principal value will fluctuate so that an investor's shares, when redeemed, may be worth more or less than original cost. Past performance does not guarantee future results. Current performance may be lower or higher than the performance data quoted. For performance information current to the most recent month end, please call 1-877-778-2100 or visit our website at www.prudential.com Performance Disclosure: Investment results assume all distributions are reinvested and reflect applicable fees and expenses. Class R shares were introduced on June 3, 2005; results prior to that date are hypothetical, based on Class A share returns at net asset value adjusted for additional distribution and service (12b-1) fees of 0.75% annually. The Portfolio's Distributor has contractually agreed to waive 0.25% annually of the Class R 12b-1 fee through August 31, 2007. Please see the fund's most recent shareholder report for actual date of first sale. Expenses are deducted from income earned by the fund. As a result, dividends and investment results will differ for each share class. Prospectus Disclosure: Investors should carefully consider a fund's investment objectives, risks, charges and expenses before investing. For more complete information about the investment options available through your account, please call 1-877-778-2100 for a free prospectus that contains this and other information about our funds. Please read the prospectus carefully before investing. It is possible to lose money investing in securities. Benchmark Disclosure: Benchmark related performance including the index is unmanaged and it cannot be invested directly. See User Guide for Benchmark definitions. Shares of each fund are offered by Prudential Investment Management Services LLC (PIMS), Three Gateway Center, Newark, NJ 07102-4077. PIMS is a Prudential Financial company. Investment Advisory services provided by Global Portfolio Strategies, Inc., a registered investment advisor and Prudential Financial Company. Prudential, the Prudential logo, and the Rock symbol are service marks of The Prudential Insurance Company of America, Newark, NJ, and its related entities, registered in many jurisdictions worldwide.
Top Five Holdings As of 8/31/2010
Dryden Core Invest ...................................................... 2.37% Avaya 9.75% ............................................................... 1.12% Charter Comms Oper 144A 8% ................................... 1.10% Nxp B V / Nxp Fdg 144A 9.75% .................................. 1.02% Sensata Tech Bv 8% ................................................... 0.93%
Top Five Sectors As of 8/31/2010
US Corporate ................................................................... 82.63%Foreign Corp ....................................................................14.94%
Asset-Backed .................................................................... 2.43% Mortgage CMO ................................................................. 0.01%
Quality Distribution As of 8/31/2010
B 41.52%Below B 26.71%BB 24.76%BBB 3.95%AAA 1.5%Not Rated 1.31%A 0.19%AA 0.06%
Portfolio Characteristics As of 8/31/2010
Fund Index Effective Duration 3.57 Yrs NAAverage Maturity NA NA Average Quality Below B NA Average Coupon 8.76% NA
Holdings and Sector allocations are ranked as a percentage of net assets and subject to change without notice.

0158705-00008-00
Third Quarter 2010 Fund Fact Sheet
Target Large Cap Growth Fund R Co-Investment Advisors: Marsico Capital, and Goldman Sachs Asset Management Key Facts INVESTMENT ADVISOR: Prudential Investments LLCFUND CATEGORY: Large GrowthINDEX: Russell 1000 Growth®NET ASSETS: $93.0 MillionINCEPTION DATE: 1/5/1993TICKER SYMBOL: TLCRXSHARE CLASS: RGROSS EXPENSE RATIO: 1.61%PORTFOLIO MANAGERS: Thomas F. Marsico
A. Douglas RaoStephen Pesek, CFA
Investor Risk Profile
Morningstar Style BoxTM As of 9/30/2010
Domestic equity funds are placed in a category based on the style and size of the stocks they typically own. The style and size parameters are based on the divisions used in the investment style box: Value, Blend, or Growth style and Small, Medium, or Large geometric average market capitalization.
Results of $10,000 Investment*
0
5,000
10,000
15,000
06 07 08 09 10
Target Large Capitalization Growth R $9,324
Annual Performance* Fund Index 2009 2008 2007 2006 2005 2004 2003 2002 2001 2000
27.34% -40.21% 8.58% 7.78% 5.95% 3.00% 38.49% -32.21% -30.84% -4.09%
37.21% -38.44% 11.81% 9.07% 5.26% 6.30%
29.75% -27.88% -20.42% -22.42%
Objective/Description The investment seeks long-term capital appreciation. The fund normally invests at least 80% of investable assets in common stocks of large companies which have market capitalization like those in the Russell 1000 index. It purchases stocks of large companies that the Portfolio believes will experience earnings growth at a rate faster than that of the S&P 500 index. The fund invests primarily in common stocks of U.S. companies, but it may also invest in foreign companies, including companies in emerging market countries. It can invest in ADRs, ADSs, GDRs and EDRs as well. There is no assurance that the objectives of the Fund will be met.
Performance* (%) As of 9/30/2010
Cumulative Returns Average Annual Total Returns
QTD YTD 1 Year 3 Year 5 Year 10 Year Since
InceptionFund 12.59 3.24 9.28 -8.21 -1.00 -6.40 --- Index 13.00 4.36 12.65 -4.36 2.06 -3.44 --- * Fees that Prudential Retirement and its affiliates receive in connection with investments in this fund include a 12b-1 fee of 0.50%, after waiver, and an annual sub-accounting and/or servicing fee of 0.42%. The expense ratio after the waiver is 1.52%. The Distributor has contractually agreed to this waiver through February 28, 2011. Performance Disclosure: Investment results assume all distributions are reinvested and reflect applicable fees and expenses. Class R shares were introduced on August 21, 2006; results prior to that date are hypothetical, based on Class T share returns at net asset value adjusted for additional distribution and service (12b-1) fees of 0.75% annually. Hypothetical Class R share returns would be greater with the waiver. In creating hypothetical Class R share returns, no adjustments are made for any differences in other expenses of Class R and Class T shares that may or may not impact hypothetical Class R share returns. Please see the fund's most recent shareholder report for actual date of first sale. Expenses are deducted from income earned by the fund. As a result, dividends and investment results will differ for each share class. The performance quoted represents past performance. The investment return and principal value will fluctuate so that an investor's shares, when redeemed, may be worth more or less than original cost. Past performance does not guarantee future results. Current performance may be lower or higher than the performance data quoted. For performance information current to the most recent month end, please call 1-877-778-2100 or visit our website at www.prudential.com Prospectus Disclosure: Investors should carefully consider a fund's investment objectives, risks, charges and expenses before investing. For more complete information about the investment options available through your account, please call 1-877-778-2100 for a free prospectus that contains this and other information about our funds. Please read the prospectus carefully before investing. It is possible to lose money investing in securities. Benchmark Disclosure: Benchmark related performance including the index is unmanaged and it cannot be invested directly. See User Guide for Benchmark definitions. Shares of each fund are offered by Prudential Investment Management Services LLC (PIMS), Three Gateway Center, Newark, NJ 07102-4077. PIMS is a Prudential Financial company. Investment Advisory services provided by Global Portfolio Strategies, Inc., a registered investment advisor and Prudential Financial Company. Prudential, the Prudential logo, and the Rock symbol are service marks of The Prudential Insurance Company of America, Newark, NJ, and its related entities, registered in many jurisdictions worldwide.
Top Five Holdings As of 7/31/2010
Apple, Inc. ................................................................... 6.56% Google, Inc. ................................................................. 3.16% Cisco Systems, Inc. ..................................................... 3.11% Prudential Core Invt .................................................... 3.01% McDonald's Corporation ............................................. 2.80%
Portfolio Allocation As of 7/31/2010
US Stocks 90.51%
Non-US Stocks 5.99%
Cash 3.01%
Preferred 0.49%
Top Five Sectors As of 7/31/2010
Industrial Materials ........................................................ 17.49% Hardware ........................................................................ 15.79% Financial Services ........................................................... 12.48% Consumer Services ......................................................... 12.43%Consumer Goods ...............................................................8.64%
Portfolio Characteristics As of 7/31/2010
Fund Index Weighted Geometric Market Cap. $41.74 $34.87 Price/Earnings Ratio (Forward) 16.43x 15.59x Price/Book Ratio 2.55x 3.26x Dividend Yield 0.31% NA 3-Year Earnings Growth Rate 11.56% 8.02%
Holdings and Sector allocations are ranked as a percentage of net assets and subject to change without notice.
0158702-00007-00
Third Quarter 2010 Fund Fact Sheet Prudential Jennison Growth R
Key Facts INVESTMENT ADVISOR: Prudential Investments LLCFUND CATEGORY: Large GrowthINDEX: Russell 1000 Growth®NET ASSETS: $9.0 MillionINCEPTION DATE: 12/17/2004TICKER SYMBOL: PJGRXSHARE CLASS: RetirementGROSS EXPENSE RATIO: 1.58%
PORTFOLIO MANAGERS: Spiros SegalasKathleen A. McCarragher
Michael A. Del Balso
Investor Risk Profile
Morningstar Style BoxTM As of 9/30/2010
Domestic equity funds are placed in a category based on the style and size of the stocks they typically own. The style and size parameters are based on the divisions used in the investment style box: Value, Blend, or Growth style and Small, Medium, or Large geometric average market capitalization.
Results of $10,000 Investment*
0
5,000
10,000
15,000
04 05 06 07 08 09
Prudential Jennison Growth R $11,302
Annual Performance* Fund Index 2009 2008 2007 2006 2005 2004 2003 2002 2001 2000
42.58% -37.93% 10.92% 1.61% 13.60% 8.32% 29.24% -31.50% -18.96% -18.34%
37.21% -38.44% 11.81% 9.07% 5.26% 6.30%
29.75% -27.88% -20.42% -22.42%
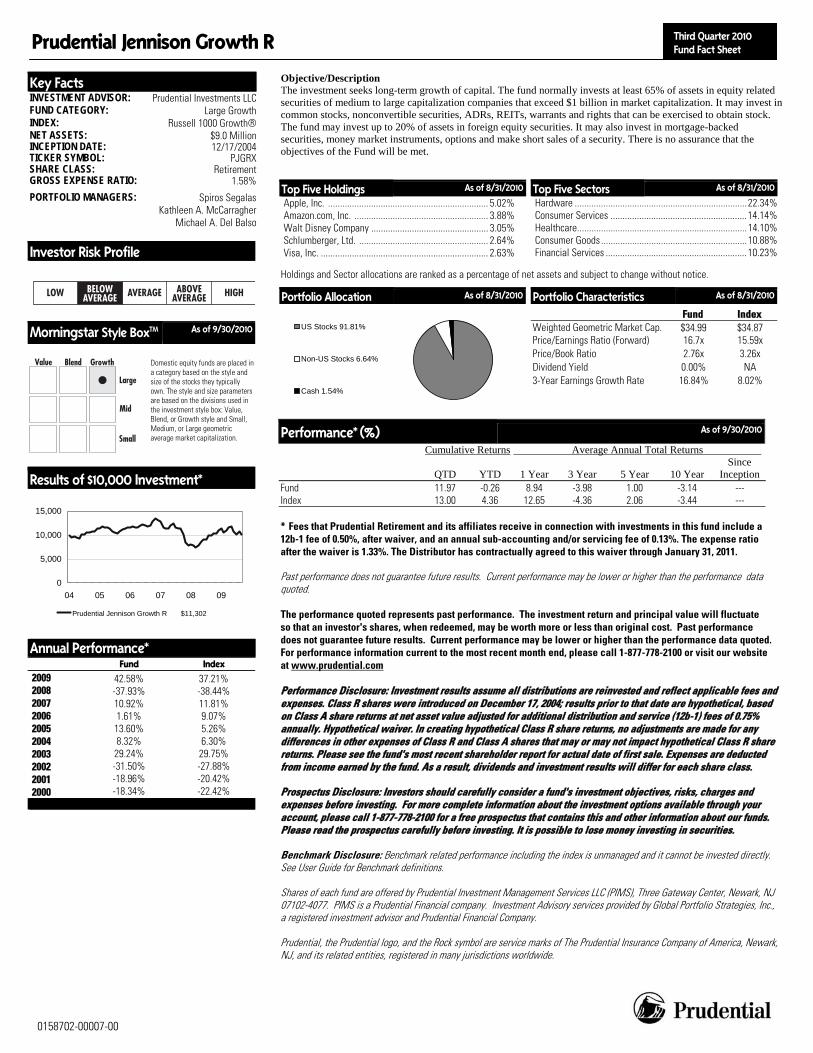
Objective/Description The investment seeks long-term growth of capital. The fund normally invests at least 65% of assets in equity related securities of medium to large capitalization companies that exceed $1 billion in market capitalization. It may invest in common stocks, nonconvertible securities, ADRs, REITs, warrants and rights that can be exercised to obtain stock. The fund may invest up to 20% of assets in foreign equity securities. It may also invest in mortgage-backed securities, money market instruments, options and make short sales of a security. There is no assurance that the objectives of the Fund will be met.
Performance* (%) As of 9/30/2010
Cumulative Returns Average Annual Total Returns
QTD YTD 1 Year 3 Year 5 Year 10 Year Since
InceptionFund 11.97 -0.26 8.94 -3.98 1.00 -3.14 --- Index 13.00 4.36 12.65 -4.36 2.06 -3.44 --- * Fees that Prudential Retirement and its affiliates receive in connection with investments in this fund include a 12b-1 fee of 0.50%, after waiver, and an annual sub-accounting and/or servicing fee of 0.13%. The expense ratio after the waiver is 1.33%. The Distributor has contractually agreed to this waiver through January 31, 2011. Past performance does not guarantee future results. Current performance may be lower or higher than the performance data quoted. The performance quoted represents past performance. The investment return and principal value will fluctuate so that an investor's shares, when redeemed, may be worth more or less than original cost. Past performance does not guarantee future results. Current performance may be lower or higher than the performance data quoted. For performance information current to the most recent month end, please call 1-877-778-2100 or visit our website at www.prudential.com Performance Disclosure: Investment results assume all distributions are reinvested and reflect applicable fees and expenses. Class R shares were introduced on December 17, 2004; results prior to that date are hypothetical, based on Class A share returns at net asset value adjusted for additional distribution and service (12b-1) fees of 0.75% annually. Hypothetical waiver. In creating hypothetical Class R share returns, no adjustments are made for any differences in other expenses of Class R and Class A shares that may or may not impact hypothetical Class R share returns. Please see the fund's most recent shareholder report for actual date of first sale. Expenses are deducted from income earned by the fund. As a result, dividends and investment results will differ for each share class. Prospectus Disclosure: Investors should carefully consider a fund's investment objectives, risks, charges and expenses before investing. For more complete information about the investment options available through your account, please call 1-877-778-2100 for a free prospectus that contains this and other information about our funds. Please read the prospectus carefully before investing. It is possible to lose money investing in securities. Benchmark Disclosure: Benchmark related performance including the index is unmanaged and it cannot be invested directly. See User Guide for Benchmark definitions. Shares of each fund are offered by Prudential Investment Management Services LLC (PIMS), Three Gateway Center, Newark, NJ 07102-4077. PIMS is a Prudential Financial company. Investment Advisory services provided by Global Portfolio Strategies, Inc., a registered investment advisor and Prudential Financial Company. Prudential, the Prudential logo, and the Rock symbol are service marks of The Prudential Insurance Company of America, Newark, NJ, and its related entities, registered in many jurisdictions worldwide.
Top Five Holdings As of 8/31/2010
Apple, Inc. ................................................................... 5.02% Amazon.com, Inc. ........................................................ 3.88% Walt Disney Company ................................................. 3.05% Schlumberger, Ltd. ...................................................... 2.64% Visa, Inc. ...................................................................... 2.63%
Portfolio Allocation As of 8/31/2010
US Stocks 91.81%
Non-US Stocks 6.64%
Cash 1.54%
Top Five Sectors As of 8/31/2010
Hardware ........................................................................ 22.34% Consumer Services ......................................................... 14.14% Healthcare ....................................................................... 14.10%Consumer Goods .............................................................10.88%
Financial Services ........................................................... 10.23%
Portfolio Characteristics As of 8/31/2010
Fund Index Weighted Geometric Market Cap. $34.99 $34.87 Price/Earnings Ratio (Forward) 16.7x 15.59x Price/Book Ratio 2.76x 3.26x Dividend Yield 0.00% NA 3-Year Earnings Growth Rate 16.84% 8.02%
Holdings and Sector allocations are ranked as a percentage of net assets and subject to change without notice.

0158703-00008-00
Third Quarter 2010 Fund Fact Sheet Prudential Stock Index A
Key Facts INVESTMENT ADVISOR: Prudential Investments LLCFUND CATEGORY: Large BlendINDEX: Russell 1000®NET ASSETS: $113.8 MillionINCEPTION DATE: 11/18/1999TICKER SYMBOL: PSIAXSHARE CLASS: AGROSS EXPENSE RATIO: 0.83%PORTFOLIO MANAGERS: John Moschberger, CFA
Wai Chiang
Investor Risk Profile
Morningstar Style BoxTM As of 9/30/2010
Domestic equity funds are placed in a category based on the style and size of the stocks they typically own. The style and size parameters are based on the divisions used in the investment style box: Value, Blend, or Growth style and Small, Medium, or Large geometric average market capitalization.
Results of $10,000 Investment*
0
5,000
10,000
15,000
99 00 01 02 03 04 05 06 07 08 09
Prudential Stock Index A $8,985
Annual Performance* Fund Index 2009 2008 2007 2006 2005 2004 2003 2002 2001 2000
25.85% -37.10% 5.00% 15.17% 4.28% 10.22% 27.93% -22.52% -12.39% -9.10%
28.43% -37.60% 5.77%
15.46% 6.27%
11.40% 29.89% -21.65% -12.45% -7.79%
Objective/Description The investment seeks to provide investment results that correspond to the price and yield performance of the Standard & Poor’s 500 Composite Stock Price index. The fund normally invests over 80% of assets in securities included in the S&P 500 index in approximately the same proportions as those of the index. There is no assurance the objectives of the Fund will be met.
Performance* (%) As of 9/30/2010
Cumulative Returns Average Annual Total Returns
QTD YTD 1 Year 3 Year 5 Year 10 Year Since
InceptionFund 11.09 3.47 9.68 -7.52 0.19 -0.91 NA Index 11.55 4.41 10.75 -6.79 0.86 -0.21 --- * Fees that Prudential Retirement and its affiliates receive in connection with investments in this fund include a 12b-1 fee of 0.25%, after waiver, and an annual sub-accounting and/or servicing fee of 0.13%. The expense ratio after the waiver is 0.61%. The Distributor has contractually agreed to this waiver through January 31, 2011. The performance quoted represents past performance. The investment return and principal value will fluctuate so that an investor's shares, when redeemed, may be worth more or less than original cost. For performance information current to the most recent month end, please call 1-877-778-2100 or visit our website at www.prudential.com. These performance results represent the change in net asset value of an investment over a stated period, assuming the reinvestment of dividends and capital gains distributions. The performance results shown do not reflect the deduction of the sales charge that may apply if the Fund shares were purchased outside of the plans or other programs. This waiver applies because the source of this money is from a retirement plan record kept by Prudential Retirement. If a sales charge were reflected, performance would be lower. This is the performance that best reflects your investment experience, as sales charges do not apply to your plan. Prospectus Disclosure: Investors should carefully consider a fund's investment objectives, risks, charges and expenses before investing. For more complete information about the investment options available through your account, please call 1-877-778-2100 for a free prospectus that contains this and other information about our funds. Please read the prospectus carefully before investing. It is possible to lose money investing in securities. Benchmark Disclosure: Benchmark related performance including the index is unmanaged and it cannot be invested directly. See User Guide for Benchmark definitions. Shares of each fund are offered by Prudential Investment Management Services LLC (PIMS), Three Gateway Center, Newark, NJ 07102-4077. PIMS is a Prudential Financial company. Investment Advisory services provided by Global Portfolio Strategies, Inc., a registered investment advisor and Prudential Financial Company. Prudential, the Prudential logo, and the Rock symbol are service marks of The Prudential Insurance Company of America, Newark, NJ, and its related entities, registered in many jurisdictions worldwide.
Top Five Holdings As of 8/31/2010
ExxonMobil Corporation .............................................. 3.13% Apple, Inc. ................................................................... 2.29% Microsoft Corporation ................................................. 1.86% Procter & Gamble Company ........................................ 1.77% AT&T, Inc. ................................................................... 1.67%
Portfolio Allocation As of 8/31/2010
US Stocks 97.72%
Cash 1.81%
Other 0.47%
Top Five Sectors As of 8/31/2010
Financial Services ........................................................... 16.36% Consumer Goods ............................................................. 11.72% Healthcare ....................................................................... 11.52%Industrial Materials ........................................................11.20%
Energy ............................................................................. 10.99%
Portfolio Characteristics As of 8/31/2010
Fund Index Weighted Geometric Market Cap. $41.46 $32.79 Price/Earnings Ratio (Forward) 12.89x 14.27x Price/Book Ratio 1.87x 2.01x Dividend Yield 1.52% NA 3-Year Earnings Growth Rate 1.9% 2.29%
Holdings and Sector allocations are ranked as a percentage of net assets and subject to change without notice.

0158689-00008-00
Third Quarter 2010 Fund Fact Sheet Prudential Jennison 20/20 Focus R
Key Facts INVESTMENT ADVISOR: Prudential Investments LLCFUND CATEGORY: Large GrowthINDEX: Russell 1000 Growth TR USD®NET ASSETS: $77.8 MillionINCEPTION DATE: 6/14/2004TICKER SYMBOL: JTWRXSHARE CLASS: RetirementGROSS EXPENSE RATIO: 1.65%PORTFOLIO MANAGERS: Spiros Segalas
David A. Kiefer, CFA
Investor Risk Profile
Morningstar Style BoxTM As of 9/30/2010
Domestic equity funds are placed in a category based on the style and size of the stocks they typically own. The style and size parameters are based on the divisions used in the investment style box: Value, Blend, or Growth style and Small, Medium, or Large geometric average market capitalization.
Results of $10,000 Investment*
0
5,000
10,000
15,000
20,000
04 05 06 07 08 09 10
Prudential Jennison 20/20 Focus R $15,033
Annual Performance* Fund Index 2009 2008 2007 2006 2005 2004 2003 2002 2001 2000
57.13% -39.97% 9.71% 14.06% 21.33% 16.17% 28.15% -22.95% -2.59% -8.68%
37.21% -37.60% 5.77%
15.46% 6.27%
11.40% 29.89% -21.65% -12.45% -7.79%
Objective/Description The investment seeks long-term growth of capital. The fund normally invests at least 80% of total assets in approximately 40 (which may range up to 45) equity and equity-related securities of companies that we believe have strong capital appreciation potential. Equity and equity-related securities in which the Fund primarily invests are common stocks, nonconvertible preferred stocks and convertible securities. It participates in the initial public offering (IPO) market. The fund may actively and frequently trade its portfolio securities. It is nondiversified. There is no assurance that the objectives of the Fund will be met.
Performance* (%) As of 9/30/2010
Cumulative Returns Average Annual Total Returns
QTD YTD 1 Year 3 Year 5 Year 10 Year Since
InceptionFund 11.66 -3.95 7.07 -3.69 3.25 4.11 --- Index 13.00 4.36 12.65 -4.36 2.06 -3.44 --- * Fees that Prudential Retirement and its affiliates receive in connection with investments in this fund include a 12b-1 fee of 0.75%, after waiver, and an annual sub-accounting and/or servicing fee of 0.17%. The expense ratio after the waiver is 1.40%. The Distributor has contractually agreed to this waiver through May 31, 2011. Past performance does not guarantee future results. Current performance may be lower or higher than the performance data quoted. The performance quoted represents past performance. The investment return and principal value will fluctuate so that an investor's shares, when redeemed, may be worth more or less than original cost. Past performance does not guarantee future results. Current performance may be lower or higher than the performance data quoted. For performance information current to the most recent month end, please call 1-877-778-2100 or visit our website at www.prudential.com Performance Disclosure: Investment results assume all distributions are reinvested and reflect applicable fees and expenses. Class R shares were introduced on June 14, 2004; results prior to that date are hypothetical, based on Class A share returns at net asset value adjusted for additional distribution and service (12b-1) fees of 0.75% annually. Hypothetical waiver. In creating hypothetical Class R share returns, no adjustments are made for any differences in other expenses of Class R and Class A shares that may or may not impact hypothetical Class R share returns. Please see the fund's most recent shareholder report for actual date of first sale. Expenses are deducted from income earned by the fund. As a result, dividends and investment results will differ for each share class. Prospectus Disclosure: Investors should carefully consider a fund's investment objectives, risks, charges and expenses before investing. For more complete information about the investment options available through your account, please call 1-877-778-2100 for a free prospectus that contains this and other information about our funds. Please read the prospectus carefully before investing. It is possible to lose money investing in securities. Benchmark Disclosure: Benchmark related performance including the index is unmanaged and it cannot be invested directly. See User Guide for Benchmark definitions. Shares of each fund are offered by Prudential Investment Management Services LLC (PIMS), Three Gateway Center, Newark, NJ 07102-4077. PIMS is a Prudential Financial company. Investment Advisory services provided by Global Portfolio Strategies, Inc., a registered investment advisor and Prudential Financial Company. Prudential, the Prudential logo, and the Rock symbol are service marks of The Prudential Insurance Company of America, Newark, NJ, and its related entities, registered in many jurisdictions worldwide.
Top Five Holdings As of 8/31/2010
Bunge, Ltd. .................................................................. 3.60% Newmont Mining Corporation .................................... 3.55% Apple, Inc. ................................................................... 3.49% Viacom, Inc. B ............................................................. 3.11% Kraft Foods, Inc. .......................................................... 3.07%
Portfolio Allocation As of 8/31/2010
US Stocks 90.58%
Non-US Stocks 6.61%
Cash 2.81%
Top Five Sectors As of 8/31/2010
Industrial Materials ........................................................ 15.92% Hardware ........................................................................ 15.18% Energy ............................................................................. 13.74%Consumer Goods .............................................................12.11%
Media ................................................................................ 8.60%
Portfolio Characteristics As of 8/31/2010
Fund Index Weighted Geometric Market Cap. $22.40 $34.87 Price/Earnings Ratio (Forward) 14.38x 15.59x Price/Book Ratio 2.15x 3.26x Dividend Yield 0.00% NA 3-Year Earnings Growth Rate 10.59% 8.02%
Holdings and Sector allocations are ranked as a percentage of net assets and subject to change without notice.
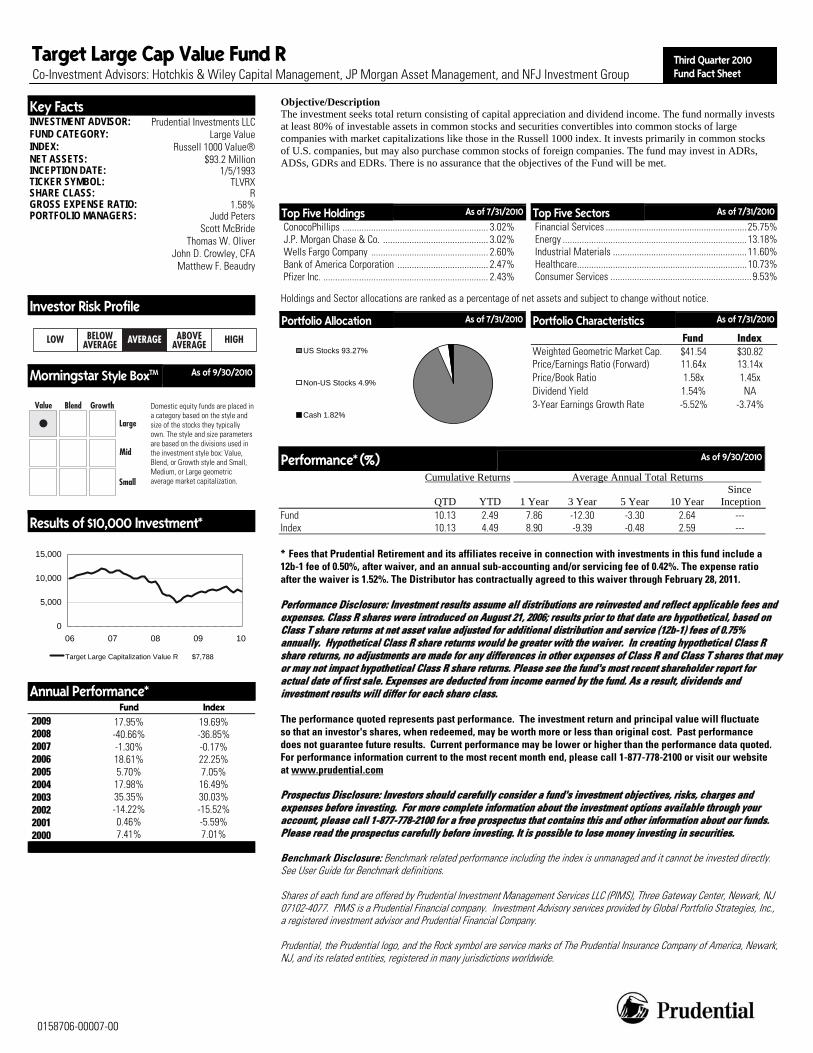
0158706-00007-00
Third Quarter 2010 Fund Fact Sheet
Target Large Cap Value Fund R Co-Investment Advisors: Hotchkis & Wiley Capital Management, JP Morgan Asset Management, and NFJ Investment Group Key Facts INVESTMENT ADVISOR: Prudential Investments LLCFUND CATEGORY: Large ValueINDEX: Russell 1000 Value®NET ASSETS: $93.2 MillionINCEPTION DATE: 1/5/1993TICKER SYMBOL: TLVRXSHARE CLASS: RGROSS EXPENSE RATIO: 1.58%PORTFOLIO MANAGERS: Judd Peters
Scott McBrideThomas W. Oliver
John D. Crowley, CFAMatthew F. Beaudry
Investor Risk Profile
Morningstar Style BoxTM As of 9/30/2010
Domestic equity funds are placed in a category based on the style and size of the stocks they typically own. The style and size parameters are based on the divisions used in the investment style box: Value, Blend, or Growth style and Small, Medium, or Large geometric average market capitalization.
Results of $10,000 Investment*
0
5,000
10,000
15,000
06 07 08 09 10
Target Large Capitalization Value R $7,788
Annual Performance* Fund Index 2009 2008 2007 2006 2005 2004 2003 2002 2001 2000
17.95% -40.66% -1.30% 18.61% 5.70% 17.98% 35.35% -14.22% 0.46% 7.41%
19.69% -36.85% -0.17% 22.25% 7.05%
16.49% 30.03% -15.52% -5.59% 7.01%
Objective/Description The investment seeks total return consisting of capital appreciation and dividend income. The fund normally invests at least 80% of investable assets in common stocks and securities convertibles into common stocks of large companies with market capitalizations like those in the Russell 1000 index. It invests primarily in common stocks of U.S. companies, but may also purchase common stocks of foreign companies. The fund may invest in ADRs, ADSs, GDRs and EDRs. There is no assurance that the objectives of the Fund will be met.
Performance* (%) As of 9/30/2010
Cumulative Returns Average Annual Total Returns
QTD YTD 1 Year 3 Year 5 Year 10 Year Since
InceptionFund 10.13 2.49 7.86 -12.30 -3.30 2.64 --- Index 10.13 4.49 8.90 -9.39 -0.48 2.59 --- * Fees that Prudential Retirement and its affiliates receive in connection with investments in this fund include a 12b-1 fee of 0.50%, after waiver, and an annual sub-accounting and/or servicing fee of 0.42%. The expense ratio after the waiver is 1.52%. The Distributor has contractually agreed to this waiver through February 28, 2011. Performance Disclosure: Investment results assume all distributions are reinvested and reflect applicable fees and expenses. Class R shares were introduced on August 21, 2006; results prior to that date are hypothetical, based on Class T share returns at net asset value adjusted for additional distribution and service (12b-1) fees of 0.75% annually. Hypothetical Class R share returns would be greater with the waiver. In creating hypothetical Class R share returns, no adjustments are made for any differences in other expenses of Class R and Class T shares that may or may not impact hypothetical Class R share returns. Please see the fund's most recent shareholder report for actual date of first sale. Expenses are deducted from income earned by the fund. As a result, dividends and investment results will differ for each share class. The performance quoted represents past performance. The investment return and principal value will fluctuate so that an investor's shares, when redeemed, may be worth more or less than original cost. Past performance does not guarantee future results. Current performance may be lower or higher than the performance data quoted. For performance information current to the most recent month end, please call 1-877-778-2100 or visit our website at www.prudential.com Prospectus Disclosure: Investors should carefully consider a fund's investment objectives, risks, charges and expenses before investing. For more complete information about the investment options available through your account, please call 1-877-778-2100 for a free prospectus that contains this and other information about our funds. Please read the prospectus carefully before investing. It is possible to lose money investing in securities. Benchmark Disclosure: Benchmark related performance including the index is unmanaged and it cannot be invested directly. See User Guide for Benchmark definitions. Shares of each fund are offered by Prudential Investment Management Services LLC (PIMS), Three Gateway Center, Newark, NJ 07102-4077. PIMS is a Prudential Financial company. Investment Advisory services provided by Global Portfolio Strategies, Inc., a registered investment advisor and Prudential Financial Company. Prudential, the Prudential logo, and the Rock symbol are service marks of The Prudential Insurance Company of America, Newark, NJ, and its related entities, registered in many jurisdictions worldwide.
Top Five Holdings As of 7/31/2010
ConocoPhillips ............................................................. 3.02% J.P. Morgan Chase & Co. ............................................ 3.02% Wells Fargo Company ................................................. 2.60% Bank of America Corporation ...................................... 2.47% Pfizer Inc. ..................................................................... 2.43%
Portfolio Allocation As of 7/31/2010
US Stocks 93.27%
Non-US Stocks 4.9%
Cash 1.82%
Top Five Sectors As of 7/31/2010
Financial Services ........................................................... 25.75% Energy ............................................................................. 13.18% Industrial Materials ........................................................ 11.60%Healthcare .......................................................................10.73%
Consumer Services ........................................................... 9.53%
Portfolio Characteristics As of 7/31/2010
Fund Index Weighted Geometric Market Cap. $41.54 $30.82 Price/Earnings Ratio (Forward) 11.64x 13.14x Price/Book Ratio 1.58x 1.45x Dividend Yield 1.54% NA 3-Year Earnings Growth Rate -5.52% -3.74%
Holdings and Sector allocations are ranked as a percentage of net assets and subject to change without notice.

0158683-00006-00
Third Quarter 2010 Fund Fact Sheet Prudential Jennison Value R
Key Facts INVESTMENT ADVISOR: Prudential Investments LLCFUND CATEGORY: Large ValueINDEX: Russell 1000 TR USD®NET ASSETS: $10.4 MillionINCEPTION DATE: 6/3/2005TICKER SYMBOL: JDVRXSHARE CLASS: RetirementGROSS EXPENSE RATIO: 1.59%PORTFOLIO MANAGERS: David A. Kiefer, CFA
Avi Z. Berg
Investor Risk Profile
Morningstar Style BoxTM As of 9/30/2010
Domestic equity funds are placed in a category based on the style and size of the stocks they typically own. The style and size parameters are based on the divisions used in the investment style box: Value, Blend, or Growth style and Small, Medium, or Large geometric average market capitalization.
Results of $10,000 Investment*
0
5,000
10,000
15,000
20,000
05 06 07 08 09 10
Prudential Jennison Value R $11,023
Annual Performance* Fund Index 2009 2008 2007 2006 2005 2004 2003 2002 2001 2000
40.81% -42.84% 2.20% 18.90% 15.21% 14.90% 26.81% -22.51% -3.60% 14.22%
19.69% -36.85% -0.17% 22.25% 7.05%
16.49% 30.03% -15.52% -5.59% 7.01%
Objective/Description The investment seeks capital appreciation. The fund normally invests at least 65% of assets in equity and equity-related securities of large capitalization companies. It may invest up to 25% of assets in REITs and up to 10% of assets in ETFs. The fund may also invest in foreign securities, money market instruments, options, foreign currency, forward contracts and may make short sales of a security. There is no assurance that the objectives of the Fund will be met.
Performance* (%) As of 9/30/2010
Cumulative Returns Average Annual Total Returns
QTD YTD 1 Year 3 Year 5 Year 10 Year Since
InceptionFund 9.33 1.47 7.26 -7.94 0.27 3.09 --- Index 11.55 4.41 10.75 -6.79 0.86 -0.21 --- * Fees that Prudential Retirement and its affiliates receive in connection with investments in this fund include a 12b-1 fee of 0.50%, after waiver, and an annual sub-accounting and/or servicing fee of 0.13%. The expense ratio after the waiver is 1.34%. The Distributor has contractually agreed to this waiver through December 31, 2010.
Past performance does not guarantee future results. Current performance may be lower or higher than the performance data quoted. The performance quoted represents past performance. The investment return and principal value will fluctuate so that an investor's shares, when redeemed, may be worth more or less than original cost. Past performance does not guarantee future results. Current performance may be lower or higher than the performance data quoted. For performance information current to the most recent month end, please call 1-877-778-2100 or visit our website at www.prudential.com Performance Disclosure: Investment results assume all distributions are reinvested and reflect applicable fees and expenses. Class R shares were introduced on June 3, 2005; results prior to that date are hypothetical, based on Class A share returns at net asset value adjusted for additional distribution and service (12b-1) fees of 0.75% annually. Hypothetical waiver. In creating hypothetical Class R share returns, no adjustments are made for any differences in other expenses of Class R and Class A shares that may or may not impact hypothetical Class R share returns. Please see the fund's most recent shareholder report for actual date of first sale. Expenses are deducted from income earned by the fund. As a result, dividends and investment results will differ for each share class. Prospectus Disclosure: Investors should carefully consider a fund's investment objectives, risks, charges and expenses before investing. For more complete information about the investment options available through your account, please call 1-877-778-2100 for a free prospectus that contains this and other information about our funds. Please read the prospectus carefully before investing. It is possible to lose money investing in securities. Benchmark Disclosure: Benchmark related performance including the index is unmanaged and it cannot be invested directly. See User Guide for Benchmark definitions. Shares of each fund are offered by Prudential Investment Management Services LLC (PIMS), Three Gateway Center, Newark, NJ 07102-4077. PIMS is a Prudential Financial company. Investment Advisory services provided by Global Portfolio Strategies, Inc., a registered investment advisor and Prudential Financial Company. Prudential, the Prudential logo, and the Rock symbol are service marks of The Prudential Insurance Company of America, Newark, NJ, and its related entities, registered in many jurisdictions worldwide.
Top Five Holdings As of 8/31/2010
Dryden Core Invest ...................................................... 2.85% Liberty Global, Inc. ...................................................... 2.68% CA, Inc. ........................................................................ 2.56% Symantec Corporation ................................................. 2.30% Lear Corporation ......................................................... 2.14%
Portfolio Allocation As of 8/31/2010
US Stocks 89.64%
Non-US Stocks 5.54%
Cash 2.85%
Preferred 1.97%
Top Five Sectors As of 8/31/2010
Financial Services ........................................................... 21.79% Energy ............................................................................. 14.92% Industrial Materials .......................................................... 8.76%Consumer Goods ...............................................................8.36%
Media ................................................................................ 7.94%
Portfolio Characteristics As of 8/31/2010
Fund Index Weighted Geometric Market Cap. $16.45 $32.79 Price/Earnings Ratio (Forward) 12.14x 14.27x Price/Book Ratio 1.41x 2.01x Dividend Yield 0.11% NA 3-Year Earnings Growth Rate -1.97% 2.29%
Holdings and Sector allocations are ranked as a percentage of net assets and subject to change without notice.
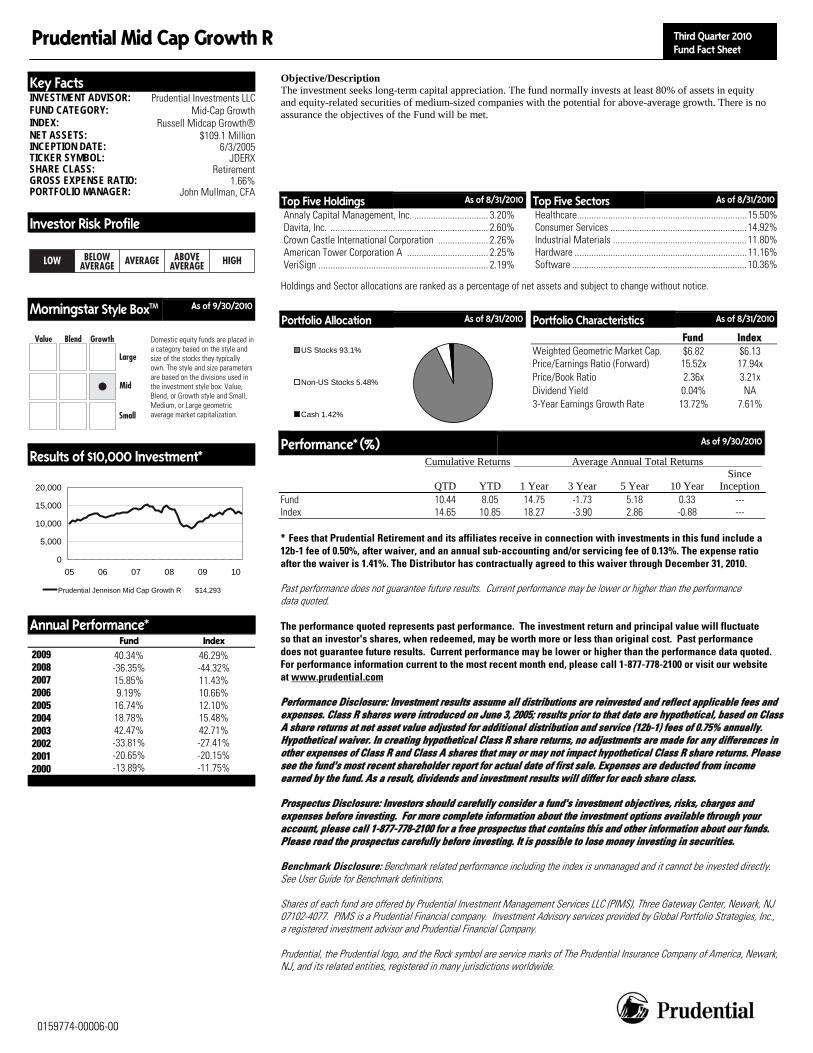
0159774-00006-00
Third Quarter 2010 Fund Fact Sheet
Prudential Mid Cap Growth R
Key Facts INVESTMENT ADVISOR: Prudential Investments LLCFUND CATEGORY: Mid-Cap GrowthINDEX: Russell Midcap Growth®NET ASSETS: $109.1 MillionINCEPTION DATE: 6/3/2005TICKER SYMBOL: JDERXSHARE CLASS: RetirementGROSS EXPENSE RATIO: 1.66%PORTFOLIO MANAGER: John Mullman, CFA
Investor Risk Profile
Morningstar Style BoxTM As of 9/30/2010
Domestic equity funds are placed in a category based on the style and size of the stocks they typically own. The style and size parameters are based on the divisions used in the investment style box: Value, Blend, or Growth style and Small, Medium, or Large geometric average market capitalization.
Results of $10,000 Investment*
0
5,000
10,000
15,000
20,000
05 06 07 08 09 10
Prudential Jennison Mid Cap Growth R $14,293
Annual Performance* Fund Index 2009 2008 2007 2006 2005 2004 2003 2002 2001 2000
40.34% -36.35% 15.85% 9.19% 16.74% 18.78% 42.47% -33.81% -20.65% -13.89%
46.29% -44.32% 11.43% 10.66% 12.10% 15.48% 42.71% -27.41% -20.15% -11.75%
Objective/Description The investment seeks long-term capital appreciation. The fund normally invests at least 80% of assets in equity and equity-related securities of medium-sized companies with the potential for above-average growth. There is no assurance the objectives of the Fund will be met.
Performance* (%) As of 9/30/2010
Cumulative Returns Average Annual Total Returns
QTD YTD 1 Year 3 Year 5 Year 10 Year Since
InceptionFund 10.44 8.05 14.75 -1.73 5.18 0.33 --- Index 14.65 10.85 18.27 -3.90 2.86 -0.88 --- * Fees that Prudential Retirement and its affiliates receive in connection with investments in this fund include a 12b-1 fee of 0.50%, after waiver, and an annual sub-accounting and/or servicing fee of 0.13%. The expense ratio after the waiver is 1.41%. The Distributor has contractually agreed to this waiver through December 31, 2010. Past performance does not guarantee future results. Current performance may be lower or higher than the performance data quoted. The performance quoted represents past performance. The investment return and principal value will fluctuate so that an investor's shares, when redeemed, may be worth more or less than original cost. Past performance does not guarantee future results. Current performance may be lower or higher than the performance data quoted. For performance information current to the most recent month end, please call 1-877-778-2100 or visit our website at www.prudential.com Performance Disclosure: Investment results assume all distributions are reinvested and reflect applicable fees and expenses. Class R shares were introduced on June 3, 2005; results prior to that date are hypothetical, based on Class A share returns at net asset value adjusted for additional distribution and service (12b-1) fees of 0.75% annually. Hypothetical waiver. In creating hypothetical Class R share returns, no adjustments are made for any differences in other expenses of Class R and Class A shares that may or may not impact hypothetical Class R share returns. Please see the fund's most recent shareholder report for actual date of first sale. Expenses are deducted from income earned by the fund. As a result, dividends and investment results will differ for each share class. Prospectus Disclosure: Investors should carefully consider a fund's investment objectives, risks, charges and expenses before investing. For more complete information about the investment options available through your account, please call 1-877-778-2100 for a free prospectus that contains this and other information about our funds. Please read the prospectus carefully before investing. It is possible to lose money investing in securities. Benchmark Disclosure: Benchmark related performance including the index is unmanaged and it cannot be invested directly. See User Guide for Benchmark definitions. Shares of each fund are offered by Prudential Investment Management Services LLC (PIMS), Three Gateway Center, Newark, NJ 07102-4077. PIMS is a Prudential Financial company. Investment Advisory services provided by Global Portfolio Strategies, Inc., a registered investment advisor and Prudential Financial Company. Prudential, the Prudential logo, and the Rock symbol are service marks of The Prudential Insurance Company of America, Newark, NJ, and its related entities, registered in many jurisdictions worldwide.
Top Five Holdings As of 8/31/2010
Annaly Capital Management, Inc. ............................... 3.20% Davita, Inc. .................................................................. 2.60% Crown Castle International Corporation ..................... 2.26% American Tower Corporation A .................................. 2.25% VeriSign ....................................................................... 2.19%
Portfolio Allocation As of 8/31/2010
US Stocks 93.1%
Non-US Stocks 5.48%
Cash 1.42%
Top Five Sectors As of 8/31/2010
Healthcare ....................................................................... 15.50% Consumer Services ......................................................... 14.92% Industrial Materials ........................................................ 11.80%Hardware ........................................................................11.16%
Software ......................................................................... 10.36%
Portfolio Characteristics As of 8/31/2010
Fund Index Weighted Geometric Market Cap. $6.82 $6.13 Price/Earnings Ratio (Forward) 15.52x 17.94x Price/Book Ratio 2.36x 3.21x Dividend Yield 0.04% NA 3-Year Earnings Growth Rate 13.72% 7.61%
Holdings and Sector allocations are ranked as a percentage of net assets and subject to change without notice.
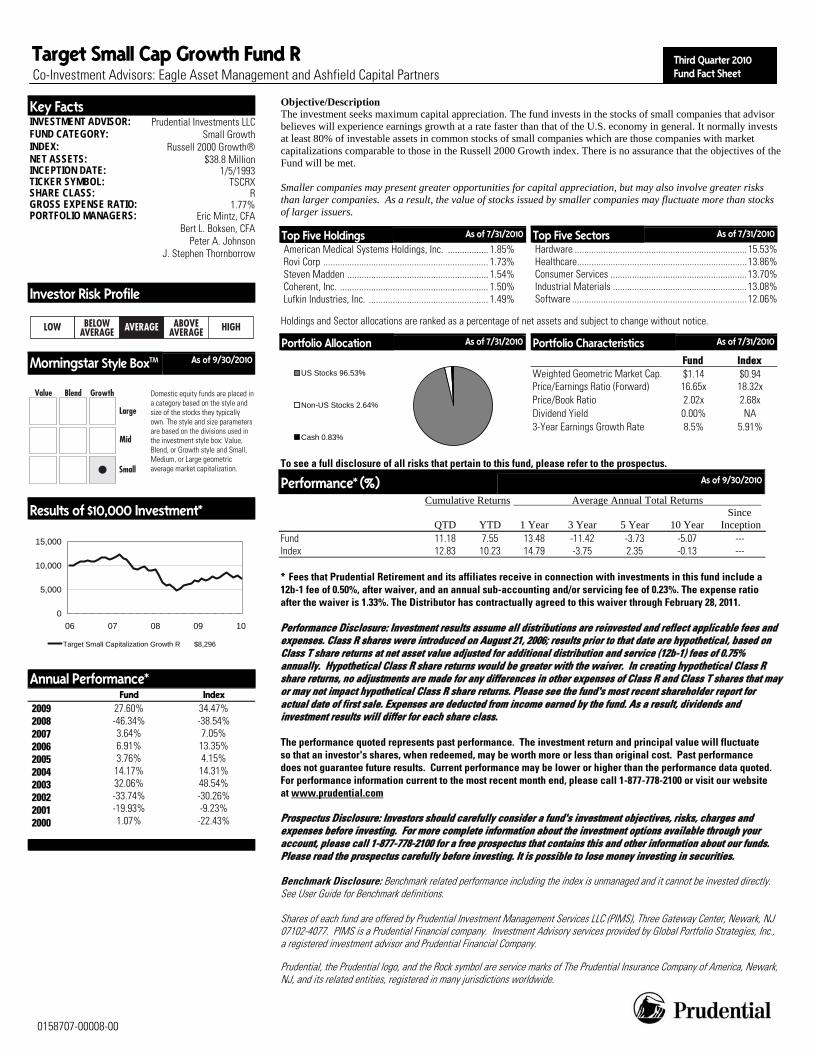
0158707-00008-00
Third Quarter 2010 Fund Fact Sheet
Target Small Cap Growth Fund R Co-Investment Advisors: Eagle Asset Management and Ashfield Capital Partners
Key Facts INVESTMENT ADVISOR: Prudential Investments LLCFUND CATEGORY: Small GrowthINDEX: Russell 2000 Growth®NET ASSETS: $38.8 MillionINCEPTION DATE: 1/5/1993TICKER SYMBOL: TSCRXSHARE CLASS: RGROSS EXPENSE RATIO: 1.77%PORTFOLIO MANAGERS: Eric Mintz, CFA
Bert L. Boksen, CFAPeter A. Johnson
J. Stephen Thornborrow
Investor Risk Profile
Morningstar Style BoxTM As of 9/30/2010
Domestic equity funds are placed in a category based on the style and size of the stocks they typically own. The style and size parameters are based on the divisions used in the investment style box: Value, Blend, or Growth style and Small, Medium, or Large geometric average market capitalization.
Results of $10,000 Investment*
0
5,000
10,000
15,000
06 07 08 09 10
Target Small Capitalization Growth R $8,296
Annual Performance* Fund Index
2009 2008 2007 2006 2005 2004 2003 2002 2001 2000
27.60% -46.34% 3.64% 6.91% 3.76% 14.17% 32.06% -33.74% -19.93% 1.07%
34.47% -38.54% 7.05%
13.35% 4.15%
14.31% 48.54% -30.26% -9.23% -22.43%
Objective/Description The investment seeks maximum capital appreciation. The fund invests in the stocks of small companies that advisor believes will experience earnings growth at a rate faster than that of the U.S. economy in general. It normally invests at least 80% of investable assets in common stocks of small companies which are those companies with market capitalizations comparable to those in the Russell 2000 Growth index. There is no assurance that the objectives of the Fund will be met. Smaller companies may present greater opportunities for capital appreciation, but may also involve greater risks than larger companies. As a result, the value of stocks issued by smaller companies may fluctuate more than stocks of larger issuers.
To see a full disclosure of all risks that pertain to this fund, please refer to the prospectus.
Performance* (%) As of 9/30/2010
Cumulative Returns Average Annual Total Returns
QTD YTD 1 Year 3 Year 5 Year 10 Year Since
InceptionFund 11.18 7.55 13.48 -11.42 -3.73 -5.07 --- Index 12.83 10.23 14.79 -3.75 2.35 -0.13 --- * Fees that Prudential Retirement and its affiliates receive in connection with investments in this fund include a 12b-1 fee of 0.50%, after waiver, and an annual sub-accounting and/or servicing fee of 0.23%. The expense ratio after the waiver is 1.33%. The Distributor has contractually agreed to this waiver through February 28, 2011. Performance Disclosure: Investment results assume all distributions are reinvested and reflect applicable fees and expenses. Class R shares were introduced on August 21, 2006; results prior to that date are hypothetical, based on Class T share returns at net asset value adjusted for additional distribution and service (12b-1) fees of 0.75% annually. Hypothetical Class R share returns would be greater with the waiver. In creating hypothetical Class R share returns, no adjustments are made for any differences in other expenses of Class R and Class T shares that may or may not impact hypothetical Class R share returns. Please see the fund's most recent shareholder report for actual date of first sale. Expenses are deducted from income earned by the fund. As a result, dividends and investment results will differ for each share class. The performance quoted represents past performance. The investment return and principal value will fluctuate so that an investor's shares, when redeemed, may be worth more or less than original cost. Past performance does not guarantee future results. Current performance may be lower or higher than the performance data quoted. For performance information current to the most recent month end, please call 1-877-778-2100 or visit our website at www.prudential.com Prospectus Disclosure: Investors should carefully consider a fund's investment objectives, risks, charges and expenses before investing. For more complete information about the investment options available through your account, please call 1-877-778-2100 for a free prospectus that contains this and other information about our funds. Please read the prospectus carefully before investing. It is possible to lose money investing in securities. Benchmark Disclosure: Benchmark related performance including the index is unmanaged and it cannot be invested directly. See User Guide for Benchmark definitions. Shares of each fund are offered by Prudential Investment Management Services LLC (PIMS), Three Gateway Center, Newark, NJ 07102-4077. PIMS is a Prudential Financial company. Investment Advisory services provided by Global Portfolio Strategies, Inc., a registered investment advisor and Prudential Financial Company. Prudential, the Prudential logo, and the Rock symbol are service marks of The Prudential Insurance Company of America, Newark, NJ, and its related entities, registered in many jurisdictions worldwide.
Top Five Holdings As of 7/31/2010
American Medical Systems Holdings, Inc. ................. 1.85% Rovi Corp ..................................................................... 1.73% Steven Madden ........................................................... 1.54% Coherent, Inc. .............................................................. 1.50% Lufkin Industries, Inc. .................................................. 1.49%
Portfolio Allocation As of 7/31/2010
US Stocks 96.53%
Non-US Stocks 2.64%
Cash 0.83%
Top Five Sectors As of 7/31/2010
Hardware ........................................................................ 15.53% Healthcare ....................................................................... 13.86% Consumer Services ......................................................... 13.70%Industrial Materials ........................................................13.08%
Software ......................................................................... 12.06%
Portfolio Characteristics As of 7/31/2010
Fund Index Weighted Geometric Market Cap. $1.14 $0.94 Price/Earnings Ratio (Forward) 16.65x 18.32x Price/Book Ratio 2.02x 2.68x Dividend Yield 0.00% NA 3-Year Earnings Growth Rate 8.5% 5.91%
Holdings and Sector allocations are ranked as a percentage of net assets and subject to change without notice.

0158688-00007-00
Third Quarter 2010 Fund Fact Sheet Prudential Jennison Small Company R
Key Facts INVESTMENT ADVISOR: Prudential Investments LLCFUND CATEGORY: Small GrowthINDEX: Russell 2000 Growth®NET ASSETS: $33.4 MillionINCEPTION DATE: 5/10/2004TICKER SYMBOL: JSCRXSHARE CLASS: RetirementGROSS EXPENSE RATIO: 1.68%PORTFOLIO MANAGER: John Mullman, CFA
Investor Risk Profile
Morningstar Style BoxTM As of 9/30/2010
Domestic equity funds are placed in a category based on the style and size of the stocks they typically own. The style and size parameters are based on the divisions used in the investment style box: Value, Blend, or Growth style and Small, Medium, or Large geometric average market capitalization.
Results of $10,000 Investment*
0
5,000
10,000
15,000
20,000
04 05 06 07 08 09 10
Prudential Jennison Small Company R $14,861
Annual Performance* Fund Index 2009 2008 2007 2006 2005 2004 2003 2002 2001 2000
35.89% -38.16% 9.32% 14.77% 14.30% 19.04% 44.59% -25.72% 15.55% 8.87%
34.47% -38.54% 7.05%
13.35% 4.15%
14.31% 48.54% -30.26% -9.23% -22.43%
Objective/Description The investment seeks capital growth. The fund normally invests at least 80% of assets in equity securities of small, less well-known undervalued U.S. companies. It may invest up to 20% of assets in equity-related securities including nonconvertible preferred stocks and convertible securities. The fund may also invest in foreign securities, REITs, high-quality money market instruments, options, foreign currency forward contracts and may make short sales of a security. There is no assurance that the objectives of the Fund will be met. Smaller companies may present greater opportunities for capital appreciation, but may also involve greater risks than larger companies. As a result, the value of stocks issued by smaller companies may fluctuate more than stocks of larger issuers.
To see a full disclosure of all risks that pertain to this fund, please refer to the prospectus.
Performance* (%) As of 9/30/2010
Cumulative Returns Average Annual Total Returns
QTD YTD 1 Year 3 Year 5 Year 10 Year Since
InceptionFund 10.47 8.69 15.39 -3.79 3.30 6.24 --- Index 12.83 10.23 14.79 -3.75 2.35 -0.13 --- * Fees that Prudential Retirement and its affiliates receive in connection with investments in this fund include a 12b-1 fee of 0.50%, after waiver, and an annual sub-accounting and/or servicing fee of 0.13%. The expense ratio after the waiver is 1.43%. The Distributor has contractually agreed to this waiver through January 31, 2011.
Past performance does not guarantee future results. Current performance may be lower or higher than the performance data quoted. The performance quoted represents past performance. The investment return and principal value will fluctuate so that an investor's shares, when redeemed, may be worth more or less than original cost. Past performance does not guarantee future results. Current performance may be lower or higher than the performance data quoted. For performance information current to the most recent month end, please call 1-877-778-2100 or visit our website at www.prudential.com
Performance Disclosure: Investment results assume all distributions are reinvested and reflect applicable fees and expenses. Class R shares were introduced on May 10, 2004; results prior to that date are hypothetical, based on Class A share returns at net asset value adjusted for additional distribution and service (12b-1) fees of 0.75% annually. Hypothetical waiver. In creating hypothetical Class R share returns, no adjustments are made for any differences in other expenses of Class R and Class A shares that may or may not impact hypothetical Class R share returns. Please see the fund's most recent shareholder report for actual date of first sale. Expenses are deducted from income earned by the fund. As a result, dividends and investment results will differ for each share class. Prospectus Disclosure: Investors should carefully consider a fund's investment objectives, risks, charges and expenses before investing. For more complete information about the investment options available through your account, please call 1-877-778-2100 for a free prospectus that contains this and other information about our funds. Please read the prospectus carefully before investing. It is possible to lose money investing in securities. Benchmark Disclosure: Benchmark related performance including the index is unmanaged and it cannot be invested directly. See User Guide for Benchmark definitions. Shares of each fund are offered by Prudential Investment Management Services LLC (PIMS), Three Gateway Center, Newark, NJ 07102-4077. PIMS is a Prudential Financial company. Investment Advisory services provided by Global Portfolio Strategies, Inc., a registered investment advisor and Prudential Financial Company. Prudential, the Prudential logo, and the Rock symbol are service marks of The Prudential Insurance Company of America, Newark, NJ, and its related entities, registered in many jurisdictions worldwide.
Top Five Holdings As of 8/31/2010
SBA Communications Corporation .............................. 2.46% Dryden Core Invest ...................................................... 2.15% United Natural Foods, Inc. .......................................... 1.90% NTELOS Holdings Corporation .................................... 1.68% Concho Resources, Inc. ............................................... 1.53%
Portfolio Allocation As of 8/31/2010
US Stocks 96.81%
Cash 2.15%
Non-US Stocks 1.04%
Top Five Sectors As of 8/31/2010
Financial Services ........................................................... 16.49% Industrial Materials ........................................................ 16.28% Business Services ........................................................... 13.75%Healthcare .......................................................................11.02%
Consumer Services ........................................................... 9.79%
Portfolio Characteristics As of 8/31/2010
Fund Index Weighted Geometric Market Cap. $1.59 $0.94 Price/Earnings Ratio (Forward) 15.41x 18.32x Price/Book Ratio 1.8x 2.68x Dividend Yield 0.00% NA 3-Year Earnings Growth Rate 11.33% 5.91%
Holdings and Sector allocations are ranked as a percentage of net assets and subject to change without notice.
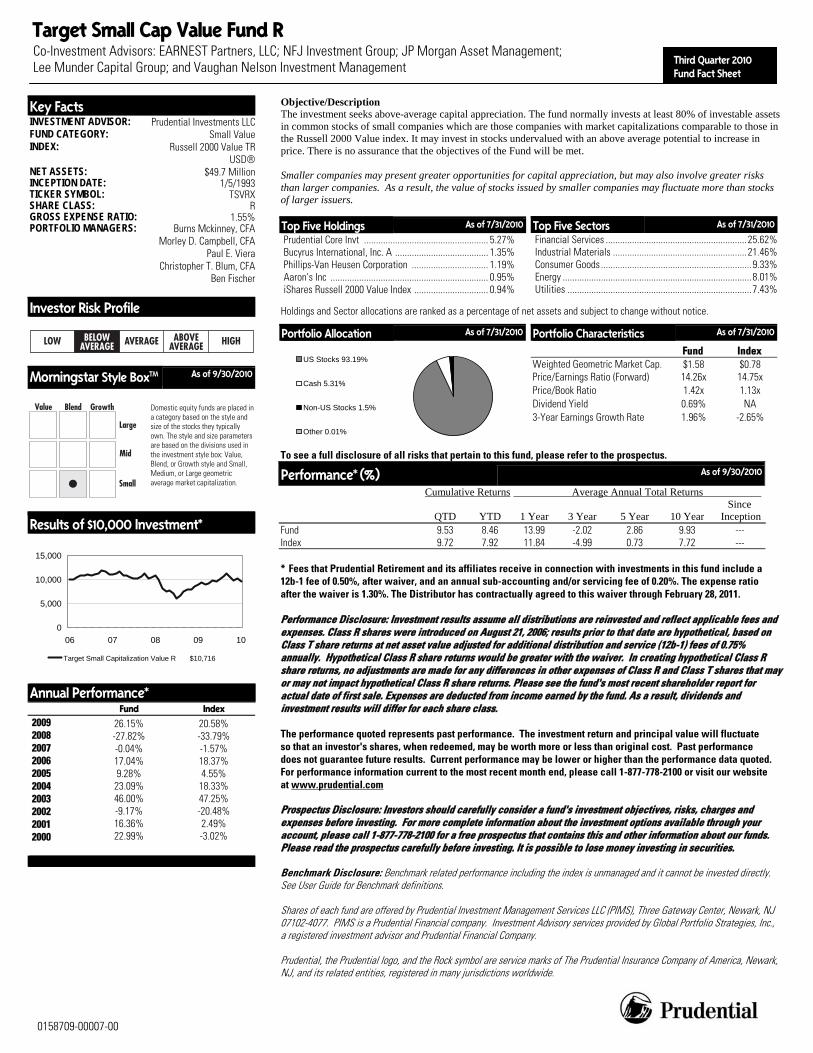
0158709-00007-00
Third Quarter 2010 Fund Fact Sheet
Target Small Cap Value Fund R Co-Investment Advisors: EARNEST Partners, LLC; NFJ Investment Group; JP Morgan Asset Management; Lee Munder Capital Group; and Vaughan Nelson Investment Management
Key Facts INVESTMENT ADVISOR: Prudential Investments LLCFUND CATEGORY: Small ValueINDEX: Russell 2000 Value TR
USD®NET ASSETS: $49.7 MillionINCEPTION DATE: 1/5/1993TICKER SYMBOL: TSVRXSHARE CLASS: RGROSS EXPENSE RATIO: 1.55%PORTFOLIO MANAGERS: Burns Mckinney, CFA
Morley D. Campbell, CFAPaul E. Viera
Christopher T. Blum, CFABen Fischer
Investor Risk Profile
Morningstar Style BoxTM As of 9/30/2010
Domestic equity funds are placed in a category based on the style and size of the stocks they typically own. The style and size parameters are based on the divisions used in the investment style box: Value, Blend, or Growth style and Small, Medium, or Large geometric average market capitalization.
Results of $10,000 Investment*
0
5,000
10,000
15,000
06 07 08 09 10
Target Small Capitalization Value R $10,716
Annual Performance* Fund Index
2009 2008 2007 2006 2005 2004 2003 2002 2001 2000
26.15% -27.82% -0.04% 17.04% 9.28% 23.09% 46.00% -9.17% 16.36% 22.99%
20.58% -33.79% -1.57% 18.37% 4.55%
18.33% 47.25% -20.48% 2.49% -3.02%
Objective/Description The investment seeks above-average capital appreciation. The fund normally invests at least 80% of investable assets in common stocks of small companies which are those companies with market capitalizations comparable to those in the Russell 2000 Value index. It may invest in stocks undervalued with an above average potential to increase in price. There is no assurance that the objectives of the Fund will be met. Smaller companies may present greater opportunities for capital appreciation, but may also involve greater risks than larger companies. As a result, the value of stocks issued by smaller companies may fluctuate more than stocks of larger issuers.
To see a full disclosure of all risks that pertain to this fund, please refer to the prospectus.
Performance* (%) As of 9/30/2010
Cumulative Returns Average Annual Total Returns
QTD YTD 1 Year 3 Year 5 Year 10 Year Since
InceptionFund 9.53 8.46 13.99 -2.02 2.86 9.93 --- Index 9.72 7.92 11.84 -4.99 0.73 7.72 --- * Fees that Prudential Retirement and its affiliates receive in connection with investments in this fund include a 12b-1 fee of 0.50%, after waiver, and an annual sub-accounting and/or servicing fee of 0.20%. The expense ratio after the waiver is 1.30%. The Distributor has contractually agreed to this waiver through February 28, 2011. Performance Disclosure: Investment results assume all distributions are reinvested and reflect applicable fees and expenses. Class R shares were introduced on August 21, 2006; results prior to that date are hypothetical, based on Class T share returns at net asset value adjusted for additional distribution and service (12b-1) fees of 0.75% annually. Hypothetical Class R share returns would be greater with the waiver. In creating hypothetical Class R share returns, no adjustments are made for any differences in other expenses of Class R and Class T shares that may or may not impact hypothetical Class R share returns. Please see the fund's most recent shareholder report for actual date of first sale. Expenses are deducted from income earned by the fund. As a result, dividends and investment results will differ for each share class. The performance quoted represents past performance. The investment return and principal value will fluctuate so that an investor's shares, when redeemed, may be worth more or less than original cost. Past performance does not guarantee future results. Current performance may be lower or higher than the performance data quoted. For performance information current to the most recent month end, please call 1-877-778-2100 or visit our website at www.prudential.com Prospectus Disclosure: Investors should carefully consider a fund's investment objectives, risks, charges and expenses before investing. For more complete information about the investment options available through your account, please call 1-877-778-2100 for a free prospectus that contains this and other information about our funds. Please read the prospectus carefully before investing. It is possible to lose money investing in securities. Benchmark Disclosure: Benchmark related performance including the index is unmanaged and it cannot be invested directly. See User Guide for Benchmark definitions. Shares of each fund are offered by Prudential Investment Management Services LLC (PIMS), Three Gateway Center, Newark, NJ 07102-4077. PIMS is a Prudential Financial company. Investment Advisory services provided by Global Portfolio Strategies, Inc., a registered investment advisor and Prudential Financial Company. Prudential, the Prudential logo, and the Rock symbol are service marks of The Prudential Insurance Company of America, Newark, NJ, and its related entities, registered in many jurisdictions worldwide.
Top Five Holdings As of 7/31/2010
Prudential Core Invt .................................................... 5.27% Bucyrus International, Inc. A ....................................... 1.35% Phillips-Van Heusen Corporation ................................ 1.19% Aaron's Inc .................................................................. 0.95% iShares Russell 2000 Value Index ............................... 0.94%
Portfolio Allocation As of 7/31/2010
US Stocks 93.19%
Cash 5.31%
Non-US Stocks 1.5%
Other 0.01%
Top Five Sectors As of 7/31/2010
Financial Services ........................................................... 25.62% Industrial Materials ........................................................ 21.46% Consumer Goods ............................................................... 9.33%Energy ...............................................................................8.01%
Utilities ............................................................................. 7.43%
Portfolio Characteristics As of 7/31/2010
Fund Index Weighted Geometric Market Cap. $1.58 $0.78 Price/Earnings Ratio (Forward) 14.26x 14.75x Price/Book Ratio 1.42x 1.13x Dividend Yield 0.69% NA 3-Year Earnings Growth Rate 1.96% -2.65%
Holdings and Sector allocations are ranked as a percentage of net assets and subject to change without notice.
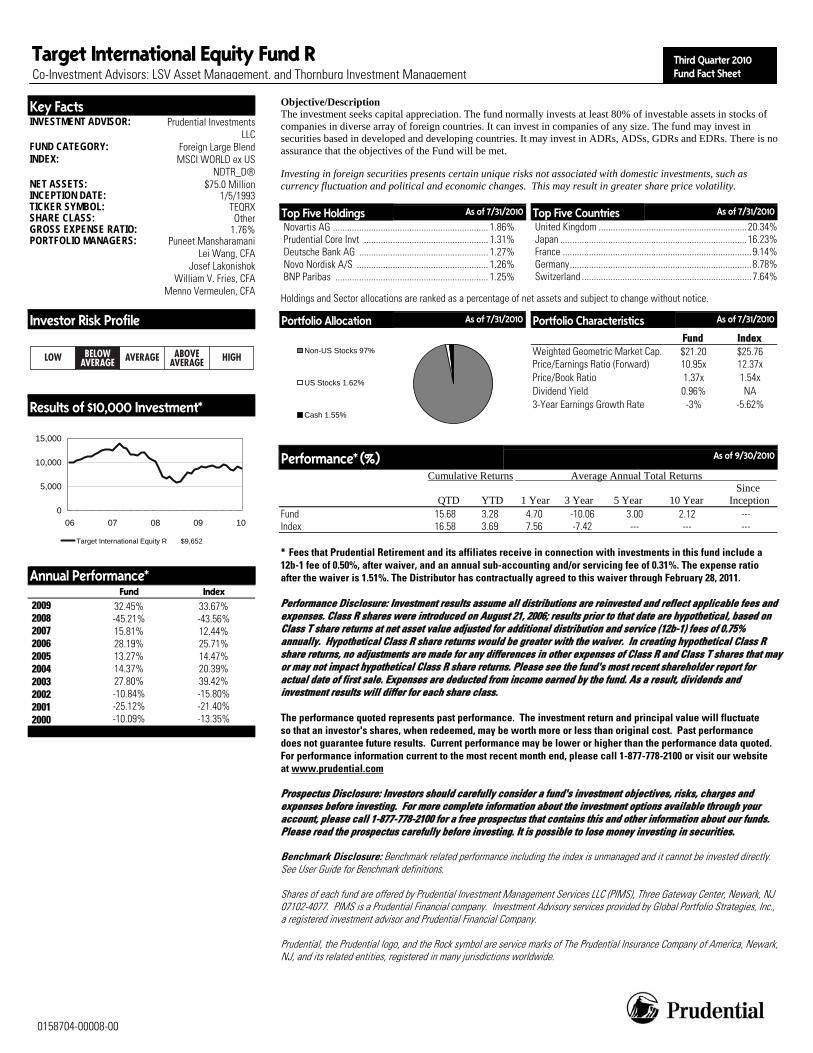
0158704-00008-00
Third Quarter 2010 Fund Fact Sheet
Target International Equity Fund R Co-Investment Advisors: LSV Asset Management, and Thornburg Investment Management
Key Facts INVESTMENT ADVISOR: Prudential Investments
LLCFUND CATEGORY: Foreign Large BlendINDEX: MSCI WORLD ex US
NDTR_D®NET ASSETS: $75.0 MillionINCEPTION DATE: 1/5/1993TICKER SYMBOL: TEQRXSHARE CLASS: OtherGROSS EXPENSE RATIO: 1.76%PORTFOLIO MANAGERS: Puneet Mansharamani
Lei Wang, CFAJosef Lakonishok
William V. Fries, CFAMenno Vermeulen, CFA
Investor Risk Profile
Results of $10,000 Investment*
0
5,000
10,000
15,000
06 07 08 09 10
Target International Equity R $9,652
Annual Performance* Fund Index 2009 2008 2007 2006 2005 2004 2003 2002 2001 2000
32.45% -45.21% 15.81% 28.19% 13.27% 14.37% 27.80% -10.84% -25.12% -10.09%
33.67% -43.56% 12.44% 25.71% 14.47% 20.39% 39.42% -15.80% -21.40% -13.35%
Objective/Description The investment seeks capital appreciation. The fund normally invests at least 80% of investable assets in stocks of companies in diverse array of foreign countries. It can invest in companies of any size. The fund may invest in securities based in developed and developing countries. It may invest in ADRs, ADSs, GDRs and EDRs. There is no assurance that the objectives of the Fund will be met. Investing in foreign securities presents certain unique risks not associated with domestic investments, such as currency fluctuation and political and economic changes. This may result in greater share price volatility.
Performance* (%) As of 9/30/2010
Cumulative Returns Average Annual Total Returns
QTD YTD 1 Year 3 Year 5 Year 10 Year Since
Inception Fund 15.68 3.28 4.70 -10.06 3.00 2.12 --- Index 16.58 3.69 7.56 -7.42 --- --- --- * Fees that Prudential Retirement and its affiliates receive in connection with investments in this fund include a 12b-1 fee of 0.50%, after waiver, and an annual sub-accounting and/or servicing fee of 0.31%. The expense ratio after the waiver is 1.51%. The Distributor has contractually agreed to this waiver through February 28, 2011. Performance Disclosure: Investment results assume all distributions are reinvested and reflect applicable fees and expenses. Class R shares were introduced on August 21, 2006; results prior to that date are hypothetical, based on Class T share returns at net asset value adjusted for additional distribution and service (12b-1) fees of 0.75% annually. Hypothetical Class R share returns would be greater with the waiver. In creating hypothetical Class R share returns, no adjustments are made for any differences in other expenses of Class R and Class T shares that may or may not impact hypothetical Class R share returns. Please see the fund's most recent shareholder report for actual date of first sale. Expenses are deducted from income earned by the fund. As a result, dividends and investment results will differ for each share class. The performance quoted represents past performance. The investment return and principal value will fluctuate so that an investor's shares, when redeemed, may be worth more or less than original cost. Past performance does not guarantee future results. Current performance may be lower or higher than the performance data quoted. For performance information current to the most recent month end, please call 1-877-778-2100 or visit our website at www.prudential.com Prospectus Disclosure: Investors should carefully consider a fund's investment objectives, risks, charges and expenses before investing. For more complete information about the investment options available through your account, please call 1-877-778-2100 for a free prospectus that contains this and other information about our funds. Please read the prospectus carefully before investing. It is possible to lose money investing in securities. Benchmark Disclosure: Benchmark related performance including the index is unmanaged and it cannot be invested directly. See User Guide for Benchmark definitions. Shares of each fund are offered by Prudential Investment Management Services LLC (PIMS), Three Gateway Center, Newark, NJ 07102-4077. PIMS is a Prudential Financial company. Investment Advisory services provided by Global Portfolio Strategies, Inc., a registered investment advisor and Prudential Financial Company. Prudential, the Prudential logo, and the Rock symbol are service marks of The Prudential Insurance Company of America, Newark, NJ, and its related entities, registered in many jurisdictions worldwide.
Top Five Holdings As of 7/31/2010
Novartis AG ................................................................. 1.86% Prudential Core Invt .................................................... 1.31% Deutsche Bank AG ...................................................... 1.27% Novo Nordisk A/S ....................................................... 1.26% BNP Paribas ................................................................ 1.25%
Top Five Countries As of 7/31/2010
United Kingdom .............................................................. 20.34% Japan .............................................................................. 16.23% France ............................................................................... 9.14%Germany............................................................................8.78%
Switzerland ....................................................................... 7.64%
Portfolio Allocation As of 7/31/2010
Non-US Stocks 97%
US Stocks 1.62%
Cash 1.55%
Portfolio Characteristics As of 7/31/2010
Fund Index Weighted Geometric Market Cap. $21.20 $25.76 Price/Earnings Ratio (Forward) 10.95x 12.37x Price/Book Ratio 1.37x 1.54x Dividend Yield 0.96% NA 3-Year Earnings Growth Rate -3% -5.62%
Holdings and Sector allocations are ranked as a percentage of net assets and subject to change without notice.
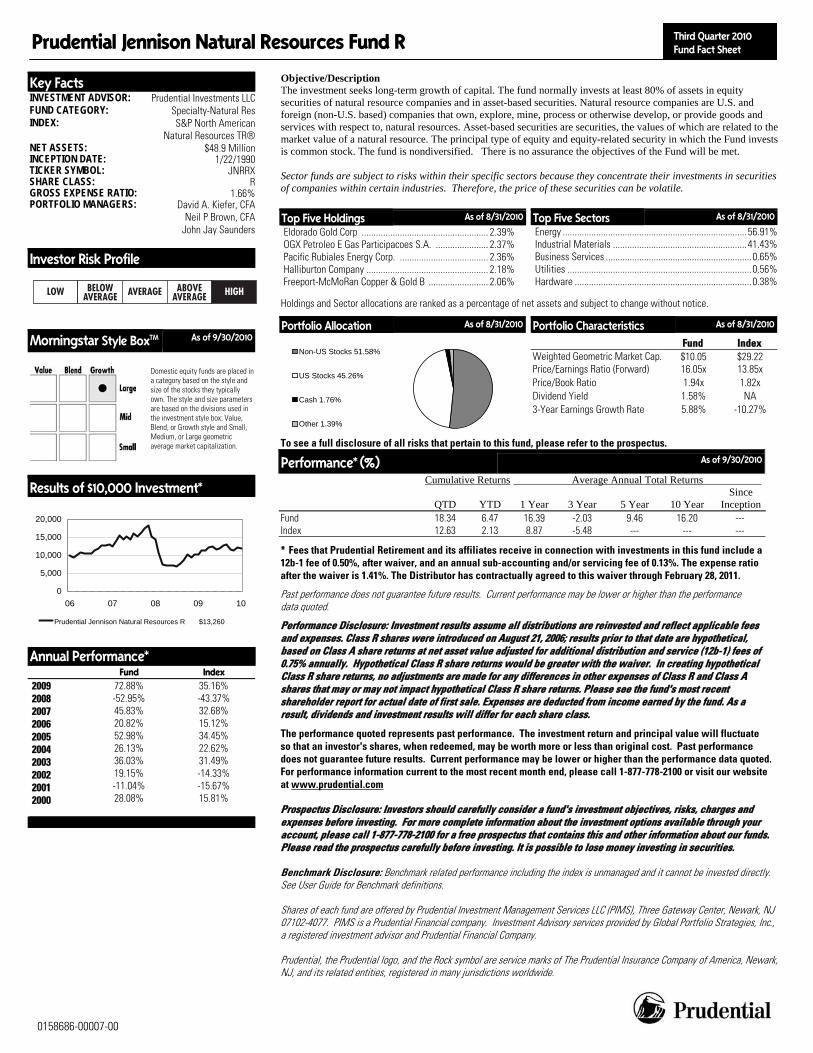
0158686-00007-00
Third Quarter 2010 Fund Fact Sheet Prudential Jennison Natural Resources Fund R
Key Facts INVESTMENT ADVISOR: Prudential Investments LLCFUND CATEGORY: Specialty-Natural ResINDEX: S&P North American
Natural Resources TR®NET ASSETS: $48.9 MillionINCEPTION DATE: 1/22/1990TICKER SYMBOL: JNRRXSHARE CLASS: RGROSS EXPENSE RATIO: 1.66%PORTFOLIO MANAGERS: David A. Kiefer, CFA
Neil P Brown, CFAJohn Jay Saunders
Investor Risk Profile
Morningstar\\Style BoxTM As of 9/30/2010
Domestic equity funds are placed in a category based on the style and size of the stocks they typically own. The style and size parameters are based on the divisions used in the investment style box: Value, Blend, or Growth style and Small, Medium, or Large geometric average market capitalization.
Results of $10,000 Investment*
0
5,000
10,000
15,000
20,000
06 07 08 09 10
Prudential Jennison Natural Resources R $13,260
Annual Performance* Fund Index 2009 2008 2007 2006 2005 2004 2003 2002 2001 2000
72.88% -52.95% 45.83% 20.82% 52.98% 26.13% 36.03% 19.15% -11.04% 28.08%
35.16% -43.37% 32.68% 15.12% 34.45% 22.62% 31.49% -14.33% -15.67% 15.81%
Objective/Description The investment seeks long-term growth of capital. The fund normally invests at least 80% of assets in equity securities of natural resource companies and in asset-based securities. Natural resource companies are U.S. and foreign (non-U.S. based) companies that own, explore, mine, process or otherwise develop, or provide goods and services with respect to, natural resources. Asset-based securities are securities, the values of which are related to the market value of a natural resource. The principal type of equity and equity-related security in which the Fund invests is common stock. The fund is nondiversified. There is no assurance the objectives of the Fund will be met. Sector funds are subject to risks within their specific sectors because they concentrate their investments in securities of companies within certain industries. Therefore, the price of these securities can be volatile.
To see a full disclosure of all risks that pertain to this fund, please refer to the prospectus.
Performance* (%) As of 9/30/2010
Cumulative Returns Average Annual Total Returns
QTD YTD 1 Year 3 Year 5 Year 10 Year Since
InceptionFund 18.34 6.47 16.39 -2.03 9.46 16.20 --- Index 12.63 2.13 8.87 -5.48 --- --- ---
* Fees that Prudential Retirement and its affiliates receive in connection with investments in this fund include a 12b-1 fee of 0.50%, after waiver, and an annual sub-accounting and/or servicing fee of 0.13%. The expense ratio after the waiver is 1.41%. The Distributor has contractually agreed to this waiver through February 28, 2011.
Past performance does not guarantee future results. Current performance may be lower or higher than the performance data quoted.
Performance Disclosure: Investment results assume all distributions are reinvested and reflect applicable fees and expenses. Class R shares were introduced on August 21, 2006; results prior to that date are hypothetical, based on Class A share returns at net asset value adjusted for additional distribution and service (12b-1) fees of 0.75% annually. Hypothetical Class R share returns would be greater with the waiver. In creating hypothetical Class R share returns, no adjustments are made for any differences in other expenses of Class R and Class A shares that may or may not impact hypothetical Class R share returns. Please see the fund's most recent shareholder report for actual date of first sale. Expenses are deducted from income earned by the fund. As a result, dividends and investment results will differ for each share class.
The performance quoted represents past performance. The investment return and principal value will fluctuate so that an investor's shares, when redeemed, may be worth more or less than original cost. Past performance does not guarantee future results. Current performance may be lower or higher than the performance data quoted. For performance information current to the most recent month end, please call 1-877-778-2100 or visit our website at www.prudential.com Prospectus Disclosure: Investors should carefully consider a fund's investment objectives, risks, charges and expenses before investing. For more complete information about the investment options available through your account, please call 1-877-778-2100 for a free prospectus that contains this and other information about our funds. Please read the prospectus carefully before investing. It is possible to lose money investing in securities. Benchmark Disclosure: Benchmark related performance including the index is unmanaged and it cannot be invested directly. See User Guide for Benchmark definitions. Shares of each fund are offered by Prudential Investment Management Services LLC (PIMS), Three Gateway Center, Newark, NJ 07102-4077. PIMS is a Prudential Financial company. Investment Advisory services provided by Global Portfolio Strategies, Inc., a registered investment advisor and Prudential Financial Company. Prudential, the Prudential logo, and the Rock symbol are service marks of The Prudential Insurance Company of America, Newark, NJ, and its related entities, registered in many jurisdictions worldwide.
Top Five Holdings As of 8/31/2010
Eldorado Gold Corp ..................................................... 2.39% OGX Petroleo E Gas Participacoes S.A. ...................... 2.37% Pacific Rubiales Energy Corp. ..................................... 2.36% Halliburton Company ................................................... 2.18% Freeport-McMoRan Copper & Gold B ......................... 2.06%
Portfolio Allocation As of 8/31/2010
Non-US Stocks 51.58%
US Stocks 45.26%
Cash 1.76%
Other 1.39%
Top Five Sectors As of 8/31/2010
Energy ............................................................................. 56.91% Industrial Materials ........................................................ 41.43% Business Services ............................................................. 0.65% Utilities ............................................................................. 0.56% Hardware .......................................................................... 0.38%
Portfolio Characteristics As of 8/31/2010
Fund Index Weighted Geometric Market Cap. $10.05 $29.22 Price/Earnings Ratio (Forward) 16.05x 13.85x Price/Book Ratio 1.94x 1.82x Dividend Yield 1.58% NA 3-Year Earnings Growth Rate 5.88% -10.27%
Holdings and Sector allocations are ranked as a percentage of net assets and subject to change without notice.
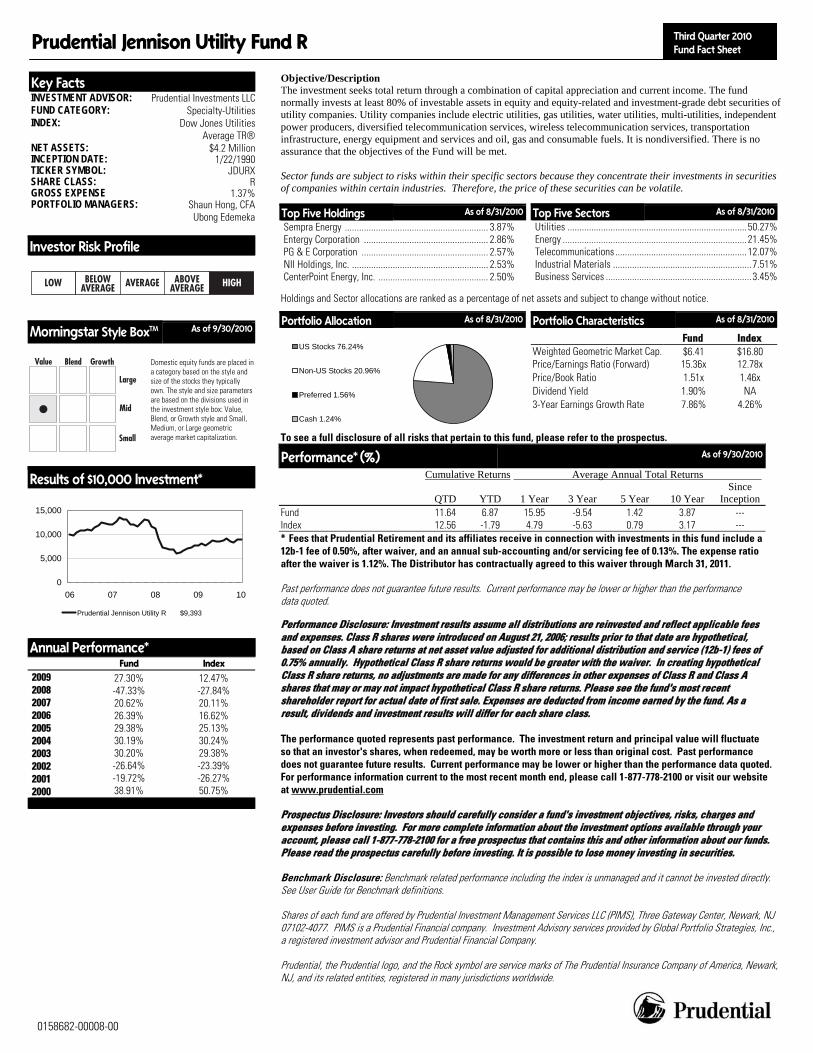
0158682-00008-00
Third Quarter 2010 Fund Fact Sheet Prudential Jennison Utility Fund R
Key Facts INVESTMENT ADVISOR: Prudential Investments LLCFUND CATEGORY: Specialty-UtilitiesINDEX: Dow Jones Utilities
Average TR®NET ASSETS: $4.2 MillionINCEPTION DATE: 1/22/1990TICKER SYMBOL: JDURXSHARE CLASS: RGROSS EXPENSE 1.37%PORTFOLIO MANAGERS: Shaun Hong, CFA
Ubong Edemeka
Investor Risk Profile
Morningstar Style BoxTM As of 9/30/2010
Domestic equity funds are placed in a category based on the style and size of the stocks they typically own. The style and size parameters are based on the divisions used in the investment style box: Value, Blend, or Growth style and Small, Medium, or Large geometric average market capitalization.
Results of $10,000 Investment*
0
5,000
10,000
15,000
06 07 08 09 10
Prudential Jennison Utility R $9,393
Annual Performance* Fund Index 2009 2008 2007 2006 2005 2004 2003 2002 2001 2000
27.30% -47.33% 20.62% 26.39% 29.38% 30.19% 30.20% -26.64% -19.72% 38.91%
12.47% -27.84% 20.11% 16.62% 25.13% 30.24% 29.38% -23.39% -26.27% 50.75%
Objective/Description The investment seeks total return through a combination of capital appreciation and current income. The fund normally invests at least 80% of investable assets in equity and equity-related and investment-grade debt securities of utility companies. Utility companies include electric utilities, gas utilities, water utilities, multi-utilities, independent power producers, diversified telecommunication services, wireless telecommunication services, transportation infrastructure, energy equipment and services and oil, gas and consumable fuels. It is nondiversified. There is no assurance that the objectives of the Fund will be met. Sector funds are subject to risks within their specific sectors because they concentrate their investments in securities of companies within certain industries. Therefore, the price of these securities can be volatile.
To see a full disclosure of all risks that pertain to this fund, please refer to the prospectus.
Performance* (%) As of 9/30/2010
Cumulative Returns Average Annual Total Returns
QTD YTD 1 Year 3 Year 5 Year 10 Year Since
Inception Fund 11.64 6.87 15.95 -9.54 1.42 3.87 --- Index 12.56 -1.79 4.79 -5.63 0.79 3.17 --- * Fees that Prudential Retirement and its affiliates receive in connection with investments in this fund include a 12b-1 fee of 0.50%, after waiver, and an annual sub-accounting and/or servicing fee of 0.13%. The expense ratio after the waiver is 1.12%. The Distributor has contractually agreed to this waiver through March 31, 2011. Past performance does not guarantee future results. Current performance may be lower or higher than the performance data quoted. Performance Disclosure: Investment results assume all distributions are reinvested and reflect applicable fees and expenses. Class R shares were introduced on August 21, 2006; results prior to that date are hypothetical, based on Class A share returns at net asset value adjusted for additional distribution and service (12b-1) fees of 0.75% annually. Hypothetical Class R share returns would be greater with the waiver. In creating hypothetical Class R share returns, no adjustments are made for any differences in other expenses of Class R and Class A shares that may or may not impact hypothetical Class R share returns. Please see the fund's most recent shareholder report for actual date of first sale. Expenses are deducted from income earned by the fund. As a result, dividends and investment results will differ for each share class. The performance quoted represents past performance. The investment return and principal value will fluctuate so that an investor's shares, when redeemed, may be worth more or less than original cost. Past performance does not guarantee future results. Current performance may be lower or higher than the performance data quoted. For performance information current to the most recent month end, please call 1-877-778-2100 or visit our website at www.prudential.com Prospectus Disclosure: Investors should carefully consider a fund's investment objectives, risks, charges and expenses before investing. For more complete information about the investment options available through your account, please call 1-877-778-2100 for a free prospectus that contains this and other information about our funds. Please read the prospectus carefully before investing. It is possible to lose money investing in securities. Benchmark Disclosure: Benchmark related performance including the index is unmanaged and it cannot be invested directly. See User Guide for Benchmark definitions. Shares of each fund are offered by Prudential Investment Management Services LLC (PIMS), Three Gateway Center, Newark, NJ 07102-4077. PIMS is a Prudential Financial company. Investment Advisory services provided by Global Portfolio Strategies, Inc., a registered investment advisor and Prudential Financial Company. Prudential, the Prudential logo, and the Rock symbol are service marks of The Prudential Insurance Company of America, Newark, NJ, and its related entities, registered in many jurisdictions worldwide.
Top Five Holdings As of 8/31/2010
Sempra Energy ............................................................ 3.87% Entergy Corporation .................................................... 2.86% PG & E Corporation ..................................................... 2.57% NII Holdings, Inc. ......................................................... 2.53% CenterPoint Energy, Inc. .............................................. 2.50%
Portfolio Allocation As of 8/31/2010
US Stocks 76.24%
Non-US Stocks 20.96%
Preferred 1.56%
Cash 1.24%
Top Five Sectors As of 8/31/2010
Utilities ........................................................................... 50.27% Energy ............................................................................. 21.45% Telecommunications ....................................................... 12.07%Industrial Materials ..........................................................7.51%
Business Services ............................................................. 3.45%
Portfolio Characteristics As of 8/31/2010
Fund Index Weighted Geometric Market Cap. $6.41 $16.80 Price/Earnings Ratio (Forward) 15.36x 12.78x Price/Book Ratio 1.51x 1.46x Dividend Yield 1.90% NA 3-Year Earnings Growth Rate 7.86% 4.26%
Holdings and Sector allocations are ranked as a percentage of net assets and subject to change without notice.
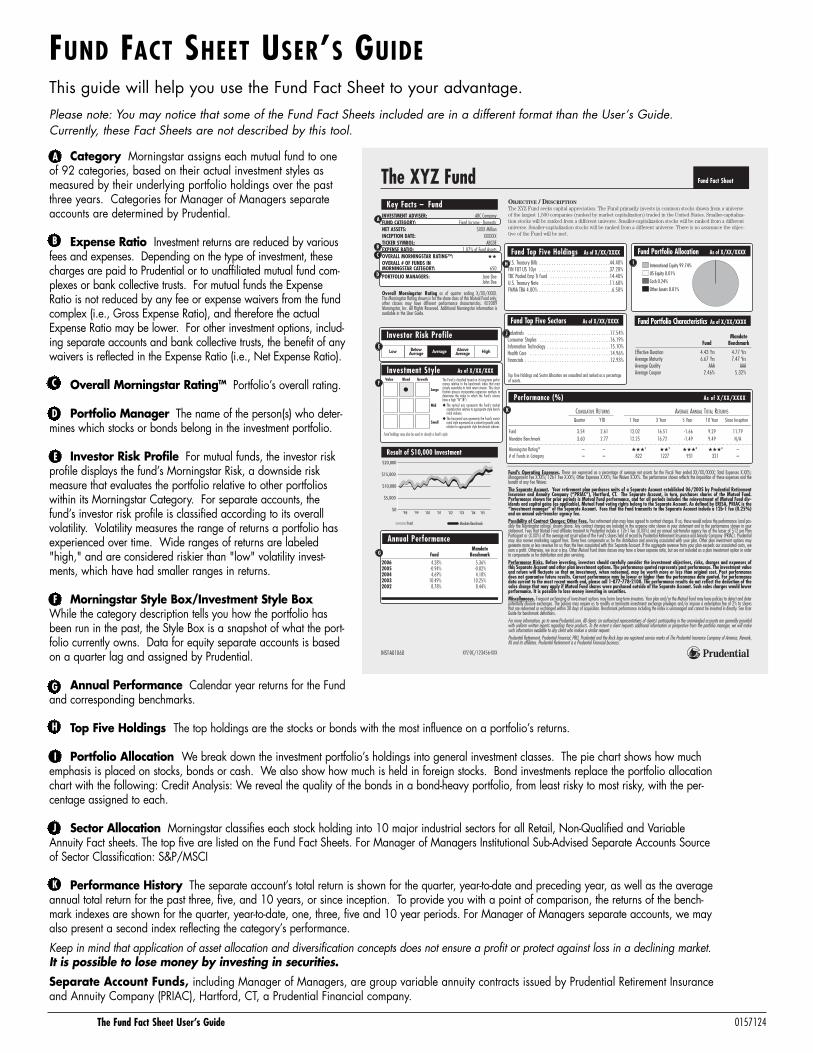
FUND FACT SHEET USER’S GUIDEThis guide will help you use the Fund Fact Sheet to your advantage. Please note: You may notice that some of the Fund Fact Sheets included are in a different format than the User’s Guide. Currently, these Fact Sheets are not described by this tool.
The Fund Fact Sheet User’s Guide 0157124
Category Morningstar assigns each mutual fund to oneof 92 categories, based on their actual investment styles asmeasured by their underlying portfolio holdings over the pastthree years. Categories for Manager of Managers separateaccounts are determined by Prudential.
Expense Ratio Investment returns are reduced by variousfees and expenses. Depending on the type of investment, thesecharges are paid to Prudential or to unaffiliated mutual fund com-plexes or bank collective trusts. For mutual funds the ExpenseRatio is not reduced by any fee or expense waivers from the fundcomplex (i.e., Gross Expense Ratio), and therefore the actualExpense Ratio may be lower. For other investment options, includ-ing separate accounts and bank collective trusts, the benefit of anywaivers is reflected in the Expense Ratio (i.e., Net Expense Ratio).
Overall Morningstar RatingTM Portfolio’s overall rating.
Portfolio Manager The name of the person(s) who deter-mines which stocks or bonds belong in the investment portfolio.
Investor Risk Profile For mutual funds, the investor riskprofile displays the fund’s Morningstar Risk, a downside riskmeasure that evaluates the portfolio relative to other portfolioswithin its Morningstar Category. For separate accounts, thefund’s investor risk profile is classified according to its overallvolatility. Volatility measures the range of returns a portfolio hasexperienced over time. Wide ranges of returns are labeled"high," and are considered riskier than "low" volatility invest-ments, which have had smaller ranges in returns.
Morningstar Style Box/Investment Style BoxWhile the category description tells you how the portfolio hasbeen run in the past, the Style Box is a snapshot of what the port-folio currently owns. Data for equity separate accounts is basedon a quarter lag and assigned by Prudential.
Annual Performance Calendar year returns for the Fundand corresponding benchmarks.
Top Five Holdings The top holdings are the stocks or bonds with the most influence on a portfolio’s returns.
Portfolio Allocation We break down the investment portfolio’s holdings into general investment classes. The pie chart shows how muchemphasis is placed on stocks, bonds or cash. We also show how much is held in foreign stocks. Bond investments replace the portfolio allocationchart with the following: Credit Analysis: We reveal the quality of the bonds in a bond-heavy portfolio, from least risky to most risky, with the per-centage assigned to each.
Sector Allocation Morningstar classifies each stock holding into 10 major industrial sectors for all Retail, Non-Qualified and VariableAnnuity Fact sheets. The top five are listed on the Fund Fact Sheets. For Manager of Managers Institutional Sub-Advised Separate Accounts Sourceof Sector Classification: S&P/MSCI
Performance History The separate account’s total return is shown for the quarter, year-to-date and preceding year, as well as the averageannual total return for the past three, five, and 10 years, or since inception. To provide you with a point of comparison, the returns of the bench-mark indexes are shown for the quarter, year-to-date, one, three, five and 10 year periods. For Manager of Managers separate accounts, we mayalso present a second index reflecting the category’s performance.
Keep in mind that application of asset allocation and diversification concepts does not ensure a profit or protect against loss in a declining market.It is possible to lose money by investing in securities.
Separate Account Funds, including Manager of Managers, are group variable annuity contracts issued by Prudential Retirement Insuranceand Annuity Company (PRIAC), Hartford, CT, a Prudential Financial company.
The XYZ FundKey Facts – Fund
Investor Risk Profile
Fund Fact Sheet
OBJECTIVE / DESCRIPTION
The XYZ Fund seeks capital appreciation. The Fund primarily invests in common stocks drawn from a universeof the largest 1,500 companies (ranked by market capitalization) traded in the United States. Smaller-capitaliza-tion stocks will be ranked from a different universe. Smaller-capitalization stocks will be ranked from a differentuniverse. Smaller-capitalization stocks will be ranked from a different universe. There is no assurance the objec-tive of the Fund will be met.
Investment Style As of X/XX/XXX
XYZ-DC/123456-XXX
Annual PerformanceMandate
Fund Benchmark2006 4.28% 5.36%2005 -0.94% -0.82%2004 4.69% 4.10%2003 10.49% 10.25%2002 8.78% 8.44%
INST-A01060
International Equity 99.74%
US Equity 0.01%
Cash 0.24%
Other Assets 0.01%
Fund Portfolio Allocation As of X/XX/XXXX
Performance (%) As of X/XX/XXXX
MandateFund Benchmark
Effective Duration 4.43 Yrs 4.77 YrsAverage Maturity 6.67 Yrs 7.47 YrsAverage Quality AAA AAAAverage Coupon 2.46% 5.32%
Fund Top Five Holdings As of X/XX/XXXX
Top Five Holdings and Sector Allocation are unaudited and ranked as a percentage of assets.
U.S. Treasury Bills . . . . . . . . . . . . . . . . . . . . . . . . . . . . .44.40%FIN FUT US 10yr . . . . . . . . . . . . . . . . . . . . . . . . . . . . .37.20%TBC Pooled Emp Tr Fund . . . . . . . . . . . . . . . . . . . . . . . . .14.40%U.S. Treasury Note . . . . . . . . . . . . . . . . . . . . . . . . . . . .11.60%FNMA TBA 4.00% . . . . . . . . . . . . . . . . . . . . . . . . . . . . . .6.50%
Fund Top Five Sectors As of X/XX/XXXX Fund Portfolio Characteristics As of X/XX/XXXX
Fund’s Operating Expenses. These are expressed as a percentage of average net assets for the Fiscal Year ended XX/XX/XXXX; Total Expenses X.XX%;Management Fee X.XX%; 12b-1 Fee X.XX%; Other Expenses X.XX%; Fee Waiver X.XX%. The performance shown reflects the imposition of these expenses and thebenefit of any Fee Waiver. The Separate Account. Your retirement plan purchases units of a Separate Account established 06/2005 by Prudential RetirementInsurance and Annuity Company (“PRIAC”), Hartford, CT. The Separate Account, in turn, purchases shares of the Mutual Fund.Performance shown for prior periods is Mutual Fund performance, and for all periods includes the reinvestment of Mutual Fund div-idends and capital gains (as applicable). Mutual Fund voting rights belong to the Separate Account. As defined by ERISA, PRIAC is the“investment manager” of the Separate Account. Fees that the Fund transmits to the Separate Account include a 12b-1 fee (0.25%)and an annual sub-transfer agency fee.Possibility of Contract Charges; Other Fees. Your retirement plan may have agreed to contract charges. If so, these would reduce the performance (and pos-sibly the Morningstar ratings) shown above. Any contract charges are included in the expense ratio shown in your statement and in the performance shown in yourstatement. Fees that Mutual Fund affiliates transmit to Prudential include a 12b-1 fee (X.XX%) and an annual sub-transfer agency fee of the lesser of $12 per PlanParticipant or (X.XX%) of the average net asset value of the Fund’s shares held of record by Prudential Retirement Insurance and Annuity Company (PRIAC). Prudentialmay also receive marketing support fees. These fees compensate us for the distribution and servicing associated with your plan. Other plan investment options maygenerate more or less revenue for us than the fees associated with this Separate Account. If the aggregate revenue from your plan exceeds our associated costs, weearn a profit. Otherwise, we incur a loss. Other Mutual Fund share classes may have a lower expense ratio, but are not included as a plan investment option in orderto compensate us for distribution and plan servicing.Performance Risks. Before investing, investors should carefully consider the investment objectives, risks, charges and expenses ofthis Separate Account and other plan investment options. The performance quoted represents past performance. The investment valueand return will fluctuate so that an investment, when redeemed, may be worth more or less than original cost. Past performancedoes not guarantee future results. Current performance may be lower or higher than the performance data quoted. For performancedata current to the most recent month end, please call 1-877-778-2100. The performance results do not reflect the deduction of thesales charge that may apply if Mutual Fund shares were purchased outside of the Separate Account. Such sales charges would lowerperformance. It is possible to lose money investing in securities.Miscellaneous. Frequent exchanging of investment options may harm long-term investors. Your plan and/or the Mutual Fund may have policies to detect and deterpotentially abusive exchanges. The policies may require us to modify or terminate investment exchange privileges and/or impose a redemption fee of 2% to sharesthat are redeemed or exchanged within 30 days of acquisition. Benchmark performance including the index is unmanaged and cannot be invested in directly. See UserGuide for benchmark definitions.For more information, go to www.Prudential.com. All clients (or authorized representatives of clients) participating in the commingled accounts are generally providedwith uniform written reports regarding these products. To the extent a client requests additional information or perspective from the portfolio manager, we will makesuch information available to any client who makes a similar request.Prudential Retirement, Prudential Financial, PRU, Prudential and the Rock logo are registered service marks of The Prudential Insurance Company of America, Newark,NJ and its affiliates. Prudential Retirement is a Prudential Financial business.
Industrials . . . . . . . . . . . . . . . . . . . . . . . . . . . . . . . . . .17.54%Consumer Staples . . . . . . . . . . . . . . . . . . . . . . . . . . . . .16.19%Information Technology . . . . . . . . . . . . . . . . . . . . . . . . . .15.10%Health Care . . . . . . . . . . . . . . . . . . . . . . . . . . . . . . . . .14.96%Financials . . . . . . . . . . . . . . . . . . . . . . . . . . . . . . . . . . .12.93%
Overall Morningstar Rating as of quarter ending X/XX/XXXX. The Morningstar Rating shown is for the share class of this Mutual Fund only;other classes may have different performance characteristics. ©2009Morningstar, Inc. All Rights Reserved. Additional Morningstar information isavailable in the User Guide.
B
A
E
G
K
J
H I
Value Blend Growth
Large
Mid
Small
The Fund is classified based on its long-term perfor-mance relative to the benchmark index that mostclosely resembles its total return stream. This classi-fication process incorporates regression analysis todetermine the index to which the Fund’s returnshave a high “fit”(R2). � The vertical axis represents the Fund’s market
capitalization relative to appropriate style bench-mark indexes.
� The horizontal axis represents the Fund’s invest-ment style expressed on a value-to-growth scale,relative to appropriate style benchmark indexes.
Fund holdings may also be used to classify a fund’s style.
F
D
INVESTMENT ADVISER: ABC Company FUND CATEGORY: Fixed Income - DomesticNET ASSETS: $XXX MillionINCEPTION DATE: XXXXXXTICKER SYMBOL: ABCDEEXPENSE RATIO: 1.07% of Fund AssetsOVERALL MORNINGSTAR RATING™: ��
OVERALL # OF FUNDS IN MORNINGSTAR CATEGORY: 650
PORTFOLIO MANAGERS: Jane Doe John Doe
CUMULATIVE RETURNS AVERAGE ANNUAL TOTAL RETURNS
Quarter YTD 1 Year 3 Year 5 Year 10 Year Since Inception
Fund 3.54 2.61 12.02 16.51 -1.66 9.29 11.79Mandate Benchmark 3.60 2.77 12.25 16.72 -1.49 9.49 N/A
Morningstar RatingTM – – ���1 ��2 ���3 ���4 –# of Funds in Category – – 822 1227 931 321 –
$0
$5,000
$10,000
$15,000
$20,000
'05'04'03'02'01'00'99'98
Fund Mandate Benchmark
Result of $10,000 Investment
C
A
B
C
D
E
F
G
H
I
J
K
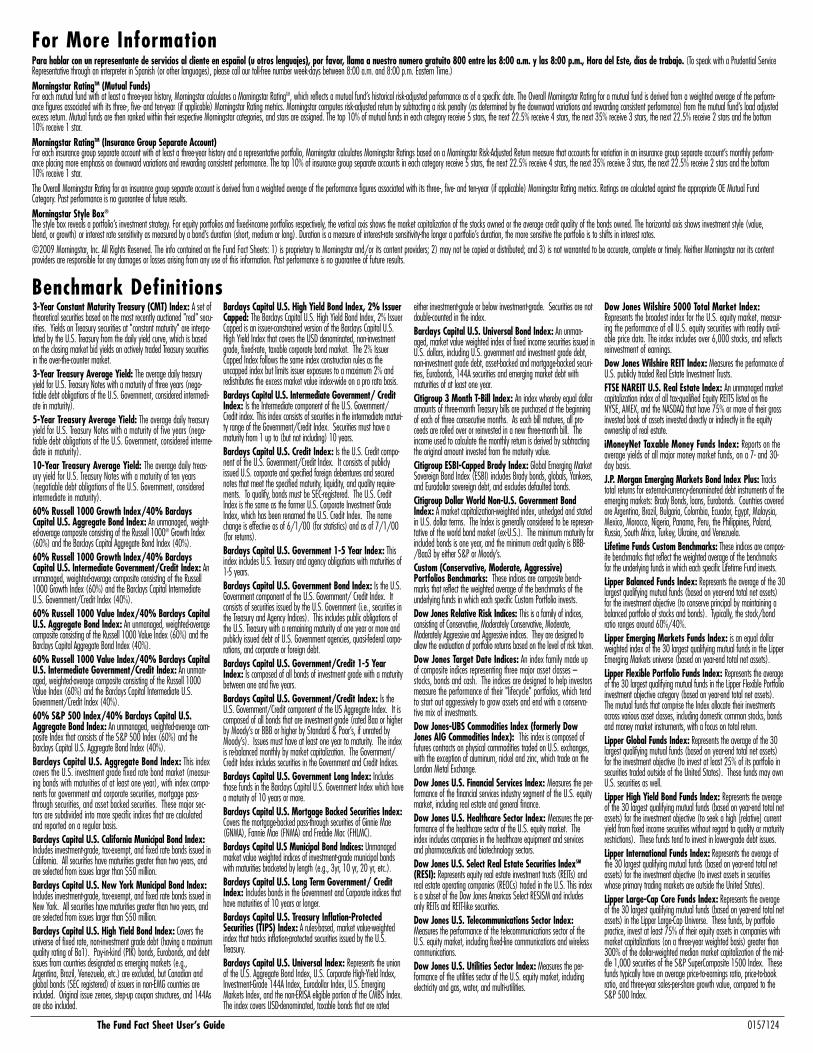
The Fund Fact Sheet User’s Guide 0157124
For More InformationPara hablar con un representante de servicios al cliente en español (u otros lenguajes), por favor, llama a nuestro numero gratuito 800 entre las 8:00 a.m. y las 8:00 p.m., Hora del Este, días de trabajo. (To speak with a Prudential ServiceRepresentative through an interpreter in Spanish (or other languages), please call our toll-free number week-days between 8:00 a.m. and 8:00 p.m. Eastern Time.)Morningstar RatingTM (Mutual Funds)For each mutual fund with at least a three-year history, Morningstar calculates a Morningstar RatingTM, which reflects a mutual fund’s historical risk-adjusted performance as of a specific date. The Overall Morningstar Rating for a mutual fund is derived from a weighted average of the perform-ance figures associated with its three-, five- and ten-year (if applicable) Morningstar Rating metrics. Morningstar computes risk-adjusted return by subtracting a risk penalty (as determined by the downward variations and rewarding consistent performance) from the mutual fund’s load adjustedexcess return. Mutual funds are then ranked within their respective Morningstar categories, and stars are assigned. The top 10% of mutual funds in each category receive 5 stars, the next 22.5% receive 4 stars, the next 35% receive 3 stars, the next 22.5% receive 2 stars and the bottom10% receive 1 star.Morningstar RatingTM (Insurance Group Separate Account)For each insurance group separate account with at least a three-year history and a representative portfolio, Morningstar calculates Morningstar Ratings based on a Morningstar Risk-Adjusted Return measure that accounts for variation in an insurance group separate account’s monthly perform-ance placing more emphasis on downward variations and rewarding consistent performance. The top 10% of insurance group separate accounts in each category receive 5 stars, the next 22.5% receive 4 stars, the next 35% receive 3 stars, the next 22.5% receive 2 stars and the bottom10% receive 1 star. The Overall Morningstar Rating for an insurance group separate account is derived from a weighted average of the performance figures associated with its three-, five- and ten-year (if applicable) Morningstar Rating metrics. Ratings are calculated against the appropriate OE Mutual FundCategory. Past performance is no guarantee of future results. Morningstar Style Box®
The style box reveals a portfolio’s investment strategy. For equity portfolios and fixed-income portfolios respectively, the vertical axis shows the market capitalization of the stocks owned or the average credit quality of the bonds owned. The horizontal axis shows investment style (value,blend, or growth) or interest rate sensitivity as measured by a bond’s duration (short, medium or long). Duration is a measure of interest-rate sensitivity-the longer a portfolio’s duration, the more sensitive the portfolio is to shifts in interest rates.©2009 Morningstar, Inc. All Rights Reserved. The info contained on the Fund Fact Sheets: 1) is proprietary to Morningstar and/or its content providers; 2) may not be copied or distributed; and 3) is not warranted to be accurate, complete or timely. Neither Morningstar nor its contentproviders are responsible for any damages or losses arising from any use of this information. Past performance is no guarantee of future results.
3-Year Constant Maturity Treasury (CMT) Index: A set oftheoretical securities based on the most recently auctioned "real" secu-rities. Yields on Treasury securities at "constant maturity" are interpo-lated by the U.S. Treasury from the daily yield curve, which is basedon the closing market bid yields on actively traded Treasury securitiesin the over-the-counter market.3-Year Treasury Average Yield: The average daily treasuryyield for U.S. Treasury Notes with a maturity of three years (nego-tiable debt obligations of the U.S. Government, considered intermedi-ate in maturity).5-Year Treasury Average Yield: The average daily treasuryyield for U.S. Treasury Notes with a maturity of five years (nego-tiable debt obligations of the U.S. Government, considered interme-diate in maturity).10-Year Treasury Average Yield: The average daily treas-ury yield for U.S. Treasury Notes with a maturity of ten years(negotiable debt obligations of the U.S. Government, consideredintermediate in maturity).60% Russell 1000 Growth Index/40% BarclaysCapital U.S. Aggregate Bond Index: An unmanaged, weight-ed-average composite consisting of the Russell 1000® Growth Index(60%) and the Barclays Capital Aggregate Bond Index (40%).60% Russell 1000 Growth Index/40% BarclaysCapital U.S. Intermediate Government/Credit Index: Anunmanaged, weighted-average composite consisting of the Russell1000 Growth Index (60%) and the Barclays Capital IntermediateU.S. Government/Credit Index (40%).60% Russell 1000 Value Index/40% Barclays CapitalU.S. Aggregate Bond Index: An unmanaged, weighted-averagecomposite consisting of the Russell 1000 Value Index (60%) and theBarclays Capital Aggregate Bond Index (40%).60% Russell 1000 Value Index/40% Barclays CapitalU.S. Intermediate Government/Credit Index: An unman-aged, weighted-average composite consisting of the Russell 1000Value Index (60%) and the Barclays Capital Intermediate U.S.Government/Credit Index (40%).60% S&P 500 Index/40% Barclays Capital U.S.Aggregate Bond Index: An unmanaged, weighted-average com-posite Index that consists of the S&P 500 Index (60%) and theBarclays Capital U.S. Aggregate Bond Index (40%).Barclays Capital U.S. Aggregate Bond Index: This indexcovers the U.S. investment grade fixed rate bond market (measur-ing bonds with maturities of at least one year), with index compo-nents for government and corporate securities, mortgage pass-through securities, and asset backed securities. These major sec-tors are subdivided into more specific indices that are calculatedand reported on a regular basis.Barclays Capital U.S. California Municipal Bond Index:Includes investment-grade, tax-exempt, and fixed rate bonds issued inCalifornia. All securities have maturities greater than two years, andare selected from issues larger than $50 million.Barclays Capital U.S. New York Municipal Bond Index:Includes investment-grade, tax-exempt, and fixed rate bonds issued inNew York. All securities have maturities greater than two years, andare selected from issues larger than $50 million. Barclays Capital U.S. High Yield Bond Index: Covers theuniverse of fixed rate, non-investment grade debt (having a maximumquality rating of Ba1). Pay-in-kind (PIK) bonds, Eurobonds, and debtissues from countries designated as emerging markets (e.g.,Argentina, Brazil, Venezuela, etc.) are excluded, but Canadian andglobal bonds (SEC registered) of issuers in non-EMG countries areincluded. Original issue zeroes, step-up coupon structures, and 144Asare also included.
Barclays Capital U.S. High Yield Bond Index, 2% IssuerCapped: The Barclays Capital U.S. High Yield Bond Index, 2% IssuerCapped is an issuer-constrained version of the Barclays Capital U.S.High Yield Index that covers the USD denominated, non-investmentgrade, fixed-rate, taxable corporate bond market. The 2% IssuerCapped Index follows the same index construction rules as theuncapped index but limits issuer exposures to a maximum 2% andredistributes the excess market value index-wide on a pro rata basis.Barclays Capital U.S. Intermediate Government/ CreditIndex: Is the Intermediate component of the U.S. Government/Credit index. This index consists of securities in the intermediate maturi-ty range of the Government/Credit Index. Securities must have amaturity from 1 up to (but not including) 10 years.Barclays Capital U.S. Credit Index: Is the U.S. Credit compo-nent of the U.S. Government/Credit Index. It consists of publiclyissued U.S. corporate and specified foreign debentures and securednotes that meet the specified maturity, liquidity, and quality require-ments. To qualify, bonds must be SEC-registered. The U.S. CreditIndex is the same as the former U.S. Corporate Investment GradeIndex, which has been renamed the U.S. Credit Index. The namechange is effective as of 6/1/00 (for statistics) and as of 7/1/00(for returns).Barclays Capital U.S. Government 1-5 Year Index: Thisindex includes U.S. Treasury and agency obligations with maturities of1-5 years.Barclays Capital U.S. Government Bond Index: Is the U.S.Government component of the U.S. Government/ Credit Index. Itconsists of securities issued by the U.S. Government (i.e., securities inthe Treasury and Agency Indices). This includes public obligations ofthe U.S. Treasury with a remaining maturity of one year or more andpublicly issued debt of U.S. Government agencies, quasi-federal corpo-rations, and corporate or foreign debt.Barclays Capital U.S. Government/Credit 1-5 YearIndex: Is composed of all bonds of investment grade with a maturitybetween one and five years.Barclays Capital U.S. Government/Credit Index: Is theU.S. Government/Credit component of the US Aggregate Index. It iscomposed of all bonds that are investment grade (rated Baa or higherby Moody’s or BBB or higher by Standard & Poor’s, if unrated byMoody’s). Issues must have at least one year to maturity. The indexis re-balanced monthly by market capitalization. The Government/Credit Index includes securities in the Government and Credit Indices.Barclays Capital U.S. Government Long Index: Includesthose funds in the Barclays Capital U.S. Government Index which havea maturity of 10 years or more.Barclays Capital U.S. Mortgage Backed Securities Index:Covers the mortgage-backed pass-through securities of Ginnie Mae(GNMA), Fannie Mae (FNMA) and Freddie Mac (FHLMC).Barclays Capital U.S Municipal Bond Indices: Unmanagedmarket value weighted indices of investment-grade municipal bondswith maturities bracketed by length (e.g., 3yr, 10 yr, 20 yr, etc.).Barclays Capital U.S. Long Term Government/ CreditIndex: Includes bonds in the Government and Corporate indices thathave maturities of 10 years or longer.Barclays Capital U.S. Treasury Inflation-ProtectedSecurities (TIPS) Index: A rules-based, market value-weightedindex that tracks inflation-protected securities issued by the U.S.Treasury.Barclays Capital U.S. Universal Index: Represents the unionof the U.S. Aggregate Bond Index, U.S. Corporate High-Yield Index,Investment-Grade 144A Index, Eurodollar Index, U.S. EmergingMarkets Index, and the non-ERISA eligible portion of the CMBS Index.The index covers USD-denominated, taxable bonds that are rated
either investment-grade or below investment-grade. Securities are notdouble-counted in the index.Barclays Capital U.S. Universal Bond Index: An unman-aged, market value weighted index of fixed income securities issued inU.S. dollars, including U.S. government and investment grade debt,non-investment grade debt, asset-backed and mortgage-backed securi-ties, Eurobonds, 144A securities and emerging market debt withmaturities of at least one year. Citigroup 3 Month T-Bill Index: An index whereby equal dollaramounts of three-month Treasury bills are purchased at the beginningof each of three consecutive months. As each bill matures, all pro-ceeds are rolled over or reinvested in a new three-month bill. Theincome used to calculate the monthly return is derived by subtractingthe original amount invested from the maturity value.Citigroup ESBI-Capped Brady Index: Global Emerging MarketSovereign Bond Index (ESBI) includes Brady bonds, globals, Yankees,and Eurodollar sovereign debt, and excludes defaulted bonds.Citigroup Dollar World Non-U.S. Government BondIndex: A market capitalization-weighted index, unhedged and statedin U.S. dollar terms. The Index is generally considered to be represen-tative of the world bond market (ex-U.S.). The minimum maturity forincluded bonds is one year, and the minimum credit quality is BBB-/Baa3 by either S&P or Moody’s.Custom (Conservative, Moderate, Aggressive)Portfolios Benchmarks: These indices are composite bench-marks that reflect the weighted average of the benchmarks of theunderlying funds in which each specific Custom Portfolio invests.Dow Jones Relative Risk Indices: This is a family of indices,consisting of Conservative, Moderately Conservative, Moderate,Moderately Aggressive and Aggressive indices. They are designed toallow the evaluation of portfolio returns based on the level of risk taken.Dow Jones Target Date Indices: An index family made upof composite indices representing three major asset classes –stocks, bonds and cash. The indices are designed to help investorsmeasure the performance of their "lifecycle" portfolios, which tendto start out aggressively to grow assets and end with a conserva-tive mix of investments.Dow Jones-UBS Commodities Index (formerly DowJones AIG Commodities Index): This index is composed offutures contracts on physical commodities traded on U.S. exchanges,with the exception of aluminum, nickel and zinc, which trade on theLondon Metal Exchange.Dow Jones U.S. Financial Services Index: Measures the per-formance of the financial services industry segment of the U.S. equitymarket, including real estate and general finance.Dow Jones U.S. Healthcare Sector Index: Measures the per-formance of the healthcare sector of the U.S. equity market. Theindex includes companies in the healthcare equipment and servicesand pharmaceuticals and biotechnology sectors.Dow Jones U.S. Select Real Estate Securities IndexSM
(RESI): Represents equity real estate investment trusts (REITs) andreal estate operating companies (REOCs) traded in the U.S. This indexis a subset of the Dow Jones Americas Select RESISM and includesonly REITs and REIT-like securities.Dow Jones U.S. Telecommunications Sector Index:Measures the performance of the telecommunications sector of theU.S. equity market, including fixed-line communications and wirelesscommunications.Dow Jones U.S. Utilities Sector Index: Measures the per-formance of the utilities sector of the U.S. equity market, includingelectricity and gas, water, and multi-utilities.
Dow Jones Wilshire 5000 Total Market Index:Represents the broadest index for the U.S. equity market, measur-ing the performance of all U.S. equity securities with readily avail-able price data. The index includes over 6,000 stocks, and reflectsreinvestment of earnings.Dow Jones Wilshire REIT Index: Measures the performance ofU.S. publicly traded Real Estate Investment Trusts.FTSE NAREIT U.S. Real Estate Index: An unmanaged marketcapitalization index of all tax-qualified Equity REITS listed on theNYSE, AMEX, and the NASDAQ that have 75% or more of their grossinvested book of assets invested directly or indirectly in the equityownership of real estate.iMoneyNet Taxable Money Funds Index: Reports on theaverage yields of all major money market funds, on a 7- and 30-day basis.J.P. Morgan Emerging Markets Bond Index Plus: Trackstotal returns for external-currency-denominated debt instruments of theemerging markets: Brady Bonds, loans, Eurobonds. Countries coveredare Argentina, Brazil, Bulgaria, Colombia, Ecuador, Egypt, Malaysia,Mexico, Morocco, Nigeria, Panama, Peru, the Philippines, Poland,Russia, South Africa, Turkey, Ukraine, and Venezuela.Lifetime Funds Custom Benchmarks: These indices are compos-ite benchmarks that reflect the weighted average of the benchmarksfor the underlying funds in which each specific Lifetime Fund invests.Lipper Balanced Funds Index: Represents the average of the 30largest qualifying mutual funds (based on year-end total net assets)for the investment objective (to conserve principal by maintaining abalanced portfolio of stocks and bonds). Typically, the stock/bondratio ranges around 60%/40%.Lipper Emerging Markets Funds Index: is an equal dollarweighted index of the 30 largest qualifying mutual funds in the LipperEmerging Markets universe (based on year-end total net assets).Lipper Flexible Portfolio Funds Index: Represents the averageof the 30 largest qualifying mutual funds in the Lipper Flexible Portfolioinvestment objective category (based on year-end total net assets).The mutual funds that comprise the Index allocate their investmentsacross various asset classes, including domestic common stocks, bondsand money market instruments, with a focus on total return.Lipper Global Funds Index: Represents the average of the 30largest qualifying mutual funds (based on year-end total net assets)for the investment objective (to invest at least 25% of its portfolio insecurities traded outside of the United States). These funds may ownU.S. securities as well.Lipper High Yield Bond Funds Index: Represents the averageof the 30 largest qualifying mutual funds (based on year-end total netassets) for the investment objective (to seek a high [relative] currentyield from fixed income securities without regard to quality or maturityrestrictions). These funds tend to invest in lower-grade debt issues.Lipper International Funds Index: Represents the average ofthe 30 largest qualifying mutual funds (based on year-end total netassets) for the investment objective (to invest assets in securitieswhose primary trading markets are outside the United States).Lipper Large-Cap Core Funds Index: Represents the averageof the 30 largest qualifying mutual funds (based on year-end total netassets) in the Lipper Large-Cap Universe. These funds, by portfoliopractice, invest at least 75% of their equity assets in companies withmarket capitalizations (on a three-year weighted basis) greater than300% of the dollar-weighted median market capitalization of the mid-dle 1,000 securities of the S&P SuperComposite 1500 Index. Thesefunds typically have an average price-to-earnings ratio, price-to-bookratio, and three-year sales-per-share growth value, compared to theS&P 500 Index.
Benchmark Definitions

The Fund Fact Sheet User’s Guide 0157124 revised 1/8/10
Lipper Large-Cap Growth Funds Index: Represents the aver-age of the 30 largest qualifying mutual funds (based on year-end totalnet assets) in the Lipper Large-Cap Universe. These funds, by portfoliopractice, invest at least 75% of their equity assets in companies withmarket capitalizations (on a three-year weighted basis) greater than300% of the dollar-weighted median market capitalization of the mid-dle 1,000 securities of the S&P SuperComposite 1500 Index. Thesefunds typically have an above average price-to-earnings ratio, price-to-book ratio, and three-year sales-per-share growth value, compared tothe S&P 500 Index.Lipper Large-Cap Value Funds Index: Represents the averageof the 30 largest qualifying mutual funds (based on year-end total netassets) in the Lipper Large-Cap Universe. These funds, by portfoliopractice, invest at least 75% of their equity assets in companies withmarket capitalizations (on a three-year weighted basis) greater than300% of the dollar-weighted median market capitalization of the mid-dle 1,000 securities of the S&P SuperComposite 1500 Index. Thesefunds typically have a below average price-to-earnings ratio, price-to-book ratio, and three-year sales-per-share growth value, compared tothe S&P 500 Index.Lipper Mid-Cap Core Funds Index: Represents the average ofthe 30 largest qualifying mutual funds (based on year-end total netassets) in the Lipper Mid-Cap Universe. These funds, by portfolio prac-tice, invest at least 75% of their equity assets in companies with mar-ket capitalizations (on a three-year weighted basis) less than 300% ofthe dollar-weighted median market capitalization of the middle 1,000securities of the S&P SuperComposite 1500 Index. These funds typi-cally have an average price-to-earnings ratio, price-to-book ratio, andthree-year sales-per-share growth value, compared to the S&P Midcap400 Index.Lipper Mid-Cap Growth Funds Index: Represents the averageof the 30 largest qualifying mutual funds (based on year-end total netassets) in the Lipper Mid-Cap Universe. These funds, by portfolio prac-tice, invest at least 75% of their equity assets in companies with mar-ket capitalizations (on a three-year weighted basis) less than 300% ofthe dollar-weighted median market capitalization of the middle 1,000securities of the S&P SuperComposite 1500 Index. These funds typi-cally have an above average price-to-earnings ratio, price-to-book ratio,and three-year sales-per-share growth value, compared to the S&PMidcap 400 Index.Lipper Mid-Cap Value Funds Index: Represents the average ofthe 30 largest qualifying mutual funds (based on year-end total netassets) in the Lipper Mid-Cap Universe. These funds, by portfolio prac-tice, invest at least 75% of their equity assets in companies with mar-ket capitalizations (on a three-year weighted basis) less than 300% ofthe dollar-weighted median market capitalization of the middle 1,000securities of the S&P SuperComposite 1500 Index. These funds typi-cally have a below average price-to-earnings ratio, price-to-book ratio,and three-year sales-per-share growth value, compared to the S&PMidcap 400 Index. Lipper Real Estate Funds Index: An equally weighted index ofthe 30 largest qualifying mutual funds (based on year-end total netassets) in the Lipper Real Estate universe. These funds invest at least65% of their portfolios in equity securities of domestic and foreign com-panies engaged in the real estate industry.Lipper Science and Technology Funds Index: Represents theaverage of the 30 largest qualifying mutual funds in the Lipper Scienceand Technology universe (based on year-end total net assets). Thesefunds, by portfolio practice, invest at least 65% of their equity assets inscience and technology stocks.Lipper Small-Cap Core Funds Index: Represents the averageof the 30 largest qualifying mutual funds (based on year-end totalnet assets) in the Lipper Small-Cap Universe. These funds, by port-folio practice, invest at least 75% of their equity assets in compa-nies with market capitalizations (on a three-year weighted basis)less than 250% of the dollar-weighted median of the smallest 500of the middle 1,000 securities of the S&P SuperComposite 1500Index. These funds typically have an average price-to-earnings ratio,price-to-book ratio, and three-year sales-per-share growth value,compared to the S&P SmallCap 600 Index.Lipper Small-Cap Growth Funds Index: Represents the aver-age of the 30 largest qualifying mutual funds (based on year-end totalnet assets) in the Lipper Small-Cap Universe. These funds, by portfoliopractice, invest at least 75% of their equity assets in companies withmarket capitalizations (on a three-year weighted basis) less than250% of the dollar-weighted median of the smallest 500 of the mid-dle 1,000 securities of the S&P SuperComposite 1500 Index. Thesefunds typically have an above average price-to-earnings ratio, price-to-book ratio, and three-year sales-per-share growth value, compared tothe S&P SmallCap 600 Index.Lipper Small-Cap Value Funds Index: Represents the averageof the 30 largest qualifying mutual funds (based on year-end total netassets) in the Lipper Small-Cap Universe. These funds, by portfoliopractice, invest at least 75% of their equity assets in companies withmarket capitalizations (on a three-year weighted basis) less than250% of the dollar-weighted median of the smallest 500 of the mid-dle 1,000 securities of the S&P SuperComposite 1500 Index. Thesefunds typically have a below average price-to-earnings ratio, price-to-
book ratio, and three-year sales-per-share growth value, compared tothe S&P SmallCap 600 Index.Merrill Lynch 3-Month U.S. Treasury Bill Index: Is com-prised of a single issue purchased at the beginning of the month andheld for a full month. Each month the index is rebalanced and theissue selected is the outstanding Treasury Bill that matures closest to,but not beyond 3 months from the rebalancing date.Merrill Lynch All Convertibles/All Qualities Index: Anunmanaged index that measures the performance of U.S. dollar-denominated convertible securities not currently in bankruptcy with atotal market value greater than $50 million at issuance.Merrill Lynch High Yield Master II Index: An unmanagedindex that tracks the performance of below-investment-grade, U.S. dol-lar-denominated corporate bonds publicly issued in the U.S. domesticmarket.Morgan Stanley REIT Index: A capitalization-weighted bench-mark index of the most actively traded real estate investment trusts(REITs), designed to measure real estate equity performance.MSCI All Country Far East Ex. Japan Index: A free float-adjusted market capitalization weighted index that is designed tomeasure the equity market performance of the Far East, excludingJapan.MSCI All Country World Ex. U.S. Index: Designed to meas-ure equity performance in the global developed and emerging marketsexcluding the United States.MSCI All Country World Ex. U.S. Growth Index: Includesthose firms in the MSCI All Country World Ex. U.S. Index with higherprice to book value (P/BV) ratios.MSCI EAFE Growth Index (net): A market capitalization-weighted index comprised of those firms in the MSCI EAFE Indexwith higher price/book value (P/BV) ratios relative to their respec-tive MSCI country index, and assumes reinvestment of dividendsafter withholding tax.MSCI EAFE Index (net): A market capitalization-weighted indexcomprised of companies representative of the market structure of 21developed market countries in Europe, Australia and the Far East. TheMSCI EAFE Index is available both in local currency and U.S. dollarterms. The returns shown in the performance chart are calculated withdividends reinvested and are net of foreign withholding tax.MSCI EAFE Value Index (net): A market capitalization-weightedindex comprised of those firms in the MSCI EAFE Index with lowerprice/book value (P/BV) ratios relative to their respective MSCI coun-try index.MSCI EMF Index (net): A market capitalization-weighted indexcomprised of companies representative of the market structure of 25emerging market countries open to foreign investment. The MSCI EMFIndex excludes closed markets and those shares in otherwise openmarkets that are not available for purchase by foreigners. The returnsshown in the performance chart are calculated with dividends reinvest-ed and are net of foreign withholding tax. The index is available bothin local currency and U.S. dollar terms.MSCI EM (Emerging Markets) Latin America Index: Is afree float-adjusted market capitalization weighted index that isdesigned to measure the equity market performance of emerging mar-kets in Latin America.MSCI Europe index: A market capitalization-weighted index madeup of equities from 15 European countries. France, Germany and theUnited Kingdom represent about two-thirds of the index.MSCI Japan Index: A capitalization-weighted index that aims tocapture 85% of the publicly available total market capitalization of theJapanese equity market.MSCI Metals/Mining Index: Consists of companies conductingbusiness in the aluminum, diversified metals and mining, gold, preciousmetals and minerals and steel industries.MSCI Pacific Free Index: A market capitalization-weighted indexmade up of equities from Pacific Basin countries. Japan representsabout three-fourths of the index.MSCI World Growth Index (net): A market capitalization-weighted index comprised of that half of the MSCI World Index withhigher price/book value (P/BV) ratios relative to their respectiveMSCI country index. The returns shown in the performance chartare calculated with dividends reinvested and net of foreign withhold-ing tax.MSCI World Index: A market capitalization-weighted index com-prised of companies representative of the market structure of 23 devel-oped market countries in North America (including the U.S.), Europeand the Asia/Pacific region. The MSCI World Index is available both inlocal currency and U.S. dollar terms. The "net" version of the index iscalculated with dividends reinvested and net of foreign withholding tax. MSCI World Ex US Index: Comprises the entire developed worldless the United States. The designation of a country as developed aris-es primarily as a measurement of GDP per capita. MSCI World Real Estate Index: A sub-index of the MSCI WorldIndex representing only securities in the GICS Real Estate Industry Group.
MSCI World Small Cap Index: Attempts to represent the busi-ness activities of small cap companies across developed markets.MSCI selects the most liquid securities relative to their market capital-ization, and targets for index inclusion 40% of the full market capital-ization of the eligible small cap universe within each industry group,within each country.MSCI World Value Index (net): A market capitalization-weighted index comprised of that half of the MSCI World Index withlower price/book value (P/BV) ratios relative to their respectiveMSCI country index.National Association of Real Estate InvestmentFiduciaries (NCREIF) Open-End Diversified Core EquityFund Index (NFI-ODCE): This index measures fund perform-ance in the private real estate industry by aggregating the perform-ance of a group of 14 open-end funds with core investment strate-gies. The component mutual funds invest primarily in the majorproperty types within the U.S., with modest leverage. Establishedin May 2005, the index is released on both a gross and net-of-investment-management-fees basis.NYSE Arca Tech Index: Is comprised of 100 listed and over-the-counter securities of companies from different industries thatproduce or deploy innovative technologies to conduct their busi-ness. Industries include computer hardware, software, semiconduc-tors, telecommunications, data storage and processing, electronicsand biotechnology.Prudential/Lazard LifeStyle Funds Custom Benchmarks:Composite benchmarks that reflect the weighted average of the bench-marks for the underlying funds in which each Prudential/LazardLifeStyle Fund invests.Retirement Goal Custom Benchmarks: These indices arecomposite benchmarks that reflect the weighted average of the bench-marks of the underlying funds in which each specific Retirement GoalFund invests.Russell 1000® Growth Index: A market capitalization-weightedindex that measures the performance of those Russell 1000 companieswith higher price-to-book ratios and higher forecasted growth rates.Russell 1000® Index: A market capitalization-weighted index thatmeasures the performance of the 1,000 largest companies in theRussell 3000® Index, which represents approximately 92% of the totalmarket capitalization of the Russell 3000 Index.Russell 1000® Value Index: A market capitalization-weightedindex that measures the performance of those Russell 1000 companieswith lower price-to-book ratios and lower forecasted growth rates.Russell 2000® Growth Index: A market capitalization-weightedindex that measures the performance of those Russell 2000 companieswith higher price-to-book ratios and higher forecasted growth rates.Russell 2000® Index: A market capitalization-weighted index thatmeasures the performance of the 2,000 smallest companies in theRussell 3000® Index, which represents approximately 8% of the totalmarket capitalization of the Russell 3000 Index.Russell 2000® Value Index: A market capitalization-weightedindex that measures the performance of those Russell 2000 compa-nies with lower price-to-book ratios and lower forecasted growth rates. Russell 2500® Growth Index: A market capitalization-weighted index that measures the performance of those Russell2500 companies with higher price-to-book ratios and higher fore-casted growth rates.Russell 2500® Index: A market capitalization-weighted indexthat measures the performance of the 2,500 smallest companies inthe Russell 3000 Index.Russell 2500® Value Index: A market capitalization-weight-ed index that measures the performance of those Russell 2500companies with lower price-to-book ratios and lower forecastedgrowth rates. Russell 3000 Growth Index: A market capitalization-weight-ed index that measures the performance of those Russell 3000companies with higher price-to-book ratios and higher forecastedgrowth rates.Russell 3000 Value Index: A market capitalization-weightedindex that measures the performance of those Russell 3000 Indexcompanies with lower price-to-book ratios and lower forecastedgrowth rates. The stocks in this index are also members of eitherthe Russell 1000 Value or the Russell 2000 Value indexes.Russell 3000® Index: A market capitalization-weighted indexthat measures the performance of the 3,000 largest U.S. compa-nies based on total market capitalization, which represents approxi-mately 98% of the investable U.S. equity market.Russell Midcap® Growth Index: A market capitalization-weighted index that measures the performance of those RussellMidcap companies with higher price-to-book ratios and higher fore-casted growth rates. The stocks are also members of the Russell1000® Growth Index.Russell Midcap® Index: A market capitalization-weightedindex that measures the performance of the 800 smallest compa-nies in the Russell 1000® Index, which represent approximately
30% of the total market capitalization of the Russell 1000 Index.Russell Midcap® Value Index: A market capitalization-weighted index that measures the performance of those RussellMidcap companies with lower price-to-book ratios and lower fore-casted growth rates. The stocks are also members of the Russell1000® Value Index.S&P 1500 Energy Index: This is an unmanaged capitaliza-tion-weighted index comprising companies in the Energy sector asdetermined by S&P. Total returns for the index include the rein-vestment of dividends and capital gain distributions, but do notreflect the costs of managing a mutual fund.S&P 1500 Industrials Index: This is an unmanaged capital-ization-weighted index comprising companies in the Industrials sec-tor as determined by S&P. Total returns for the index include thereinvestment of dividends and capital gain distributions beginningon January 1, 2002. Index returns with reinvested dividends anddistributions are unavailable prior to that date. Total returns for theindices include the reinvestment of dividends and capital gain distri-butions, but do not reflect the costs of managing a mutual fund.S&P 500® Index: (registered trademark of The McGraw-HillCompanies, Inc.) is an unmanaged index of 500 common stocksprimarily traded on the New York Stock Exchange, weighted by market capitalization. Index performance includes the reinvestmentof dividends and capital gains.S&P 500/Citigroup Value Index: Standard & Poor’s andCitigroup cooperate to employ a value calculation, whereby themarket capitalization of the S&P 500 Index uses a multi-factormethodology to calculate growth and value in separate dimensions.Style scores are calculated taking standardized measures of 3growth factors and 4 value factors for each constituent. The mini-mum market capitalization of any constituent of the S&P500/Citigroup Value Index is $4 billion.S&P Composite 1500® Index: Combining the S&P 500®,S&P MidCap 400® and S&P SmallCap 600® indices is an efficientway to create a broad market portfolio representing about 85% ofU.S. equities. This combination addresses the needs of investorswanting broader exposure beyond the S&P 500®. S&P MidCap 400 Index: Consists of 400 domestic stockschosen for market size, liquidity, and industry group representation.It is a market-weighted index, with each stock affecting the Indexin proportion to its market value. The market capitalization of eachconstituent in the S&P MidCap 400 Index is between $1 billionand $4.5 billion.S&P North American Natural Resources Sector Index:Is a modified capitalization-weighted index. It includes extractiveindustries, energy companies, owners and operators of timbertracts, forestry services, producers of pulp and paper, and ownersof plantations.S&P Technology Index: Standard & Poor’s offers sectorindices on the S&P 500 based upon the Global IndustryClassification Standard (GICS®). This standard is jointly owned byStandard & Poor’s and MSCI. Each stock is classified into one of10 sectors, 24 industry groups, 64 industries and 139 sub-indus-tries according to their largest source of revenue. Standard &Poor’s and MSCI jointly determine all classifications. The 10 sec-tors are Consumer Discretionary, Consumer Staples, Energy,Financials, Health Care, Industrials, Information Technology,Materials, Telecommunication Services and Utilities. These indicesare calculated using the same guiding principles that apply to allStandard & Poor’s indices.The Morningstar Lifetime Moderate Indices: This seriesof indices represents portfolios of global equities, bonds and tradi-tional inflation hedges such as commodities and TIPS. The portfo-lios are held in proportions appropriate for U.S. investors whoexpect to retire during the indicated year. The Moderate risk pro-file is for investors who are comfortable with average exposure toequity market volatility.The Morningstar Target Risk Index family: These indicesare designed to meet the benchmarking needs of target riskinvestors by offering an objective yardstick for performance com-parison. The family consists of five indexes covering equity riskpreferences – aggressive, moderately aggressive, moderate, mod-erately conservative and conservative.U.S. Treasury 6 Month Certificate of Deposit (CD)Index: The average of the secondary market interest rates fornationally traded 6 month certificates of deposit.Vanguard Balanced Composite Index: Made up of twounmanaged benchmarks, weighted 60% Dow Jones Wilshire 5000Index and 40% Barclays Capital U.S. Aggregate Bond Indexthrough May 31, 2005; 60% MSCI U.S. Broad Market Index and40% Barclays Capital U.S. Aggregate Bond Index thereafter.Vanguard Wellington Composite Index: is a combinationof unmanaged industry benchmarks: 65% S&P 500 Index and35% Barclays Capital Credit A or Better Index. Prior to March 1,2000, weighted 65% S&P 500 Index and 35% Barclays CapitalLong Credit AA or Better Index.