Embed Size (px)
Citation preview

Executive Summary
INVESTMENT CLIMATE IN ARAB COUNTRIES 2009
September 2010
Research & Studies Division The Arab Investment & Export Credit Guarantee Corporation
(Dhaman)
© 2010 The Arab Investment and Export Credit Guarantee Corporation (Dhaman) Headquarters
The Arab Organizations Headquarters Building Jamal Abdul Nasser Street and Airport Road Intersection,
Shuwaikh, Kuwait P.O.Box: 23568 - Safat 13096
Tel: (965) 24959555, Fax: (965) 24959596/7, 24835489 E-mail: [email protected] Website: www.dhaman.org
All rights reserved.
Dhaman’s Head of the Research & Studies Division Mr. Adel Abdel Azim Ebrahim
e-mail: [email protected] , [email protected] , [email protected]

Investment Climate in Arab Countries 2009
The Arab Investment & Export Credit Guarantee Corp. | Dhaman 1
The Arab Investment and Export Credit Guarantee Corporation (Dhaman) is an autonomous Arab regional organization established in 1974, in accordance with a multi-lateral Convention signed by all Arab states, deposited with the Ministry of Foreign Affairs in the State of Kuwait. With its headquarters in Kuwait and a regional office in Riyadh, Dhaman commenced its operations in mid-1975, encompassing in its membership all Arab states, and a number of Arab international organizations. In accordance with its establishment convention, Dhaman has two key objectives which are to provide insurance coverage against non-commercial risks for inter-Arab and foreign investments in development projects, in the Arab countries. Furthermore, Dhaman provides insurance against commercial and non-commercial risks, for inter-Arab and worldwide Arab export credits, and to raise awareness of investments in Arab countries by means of a group of complementary activities and ancillary services, aiming at enhancing the business environment & investment climate; identifying available investment opportunities, and developing human capital in Arab countries. In fulfillment of such objectives, Dhaman provides, wholly or partially, finance to insured operations through factoring, debt collection, insuring bonds, franchises, licenses, and intellectual property rights. In addition to possessing shares and equities in the Arab public and private national guarantee agencies, establishing information corporations, establishing or co-establishing special investment funds owned by governments or institutions in contracting countries. On the 25th March, 2010, Standard & Poor’s Rating Services upgraded its credit rating for Dhaman to “AA” as an insurer, compared to “AA-” previously assigned for the past two years in a row, as a long term rating for Dhaman’s counterparty credit rating and its financial strength rating. The outlook remains “stable”. Such rating is one of the highest in the region. This volume is a product of the Research & Studies Division of Dhaman. The findings, interpretations, and conclusions expressed herein are those of the author(s) and do not necessarily reflect the views of the Board of Dhaman or the governments they represent. Dhaman does not guarantee the accuracy of the data included in this report. The boundaries, colors, denominations, and other information shown on any map in this work do not imply any judgment on the part of the Dhaman concerning the legal status of any territory or the endorsement or acceptance of such boundaries.
Rights and Permissions
The material in this report is copyrighted. Copying and/or transmitting portions or all of this work without
permission may be a violation of applicable law. Dhaman encourages dissemination of its work and will normally
grant permission promptly.
For permission to photocopy or reprint any part of this work, please send a request to Dhaman, in Kuwait, at the
Arab Organizations Headquarters Building, Jamal Abdul Nasser Street and Airport Road Intersection,
Shuwaikh, Kuwait,P.O.Box: 23568 - Safat 13096, Tel: (965) 24959555, Fax: (965) 24959596/7, 24835489 e-
mail: [email protected]

Investment Climate in Arab Countries 2009
The Arab Investment & Export Credit Guarantee Corp. | Dhaman 2
Table of Contents Preface ........................................................................................................................................................................ 3
Abstract ...................................................................................................................................................................... 4
Investment Climate Composite Indicator: ..................................................................................................................6
Inter-Arab Direct Investments (2009 Estimates): .......................................................................................................7
FDI inflows to the Arab Countries (2009 Estimates): ............................................................................................. 10
Merger & Acquisitions (M&As) Deals: .................................................................................................................. 13
World FDI flows (2009 Estimates): ........................................................................................................................ 14
Trade ....................................................................................................................................................................... 15
Arab Stock Exchange Markets: ............................................................................................................................... 17
Investment legislations ............................................................................................................................................ 18
Dhaman’s Rating in 2010 ........................................................................................................................................ 18
Arab countries composite ratings: ........................................................................................................................... 18
(based on the sovereign rating produced by the international rating agencies) ..................................................... 18
Selected International Indices ................................................................................................................................. 20
Global Competitiveness Index 2009/2010: .............................................................................................................. 20
Global Retail Development Index 2009 ................................................................................................................... 20
The Ease of Doing Business Index 2010 .................................................................................................................. 20
Arab Air Transport Sector; “Arab Air Transport Industry: future prospects in light of the current performance” ............................................. 21

Investment Climate in Arab Countries 2009
The Arab Investment & Export Credit Guarantee Corp. | Dhaman 3
Preface The “Investment Climate in Arab Countries 2009” report is the 25th in a series published by the Arab Investment & Export Credit Guarantee Corporation (Dhaman) since 1985. The report aims to deepen the understanding about the investment climate in Arab countries, its components, performance and trends. Prepared by the research and studies division at Dhaman, the report provides a true insight into the reality of the investment climate in the region. The report features latest developments, improvement or backlash elements in the investment climate, and country promotion efforts targeting more investment flows to the region, taking into account the impact and repercussions of the global economic crisis at the country level, for all Arab countries collectively. The report depended mainly on hard data provided by official and authentic country sources in member states. Data deficiencies were completed from the databases of international sources. The report contains two main parts. The 1st part reflects the key components of investment climate, including the significant political developments, highlighting internal issues, Arab joint action, inter-Arab, regional & international relations. It also tackles economic developments covering; growth rates, internal & external balances, inflation rates, exchange rates, and main updates in Arab stock markets. The report also reviews inter-Arab investment flows, estimations of FDI flows, inter-Arab & foreign trade, policy and legislation developments, and new economy components. In addition to bilateral and multilateral agreements, sovereign ratings, country risk and other ratings in selected international indices closely associated with investment environment, particularly, the Ease of Doing Business Index issued by the World Bank. This year, a new chapter was introduced in the report, “Investment Flows Outlook, 2010”, which features the latest investment flow trends for the current year, and future prospects globally and for Arab countries individually. The 2nd part covers the main theme of this year’s report: “Arab Air Transport Industry: future prospects in light of the current performance”. This topic comes in correspondence with the Arab Summit held in Doha, Qatar during the end of March, 2009, where many crucial topics were discussed, the outcome was a number of decisions and recommendations, of which were, to increase the liberalization of air services, freedom of the air and open skies between Arab countries. The air transport sector plays a major role in the world’s economic activity; many economies rely on this sector to stimulate their economic growth and financial strength. It also acts as an economic catalyst, contributing to FDI flows, trade, tourism, employment and increasing the overall economic efficiency of Arab countries. The air transport sector remains one of the fastest growing sectors of the world economy, especially in Arab countries, hence the launch of several mega projects in this area. Furthermore, the report provides a statistical profile “FDI at a Glance” containing recent economic data and indicators, charts showing the recent performance of (inward/outward) foreign direct investment flows in the Arab countries and FDI data by economic sector. Also, data tables of FDI inflows distributed by the host country. In addition, this section provides updated information related to Arab Investment Promotion Agencies (IPAs) logos, websites, addresses, and contact numbers. Due to differences in the degree of response from member countries, these factsheets may vary from one country to another.

Investment Climate in Arab Countries 2009
The Arab Investment & Export Credit Guarantee Corp. | Dhaman 4
Abstract Based on the information gathered by Dhaman from Arab countries, preliminary estimates show that the FDI flows into the region during 2009 have been negatively influenced by the global financial & economic crisis, and the markedly FDI global downturn. Inward FDI to 18 out of 21 Arab countries have decreased by approximately 17.7% throughout the year 2009, declining from US$ 98.1 billion in 2008, to US$ 80.7 billion in 2009. This is a clear indication that Arab countries have been unfavorably affected by the repercussions of the global financial and economic crisis which began in 2007 and intensified in August 2008, and also due to the burst of the Dubai real estate bubble in 2008. However, in comparison to the world and other major economic regional groups, the Arab countries have witnessed the least decline in FDI inflows during the year 2009, thus, proving that the region still maintains the ability to attract FDI flows. After the global economic downturn occurred in 2009, the outlooks of economic performance in Arab region are set to improve, along with the global recovery. Global FDI flows have witnessed a modest recovery in 2010 after the drastic decline in 2009. These factors pave the way for getting back solid growth rates in the Arab countries region. They should be a key driver in returning the appetite for investment of foreign capital flows into the region. Accordingly, it is projected that the region will most likely realize moderate growth in 2010, and FDI prospects are set to gain momentum throughout the year. Arab countries have continued to apply reforms to strengthen and liberalize the region’s economies, in order to make them more attractive to foreign capital, as a matter of fact, the rapid growth of Arab countries in the past decade has attracted, and been facilitated by FDI flows, which has increased substantially in recent decades. Part of the reason for this is that most of Arab countries have removed restrictions and implemented a policy to attract FDI inflows in order to benefit from the investments and potential spillover effects. As a result of policies adopted to facilitate FDI inflows into Arab countries, inter-Arab direct investment flows, as a part of the total FDI received by the region, has been markedly increased, especially during the recent years, these increases have provided a cushioning for the crisis, and play an essential role to support the ongoing recovery. Inter-Arab investments have grown slowly but steadily over the period of 1995-2003. Then, it began to increase sharply in 2004 and have maintained this expansion in the years that followed. Such a sudden rise may mainly be attributed to higher international oil prices during the past few years on one hand, and the general trend in policy changes over the same period, suggesting the reduction of FDI restrictions and a more welcoming investment climate, as well as the elimination of most tariffs amongst the 17 members of GAFTA (Greater Arab Free Trade Area) in January 2005, which was the climax point of inter-Arab Investment flows, reaching the highest value of flows. Then in 2006, flows decreased in comparison to their level in 2005, however this level was still more than double that of the 2004, and there has been a continuous increase ever since, until 2009, where the repercussions of the global economical and financial crisis played a major role in the decline of Inter-Arab FDI inflows, alongside the Dubai crisis. According to data collected by Dhaman from 8 Arab countries, inter-Arab direct investments flows totaled US$ 19.2 billion in 2009 compared to US$ 20.7 billion received by the same 8 countries in 2008. This reflects a minor decrease in inter-Arab inflows of 7% throughout the year 2009. However, by using the data available for 13 Arab countries in 2008, inter-Arab direct investments reached US$ 35.4 billion during the year, therefore declining by 45.6%, compared to that figure.

Investment Climate in Arab Countries 2009
The Arab Investment & Export Credit Guarantee Corp. | Dhaman 5
It is well known that endogenous theory of economic growth provides powerful reasons to consider FDI as a crucial factor in growing process, and vice versa. Many studies have highlighted the positive effects of FDI, especially with respect to its stability advantages on other types of capital flows, the know-how transfers which often accompany such investments, upgrading infrastructure and labor skills. In fact, the potential benefits of FDI extend far beyond the financial resources- but costs may be entailed as well. As a matter of fact, governments throughout the region have been striving to find an appropriate policy mix for FDI that will maximize the net benefits for their economies. Consequently, there is considerable variation in policies and experiences with FDI across countries, reflecting differing economic, social and political conditions, as noted in the following sections.

Investment Climate in Arab Countries 2009
The Arab Investment & Export Credit Guarantee Corp. | Dhaman 6
Investment Climate Composite Indicator:1 This year’s report reveals that the investment climate in Arab countries has not been as stable as it has been in the past few years. This is shown in the decrease of the Composite Indicator of Investment Climate to 0.70 in 2009, compared to 1.05 a year earlier. This decrease comes as a natural outcome to the unprecedented turmoil of the global economy. It also comes as a result of the decline in the sub-indices: External balance index (current account balance as a percent of GDP), to -1.72 in 2009, from 5.97 in 2008. Internal balance index (budget deficit or surplus as a percent of GDP), to -2.46 from 5.79 in 2008. On the other hand, there was an improvement in one sub-index though, the Monetary policy index (measured by the inflation rate based on Consumer Price Index-CPI prevailed in each Arab country) which reached 3.18 in 2009, from 10.19 in 2008. Based on the data available from a total of 19 Arab countries, the external balance index improved in 14 Arab countries and dropped in 5 countries, while the external balance index improved in 8 countries and dropped in 11 countries. Nevertheless, inflation decreased in 17 Arab countries, and increased in only 2 countries, ranging between 0.97% and 16.24% in 14 countries, while three Arab countries witnessed a deflation ranging between 0.68% and 4.87%. Inflation pressures have been evidently reduced across most of the region, as its rates based on CPI price level recorded an average of 3.18% in 2009, in comparison to 10.19% reached during 2008. Only two Arab countries reflected two digits inflation rates during 2009, compared to 12 Arab countries in 2008. However, inflationary pressures are rising as a result of the increase in commodity prices and the tightening of the real estate markets. Therefore, Arab countries need to aim at preventing the buildup in inflationary pressures for the coming years. Exchange rate trends have become less uniform across the region. However, due to fixed exchange rate regimes adopted by the majority of Arab countries, nominal exchange rates against the US Dollar remained mostly stable. According to Figure (1), there is a direct and positive relationship between the lagged value of the Composite Index of Arab countries in the Investment Climate Report and the FDI flows (as a % of the World’s FDI inflows) into these Arab countries, this relationship has been consistent for the entire specified period, except for the years 2000 and 2005.
1 Statistical Appendix: Table (1)
0.0
0.5
1.0
1.5
2.0
0.0%
2.0%
4.0%
6.0%
Co
mp
osite
Ind
ex
FDI F
low
s
Figure (1): Arab Countries Composite Index & FDI Inflows
Arab Countries FDI inflow (% Global FDI inflows) Composite Index of Arab Countries' Investment Climate

Investment Climate in Arab Countries 2009
The Arab Investment & Export Credit Guarantee Corp. | Dhaman 7
Inter-Arab Direct Investments (2009 Estimates):2 According to data collected by Dhaman from 8 Arab countries, inter-Arab direct investments totaled US$ 19.2 billion in 2009 compared to US$ 20.7 billion received by the same 8 countries in 2008. This reflects a minor decrease in inter-Arab inflows of 7% throughout the year 2009. However, by using the data available for 13 Arab countries3 in 2008, inter-Arab direct investments reached US$ 35.4 billion during the year. In comparison to that figure, this reflects a severe decline of 45.6%. Based on the data for the eight countries which provided data for both years 2008 and 2009, inter-Arab direct investments increased in four Arab countries while dropped in the rest. Looking at Figure (2), it is evident that the largest share of inter-Arab direct investments in 2009 was directed to Saudi Arabia, with a value of US$ 11.6 billion or more than 60% of the total inter-Arab investments for the year, followed by UAE, Egypt, Jordan and Yemen. As a result, accumulated stock of inter-Arab direct investment increased to reach around US$ 163.4 billion over the period of 1985-2009, from US$ 144.2 billion over the period 1985-2008. This means that the annual average flows increased to US$ 6.8 billion during the period 1985-2009, from US$ 6.2 billion during the period of (1985-2008). Compared to flows of US$ 1.43 billion in 1995, inter-Arab direct investments amounted to US$ 19.2 billion in 2009, reaching a total accumulated value of US$ 155.8 billion for the period (1995-2009). Saudi Arabia still tops that list with an accumulated total of US$ 64.3 billion for the period (1995-2009), followed by Sudan with US$ 16.4 billion, Lebanon US$ 14.8 billion, Egypt US$ 12.9 billion and UAE with US$ 11.9 billion, totaling altogether around US$ 120.2 billion or more than 77% of total inter-Arab direct investments during the period 1995-2009.
2 Statistical Appendix: Table (2)
3 The list includes 5 Arab countries which failed to provide Dhaman with data for inter-Arab investments in 2009.
47
3
39
3 84
1
21
3
32
5
75
6
65
2
64
2
16
4
47
0
2,000
4,000
6,000
8,000
10,000
12,000
14,000
US$
mn
Figure (2): Inter-Arab FDI Inflows
2008
2009
0
5,000
10,000
15,000
20,000
25,000
30,000
35,000
40,000
US$
mn
Figure (3): Inter-Arab FDI Inflows(1995 - 2009)

Investment Climate in Arab Countries 2009
The Arab Investment & Export Credit Guarantee Corp. | Dhaman 8
It is evident from Figure (3) that inter-Arab direct investments have grown slowly but steadily over the period of 1995-2003. Afterwards, it began to increase sharply in 2004 and have maintained this expansion in the years that followed. Such a sudden rise may mainly be attributed to higher international oil prices during the past few years on one hand, and the general trend in policy changes over the same period, suggesting the reduction of FDI restrictions and a more welcoming investment climate, as well as the elimination of most tariffs amongst the 17 members of GAFTA (Greater Arab Free Trade Area) in January 2005, which was the peak point of inter-Arab direct Investment flows for the entire period. Then in 2006, flows decreased in comparison to their level in 2005, however this level was still more than doubled that of the 2004, and there has been a continuous increase ever since, until 2009, where the repercussions of the global economic and financial crisis played a major role in the decline of Inter-Arab FDI inflows, alongside the Dubai crisis. Depending on the available geographically distributed data on the inter-Arab direct investment, reported by 8 Arab host countries (Liabilities or inwards) for 2009, the mirror data reflect the inter-Arab direct investment by investor’s country of residence (Assets or outwards). Figure (4)4, shows that Kuwait topped the FDI source countries, accounting for US$ 6.1 billion, or 32% of total inter-Arab direct investment received by 7 out of 8 Arab countries. The runner up was UAE, which accounted for US$ 5.1 billion, or 26% of received by 7 out of 8 countries, followed by Bahrain with its contribution of US$ 1.7 billion, or 9%, hosted by 7 countries, then Qatar with US$ 1.2 billion and 6%, Jordan with US$ 1.1 billion and also 6%, and Saudi Arabia with US$ 1.0 billion and 5% of the total inter-Arab investments received. These six Arab countries alone had a combined total value of US$ 16.3 billion, and their shares accounted for 85% of total inter-Arab direct investment outflows. As for inter-Arab direct investments breakdown by sector, this year’s report witnessed an extremely weak response rate for inter-Arab investments, 8 out of 21 countries, of which, only 4 countries provided a breakdown of their figures by major economic sectors with a total value of US$ 1.6 billion. This breakdown, Figure (5)5, reaffirms a pattern where the majority of inter-Arab direct investments continue to be directed towards the manufacturing and
4 Statistical Appendix: Table (4)
5 Statistical Appendix: Table (5)
6,1
36
5,0
56
1,6
79
1,2
48
1,1
19
1,0
42
72
6
44
6
37
0
31
8
22
2
19
9
18
6
16
7
13
4
12
4
33
4 40
0
1,000
2,000
3,000
4,000
5,000
6,000
Figure (4): Inter-Arab FDI, by SourceCountry, 2009
52.0%
0.2%
43.0%
4.7%
Figure (5): Inter-Arab Direct Investmentsby Sector (2009)
Manufacturing
Agriculture
Services
Other

Investment Climate in Arab Countries 2009
The Arab Investment & Export Credit Guarantee Corp. | Dhaman 9
service sectors. The manufacturing sector accounted for 52% of total Arab direct investments, followed by the services sector with 43%, then other sectors with 4.7%, and the agriculture sector accounted for a diminutive share of only 0.23%.

Investment Climate in Arab Countries 2009
The Arab Investment & Export Credit Guarantee Corp. | Dhaman 10
FDI inflows to the Arab Countries (2009 Estimates): It is very important to clarify which type of information Dhaman works with. Dhaman obtains its data from official contact points in Arab countries and some official governmental websites. However, sometimes Dhaman is provided with two sets of data for some Arab countries as follows; 1. FDI data for the years 2008 and 2009 from the Investment Promotion Agencies (IPAs). This data represents “licensed” investment projects, which may have not even started operating yet. This data in itself doesn’t necessarily represent the actual flows of FDI, therefore the flows of capital, may have not actually crossed international borders. 2. FDI data from the Arab countries’ official Balance of Payments estimates for the years 2008 and 2009. This data represents the actual flows of capital which crossed international borders and started to engage in activity. The year 2009, has been a very difficult year for the entire region, from the perspective of attracting FDI flows. This comes as a natural outcome of the global financial and economic crisis, and the tightening of financial conditions. These two factors have caused a major cutback in investments, and capital inflows into the region. As a result of the turmoil witnessed in 2008 with the global economic and financial crisis, investors globally have cut back their spending and became extra cautious. These issues forced most of the Arab countries to pursue strong countercyclical macroeconomic policies and reforms in order to be able to attract more foreign capital and FDI into the region, and help in the recovery process. Therefore, as a natural outcome, FDI flows into the region have witnesses a sharp decline during the year 2009. Based on the information provided from Arab countries, preliminary estimates of FDI by 18 out of 21 Arab countries, report a total FDI inflow of US$ 80.7 billion. The same group of 18 countries reported a combined FDI inflow during 2008 with a total of US$ 95 billion, showing a decrease of 15.1% throughout the year 2009. However, Dhaman was able to obtain data on all 21 Arab countries for the year 2008, where FDI inflows amounted to US$ 98.1 billion, compared to this figure in 2008, Arab countries witnessed a 17.7% decrease in FDI inflows during 2009. The repercussions of the financial and economic crisis which began in 2007 with US subprime crisis and intensified in August 2008, have affected the FDI flows globally and caused turmoil in all the regions across the world, leading to the major FDI declines witnessed in 2009. Through this all, the Arab countries region has been the least affected region globally in terms of the FDI downturn during the year 2009. Therefore, Arab countries still maintained the ability to attract FDI. This ability is due to pull internal factors and push external factors. As for pull internal factors, many studies that attempted to monitor the performance of FDI, according to political, social and economic variables, found out many factors influence the behavior of FDI. These factors, however, can be divided into three categories; economic conditions (national, regional and global), legislative and institutional frameworks and Investment Promotion Agencies’ (IPAs) role. Concerning the category of economic conditions, actually, the rapid growth of Arab countries has attracted, and been facilitated by, FDI, flows of which have increased substantially in recent decades, especially during the six previous years, averaging annually about 6%.

Investment Climate in Arab Countries 2009
The Arab Investment & Export Credit Guarantee Corp. | Dhaman 11
With respect to the role of Arab IPAs and institutional dimension, most of Arab countries adopted reform policies including; adding more flexibility in the institutional & FDI related legislative framework in many countries of the region, especially in the service sector. The commitment of Arab states to encourage privatization. The improvement of the investment climate in several Arab countries due to the continued reform efforts by facilitating the stage of project start up related administrative procedures and shortening the amount, cost and time needed for fulfilling them, establishing one-stop-shop as well as public & private credit information offices, reducing various tax rates and customs duties, developing and implementing e-government programs with respect to licensing and registration, facilitating the procedures for the technical investigation of exports and imports, improving the dimensions of economic data dissemination quality, including the data integrity, accuracy, transparency, periodicity and timeliness. The push external factors pointed to the financial and economic uncertainty, lower rate of return on investment abroad, which in turn, led the Arab investors to transfer more funds into Arab region.
By looking at the data of countries individually, in which FDI inflows to Arab countries are depicted, Figure (6)6 shows that only 7 out of 18 countries with the data for both years have witnessed an increase in attracting FDI flows in 2009, on the other hand, 11 Arab countries witnessed a decline in their FDI inflows. The conditions in FDI declines and increases varied vastly from one country to another. The increases varied from only a mere US$ 30 million in Algeria, to a US$ 2 billion increase in Qatar. While the decline varied from US$ 19.3 million in Mauritania to a hefty decline of US$ 5.2 billion in UAE. The top five countries combined, accounted for 80% of total FDI inflows to the Arab region. Topping the list was Saudi Arabia with US$ 35.5 billion, then Qatar with US$ 8.7 billion, UAE US$ 8.6 billion, Egypt US$ 6.7 billion, and Lebanon with US$ 4.8 billion. Based on UNCTAD's annual World Investment Report 2009 (covering 2008), FDI inflows to the Arab countries have been experiencing continuous growth, which reached US$ 96.5 billion in 2008, compared
6 Statistical Appendix: Table (6)
38
,15
13
5,5
14
0
2,000
4,000
6,000
8,000
10,000
12,000
14,000
US$
mn
Figure (6): Global FDI flows into Arab Countries
2008
2009

Investment Climate in Arab Countries 2009
The Arab Investment & Export Credit Guarantee Corp. | Dhaman 12
to US$ 80.8 billion in 2007, increasing by 19.4% in 2008. FDI inflows to Arab countries accounted for 5.7% of global FDI inflows (US$ 1,697 billion), and for 15.5% of global FDI inflows to developing countries (US$ 620.7 billion), in comparison to 4.09% and 15.3% respectively a year earlier. These increases were an outcome of the tangible increase in FDI inflows to 12 Arab countries (KSA, Lebanon, Qatar, Sudan, Tunisia, Algeria, Jordan, Bahrain, Syria, Iraq, Djibouti and Palestine). On the other hand, FDI inflows declined in nine Arab countries (UAE, Egypt, Morocco, Libya, Oman, Yemen, Mauritania, Kuwait and Somalia). Over the period 1999–2008, FDI stock accumulated from inflows to the Arab countries, amounting US$ 362.5 billion, i.e. 3.2% of global FDI flows, and accounting for 11.1% of flows to developing countries, recording an average annual growth rate of 41.2% for the same period.7 Arab countries have undoubtedly managed to increase their share in the global FDI flows over the past decade, shooting up from a mere 0.40% of the world’s FDI in 1999, to reach a record high of 5.68% in 2008. This also applies to Arab Countries’ share in the developing countries’ FDI inflows, where Arab countries’ accounted for 1.90% of developing countries FDI in 1999, then reached a record high of 16.37% in 2006, to settle at 15.54% in 2008.8
7 Statistical Appendix: Table (7)
8 Statistical Appendix: Table (8)
0.002.004.006.008.00
10.0012.0014.0016.0018.00
Figure (7): Arab Countries' Share in Global FDI Inflows(1999 - 2008)
Arab Countries/Developing Countries (%) Arab Countries/World (%)

Investment Climate in Arab Countries 2009
The Arab Investment & Export Credit Guarantee Corp. | Dhaman 13
Merger & Acquisitions (M&As) Deals:9 The impact of the global economic and financial turmoil drove the cross-border M&As deals to drop sharply at a rate of 34.7% globally, to reach US$ 673.2 billion in 2008, in comparison to US$ 1,031 billion in 2007. This comes as a result of the worldwide economic uncertainty conditions and the deterioration of profit levels achieved, most of transnational companies and Sovereign Wealth Funds (SWFs) were enforced to call off their own decisions related to start up Greenfield investment projects or expand existing projects. The year 2008 witnessed major declines globally, however, Arab countries witnessed an increase in cross-borders M&A’s value (as a seller) during the year 2008. This was mainly due to the large increase in cross-border M&A’s value (as a seller) in Egypt, reaching US$ 15,895 million from a mere US$ 1,719 million in 2007. A few other Arab countries also witnessed an increase in the number of M&A’s and values during the year 2008. Global M&A’s value in 2007 totaled around US$ 1.03 trillion, of which Arab countries accounted for US$ 19.3 billion as sellers, and US$ 23.9 billion as purchasers. Global M&As during 1999 – 2008 totaled around US$ 6.94 trillion, of which Arab countries share was around 3.13% as vendors and purchasers. It’s worth pointing out that the GCC countries accounted for the largest share of deals amongst the Arab countries as a purchaser, the equivalent of 80% of the total value of Arab deals in 2008, and 93% of the total number of deals during the same year as a purchaser. The global levels of cross-border merger and acquisition (M&A) transactions have been severely impacted by the worldwide economic and financial crisis, and as a result of the fragility of the global economic recovery, the world continued to witness declining cross-border M&A sales during the first half of 2009. The total value of cross-border M&A’s reached US$ 123.2 billion during the first half of the year, of which Arab countries’ share was, as a seller, US$ 2.1 billion (1.7%), with 32 deals. As purchaser, the Arab countries’ share was US$ 8.7 billion (7.0%), with 36 deals.
9 Statistical Appendix: Table (8)
0.00
1.00
2.00
3.00
4.00
5.00
6.00
7.00
8.00
1999 2000 2001 2002 2003 2004 2005 2006 2007 2008 2009(1st half)
Figure (8): Arab Countries' Share in Cross-border M&As(1999 - 2009)
Arab Countries share of Global M&As as a Seller (%)
Arab Countries share of Global M&As as a Purchaser (%)

Investment Climate in Arab Countries 2009
The Arab Investment & Export Credit Guarantee Corp. | Dhaman 14
World FDI flows (2009 Estimates): Based on UNCTAD's annual World Investment Report 2009 (WIR09), Global FDI flows have been severely affected by the ongoing economic and financial crisis, there was a drastic decline in FDI flows worldwide in 2009, this can be seen at the global, regional or geographical level. The world’s FDI flows decreased by an astonishing 38.7%, reaching US$ 1.04 trillion in 2009, declining from US$ 1.70 trillion in 2008. Nonetheless, the UNCTAD's World Investment Prospects Survey (WIPS) 2009-2011 shows that forecasted figures are set to have a slow recovery in 2010, when most regions are expected to witness a rebound in FDI flows. Then FDI flows are expected to pick up and gain momentum in 2011, provided that the crisis abates and the international credit markets begin to stabilize. However, these FDI forecasts are hindered with uncertainties and risks due to the fragility of the global recovery. This decline comes after successive increases in the past five years, before 2008. Then, since the global economic and financial crisis witnessed in 2008, FDI flows have dropped ever since then. The drop is mainly due to the repercussions of the current global economic crisis at the forefront; the slowdown of economic growth in developed and developing countries alike and global financial turmoil, coupled with the atmosphere of uncertainty and liquidity crises in money and credit markets, prompting many companies to resort to dispense the number of workers and reduce their production and investment spending. According to the UNCTAD’s preliminary estimates, it is clear to see the negative effects of the global financial & economic crisis across economic regions and nations around the world, which as a consequence has changed the landscape and pattern of FDI flows and trends.

Investment Climate in Arab Countries 2009
The Arab Investment & Export Credit Guarantee Corp. | Dhaman 15
Trade 10 The global economic and financial crisis witnessed in 2008 and 2009 causing turmoil across the world’s geographical regions, resulted in the largest decline in world trade in more than 70 years. The rate of trade growth had already slowed down 2008, but the 12.2% drop in 2009 was the first decline of this magnitude in recent history. The World Trade Organization’s (WTO) has projected a modest recovery in 2010 which should nonetheless counter the effects of the global trade collapse. International trade has always been one of the most important branches of economic activity. According to WTO estimates, world trade is expected to witness a 9.5% growth rate during the year 2010. This comes after the drastic drop witnessed in 2009, caused by a decline in the global aggregate demand, inversely affected by the global financial and economic crisis. According to preliminary estimates by the WTO (2009), and official data from national Arab contact points, it is clear to see that Arab countries where not able to avoid the repercussions of the economic and financial crisis, which affected the global foreign trade. In 2009, Arab foreign trade in current prices, declined by around 27.7%, compared to 2008. Total Arab foreign trade, (excluding Palestine & Somalia), amounted US$ 1.3 trillion, of which exports accounted for 56.3%, i.e. US$ 706 billion, and imports for 43.7%, i.e. US$ 549 billion, compared to a total Arab trade value of US$ 1.7 trillion in 2008 (of which exports' value was US$ 1.1 billion and imports' value was US$ 658 billion).
Arab Countries' Share in World Trade
2004 2005 2006 2007 2008 2009
Exports (US$ mn)
Arab Countries 406,364 560,465 678,462 793,011 1,070,938 706,051
World 9,219,000 10,489,000 12,112,000 13,993,000 16,097,000 12,461,000
Arab Countries/World (%)
4.41 5.34 5.60 5.67 6.65 5.67
Imports (US$ mn)
Arab Countries 282,106 339,556 388,140 498,881 657,552 549,130
World 9,567,000 10,853,000 12,435,000 14,287,000 16,493,000 12,647,000
Arab Countries/World (%)
2.95 3.13 3.12 3.49 3.99 4.34
As for Arab merchandise trade, exports accounted for 5.6% of global merchandise exports during the past five years, whereas, Arab merchandise imports accounted for an average of 3.5% of global merchandise imports. Arab consolidated trade balance in 2009, recorded a surplus of US$ 154.7 billion, dropping by 44% from the realized surplus in 2008 recorded US$ 421.6 billion, this was due to the decrease in the trade balance surplus recorded in 13 Arab countries. Data from the Arab Unified Economic Report 2009 show that the volume of inter-Arab trade has grown for the fifth consecutive year, rising by 22.6% in 2008 to reach US$ 82.5 billion, compared to 2007, US$ 67.3 billion in 2007.
10
Statistical Appendix: Table (9)

Investment Climate in Arab Countries 2009
The Arab Investment & Export Credit Guarantee Corp. | Dhaman 16
Inter-Arab trade accounted to 10% of total Arab foreign trade in 2009, compared to 9.5% in 2008. Based on data extracted from Arab Unified Economic Report 2009 and the World Trade Organization (WTO), inter-Arab merchandise trade was expected to have reached US$ 126 billion in 2009, with exports accounting for 47.9% (US$ 60.2 billion) and imports accounting for 52.1% (US$ 65.5 billion). The list of the Top 30 global merchandise exporters and importers, according to the World Trade Organization in 2009, accounted for 81.9% of total world merchandise trade, which amounted to US$ 12.6 trillion. The WTO also issued the global leading 30 services exporters and importers, accounted for 82.6% of total world service trade, which amounted to US$ 3.3 trillion. Only two Arab countries made it to the list of the top 30 global merchandise exporters and importers, KSA ranked 18th, with 1.5% of the world’s exports, or US$ 189 billion in 2009. UAE, ranked 19th with 1.4% exports, US$ 175 billion in 2009. Furthermore, UAE was ranked 24th with a 1.1% share of the global merchandise imports, with US$ 140 billion in 2009, compared to ranking 27th in 2008. KSA joined at the bottom of the list this year, with 0.7% of the world’s imports. As for the service trade list, UAE was the only Arab country to enter the largest global service importers, ranking 27th with 1.1% of the world’s service imports, with US$ 36 billion.
0.00
1.00
2.00
3.00
4.00
5.00
6.00
7.00
0
200
400
600
800
1,000
1,200
2004 2005 2006 2007 2008 2009
(%)
US
$ bn
Figure (9): Arab Countries Trade(2004-2009)
Arab Exports Arab Imports
Arab Exports/World Exports(%)
Arab Exports/World Imports(%)

Investment Climate in Arab Countries 2009
The Arab Investment & Export Credit Guarantee Corp. | Dhaman 17
Arab Stock Exchange Markets:11 During the year 2009, Arab Stock Exchange Markets have continued their ongoing efforts to counter the losses encountered in 2008. These efforts were spread across developing regulatory and legislative frameworks, aiming at developing and improving performance and working methods, through increasing levels of disclosure and transparency, increasing discipline, awareness and investor confidence, particularly amidst the ongoing effects of the global financial crisis. Arab stock exchange markets have not been immune to the global turbulence. Equities’ prices have sharply declined compared to its levels at the beginning of the turmoil. Risk aversion remains high and fund manager in the region have reportedly shifted allocations towards cash and high quality and more safety papers. The performance of Arab stock markets declined during the year 2008, like other worldwide stock markets, affected by the global financial and economic crisis, but managed to pick up gradually during the year 2009. This is reflected by the composite index, issued by the Arab Monetary Fund, which measures the performance of 15 Arab stock exchange markets. It recuperated by 18.1% to reach 196.3 points by the end of 2009, compared to 166.2 points at the end of 2008. Such increase is still not enough to offset the losses endured from the 2008 deterioration. However, if it wasn’t for the Dubai debt crisis, the increase could have reached much higher levels during the year 2009. This slight increase came as a result of the increases recorded in individual markets’ indicators throughout the year 2009. Out of the 15 Arab stock exchange markets, 8 markets witnessed an increase in their composite index during the year 2009 (Oman, Doha, Saudi Arabia, Dubai, Egypt, Khartoum, Palestine, and Algeria), the increases ranged between 13.4% – 95.3%. On the other hand, the composite index dropped in 6 Arab markets (Kuwait, Abu Dhabi, Bahrain, Beirut, Muscat, and Tunisia), the decreases in the indices ranged between 1.2% – 17.6% in 2009. Based on database of the Arab Monetary Fund, the market value of all Arab stock Markets amounted to US$ 903 billion in 2009, increasing by 17%, compared to US$ 770 billion in 2008. Maintaining the highest rank, KSA stock market accounted for 35.3% (US$ 319 billion) of total market value, followed by Kuwait, Egypt, Qatar and Abu Dhabi markets respectively. Total value traded (listed and unlisted securities) dropped by an astounding 35% to around US$ 654 billion, compared to US$ 1000 billion in 2008. KSA stock market accounted for 51.5% of the total value traded, followed by Kuwait, Egypt, Dubai and Qatar stock markets. The Value of traded securities increased to reach US$ 364 billion by end of 2009, compared to US$ 305 billion in 2008, Dubai’s stock market topped the list and accounted for 30.4%, followed by Kuwait, KSA and Egypt stock markets. The number of listed companies in all 15 stock markets decreased to 1495 companies, compared to 1542 companies in 2008, due to decrease of listed companies in Egypt, Morocco, Oman, Bahrain and Lebanon stock markets. As for the number of listed companies distributed among Arab stock exchange markets, the Cairo & Alexandria markets continued to have the largest share of the total by 24.5%, followed by Jordan and Kuwait’s stock markets, both accounting for 18.2% and 13.7% respectively.
11
Statistical Appendix: Table (10)

Investment Climate in Arab Countries 2009
The Arab Investment & Export Credit Guarantee Corp. | Dhaman 18
Investment legislations Arab countries' efforts were continued towards legislative reform, enhancing the doing business environment through deregulating investment laws, tax incentives & exemptions, improving terms and conditions of the bilateral, international & regional agreements, establishing new free & industrial zones, new airports & seaports, and activating the private sector's role within the comprehensive economic process. Amid the effects of the global financial & economic crisis, the efforts of Arab countries at this level appear to be means of challenging the crisis, especially with the many benefits and advantages of these reforms which are reflected on the societies, economies, institutions and individuals to harness the technical developments and progress faster at a lower cost. Dhaman’s Rating in 201012 At the beginning of 2010, Standard & Poor's Ratings Services upgraded Dhaman’s credit rating to “AA”, with “Stable” outlook. This upgrade comes from the “AA-, Stable” given for the past couple of years for its counterparty credit and insurer financial strength ratings, to the Arab Investment and Export Credit Guarantee Corporation (Dhaman). This upgrade was made upon the improvement of Dhaman’s liquidity, quality of capital and its continuation to demonstrate very strong capitalization relative to its underwriting commitments by reference to its peer trade credit insurers in the private sector and multilateral lending institutions. S&P’s report said, “Dhaman’s balance sheet provides full support to its business as an export credit and investment risk insurer”. Arab countries composite ratings: (based on the sovereign rating produced by the international rating agencies)
13
The periodic international sovereign rating by the Financial Times, based on the sovereign rating of the international credit rating agencies, included seven Arab countries, in comparison to 12 Arab countries a year before. These seven countries ranked as follows:
High investment grade, low risk and moderate repayment ability: o Tunisia o Libya
Speculation grade, medium risk, and probability of repayment risks: o Egypt o Morocco o Jordan
High speculation grade, high risk, high probability of repayment risks: o Lebanon o Yemen
12 http://www.iaigc.net/UserFiles/file/SnP Dhaman 25Mar10.pdf 13
Statistical Appendix: Table (11)

Investment Climate in Arab Countries 2009
The Arab Investment & Export Credit Guarantee Corp. | Dhaman 19
A number of international credit rating agencies covered 65 Arab banks and financial establishments & companies.14
The Composite Country Risk Index (PRS) / 18 Arab Countries
Qatar and Oman. Very Low Risk (80-100) UAE, Kuwait, Bahrain, KSA, Libya, Algeria, Morocco and Tunisia. Low Risk (70-79) Yemen, Egypt, Syria, Jordan, and Lebanon. Moderate Risk (60-69) Iraq and Sudan. High Risk (50-59) Somalia. Very High Risk (<50)
The Institutional Investor for Credit Rating / 20 Arab Countries
-- Very Low Risk (80-100) UAE, Bahrain, KSA, Oman, Qatar and Kuwait. Low Risk (70-79) Jordan, Tunisia, Algeria, Libya, Egypt and Morocco. Moderate Risk (50-69) Djibouti, Syria, Lebanon, Mauritania and Yemen High Risk (25-49) Sudan, Somalia and Iraq. Very High Risk (<25)
Dun & Bradstreet Country Risk Indicator / 17 Arab Countries
Bahrain, UAE, Qatar, and Tunisia. Low Risk (DB2) KSA, Morocco, Kuwait, Oman, Egypt and Jordan. Moderate Risk (DB3) Lebanon and Libya. Probable Risk (DB4) Algeria and Syria. High Risk (DB5) Yemen, Sudan and Iraq. Very High Risk (DB6) -- Extreme Risk (DB7)
COFACE Country Rating / 19 Arab Countries
UAE, Qatar, Kuwait, Bahrain, Oman, Tunisia, Algeria, KSA and Morocco.
Investment Grade (A2 – A4)
Jordan and Egypt. Speculation Grade (B)
Djibouti, Syria, Lebanon, Libya and Mauritania. Speculation Grade (C)
Sudan, Iraq and Yemen. High Speculation Grade (D)
14
Statistical Appendix: Table (12)

Investment Climate in Arab Countries 2009
The Arab Investment & Export Credit Guarantee Corp. | Dhaman 20
Selected International Indices 15
Global Competitiveness Index 2009/2010: Qatar topped the Arab countries by reaching a global ranking of (22), followed directly by UAE (23), KSA (28), Bahrain (38), Kuwait (39), Tunisia (40), Oman (41), Jordan (50), Egypt (70), and Morocco (73). Compared to 2008/2009, seven Arab countries were upgraded (Jordan, Bahrain, Tunisia, KSA, Syria, Oman and Kuwait), whereas, six Arab countries were downgraded (UAE, Algeria, Qatar, Libya, Egypt and Mauritania). Morocco managed to maintain the same ranking as the previous year.
Global Retail Development Index 2009 UAE topped the Arab countries, after leaping 16 ranks to reach the fourth (4) ranking globally. UAE was followed by KSA, ranking (5) globally, then Algeria (11), Tunisia (14), Egypt (15) and Morocco (19). Compared to 2008, four Arab countries witnessed improvements in their ranking (UAE, KSA, Algeria and Tunisia) whereas, Egypt and Morocco descended.
The Ease of Doing Business Index 2010 KSA topped the Arab countries with global ranking (13), followed by Bahrain (20), UAE (33), Qatar (39), Kuwait (61), Oman (65), Tunisia (69), Yemen (99), Jordan (100) and Egypt (106). Compared to 2009, seven countries saw relative improvements (KSA, UAE, Tunisia, Yemen, Jordan, Egypt and Morocco) whereas, 12 countries relatively dropped (Bahrain, Qatar, Kuwait, Oman, Lebanon, Algeria, Palestine, Syria, Iraq, Sudan, Djibouti and Mauritania).
15
Statistical Appendix: Table (13)

Investment Climate in Arab Countries 2009
The Arab Investment & Export Credit Guarantee Corp. | Dhaman 21
Arab Air transport sector; “Arab Air Transport Industry: future prospects in light of the current performance” as the major topic in the current year’s report There is no doubt that having an efficient, effective and reliable air transport infrastructure, especially in developing countries, is becoming increasingly crucial to national competitiveness and materialization of the gains from trade. That’s why “Arab Air Transport Industry: future prospects in light of the current performance” was the major topic chosen for the 2009 report. Such choice was in line with the recommendations of the first Arab Economic Summit held in Kuwait on 19-20 January 2009 and its following two Arab Summits held in Qatar and Libya in March 2009 and 2010, respectively. In that concern, a number of decisions and recommendations have been taken, of which were, to increase the liberalization of air services, freedom of the air and open skies between Arab countries. The first part of this year’s major theme focuses on the importance of the air transport sector as it plays a major role in the world’s economic activity; many economies rely on this sector to stimulate their economic growth and financial strength. It also acts as an economic catalyst, contributing to FDI flows, tourism, and employment and increasing the overall economic efficiency of Arab countries. The air transport sector remains one of the fastest growing sectors of the world economy, especially in Arab countries, hence the launch of several mega projects in this area. Also its importance, like other transport services, comes from its strong association with international trade in two distinct ways as it is traded as a service in its own right on one hand and it is a key intermediate service for many other kinds of trade, in the domain of both goods and services, on the other. Furthermore, by reducing the time required to reach a distant location, air transport is an important determinant of overall transport costs. Higher passenger flows between two countries also lead to lower information and enforcement costs for mutual trade. In addition, rules and regulation governing passenger traffic are also important for air cargo. In fact, 50% of cargo is transported on passenger flights rather than dedicated cargo flights. This importance is expected to increase as a result of technological innovation, deregulation and enhanced market access for foreign companies, which are all making air transport more accessible to a wider set of customers in a broader range of countries. From this point of view, the rest of the topic is organized as follows: Section 2 reviews the recent developments and new phenomenon witnessed in global air transport sector. Section 3 describes the importance of the sector in the Arab region, compares the Arab air transport sector’s key indictors with those of the other major economic regional groups, and shows the sector’s infrastructure in terms of the number of airports and national airways available in Arab countries and its plans to improve the quality of services offered. Section 4 highlights the expected domestic and foreign investment plans assigned for developing that sector in Arab countries. Section 5 describes the framework of regulations that governs the sector in Arab countries and introduces the alternative measures of liberalization of the aviation market through; domestic legislations in place, as well as the regional, bilateral, and multilateral agreements concluded by Arab countries. In this section the informed index produced by the WTO Secretariat is shown, to know which countries benefit from “Open Skies Agreements, (OSAs)” the most. Section 6 points to the main challenges that face the Arab air transport sector in near future. Finally section 7 concludes. This year's major topic included an extensive section of data on the Air-transport Sector in the Arab Countries and grouped them in a more meaningful way of arrangement than alphabetical and included other non-Arab states, and world regions at various levels of development for comparisons. These data were examined sequentially one after the other, in order to conclude where Arab countries stand and

Investment Climate in Arab Countries 2009
The Arab Investment & Export Credit Guarantee Corp. | Dhaman 22
whether the Arab region measures up to the international standards or not. It is understood that the development and growth of air transport depends on various factors including; economic and trade growth, fuel price changes, airline productivity gains and airports and airspace capacity. Our analysis suggested that traffic growth will vary by geographic region because of the impact of specific local or regional factors. But, as for the region as a whole, our findings suggested that the Arab air sector will grow in the incoming years at a higher average rate than the global rate given the following stylized facts:
Arab aviation has recently experienced a phenomenal period of growth that has created new opportunities and new challenges for Arab states, airlines, airport operators, aircraft manufacturers, air traffic service providers and other related air transport organizations. Over the 1996–2006 period, the MENA region realized the highest average growth rate of the scheduled passenger traffic of airlines among other economic regional groups, registered 10.3% per annum5.4ـــــ% above the world average. MENA airlines are an example of companies that are taking advantage of the demand for international travel, relative to domestic travel. The region has increased its share of world traffic from 2.5% in 1991, and 3.6% in 2002, to 7.5% in 2006. At the current pace of traffic growth, MENA region is more likely to have a significant effect in the world transport market, within the next 10 years.
According to Airports Council International (ACI) and based on reports from 1,100 member
airports, in 2008 the world’s airports processed 4.4 billion passengers, 85.6 million metric tons of cargo and 72.2 million aircraft movements. Within the Arab region, based on data downloaded from the Arab Air Carriers Organization (AACO) in 2008, their airports handled 184 million passengers, (with CAGR of 10.3% in the past 10 years), 4.7 million tons of cargo and 1.6 million aircraft movements. It also worth mentioning that the Arab region is operating 202 airports, of which, 91 international airports.
As a matter of fact, several Arab governments have begun to adjust their airports’ capacity to the
growing demand, either by expansion and/or restructuring their ownership and management. These reforms are enabled by liberalization of economic regulations. Privatization has already occurred at several key airports in Arab region, namely: Egypt, Algeria and Mauritania. Still, significant investments are required in a timely and efficient manner to overcome and/or avoid infrastructure bottlenecks. According to IATA 2006, capital expenditures for airport infrastructure in Arab region amounted US$ 2 trillion. According to our report 2009, current and future investment plans for airport infrastructure in Arab region exceed US$ 75 billion, of which US$ 37 billion for 10 of the biggest arab airports in the region. (For instance; US$ 50 billion for AlMaktoum or Gabal Ali airport, US$ 8 billion for Bahrain airport, US$ 7 billion for Al-Medina airport), to add new capacities for its own premises by 2012. This is expected to enlarge its capacities to reach 400 million passengers on an annual basis.
At the end of 2008 there were more than 300 carriers in the Arab world providing international
and/or domestic scheduled passenger services. During 2009, the reported number of commercial air transport aircraft in service increased by about 7%-twofold of global growth rate. It is expected for the region to be in need for 1710 aircrafts in the upcoming period of 2009-2028 (Boeing 2009). It is also expected that the demand on travel will grow on an annual rate ranging between 10%-15%. Based on data from 6 Arab countries, about 40% of airlines in the region

Investment Climate in Arab Countries 2009
The Arab Investment & Export Credit Guarantee Corp. | Dhaman 23
continue to be state owned to a varying extent. Privatization of Arab state owned airlines has been one of the pre-eminent transformations in air transport. The main airline companies in the region have also continued their efforts to enhance and develop their fleet. LLCs (Low-cost carriers) have also witnessed a boom in the region, with more than 7 registered carriers operating in the region, with further expected growth in the future. The air charter industry has also been growing very rapidly in the past few years. Within the Arab region, there are more than 600 registered private jets, of which 70% belong to owners from the GCC countries. Renting airplanes as corporate aviation, air taxi or air charters, has also witnessed growth in the region for during the past few years.
The move toward Arab Open Skies either bilaterally through conditions established by the Air
Services Agreements under which air companies operate in each country, or regionally through Damascus Agreement conditions under the supervision of the League of Arab States, or multilaterally through the General Agreement on Trade in Services (GATS) under the umbrella of WTO. As for multilateral agreements concluded under the General Agreement on Trade in Services (GATS) of the World Trade Organization (WTO), only Morocco, Jordan, Oman and Saudi Arabia have committed their obligation to their air transport services sector. In this regard, horizontal and specific commitments submitted by these countries to the WTO are analyzed and explained in details.
The youth dominance of Arab demographic structure puts more pressure on demand for inter-
Arab tourism, taking into account the fact that personal income changes affect the level of consumer purchasing power and the propensity to undertake leisure travel.
The switch of the global air transport’s key transit points to some of Arab airports, headed by
GCC airports, to become the main air transport channel between West and East sides of the world.
Most of Arab aviation authorities have undertaken liberalization policies and open a lot of ways
for the private sector to play a significant role to adjust for the growing demand on airports’ services, either through concluding sound management contracts that lead to effective and efficient use of airports’ premises, slots and others, or allowing the private sector to build new airports in the form of PPP, BOO, BOOT, BOT contracts.
The decline of air transport costs as a result of the diffusion of jet engines, the expected
technology progress in the field, and more recently the changes in the regulatory set-up by most of Arab countries helped to reduce air transport costs.
Establishing Inter-Arab airlines alliances, as well as joining some of Arab national carriers into
globally airlines alliances such as “Star Alliance” and “One World Alliance”. Such memberships could play as catalyst for demand.

Investment Climate in Arab Countries 2009
The Arab Investment & Export Credit Guarantee Corp. | Dhaman 24
In conclusion, Arab governments should pay due attention to the vital role of air transport services, directly participating to the achievement of economic development and growth, by providing greater access to international markets and more integration into global economy. This could be achieved through the following possible future actions and strategies:
1. Linking trade in aviation services with other goods and services is important to form successful free trade blocs: When airline services are liberalized, it is possible that the airline industries of some countries will lose. However, when the airline industry is grouped with other industries in trade negotiations, the losses in one industry (airline services) might be offset by gains in other industries (agriculture or garments manufacturing or ICT-enabled services). The Greater Arab Free Trade Area (GAFTA) is a good venue for negotiating free trade in commercial air services. However, the GAFTA covers quite a number of sectors in its exclusion list and air transport is one of them. Since 2005, significant reductions in the tariffs on manufactured goods have been witnessed but very slow progress in the opening up of the services sector, the backbone of a competitive manufacturing sector.
2. Building Capabilities of negotiation Team: In managing the transition, capability-building
measures are needed, particularly in preparing negotiating positions. They include training, workshops, development of appropriate policy regulation framework and setting up of institutional organizations or making existing organizations more efficient through separation of functions like ownership, regulation and operations. Such measures must be focused not only on the technical, safety and security aspects of aviation, but also on the economics of aviation issues that, for example, make policy makers more aware of the benefits and costs of Open Skies. These activities can be funded by Arab countries and/or other Arab agencies at the regional level.
3. Widening regional and sub-regional economic cooperation: There has not been much
progress in services liberalization under the Arab Agreement of liberating trade in Services, also given the slow progress in the General Agreement on Trade in Services (GATS), it is less likely that the Arab Agreement of liberating trade in Services will also have significant impact on the services sector of Arab countries. However, under the conditions of the bilateral or sub-regional agreements concluded, the Arab countries might agree to include air transport services liberalization as part of an overall economic package.
4. Building strategic links between aviation and tourism and other users: As mentioned earlier
in the report, the move toward Arab Open Skies is not a recent initiative but an integral part of the League of Arab States’ vision. It has been noticed that users of air services, particularly tourism and trade-related agencies are not generally part of the negotiating panels therefore limiting negotiation perspectives to pure traffic rights issues. So, it is recommended to consult the stakeholders in the air transport sector prior to the negotiation process and it is not necessary for transport officials to take the lead in the negotiation process since the package will cover more than air transport. That is, gaining the same amount of access given to the other party. A closer integration can be achieved through joint working group meetings for air transport and tourism. This is one way of supporting the Arab Leaders’ directive to accelerate the integration of the air travel and tourism sectors. This will also facilitate the development of a regional action plan for staged and progressive implementation of Open Skies.

Investment Climate in Arab Countries 2009
The Arab Investment & Export Credit Guarantee Corp. | Dhaman 25
5. Moving from a single designation to dual and eventually to multiple designation policy, as well as relaxing the route controls and building adequate infrastructure: this policy can enhance the benefits from liberalization. The shift however calls for greater transparency in the allocation of traffic rights and even landing slots between or among carriers. Countries such as Kuwait, UAE, Saudi Arabia, and Egypt have national and private carriers which compete for the limited traffic rights under either a dual or multiple designation policy. Given the lack of competition policies in the aviation sector, it is common to observe the government-owned or controlled airline or the older carrier to receive majority of new traffic rights negotiated for the country. In most cases, these established airlines argue that they deserve to be granted with those traffic rights given their huge investments in developing the routes in the past. Consequently, secondary or smaller carriers are prevented from exploiting commercial opportunities in those markets.
6. Supporting efforts that can be enhanced by greater cooperation in assisting less capable
airlines on technical and management aspects: Individual countries have different approaches to liberalization but there are some which can be harmonized at the regional level in order to manage the transition towards an Arab Open Skies and maintain the momentum created by the existing initiatives. There is no easy path but the gains for all nations can be found by considering some facilitation measures at the regional or sub-regional levels. These measures are needed to bridge the gaps in the levels of capabilities of individual economies and airlines, and eventually provide for a smooth transition to an Arab Open Skies.
7. Exploring potential benefits from perfect completion: Arab countries have witnessed the
entry and growth of low cost carriers such as Jazeera Airways and Wataniya Airways in Kuwait, Air Arabia and Fly Dubai in UAE, particularly in the regional market. These carriers have expanded the choices available to consumers through lower fares and more access. Some have started to operate in secondary gateways, developed the tourism markets and facilitated the movement of the travelling public in general. By studying the effects created by those carriers, possible gains from more competition would be illustrated. And the higher the consumers’ satisfaction the stronger the pressure on older or bigger airlines to become more productive and cost-competitive.
8. Benefiting from the expected solid industry’s growth over the incoming twenty years
forecasted by the recent undertaken studies and working papers in this field.
9. Promoting Coordinated and Harmonized air transport data: According to our report, it was observed that Arab member countries usually submit raw data on air transportation and aviation to the international institutions such as; the ICAO, the World Bank group etc., but they often are not valid for international comparison and are hardly harmonized for Arab’s interests. Thus, it is proposed to establish and maintain a comprehensive database on Arab aviation. Such database can highlight Arab’s position as an air transport market relative to the other global major regional groups. These databases will be the channel through which you can determine gains from consumers, give inputs to airlines and investors on market opportunities, and help policy-makers in becoming more capable in balancing impacts of policy options. Also, the Arab league can possibly take a lead by designating a Committee on Air Transport Statistics in the Arab Countries that will be tasked to collect, harmonize and present the data in a way that will be most

Investment Climate in Arab Countries 2009
The Arab Investment & Export Credit Guarantee Corp. | Dhaman 26
relevant to the Arab Countries members for investments promotion, developing gateways or markets, and promoting competition among others. It can be composed of Air Transport Statisticians from the member countries. However, international organizations like UNCTAD or external agencies such as ICAO can be tapped to provide technical support and to organize seminars on how to monitor and collect aviation data in a way consistent with international standards.
10. Continuing Reform programs: setting up wide ranging policies targeted at deregulating entry,
increasing foreign ownership, liberalizing market access and easing infrastructure restrictions as a number of them remain unchanged as well as the developing the much needed technology tools that upgrade the navigation and control services in Arab airports.
11. Realizing more liberalization towards easy mobility of persons and goods among Arab
countries as it pushes demand on air services upward and reforms the market failure.
12. Encourage Arab airways companies to seek the membership of the global and regional airlines alliances.

Investment Climate in Arab Countries
2009
Statistical Appendix

YearReal Growth Rate (%)
Improved: 17 Improved: 11 Improved: 15 Improved: 12 Improved: 11 Improved: 12 Improved: 14 Improved: 7 Improved: 12 Improved: 14
Deteriorated: 2 Deteriorated: 4 Deteriorated: 1 Deteriorated: 6 Deteriorated: 7 Deteriorated: 6 Deteriorated: 5 Deteriorated: 12 Deteriorated: 7 Deteriorated: 5
Improved: 14 Improved: 7 Improved: 9 Improved: 14 Improved: 11 Improved: 12 Improved: 14 Improved: 8 Improved: 13 Improved: 8
Deteriorated: 3 Deteriorated: 7 Deteriorated: 6 Deteriorated: 4 Deteriorated: 6 Deteriorated: 6 Deteriorated: 5 Deteriorated: 11 Deteriorated: 6 Deteriorated: 11
Decreased: 5 Decreased: 10 Decreased: 4 Decreased: 5 Decreased: 2 Decreased: 9 Decreased: 4 Decreased: 7 Decreased: 2 Decreased: 17
Increased: 11 Increased: 4 Increased: 12 Increased: 13 Increased: 16 Increased: 9 Increased: 15 Increased: 12 Increased: 17 Increased: 2
Composite Indicator
Source:IMF, World Economic Outlook Database, April 2010IMF, Regional Economic Outlook, MECA, May 2010
Internal BalanceBudget balance as a % of GDP(number of countries)
External BalanceCurrent account as a % of GDP(number of countries)
Monetary Policy IndexInflation Rate(number of countries)
Composite Index of Arab Countries' Investment Climate (2000 - 2009)20005.1
2004 2005 2006
0.71.2
20012.9
0.7 0.9 1.01
2002 2003
1.08 0.91 1.49 0.93 1.05
2.4
Table (1)
2007 2008 20092.9 6.9 5.8 5.4 5.7 5.6 5.1

(US$ Million)
Value (%) Value (%)KSA 12,758.0 36.07 11,623.0 60.39UAE 3,559.7 10.06 3,651.6 18.97Egypt 2,422.0 6.85 1,711.7 8.89Jordan 473.2 1.34 756.3 3.93Yemen 392.8 1.11 652.2 3.39Morocco 841.1 2.38 641.6 3.33Tunisia 213.2 0.60 163.7 0.85Libya 31.6 0.09 47.5 0.25
Total (countries with data for both years) 20,691.6 58.50 19,247.6 100.00Djibouti 5.1 0.01 -- --Syria 1,539.7 4.35 -- --Lebanon 2,661.1 7.52 -- --Sudan 4,806.5 13.59 -- --Algeria 5,666.0 16.02 -- --Total 35,370.0 100.00 19,247.6 100.00
Source: National sources
Inter-Arab Direct Investment Flows, by Host Country
Country/Year2008 2009
Table (2)

Country 1995 1996 1997 1998 1999 2000 2001 2002 2003 2004 2005 2006 2007 2008 2009 TotalKSA 12.2 20.6 27.0 198.0 82.0 76.8 651.4 716.9 297.3 958.0 28,797.0 1,649.0 6,388.0 12,758.0 11,623.0 64,255.2Sudan 38.8 554.0 142.5 70.3 151.7 414.6 554.9 567.4 610.0 657.0 2,455.0 2,004.0 3,339.8 4,806.5 - 16,366.5Lebanon 157.8 250.0 312.0 400.0 500.0 350.0 225.0 650.0 850.0 1,050.0 1,779.8 2,266.8 3,342.8 2,661.1 - 14,795.3Egypt 455.0 711.0 532.0 390.0 277.0 113.0 96.5 100.4 125.5 418.0 363.1 3,273.6 1,874.6 2,422.1 1,711.7 12,863.5UAE - - - 380.0 176.0 196.0 215.0 217.5 650.2 525.0 0.0 2,316.0 - 3,559.7 3,651.6 11,887.0Algeria 3.5 - - 122.0 85.8 347.5 350.0 54.6 80.4 263.3 260.6 - 476.0 5,666.0 - 7,709.7Morocco 59.8 61.2 48.0 48.6 22.2 24.8 39.5 12.8 672.1 1,105.4 1,121.4 350.1 832.6 841.1 641.6 5,881.3Syria 333.5 303.0 328.0 212.0 224.0 8.7 43.5 46.5 42.4 427.2 955.4 225.0 370.0 1,539.6 - 5,058.8Tunisia 54.7 70.2 135.0 290.0 506.0 49.1 69.1 75.0 67.4 107.3 153.8 2,363.8 165.5 213.2 163.7 4,483.8Jordan 35.7 13.5 10.6 12.7 24.2 26.2 27.6 21.0 17.6 27.0 299.4 959.9 816.5 473.2 756.3 3,521.4Oman 4.2 24.0 18.7 42.0 45.8 - - - - 62.6 573.3 - 2,653.3 - - 3,423.9Yemen 11.9 86.0 11.0 22.2 16.7 68.5 6.5 139.4 126.4 58.8 203.9 849.6 92.0 392.8 652.2 2,737.9Libya - - - - - 80.4 85.0 82.7 102.6 23.6 300.3 246.4 302.1 31.6 47.5 1,302.2Bahrain 13.0 - - 16.0 14.0 - 217.4 159.6 191.7 274.2 - - - - - 885.9Palestine 250.0 - 24.8 56.0 - - - - - 0.3 0.5 - - - - 331.6Qatar - - - 54.4 58.0 61.8 65.5 68.5 10.0 - - - - - - 318.2Djibouti - - - - - - - - - - - - 7.2 5.1 - 12.3
Total 1,430.1 2,093.5 1,589.6 2,314.2 2,183.4 1,817.4 2,646.9 2,912.3 3,843.6 5,957.7 37,263.5 16,504.2 20,660.4 35,370.0 19,247.6 155,834.5Source: National Sources
Table (3)Inter-Arab Direct Investment Inflows, by Host Country (1995 - 2009)
(US$ Millions)

Jordan Tunisia Libya Egypt Morocco Yemen UAE KSAKuwait 71.8 38.0 - 111.7 375.2 17.9 1,222.2 4,299.0 6,135.8UAE 84.9 65.6 15.8 952.4 149.7 0.8 - 3,787.0 5,056.2Bahrain 302.2 25.5 3.5 35.1 14.8 - 202.7 1,095.0 1,678.8Qatar - - - 29.6 12.9 527.5 614.3 64.0 1,248.3Jordan - 0.4 - 199.7 30.3 0.4 70.3 818.0 1,119.1KSA 248.6 2.8 - 261.9 33.1 21.7 473.7 - 1,041.8Lebanon 1.4 - - 49.5 8.6 0.7 251.3 414.0 725.5Egypt 0.7 11.4 - - 8.0 0.1 34.9 391.0 446.1Libya 0.7 10.2 - 10.1 0.9 26.9 321.1 - 369.9Syria 2.9 0.4 - - - 0.1 2.4 312.0 317.8Palestine 5.1 0.9 - - - 18.5 197.0 221.5Sudan - - - 1.7 - 177.6 20.0 199.3Yemen 1.5 - - 7.1 - - - 177.0 185.6Iraq 34.7 3.2 5.4 - 2.5 56.1 58.8 6.0 166.7Oman 1.7 - - 12.5 - - 86.5 33.0 133.7Algeria - 5.1 - - - - 117.3 2.0 124.4Tunisia - - 21.2 2.1 5.6 - - 4.0 32.9Morocco - 0.2 - - - - - 4.0 4.2Other - - 1.6 38.3 - - - - 39.9
Total 756.2 163.7 47.5 1711.7 641.6 652.2 3651.6 11623 19,247.5Source: National Sources
Table (4)Breakdown of Inter-Arab Direct Investment Flows by Host/Source Country (2009)
(US$ Millions)
Country of DestinationTotalCountry of Origin

(US$ Millions)
Country/Sector Manufacturing Agriculture Services Other TotalJordan 717.20 1 21.40 16.8 756.4Yemen 36.4 2.7 585 28.1 652.2Tunisia 41.8 - 90.5 31.4 163.7Libya 47.5 - - - 47.5Total 842.9 3.7 696.9 76.3 1,619.8Percentage 52.04% 0.23% 43.02% 4.71% 100%Source: National Sources
Table (5)Inter-Arab Direct Investments Inflows by Sector (2009)

Value (%) Value (%)KSA 38,151.0 38.90 35,514.0 43.99Qatar 6,700.0 6.83 8,722.0 2 10.80UAE 13,700.0 13.97 8,550.0 10.59Egypt 9,494.6 9.68 6,711.6 8.31Lebanon 3,606.4 3.68 4,803.6 5.95Sudan 2,600.5 2.65 2,922.8 3.62Morocco 3,608.1 3.68 2,519.4 3.12Jordan 2,826.0 2.88 2,384.3 2.95Algeria 2,280.0 2.32 2,310.0 2.86Tunisia 2,726.4 2.78 1,767.9 1 2.19Syria 2,116.0 2.16 1,514.0 2 1.88Iraq 488.0 0.50 920.0 2 1.14Libya 4,111.0 4.19 844.3 1.05Yemen 415.5 0.42 654.8 0.81Bahrain 1,793.5 1.83 257.1 0.32Kuwait 56.0 0.06 146.4 0.18Djibouti 253.2 0.26 99.2 1 0.12Mauritania 103.0 0.11 83.7 3 0.10Palestine 29.0 0.03 -- --Somalia 87.0 0.09 -- --Oman 2,928.0 2.99 -- --Total 98,073.2 100.00 80,725.1 100.00
Sources:National sourcesHighlighted cells: from UNCTAD, World Investment Report 2009.1 Central Bank, estimated based on the first 9 months of the year.2 IMF projections, country reports: Qatar (Feb 2010), Iraq March (2010), Syria (March 2010)3 IMF Country Report , Mauritania (June 2010), investments in the Oil Sector.
Table (6)Inward FDI, by Host Country
(US$ Millions)
2008 2009Country/Year

Country/Year 1999 2000 2001 2002 2003 2004 2005 2006 2007 2008 TotalSaudi Arabia 123 183 504 453 778 1,942 12,097 18,293 24,318 38,223 96,914United Arab Emirates -985 -506 1,184 1,314 4,256 10,004 10,900 12,806 14,187 13,700 66,860Egypt 1,065 1,235 510 647 237 2,157 5,376 10,043 11,578 9,495 42,343Lebanon 872 964 1,451 1,336 2,860 1,899 2,624 2,675 2,731 3,606 21,018Qatar 113 252 296 624 625 1,199 2,500 3,500 4,700 6,700 20,509Morocco 1,364 422 2,808 481 2,314 895 1,653 2,450 2,803 2,388 17,578Sudan 371 392 574 713 1,349 1,511 2,305 3,541 2,436 2,601 15,793Libya -128 141 -113 145 143 357 1,038 2,013 4,689 4,111 12,396Tunisia 368 779 486 821 584 639 782 3,312 1,618 2,761 12,150Algeria 292 438 1,196 1,065 634 882 1,081 1,795 1,662 2,646 11,691Jordan 156 815 180 122 443 816 1,774 3,268 1,950 1,954 11,478Bahrain 454 364 80 217 517 865 1,049 2,915 1,756 1,794 10,011Oman 39 83 5 122 26 111 1,538 1,688 3,125 2,928 9,665Syria 263 270 110 115 160 320 583 659 1,242 2,116 5,838Yemen -308 6 136 102 6 144 -302 1,121 917 463 2,285Iraq -7 -3 -6 -2 0 300 515 383 485 488 2,153Mauritania 15 40 77 67 102 392 814 155 153 103 1,918Djibouti 4 3 3 4 14 39 59 164 195 234 719Palestine 189 62 19 9 18 49 47 19 28 29 469Kuwait 72 16 -175 4 -68 24 234 122 123 56 408Somalia -1 0 0 0 -1 -5 24 96 141 87 341Total Arab Countries 4,331 5,956 9,325 8,359 14,997 24,540 46,691 71,018 80,837 96,483 362,537Developing countries 228,178 256,883 215,421 175,935 183,994 290,397 329,292 433,764 529,344 620,733 3,263,941World 1,078,606 1,381,675 820,430 629,675 565,160 734,892 973,329 1,461,074 1,978,838 1,697,353 11,321,032Arab Countries (% of the world) 0.40 0.43 1.14 1.33 2.65 3.34 4.80 4.86 4.09 5.68 3.20
Source: UNCTAD World Investment Report 2009.
Table (7)FDI Inflows to Arab Countries (1999 - 2008)
(US$ Millions)

1999 2000 2001 2002 2003 2004 2005 2006 2007 2008World 1,078,606 1,381,675 820,430 629,675 565,160 734,892 973,329 1,461,074 1,978,838 1,697,353Developing Economies 228,178 256,883 215,421 175,935 183,994 290,397 329,292 433,764 529,344 620,733Economies in Transition 8,486 6,998 9,725 11,293 19,901 30,308 30,948 54,548 90,866 114,361Developed Economies 841,942 1,117,795 595,284 442,448 361,265 414,186 613,089 972,762 1,358,628 962,259Arab Countries, Total 4,331 5,956 9,325 8,359 14,997 24,540 46,691 71,018 80,837 96,483Arab Countries/Developing Countries (%) 1.90 2.32 4.33 4.75 8.15 8.45 14.18 16.37 15.27 15.54Arab Countries/World (%) 0.40 0.43 1.14 1.33 2.65 3.34 4.80 4.86 4.09 5.68Source: UNCTAD World Investment Report 2009
1999 2000 2001 2002 2003 2004 2005 2006 2007 2008 2009(1 st half)
Total
World 766,044 1,143,816 593,960 369,789 296,988 380,598 929,362 635,940 1,031,100 673,214 123,155 6,943,966
Arab Countries, Total M&As as a Seller 1,181 1,744 3,225 611 5,717 955 4,718 13,865 9,117 19,331 2,064 62,529
Arab Countries, Total M&As as a Purchaser 1,417 1,900 539 3,005 1,981 1,282 34,101 40,585 37,690 23,850 8,651 155,001
Arab Countries share of Global M&As as a Seller (%) 0.15 0.15 0.54 0.17 1.93 0.25 0.51 2.18 0.88 2.87 1.68 0.90Arab Countries share of Global M&As as a Purchaser (%) 0.18 0.17 0.09 0.81 0.67 0.34 3.67 6.38 3.66 3.54 7.02 2.23Source: UNCTAD World Investment Report 2009
3.20
Arab Countries' Share in Global FDI Flows(1999 - 2008)
(US$ Millions)
Arab Countries' Share in Cross-border M&As(1999 - 2009)
Total11,321,0323,263,941377,434
7,679,658
Table (8)Arab Countries' Share in Global FDI Flows and Cross-border M&As
(US$ Millions)
362,53711.11

Total Inter-Arab Inter-Arab(%) Total Inter-Arab Inter-Arab
(%) Total Inter-Arab Inter-Arab(%) Total Inter-Arab Inter-Arab
(%)Jordan 5,633 2,608 46.31 6,366 2,604 40.90 16,995 5,697 33.52 14,075 4,813 34.19 (11,362) (7,709)UAE 239,000 14,370 6.01 175,000 9,435 5.39 177,000 7,936 4.48 140,000 6,704 4.79 62,000 35,000Bahrain 17,316 3,106 17.94 12,050 2,039 16.92 10,350 6,158 59.49 6,100 5,202 85.27 6,966 5,950Tunisia 19,319 1,784 9.23 14,449 1,715 11.87 24,622 2,708 11.00 19,100 2,288 11.98 (5,303) (4,651)Algeria 79,298 2,442 3.08 43,689 1,418 3.25 39,479 1,110 2.81 39,103 1,627 4.16 39,819 4,586Djibouti 69 43 61.59 75 28 37.21 574 116 20.17 410 98 23.86 (505) (335)Saudi Arabia 313,462 38,588 12.31 188,500 25,336 13.44 115,147 8,554 7.43 92,200 7,226 7.84 198,315 96,300
Sudan 1 11,671 868 7.44 7,800 1,103 14.14 9,352 2,169 23.20 8,200 1,953 23.82 2,319 (400)Syria 14,300 5,127 35.86 10,400 3,367 32.37 18,150 2,981 16.42 16,300 2,518 15.45 (3,850) (5,900)Iraq 62,300 1,226 1.97 39,500 805 2.04 33,000 8,870 26.88 37,000 7,493 20.25 29,300 2,500Oman 37,719 3,849 10.20 26,430 2,527 9.56 23,137 6,136 26.52 19,500 5,183 26.58 14,582 6,930Qatar 56,593 1,499 2.65 41,500 1,366 3.29 27,900 2,323 8.33 22,500 1,962 8.72 28,693 19,000Kuwait 87,464 2,004 2.29 56,610 1,316 2.32 24,874 3,537 14.22 19,640 2,988 15.21 62,590 36,970Lebanon 4,454 1,636 36.73 4,187 1,074 25.66 16,754 2,165 12.92 16,574 1,829 11.03 (12,300) (12,387)Libya 62,782 1,378 2.20 35,300 845 2.39 9,150 1,005 10.99 10,150 849 8.37 53,632 25,150Egypt 29,849 3,457 11.58 23,089 4,092 17.72 56,623 5,969 10.54 45,564 4,034 8.85 (26,774) (22,475)Morocco 20,302 748 3.68 13,848 491 3.55 42,262 5,332 12.62 32,804 4,505 13.73 (21,960) (18,956)Mauritania 1,752 35 2.01 1,360 23 1.70 1,731 152 8.78 1,410 128 9.10 21 (50)Yemen 7,717 1,321 17.12 5,898 627 10.63 10,452 4,901 46.89 8,500 4,140 48.70 (2,735) (2,602)Total 1,071,000 86,090 8.04 706,051 60,212 8.53 657,552 77,820 11.83 549,130 65,540 11.94 413,448 156,921
Source: National Sources, WTO, Unified Arab Economic Report 2009Shaded cells: Figures are projected.1 For 2009, Sudanese Inter-Arab exports data represents the first half of the year only.
2008 20092009
(US$ Millions)
Table (9)Foreign and Inter-Arab Trade, 2008 & 2009
Exports Imports2008 2009 2008
Trade Balance

2008 2009 %(from total) 2008 2009 %
(from total) 2008 2009 %(from total) 2008 2009 %
(from total) 2008 2009 Change (%)
Saudi Arabia 246.3 318.8 35.28 523.1 337.0 51.54 58.8 56.7 15.57 126 135 9.03 226.8 291.5 28.53Kuwait 70.2 93.8 10.39 133.7 103.8 15.87 80.9 106.3 29.19 204 205 13.71 406.9 381.3 (6.29)Egypt 85.9 91.1 10.08 88.0 81.2 12.41 22.2 36.7 10.06 373 306 20.47 116.8 218.4 86.99Qatar 76.6 87.9 9.73 48.2 25.3 3.87 3.9 3.5 0.95 43 44 2.94 372.4 386.9 3.89Abu Dhabi 68.8 80.2 8.88 63.1 18.8 2.87 49.9 36.6 10.04 65 67 4.48 265.3 218.8 (17.53)Morocco 65.7 74.2 8.21 14.1 16.2 2.48 0.2 0.3 0.08 77 73 4.88 463.0 446.0 (3.67)Dubai 63.1 58.1 6.43 83.1 47.2 7.22 76.5 110.7 30.38 65 67 4.48 198.8 225.5 13.43Jordan 35.8 31.9 3.53 28.7 13.6 2.09 5.4 6.0 1.65 262 272 18.19 207.4 405.1 95.32Oman 15.1 23.6 2.61 8.7 5.9 0.90 4.2 6.1 1.67 122 120 8.03 134.6 111.5 (17.16)Bahrain 19.9 16.3 1.80 2.1 0.5 0.07 1.7 0.9 0.23 51 49 3.28 173.5 170.0 (2.02)Lebanon 9.6 12.8 1.42 1.7 1.0 0.16 0.1 0.1 0.03 13 11 0.74 172.4 142.5 (17.34)Tunisia 6.3 9.2 1.02 1.7 1.4 0.21 0.2 0.2 0.05 50 52 3.48 64.6 63.8 (1.24)Sudan 3.8 3.0 0.34 0.5 1.0 0.15 0.3 0.1 0.04 52 53 3.55 103.3 185.9 79.96Palestine 2.1 2.4 0.26 1.2 0.5 0.08 0.3 0.2 0.06 37 39 2.61 155.4 176.6 13.64Algeria 0.1 0.1 0.01 2.1 0.5 0.07 0.0 0.0 0.01 2 2 0.13 59.3 85.7 44.52Total 770 903 100 1,000 654 100 305 364 100 1,542 1,495 100 3,121 3,510 12.47
Source:Arab Monetary Fund1Arab Monetary Fund Composite IndexNote: Coutries are arranged according to their Market Value in 2009
Traded Securities (billions) Number of Listed Companies Price Indices1Country's Stock Exchange Market
Table (10)Arab Stock Exchanges (2008 & 2009)
Market Value (US$ Billions) Trade Value (US$ billions)
Key Indicators

Dec-08 Dec-09UAE 4 - AA –
Qatar 4 - AA –
Kuwait 4 - AA –
KSA 4 - AA –
Oman 6 - A
Bahrain 6 - A
Tunisia 8 8 BBB +
Libya - 8 BBB +
Egypt 10 10 BBB -
Morocco 10 10 BBB -
Jordan 11 11 BB +
Lebanon 15 15 B
Yemen 15 15 B
Source: FT, Credit Ratings in Emerging Markets, Issue 2010:1
High speculation grade, high risk and high probability of payment risks.
Unified Credit RatingsRating Outlook
Table (11)Sovereign Credit Ratings 2009
Country
Strong investment grade, very low risk, very strong payment ability.
Very high investment grade, low risk and strong payment ability.
High investment grade, low risk and moderate payment ability.
Speculation grade, medium risk and probabilty of payments risks.

140 Countries
140 Countries
177 Countries
177 Countries
132 Countries
132 Countries
165 Countries
165 Countries
Dec-08 Dec-09 Mar-08 Sep-09 Dec-08 Dec-09 Dec-08 Dec-09Jordan 66.5 69.8 41.8 43.8 DB3c DB3d B BUAE 82.3 76.8 71.7 76 DB2a DB2b A2 A3Bahrain 82 75.5 66.1 68.2 DB2d DB2d A3 A3Tunisia 72.3 71 56.1 58.7 DB2c DB2c A4 A4Algeria 76.8 70.8 51.9 53.3 DB5a DB5a A4 A4Djibouti - - 22.8 22.5 - - C CKSA 80.3 73 72 72.4 DB2d DB3a A4 A4Sudan 55.8 53.3 9.6 10.8 DB6d DB6d D DSyria 65 65.5 26.4 28 DB5b DB5a C CSomalia 39.3 37.3 6.2 7 - - - -Iraq 60 59.5 19.5 16.7 DB7 DB6d D DOman 82.5 80.3 69.1 69.8 DB3a DB3a A3 A3Palestine - - - - - - - -Qatar 78.8 81.3 75.2 76.7 DB2a DB2a A2 A2Kuwait 84.8 78.3 71.1 74.4 DB2c DB3b A2 A2Lebanon 57.8 60.3 23.3 26.1 DB5a DB4d C CLibya 81.5 75.8 49.2 49.1 DB4d DB4d C CEgypt 65.5 66.3 49.1 49.9 DB3b DB3c B BMorocco 74.8 73.3 52.3 53.7 DB2d DB3b A4 A4Mauritania - - 19.4 20.4 - - C CYemen 66.5 65.5 23 27.9 DB6b DB6c C DTotal Number of Arab Countries
Source:Interactive Data Credit Ratings - Emerging Markets, Issue 1, 2010Coface.com (website accessed Jan 2010)Institutional Investor website (accessed April 2010)
17 19
Table (12)Arab Countries in International Rating Indices
Institutional Investor Dun & Bradstreet CofacePRS
18 20
Country
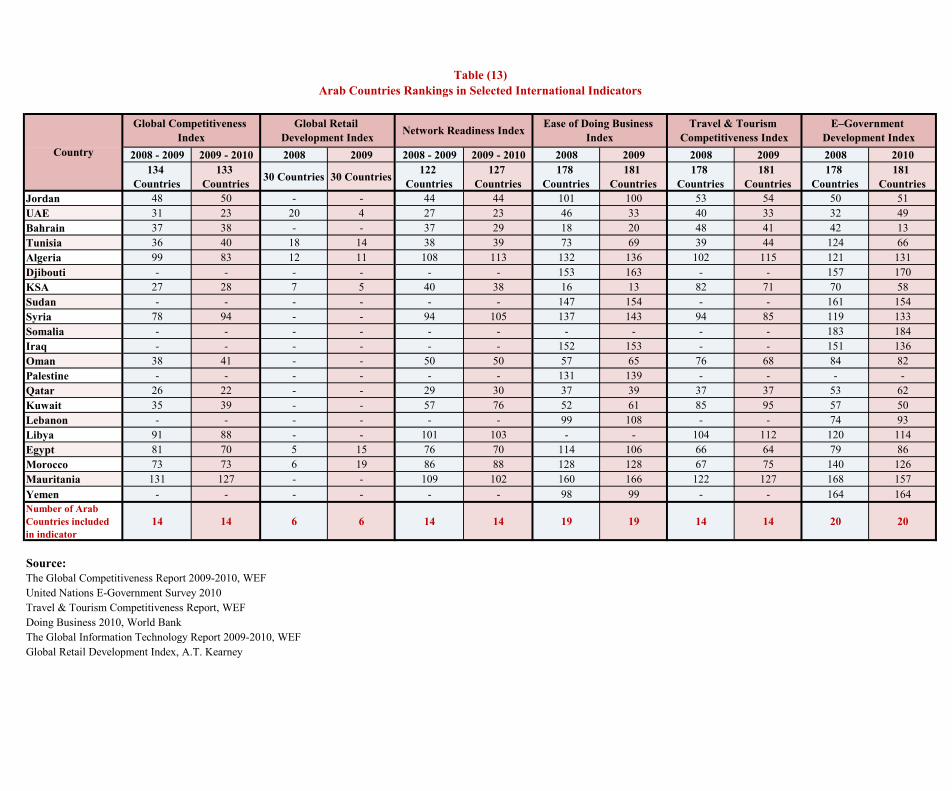
2008 - 2009 2009 - 2010 2008 2009 2008 - 2009 2009 - 2010 2008 2009 2008 2009 2008 2010134
Countries133
Countries 30 Countries 30 Countries 122 Countries
127 Countries
178 Countries
181 Countries
178 Countries
181 Countries
178 Countries
181 Countries
Jordan 48 50 - - 44 44 101 100 53 54 50 51UAE 31 23 20 4 27 23 46 33 40 33 32 49Bahrain 37 38 - - 37 29 18 20 48 41 42 13Tunisia 36 40 18 14 38 39 73 69 39 44 124 66Algeria 99 83 12 11 108 113 132 136 102 115 121 131Djibouti - - - - - - 153 163 - - 157 170KSA 27 28 7 5 40 38 16 13 82 71 70 58Sudan - - - - - - 147 154 - - 161 154Syria 78 94 - - 94 105 137 143 94 85 119 133Somalia - - - - - - - - - - 183 184Iraq - - - - - - 152 153 - - 151 136Oman 38 41 - - 50 50 57 65 76 68 84 82Palestine - - - - - - 131 139 - - - -Qatar 26 22 - - 29 30 37 39 37 37 53 62Kuwait 35 39 - - 57 76 52 61 85 95 57 50Lebanon - - - - - - 99 108 - - 74 93Libya 91 88 - - 101 103 - - 104 112 120 114Egypt 81 70 5 15 76 70 114 106 66 64 79 86Morocco 73 73 6 19 86 88 128 128 67 75 140 126Mauritania 131 127 - - 109 102 160 166 122 127 168 157Yemen - - - - - - 98 99 - - 164 164Number of Arab Countries included in indicator
14 14 6 6 14 14 19 19 14 14 20 20
Source:The Global Competitiveness Report 2009-2010, WEFUnited Nations E-Government Survey 2010Travel & Tourism Competitiveness Report, WEFDoing Business 2010, World BankThe Global Information Technology Report 2009-2010, WEFGlobal Retail Development Index, A.T. Kearney
E–Government Development Index
Table (13)Arab Countries Rankings in Selected International Indicators
Global Competitiveness Index
Global Retail Development Index Network Readiness Index Ease of Doing Business
Index Country
Travel & Tourism Competitiveness Index

Investment Climate in Arab Countries
2009
FDI at a Glance

Country fact sheet:
AlgeriaArea (Sq Km) 2,381,740Capital City AlgeriaOfficial Language ArabicLocal Currency Algerian Dinar
2005 2006 2007 2008 2009Population (millions) 32 906 33.800 34.400 34.460 34 977Exchange Rate (period average) 73.276 72.647 69.293 64.583 72 520Inflation Rate 1.6 2.3 3.6 4.9 5.7GDP at current prices (US$ mn) 103,220 117,288 134,303 170,228 140,848Real GDP growth rate 5.1 2.0 3.0 2.4 2.0Exports of Goods and Services (US$ mn) 48,840 57,300 63,500 82,100 48,000Imports of Goods and Services (US$ mn) 24,640 25,500 33,300 49,100 49,400Official Reserves excluding gold (US$ mn) 56,180 77,800 110,200 143,100 147,200External Debt (US$ mn) 17,238 5,630 5,641 5,618 7,183
CountryJordanUAE
BahrainTunisiaSudanSyria
MoroccoOmanQatar
KuwaitLebanon
LibyaEgypt
Yemen
National Investment Development Agency Agence Nationale de Développement de l'InvestissementAddress 27, Street Mohamed MERBOUCHE Hussein-Dey BP 414 (siège du CNAT) - AlgerContact number 213 (0) 21 77 32 62/63Email information@andi dzWebsite www andi dz
-- 25 January 1990
Date of signature1 August 199624 April 2001
Bilateral Investment Treaties(BITs)
Double Tax Treaties(DTTs)
Date of signature16 September 1997
24 April 2001
Investment Promotion Agency contact information
Membership of investment related international organizations (agreements) as of December 2009Other relevant information
Algeria is a member of the Multilateral Investment Guarantee Agency (MIGA), the World Association for Investment Promotion Agencies (WAIPA), and an observer in the World Trade Organisation (WTO)
11 June 200016 February 200624 October 2001
14 September 1997
24 October 19963 September 2001
--6 August 200129 March 1997
25 November 1999
11 June 2000
AlgeriaForeign Direct Investment (FDI) at a Glance
Bilateral Agreements 2009
FDI Inflows 2003-2009 FDI Inflows as a % of GDP
(US$ mn)
2003-2009(US$ mn)
FDI Ouflows 2002-2008 FDI Ouflows as a % of GDP2002-2008
29 January 2002
9 February 1985--
12 September 1997
9 April 20001 August 1998
9 April 2000
--29 August 2002
19 June 198817 February 2001
2003 2004 2005 2006 2007 2008 2009
634 882 1,081 1,795 1,662 2,280 2,310
0
500
1,000
1,500
2,000
2,500
2003 2004 2005 2006 2007 2008 2009
0.9 1.0 1.0 1.5 1.2 1.3 1.6
0.00.20.40.60.81.01.21.41.61.8
2002 2003 2004 2005 2006 2007 2008
100 14 258 57 35 295 318
050
100150200250300350
2002 2003 2004 2005 2006 2007 2008
0.00 0.02 0.30 0.06 0.03 0.22 0.19
0.000.050.100.150.200.250.300.35

Country fact sheet:
Bahrain
Area (Sq Km) 741
Capital City Manama
Official Language Arabic
Local Currency Bahraini Dinar
2005 2006 2007 2008 2009
Population (millions) 0.73 0.75 0.76 0.78 1.04
Exchange Rate (period average) 0.376 0.376 0.376 0.376 0.376
Inflation Rate 2.62 2.04 3.25 3.53 2.79
GDP at current prices (billion US$) 13,456 15,848 18,443 21,236 20,214
Real GDP growth rate 7.85 6.65 8.07 6.12 2.89
Exports of Goods and Services (US$ mn) 13,290 15,500 17,200 21,100 16,300
Imports of Goods and Services (US$ mn) 10,287 11,300 12,300 15,700 12,900
Official Reserves excluding gold (US$ mn) 1,876 2,700 4,100 3,800 3,600
External Debt (US$ mn) 5,828 8,463 25,728 33,553 32,464
Country
AlgeriaEgyptJordan
LebanonMorocco
SyriaYemen Sudan
Investment promotion agency: Bahrain Economic Development Board
Address: Seef Tower, 7th, 8th, 12th, 13th floor, P.O. Box 11299, Manama, BahrainContact number: +973 17 58 99 99Fax: +973 17 58 99 00E-mail: [email protected]: www.bahrainedb.com
20 September 20001 December 200217 January 2000
--28 September 2002
23 March 2006
Bahrain is a member of the Multilateral Investment Guarantee Agency (MIGA), the World Trade Organisation (WTO), the World Association of Investment Promotion Agencies (WAIPA)
Investment Promotion Agency contact information
Other relevant information
Membership of investment related international organizations (agreements) as of December 2009
Date of signature Date of signature
Bilateral Investment Treaties
(BITs)
Double Tax Treaties
(DTTs)
BahrainForeign Direct Investment (FDI) at a Glance
FDI Inflows 2003-2009 FDI Inflows as a % of GDP
(US$ mn) 2003-2009
FDI outflows 2002-2008
(US$ mn)
FDI outflows as a % of GDP
2002-2008
Bilateral Agreements 2009
--4 October 19978 February 20007 August 20037 April 2000
11 June 200017 September 1997
--7 August 2003
4 February 2000
2003 2004 2005 2006 2007 2008 2009
517 865 1,049 2,915 1,756 1,793 257
0500
1,0001,5002,0002,5003,0003,500
2003 2004 2005 2006 2007 2008 2009
5.3 7.7 7.8 18.4 9.5 8.4 1.3
0.0
5.0
10.0
15.0
20.0
2002 2003 2004 2005 2006 2007 2008
190 741 1,036 1,135 980 1,669 1,620
0200400600800
1,0001,2001,4001,6001,800
2002 2003 2004 2005 2006 2007 2008
2.25 7.64 9.26 8.43 6.18 9.05 7.63
0.001.002.003.004.005.006.007.008.009.00
10.00

Country fact sheet:
Djibouti
Area (Sq Km) 23,200
Capital City Djibouti
Official Language French & Arabic
Local Currency Franc
2005 2006 2007 2008 2009
Population (millions) 0.73 0.75 0.77 0.78 0.80
Exchange Rate (period average) 177.6 177.6 177.7 177.6 177.7
Inflation Rate 3.11 3.47 4.97 11.96 1.67
GDP at current prices (US$ mn) 709 769 848 983 1,049
Real GDP growth rate 3.17 4.82 5.08 5.82 4.97
Exports of Goods and Services (US$ mn) 288 300 300 400 400
Imports of Goods and Services (US$ mn) 391 500 600 700 600
Official Reserves excluding gold (US$ mn) 88 117 130 132 ..
External Debt (US$ mn) 440 437 539 592 665
Country
Egypt
National Investment Promo ion Agency Agence Nationale pour la Promotion des Investissement (ANPI)
Address ANPI – B.P. 1884 Rue de Marseille, Djibouti Contact number (+253) 31 21 02
Website www.djibou iinvest.djE-mail [email protected]
Date of signature
-
DjiboutiForeign Direct Investment (FDI) at a Glance
Investment Promo ion Agency contact informationDjibouti is a member of the Multilateral Investment Guarantee Agency (MIGA), the World Trade Organisation (WTO), the World Association of Investment Promotion Agencies (WAIPA)
Other relevant information
Membership of investment related interna ional organizations (agreements) as of December 2009
FDI Inflows 2003-2009 FDI Inflows as a % of GDP
(US$ mn) 2003-2009
Bilateral Agreements 2009
Bilateral Investment Treaties
(BITs)
Double Tax Treaties
(DTTs)
Date of signature
21 July 1998
2003 2004 2005 2006 2007 2008 2009
14 39 59 164 195 253 99
0
50
100
150
200
250
300
2003 2004 2005 2006 2007 2008 2009
2.2 5.9 8.3 21.3 23.0 25.7 9.5
0.0
5.0
10.0
15.0
20.0
25.0
30.0

Country fact sheet:
EgyptArea (Sq Km) 1,001,450Capital City CairoOfficial Language ArabicLocal Currency Egyptian Pound
2005 2006 2007 2008 2009Population (millions) 70.0 71.3 73.6 75.2 76.7Exchange Rate (period average) 5.997 5.753 5.714 5.513 5.526Inflation Rate 8.80 4.20 10.95 11.70 16.24GDP at current prices (US$ mn) 89,794 107,375 130,346 162,435 187,954Real GDP growth rate 4.47 6.84 7.09 7.17 4.67Exports of Goods and Services (US$ mn) 28,862 33,900 39,500 53,300 47,000Imports of Goods and Services (US$ mn) 39,221 38,200 45,200 63,100 59,900Official Reserves excluding gold (US$ mn) 19,300 22,800 28,500 34,500 31,200External Debt (US$ mn) 28,914 29,636 29,849 33,949 31,576
Arab countries 2008 2009 Non-Arab countries 2008 2009
UAE 762.80 952.40 USA 4,714.70 2,258.10Saudi Arabia 504.10 261.90 UK 2,463.70 3,780.80Jordan 83.60 199.70 Belgium 1,104.60 1,274.70Kuwait 611.80 111.70 France 1,130.90 244.40Lebanon 35.40 49.50 Greece 125.20 119.00Bahrain 35.80 35.10 Holland 143.90 102.20Qatar 217.10 29.60 Germany 90.00 85.00Oman 7.00 12.50 Italy 37.30 82.40Libya 137.40 10.10 Spain 22.30 71.20Yemen 15.40 7.10 Turkey 37.10 56.20Tunisia 0.40 2.10 China 24.10 53.50Sudan 2.40 1.70 Cyprus 11.50 49.80Others 8.80 38.30 India 13.30 48.80Subtotal 2422.0 1711.7 Japan 38.60 27.80
Non-Arab countries 2008 2009 Australia 7.80 4.90Switzerland 235.40 98.20 Poland 7.40 3.90Sweden 1.70 45.90 Luxumbourg 37.30 3.90Norway 5.30 4.30 Canada 135.70 2.70Ireland 2.60 1.60 Others 1,504.50 1,543.00Austria 10.40 1.50Denmark 18.20 0.80 Subtotal 11923.5 9964.6
Repatriation -4850.9 -4964.7
FDI (net) 9494.6 6711.6
CountryAlgeriaBahrainJordanKuwait
LebanonLibyaOman
Saudi ArabiaSudan
MoroccoTunisiaQatarSyria
DjiboutiPalestine
UAEIraq
SomaliaYemen
Investment promotion agency General Authority for Investment and Free Zones (GAFI)Address Salah Salem Road, Fairgrounds, Nasr City, 11562 Cairo, Egypt Telephone +202 240 55 452Fax +202 240 55 425Email [email protected] www.gafinet.org
6 June 1996 12 December 1997
Bilateral Investment Treaties(BITs)
Date of signature29 March 19974 October 1997
8 May 199617 April 200116 March 1996
3 December 199025 March 199813 March 1990
14 April 19978 December 198912 February 1999
9 December 197022 March 1989
8 December 19893 December 1990
--29 May 1982
--28 April 199812 April 199431 March 1968
--
21 July 199828 April 199811 May 1997
28 April 1997 19 July 1991
17 March 19963 December 1990
26 April 2000--
Double Tax Treaties(DTTs)
Date of signature17 February 2001
17 September 19978 May 1996
8 July 2001
Bilateral Agreements 2009
16 February 2004
Inward FDI: geographical breakdown, by source (US$ mn) Inward FDI breakdown, by sector
FDI Inflows 2003-2009 FDI Inflows as a % of GDP(US$ mn) 2003-2009
FDI Outflows 2002-2008 FDI Outflows as a % of GDP(US$ mn) 2002-2008
Investment Promotion Agency contact information
Other relevant informationMembership of investment related international organizations (agreements) as of December 2009
Egypt
Egypt is a member of the Multilateral Investment Guarantee Agency (MIGA), the World Trade Organisation (WTO), the World Association of Investment Promotion Agencies (WAIPA)
Foreign Direct Investment (FDI) at a Glance
Industry8.5% Agricultu
re0.7%
Tourism1.1%
Telecom0.1%
Finance17.8%
Other71.8%
2008
Industry6.8%Agricultur
e0.6%
Tourism1.0%
Telecom5.9%
Finance3.5%
Other82.2%
2009
2003 2004 2005 2006 2007 2008 2009
237 2,157 5,376 10,043 11,578 9,495 6,712
0
2,000
4,000
6,000
8,000
10,000
12,000
14,000
2003 2004 2005 2006 2007 2008 2009
0.3 2.7 6.0 9.4 8.9 5.8 3.6
0.0
2.0
4.0
6.0
8.0
10.0
2002 2003 2004 2005 2006 2007 2008
28 21 159 92 148 665 1,920
0
500
1,000
1,500
2,000
2,500
2002 2003 2004 2005 2006 2007 2008
0.03 0.03 0.20 0.10 0.14 0.51 1.18
0.00
0.20
0.40
0.60
0.80
1.00
1.20
1.40

Country fact sheet:
Iraq
Area (Sq Km) 438,317
Capital City Baghdad
Official Language Arabic
Local Currency Iraqi Dinar
2005 2006 2007 2008 2009
Population (millions) 27.9 28.8 29.6 30.4 31.2
Exchange Rate (period average) 1,469 1,467 1,255 1,193 1,170
Inflation Rate 36.96 53.25 30.82 2.67 -2.80
GDP at current prices (US$ mn) 31,383 45,075 56,982 86,525 65,838
Real GDP growth rate -0.73 6.21 1.50 9.52 4.21
Exports of Goods and Services (US$ mn) 23,500 30,200 38,700 63,500 40,200
Imports of Goods and Services (US$ mn) 24,900 23,200 29,300 49,100 50,400
Official Reserves excluding gold (US$ mn) 12,000 20,000 31,500 50,200 44,300
External Debt (US$ mn) 110,343 99,030 103,137 95,610 90,264
Country
TunisiaKuwait
MoroccoSyriaEgypt
Yemen
Investment promotion agency National Investment Commission Email [email protected] iqWebsite http://www.investpromo.gov iq
FDI Outflows 2004-2008 FDI Outflows as a % of GDP
(US$ mn) 2004-2008
31 March 1968
25 October 1964 --18 June 1990 --
29 August 2002 --
25 December 2001
Investment Promotion Agency contact information
Membership of investment related international organizations (agreements) as of December 2009Other relevant information
Iraq
Iraq is a member of the Multilateral Investment Guarantee Agency (MIGA), the World Association for Investment Promotion Agencies (WAIPA), and an observer in the World Trade Organisation (WTO)
Foreign Direct Investment (FDI) at a Glance
FDI Inflows 2003-2009 FDI Inflows as a % of GDP
(US$ mn) 2003-2009
Bilateral Agreements 2009
Bilateral Investment Treaties
(BITs)
Double Tax Treaties
(DTTs)
Date of signature Date of signature
--
----
June 2001
2004 2005 2006 2007 2008 2009
300 515 383 485 488 920
0
200
400
600
800
1000
2004 2005 2006 2007 2008 2009
2.17 1.64 0.85 0.85 0.56 1.40
0.00
0.50
1.00
1.50
2.00
2.50
2004 2005 2006 2007 2008
89 305 149 181
0
50
100
150
200
250
300
350
2004 2005 2006 2007 2008
0.28 0.68 0.26 0.21
0.00
0.20
0.40
0.60
0.80

Country fact sheet
Jordan
Area (Sq Km) 92,300
Capital City Aman
Official Language Arabic
Local Currency Jordanian Dinar
2005 2006 2007 2008 2009
Population (millions) 5.47 5.60 5.72 5.85 5.99
Exchange Rate (period average) 0.709 0.709 0.709 0.709 0.709
Inflation Rate 3.49 6.26 5.39 14.93 -0.68
GDP at current prices (US$ mn) 12,629 14,839 17,005 21,223 22,929
Real GDP growth rate 8.12 7.98 8.91 7.75 2.75
Exports of Goods and Services (US$ mn) 6,635 8,100 9,300 12,400 10,900
Imports of Goods and Services (US$ mn) 11,859 13,200 15,700 19,200 16,300
Official Reserves excluding gold (US$ mn) 4,744 6,200 6,900 7,700 11,100
External Debt (US$ mn) 7,135 7,316 7,414 5,157 5,365
Arab countries 2008 2009Non-Arab
countries2008 2009
Bahrain 21.15 302.20 UK 333.08 179.99Saudi Arabia 127.70 248.60 USA 8.30 41.99UAE 164.30 84.91 India - 25.06Kuwait 1.48 71.84 Israel 5.36 12.71Iraq 93.53 34.71 Sri Lanka - 11.28Palestine 57.19 5.11 South Korea - 7.05Syria 0.21 2.91 Canada 1.59 1.14Oman 0.00 1.69 Italy 0.11 0.80Yemen 0.00 1.47 Belgium - 0.52Lebanon 3.42 1.40 France 0.07 0.41Libya 0.00 0.74 Holland 2.82 0.39Egypt 2.83 0.69 Australia - 0.37Qatar 1.44 0.00 Austria 0.71 0.35Others 113.1 - Greece - 0.14
Arab Countries Total 586.3 756.3 China 0.14 0.10Turkey 0.42 0.07Taiwan 8.12 -Denmark 7.03 -Romania 0.11 -Germany 0.24 -Sweden 4.55 -South Africa 4.34 -Others 1862.72 1345.38
Subtotal 2,239.7 1,627.7
Total FDI 2,826 2,384
Country
BahrainQatar
TunisiaAlgeriaSudanSyria
KuwaitLebanon
EgyptOman
MoroccoUAE
Yemen
Investment promotion agency: Jordan Investment Board
Contact number: 962 65608400/9
Email: [email protected]: www.jordaninvestment.com
28 January 2009 12 January 2004
-- 12 June 2005
Membership of investment related international organizations (agreements) as of December 2009Other relevant information
6 November 199730 March 2000
16 June 2005
26 October 1998
8 October 2001--
31 October 20028 May 1996
--
Bilateral Agreements 2009
Jordan is a member of the Multilateral Investment Guarantee Agency (MIGA), the World Trade Organisation (WTO), the World Association of Investment Promotion Agencies (WAIPA)
27 April 19951 August 199630 March 20008 October 2001
21 May 200131 October 2002
8 May 19969 April 2007
16 June 1998
18 June 1995
1 October 1990
Investment Promotion Agency contact information
JordanForeign Direct Investment (FDI) at a Glance
FDI Outflows 2002-2008 FDI Outflows as a % of GDP
(US$ mn) 2002-2008
Inward FDI: geographical breakdown, by source (US$ mn) Inward FDI breakdown, by sector
(US$ mn) 2003-2009
FDI Inflows 2003-2009 FDI Inflows as a % of GDP
Bilateral Investment Treaties
(BITs)
Double Tax Treaties
(DTTs)
Date of signature Date of signature
8 February 2000 --
Industrial58.98%Agricultur
e0.08%
Service40.75%
Others0.18%
2008
Industrial95.60%
Agriculture
0.15%
Service4.18%
Others0.07%
2009
2003 2004 2005 2006 2007 2008 2009
443 816 1,774 3,268 1,950 2,826 2,384
0500
1,0001,5002,0002,5003,0003,500
2003 2004 2005 2006 2007 2008 2009
4.3 7.2 14.0 22.0 11.5 13.3 10.4
0.0
5.0
10.0
15.0
20.0
25.0
2002 2003 2004 2005 2006 2007 2008
14 -4 18 163 -138 48 13
-200-150-100-50
050
100150200
2002 2003 2004 2005 2006 2007 2008
0.15 -0.04 0.16 1.28 -0.93 0.28 0.06
-1.50
-1.00
-0.50
0.00
0.50
1.00
1.50

Country fact sheet:
Kuwait
Area (Sq Km) 17,818
Capital City Kuwait
Official Language Arabic
Local Currency Kuwaiti Dinar
2005 2006 2007 2008 2009
Population (millions) 3.0 3.2 3.3 3.4 3.5
Exchange Rate (period average) 0.292 0.290 0.284 0.269 0.287
Inflation Rate 4.12 3.09 5.47 10.50 4.68
GDP at current prices (US$ mn) 80,800 101,564 111,755 158,150 111,309
Real GDP growth rate 10.62 5.14 2.51 6.40 -2.67
Exports of Goods and Services (US$ mn) 51,700 66,900 73,300 98,300 65,000
Imports of Goods and Services (US$ mn) 22,800 25,800 31,200 38,000 34,500
Official Reserves excluding gold (US$ mn) 8,100 11,800 15,900 16,700 17,700
External Debt (billion US$) 16,483 26,407 26,262 26,727 27,048
Country
EgyptJordan
LebanonIraq
MauritaniaMorocco
UAETunisiaYemenAlgeriaSyria
Investment promotion agency Kuwait Foreign Investment Bureau (KFIB)
Address Sharq - Khalid bin alwaleed street - City tower, Kuwait. P.O.BOX : 3690 Safat 13037, Kuwait
Tel: (+965) 222 40 700
Fax: (+965) 222 40 773
Website www.kfib.com.kwE-mail: [email protected]
12 February 196614 September 1973
23 June 2000--
16/08/2001
16 February 2004--
4 April 2001
--
April 200030 September 2001
19 April 20089 December 1997
21 January 2001
16 February 1999
15 October 1964 --1 August 2006 --
Date of signature Date of signature
17 April 200121 May 2001
Bilateral Agreements 2009
Bilateral Investment Treaties
(BITs)
Double Tax Treaties
(DTTs)
Other relevant information
Membership of investment related international organizations (agreements) as of December 2009Kuwait is a member of the Multilateral Investment Guarantee Agency (MIGA), the World Trade Organisation (WTO), the World Association of Investment Promotion Agencies (WAIPA)
Investment Promotion Agency contact information:
KuwaitForeign Direct Investment (FDI) at a Glance
(US$ mn) 2003-2009
FDI outflows 2002-2008 FDI outflows as a % of GDP
FDI Inflows 2003-2009 FDI Inflows as a % of GDP
(US$ mn) 2002-2008
2003 2004 2005 2006 2007 2008 2009
-68 24 234 122 123 56 146
-100-50
050
100150200250
2003 2004 2005 2006 2007 2008 2009
-0.14 0.04 0.29 0.12 0.11 0.04 0.13
-0.20-0.15-0.10-0.050.000.050.100.150.200.250.300.35
2002 2003 2004 2005 2006 2007 2008
-78 -5,016 2,581 5,142 8,240 10,156 8,521
-6,000-4,000-2,000
02,0004,0006,0008,000
10,00012,000
2002 2003 2004 2005 2006 2007 2008
-0.20 -10.49 4.35 6 36 8.11 9 09 5.39
-15.00
-10.00
-5.00
0 00
5 00
10 00
15 00

Country fact sheet:
Lebanon
Area (Sq Km) 10,400
Capital City Beirut
Official Language Arabic
Local Currency Lebanese Pound
2005 2006 2007 2008 2009
Population (millions) 3.8 3.8 3.8 3.8 3.9
Exchange Rate (period average) 1,508 1,508 1,508 1,508 1,508
Inflation Rate -0.72 5.57 4.06 10.76 1.21
GDP at current prices (US$ mn) 21,861 22,438 25,047 29,485 33,585
Real GDP growth rate 2.50 0.58 7.50 9.00 9.00
Exports of Goods and Services (US$ mn) 11,300 13,700 16,000 22,600 24,300
Imports of Goods and Services (US$ mn) 14,900 16,700 20,600 28,100 29,600
Official Reserves excluding gold (US$ mn) 9,600 11,400 11,500 18,800 27,500
External Debt (US$ mn) 40,552 44,607 48,616 51,628 65,558
Country
JordanUAE
BahrainTunisia AlgeriaSudanSyriaOmanQatarKuwaitEgypt
MoroccoMauritania
Yemen
Investment promotion agency Investment Development Authority of Lebanon
Address Azarieh Tower, 4th Floor, Emir Bechir Street, Riad El-SolhP.O.Box: 113-7251 Beirut Lebanon
Contact number + 961 (1) 983306/7/8
Email [email protected] www.idal.com.lb
Double Tax Treaties
(DTTs)
FDI Inflows 2003-2009 FDI Inflows as a % of GDP
(US$ mn) 2003-2009
Lebanon is a member of the Mult lateral Investment Guarantee Agency (MIGA), the World Association for Investment Promotion Agencies (WAIPA), and an observer in the World Trade Organisation (WTO)
Foreign Direct Investment (FDI) at a Glance
Other relevant information
Membership of investment related international organizations (agreements) as of December 2009
Investment Promotion Agency contact information
Date of signature Date of signature
31 October 200217 May 1998
FDI outflows 2003-2008 FDI outflows as a % of GDP
(US$ mn) 2003-2008
Bilateral Agreements 2009
Bilateral Investment Treaties
(BITs)
21 January 200116 March 1996
3 July 199715 June 2004
Lebanon
7 August 200324 June 1998
--9 March 2004
12 January 199711 April 2006
25 November 1999
31 October 200217 May 1998
7 August 200324 June 1998
26 March 20029 March 2004
12 January 199712 April 2001
23 November 200521 January 200117 March 1996
20 October 2001--
29 September 2002
--
2003 2004 2005 2006 2007 2008 2009
2,860 1,899 2,624 2,675 2,731 3,606 4,804
0
1,000
2,000
3,000
4,000
5,000
6,000
2003 2004 2005 2006 2007 2008 2009
14.4 8.7 12.0 11.9 10.9 12.2 14.3
0.02.04.06.08.0
10.012.014.016.0
2003 2004 2005 2006 2007 2008
611 827 716 875 848 987
0
200
400
600
800
1000
1200
2003 2004 2005 2006 2007 2008
3.07 3.80 3.28 3.90 3.39 3.35
0.000.501.001.502.002.503.003.504.004.50

Country fact sheet:
LibyaArea (Sq Km) 1,759,540Capital City TripoliOfficial Language ArabicLocal Currency Libyan Dinar
2005 2006 2007 2008 2009Population (millions) 5.9 6.0 6.1 6.2 6.3Exchange Rate (period average) 1.350 1.281 1.222 1.267 1.305Inflation Rate 2.90 1.44 6.20 10.40 2.65GDP at current prices (US$ mn) 44,031 56,479 71,687 89,909 60,351Real GDP growth rate 10.29 6.72 7.50 3.38 1.76Exports of Goods and Services (US$ mn) 31,900 40,200 48,000 63,100 39,000Imports of Goods and Services (US$ mn) 13,533 15,900 20,400 25,400 26,900Official Reserves excluding gold (US$ mn) 39,300 60,100 80,300 97,100 102,600External Debt (US$ mn) 5,416 5,591 5,592 5,574 5,552
Arab countries 2008 2009 Non-Arab countries 2008 2009
UAE - 15.8 Germany 1.2 -Tunisia 15.3 - India 4.0 -Iraq - 5.4 Greece 5.0 -Qatar 13.0 - UK 6.1 22.2Bahrain - 3.5 South Africa 30.9Kuwait 2.4 21.2 Bahamas, The 2.9Egypt 1.0 - Canada 2.0Others - 1.6 Malta 2.1 166.9
Subtotal 31.6 47.5 Holland 3.6 500.5Spain - 1.3China - 42.6USA - 5.0Italy - 16.6Turkey - 15.6Switzerland - 0.6France - 10.9Cyprus - 4.9Central Africa - 0.1Iran - 7.9Others 4,021.7 1.6
Subtotal 4,079.3 796.8
Total FDI 4,111 844
Country
TunisiaJordanAlgeriaQatarEgypt
MoroccoSyria
Investment promotion agency Privatization & Investment Board (PIB)Address Anter Ben Shaddad Street - Tripoli -libya
P.B Box 93524 Alfatah Tower, Tripoli - Libya
Contact number +218 21 3345010 - 20 Email info@investinlibya lyWebsite http://investinlibya ly
FDI Outflows 2002-2008 FDI Outflows as a % of GDP(US$ mn) 2002-2008
Inward FDI: geographical breakdown, by source (US$ mn) Inward FDI breakdown, by sector
FDI Inflows 2003-2009 FDI Inflows as a % of GDP(US$ mn) 2003-2009
Investment Promotion Agency contact information
Membership of investment related international organizations (agreements) as of December 2009Other relevant information
Libya
Libya is a member of the Multilateral Investment Guarantee Agency (MIGA), the World Association for Investment Promotion Agencies (WAIPA), and an observer in the World Trade Organisation (WTO)
Foreign Direct Investment (FDI) at a Glance
Bilateral Agreements 2009
Bilateral Investment Treaties(BITs)
Double Tax Treaties(DTTs)
Date of signature Date of signature19 February 2005
3 December 19902 November 20008 February 2003
--
--26 January 1984
--
5 May 2009 ---- 19 June 1988
28 April 2004 --
Industrial32.3%
Services56.44%
Tourism6.2%
Health1.9%
Real Estate3.2%
2008
Industrial74.12%
Services6.40%
Tourism19.48%
2009
2003 2004 2005 2006 2007 2008 2009
143 357 1,038 2,013 4,689 4,111 844
0
1,000
2,000
3,000
4,000
5,000
6,000
2003 2004 2005 2006 2007 2008 2009
0.6 1.1 2.4 3.6 6.5 4.6 1.4
0.01.02.03.04.05.06.07.0
2002 2003 2004 2005 2006 2007 2008
-136 63 -286 128 -534 3,933 5,888
-1,0000
1,0002,0003,0004,0005,0006,0007,000
2002 2003 2004 2005 2006 2007 2008
-0.67 0.26 -0.89 0.30 -0.95 5.49 6.55
-2.00
0.00
2.00
4.00
6.00
8.00

Country fact sheet:
Mauritania
Area (Sq Km) 1,030,700
Capital City Nouakchott
Official Language Arabic
Local Currency Ouguiya
2005 2006 2007 2008 2009
Population (millions) 2.8 2.9 3.0 3.0 3.1
Exchange Rate (period average) 265.6 268.6 260.1 241.5 262.0
Inflation Rate 12.13 6.23 7.26 7.35 2.24
GDP at current prices (billion US$) 1,857 2,699 2,822 3,540 3,029
Real GDP growth rate 5.45 11.45 1.02 3.67 -1.07
Exports of Goods and Services (US$ mn) 700 1,400 1,500 1,900 1,500
Imports of Goods and Services (US$ mn) 1,800 1,600 2,100 2,700 2,000
Official Reserves excluding gold (US$ mn) 94 200 200 200 200
External Debt (US$ mn) 2,468 2,540 2,749 2,949 3,123
Country
LebanonMorocco
QatarKuwaitTunisia
Private Investment Promotion Authority Commissariat for the Investment Promotion
Address P.O. Box 238 - Nouakchott, MauritaniaContact number 00 222 525 07 55 / 524 87 17
Email [email protected] www.investinmauritania.gov.mr
FDI Outflows 2003-2008 FDI Outflows as a % of GDP
(US$ mn) 2003-2008
11 March 1986
-
-
Bilateral Agreements 2009
Bilateral Investment Treaties
(BITs)
Double Tax Treaties
(DTTs)
Date of signature Date of signature
Investment Promotion Agency contact information
Other relevant information
Mauritania is a member of the Multilateral Investment Guarantee Agency (MIGA), the World Trade Organisation (WTO), the World Association of Investment Promotion Agencies (WAIPA)
Membership of investment related international organizations (agreements) as of December 2009
15 June 200413 June 2000 -
25 December 2003 25 January 20031 August 2006 -
Mauritania
2003-2009
Foreign Direct Investment (FDI) at a Glance
FDI Inflows 2003-2009 FDI Inflows as a % of GDP
(US$ mn)
2003 2004 2005 2006 2007 2008 2009
102 392 814 155 153 103 84
0
200
400
600
800
1000
2003 2004 2005 2006 2007 2008 2009
7.6 25.8 43.8 5.7 5.4 2.9 2.8
0.0
10.0
20.0
30.0
40.0
50.0
2003 2004 2005 2006 2007 2008
-1 4 2 5 4 4
-2-10123456
2003 2004 2005 2006 2007 2008
-0.07 0.26 0.11 0.19 0.14 0.11
-0.10-0.050.000.050.100.150.200.250.30

Country fact sheet
Morocco
Area (Sq Km) 710,000
Capital City Rabat
Official Language Arabic
Local Currency Moroccan Dirham
2005 2006 2007 2008 2009
Population (millions) 30.3 30.6 31.0 31.4 31.7
Exchange Rate (period average) 8.865 8.796 8.192 7.750 8.057
Inflation Rate 0.98 3.29 2.04 3.89 0.97
GDP at current prices (US$ mn) 59,524 65,640 75,223 88,879 90,815
Real GDP growth rate 2.98 7.76 2.71 5.58 5.20
Exports of Goods and Services (US$ mn) 18,800 21,700 27,300 33,400 26,300
Imports of Goods and Services (US$ mn) 22,800 26,100 34,600 46,300 37,200
Official Reserves excluding gold (US$ mn) 16,100 20,200 24,000 22,000 22,700
External Debt (US$ mn) 14,405 15,688 17,828 18,309 21,160
Arab countries 2008 2009Non-Arab
countries2008 2009
Kuwait 14.90 375.22 France 1,360.66 931.38UAE 608.49 149.73 Spain 337.55 208.83Saudi Arabia 65.87 33.06 Switzerland 214.26 142.94Jordan 5.83 30.33 UK 156.65 128.72Bahrain 60.41 14.83 Belgium - 123.36Qatar 17.01 12.93 Germany 169.24 98.39Lebanon 6.68 8.59 USA 108.10 86.04Egypt 19.92 7.98 Italy 98.99 74.08Tunisia 8.79 5.56 Holland 24.32 31.40Iraq 8.12 2.45 Turkey 17.04 10.04Libya 30.85 0.87 Portugal 5.79 6.60
Luxumbourg - 5.86Norway 0.72 2.99Canada 5.06 2.85Singapore 4.31 2.16Congo - 2.07Austria 2.31 1.80Ireland 2.93 1.73Japan 6.43 0.96Cyprus 0.97 0.93Sweden 11.91 0.91Others 233.87 13.75
Subtotal 846.9 641.6 Subtotal 2,761.1 1,877.8
Total FDI 3,608 2,519
Investment promotion agency L'Agence Marocaine pour le Développement des Investissements (AMDI)
Address 32, rue Honaine angle avenue Michlifen Agdal – Rabat, MarocContact number + 212 537 67 34 20/ 21 Email [email protected] http://www.invest.gov.ma/
--
(US$ mn) 2002-2008
2003-2009(US$ mn)
Bilateral Agreements 2009
FDI Outflows 2002-2008 FDI Outflows as a % of GDP
Inward FDI: geographical breakdown, by source (US$ mn) Inward FDI breakdown, by sector
FDI Inflows as a % of GDPFDI Inflows 2003-2009
Syria
Country
TunisiaSudan
Date of signature
16 June 19989 February 1999
7 April 200028 January 199423 February 199923 October 2001
Algeria
Iraq
Investment Promotion Agency contact information
Other relevant information
Membership of investment related international organizations (agreements) as of December 2009
Oman
Lebanon26 January 198422 March 1989
18 July 19908 May 2001
20 February 199916 February 1999
QatarKuwait
8 February 2006
Morocco
Morocco is a member of the Multilateral Investment Guarantee Agency (MIGA), the World Trade Organisation (WTO), the World Association of Investment Promotion Agencies (WAIPA)
Foreign Direct Investment (FDI) at a Glance
LibyaEgypt
Mauritania
3 July 19972 November 2000
14 May 199713 July 2000
JordanUAE
Bahrain
Yemen
25 January 1990
24 February 2001
Double Tax Treaties
(DTTs)
Date of signature
16 May 20059 February 1999
4 February 200028 August 1974
----
19 June 2005--
17 March 2006--
5 May 2002
--
Bilateral Investment Treaties
(BITs)
2003 2004 2005 2006 2007 2008 2009
2,314 895 1,653 2,450 2,803 3,608 2,519
0
1,000
2,000
3,000
4,000
2003 2004 2005 2006 2007 2008 2009
5.3 1.8 2.8 3.7 3.7 4.1 2.8
0.0
1.0
2.0
3.0
4.0
5.0
6.0
2002 2003 2004 2005 2006 2007 2008
28 12 31 75 445 621 369
0
100
200
300
400
500
600
700
2002 2003 2004 2005 2006 2007 2008
0.08 0.03 0.06 0.13 0.68 0.83 0.42
0.00
0.20
0.40
0.60
0.80
1.00
Real Estate
32.73%
Banking17.74%
Tourisme20.29%
Télécommunications
0.82%
Industry12.89%
Services9.89%
Agriculture0.17%
Others5.46%2008
Real Estate
28.88%
Banking19.51%Tourisme
15.17%
Télécommunications
14.73%
Industry12.72%
Services5.12%
Agriculture0.08%
Others3.79%
2009

Country fact sheet:
Oman
Area (Sq Km) 310,500
Capital City Muscat
Official Language Arabic
Local Currency Omani Riyal
2005 2006 2007 2008 2009
Population (millions) 2.51 2.58 2.74 2.87 2.96
Exchange Rate (period average) 0.385 0.385 0.385 0.385 0.385
Inflation Rate 1.85 3.44 5.89 12.61 3.54
GDP at current prices (billion US$) 30,905 36,805 41,640 59,946 53,395
Real GDP growth rate 4.89 6.00 7.74 12.26 3.35
Exports of Goods and Services (US$ mn) 19,400 22,900 26,300 39,700 28,800
Imports of Goods and Services (US$ mn) 11,082 13,800 19,200 26,800 21,600
Official Reserves excluding gold (US$ mn) 4,358 5,000 9,500 11,400 11,600
External Debt (US$ mn) 3,770 5,705 7,204 9,172 8,703
Country
AlgeriaEgypt
LebanonSudan
MoroccoSyria
JordanTunisiaYemen
Investment promotion agency Omani Center for Investment Promotion & Export Development
Address P.O.Box 25 Wadi Kabir- P.C.117 Contact Number 968 24812344
Email [email protected] www.ociped.com/
8 May 2001
9 April 200719 October 1991
20 September 1998
--16 November 1997
8 May 2002
Other relevant information
Oman is a member of the Multilateral Investment Guarantee Agency (MIGA), the World Trade Organisation (WTO), the World Association of Investment Promotion Agencies (WAIPA)
Investment Promotion Agency contact information:
Membership of investment related international organizations (agreements) as of December 2009
OmanForeign Direct Investment (FDI) at a Glance
(US$ mn) 2003-2008
FDI outflows 2003-2008 FDI outflows as a % of GDP
FDI Inflows 2002-2008 FDI Inflows as a % of GDP
(US$ mn) 2002-2008
Bilateral Agreements 2009
Bilateral Investment Treaties
(BITs)
Double Tax Treaties
(DTTs)
Date of signature
14 September 2005
9 April 200026 April 2000
16 August 20017 June 2003
14 December 200614 September 2005
9 April 200025 March 199811 April 2006
Date of signature
25 October 1999
2002 2003 2004 2005 2006 2007 2008
122 26 111 1,538 1,688 3,125 2,928
0500
1,0001,5002,0002,5003,0003,500
2002 2003 2004 2005 2006 2007 2008
0.6 0.1 0.4 5.0 4.6 7.5 4.9
0.01.02.03.04.05.06.07.08.0
2003 2004 2005 2006 2007 2008
88 42 234 275 243 329
050
100150200250300350
2003 2004 2005 2006 2007 2008
0.41 0.17 0.76 0.75 0.58 0.55
0.000.100.200.300.400.500.600.700.80

Country fact sheet:
Qatar
Area (Sq Km) 11,500
Capital City Doha
Official Language Arabic
Local Currency Qatari Riyal
2005 2006 2007 2008 2009
Population (millions) 0.80 0.84 0.93 1.10 1.22
Exchange Rate (period average) 3.640 3.640 3.640 3.640 3.640
Inflation Rate 8.81 11.83 13.76 15.05 -4.87
GDP at current prices (US$ mn) 42,463 56,918 71,041 100,407 83,910
Real GDP growth rate 9.24 15.03 13.69 15.81 9.04
Goods Exports (US$ mn) 28,700 39,300 51,500 71,200 52,200
Goods Imports (US$ mn) 12,600 21,800 27,200 34,800 33,500
Official Reserves excluding gold (US$ mn) 4,600 5,400 9,800 9,800 18,800
External Debt (US$ mn) 20,425 26,296 41,843 59,039 80,805
Country
SudanAlgeriaJordanSyriaLibya
Mauritania
MoroccoLebanonTunisiaEgypt
Yemen
Investment promotion agency Investment Promotion Department
Address P.O. Box: 22355, Doha, QatarTel + 974 (4945522)
Fax + 974 (4933054)Email [email protected] www.investinqatar com.qa/
Qatar is a member of the Multilateral Investment Guarantee Agency (MIGA), the World Association of Investment Promotion Agencies (WAIPA), the World Trade Organisation (WTO)
Investment Promotion Agency contact information:
Other relevant information
Membership of investment related international organizations (agreements) as of December 2009
Bilateral Investment Treaties
(BITs)
Double Tax Treaties
(DTTs)
Date of signature Date of signature
3 June 1998
7 August 2000
30 June 1998
17 March 200623 November 2005
1 March 19973 December 1990
7 August 2000
20 February 1999--
28 May 199612 February 1999
QatarForeign Direct Investment (FDI) at a Glance
(US$ mn) 2003-2009
FDI Inflows 2003-2009 FDI Inflows as a % of GDP
FDI outflows 2002-2008 FDI outflows as a % of GDP
(US$ mn) 2002-2008
Bilateral Agreements 2009
24 October 1996 1 August 199828 January 2009 12 January 200424 October 2003 23 October 2003
28 April 2004 --25 December 2003 25 January 2003
2003 2004 2005 2006 2007 2008 2009
625 1,199 2,500 3,500 4,700 6,700 8,722
01,0002,0003,0004,0005,0006,0007,0008,0009,000
10,000
2003 2004 2005 2006 2007 2008 2009
2.7 3.8 5.9 6.1 6.6 6.7 10.4
0.0
2.0
4.0
6.0
8.0
10.0
12.0
2002 2003 2004 2005 2006 2007 2008
-21 88 438 352 127 5263 2400
-10000
100020003000400050006000
2002 2003 2004 2005 2006 2007 2008
-0.11 0.37 1.38 0.83 0.22 7.41 2.39
-1.000.001.002.003.004.005.006.007.008.00

Country fact sheet:
Saudi Arabia
Area (Sq Km) 2,149,690Capital City RiyadhOfficial Language ArabicLocal Currency Saudi Riyal
2005 2006 2007 2008 2009
Population (millions) 23.1 23.7 24.3 24.9 25.5
Exchange Rate (period average) 3.750 3.750 3.750 3.750 3.750
Inflation Rate 0.63 2.31 4.11 9.87 5.06
GDP at current prices (US$ mn) 315,758 356,630 385,199 475,728 369,671
Real GDP growth rate 5.55 3.16 2.02 4.33 0.15
Goods Exports (US$ mn) 188,000 225,600 249,600 323,500 194,900
Goods Imports (US$ mn) 88,300 115,300 147,100 179,500 160,400
Official Reserves excluding gold (US$ mn) 73,400 225,200 305,300 441,900 408,600
External Debt (US$ mn) 29,681 42,439 75,884 83,252 86,503
Arab countries 2008 2009Non-Arab
countries2008 2009
Kuwait 4,461 4,299 USA 5,228 5,830UAE 5,873 3,787 Sweden 44 90Bahrain 1,003 1,095 France 3,022 2,558Jordan 582 818 Japan 3,245 2,044Lebanon 279 414 China 1,323 1,665Egypt 164 391 Holland 1,363 1,345Syria 168 312 Germany 922 1,043Palestine 109 197 UK 997 886Yemen 66 177 taly 771 869Qatar 25 64 Russia 1,106 516Oman 11 33 Malaysia 589 471Sudan 11 20 Spain 445 413Iraq 3 6 Turkey 189 280Morocco 2 4 Switzerland 160 261Tunisia 1 4 Pakistan 219 221Algeria - 2 Canada 164 216
Korea, South 162 174Singapore 159 171Australia 147 168India 182 116Taiwan 46 91Others 4,910 4,463
Subtotal 12,758 11,623 Subtotal 25,393 23,891
Total FDI 38,151 35,514
Country
Egypt
Investment promotion agency Saudi Arabia General Investment Authority (SAGIA)
Address Imam Saud Bin Abdulaziz Road (university road), P.O. Box 5927, Riyadh 11432Tel +966 1 203 5555Fax +966 1 263 2894Website www.sagia.gov sa/E-mail Info@sagia gov.sa
Date of signature Date of signature
13 March 1990 --
Other relevant information
Membership of investment related international organizations (agreements) as of December 2008
Investment Promotion Agency contact information
Saudi Arabia is a member of the Multilateral Investment Guarantee Agency (MIGA), the World Trade Organisation (WTO), the World Association of Investment Promotion Agencies (WAIPA)
Double Tax Treaties
(DTTs)
Bilateral Agreements 2009
Bilateral Investment Treaties
(BITs)
Saudi Arabia
2003-2009
Foreign Direct Investment (FDI) at a Glance
Inward FDI geographical breakdown, by source (US$ mn) Inward FDI breakdown, by sector
FDI Outflows 2002-2008 FDI Outflows as a % of GDP
(US$ mn) 2002-2008
FDI Inflows 2003-2009 FDI Inflows as a % of GDP
(US$ mn)
2003 2004 2005 2006 2007 2008 2009
778 1,942 12,097 18,293 24,318 38,151 35,514
0
10,000
20,000
30,000
40,000
50,000
2003 2004 2005 2006 2007 2008 2009
0.36 0.78 3.83 5.13 6.31 8.02 9.61
0.00
5.00
10.00
15.00
2002 2003 2004 2005 2006 2007 2008
2,020 473 78 53 1,257 13,139 1,080
-5,000
0
5,000
10,000
15,000
2002 2003 2004 2005 2006 2007 2008
1.07 0.22 0.03 0.02 0.35 3.41 0.23
0.00
1.00
2.00
3.00
4.00
Industry31.50%
Agriculture
0.09%
Energy12.84%
Services31.26%
Real Estate &
Infrastructure
18.14%
Other6.17%
2008
Industry32.90%
Agriculture
0.12%
Energy11.16%
Services32.80%
Real Estate &
Infrastructure
13.12%
Other9.91%
2009

Country fact sheet:
Sudan
Area (Sq Km) 2,505,000
Capital City Khartoum
Official Language Arabic
Local Currency Sudanese Pound
2005 2006 2007 2008 2009
Population (millions) 35.3 36.2 37.2 38.1 39.1
Exchange Rate (period average) 2.436 2.172 2.016 2.090 2.300
Inflation Rate 8.52 7.20 7.97 14.30 11.26
GDP at current prices (US$ mn) 27,386 36,401 46,531 58,028 54,677
Real GDP growth rate 6.33 11.29 10.16 6.84 4.52
Exports of Goods and Services (US$ mn) 4,824 6,000 9,300 13,000 8,200
Imports of Goods and Services (US$ mn) 7,700 10,000 11,000 12,500 11,400
Official Reserves excluding gold (US$ mn) 1,700 1,700 1,400 2,000 700
External Debt (billion US$) 27,003 28,429 31,874 33,714 35,485
Country
BahrainEgyptJordan
LebanonOman
MoroccoTunisiaQatarSyriaUAE
Yemen
Investment promotion agency Ministry of Investment
Address P.O. Box: 6286 - Khartoum, West HiltonContact number 24911-787193/4/5
Email [email protected] www.sudaninvest.org
FDI Outflows 2005-2008 FDI Outflows as a % of GDP
(US$ mn) 2005-2008
15 March 2001
17 January 2000 23 March 20069 December 1970
--9 March 2004
Bilateral Agreements 2009
Bilateral Investment Treaties
(BITs)
Double Tax Treaties
(DTTs)
Date of signature Date of signature
--
28 May 197730 March 20009 March 2004
25 October 1999 7 June 2003--
8 October 200330 June 199831 May 2001
10 August 1999
23 February 19998 October 2003
3 June 19987 January 2000
18 February 2001
Other relevant information
Sudan is a member of the Multilateral Investment Guarantee Agency (MIGA), the World Association for Investment Promotion Agencies (WAIPA), and an observer in the World Trade Organisation (WTO)
Membership of investment related international organizations (agreements) as of December 2009
Investment Promotion Agency contact information
Foreign Direct Investment (FDI) at a Glance
FDI Inflows 2003-2009 FDI Inflows as a % of GDP
(US$ mn) 2003-2009
Sudan
2003 2004 2005 2006 2007 2008 2009
1,349 1,511 2,305 3,541 2,436 2,601 2,923
0500
1,0001,5002,0002,5003,0003,5004,000
2003 2004 2005 2006 2007 2008 2009
7.1 6.9 8.4 9.7 5.2 4.5 5.3
0.0
2.0
4.0
6.0
8.0
10.0
12.0
2005 2006 2007 2008
7 11 98
0
20
40
60
80
100
120
2005 2006 2007 2008
0.02 0.02 0.17
0.00.00.00.10.10.10.10.10.20.2

Country fact sheet:
SyriaArea (Sq Km) 185,180
Capital City Damascus
Official Language Arabic
Local Currency Syrian Pound
2005 2006 2007 2008 2009
Population (millions) 18.4 18.9 19.4 19.9 20.4
Exchange Rate (period average) 52.17 51.00 49.93 46.53 46.40
Inflation Rate 7.24 10.39 4.68 15.15 2.55
GDP at current prices (US$ mn) 28,577 33,505 40,556 54,476 52,524
Real GDP growth rate 4.50 5.10 4.26 5.16 3.99
Exports of Goods and Services (US$ mn) 11,900 13,100 15,500 19,300 16,700
Imports of Goods and Services (US$ mn) 12,900 14,600 17,700 21,900 19,100
Official Reserves excluding gold (US$ mn) 18,200 16,500 17,000 17,100 17,100
External Debt (US$ mn) 6,692 6,433 5,881 5,720 5,462
Country
Saudi ArabiaJordanUAE
BahrainTunisiaAlgeria
IraqOmanQatarKuwait
LebanonLibyaEgypt
MoroccoYemenSudan
Investment promotion agency Syrian Investment Agency Address Damascus Former Prime Ministry, Headquarter Sabe Bahrat SquareContact number (963) 11 - 4410448
(963) 11 - 4412039
Email syinvest@mail syWebsite www investsyria.org
16 November 2008 --
Bilateral Agreements 2009
Bilateral Investment Treaties
(BITs)
Double Tax Treaties
(DTTs)
Date of signature Date of signature
FDI outflows 2002-2008 FDI outflows as a % of GDP
(US$ mn) 2002-2008
FDI Inflows 2003-2009 FDI Inflows as a % of GDP
(US$ mn) 2003-2009
Syria
Syria is a member of the Multilateral Investment Guarantee Agency (MIGA)
Foreign Direct Investment (FDI) at a Glance
Membership of investment related international organizations (agreements) as of December 2009
Investment Promotion Agency contact information
Other relevant information
08 October 200126 November 199720 September 2000
23 January 200114 September 1997
29 August 200214 September 2005
24 October 200316 August 200112 January 199708 February 1993
28 April 199723 October 200109 October 199607 January 2000
8 October 200126 January 2000
20 September 200022 June 1998
12 September 1997--
14 September 200523 October 20039 December 199712 January 1997
--19 July 19919 June 2005
23 June 200131 May 2001
2003 2004 2005 2006 2007 2008 2009
160 320 583 659 1,242 2,116 1,514
0
500
1,000
1,500
2,000
2,500
2003 2004 2005 2006 2007 2008 2009
0.7 1.3 2.0 2.0 3.1 3.9 2.9
0.00.51.01.52.02.53.03.54.04.5
2002 2003 2004 2005 2006 2007 2008
119 57 48 61 55 55 57
0
20
40
60
80
100
120
140
2002 2003 2004 2005 2006 2007 2008
0.55 0.23 0.17 0.18 0.14 0.10 0.11
0.00
0.10
0.20
0.30
0.40
0.50
0.60

Country fact sheet
Tunisia
Area (Sq Km) 163,610
Capital City Tunis
Official Language Arabic
Local Currency Tunisian Dinar
2005 2006 2007 2008 2009
Population (millions) 10.0 10.1 10.2 10.3 10.4
Exchange Rate (period average) 1.297 1.331 1.281 1.232 1.350
Inflation Rate 2.01 4.50 3.15 5.05 3.73
GDP at current prices (US$ mn) 29,109 31,110 35,610 40,843 40,168
Real GDP growth rate 4.08 5.35 6.35 4.65 2.95
Exports of Goods and Services (US$ mn) 14,500 16,000 20,100 25,200 19,900
Imports of Goods and Services (US$ mn) 14,637 16,700 20,800 26,600 21,100
Official Reserves excluding gold (US$ mn) 4,400 6,800 7,900 9,000 10,600
External Debt (US$ mn) 18,135 18,542 20,155 20,626 21,691
Arab countries 2008 2009 Non-Arab countries 2008 2009
UAE 61.1 65.6 European Union 1905.8 1266.8
Kuwait 10.7 38.0 France 427.0 192.9Bahrain - 25.5 Italy 272.1 430.6Egypt 4.5 11.4 UK 818.6 404.2Libya 103.8 10.2 Germany 16.8 45.9Algeria 1.9 5.1 Spain 76.1 39.3Iraq 3.0 3.2 Sweden 179.3 59.2Saudi Arabia 0.8 2.8 Austria 69.5 48.6Palestine 0.0 0.9 North America 147.5 62.9
Jordan 25.6 0.4 Canada 117.7 67.4Syria 0.0 0.4 Asia 31.6 72.0
Morocco 1.2 0.2 Japan 0.2 12.1Lebanon 0.6 - China 16.5 4.3
Korea, South 3.0 3.9Others 428.3 202.5
Australia 3.8 18.9Turkey 143.1 1.4
Subtotal 213.2 163.7 Subtotal 2,513.2 1,604.2
Total FDI 2726.4 1767.9
Country
MauritaniaLibya
Algeria EgyptJordanKuwait
LebanonSaudi Arabia
OmanIraq
MoroccoQatarSyria
SudanUAE
Yemen
Investment promotion agency Foreign Investment Promotion Agency (FIPA)Address Rue Slaheddine El Ammami, Centre Urbain Nord 1004 TunisContact number (216) 71 752 540
Email [email protected] www.investintunisia.tn
FDI Outflows 2002-2008 FDI Outflows as a % of GDP
(US$ mn) 2002-2008
Foreign Direct Investment (FDI) at a Glance
(US$ mn) 2003-2009
Investment Promotion Agency contact information
Membership of investment related international organizations (agreements) as of December 2009Other relevant information
FDI Inflows 2003-2009 FDI Inflows as a % of GDP
Inward FDI: geographical breakdown, by source (US$ mn) Inward FDI breakdown, by sector
Tunisia
Tunisia is a member of the Multilateral Investment Guarantee Agency (MIGA), the World Trade Organisation (WTO), the World Association of Investment Promotion Agencies (WAIPA)
Bilateral Agreements 2009
Bilateral Investment Treaties
(BITs)
Date of signature
11 March 198619 February 200517 February 20068 December 1989
27 April 199514 September 1973
24 June 1998
19 October 1991-
28 January 199428 May 1996
23 January 20018 October 200310 April 19968 March 1998
Double Tax Treaties
(DTTs)
Date of signature
June 200128 August 1974
22 June 1998March 1997
8 October 200310 April 19968 March 1998
March 1986May 1978
9 February 19858 December 1989
February 1988April 2000
24 June 1998
16 November 1997- 9 October 1988
2003 2004 2005 2006 2007 2008 2009
584 639 782 3,312 1,618 2,726 1,768
0
1,000
2,000
3,000
4,000
2003 2004 2005 2006 2007 2008 2009
Series1 2.2 2.2 2.7 10.6 4.5 6.7 4.4
0.0
2.0
4.0
6.0
8.0
10.0
12.0
2002 2003 2004 2005 2006 2007 2008
7 5 4 13 33 20 42
0
10
20
30
40
50
2002 2003 2004 2005 2006 2007 2008
Series2 0.03 0.02 0.01 0.04 0.11 0.06 0.10
0.00
0.02
0.04
0.06
0.08
0.10
0.12
Indust al16.80%
Agriculture
0.56%
Energy53.74%
Tourism5.52%
Telecom1.04%
Other Services10.19%
Finance12.15%
2008
Indust al27.55%
Agriculture
0.70%Energy58.22%
Tourism3.58%
Telecom6.28%
Other Services0.38%
Finance3.28%
2009

Country fact sheet
UAE
Area (Sq Km) 83,600
Capital City Abu Dhabi
Official Language Arabic
Local Currency Emirati Dirham
2005 2006 2007 2008 2009
Population (millions) 4.11 4.23 4.49 4.77 4.91
Exchange Rate (period average) 3.673 3.673 3.673 3.673 3.673
Inflation Rate 6.20 9.29 11.65 12.30 1.60
GDP at current prices (US$ mn) 134,172 163,718 207,564 254,394 248,969
Real GDP growth rate 8.19 8.72 6.06 7.40 1.30
Goods Exports (US$ mn) 122,000 151,500 187,100 239,213 192,193
Goods Imports (US$ mn) 93,900 112,900 166,100 200,327 170,514
Official Reserves excluding gold (US$ mn) 21,300 28,000 77,900 30,900 29,900
External Debt (US$ mn) 40,654 80,549 130,143 134,700 128,600
Arab countries 2008 2009Non-Arab
countries2008 2009
Kuwait 1,191.5 1,222.2 Others 10,140 4,898
Libya 313.0 321.1
Bahrain 197.6 202.7
Jordan 68.6 70.3
Lebanon 245.0 251.3
Egypt 34.0 34.9
Syria 2.3 2.4
Palestine 18.0 18.5
Saudi Arabia 461.8 473.7
Qatar 598.9 614.3
Oman 84.3 86.5
Sudan 173.1 177.6
Iraq 57.3 58.8
Algeria 114.3 117.3Subtotal 3,559.7 3,651.6 Subtotal 10,140 4,898
Total FDI 13,700 8,550
Country
AlgeriaLebanonKuwaitJordanSudan
MoroccoTunisiaEgyptSyria
Yemen
Investment promotion agencies Department of Economic Development - Foreign Investment Office
Dubai Airport Free Zone Authority (DAFZA)
Ras Al Khaimah Free Trade Zone Authority
Websites http://www.dubaided.gov.ae www.rakiftz.com www.dafza.gov.ae
Other relevant information
Investment Promotion Agency contact information
Membership of investment related international organizations (agreements) as of December 2009
Bilateral Agreements 2009
Bilateral Investment Treaties
(BITs)
Double Tax Treaties
(DTTs)
Date of signature Date of signature
26 November 199713 February 2001
24 April 200117 May 1998
15 March 20019 February 1999
10 April 1996
United Arab Emirates
UAE is a member of the Multilateral Investment Guarantee Agency (MIGA), the World Trade Organisation (WTO), the World Association of Investment Promotion Agencies (WAIPA)
Foreign Direct Investment (FDI) at a Glance
FDI Inflows 2003-2009 FDI Inflows as a % of GDP
Inward FDI: geographical breakdown, by source (US$ mn) Inward FDI breakdown, by sector
(US$ mn) 2003-2009
FDI outflows 2002-2008 FDI outflows as a % of GDP
(US$ mn) 2002-2008
12 April 199426 January 200013 February 2001
24 April 200117 May 1998
18 February 20009 February 1999
10 April 199611 May 1997
12 February 1966 ---- 12 May 2005
2003 2004 2005 2006 2007 2008 2009
4,256 10,004 10,900 12,806 14,187 13,700 8,550
02,0004,0006,0008,000
10,00012,00014,00016,000
2003 2004 2005 2006 2007 2008 2009
4.8 9.4 8.1 7.8 6.8 5.4 3.4
0.0
2.0
4.0
6.0
8.0
10.0
Manufacturing 0.82%
Strategic industry 4.09%
Agriculture
0.26%
Services84.84%
2008
2002 2003 2004 2005 2006 2007 2008
441 991 2,208 3,749 10,892 14,568 15,800
02,0004,0006,0008,000
10,00012,00014,00016,00018,000
2002 2003 2004 2005 2006 2007 2008
0.59 1.12 2.08 2.79 6.65 7.02 6.21
0.001.002.003.004.005.006.007.008.00
Manufacturing
12.70%
Strategic industry 3.43%
Agriculture
0.20%
Services83.67%
2009

Country fact sheet
Yemen
Area (Sq Km) 527,968
Capital City Sana'a
Official Language Arabic
Local Currency Yemeni Riyal
2005 2006 2007 2008 2009
Population (millions) 20.3 20.9 21.5 22.2 22.9
Exchange Rate (period average) 191.0 197.0 199.0 199.8 210.0
Inflation Rate 9.87 10.85 7.91 18.98 3.68
GDP at current prices (US$ mn) 17,920 20,909 23,721 28,673 27,641
Real GDP growth rate 5.90 3.80 4.40 4.70 4.70
Exports of Goods and Services (US$ mn) 6,864 7,864 7,696 9,642 5,666
Imports of Goods and Services (US$ mn) 5,149 5,984 8,469 2,345 1,584
Official Reserves excluding gold (US$ mn) 5,300 6,800 8,690 8,161 7,314
External Debt (US$ mn) 5,160 5,483 6,657 5,886 6,049
Arab countries 2008 2009Non-Arab
countries2008 2009
Qatar 2.80 527.49 Italy - 0.76Iraq 3.90 56.15 Holland - 0.61Libya - 26 90 Turkey 3.80 0.47Saudi Arabia 166.51 21 66 Iran 0.00 0.28Kuwait 22.78 17 91 China 13.93 0.20UAE 10.13 0.80 Malaysia 0.46 0.14Lebanon 81 52 0.69 India 1.50 0.10Jordan 0.72 0.38 Pakistan 0.20 -Egypt 1.06 0.14 USA 0.18 -Syria 0.85 0.10 France 1.56 -Algeria - - Korea, Sout 0.83 -Palestine 0.84 - Sri Lanka 0.25 -Oman 102 -
Subtotal 392.78 652.22 Subtotal 22.7 2.5
Total FDI 415.5 654.8
Country
AlgeriaBahrainEgyptJordanKuwait
LebanonOmanSudan
MoroccoTunisiaQatarSyriaUAEIraq
Investment promotion agency General Investment Authority (GIA) Address ALQUDS ST. ALSAFIAH ALJANOBIAH - SANAA - YEMEN P.O.BOX: 19022 Contact number 00967-1-262961/2/3
Fax 00967-1-262964
Email [email protected] [email protected] http://www.giay.org
FDI Outflows 2002-2008 FDI Outflows as a % of GDP
(US$ mn) 2002-2008
25 December 2001
9 October 199613 February 2001
--
29 January 200228 September 200212 December 199713 December 199730 September 200129 September 2002
9 May 200210 August 19998 February 2006
8 March 199830 August 2000
23 July 200130 August 2000
Bilateral Agreements 2009
Bilateral Investment Treaties
(BITs)
Double Tax Treaties
(DTTs)
20 September 199810 August 1999
24 February 199710 February 20007 September 2000
25 November 19991 December 2002
6 June 199618 June 1995
20 February 200125 November 1999
Date of signature Date of signature
Investment Promotion Agency contact information
Other relevant information
Membership of investment related international organizations (agreements) as of December 2009
Yemen
Yemen is a member of the Multilateral Investment Guarantee Agency (MIGA), the World Association of Investment Promotion Agencies (WAIPA), and an observer in the World Trade Organisation (WTO)
Foreign Direct Investment (FDI) at a Glance
Inward FDI geographical breakdown, by source (US$ mn) Inward FDI breakdown, by sector
FDI Inflows 2003-2009 FDI Inflows as a % of GDP
(US$ mn) 2003-2009
2003 2004 2005 2006 2007 2008 2009
6 144 -302 1121 917 463 655
-500
0
500
1000
1500
2003 2004 2005 2006 2007 2008 2009
0.1 1.0 -1.7 5.4 3.9 1.6 2.4
-4.0
-2.0
0.0
2.0
4.0
6.0
2002 2003 2004 2005 2006 2007 2008
39 61 21 65 56 54 66
0
10
20
30
40
50
60
70
2002 2003 2004 2005 2006 2007 2008
0.37 0.51 0.15 0.36 0.27 0.23 0.23
0.00
0.10
0.20
0.30
0.40
0.50
0.60
Industrial62.93%Agriculture
& Fisheries0.11%
Service36.77%
Tourism0.20%
2008
Industrial5.85%
Agriculture & Fisheries
0.41%
Service89.51%
Tourism4.23%2009