Embed Size (px)
Citation preview
“INVESTIGATION ON CUSTOMER-BASED BRAND EQUITY
IN HYPERMARKET: A CASE STUDY IN IPOH.”
CHENG JAP XEN
MASTER OF BUSINESS ADMINISTRATION
(CORPORATE MANAGEMENT)
UNIVERSITI TUNKU ABDUL RAHMAN
FACULTY OF BUSINESS AND FINANCE
DECEMBER 2015
“Investigation on Customer-Based Brand Equity in Hypermarket : a
case study in Ipoh.”
BY
CHENG JAP XEN
A research project submitted in partial fulfillment of the requirement
for the degree of
MASTER OF BUSINESS ADMINISTRATION
(CORPORATE MANAGEMENT)
UNIVERSITI TUNKU ABDUL RAHMAN
FACULTY OF BUSINESS AND FINANCE
DECEMBER 2015
iii
Copyright @ 2015 ALL RIGHTS RESERVED. No part of this paper may be reproduced, stored in a retrieval
system, or transmitted in any form or by any means, graphic, electronic, mechanical,
photocopying, recording, scanning, or otherwise, without the prior consent of the authors.
iv
DECLARATION
I hereby declare that:
(1) This postgraduate project is the end result of my own work and that due
acknowledgement has been given in the references to ALL sources of information be they printed, electronic, or personal.
(2) No portion of this research project has been submitted in support of any application for
any other degree or qualification of this or any other university, or other institutes of learning.
(3) The word count of this research report is 13,712 words Name of Student: Student ID: Signature:
__________________________ _________________ __________________
Date: _____________________
v
ACKNOWLEDGEMENTS First of all, I would like to express my utmost gratitude to my supervisor; Mr. Raja Kumar A/L
K. Kathiravelu who has guided me thoroughly in completing this research project. His guidance,
support and suggestion have helped me a lot in the course of completing this research project.
Besides, I would also like to thank all the respondents who had taken part in this survey. The
time spent and efforts endured in completing the questionnaires are very much appreciated.
Without their contribution, this research project would not have been possible.
Lastly, I also would like to express my gratitude towards all my seniors at UTAR who had been
very helpful in this study by sharing their knowledge and experience to me.

vi
TABLE OF CONTENTS
Page Copyright Page ...………………………………………………………………………………..iii
Declaration …………………………………………………………………………………………...iv
Acknowledgement …………………………………………………………………………………....v
Table of Contents ……………………………………………………………………………….vi List of Tables …………………………………………………………………………………....ix List of Figures …………………………………………………………………………………...x List of Appendices ………………………………………………………………………………xi
Abstract …………………………………………………………………………………………xii
CHAPTER 1 INTRODUCTION …..…………………………………………………....1
1.0 Introduction ………………………………………………………………1 1.1 Research Background …………………………………………… ............. 1 1.2 Problem Statement ………………………………………………………. 3 1.3 Research Objectives ………………………………………………………4
1.3.1 General Objective………………………………………………….4
1.3.2 Specific Objective………………………………………………….4 1.4 Research Questions…………. ……………………………………………4 1.5 Hypotheses of the study…………………………………………………...5
1.6 Significance of the study………………………………………………….6 1.6.1 Marketers ……………………………………………………........6 1.6.2 Researchers…………. …………………………………................6 1.6.3 Consumers ………………………………………………………..7
1.7 Chapter Layout……………………………………………………………7
1.8 Conclusion………………………………………………………………...8 CHAPTER 2 LITERATURE REVIEW ………………………………………………...9
2.0 Introduction ……………………………………………………………....9
2.1 Review of the Literature…………………………………………………..9 2.1.1 Hypermarket……………………………………………………….9 2.1.2 Customer-Based Brand Equity….…………………………….....10 2.1.3 Brand Awareness………………………………………………...13
vii
2.1.4 Brand Association……………………………………………….14
2.1.5 Perceive Quality…………………………………………………16
2.1.6 Brand Loyalty…………………………………………………....17 2.2 Review of Relevant Theoretical Models..……………………………….19
2.2.1 Aaker’s Brand Equity Model……………………………………20
2.2.2 Keller’s Brand Equity Pyramid………………………………….23
2.3 Proposed Theoretical/Conceptual Framework.………………………….26 2.4 Hypotheses Development………… …………………………………….27 2.5 Conclusion……………………………………….………………………27
CHAPTER 3 RESEARCH METHODOLOGY …………………………………………...28
3.0 Introduction……………………………………………………………...28
3.1 Research Design ………………………………………………………....28 3.2 Data Collection Method …………………………………………………29 3.3 Sampling Design……………..............…………………………………..29
3.3.1 Target Population…………………………………………………29
3.3.2 Sampling Frame and Sampling Location…………………………30
3.3.3 Sampling Elements……………………………………………….30
3.3.4 Sampling Technique……………………………………………...30
3.3.5 Sampling Size…………………………………………………….31 3.4 Research Instrument ………………………………………………….....31 3.5 Construct Measurement (Scale and Operational Definitions………........32 3.6 Data Processing…………………………………………………………..33 3.7 Date Analysis ……………………………………………………………33
3.7.1 Descriptive Analysis ……………………………………………..33 3.7.2 Reliability Analysis ………………………………………...........34 3.7.3 Inferential Analysis ………………………………………...........34
3.8 Conclusion……………………………………………………………….35
CHAPTER 4 DATA ANALYSIS ……………………………………………………..36
4.0 Introduction ……………………………………………………………..36 4.1 Reliability ……………………………………………………………….36 4.2 Descriptive Statistics …………………………………………………….37
4.2.1 Respondents’ Demographic Profile.………………………………...37 4.2.2 Central Tendencies Measurement of Constructs.………………..39
4.3 Inferential Statistics ……………………………………………………..42 4.3.1 Pearson Correlation Scores ………………………………...........42 4.3.2 Multiple Regression Analysis ……………………………...........45
viii
CHAPTER 5 CONCLUSION ………………………………………………………….48
5.0 Introduction……………………………………………………………...48 5.1 Summary of Statistical Analysis……………………………….…….......48 5.2 Discussion on Major Findings…………………………………………...49 5.3 Managerial Implications…………………………………………………51 5.4 Limitations of the Study.………………………………………………...51
5.5 Recommendations for Future Research………………………………….52
5.6 Conclusion……………………………………………………………….53
References ……………………………………………………………………………………….54 Appendices ………………………………………………………………………………………63

ix
LIST OF TABLES
Page
Table 4.1: Frequency distribution based on respondents’ age profiles 36
Table 4.2: Reliability Scores of Each Independent and Dependent Variables 37
Table 4.3: The Frequencies of Respondents’ Demographic Profiles 38
Table 4.4: Central of Tendency for Brand Awareness 39
Table 4.5: Central of Tendency for Brand Association 39
Table 4.6: Central of Tendency for Perceived Quality 40
Table 4.7: Central of Tendency for Brand Loyalty 41
Table 4.8: Central of Tendency for Overall Retailer Equity 42
Table 4.9: Pearson Correlation Scores between the Independent Variables and
Dependent Variable 43
Table 4.10: Pearson Correlation Coefficient 44
Table 4.11: Multiple Linear Regression Results 46 Table 5.1 : Summary of Hypothesis Testing 49
x
LIST OF FIGURES
Page Figure 1: Brand Equity Model (source: Aaker, 1991) 20
Figure 2: Consumer-Based Brand Pyramid (source: Keller, 2003) 23
Figure 3: Conceptual Framework 26

xi
LIST OF APPENDICES
Page Appendix 1 Questionnaire 63
xii
ABSTRACT
The aim of this study is to examine and verify the applicability of customer-based brand equity
model based on Aaker’s well-known brand equity framework from customers’ standpoint in the
Malaysia’s hypermarket industry. Besides, this study is set to distinguish the different
dimensions of Aaker’s customer-based brand equity model and examine its impact and influence
on hypermarket’s overall brand equity in Ipoh, Malaysia. It is conceptualized that hypermarket
equity is determined by four dimensions-brand awareness, brand associations, perceived quality
and brand loyalty. Mall intercept method is applied to choose and contact shoppers with the
structured questionnaire at the four hypermarkets in Ipoh. A total of 427 valid and useable
questionnaires are obtained, wherein responses are recorded on 7 point Likert-type scale, with 1
being strongly disagree and 7 strongly agree. The study revealed that except brand association,
all the other three equity dimensions - brand awareness, perceived quality and brand loyalty
significantly related to overall hypermarket equity. Among these, brand loyalty is found to be
the most influential determinant of overall hypermarket equity Thus, based on the results, it was
confirmed that Aaker’s brand equity model is also applicable to the large retailing industry like
hypermarkets. Hence, retailers should consider relative importance of these dimensions while
evaluating their overall equity. This study is of great interest for large retailers who wish to
increase their brands’ value proposition to the marketplace.
1
CHAPTER 1: RESEARCH OVERVIEW
1.0 Introduction
This chapter provides an overview of the research project titled “Investigation On Customer-
Based Brand Equity in Hypermarket: A Case Study in Ipoh.” This chapter will begin with the
research background followed by problem statement, research objectives, research questions,
significance of the study and finally the conclusion.
1.1 Research Background
Over the last decades, Malaysia has registered a robust growth in the retail industry particularly
the hypermarkets which has ultimately changed the market structure and nation’s shopping
landscape. Hypermarket retailers such as Giant, Tesco, Mydin, Econsave and others have indeed
become household names in the mind of Malaysian consumers mainly due to the convenience of
having everything under one roof. These transformation have resulted in a significant drop in
customers spending and patronage at traditional marts since they are more attracted to modern
day retailing concepts – ‘Hypermarkets’ (Morganosky, 1997). Generally, the concept of
hypermarket refers to a large retail store that combines a supermarket and a departmental store
which offers wide range of products such as groceries, appliances, general merchandise, clothing
and others that leads to a one stop shopping experience (Perrigot & Cliquet, 2006). According to
Burt (2000), diversity in brands, product labels, price and quality offered by these retail outlets
makes a big difference in purchase behavior.
Besides providing employment opportunities, Malaysia’s retailing industry is also a major
contributor towards nation’s gross domestic product (GDP) (Kaliappan, Alavi, Abdullah &
Zakaullah, 2009). In 1993, Malaysia’s first hypermarket ‘Makro’ was introduced and paved way
for new era in retailing industry. Hassan, Sade and Rahman (2013) have indicated that the
widespread expansion of hypermarkets are relatively immune to maturity phase and expected to
expand continuously throughout Malaysia. These expansions have led to dramatic rise in the
competition among rival hypermarkets and high level of brand consolidation in the industry. In
2
the face of intense competition and price wars between these retail stores, grocers need to
explore further to increase their customer-based brand equity to stimulate customer loyalty
(Allaway, Huddleston, Whipple & Ellinger, 2011). Ensuring continuous customer satisfaction
and customer loyalty would be an absolute necessity for retail firms as loyal customers will
generate repeat purchases that ultimately increase the retail outlet’s revenue and profitability (Li
& Green, 2011). By understanding the importance of this notion, retailers have been taking great
efforts by engaging in various brand management exercises in order to increase their customer-
based brand equity and to insulate themselves from competitors.
Moreover, retailers also have resorted to undertake various sustainable competitive tactics by
focusing on customer needs and wants (Bhukya, 2015). For this, retailers must form great
understanding about brand equity from the perspective of consumers (Taskin & Akat, 2010).
According to Kim, Kim, Kim, Kim & Kang (2008), customer-based brand equity serves as the
most important parameter in determining customer’s purchase decision. Kumaravel and
Kandasamy (2012) have noted that brand equity is an important instrument for associating a
brand and influencing customer’s purchase decisions for a particular hypermarket store. Positive
hypermarket brand equity does not merely increases the revenue and profitability of the firm but
it also provides opportunity for retailers to charge premium prices on certain goods and embark
on brand extension strategy knowingly brand switching are less likely among loyal customers
(Keller, 1993). Moreover, respective hypermarkets would be able to gain competitive advantage
over rival stores and help in their decision making approach should they understand and
incorporate the concept of customer-based brand equity.
Hence, it has become a primary importance for marketers to focus on branding of their store.
Although there were numerous researches have been devoted over the years to brand equity
namely the drivers, models, measurement and definition in particular (Burt, 2000; Pappu,
Quester and Cooksey, 2005; Aaker 1991; Keller 1993, 1998), not much focus has been paid to
the equity of the retailer as a brand. Thus, the objective of this study is to distinguish the
dimensions of well-known customer based brand equity model developed by Aaker (1991) and
examine its impact and influence on hypermarket brand equity in Ipoh, Malaysia.
3
1.2 Problem Statement
The subject matter of customer-based brand equity has been a topic of interests for researchers
over the years. According to the Marketing Science Institute (2015), brand equity and brand
related issues were one of the most widely studied subject matter among researchers and remain
as a top priority area for future studies. Generally, brand equity’s definition mainly concerns
product brands (Keller 1993; Aaker 1991; Park and Srinivasan 1994) or service brands (Berry
2000) in the business circle. The concept was not developed for retailers initially and remains
distinct in accordance to their specific characteristics. Many existing literatures have generally
examined the relationship between brand equity and customer’s purchase intention on various
industries and product categories (Porral, Fernandez, Boga & Mangin, 2015; Lin, Huang & Lin,
2015; Aaker, 1996; Khan, Rahmani, Hoe & Chen, 2014). As for the retail industry, there are
relatively very limited number of studies conducted to examine the concept of retailer as a brand
or retailer equity as a whole (Jara & Cliquet, 2009; Grewal & Levy, 2012; Chen & Green, 2010).
It has become an interesting subject to explore further especially with the consumers’ higher
level of exposure and awareness (Pappu, Quester & Cooksey, 2007; Lassar, Mittal & Sharma,
1995). In Malaysia, this concept remains unaddressed and needs to be focused upon since there
is a dire need to study how does hypermarket’s brand equity drives customers to be loyal to a
particular outlet. Most of the available studies on brand equity in retail industry are concerning
hypermarket’s private labels or store brands. According to Pappu and Quester (2006), the issues
on retailer equity has not been extensively studied in the literature due to fewer attempts to
measure them. Therefore, this study will address the vacuum left on this subject matter by past
literatures in order to differentiate the related components (Brand Awareness, Brand Association,
Perceived Quality and Brand Loyalty) by adopting Aaker’s brand equity model and examine its
impact on hypermarkets in Ipoh, Malaysia from the consumer’s perspective in order to have a
deeper understanding on key dimensions enhancing retail brand equity. Besides that, this
research will also attempt to fill the gaps left behind by past conceptualizations of brand equity
by addressing the void and weaknesses of previous literatures. The findings and outcome of this
research are believed to yield significant contribution to both academicians and business
practitioners.
4
1.3 Research Objectives
The research objectives in this study can be categorized into general objective and specific
objective.
1.3.1 General Objective
The general objective of this research is to distinguish the different dimensions of customer-
based brand equity model developed by Aaker (1991) and examine its impact and influence on
hypermarket’s overall brand equity in Ipoh, Malaysia.
1.3.2 Specific Objective
The specific objectives of this study as per listed below:
To determine the significant impact of Brand Awareness towards hypermarket’s overall
brand equity.
To determine the significant impact of Brand Association towards hypermarket’s overall
brand equity.
To determine the significant impact of Perceived Quality towards hypermarket’s overall
brand equity.
To determine the significant impact of Brand Loyalty towards hypermarket’s overall
brand equity.
1.4 Research Questions
This study addresses the following research questions:
Does Brand Awareness have significant impact towards hypermarket’s overall brand
equity?
5
Does Brand Association have significant impact towards hypermarket’s overall brand
equity?
Does Perceived Quality have significant impact towards hypermarket’s overall brand
equity?
Does Brand Loyalty have significant impact towards hypermarket’s overall brand equity?
1.5 Hypotheses of the Study
The hypotheses of this project are developed from the specific objectives mentioned under sub-
topic 1.3.2. The developments of these hypotheses are supported by previous literatures on
hypermarket’s overall brand equity by using Aaker’s customer-based brand equity model
(Bhukya, 2015; Pappu & Quester, 2006; Jara & Cliquet, 2009; Chen & Green, 2010; Kumaravel
& Kandasamy, 2012).
H1 = There is a significant positive impact of brand awareness on the overall
hypermarket’s equity
H2 = There is a significant positive impact of brand association on the overall
hypermarket’s equity
H3 = There is a significant positive impact of perceived quality on the overall
hypermarket’s equity
H4 = There is a significant positive impact of brand loyalty on the overall
hypermarket’s equity.
6
1.6 Significance of the Study
The completion of this research is expected to significantly contribute to several parties such as;
1.6.1 Marketers
Undoubtedly, the marketers in the retail industry particularly the hypermarkets will enjoy the
most benefit, because this research is a behavioral study which designed to investigate the impact
of consumer-based brand equity dimensions on consumer’s store patronize. The outcome of this
research will help marketers to acquire sound knowledge and better understanding in order to
improve their marketing and distribution channel activities. By having such vital information,
firms would be able to control the activities of their retail outlet in a more precise and effective
manner. Besides that, the results will also guide managers to decide on the advertising budget
allocation and spending. The study also serves to identify and diagnose the weaknesses of
current marketing strategies adopted by the firms that require further improvement. In addition to
that, marketers may also use this study as a point of reference in allocating resources and
capacities in a more constructive manner.
1.6.2 Researchers
This study intends to serve as a guiding principle or reference point for any aspiring researchers
in their future studies. In Malaysia though, there aren’t many studies done in the hypermarket
industry particularly concerning the concept of customer-based brand equity of the retailer.
Hopefully, this research will provide a theoretical contribution in the literature that would further
enrich the knowledge and understanding of marketers and consumers’ on retail outlet’s brand
equity. Since academicians over the years have hinted over the potential of this concept, there is
a great urgency to initiate more studies. Therefore, this study will generate supportive data about
the subject matter, shorten the literature gap and pave way for establishing more similar studies
in the near future.
7
1.6.3 Consumers
The research may help them to evaluate the brand equity of the hypermarkets and provide
comprehensive information in the future. By evaluating hypermarket brand equity from different
dimensions (Brand Awareness, Brand Association, Perceived Quality and Brand Loyalty), it will
certainly provide better understanding in how there retail outlets are being perceived by
customers at large which will eventually influence their decision making on store patronage or
their purchase intention. New elements which perhaps were unknown or paid less attention
previously could emerge from this study and provide a whole new perspective from customer
point of view. When credible studies leading to vital information are vastly available, customers
would be able to mitigate their risk factors and would help them to make better informed
decisions in the future.
1.7 Chapter Layout
Chapter 1 provides a brief introduction of the research topic, which includes a general
background on different dimensions of customer-based brand equity model, developed by Aaker
(1991) and examine its impact and influence on hypermarket’s overall brand equity in Ipoh,
Malaysia. Problem statement, research objectives, research questions, hypotheses and
significance of study are included in this chapter as well. In chapter 2, this chapter provides a
literature review that is related to the research topic and framework. The variables of the research
will be discussed in this chapter. Besides, this chapter is also considered as a basis for the testing
of the hypotheses formed.
For chapter 3, it focuses on the methodology of the research. This chapter shows the way of
conducting the research by including the details of the research setting. This chapter contains the
research sample, data collection method, measurement scales and methods of analyzing data.
Chapter four contains the results obtained from the survey. In this chapter, all the data that are
obtained from the survey will be analyzed by using Statistical Package for Social Science (SPSS)
software. The results are presented in a table form. The final chapter which is chapter 5 consists
of the discussion of the research results. Recommendations and implications for future research
8
will be included in this chapter. Next, limitations of the research also will be discussed. In
addition, a brief summary of the whole thesis is also included.
1.8 Conclusion
This chapter presents an overview of this research and provides preliminary understanding of the
subject matter being tested upon. Research background and problem statement are first
discussed, followed by the research objective, research questions and significance of study.
Therefore, the content of this chapter will serve as basis and foundation for further exploration in
the following chapters.

9
CHAPTER 2: LITERATURE REVIEW
2.0 Introduction
The aim of this chapter is to review the literatures which relate to the area of customer-based
brand equity, brand awareness, brand association, perceived quality and brand loyalty. The
theory of customer-based brand equity by (Aaker, 1991) will be used as the basis to test the
hypotheses formed. Other relevant theories and models are also introduced in order to provide
better insights and deeper understanding about the research topic. Besides that, conceptual
framework for this study will also be constructed and finally the development of the hypotheses.
2.1 Review of the Literature
This chapter will engage in reviewing the past literature critically and related theories to the topic
of this study. This literature review will help to understand the subject more clearly.
2.1.1 Hypermarket
In general, the definition of ‘hypermarket’ is still very much ambiguous and unclear till date.
Public at large including researchers and academicians are still perplexed over this term and
often refer hypermarket to supermarkets or shopping malls. Thus, this has prompted questions on
how to distinguish between them. Hypermarket can be perceived as a modern day retailing
concept that combines a supermarket and a departmental store which offers wide range of
assortment and products levels with a floor space of between 2,500 square meters to over 8,000
square meters in size (Hassan, Sade & Rahman, 2013).
According to Perrigot and Cliquet (2006), the most essential principle of hypermarket is
basically works under the concept of having “Everything under the same roof’ in which consists
features such as having a large floor space, large parking lot with wide assortment of product
categories. Most of the products sold at hypermarkets are from a fast moving consumable
10
product category such as groceries. Besides that, it also offers other products range such as home
appliances, general merchandise, clothing and others that leads to a one stop shopping
experience (Perrigot & Cliquet, 2006). Fascinating features such as modern display format, large
floor space, wide array and large quantity of products have enrich customer experience and have
significantly added value to hypermarkets (Business Monitor International, 2007). The layout
design of the hypermarket also consists of many sub-retailers who rent the space within the
premise. In 1993, Malaysia’s first hypermarket ‘Makro’ was introduced and paved way for new
era in retailing industry. Besides providing employment opportunities to many, it was also noted
that one of the major contributing sectors in Malaysia’s foreign direct investment inflow (FDI) is
from the wholesale and retail in which hypermarkets make up a major portion
(PricewaterhouseCoopers, 2015).
2.1.2 Customer-Based Brand Equity
Generally, academicians have taken two distinct perspectives and principal to study brand equity
concept – customer based approach and financial approach. The financial perspective of brand
equity concerns on the asset value of the evaluated brand (Simon & Sullivan, 1990; Farquhar,
Han & Ijiri, 1991). The customer based perspective however is basically the evaluation of
customer’s responses towards a particular brand (Keller, 1993; Aaker, 1991; Shocker, Srivastave
& Reukert, 1994). According to Aaker (1991), customer-based brand equity can be defined as
the value customers associate themselves with a brand using a set of dimensions such as brand
association, perceived quality, brand awareness, and brand loyalty. Aaker also describe brand
equity as a set of assets or liabilities and symbol that add to or subtract from the value provided
by products or services.
As per Aaker’s claim that these four dimensions as the most important dimensions to measure
brand equity from a customer’s perspective, some empirical evidence also supports this notion
and describe these four distinct dimensions as a brand equity measurement tool. Washburn and
Plank (2002) have stated that elements such as customer’s familiarity, knowledge and
associations towards a specific brand define the essentials of customer-based brand equity
theory. On the same note, Keller (1993) also mentioned that the subject of customer-based brand
11
equity is rather a differential effect of brand knowledge and the response of consumer towards
marketing. It is also can be defined as the prefix of attribute levels measurement in an objective
way so that it helps to distinguish between multi attributed preferences and the overall brand
performance subjected to the aspects of quality, choice and intention (Park & Srinivasan, 1994;
Agarwal & Rao, 1996). The proponent contend for a particular brand of product/services to be
deemed as valuable or brings value, it has to be valued by customers and no the marketers.
However, none of the other definitions would be meaningful if the brand has no meaning or add
value to the customers (Cobb-Walgren & Donthu, 1995).
Strong brands have greater tendency in increasing the trust level among consumers for intangible
products by helping customers to visualize better and form greater understanding in making
informed decisions. This can significantly reduce customers’ perceived risks particularly
monetary, safety and social risks in making a purchase decision in which evaluation process with
the availability of vast brand choices could be a great challenge. In this regard, it was found that
high level of brand equity could ultimately increases the degree of customers’ satisfaction, repeat
purchase intention and brand loyalty towards product/services (Berry, 2000; Kim et al, 2008).
According to Eldem and Swait (1998), brand equity was described as an “added value” in
relation to a certain brand (name, design, symbol or mark) in which the given brand is capable to
endow a product (something that offers functional benefit) and allows the brand to charge
premium price. In the retail sector, multi-channeling or m-tailing concept as a results of rapid
expansion offer new considerations on the applicability and the adaptability of overall retail
brand equity management (Grewal & Levy, 2009).
In the context of this research, the pertinent question that arises would be how customer-based
brand equity theory applicable to retail brands itself particularly the hypermarket brand.
Contrasting to the classical brand equity approach in which a particular brand endows a product
or service, the retailer or the hypermarkets endows their outlet and its offerings of
products/services as brand equity in a very specific set up of atmosphere that eventually leads to
a wholesome shopping experience to customers (Verhoef, Lemon, Parasuraman, Roggeveen,
Tsiros & Schlesinger, 2009; Grewal & Levy, 2009). Similarly, Ailawadi and Keller (2004) also
found that retailers like hypermarket also enjoy brand equity just like any other product/services
12
because they capitalize on the value of their retail outlet’s name and stand as a genuine brand
themselves. In doing so, hypermarket must leverage on its in-store atmosphere, price positioning,
merchandising and selection of specific brands and products which part of brand equity sub
dimensions. In a meta-analysis study by Pan and Zinkhan (2006), customers’ store choices are
identified to be strongly driven by determinants such as store image, store atmosphere, location,
convenient parking facilities, product quality and product assortment, which are connected to
brand equity dimensions. Some would argue that these are merely drivers of brand equity and not
the dimensions; however drivers are factors that leading to the brand equity dimensions and
hence part of overall brand equity theory conceptualization. Interestingly, location factor is found
to be no longer a significant factor in choosing a store as customers are willing incur additional
costs and sacrifice other resources such as time and energy in an effort to patronize their favorite
retail outlet even if it is located farther away than competitor store (Ailawadi, 2001). Retail
store’s success is largely depending on its effort and sincerity by utilizing its resources and
capabilities to fulfill customers’ needs and expectations. The ultimate aim here is to generate
satisfaction and enhance customer loyalty and not to increase customer’s costs (Corstjens & Lal,
2000).
Basically, the more resources and capacities a hypermarket possesses to attract customers to their
store, the higher the retailer’s customer-based brand equity. These criteria are generally well
received, valued and appreciated differently by patron of the outlet (Baltas, Argouslidis &
Skarmeas, 2010). In addition, customers could be loyal to a particular hypermarket and to take
additional effort at the expense of time and money in order to patronize for its long opening
hours providing convenience to at their ease of time, or for its low price strategy, or for the
assortment quality. According to Keller (2010), one weakness that often associated with the
conceptualization of brand equity theory is inefficiency to demonstrate retailers brand equity on
the basis of low price strategy. He further argued that many leading retailers in the world are
operating squarely on low price positioning strategy.
However, it does not indicate that they do not have equity since they charge low prices. One
mechanism to conceptualize their equity would be in terms of resources premium at the expense
of consumers in order to shop with them. Although resources could reflect financial aspect but
13
there are also other pertinent factors such as brand preferences compromised, distance traveled or
services foregone. This weakness could be addressed with a strategy to imply store image cues.
Consequently, low price retailers could also fit into the brand equity paradigm allowing higher
retailer equity. It also important to note that, customers do not only patron retail store to buy
groceries and other products but they also visit the outlet to satisfy their hedonic and social needs
such as entertainment value, self-expression and as an exploration avenue to spend quality time
(Holbrook & Hirschman, 1982; Babin, Darden & Griffin, 1994; Chandon, Wansink & Laurent,
2000).
2.1.3 Brand Awareness
Throughout all the researches done on brand equity concept, brand awareness is undoubtedly one
of the key dimensions specified in most of the studies on brand equity (Krishnan, 1996; Aaker,
1991; Mackay, 2001; Keller, 1992; Na, Marshal & Keller, 1999l; Agarwal & Rao, 1996). Brand
awareness could be described as the customers’ ability to identify, recognize and recall a
particular brand under various circumstances by associating the brand, image, symbol, logo and
other elements into memory (Keller, 2003). In contrast, Aaker (1991) has stated that criteria such
as brand knowledge, brand dominance, top of mind and brand opinion are the essence of forming
brand awareness in consumers’ mind. The level of noticeability and awareness a brand can
achieve in the marketplace will influence its brand equity.
Therefore, if a brand can attain higher level of awareness, the likelihood of the products related
to that brand being purchased is high as well (Nedungadi, 1990). Brand awareness is very
important in influencing customer’s buying decisions as they are generally driven by heuristic
elements like “choose the brand they know” or buy the brand they have heard of” which
subsequently leads to purchasing well established brands (Keller, 1993). There are two sub-
dimensions of brand awareness single out by Keller (1993) which comprises of ‘brand
recognition’ and ‘brand recall’. Keller also stated that brand recognition is a very important
factor in forming brand communication strategies by firm to help communicate the product
attributes to targeted customers which will eventually allow them to be associated with the
products until the brand name gets recognized in the eyes of consumers. Furthermore, it can also
14
help customers in their buying decisions as they could identify a brand name from other rival
brands (Percy & Rossiter, 1992). As the brand gets hold building greater awareness and
recognition from consumers, it will become a launch pad to boost its market share and enhance
its brand image further among existing and potential consumers (Grewal, Krishnan, Baker &
Borin, 1998).
Thus, the above could also be applicable to retailer in which a retailer brand with a higher level
of brand awareness among consumers will most certainly enjoy greater brand equity. Moreover,
brand awareness also can be perceived as a sign of commitment in an effort to familiarize
customers with a specific brand and helping them in point of consideration (Aaker, 1991). The
studies on brand awareness dimension are mainly concerning its impact on product / services
brand choices as revealed in a study by Hoyer and Brown (1990) in which they found consumers
with high level of brand awareness have significantly high tendency to buy high quality brands
as their first choice compared with consumers with no brand awareness. Moreover, brand
awareness also can be considered to be functioning as a cue to brand revival in terms of brand
choices (Holden, 1993). From the perspective consumer-based brand equity, unaided recall and
familiarity were used as a measurement tool by Agarwal and Rao (1996) in which they found
that the recall measure is somehow not convergent with other brand equity measurement
however familiarity aspect does proved to be in line and consistent.
In addition, other emerging issues such as brand awareness sources in relation to brand
awareness dimension and its overall underlying structure have considerable effect on consumers’
purchase intention and purchase behavior however there seems to be little attention paid to this
in the literatures (Laurent, Kapferer & Roussel, 1995; Bird & Ehrenberg, 1966). This dimension
was included in the studies conducted by Yoo and Donthu (2001) but the findings resulted in no
significant direct effect on brand equity concept.
2.1.4 Brand Association
Aaker (1991) has defined brand association as anything linked in consumers’ thought process
and memory in relation to a brand which believed to bring value and meaning to them. The brand
15
association dimension of brand equity model viewed from all forms of attributes in reflection of
a product or any independent aspects of the product itself (Chen, 2001). Keller (1993) has stated
that three major aspects could be derived from the dimension of brand associations specifically
under brand image which are the benefits, attributes and attitudes Generally, brand image is
formed by a set of associations that are usually developed and organized in a very peculiar way
that help provide meaning and value to both firm and customers. Besides helping to create a
positive feeling, brand association also plays an important role in helping customers to process or
retrieve information, identify brand differentiation and provide reasons to make purchase.
Krishnan (1996) has stated that any link or association exists between ‘informational’ and
‘brand’ will most likely contribute in developing brand association in consumers mind.
Another type of brand association that exists mainly revolves around brand attitudes as
mentioned by Keller (1993) in which overall evaluation of a specific brand by consumers can
help nurture brand attitude (Wilkie, 1986). In making brand choices, a brand attitude of
consumers’ plays a very important role in their purchase decision making. In a study by Laroche,
Kim and Zhou (1996), it was found that attitude towards a focal brand does have positive
relationship with purchase intentions. Besides that, it also forms a basis for firms in deciding to
adopt brand extension policy as part of its marketing strategy (Aaker, 1996). Moreover, the
concept of customer-based brand equity usually works with customers holding some unique,
strong and favorable brand associations in their mind as a result of having greater awareness.
According to Kotler and Keller (2006), elements such as brand related thoughts, attitudes,
perceptions, beliefs, experiences, images, feelings and anything others that could be linked in
memory of consumers can be defined as having brand associations.
In another study on customer-based brand equity model by Netemeyer, Krishnan, Pullig, Wang,
Yagci and Dean (2004), the primary brand equity dimension detected is brand uniqueness and
wheras the related brand equity dimensions are such as popularity, brand awareness,
organizational associations, familiarity and brand image. On the other hand, when it involves a
corporate brand or when brands tend to have similar features and attributes, the more appropriate
core brand association dimension would be “organizational associations” as the particular
organizations’ business philosophy lies within its brand association (Aaker, 1996). Brand
16
associations is also related to the symbolic and functional beliefs derived from brand image
which based on the argument that customers also make product purchase that signifies the image
it carries, wealth, power, sophistication in order to gain identification and connection with other
users or social groups that uses similar brand (Evans, Foxall, & Jamal, 2006). As for the retailers,
retailers distinct marketing activities could also form specific associations in the mind of
consumers which will can be considered to be related positively with store patronage and
purchase intentions (Keller, 1998). Thus, if the associations linked to a particular retailer are
positive in nature from consumers’ perspective, the probability of the customer buying from that
store will be significantly increased as well. Moreover, a study by Grewal et al (1998) have
further reaffirm this argument that there is indeed positive relationship between a retailer’s image
and customer’s purchase intentions.
2.1.5 Perceived Quality
From the perspective of this study, another component from brand equity model to be tested is
perceived quality. According to Aaker (1991), perceived quality can be classified as an important
dimension under the brand equity model. It could also be categorized as an element of yet
another brand equity dimension – brand associations in which components such as brand
attitude, brand image and perceived quality can form as multi-dimensions proposition (Low &
Lamb Jr, 2000). According to Aaker (1991), customer’s overall perception and evaluation on a
specific product’s level of quality in connection with its intended objective relative to availability
of alternatives can best described the term perceived quality. Similarly Zeithaml (1988) and
Keller (2001) also subscribed to the same definition as per Aaker’s with an important note that
perceived quality is the first element that will form perception on consumers’ mind.
Therefore, the dimension of perceived quality could have some conceptualization differences in
terms of manufacturing quality, product based quality or the objective quality (Aaker, 1991). He
further stated that perceived quality can generates value particularly in the context of price
premium, reason to buy, differentiation position, brand extension and channel member interest.
Besides that, Dick, Jain and Richardson (1995) have indicated that the dimension of perceived
quality does have positive effect on the confidence level of making buying decisions. It also
17
capable of significantly adds value to the overall brand equity in customers’ purchase processes
(Low et al, 2000). Moreover, Li, Monroe and Chan (1994) also have concluded that perceived
quality to be positively correlated with purchase intention through perceived value of a particular
brand name. Brand quality is therefore an essential aspect in the buying process of consumers
since their satisfaction level is very much depending on purchasing a product that perceived to be
of high quality (Grewal et al (1998). Further to that, they have concluded that if a particular
brand of product is perceived to be high in quality, it will most likely increase the likelihood of
customer’s willingness to purchase and found support.
From the perspective of this study, product quality and service quality would be a crucial
measurement to assess the perceived quality dimension associated with the retailers particularly
the hypermarkets. A study by Jinfeng and Zhilong (2009) has found that high perceived quality
on retailer will influence the purchase decisions of consumers and their store selection.
Consumers would opt for high perceived quality store rather than other rival stores. Perceived
quality has been increasingly gaining attention and recognition from marketer across the globe in
various product groups. Firms have long recognized the importance of perceived quality and
incorporated it into its marketing related decisions (Pappu et al, 2006). In addition to that, Kotler
(1991) has indicated that there is an intimate connection exists between variables such as
customer satisfaction level, service quality of the firm and the profitability of the company.
Based on the above descriptions, the relationship of customers’ perceived quality and
hypermarkets’ overall brand equity will be tested upon in this study.
2.1.6 Brand Loyalty
Over the years, brand loyalty has been studied extensively by researchers and marketers which
have enriched the marketing literature (Chaudhuri & Holbrook, 2001). Generally, customers
have high tendency to be attracted to new brands in the markets and would like to try them out
however, there is no indication that they will continue to stick with that brand in the future. In
order to make customers stick with that particular brand as their preferred choice, brand loyalty
has to play its role. Oliver (1999) has defined the term brand loyalty as a continuous commitment
to repurchase or revisit a particular product or service in a very consistent manner, thereby
18
leading to repetitive purchase of the same preferred brand despite various marketing efforts by
competing firms and other situational factors that could potentially cause a change in attitude and
switch brand. Similarly, when a focal brand adjusts its pricing or makes any changes to its
product features, there is a likelihood that customers may resort to brand switching (Aaker,
1991). According to Wernerfelt (1991), customers will only consider themselves to be loyal to
certain brands if they could associate positively with that brand. Brand loyalty could classify into
two different dimensions – behavioral loyalty and attitudinal loyalty.
Behavioral loyalty is also known as purchase loyalty and described as having a constant repeat
purchase pattern on a particular brand of product/service (Chaudhuri et al, 2001). On the other
hand, the term attitudinal brand loyalty described as customers having a dispositional
commitment to a particular brand that offers specific values and uniqueness which prompted
them to be associated with that brand (Chaudhuri et al, 2001). Nevertheless, Aaker (1991) has
defined brand loyalty consists of many classification groups such as ‘likes the brand, committed
buyer, habitual buyer, satisfied buyer with switching costs, switchers, and”. Maintaining high
level of brand loyalty among consumers are crucial for firms as it can potentially increase its
market share and sustain its revenue inflow with customers’ repeat purchase behavior.
Besides that, it can also leads to positive word of mouth from existing customers (Dick & Basu,
1994). Aaker (1991) has further pointed that brand loyalty is basically act as a firm’s strategic
asset in which it is capable to create value and becomes an advantage to the firm. The mentioned
advantage and values of brand loyalty are able to lower the costs of marketing, able to attract
new customers, able to trade leverage and act as a response to competitive threats. Thus, brand
loyalty is undoubtedly a crucial aspect of brand equity which can increase customers’ purchase
intention. In a study by Tellis (1988), it was found that the strongest determinant of customers’
buying behavior is indeed brand loyalty. Moreover, Broyles, Schumann and Leingpibul (2009)
also concluded that there is a substantial positive influence and direct effect of behavioral loyalty
to customers’ willingness to make a purchase. Adding to that, it was also found that one
additional brand loyal purchase leads to increase in percentage hike in the purchase probability
which signifies a positive correlation with brand loyalty dimension and customer’s purchase
intention (Pan et al, 2006).

19
In the context of retail sector, brand loyalty can be described as customers’ loyalty towards a
specific retail outlet or hypermarket as a result of its’ superior product quality or service quality
(Pappu et al, 2006) and customers’ intention to make purchase as primary choice from that
particular store (Yoo et al, 2001). Therefore, it can be summarized that the above literatures
suggested that higher retailer equity should be able to generate higher level of customers’
purchase intention. Besides that, it can also be noted that, customers may remain loyal to a
particular retail store if they have positive prior experience with that outlet regardless of their
inclination of brand loyalty (Karayalcin, 2010). Based on the above descriptions, the relationship
of retailer’s brand loyalty dimension and hypermarkets’ overall brand equity will be tested upon
in this study.
2.2 Review of Relevant Theoretical Models
There are several brand equity models that have been studied by researchers and academicians
over the years. One of the most frequently cited brand equity models is the one developed by
Aaker (1991), which has been empirically tested countless times in the past literatures (Yoo,
Donthu & Lee, 2000; Kim & Kim, 2004; Atilgan, Aksoy & Akinci, 2005). This model also can
be utilized in the retail context by getting the grisps of the brand equity concept and attain
valuable information particularly the relationships of its various dimensions towards the brand
performance. Besides that, the model also provides clues on the indicators of a firm’s branding
policies.
Therefore using Aaker’s brand equity model, this study aims to retest the specified dimensions
and measurement criteria of customer-based brand equity in the hope to determine its impact on
overall hypermarket equity and store selection in Ipoh, Perak. For the purpose of this study, four
components; “Brand Awareness, Brand Association, Perceived Quality and Brand Loyalty”
listed in Aaker (1991) brand equity model will be tested. The study will exclude “other
proprietary assets” component of the brand equity model since it is irrelevant to the context of
this study. Figure 1 shows the brand equity model constructed by Aaker (1991).

20
2.2.1 Aaker’s Brand Equity Model
Figure 1: Brand Equity Model (source: Aaker, 1991)
Brand Awareness: The dimension of brand awareness is a crucial measurement criterion in the
study of brand equity. It can be described as the extent to which a brand has reached out to the
consumers and public at large. The ability to recognize or recall a particular brand name by
consumers is the focal point of this dimension. Enhancing brand awareness of a particular
product / service is largely depending on how strong the brand name is and associations that
could be formed in the mind of consumers. Customers’ familiarity and preference towards a
brand can lead to building positive attitude towards it.
Besides that, Aaker (1991) also noted that consumers tend to talk more about a brand and spread
positive word of mouth if they really like it. Aaker also described high brand awareness signifies
customers’ commitment towards the brand and provides assurance to businesses. It is also fairly
important to note that marketers strive to enact their brand name to be part of consumer’s evoked
21
set of brands in order to create more awareness. Therefore, this study will relate this dimension
in the context of retail sector and use it as measurement to investigate its impact on overall
retailer equity.
Brand Association: According to Aaker’s brand equity model, there are few indicators available
from the marketing perspective to assess a particular brand of product/service in relation to its
associations triggered. One of the indicators of brand association component is to understand the
extent to which a particular brand can gain consumers’ associations towards it resulting from
advertisement exposure. With the heightening competition among rival firms, the ability to
create ‘brand differentiation’ in the consumers’ mind has become a priority for marketers in
which brand associations play a crucial role in developing it.
Aaker also indicated that higher brand association will lead to higher overall brand equity by
having high influence on customers’ purchasing behavior and buying process. Besides that, it
also indicates the role play by brand awareness in developing positive attitude towards a brand.
Brand extension is yet another indicator specified by Aaker in the brand association dimension in
which there will be greater opportunities to enhance brand associations if brand extension is
vastly available in the market. Therefore, this study will relate this dimension in the context of
retail sector and use it as measurement to investigate its impact on overall retailer equity.
Perceived Quality: The dimension of perceived quality is also an important measurement
criterion in determining equity level of a brand. Aaker (1991) has described the dimension of
perceived quality underlines the extent to which a brand name is perceived by consumers in
carrying quality products/services under its banner. One of the criteria to measure perceived
quality is a brand must provide enough reason to consumers to purchase it. Secondly, the brand
must contain differentiation elements or attributes that stand out from rival brands which will
help develop positive feeling towards the brand.
Besides that, Aaker also has stated that price can be considered as a quality indicator especially
when buying involves a complex assessment process and customer’s status is at stake. The
element of ‘availability’ also has great level of influence in brand perception in the eyes of
22
consumers in which widely available products through various sales channels are deemed to
have high in quality. Finally, Aaker also explained the importance of line extension as high
number of brand extension provides an indication that the brand name contains some quality
guarantee which allows the brand to grow on a wide spectrum. Thus, this has given enough
reason to adopt this component in this study to investigate its impact on overall retailer equity.
Brand Loyalty: Aaker’s (1991) brand equity model also reaffirms the importance of having
brand loyalty, in which it can be considered as the ultimate goal of businesses. Brand loyalty
revolves around the extent to which consumers are able to remain loyal to a particular brand
name. There are a number of factors to look upon in relation to brand loyalty. Firstly, it is always
less costly to maintain loyal customers than investing heavily on marketing activities to lure new
customers. Moreover, loyal customers tend to provide trade leverage for firms as they ensure
firms in generating stable stream of revenue. The model also provide insights on how loyal
customers plays a very important role in attracting new client base by enhancing brand
awareness through positive ‘word of mouth’ with family and friends.
This serves as an added value for firms by allocating its resources better and avoids unnecessary
spending on advertisement. Besides that, brand loyalty also helps firm in reducing threat factors
from other competitors in the market. Marketers are fully aware that loyal customers will not
switch brands quickly and this advantage provides additional response time for firms to take
counter measures in order to address threats posed by competitors in the market. Thus, this study
aims to incorporate this dimension and reevaluate its applicability in the retail industry to
determine its significance level on overall equity of a retailer.
23
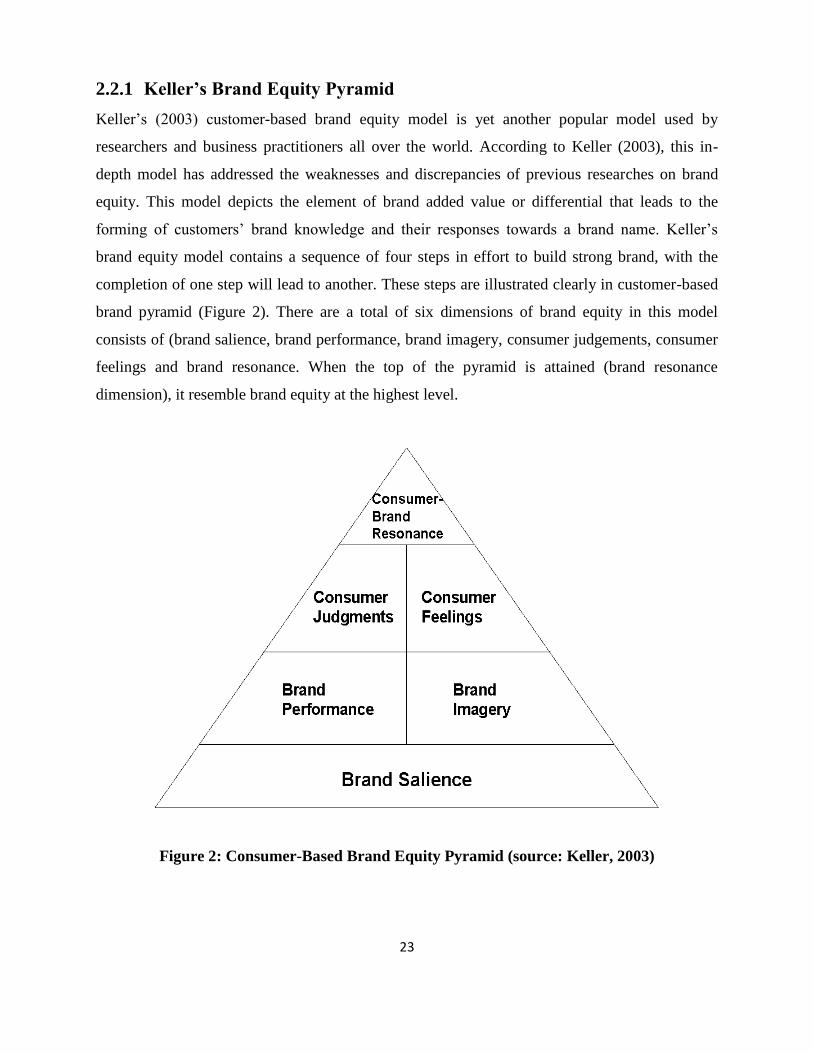
2.2.1 Keller’s Brand Equity Pyramid
Keller’s (2003) customer-based brand equity model is yet another popular model used by
researchers and business practitioners all over the world. According to Keller (2003), this in-
depth model has addressed the weaknesses and discrepancies of previous researches on brand
equity. This model depicts the element of brand added value or differential that leads to the
forming of customers’ brand knowledge and their responses towards a brand name. Keller’s
brand equity model contains a sequence of four steps in effort to build strong brand, with the
completion of one step will lead to another. These steps are illustrated clearly in customer-based
brand pyramid (Figure 2). There are a total of six dimensions of brand equity in this model
consists of (brand salience, brand performance, brand imagery, consumer judgements, consumer
feelings and brand resonance. When the top of the pyramid is attained (brand resonance
dimension), it resemble brand equity at the highest level.
Figure 2: Consumer-Based Brand Equity Pyramid (source: Keller, 2003)
24
Brand Salience: Development of brand saliency in consumers’ mind is the first effort of
developing high value in brands in Keller’s consumer-based brand pyramid. It refers to the
aspects of brand awareness in which top-of mind awareness, strength of brand and brand
retrievability as the main focus area. Generally a brand with high saliency is the outcome of great
amount of brand awareness. Firms have to establish a clear link or association between a brand
and a particular product category in the mind of the consumer. However, having brand awareness
alone may not be sufficient enough to entice customers to make purchase. Instead, it becomes a
launch pad in creating the meaning and value of the particular brand in the mind of the
customers. Therefore, this dimension act as a precondition set for moving up further on the
Keller’s brand equity pyramid.
Brand performance and Brand Imagery: Upon attaining the first level (brand salience), the
process moves to next step in which it will emphasize on meeting or exceeding customers’ needs
such as their functional need, social needs and psychological needs. Enhancement of overall
brand equity is largely depending on the roles played by both brand performance and brand
image aspects. Brand performance can be raised by delivering product or service that fulfills
their needs, followed by firm’s attempts to exceed the expectation level of consumers. On the
other hand, brand imagery dimension can be boosted by personalized to consumers’ psycho-
social needs through direct method of brand experience or indirect method like advertising. In
terms of brand imagery, customers are mainly concern about the value and meaning a brand
brings and not so much on the product functionality. The outcome of these dimensions could be
the initial indicators for firms in pursuant of brand loyalty.
Consumer Judgements and Consumer Feelings: According to Keller (2003), the third step of
this brand pyramid is to elicit customers’ responses to the efforts from step two in the form of
judgement and feelings towards a particular brand name. Consumer judgement can be defined as
the cognitive evaluation of the many aspects of the brand such as the credibility, quality and the
overall superiority of a specific brand name by forming a certain opinion or attitude towards it.
Consumer feelings are basically the emotional reactions of a particular brand. What emotional
reaction does the brand evoke in the consumers’ mind and their social surroundings? These
positive / negative feelings can be very strong in influencing consumer’s purchase decision and
25
even their post purchase behavior during observational stage of actual product usage. Therefore,
consumer judgements and consumer feelings tend to have significant influence on consumers’
relationship and level of identification towards a brand name of a product / service. Besides, the
same components may also have some implications on other consumers.
Brand Resonance: The final step of Keller’s brand equity model takes place when all the
requirements and conditions of step three are met, and with the understanding that the consumer
has obtained a positive image of the brand name using rational and emotional consideration.
Basically, this final step provides clues on whether a consumer is willing to engage into a
relationship with the brand. If the answer is yes, then the firm has achieved true brand loyalty
from consumers. By reaching to this level, firms are rest assured that there will be continuous
repeat purchase from loyal customers. Besides that, it may also help a firm to reduce threat and
susceptibility from competitors. Firms also may opt for price premium strategy having known
the fact that loyal customers would not switch brands easily. Therefore, brand resonance reflects
the ultimate bonding between a brand and a customer.
26
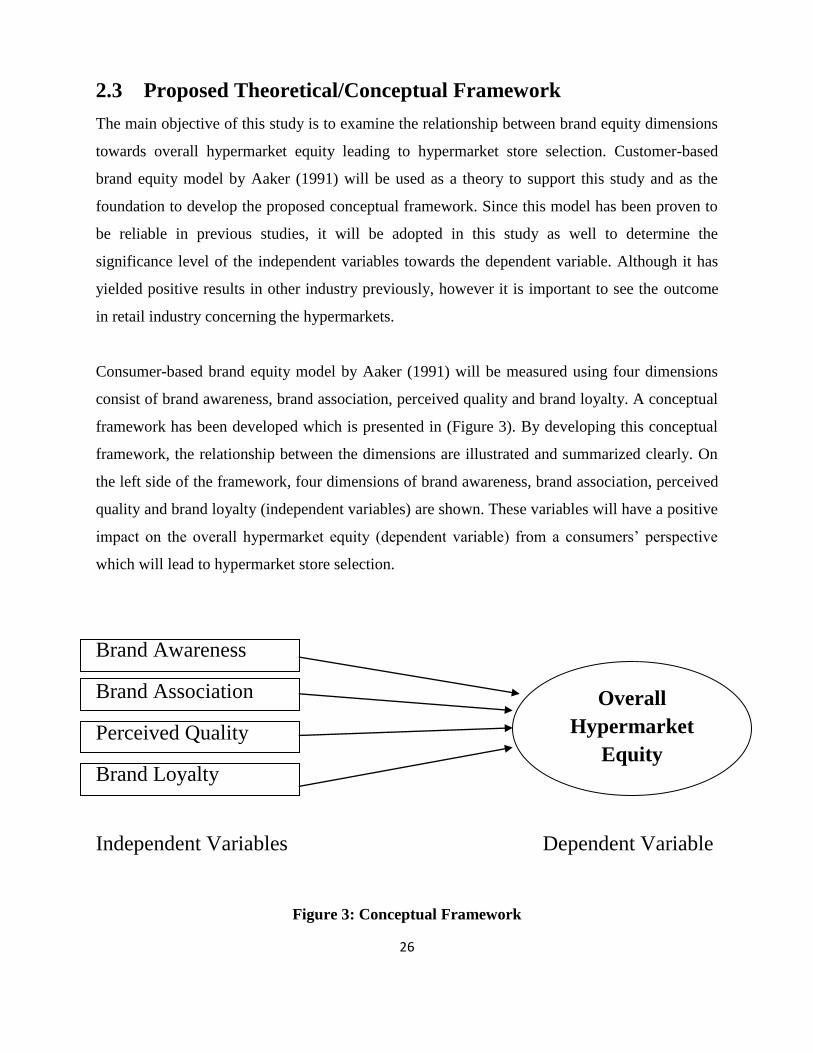
2.3 Proposed Theoretical/Conceptual Framework
The main objective of this study is to examine the relationship between brand equity dimensions
towards overall hypermarket equity leading to hypermarket store selection. Customer-based
brand equity model by Aaker (1991) will be used as a theory to support this study and as the
foundation to develop the proposed conceptual framework. Since this model has been proven to
be reliable in previous studies, it will be adopted in this study as well to determine the
significance level of the independent variables towards the dependent variable. Although it has
yielded positive results in other industry previously, however it is important to see the outcome
in retail industry concerning the hypermarkets.
Consumer-based brand equity model by Aaker (1991) will be measured using four dimensions
consist of brand awareness, brand association, perceived quality and brand loyalty. A conceptual
framework has been developed which is presented in (Figure 3). By developing this conceptual
framework, the relationship between the dimensions are illustrated and summarized clearly. On
the left side of the framework, four dimensions of brand awareness, brand association, perceived
quality and brand loyalty (independent variables) are shown. These variables will have a positive
impact on the overall hypermarket equity (dependent variable) from a consumers’ perspective
which will lead to hypermarket store selection.
Brand Awareness
Brand Association
Perceived Quality
Brand Loyalty
Independent Variables Dependent Variable
Figure 3: Conceptual Framework
Overall
Hypermarket
Equity
27
2.4 Hypotheses Development
According to the conceptual framework, the following four hypotheses for this research are
constructed as follows:
H1 = There is a significant positive impact of brand awareness on the overall
hypermarket’s equity.
H2 = There is a significant positive impact of brand association on the overall
hypermarket’s equity.
H3 = There is a significant positive impact of perceived quality on the overall
hypermarket’s equity
H4 = There is a significant positive impact of brand loyalty on the overall
hypermarket’s equity
2.5 Conclusion
This chapter has included the literature reviews of both the independent variables and dependent
variable. In addition to that, this chapter also discussed about the theoretical models developed
by the researchers and summary of past empirical studies conducted. Finally as a guideline to
this research, a conceptual framework and hypotheses were developed.
28
CHAPTER 3: RESEARCH METHODOLOGY
3.0 Introduction
The objective of this chapter is to explain the process flow in conducting this research, from
research design, to data collection methods, sampling design, research instrument, constructs
measurement, data processing, and data analysis. By defining the research methods in a clear and
systematic manner, the research would be more organized and the mistakes could be minimized,
which may prove to be critical to the entire study.
3.1 Research Design
Basically, the nature of this research is a causal research and the purpose of this research is to
identify, determine, and indicate the cause-and-effect relationships between independent
variables and dependent variables. To be precise, this research is being conducted to investigate
the relationship of Aaker’s (1991) brand equity dimensions (brand awareness, brand association,
perceived quality and brand loyalty) towards overall hypermarket’s equity that leads to
hypermarket store selection. Therefore, this study determines to find out the strength of these
relationships and how great the influence is to a consumer. This research will be carried out
using survey method by distributing questionnaires to the targeted respondents. Besides that, the
study is also based on reviewing previous researches and theoretical models. As results, four
hypotheses are developed.
Therefore deductive approach is appropriate to apply in this circumstance. Furthermore, the
study collects empirical data (primary data) by conducting questionnaire in order to test the
existing theory. From this perspective, deductive approach is supported and fulfills the
requirement. Quantitative research is chosen as the approach for this study due to the fact that
quantification in the data collection and data analysis is involved. Moreover, instead of gaining
in-depth insights of the subject matter, the main focus of this study is to test the hypotheses
derived from the theoretical model. The relationship between brand equity dimensions and
29
overall hypermarket equity will be determined in this study. Based on these justifications,
quantitative approach is more suitable.
3.2 Data Collection Method
In this study, primary data was obtained in order to construct the research model and to design
the questionnaires. The questionnaire was designed to measure the intensity and the impact level
of brand equity variables; ‘brand awareness’, ‘brand association’, ‘perceived quality’ and ‘brand
loyalty’ against the ‘overall hypermarket equity’. Since this study is pertaining to the
hypermarkets, four hypermarkets located around Ipoh were chosen to collect the data. The
hypermarkets involved are Tesco (Station 18), Giant (Bercham), Mydin (Meru) and Econsave
(Jalan Kampar). The respondents will be requested to fill up the questionnaire (self-
administered) and to return it back immediately to the researcher. The nature of this study falls
under cross-sectional type in which the data are collected only once for the purpose of data
analysis. A total of 427 set of questionnaires were distributed and collected. The survey was
conducted from 7th
November 2015 until 15th
November 2015.
3.3 Sampling Design
Sampling is the process of selecting enough number of elements in a defined population and so
that results from analyzing the sample are generalizable to the population. There are 5 steps
involved in the sampling design which include determining the target population, setting
sampling frame and location, deciding the sampling elements, selecting sampling technique and
determining the sampling size of respondents.
3.3.1 Target Population
Due to the budget limitations and time constraint, the target population for this research is the
residents in Ipoh, Malaysia. According to the Department of Statistics Malaysia (2010), the
population in Ipoh were 657,892 residents in year 2010, with 249,853 were Malay, 290,165 were
30
Chinese, 92,587 were Indian, and 25,287 were belongs to others ethnic groups. Therefore, this
study will use this data as the population size.
3.3.2 Sampling Frame and Sampling Location
The list comprising of all the residents in Ipoh is could not be obtained at the Department of
Statistic Malaysia, Ipoh. Hence, non-probability techniques will be applied for this study. The
sampling locations are the hypermarkets that are situated in Ipoh, i.e. Tesco (Station 18), Giant
(Bercham), Mydin (Meru) and Econsave (Jalan Kampar).
3.3.3 Sampling Elements
For the purpose of this study, the selected respondents are patrons of hypermarket store in Ipoh.
The focus will be largely on the patrons who are above 18 years old. The reason behind this is
that those who are above 18 years old generally have higher maturity level that impacts the
accuracy level of the study (Ahmad & Judhi, 2010). Furthermore, these groups of people have
more spending power, able to evaluate things better and higher capability in making informed
decisions on their own.
3.3.4 Sampling Technique
In general, probability sampling would always be an ideal choice because the population has
equal chance to be chosen as respondents. However in this study, probability sampling cannot be
carried out because the (1) sampling frame of the population size is unknown, and (2) the
distribution of the population of the study does not follow a specific pattern. As a result, non-
probability was employed. Nevertheless, the targeted population was carefully selected to reduce
the occurrence of sampling error. In this research, judgment sampling technique was used in
selecting appropriate sample.
31
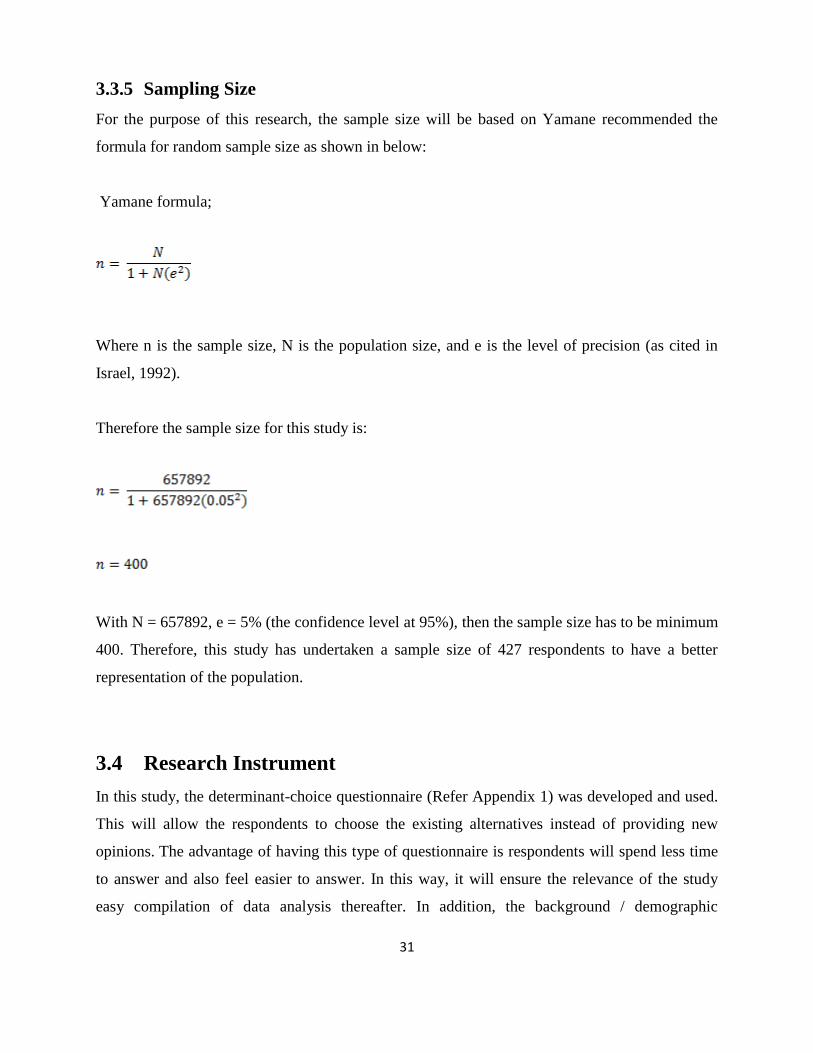
3.3.5 Sampling Size
For the purpose of this research, the sample size will be based on Yamane recommended the
formula for random sample size as shown in below:
Yamane formula;
Where n is the sample size, N is the population size, and e is the level of precision (as cited in
Israel, 1992).
Therefore the sample size for this study is:
With N = 657892, e = 5% (the confidence level at 95%), then the sample size has to be minimum
400. Therefore, this study has undertaken a sample size of 427 respondents to have a better
representation of the population.
3.4 Research Instrument
In this study, the determinant-choice questionnaire (Refer Appendix 1) was developed and used.
This will allow the respondents to choose the existing alternatives instead of providing new
opinions. The advantage of having this type of questionnaire is respondents will spend less time
to answer and also feel easier to answer. In this way, it will ensure the relevance of the study
easy compilation of data analysis thereafter. In addition, the background / demographic

32
information will be gathered after the constructs measurement in order to avoid embarrassment
or feel of threat to respondents. The constructs measurement are started from independent
variables (brand awareness, brand association, perceived quality and brand loyalty) and followed
by dependant variable (overall hypermarket equity).
3.5 Construct Measurement (Scale and Operational Definitions)
The questionnaire is divided into two sections, i.e. Section A and Section B. Section A measures
consumer-based brand equity dimensions (independent variables) and overall hypermarket
equity (dependent variable). Consumer-based brand equity dimensions are measured by adopting
Aaker’s (1991) scale, i.e. brand awareness, brand association, perceived quality and brand
loyalty. The sources adopted for the above mentioned scales are explained below.
Brand Awareness is measured by adopting questions from Aaker (1991) and Yoo et al (2000). It
consists of questions like ‘When I see this store, some characteristics of this store come to mind
quickly’ and ‘I can recognize this store quickly among other competitor stores’.
Brand Association is measured by adopting questions from Aaker (1991); Keller (1993) and
Pappu et al (2005). Some of the questions used in this scale are ‘Comparing to competitor store,
this store has a very unique image’, ‘I respect and admire people who buy at this store’ and ‘I
like the brand image of this store’.
Perceived Quality is measured by adopting questions from Aaker (1991) and Pappu et al (2005).
The questions in this dimension consists of ‘I trust the quality of products available at this store’,
‘This store offer products with excellent features’ and ‘Buying products from this store would be
of very good quality’.
Brand Loyalty is measured by adopting questions from Yoo et al (2000) and Pappu et al (2005).
Some of the questions in this dimension are ‘If the required product is not available at this store,
I would not go and buy it from competitor store’, ‘I consider myself to be loyal to this store’ and
‘This store would be my first choice’.
33
Overall Retailer Equity is measured by adopting questions from Yoo et al (2000). The questions
consists of ‘Even if another competitor store has the same features as this store, I would still
prefer to buy at this store’ and ‘Even if another competitor store has the same price as this store, I
would still buy at this store’.
3.6 Data Processing
The collected questionnaires will be checked and screened thoroughly before run the data
analysis. The researcher shall edit, manipulate or delete the data if the respondents are found to
have provided inconsistency rating. For example, the respondent rates strongly agree for first
attribute, but rates strongly disagree for second attribute which under the same variable (both are
same directional questions). Data coding involved assigning a code for each response of the
questions respectively. Codes formulated are simple and easy. For instance, gender of
respondents can be assigned as “1” for male and “2” for female. Coding enables easier
interpretation of data as compare to lengthy alphabetical descriptions. Coded data will be
transcribed onto the Statistical Package for the Social Science (SPSS) software’s database
system.
3.7 Data Analysis
Data collected through questionnaires will be examined by using Statistical Package for Social
Science (SPSS) software. SPSS software helps the researcher to convert the raw data into useful
information. In this research, SPSS software will be used to analyse descriptive analysis, scale
measurement, and inferential analysis.
3.7.1 Descriptive Analysis
Descriptive analysis was used to determine the respondents’ demographic profiles such as
gender, age, race, occupation, and education level were analyzed by using the frequency
34
distribution. For example, the collected data showed 33% and 29% of the respondents is aged
within 28 to 37 and aged within 38 to 47. The data also showed that the lowest aged groups of
customers visiting the hypermarkets are below 18 years old which makes up to 9 %. The study
has found that most of the patrons to hypermarkets are female consumers representing 67.8% of
the total respondents. Male respondents only make up to 37.2% of the study.
3.7.2 Reliability Analysis
The reliability test is a process to indicate the correlation among items, scale, or attributes as well
as to test the consistency of respondents in answering of each set variables (brand awareness,
brand association, perceived quality, brand loyalty and overall hypermarket equity). The
reliability is measured by Cronbach’s Alpha coefficient. According to Hair, Black, Babin, and
Anderson (2010), a reliability score of exceeding 0.6 can be consider as achieving good internal
consistency. However, Nunnally (1978) suggested that the acceptable value of Cronbach‟s
Alpha should be greater than 0.7. In this study, the reliability scales of each variables have
scored higher than 0.7 thus indicating that the items or attributes used to measure each
independent and dependent variables have complied with the requirement by Nunnally (1978).
3.7.3 Inferential Analysis
Throughout the entire research, inferential analysis is the most important analysis to be carried
out in order to answer the research questions and hypotheses made. In order to test the causal
impact caused by the independent variables (IV) on the dependent variable (DV), it is useful to
determine whether the relationships between the IVs and DV do exist priory. This can be done
by using Pearson Correlation test. After confirming the relationships, a subsequent test –
Multiple Linear Regression – was carried out to check the level of strength that had caused by
each IV on the change of DV. Furthermore, multiple regression analysis will also be used to
justify the hypotheses, either accepted or rejected; it also can be used to identify the dominant
factors in the independent variables by examining the strength of Beta coefficient.
35
3.8 Conclusion
Chapter 3 discussed about the methodologies adopted to conduct a business research. The
research design, data collection method, sampling design, research instrument, constructs
measurement, data processing and methods of data analysis that applied in this study were
outlined clearly in this chapter. The next chapter will be discussing about the data analysis in
which all the data were obtained through methodologies specified in this chapter.

36
CHAPTER 4: DATA ANALYSIS
4.0 Introduction
A total of 427 questionnaires had been distributed, completed, and collected for data analyzing.
The collected data showed 33% and 29% of the respondents is aged within 28 to 37 and aged
within 38 to 47. This finding reflects the largest customer segment group that patronized
hypermarkets to fulfill their shopping needs. The data also showed that the lowest aged groups of
customers visiting the hypermarkets are below 18 years old which makes up to 9 %. (Refer Table
4.1).
Table 4.1: Frequency distribution based on respondents’ age profiles
Respondents‟ range of age Number of respondents Percentage
< 18 37 9 %
18 – 27 64 15 %
28 – 37 142 33 %
38 – 47 126 29 %
> 47 58 14 %
427 100 %
4.1 Reliability
The reliability scales of each variable have scored higher than 0.7 (Refer Table 4.2). The results
indicate that the items or attributes used to measure each independent and dependent variables
have complied with the requirement by Nunnally (1978). In another word, the reliability test of
this research is fairly consistent with past studies; the respondents are able to understand the
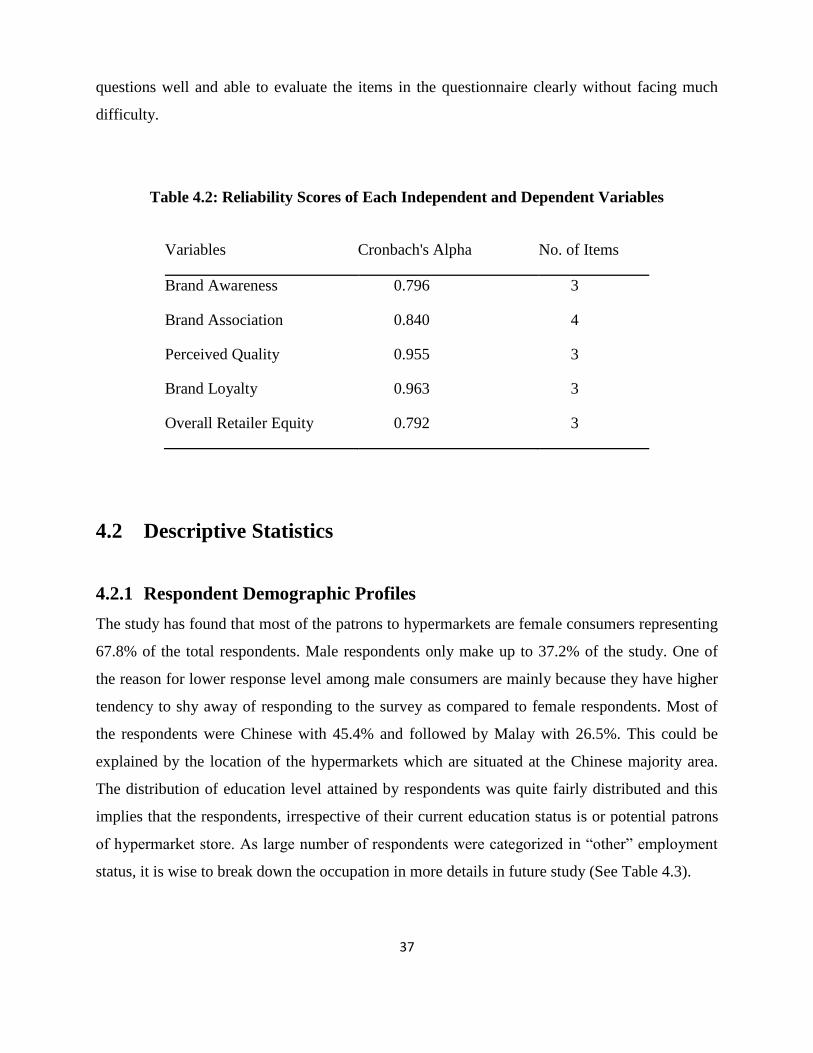
37
questions well and able to evaluate the items in the questionnaire clearly without facing much
difficulty.
Table 4.2: Reliability Scores of Each Independent and Dependent Variables
Variables Cronbach's Alpha No. of Items
Brand Awareness 0.796 3
Brand Association 0.840 4
Perceived Quality 0.955 3
Brand Loyalty 0.963 3
Overall Retailer Equity 0.792 3
4.2 Descriptive Statistics
4.2.1 Respondent Demographic Profiles
The study has found that most of the patrons to hypermarkets are female consumers representing
67.8% of the total respondents. Male respondents only make up to 37.2% of the study. One of
the reason for lower response level among male consumers are mainly because they have higher
tendency to shy away of responding to the survey as compared to female respondents. Most of
the respondents were Chinese with 45.4% and followed by Malay with 26.5%. This could be
explained by the location of the hypermarkets which are situated at the Chinese majority area.
The distribution of education level attained by respondents was quite fairly distributed and this
implies that the respondents, irrespective of their current education status is or potential patrons
of hypermarket store. As large number of respondents were categorized in “other” employment
status, it is wise to break down the occupation in more details in future study (See Table 4.3).
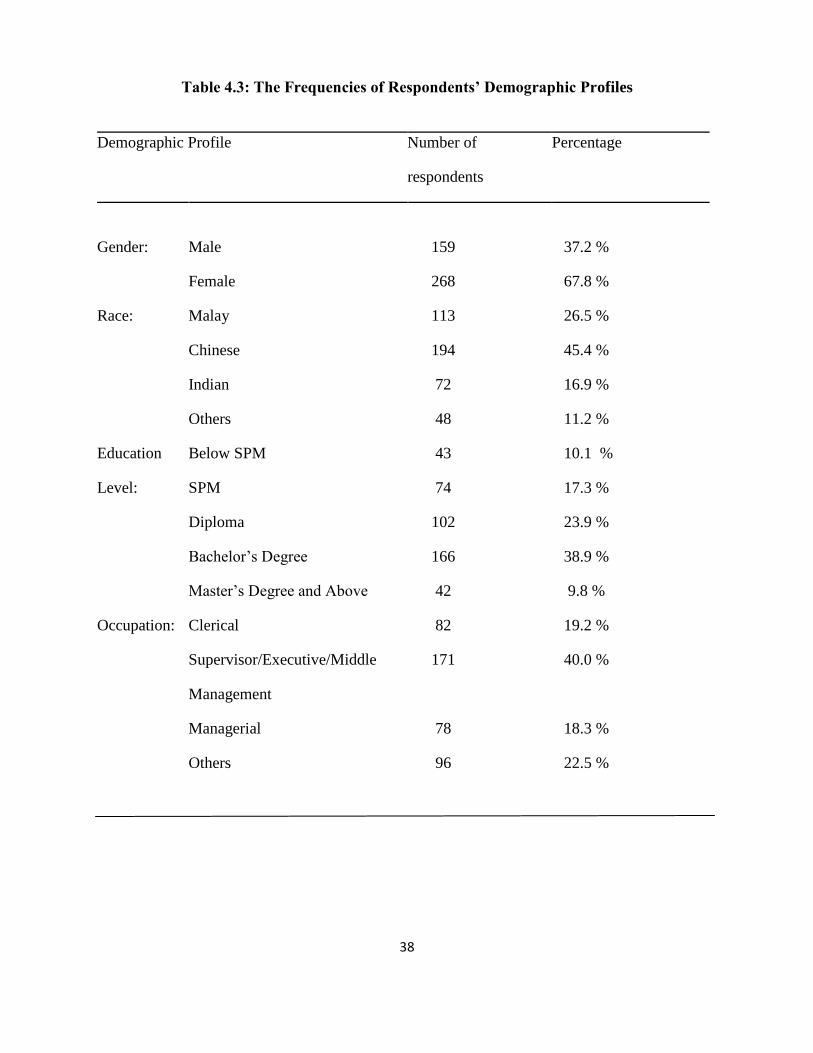
38
Table 4.3: The Frequencies of Respondents’ Demographic Profiles
Demographic Profile Number of Percentage
respondents
Gender: Male 159 37.2 %
Female 268 67.8 %
Race: Malay 113 26.5 %
Chinese 194 45.4 %
Indian 72 16.9 %
Others 48 11.2 %
Education Below SPM 43 10.1 %
Level: SPM 74 17.3 %
Diploma 102 23.9 %
Bachelor’s Degree 166 38.9 %
Master’s Degree and Above 42 9.8 %
Occupation: Clerical 82 19.2 %
Supervisor/Executive/Middle 171 40.0 %
Management
Managerial 78 18.3 %
Others 96 22.5 %
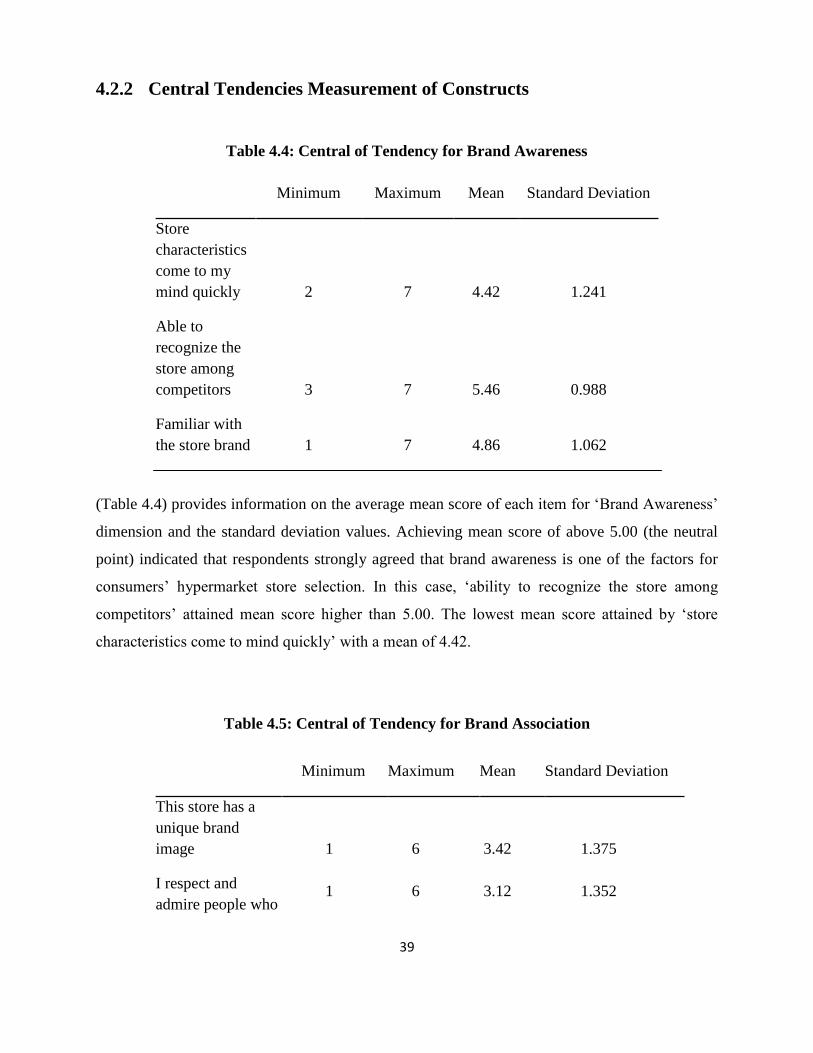
39
4.2.2 Central Tendencies Measurement of Constructs
Table 4.4: Central of Tendency for Brand Awareness
Minimum Maximum Mean Standard Deviation
Store
characteristics
come to my
mind quickly 2 7 4.42 1.241
Able to
recognize the
store among
competitors 3 7 5.46 0.988
Familiar with
the store brand 1 7 4.86 1.062
(Table 4.4) provides information on the average mean score of each item for ‘Brand Awareness’
dimension and the standard deviation values. Achieving mean score of above 5.00 (the neutral
point) indicated that respondents strongly agreed that brand awareness is one of the factors for
consumers’ hypermarket store selection. In this case, ‘ability to recognize the store among
competitors’ attained mean score higher than 5.00. The lowest mean score attained by ‘store
characteristics come to mind quickly’ with a mean of 4.42.
Table 4.5: Central of Tendency for Brand Association
Minimum Maximum Mean Standard Deviation
This store has a
unique brand
image 1 6 3.42 1.375
I respect and
admire people who 1 6 3.12 1.352
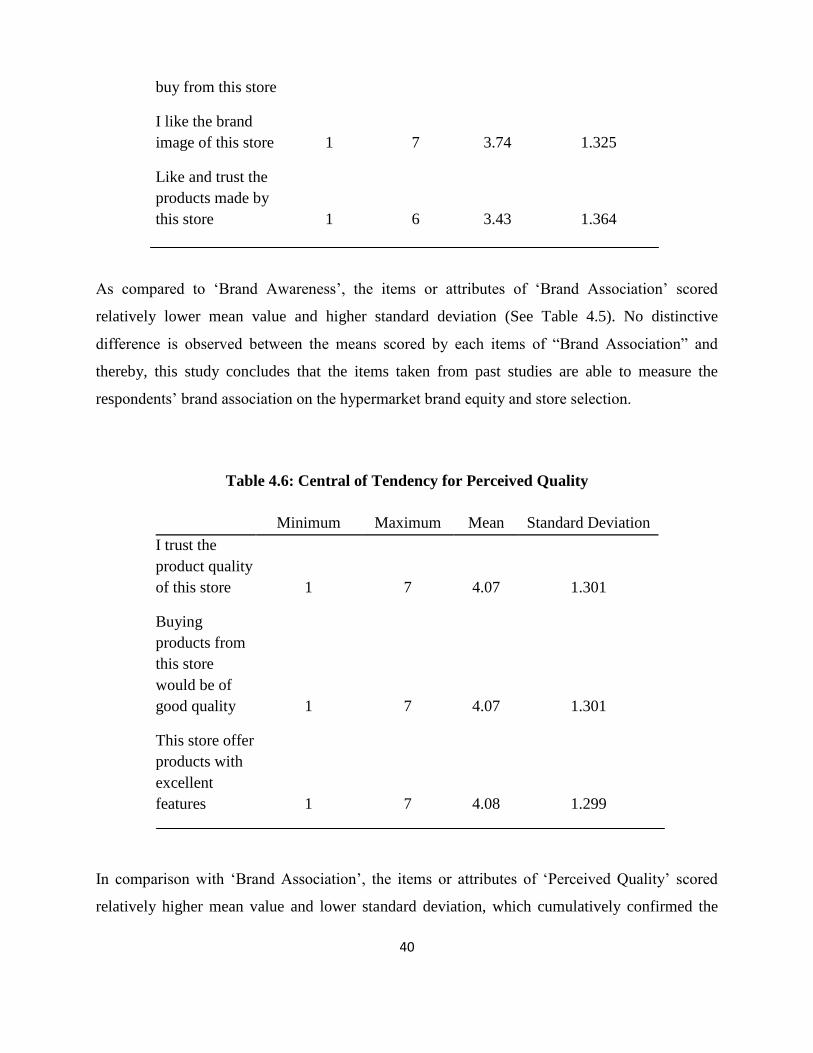
40
buy from this store
I like the brand
image of this store 1 7 3.74 1.325
Like and trust the
products made by
this store 1 6 3.43 1.364
As compared to ‘Brand Awareness’, the items or attributes of ‘Brand Association’ scored
relatively lower mean value and higher standard deviation (See Table 4.5). No distinctive
difference is observed between the means scored by each items of “Brand Association” and
thereby, this study concludes that the items taken from past studies are able to measure the
respondents’ brand association on the hypermarket brand equity and store selection.
Table 4.6: Central of Tendency for Perceived Quality
Minimum Maximum Mean Standard Deviation
I trust the
product quality
of this store 1 7 4.07 1.301
Buying
products from
this store
would be of
good quality 1 7 4.07 1.301
This store offer
products with
excellent
features 1 7 4.08 1.299
In comparison with ‘Brand Association’, the items or attributes of ‘Perceived Quality’ scored
relatively higher mean value and lower standard deviation, which cumulatively confirmed the
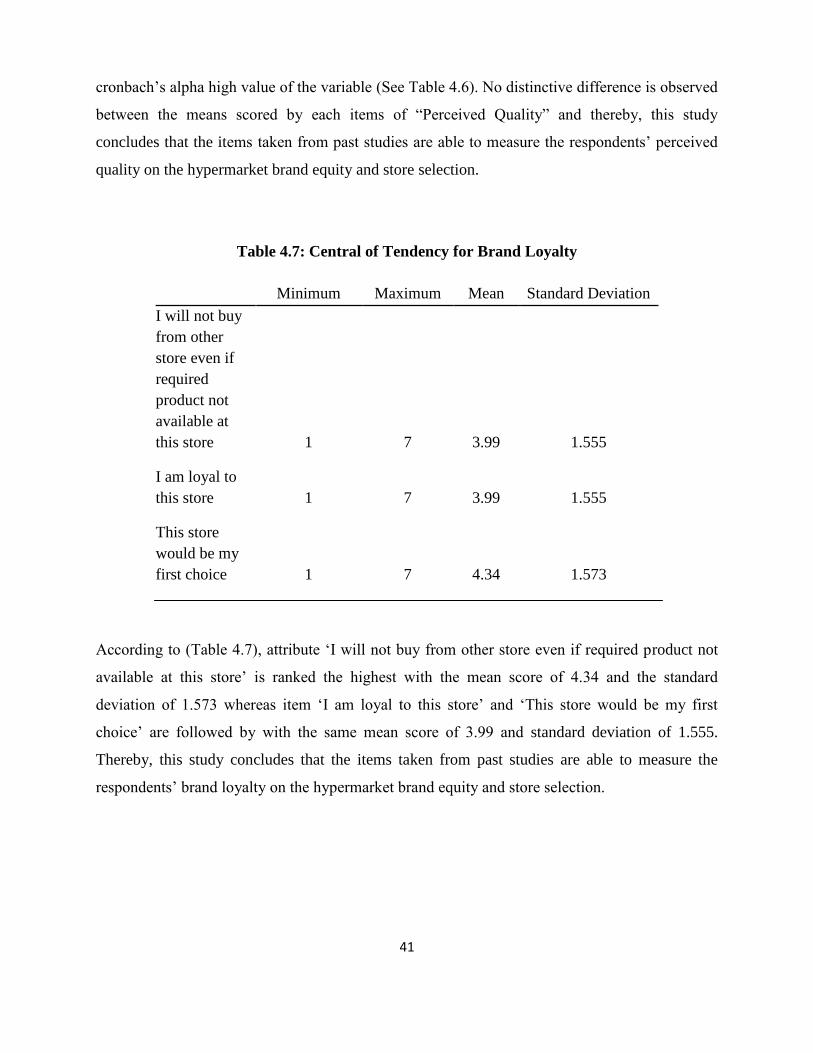
41
cronbach’s alpha high value of the variable (See Table 4.6). No distinctive difference is observed
between the means scored by each items of “Perceived Quality” and thereby, this study
concludes that the items taken from past studies are able to measure the respondents’ perceived
quality on the hypermarket brand equity and store selection.
Table 4.7: Central of Tendency for Brand Loyalty
Minimum Maximum Mean Standard Deviation
I will not buy
from other
store even if
required
product not
available at
this store 1 7 3.99 1.555
I am loyal to
this store 1 7 3.99 1.555
This store
would be my
first choice 1 7 4.34 1.573
According to (Table 4.7), attribute ‘I will not buy from other store even if required product not
available at this store’ is ranked the highest with the mean score of 4.34 and the standard
deviation of 1.573 whereas item ‘I am loyal to this store’ and ‘This store would be my first
choice’ are followed by with the same mean score of 3.99 and standard deviation of 1.555.
Thereby, this study concludes that the items taken from past studies are able to measure the
respondents’ brand loyalty on the hypermarket brand equity and store selection.
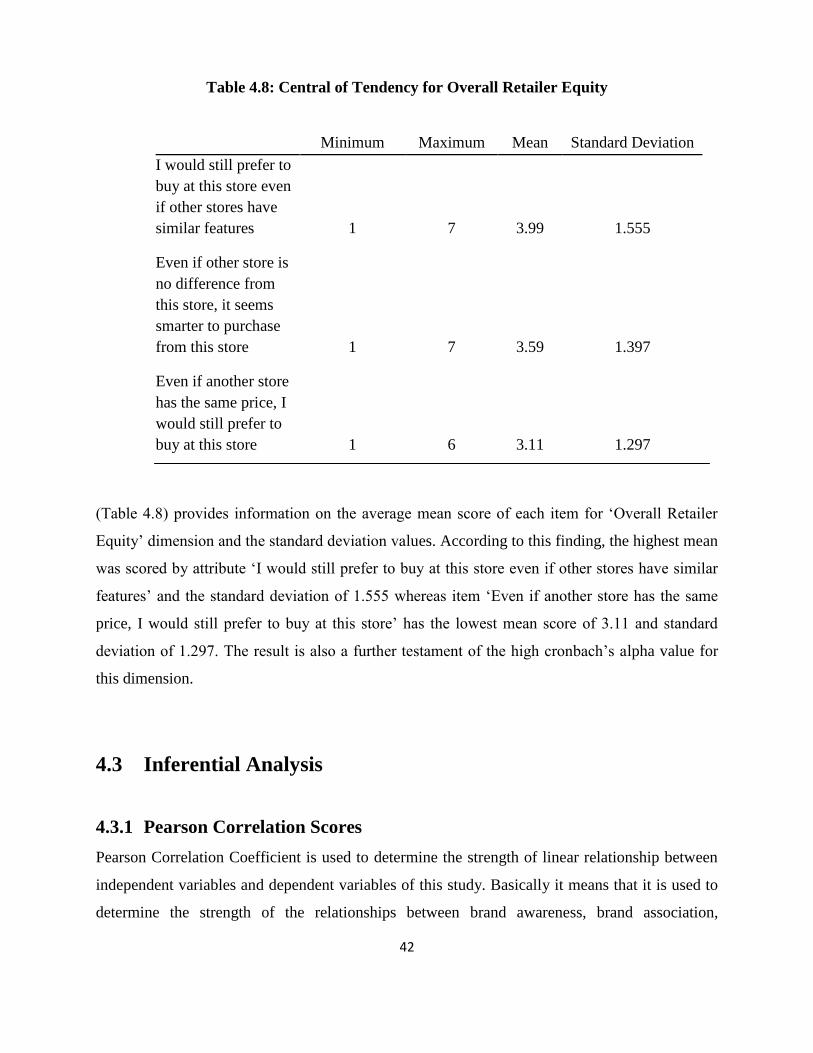
42
Table 4.8: Central of Tendency for Overall Retailer Equity
Minimum Maximum Mean Standard Deviation
I would still prefer to
buy at this store even
if other stores have
similar features 1 7 3.99 1.555
Even if other store is
no difference from
this store, it seems
smarter to purchase
from this store 1 7 3.59 1.397
Even if another store
has the same price, I
would still prefer to
buy at this store 1 6 3.11 1.297
(Table 4.8) provides information on the average mean score of each item for ‘Overall Retailer
Equity’ dimension and the standard deviation values. According to this finding, the highest mean
was scored by attribute ‘I would still prefer to buy at this store even if other stores have similar
features’ and the standard deviation of 1.555 whereas item ‘Even if another store has the same
price, I would still prefer to buy at this store’ has the lowest mean score of 3.11 and standard
deviation of 1.297. The result is also a further testament of the high cronbach’s alpha value for
this dimension.
4.3 Inferential Analysis
4.3.1 Pearson Correlation Scores
Pearson Correlation Coefficient is used to determine the strength of linear relationship between
independent variables and dependent variables of this study. Basically it means that it is used to
determine the strength of the relationships between brand awareness, brand association,

43
perceived quality and brand loyalty against overall hypermarket brand equity and hypermarket
store selection. (Table 4.9 and Table 4.10) showed that the relationships of three tested
independent variables (Brand Awareness, Perceived Quality and Brand Loyalty) were
significantly related to dependent variable with all three independent variables obtained p-value
lower than alpha value 0.05.
However, independent variable (Brand Association) does not have significant relationship to the
dependent variable as its p-value is above 0.05 alpha value. The correlation strength of
dimensions (brand awareness, perceived quality and brand loyalty) are relatively within + 0.21 to
+ 0.40 indicating a definite relationship. However, dimension (Brand Association) indicates
correlation strength level within + 0.00 to + 0.20 which implies that this dimension is very little
in strength and can be ignored. Interestingly, the study also revealed dimension ‘Brand
Awareness’ has a negative relationship towards dependent variable. Overall, the results indicate
a potential for improvement in this area. Therefore, the results of this study will be a reference
point for future studies to identify further on the causal implications of theses independent
variables towards the dependent variable.
Table 4.9: Pearson Correlation Scores between Independent Variables
and Dependent Variable.
Brand
Awareness
Brand
Association Perceived Quality
Brand
Loyalty
Pearson Correlation
with dependent
variable: Overall
Retailer Equity - 0.207 0.077 0.281 0.295
Sig. (2-tailed) 0.000 0.114 0.000 0.000
N 427 427 427 427
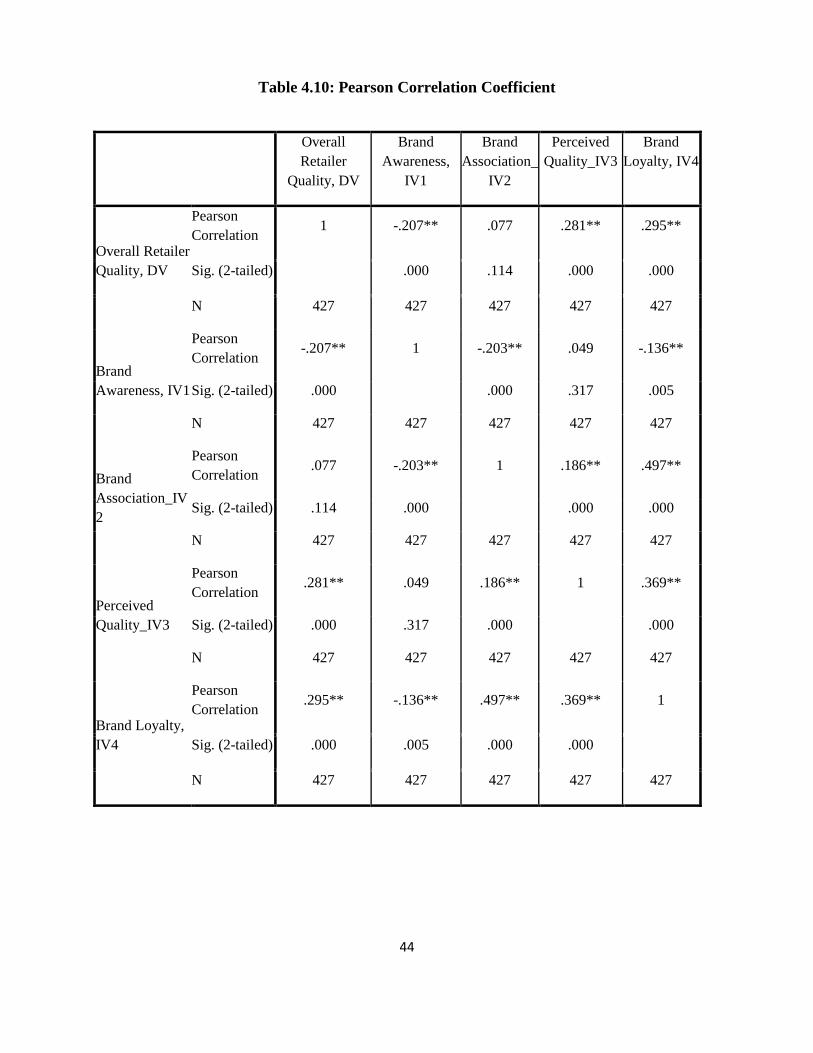
44
Table 4.10: Pearson Correlation Coefficient
Overall
Retailer
Quality, DV
Brand
Awareness,
IV1
Brand
Association_
IV2
Perceived
Quality_IV3
Brand
Loyalty, IV4
Overall Retailer
Quality, DV
Pearson
Correlation 1 -.207** .077 .281** .295**
Sig. (2-tailed) .000 .114 .000 .000
N 427 427 427 427 427
Brand
Awareness, IV1
Pearson
Correlation -.207** 1 -.203** .049 -.136**
Sig. (2-tailed) .000 .000 .317 .005
N 427 427 427 427 427
Brand
Association_IV
2
Pearson
Correlation .077 -.203** 1 .186** .497**
Sig. (2-tailed) .114 .000 .000 .000
N 427 427 427 427 427
Perceived
Quality_IV3
Pearson
Correlation .281** .049 .186** 1 .369**
Sig. (2-tailed) .000 .317 .000 .000
N 427 427 427 427 427
Brand Loyalty,
IV4
Pearson
Correlation .295** -.136** .497** .369** 1
Sig. (2-tailed) .000 .005 .000 .000
N 427 427 427 427 427

45
4.3.2 Multiple Regression Analysis
In this research, this statistical tool is used to determine the relationship between brand
awareness, brand association, perceived quality and brand loyalty against the overall equity of
hypermarket. (Table 4.11) showed that 17% of the change in the dependent variable: ‘Overall
Hypermarket Equity’, can be explained by the 3 independent variables – ‘Brand Awareness’,
‘Perceived Quality’ and ‘Brand Loyalty’. Overall, the statistical significance of the fourth
regression model is acceptable, F-value = 21.605 (p < 0.05) (see the ANOVA Table below). The
table provided the important figures to establish a regression formula that can describe the
relationship and the strength of association between each independent variables and dependent
variable, i.e.
Y = 3.427 - 0.255 X1 - 0.154 X2 + 0.209 X3 + 0.212 X4
Whereby, Y = Overall Hypermarket Equity
X1 = Brand Awareness
X2 = Brand Association
X3 = Perceived Quality
X4 = Brand Loyalty
The above equation shows that independent variable “Brand Awareness” has the highest causal
impact of the change in dependent variable (Overall Hypermarket equity), followed by “Brand
Loyalty”. The third and fourth variables would be “Perceived Quality” and “Brand Association”.
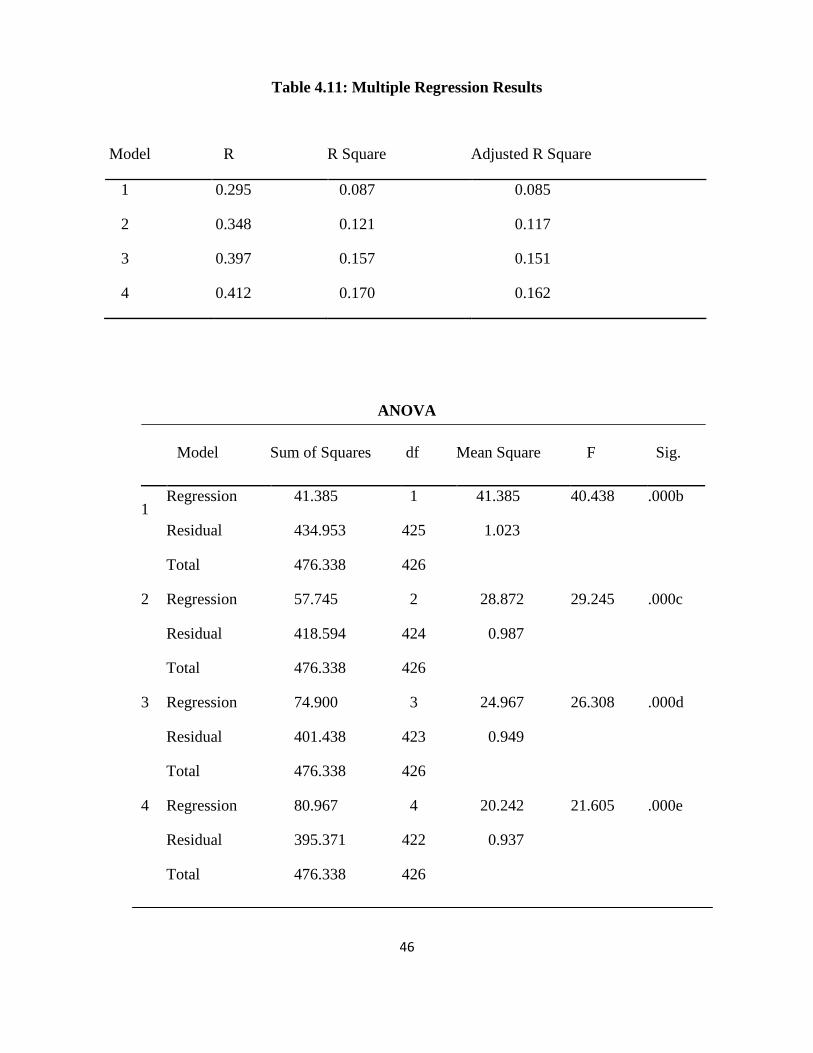
46
Table 4.11: Multiple Regression Results
Model R R Square Adjusted R Square
1 0.295 0.087 0.085
2 0.348 0.121 0.117
3 0.397 0.157 0.151
4 0.412 0.170 0.162
ANOVA
Model Sum of Squares df Mean Square F Sig.
1 Regression 41.385 1 41.385 40.438 .000b
Residual 434.953 425 1.023
Total 476.338 426
2 Regression 57.745 2 28.872 29.245 .000c
Residual 418.594 424 0.987
Total 476.338 426
3 Regression 74.900 3 24.967 26.308 .000d
Residual 401.438 423 0.949
Total 476.338 426
4 Regression 80.967 4 20.242 21.605 .000e
Residual 395.371 422 0.937
Total 476.338 426
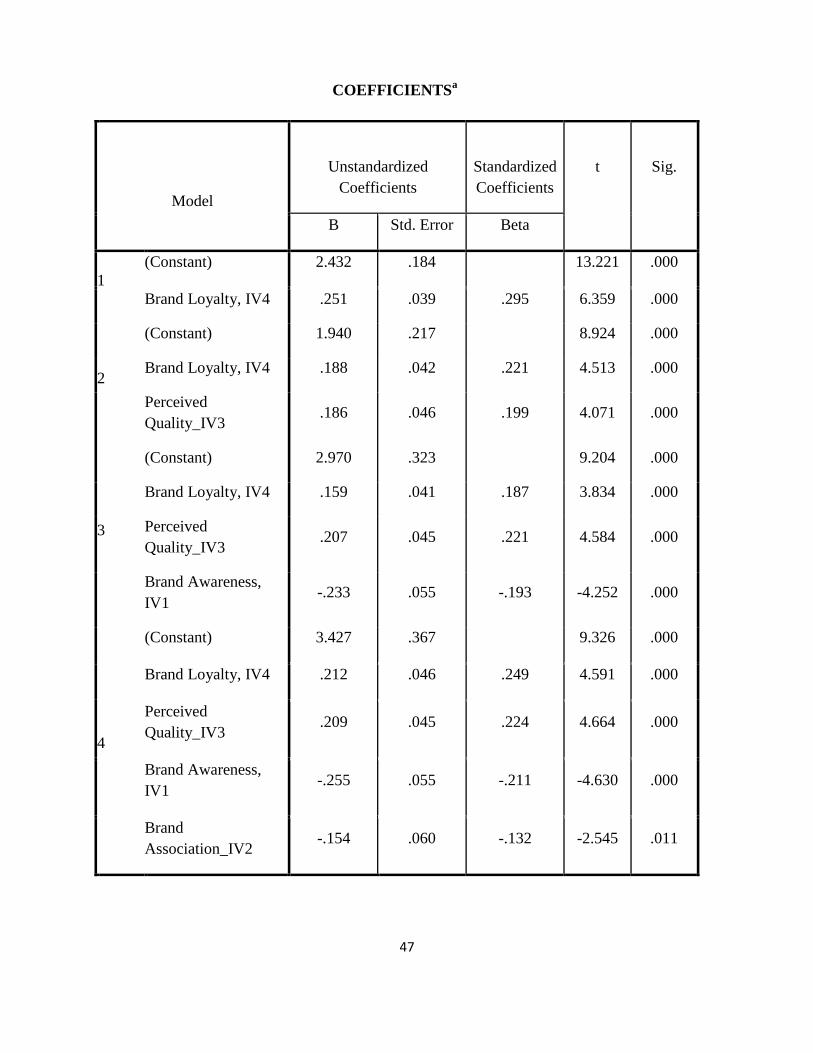
47
COEFFICIENTSa
Model
Unstandardized
Coefficients
Standardized
Coefficients
t
Sig.
B Std. Error Beta
1
(Constant) 2.432 .184 13.221 .000
Brand Loyalty, IV4 .251 .039 .295 6.359 .000
2
(Constant) 1.940 .217 8.924 .000
Brand Loyalty, IV4 .188 .042 .221 4.513 .000
Perceived
Quality_IV3 .186 .046 .199 4.071 .000
3
(Constant) 2.970 .323 9.204 .000
Brand Loyalty, IV4 .159 .041 .187 3.834 .000
Perceived
Quality_IV3 .207 .045 .221 4.584 .000
Brand Awareness,
IV1 -.233 .055 -.193 -4.252 .000
4
(Constant) 3.427 .367 9.326 .000
Brand Loyalty, IV4 .212 .046 .249 4.591 .000
Perceived
Quality_IV3 .209 .045 .224 4.664 .000
Brand Awareness,
IV1 -.255 .055 -.211 -4.630 .000
Brand
Association_IV2 -.154 .060 -.132 -2.545 .011
48
CHAPTER 5: CONCLUSION
5.0 Introduction
This chapter will serve as a summary for this entire study by providing the essential parts of the
statistical findings and validation of the hypotheses. Besides that, theoretical and managerial
implications will be discussed along with the limitation of this research and its recommendation
for future research.
5.1 Summary of Statistical Analysis
In this study, reliability test using Cronbach’s alpha was used to assess the reliability of the 16
items constructed to evaluate the 4 independent variables (Brand Awareness, Brand Association,
Perceived Quality, and Brand Loyalty) and dependent variable (Overall Hypermarket Equity).
The reliability test shows that the items used to measure each independent and dependent
variable are highly reliable and this is consistent with the past studies’ findings. The reliability
scores also imply that the respondents are able to understand the questions well and able to
evaluate the items in the questionnaire clearly without facing much difficulty. Besides that, the
Pearson correlation test showed that the relationships of three tested independent variables
(Brand Awareness, Perceived Quality and Brand Loyalty) were significantly related to dependent
variable however, another independent variable (Brand Association) does not have significant
relationship to the dependent variable.
The three variables found to be significant (brand awareness, perceived quality and brand
loyalty) have attained a correlation strength that signifies a definite relationship. Interestingly,
the study also revealed dimension ‘Brand Awareness’ has a negative relationship towards the
dependent variable. This implies that when brand awareness is high, the overall hypermarket
equity is low and doesn’t play a role in hypermarket store selection. There is a possibility of
spreading of negative news that could be detrimental to the hypermarket which leads to this
phenomenon. The study has also found that independent variable “Brand Awareness” has the
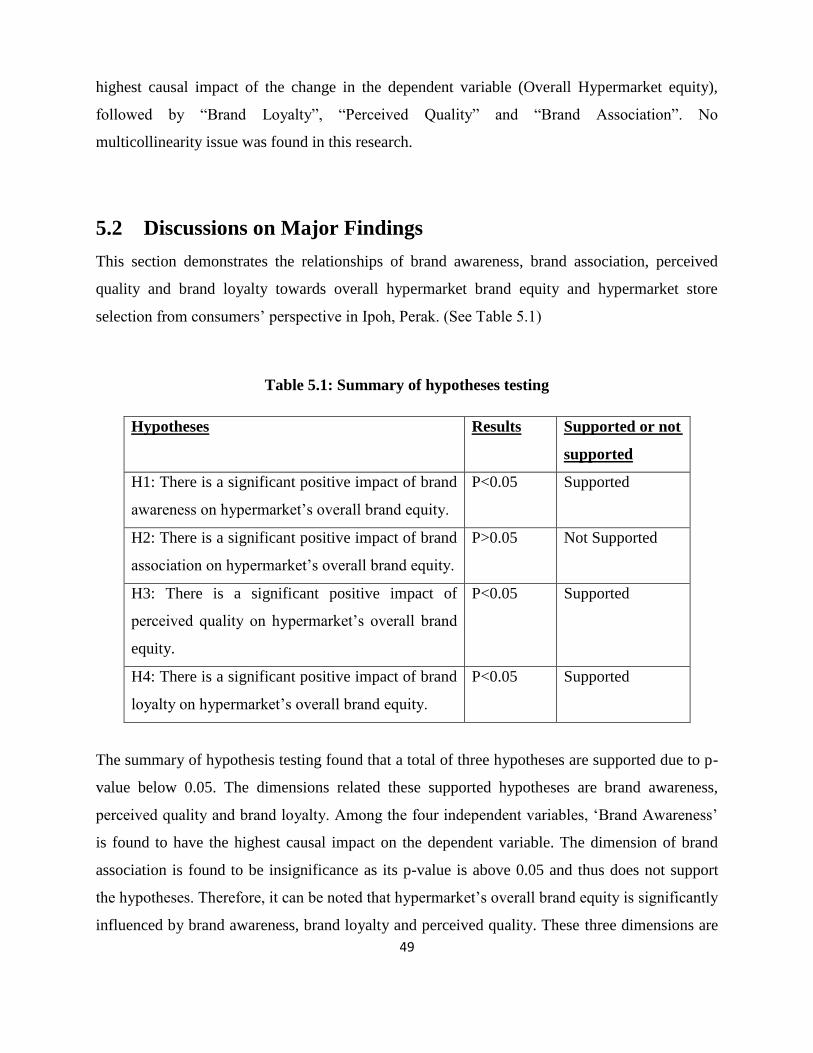
49
highest causal impact of the change in the dependent variable (Overall Hypermarket equity),
followed by “Brand Loyalty”, “Perceived Quality” and “Brand Association”. No
multicollinearity issue was found in this research.
5.2 Discussions on Major Findings
This section demonstrates the relationships of brand awareness, brand association, perceived
quality and brand loyalty towards overall hypermarket brand equity and hypermarket store
selection from consumers’ perspective in Ipoh, Perak. (See Table 5.1)
Table 5.1: Summary of hypotheses testing
Hypotheses Results Supported or not
supported
H1: There is a significant positive impact of brand
awareness on hypermarket’s overall brand equity.
P<0.05 Supported
H2: There is a significant positive impact of brand
association on hypermarket’s overall brand equity.
P>0.05 Not Supported
H3: There is a significant positive impact of
perceived quality on hypermarket’s overall brand
equity.
P<0.05 Supported
H4: There is a significant positive impact of brand
loyalty on hypermarket’s overall brand equity.
P<0.05 Supported
The summary of hypothesis testing found that a total of three hypotheses are supported due to p-
value below 0.05. The dimensions related these supported hypotheses are brand awareness,
perceived quality and brand loyalty. Among the four independent variables, ‘Brand Awareness’
is found to have the highest causal impact on the dependent variable. The dimension of brand
association is found to be insignificance as its p-value is above 0.05 and thus does not support
the hypotheses. Therefore, it can be noted that hypermarket’s overall brand equity is significantly
influenced by brand awareness, brand loyalty and perceived quality. These three dimensions are
50
found to be of great importance to consumers.
This results of this study coincide with studies by Yoo et al (2000) in which it was found that
brand awareness have positive impact on retailers’ equity. Therefore, this finding is yet another
further testament on the importance of brand awareness as they tend to have significant impact
on consumers’ mind. A hypermarket’s equity could be determined by brand awareness. As such,
it important for big retailers like hypermarket to improve on its marketing activities on various
scales. In some occasions, any negative news about the firm could also lead to consumer’s
awareness level which will cause negative reaction towards the brand. The study also found a
positive correlation between perceived quality and hypermarket’s overall brand equity. This
result supports the evidence from previous studies undertaken by Li et al (1994); Jinfeng et al
(2009); Erenkol and Duygun (2010) in which perceived quality has a positive impact towards
brand equity. The hypermarket must pay a close attention to how is the retail outlets’ quality
level being perceived by consumers.
According to Aaker (1991), customer’s overall perception and evaluation on a specific product’s
level of quality in connection with its intended objective relative to availability of alternatives
can best described the term perceived quality. In addition, the result of this study also supports
hypotheses 4 in which stated that brand loyalty has a positive impact towards hypermarkets’
overall brand equity. The results from this dimension is also in line with past literatures by Tellis
(1988); Pan et al (2006); Pappu et al (2006) in which brand loyalty is positively correlated with
brand equity from various industries. Therefore, hypermarkets need to engage more in loyalty
programmes to enrich customers’ shopping experience with them. Aaker (1991) has also stated
that brand loyalty able to reduce marketing costs, able to attract new customers by creating
awareness, able to trade leverage and act as a response to competitive threats. Hence, this study
has confirmed that Aaker’s brand equity model can be applicable to hypermarkets too.

51
5.3 Managerial Implications
As managerial implications, managers should concentrate on improving its brand equity level
especially the dimensions of brand awareness, brand loyalty and perceived quality which were
found to be significance in this research. For example; personalized marketing activities and
events need to be carried out in a continuous manner to retain the existing customers as part of
rewards for their loyalty towards the store. By continuously monitoring of hypermarket equity
and related marketing activities, managers would have better insights and understandings in this
subject matter which will be helpful in estimating their efforts in the long run. On the same note,
this study also has theoretical implication as the concept of consumer-based brand equity was
validated in a relatively new to Malaysia’s hypermarket arena which is one of South-East Asia’s
fast emerging countries. Therefore, the findings and results obtained in this research will be
useful for hypermarkets or retailers, who aim to attain high level of brand equity from
consumers’ perspective in the hope to enhance their foothold in the market and boost their
profits. In conclusion, consumer-based brand equity is an essential part of hypermarkets to
further enhance their revenues.
5.4 Limitations of the Study
In this study, the statements or propositions shown in the questionnaire to measure each
variables’ items were adopted from past studies such as Aaker (1991); Yoo et al (2000); Keller
(1993); Pappu et al (2005). Furthermore, most of the past studies supported the used of the
original statements by displaying high reliability and validity scores. As the statements are highly
reliable and valid, pilot test was not carried out to test the suitability of the sentence structures to
our potential respondents. Nevertheless, the results showed that the author might need to
consider restructuring of independent variables. The issue of getting accurate responses from
respondents is always a debatable issue in any survey. To lessen the issue, the study was
conducted by distributing questionnaires in which face-to-face interviews were held and
respondents were requested fill in the questionnaire immediately. On top of that, the facilitators
were trained to facilitate the respondents in answering the questionnaire should any query raised
by the respondent. Conducting a census survey is always better than sampling survey. In spite of
52
time constraints and financial limitations, the study was conducted in a best possible way in
Ipoh, Perak by gathering the data from four prominent hypermarkets; Tesco, Giant, Mydin and
Econsave. Thus, the results cannot be generalized and represent Malaysia as a whole and other
nationalities. As the concept of consumer-based brand equity may have differential elements
across nations and countries, the findings may not be applicable to other countries due to
differences in cultures and economic status.
5.5 Recommendations for Future Research
In order to get a more comprehensive, detailed and conclusive outcome, it is highly
recommended of this study to be conducted in other parts of Malaysia as well. For a better
generalization, researchers may focus their studies on multi-regions by expanding coverage to
wider range of age group and geographical area to acquire different perspectives. On the other
hand, increasing the total sample size could examine the hypotheses in a better way if this
research is to be repeated in future. This study’s adopted analytical tools are the most common
ones in the context of the study. It is recommended that new research to be undertaken using
qualitative and other analytical tools for a more diverse and exhaustive finding and to build
results viable enough to challenge the currently adopted best practices.
On the other hand, future researchers also encouraged to use a variety of methods to collect data
rather than focusing on written questionnaire alone. The alternatives includes face to face
interview, videotape of interview session, observation, group discussion with detailed evaluation
question and so on. Furthermore, future researchers are suggested to construct their questionnaire
carefully to avoid biased questionnaire in order to obtain valuable information. Besides that, it is
also recommended that other variables such as environmental factors to be incorporated in the
future studies. Researchers also may study the equity concept extensively and include other sub
dimensions of equity such as ‘brand personality’.
53
5.6 Conclusion
In this research, a total of four independent variables (Brand Awareness, Brand Association,
Perceived Quality and Brand Loyalty) were used to determine the impact on dependent variable
(hypermarket’s overall brand equity) in Ipoh, Perak. Dimensions such as brand awareness,
perceived quality and brand loyalty are found to have significant relationship with hypermarkets’
equity. Based on the coefficient value, perceived value and brand loyalty are positively related
towards the dependent variable. Both descriptive analysis and inferential analysis were
summarized and discussed in this chapter. Besides, managerial implications and limitation were
also discussed, and recommendations were provided for future research.
54
REFERENCES
Aaker, D. (1991). Managing brand equity. New York: Free Press.
Aaker, D. (1996). Measuring Brand Equity Across Products and Markets. California
Management Review, 38(3), 102-120.
Agarwal, M.K., & Rao, V. (1996). “An empirical comparison of consumer based measures of
brand equity”, Marketing Letters, 7(3), 237-247.
Ahmad, S. N. B., & Juhdi, N. (2010). Organic food : A study on demographic characteristics and
factors influencing purchase intentions among consumers in Klang Valley, Malaysia.
International Journal of Business and Management, 5(2), 105–118.
Ailawadi, K.L. (2001). The retail power-performance conundrum: what have we learned?
Journal of Retailing, 77(3), 299-318.
Ailawadi, K.L., & Keller, K.L. (2004). Understanding retail branding: conceptual insights and
research priorities, Journal of Retailing, 80(4), 331-342.
Allaway, A.W., Huddleston, P., Whipple, J., & Ellinger, A.E. (2011). Customer-based brand
equity, equity drivers, and customer loyalty in the supermarket industry, Journal of
Product & Brand Management, 20, 3, 190-204
Atilgan, E., Aksoy, S., & Akinci, S. (2005). “Determinants of the brand equity: A verification
approach in the beverage industry in Turkey”. Marketing Intelligence and Planning,
23(2), 237-248.
Berry L.L. (2000). Cultivating service brand equity. Journal of the Academy of Marketing
Science, 28, 1, 128-137.
55
Bhukya, R. (2015). Determinants of Customer-Based Retailer Equity: An Empirical Verification
Approach from Indian Large Retail Market. Jmr, 7(2), 411.
Bird, M., & Ehrenberg, A. S. C. (1966). Non-awareness and non-usage. Journal of Advertising
Research, 6(4), 4–9.
Broyles, S. A., Schumann, D. W., & Leingpibul, T. (2009). Examining brand equity antecedent /
consequence relationships. Journal of Marketing Theory and Practice, 17 (2), 145-161.
Burt, S. (2000). The strategic role of retail brands in British grocery retailing. European Journal
Of Marketing, 34(8), 875-890.
Chaudhuri, A., & Holbrook, M.B. (2001). The chain of effects from brand trust and brand affect
to brand performance: The role of brand loyalty. The Journal of Marketing, 65 (2), 81-93.
Chen, C. (2001). “Using free association to examine the relationship between the characteristics
of brand associations and brand equity”, The Journal of Product and Brand Management,
10(6), 439-451.
Chen, H., & Green, R. (2010). Brand equity, marketing strategy, and consumer income: A
hypermarket study. Journal Of Management And Marketing Research, 1-18.
Cobb-Walgren, C.J., Beal, C., & Donthu, N. (1995). “Brand equity, brand preferences, and
purchase intent”, Journal of Advertising, 24(3), 25-40.
Department of Statistics, Malaysia. (2010). Population and Housing Census of Malaysia.
Retrieved 4 December 2015, from
https://www.statistics.gov.my/images/stories/files/LatestReleases/population/Web_Relea
se_Ciri_IR2010.pdf
Dick A., Jain, A., & Richardson, P. (1995). Correlates of store brand proneness: Some empirical
56
observations. Journal of Product and Brand Management, 4 (4), 15-22.
Dick, A.S., & Basu, K. (1994). Customer loyalty: Toward an integrated conceptual framework.
Journal of Academy of Marketing Science, 22 (2), 99-113.
Eldem, T., & Swait, J. (1998). Brand equity as a signaling phenomenon, Journal of Consumer
Psychology, 7(2), 131-157.
Erenkol, H. A. D., & Duygun, A. (2010). Customers perceived brand equity and research on the
customers of Bellona which is a Turkish Furniture brand. The Journal of American
Academy of Business, 16(1), 93–110
Evans, M. M., Foxall, G., & Jamal, A. (2006). Consumer Behaviour.UK: John Wiley & Sons.
Farquhar, P.H., Han, J.Y & Ijiri, Y. (1991). Recognizing and Measuring Brand Assets.
Marketing Science Institute, Cambridge, MA.
Grewal, D., Krishnan, R., Baker, J., & Borin, N. (1998). The effect of store name, brand name
and price discounts on consumers' evaluations and purchase intentions. Journal of
retailing, 74(3), 331-352.
Grewal, D., & Levy, M. (2009). Emerging issues in retailing research, Journal of Retailing,
85(4), 522-526.
Grewal, D., & Levy, M. (2012). Retailer Brand Equity: An Approach Based on Store Image.
Journal Of Retailing, 2-23.
Hair, J., Money, A., Samouel, P., & Page, M. (2006). Research methods for business. New York:
John Wiley & Sons, Inc.
Hassan, H., Sade, B.A., & Rahman, S.M. (2013). Malaysian hypermarket retailing development
and expansion. Intl J Of Retail & Distrib Mgt, 41(8), 584-595.
57
Holden, S. J. S. (1993). Understanding brand awareness: Let me give you a clue. Advances in
Consumer Research, 20, 383–388.
Hoyer, W. D., & Brown, S. P. (1990). Effects of brand awareness on choice for a common,
repeat-purchase product. Journal of Consumer Research, 17(2), 141–148.
Israel, G. D. (1992). Determining sample size. University of Florida Cooperative Extension
Service, Institute of Food and Agriculture Sciences, EDIS. Retrieved from
http://www.soc.uoc.gr/socmedia/papageo/metaptyxiakoi/sample_size/samplesize1.pdf
Jara, M., & Cliquet, G. (2009). Retail Brand Equity: A Conceptual and Differentiated Approach,
3-19.
Jinfeng, W., & Zhilong, T. (2009). The impact of selected store image dimensions on retailer
equity: evidence from 10 chinese hypermarkets, Journal of Retailing & Consumer
Services, 16(6), 486-494.
Kaliappan, S.R., Alavi, R., Abdullah, K., & Zakaullah, M.A. (2009). “Spillover effects of
foreign hypermarkets on domestic suppliers in Malaysia”, International Journal of Retail
& Distribution Management, 37(3), 226-249.
Karayalcin, C. (2010). “Comparison of Brand and Retailer Equity Regarding Purchase Intentions
of Customers in Turkish Automotive Sector”. University Of Amsterdam, 20-35.
Keller, K.L. (1992). Memory retrieval factors and advertising effectiveness. In Advertising,
Exposure, Memory and Choice. Mitchell A.A., ed. Hillsdale, NJ: Lawrence Erlbaum
Associates, in press.
Keller, K. L. (1993). Conceptualizing, measuring, and managing customer-based brand equity.
The Journal of Marketing, 1-22.
58
Keller, K. L. (1998). Strategic brand management. Upper Saddle River, N.J.: Prentice Hall.
Keller, K. L. (2003). Strategic brand management: Building, measuring, and managing brand
equity. 2nd Ed. Boston, MA: Pearson Education.
Khan, N., Rahmani, S., Hoe, H., & Chen, T. (2014). Causal Relationships among Dimensions of
Consumer-Based Brand Equity and Purchase Intention: Fashion Industry. International
Journal of Business Managemet, 10(1).
Kim, K., Kim, K., Kim, D., Kim, J., & Kang, S. (2008). Brand equity in hospital marketing.
Journal Of Business Research, 61(1), 75-82.
Kim, W. G., & Kim, H. (2004). “Measuring customer-based restaurant brand equity:
Investigating the relationship between brand equity and firms' performance”, Cornell
Hotel and Restaurant Administration Quarterly, 45(2), 115-131.
Kotler, P. (1991). Marketing Management: Analysis, Planning Implementation and Control (7th
edition), Prentice Hall, Upper Saddle River, NJ.
Kotler, P., & Keller, K. L. (2006). Marketing Management.12th edition. Upper Saddle River, NJ:
Prentice Hall.
Krishnan, H.S. (1996). Characteristics of memory associations : a consumer based brand equity
perspective. International Journal of Research in Marketing. 13, 389-405.
Kumaravel, V., & Kandasamy, C. (2012). Measuring Customer Based Brand Equity on
Hypermarket Store in India. European Journal Of Social Sciences, 28(3), 408-415.
Laroche, M., Kim, C., & Zhou, L. (1996). Brand familiarity and confidence as determinants of
59
purchase intention: An empirical test in a multiple brand context. Journal of Business
Research, 37, 115-120.
Lassar, W., Mittal, B., & Sharma, A. (1995). Measuring customer‐based brand equity. Journal of
Consumer Marketing, 12(4), 11-19.
Laurent, G., Kapferer, J. N., & Roussel, F. (1995). The underlying structure of brand awareness
scores. Marketing Science, 14(3), G170–G179.
Li, M.L., & Green, R.D 2011. A mediating influence on customer loyalty: The role of perceived
value. Journal of Management and Marketing Research, 1-12.
Lin, A., Huang, Y., & Lin, M. (2015). Customer-Based Brand Equity: The Evidence from
China. Contemporary Management Research, 11(1), 75-94.
Li, W. K., Monroe, K. B., & Chan, D. K. S. (1994). The effects of country origin, brand, and
price information: A cognitive-affective model of buying intentions. Advances in
Consumer Research, 21, 449-457.
Low, G.S., & Lamb Jr, C.W. (2000). The measurement and dimensionality of brand associations.
Journal of Product and Brand Management, 9 (6), 350-368.
Mackay, M. M. (2001). Evaluation of brand equity measures: further empirical results. The
Journal of Product and Brand Management 10(1): 38-51.
Marketing Science Institute. (2015). Current Research Priorities. Retrieved 24 November
2015, from http://www.msi.org/research/2014-2016-research-priorities/
Morganosky, M.A. (1997). “Format change in US grocery retailing”, International Journal of
Retails & Distribution Management, 25(6), 211-218.
60
Na, W. B., Marshall, R., & Keller, K.L. (1999). Measuring brand power: Validating a model for
optimising brand equity. The Journal of Product and Brand Management 8(3): 170-184.
Nedungadi, P. (1990). Recall and consumer consideration sets: influencing choice without
altering brand evaluations. Journal of Consumer Research, 17 (3), 263-276.
Netemeyer, R. G., Krishnan, B., Pullig, C., Wang, G., Yagci, M., Dean, D. (2004). Developing
and validating measures of facets of customer-based brand equity. Journal of Business
Research, 57(2), 209–224.
Nunnally, J. C. (1978). Psychometric theory (2nd ed.). New York: McGraw-Hill.
Oliver, R. L. (1999). Whence consumer loyalty. Journal of Marketing, 63 (Special Issue), 33-44.
Pan, Y., & Zinkhan, G.M. (2006). Determinants of retail patronage: a meta-analytical
perspective, Journal of Retailing, 82(3), 229-243.
Pappu, R., & Quester, P. (2006). A consumer-based method for retailer equity measurement:
Results of an empirical study. Journal of Retailing and Consumer Services, 13, 317-329.
Pappu, R., Quester, P., & Cooksey, R. (2005). Consumer‐based brand equity: improving the
measurement – empirical evidence. Journal Of Product & Brand Management, 14(3),
143-154.
Pappu, R., Quester, P., & Cooksey, R. (2007). Country image and consumer-based brand equity:
relationships and implications for international marketing. Journal Of International
Business Studies, 38(5), 726-745.
Park, C., & Srinivasan, V. (1994). A Survey-Based Method for Measuring and Understanding
Brand Equity and Its Extendibility. Journal of Marketing Research, 31(2), 271.
61
Percy, L., & Rossiter, J. R. (1992). A model of brand awareness and brand attitude advertising
strategies. Psychology & Marketing, 9(4), 263-274.
Perrigot, R., & Cliquet, G. (2006). Hypermarket format: Any future or a real need to be changed?
An empirical study of the French, Spanish and Italian markets. 5th
International
Marketing Trends Congress.
Porral, C. C., Fernandez, V. A. M., Boga, O. J., & Mangin, J, P, L. (2015). Measuring the
influence of customer-based store brand equity in the purchase intention.
Cuadernosgestion, 15(1), 93-118.
Shocker, A.D., Srivastave, R.K. & Reukert R.W. (1994). Challenges and opportunities facing
brand management: An introduction to special issue. Journal of Marketing Research 31:
149-158.
Simon, C. J., & Sullivan, M.W. (1990). The measurement and determinants of brand equity: A
financial approach. Working Paper. Graduate School of Business, University of Chicago.
Taskin, C., & Akat, O. (2010). Measurement of Consumer Based Brand Equity Using Structural
Equation Modeling and A Research in Durable Consumer Goods Sector. Business and
Economics Research Journal, 1(2).
Tellis, G. J. (1988). Advertising exposure, loyalty, and brand purchase: A two-stage model of
choice. Journal of Marketing Research, 25 (2), 134-144.
Verhoef, P.C., Lemon, K.N., Parasuraman, A., Roggeveen, A.,Tsiros, M., & Schlesinger, L.A.
(2009). Customer experience creation: determinants, dynamics and management
strategies, Journal of Retailing, 85(1), 31-41.
Washburn, J., & Plank, R. (2002). “Measuring brand equity: An evaluation of a consumer-based
62
brand equity scale”, Journal of Marketing Theory and Practice, 10(1), 46-62.
Wernerfelt, B. (1991). Brand loyalty and market equilibrium. Marketing Science, 10(3), 229-
245.
Wilkie, W. (1986). Consumer Behavior. New York: John Wiley& Sons, Inc.
Yoo, B., & Donthu, N. (2001). Developing and validating a multidimensional consumer-based
brand equity scale. Journal of Business Research, 52(1), 1–14.
Yoo, B., Donthu, N., & Lee, S. (2000). “An examination of selected marketing mix elements and
brand equity”. Academy of Marketing Science, 28(2), 195-212.
Zeithaml, V.A. (1988). Consumer perceptions of price, quality, and value: A means-end model
and synthesis of evidence. The Journal of Marketing, 52 (3), 2-22.
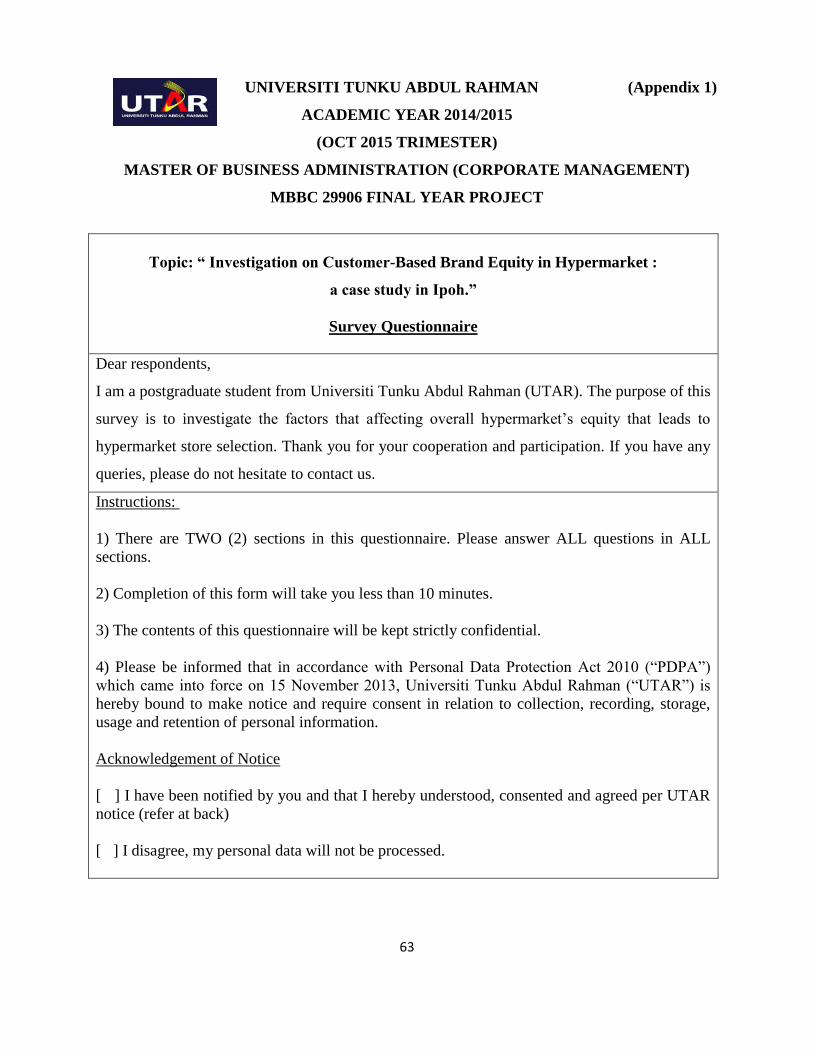
63
UNIVERSITI TUNKU ABDUL RAHMAN (Appendix 1)
ACADEMIC YEAR 2014/2015
(OCT 2015 TRIMESTER)
MASTER OF BUSINESS ADMINISTRATION (CORPORATE MANAGEMENT)
MBBC 29906 FINAL YEAR PROJECT
Topic: “ Investigation on Customer-Based Brand Equity in Hypermarket :
a case study in Ipoh.”
Survey Questionnaire
Dear respondents,
I am a postgraduate student from Universiti Tunku Abdul Rahman (UTAR). The purpose of this
survey is to investigate the factors that affecting overall hypermarket’s equity that leads to
hypermarket store selection. Thank you for your cooperation and participation. If you have any
queries, please do not hesitate to contact us.
Instructions:
1) There are TWO (2) sections in this questionnaire. Please answer ALL questions in ALL
sections.
2) Completion of this form will take you less than 10 minutes.
3) The contents of this questionnaire will be kept strictly confidential.
4) Please be informed that in accordance with Personal Data Protection Act 2010 (“PDPA”)
which came into force on 15 November 2013, Universiti Tunku Abdul Rahman (“UTAR”) is
hereby bound to make notice and require consent in relation to collection, recording, storage,
usage and retention of personal information.
Acknowledgement of Notice
[ ] I have been notified by you and that I hereby understood, consented and agreed per UTAR
notice (refer at back)
[ ] I disagree, my personal data will not be processed.

64
PERSONAL DATA PROTECTION STATEMENT
Please be informed that in accordance with Personal Data Protection Act 2010 (“PDPA”) which
came into force on 15 November 2013, Universiti Tunku Abdul Rahman (“UTAR”) is hereby
bound to make notice and require consent in relation to collection, recording, storage, usage and
retention of personal information.
Notice:
1. The purposes for which your personal data may be used are inclusive but not limited to:-
For assessment of any application to UTAR
For processing any benefits and services
For communication purposes
For advertorial and news
For general administration and record purposes
For enhancing the value of education
For educational and related purposes consequential to UTAR
For the purpose of our corporate governance
For consideration as a guarantor for UTAR staff/ student applying for his/her
scholarship/ study loan
2. Your personal data may be transferred and/or disclosed to third party and/or UTAR
collaborative partners including but not limited to the respective and appointed outsourcing
agents for purpose of fulfilling our obligations to you in respect of the purposes and all such
other purposes that are related to the purposes and also in providing integrated services,
maintaining and storing records. Your data may be shared when required by laws and when
disclosure is necessary to comply with applicable laws.
3. Any personal information retained by UTAR shall be destroyed and/or deleted in accordance
with our retention policy applicable for us in the event such information is no longer
required.
4. UTAR is committed in ensuring the confidentiality, protection, security and accuracy of your
personal information made available to us and it has been our ongoing strict policy to ensure
that your personal information is accurate, complete, not misleading and updated. UTAR
would also ensure that your personal data shall not be used for political and commercial
purposes.
Consent:
1. By submitting this form you hereby authorise and consent to us processing (including
disclosing) your personal data and any updates of your information, for the purposes and/or
for any other purposes related to the purpose.
2. If you do not consent or subsequently withdraw your consent to the processing and disclosure
of your personal data, UTAR will not be able to fulfill our obligations or to contact you or to
assist you in respect of the purposes and/or for any other purposes related to the purpose.

65
3. You may access and update your personal data by writing to me at [email protected]
Questionnaires
Section A
Please indicate your response by circling the right number based on the scale given below:
Strongly
Disagree
Disagree Slightly
Disagree
Neutral Slightly
Agree
Agree Strongly
Agree
1 2 3 4 5 6 7
Brand Awareness
1 When I see this store, some characteristics of this store come
to my mind quickly.
1 2 3 4 5 6 7
2 I can recognize this store quickly among other
competing brand stores.
1 2 3 4 5 6 7
3 I am familiar with this store brand. 1 2 3 4 5 6 7
Brand Association
1 Comparing to competing brand stores, this store has a very
unique brand image.
1 2 3 4 5 6 7
2 I respect and admire people who buy at this store. 1 2 3 4 5 6 7
3 I like the brand image of this store. 1 2 3 4 5 6 7
4 I like and trust the products made by this store. 1 2 3 4 5 6 7
Perceived Quality
1 I trust the quality of products available at this store. 1 2 3 4 5 6 7
2 Buying products from this store would be of very
good quality
1 2 3 4 5 6 7
3 This store offer products with excellent features 1 2 3 4 5 6 7
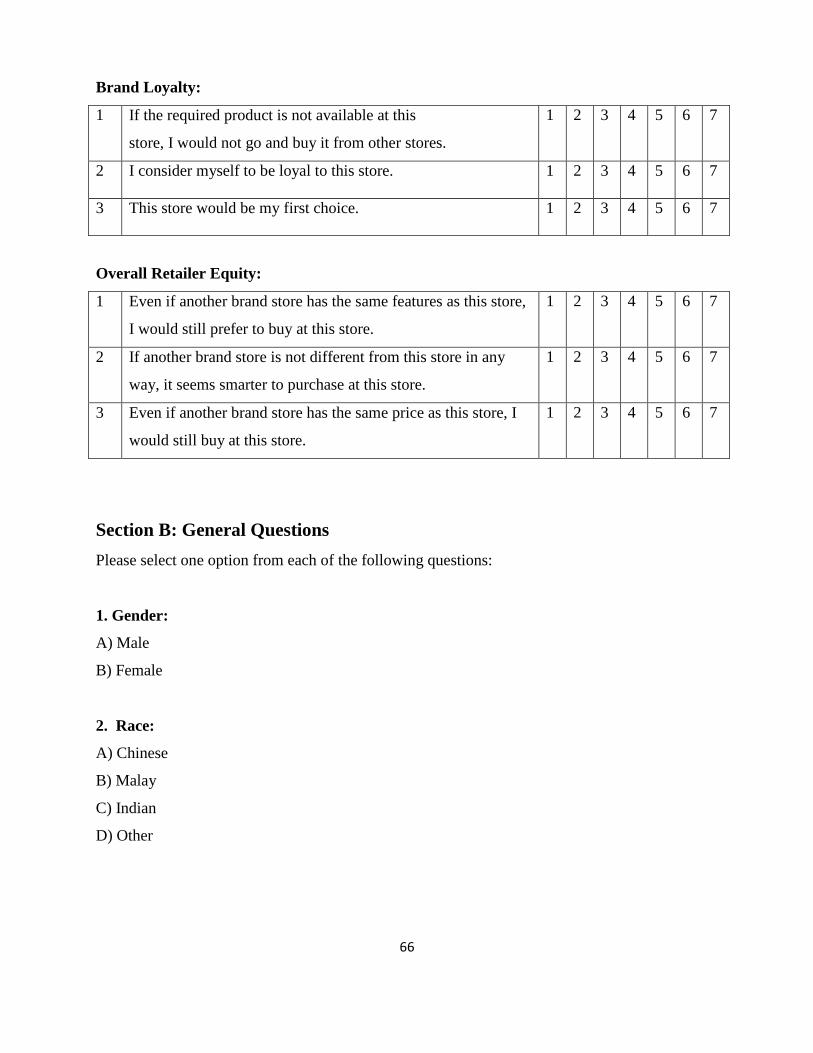
66
Brand Loyalty:
1 If the required product is not available at this
store, I would not go and buy it from other stores.
1 2 3 4 5 6 7
2 I consider myself to be loyal to this store. 1 2 3 4 5 6 7
3 This store would be my first choice. 1 2 3 4 5 6 7
Overall Retailer Equity:
1 Even if another brand store has the same features as this store,
I would still prefer to buy at this store.
1 2 3 4 5 6 7
2 If another brand store is not different from this store in any
way, it seems smarter to purchase at this store.
1 2 3 4 5 6 7
3 Even if another brand store has the same price as this store, I
would still buy at this store.
1 2 3 4 5 6 7
Section B: General Questions
Please select one option from each of the following questions:
1. Gender:
A) Male
B) Female
2. Race:
A) Chinese
B) Malay
C) Indian
D) Other
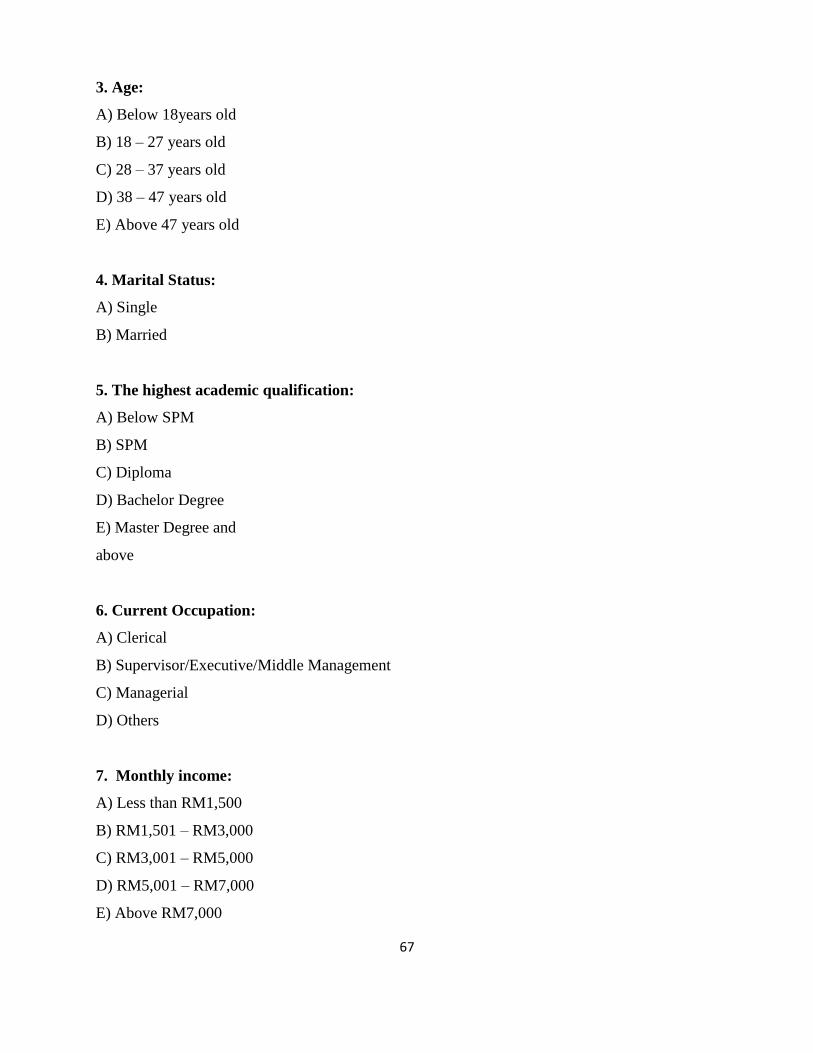
67
3. Age:
A) Below 18years old
B) 18 – 27 years old
C) 28 – 37 years old
D) 38 – 47 years old
E) Above 47 years old
4. Marital Status:
A) Single
B) Married
5. The highest academic qualification:
A) Below SPM
B) SPM
C) Diploma
D) Bachelor Degree
E) Master Degree and
above
6. Current Occupation:
A) Clerical
B) Supervisor/Executive/Middle Management
C) Managerial
D) Others
7. Monthly income:
A) Less than RM1,500
B) RM1,501 – RM3,000
C) RM3,001 – RM5,000
D) RM5,001 – RM7,000
E) Above RM7,000

68