Embed Size (px)
Citation preview

AFFDL-TR-76-150 X
INVESTIGATION OF STRESS-STRAIN
HISTORY MODELING AT STRESS RISERS
SPHASE I
LOCKHEED-GEORGIA COMPANYMARIETTA, GEORGIA 30063
,Tulc 11)77
FINAL PHASE I TECHNICAL REPORT
Approved for oublic release; distribution unlimited
-ANC TO 197
AIR FORCE FLIGHT DYNAMICS LABORATORYLU AIR FORCE WRIGHT AERONAUTICAL LABORATORIES
S-~ -- AIR FORCE SYSTEMS COMMANDLA.. WRIGHT-PATTERSON ,"IR FORCE BASE, OHIO 45433
i, W3

NOTICE
When Government drawings, specifications, or other data are used for any purposeother than in connection with a definitely related Government procurement operation,the Unjited States Goverrunent thereby incurs no responsibility nor any obligationwhatsoever; and the fact that the government may have formu7 ated, furnished, or inany way supplied the said drawings, specifications, or other data, is not to beregarded by implication or otherwise as in any manner licensing the holder or any.other person or corporation, or conveying any rights or permission to manufacture,use, or sell any patented invention that may in any way be related thereto.
This report has been reviewed by the Information Office (01) and k releasable to the NationalTechnical Information Service (NTIS). At NTIS, It w!il be available to the general public,Including foreign nations.
This technical report has been reviewed and is approved For publication.
ROBERT L. NEULIEB ROBERT M. BADER, ChiefProject Engineer Structural Integrity Branch
FOR THE COMMANDER
HOWARD L. FARMER, Colonel, USAFChief, Structural Mechanics Division
Copies Of this report should not be returned unloea return ia required by eucurityconsiderations, contractual obligations, or notice on a xpocific document.

SCRITYC _6s I Ie-ATIOilO !H I~ A 4-3E (Wh~k )1a, I)., Ift red)__________________
(1 JREPOIRT DOCUMENTATION PAGE ~cR1CO5INSTRUTINS O2. GOV AC j' NO. 3. PFC1I'l T1.' CATALOG NUMflER
A FF Dý -7 6 -1 - - - - - . -____
6.TITLE (and Sujtl iff) r; .'W-LD"ý.4 v.FtIoOD COVEE~tD
(INVESTIGATION OF STRESS STRAIN HISM4rYI I a,.5..1 eW 96 -,v MODEiLINGi AT STRESS RISERS,
______~ .- ,-* . - ' LG77ERM33 - h
James ./-J&iroeII GRJ F'."Wllsn F33615-75-C-3078 L
9.~~~~~~~ ~ ~ ~ PEFRMN OGNIAIN AE N ADES LEMENT. W314vECT, T Ago'
A Divisilon of Lockheed Aircraft CorporationMarietta, Georgia 30063 1K1Fkh
1 1. CONTROLLING OFFICE NAME AND AD0149SI
Wright-Pattorson AF8, Ohio 45433 121
Aproedfo ubicree Se;'l dilsterifution uontalimited. ) epr
Is. SUPPLEMKNTAfly NOTES
I; ~is. KEY WORDS (Corilinuo arn fevers* side It naehmaary end 101h - h~ihI, blockl numnber)
Stress-strain history, fatigue life, residual stress, creep and stress relaxation
IO AThRACT (Continue, onaw.id Invaryaddnibh b'kntn.J
An experimental and analytical study of the stress and strain history at stress risers wasconducted to assess the effects on cracking in aluminum alloy Structures. This reportcovers Phase I of a two-phase program. The program includes cyclic characterization ofthe 7075-T651 material used, Initial residual stress studies, complex sequence testing ofsuper-scale and notched coupons, and analytical modeling of experimental results. . .,
DD I A s 1473 10 TION OF I NOV 6611i ONSOLITkUNCLASSIFIED)
SECURITY CLASSIFICATION Or *THISI PAGE (i4
,nfli. Knmf nford)

UNCLASSIFIEDSECVRII N CLASSIFICATION OF THIS PAOGE(Whon DLt. IEnfoed)
20. (Continued)
Cyclic and time-dependent creep and/or relaxation were evoluated by measuring strain atthe stress riser. Thirty different test sequences were run and strain data recorded for analyti-cal modeling. These test sequences included combinations of overloads, underloads, periodsbetween overloads, and hold periods at sustained load.
Creep and/or stress relaxation occurs at the stress riser during periods of sustained compressionloading. This creep and relaxation is very complex and Is a funqtion of both not ch stress andnotch strain. The elastic-plastic stress and strain field definition Is important to both thecrack initiation and crack propagation phases of the damage process. Test sequences withsustained load periods reduced specimen life by eighty percent for same loading sequences.
,t
UNCLASSIVIM ASECURITY CL ASSIFICATION 0f TH~IS PAG~rWhenf tiara F.riterdi

FOREWORD
This research and development work reported herein was conducted under Air Force
Contract F33615-75-C-3078 by the Lockheed-Georgia Company, a Division of Lockheed
Aircraft Corporation, The work was sponsored by the Air Force Flight Dynamics Laboratory,
Air Force Systems Command, Wright-Patterson Air Force Bose, Ohio, Dr. Robert L.
Neulieb of the Fatigue, Fracture, and Reliability Group, Structural Integrity Branch, (FBE),
Structural Mechanics Division was the Project Engineer. This report covers the period
from 1 May 1975 to 30 September 1976. This work was performed under Project 1367,
Task 03, Work Unit 11.
Mr. James R. Carroll was the Lockheed-Georgia Company Program Manager. Other key
Lockheed-Georgia technical personnel participating In the program included
* Testing - Mr. G. J. Gilbert
* Analytical Studies - Mr. R. F. Wilkinson
0 Computer Programming - Mr. J. F. Holliday
OIIC 9j11 SpcIloin [" I" -
_ /1gill;
By . .. .................
.. . . ... ....... . . .... . .. ... : " ' ' ' / • . . l :. . . :l :
LL LLmm
1113 1.lA

TABLE OF CONTENTS
Section Title Page
INTRODUCTION 1
SUMMARY 2
Ill EXPERIMENTAL 4
3.1 TEST SEQUENCES 5
3.2 MATERIAL PROPERTY TESTS 15
3.2.1 Static Tests 15
3.2.2 Material Cyclic Characterization 19
3.2.3 Unnotched Fatigue Tests 26
3.3 TEST SPECIMEN DESIGN AND FABRICATION 26
3.3.1 Specimen Configurations 26
3.3.2 Initial Residual Stresses 31
3.4 EXPERIMENTAL TECHNIQUES 49
3.4.1 Small Scale Notched Coupon Tests 49
3.4.2 Super Scale 49
3.4.3 :rraln Measurement 52
3.4.4 Continuous Strain Recording 55
3.5 COMPLEX SEQUENCE TESTS 59
3.5.1 Data Presentation 59
3.5.2 Creep Studies 79
3.5.3 Crack Growth Data 96
3.5.4 Fractographic Studies 96
v- Not rum

TABLE OF CONTENTS (Continued)
Section Title Pog
IV ANALYTICAL 102
4.1 ANALYTICAL PROGRAM 102
4.1.1 Material Response Characterization of 103
7075-T651 Aluminum
4,1.2 Notch Response 133
4.1.3 Cyclic Croop 13
'i, 4.1.4 Damage Predictions 137
V DATA ANALYSIS AND CORRELATION 140
5.1 NOTCH RESPONSE 140
5.2 DAMAGE PREDICTIONS 157
VI CONCLUSIONS 161
REFERENCES 162
.. VI*31......... ___________________

LIST OF FIGURES
Figure No. Title Page
1 Phase I Test Sequences (Sheet 1 of 7) 6
2 Tensile & Compressive Coupon Specimen Configurations 16
3 Monotonic Stress-Strain Curve 7075-T651 18
4 Button End Test Specimen 20
5 Hysteresis Loops for Test GJ3(A t/2 - 0.0119) 21
6 Hysteresis Loops for Test GJ6(A '/2 = 0.0149) 21
7 Hysteresis Loops for Test GJ9(A f/2 = 0.0211) 22
8 Hysteresis Loops for Test GJI(6 ir/2 = 0.0294) 23
9 Cyclic and Monotonic Stress-Strain Data (7075-1651) 24
10 Stress History for 7075-T651 (1.0 Plate) 25
11 Unnotchad Fatigue Data (7075-T651 Plate) 28
12 Super Scale Test Specimen - KT = 2.43 29
13 Notched Coupon Test Specimen - KT = 2.43 30
14 Specimen Locations 32
15 Super-Scale Test Specimen Installation 33
16 Initial Residual Stress Investigation (2 Sheets) 34
17 Strain Gage Locations - Residual Stress Investigation 38
18 Transducer Strain vs. Neuber Analysis lst Super-Scale 40Specimen
19 Strain Gage and Tensile Coupon Location Second 41Super-Scale Specimen
20 Transducer Load-Deflection Curve 44
21 Residual Stress Calculations Using Neuber's Rulb 46
22 Neuber Analysis 2nd Super-Scale Specimen 47
23 Comparison of Neuber and Finite Element Analysis 48
24 Typical Room Temperature Test Arrangement for 50Super-Scale Specimens
25 Elevated Temperature Test Set-Up 51
26 Strain Transducer 53
27 Tinuis Olsen Calibrator With Mounting Attachment 54
28 Calibrator with Transducer Mounted to Measure Normal 56Displacement
vii
V.~~~ -- - - - -.,Lir

LIST OF FIGURES (Continued)
Figure No. Title 9_.e
29 Calibrator with Transducer Mounted to Measure Simulated 57
Hole Diameter Changes
30 Block Schematic Diagram of Data Collection System 58
31 Strain Time History - Sequence No. 8 66
32 Strain Time History - Sequence No. 9 67
33 Strain Time History - Sequence No. 11 68
34 Strain Time History - Sequence No. 12 69
35 Strain Time History - Sequence No, 13 70
36 Strain Time History - Sequence No. 14 71
"37 Strain Time History - Sequence No, 15 72
38 Strain Time History - Sequence No. 21 73
39 Strain Time History - Sequence No, 22 74
40 Strain Time History - Sequence No, 23 75
41 Strain Time History - Sequence No. 24 76
42 Strain Time History - Sequence No. 26 77
43 Strain Time History - Sequence No. 27 78
44 Recorded Load - Strain Data Sequence 6 80
45 Recorded Load - Strain Data Sequence 8 81
46 Recorded Load - Strain Data Sequence 12 82
47 Recorded Load - Strain Data Sequence 13 83
48 Recorded Load - Strain Data Sequence 15 84
49 Recorded Load - Strain Data Sequence 21 85
50 Recorded Load - Strain Data Sequence 22 86
51 Recorded Load - Strain Data Sequence 24 87
52 Recorded Load - Strain Data Sequence 26 88
53 Strain Gage Locations - Sequences 28 and 29 90
54 Strain Distribution - Sequence 28 -7.9 Ksi Loading 91
55 Creep Datr - Sequence -7.9 Ksl Loading 92
.56 Hypothesis of Time Dependent Stress-Strain Change 93
57 Fractographic Analysis of Specimen 1E-4 Failure (2 Sheets) 98
58 Fractographlc Analysis of Specimen 2F.,1 Failure (2 Sheets) 100
viii

LIST OF FIGURES (Continued)
Figure No. Title Page
59 Hysteresis Loops for Test GJ3(A =2=0.01 19) 104
60 Hysteresis Loops for Test GJ6(A /2-0.0149) 104
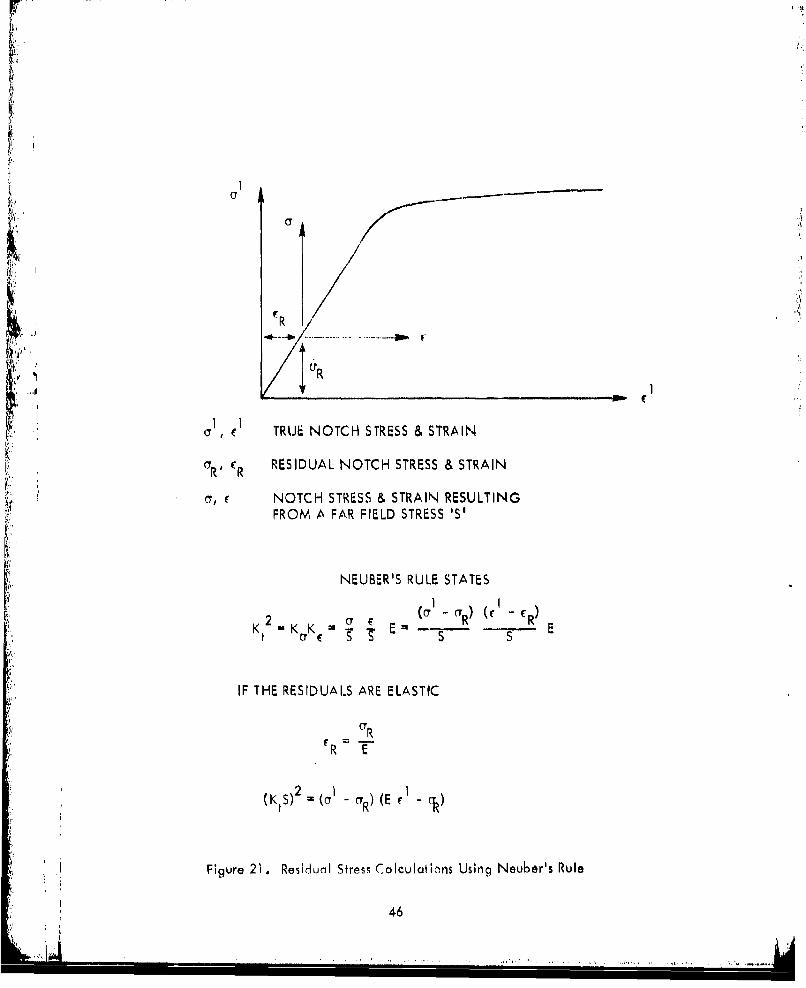
61 Hysteresis Loops for Test GJ9(A c/2=0.021 1) 105
62 Hysteresis Loops for Test GJI(At/2=0.0294) 106
63 Cyclic Locus Curve 107
64 Stable Hysteresis Loops with Matching Lower Tips 109
65 Stable Hysteresis Loops with Matching Upper Branches 110
66 Stable Hysteresis Loops with Matching Upper Tips 111
67 A Basic Stable Lower Branch Curve 112
68 Stable Hysteresis Loops with Matching Modified Lower 114Branches
69 Basic Branch Curve 116
70 Lower Branch Curve Elastic Modulus 117
71 Variation of the Branch Curve Moduill 118
72 Example of Stable Response Algorithm 120
73 Initial Hysteresis Loops with Matching Upper Branches 123
74 InitIal Hysteresis Loops with Modified Lower Branches 124Matching
75 Tension Hardening Curves 125
76 Number of Reversals to Harden 126
77 Normalized Hardening Curve 127
78 Example of Cyclic Hardening
79 Modified Neuber's Equation for the Second Super-Scale 134Specimen
80 Analytical Simulation Cyclic Creep Evaluation 135
81 Cyclic Creep Evaluation - Sequence No, 30 136
82 Rain Flow Counting 138
83 Simultaneous Solution of Neuber's Equation and the 139Stress-Strain Curve
84 Predicted vs. Measured Load Strain Data Sequence 6 141
85 Predicted vs. Measured Load Strain Data Sequence 8 142
86 Predicted vs. Moasured Load Strain Data Sequence 9 143
Ix

LIST OF FIGURES (Continued)
Figure No. Title P!me
87 Predicted vs. Measured Load Strain Data Sequence 12 144
88 Predicted vs. Measured Load Strain Data Sequence 13 145
89 Predicted vs. Measured Load Strain Data Sequence 21 146
90 Predicted vs. Measured Load Strain Data Sequence 22 147
91 Predicted vs. Measured Load Strain Data Sequence 26 148
92 Notch Stress vs. Notch Strain - Sequence 6 149
93 Notch Stress vs. Notch Strain - Sequence 8 150
94 Notch Stress vs. Notch Strain - Sequence 9 151
95 Notch Stress vs. Notch Strain - Sequence 12 152
96 Notch Stress vs. Notch Strain - Sequence 13 153
97 Notch Stress vs. Notch Strain - Sequence 21 154
98 Notch Stress vs. Notch Strain - Sequence 22 155
99 Notch Stress vs. Notch Strain - Sequence 26 156
100 Constant Amplitude Cycling at Max Overload and 158Max Underload Only

r.
LIST OF TABLES
Table No. Title Page
MATERIAL PROPERTIES DATA 17
II UNNOTCHED FATIGUE DATA 27
III RESIDUAL STRESS INVESTIGATION - 37SUPER-SCALE SPECIMEN
IV INITIAL RESIDUAL STRESS INVESTIGATION - 39SMALL SCALE SPECIMEN
V RECORDED STRAIN VS. LOAD DATA 42SECOND SUPER-SCALE SPECIMEN
VI TENSILE TEST DATA - SECOND SUPER SCALE 43SPEC IMEN
VII SUPER-SCALE TEST SUMMARY (2 Sheets) 60
VIII NOTCHED COUPON TEST SUMMARY 62
IX RECORDED STRAIN - SEQUENCE 28 94SUSTAINED LOAD AT -7.9 KSI
X RECORDED STRAIN - SEQUENCE 29 95SUSTAINED LOAD AT 15,8 KSI
XI CRACK GROWTH DATA 97
XII ACTUAL VERSUS PREDICTED LIFE SUPER-SCALE 159TEST SPECIMENS
xi

SECTION I
INTRODUCTION
Structural cracking continues to be a major factor in air vehicle design and operation
and an accurate assessment of the life of the structures is an essential part of design
criteria. In order to accurately assess the life or time to cracking of aircraft structures,
it is necessary to describe the detailed stress-strain state at the probable crack initiation
site, usually at a stress concentration. A hysteresis type of analysis which describes
notch stresses and strains and includes residual stress accountability is becoming a widely
used tool for looking at the stress-strain history. This analysis accounts for sequence
effects in complex load time histories. Recent published results in References 1 through
3 indicate that there may be time and cyclic dependent changes in the stress-strain state
which significantly affect fatigue life but are not currently included in any
analytical models.
It has been shown in Reference I and 3 that there is a shortening of life when a sustained
compression load follows a tension overload in the loading sequence. This is attributed
to a relaxation of the induced residual stresses during the period of sustained compressive
loading. The program reported here is Phase I of a two-phase program to evaluate the
stress-strain history at stress risers, including this relaxation or creep phenomena. An analy-
tical and experimental study has been performed as a first step in formulation of an empirical
stress-strain analysis model.
The studies included effects of (1) load and mechanically induced plasticity at the
stress riser, (2) cyclic characterization of the materioa, (3) cyclic dependent variations
in the stress-strain field, and (4) time dependent changes (creep) in the stress-strain
state during sustained loading periods.
PRhGEMINgG PAGE NOT FLLj

SECTION II
SUMMARY
This program was directed to an experimental and analytical study of the stress and
strain history at a stress riser to determine effects on cracking in aluminum alloy structures.
The program reported here Is Phase I of a two-phase program. An experimental approach
was devised to determine if meaningful and measurable strain data could be recorded at
the stress riser In a centrally notched plate when loaded under complex load-time-
temperature test sequences. Program tasks Included; monotonic and cyclic characterization
of the 7075 material used, initial residual stress studies, complex sequence testinc, of super-
scale and notched coupon specimens, and analytical modeling of experimental results. The
A .existence of cyclic-and time-dependent creep and/or relaxation at the stress riser was
evaluated by measuring strain at the hole during loadings. The combinations of loads Included
overloads, underloads, periods between overloads, and hold periods at sustained load.
Thirty different test sequences were run and strain data recorded for analytical modeling.
A large amount of experimental data was obtained during this program and It was shown
that meaninaful strain history data at a stress riser can be obtained and analytical modeling
of the stress-strain history is a vital part in predicting cracking of aluminum alloy structures.
The super-scale test specimen is a good tool for evaluating effects of complex loading on time
to cracking. This specimen, together with a Lockheed developed strain transducer, have
provided a data base for stress-strain history modeling.
A summary of some of the observations made during this program is as follows:
0 Overloads Introduce beneficial residual stresses which Increase fatigue life.
An overload immediately followed by an underload results In a shorter life
than with the overloud only. Increasing the magnitude of the underlocJ
decreases life.
Including hold periods at a sustained compression load reduces the specimen life
considerably over that with the underload and no hold period.
* Duration of the sustained load hold period affects life.
2
S. . . . .!i i

* Cyclic periods between overloads and underloads also affect life.
Creep and/or relaxation occurs during these hold periods at compressive
loadings. Time to cracking or life is a function of both a stress and strain
change (creep and/or relaxation) which occurs during periods of sustained
loading.
3
............................................•...•....•. .... ..... •.~.. .

SECTION III
EXPERIMENTAL
An experimental program was designed to demonstrate techniques and procedures for
determining measurable variations In the plastically induced strain field at a stress riser.
Data have been recorded under complex load-time-temperature test conditions, Test
conditions have Included overloads and underloads, variable length blocks of constant
amplitude cycling, periods of sustained loading, and elevated temperatures. These data
have been used to empirically model the stress-strain time history around a stress riser -
in this case a circular hole in a finite width plate. Significant data which have been
"recorded Include the following;
• Continuous recording of notch strain, load, time and cyclic test conditions
; Material cyclic characterization
a Initial residual stress
6 Cycles to crack Initiation
e Cycles to rupture
0 Creep Data
Thirty complex load-time-temperature test sequences were developed and applied to notched
super-scale and coupon test specimens to evaluate the variations In the plastic strain field
at the stress riser. These test sequences are representative of the environmental load-time-
temperature profiles of a typical fighter or transport wing structure. The sequences include
initial tension and/or compression loadings followed by blocks of constant amplitude cycling
at a positive 1-g mean stress. In some sequences the compression loadings are followed by
periods of sustained load (either at the compression minimum or at the 1-g condition) prior
to constant amplitude cycling. Test variables Include time at sustained load, length of the
constant amplitude block of cycles, compression load magnitude, and test temperature. All
specimens were tested to fallure.
& I 4
L j.. ..

Continuous recording of strain and load at the stress riser was achieved with a strain
transducor and data logoer system developed eorlier by Lockheed on an In-house program.
The transducer/data logger system makes it possible to continuously monitor notch strain and
record changes in strain and load under various loading profiles. This system is discussed in
more detail In 3.4.1,
In addition to the complex sequence tests, material properties and material cyclic character-
ization studies have been run. Standard ASTM tests were run todevelop static tension and
compression data for the 7075-T651 plate used in this program. Monotonic and cyclic stress-
strain curves were also developed. The companion specimen test technique was used in thesecyclic characterization studies. Data from these tests have been used In formulating an
t' algorithm for simulating the material cyclic response both during strain hardening/softening
F .and In the stable condition.
Additional studies have included; (1) an evaluation of the Initial residual stress at the stress
riser, (2) a limited crack growth study, and (3) generation of unnotched S-N data for the
: '7075-T651 plate.
:J.Details of all phases of the experimental program are discussed in paragraphs 3.1 through 3.5.
Application of the data in an analytical model formulation is discussed In Section IV and the
data analysis and correlation studies are in Section V.
3.1 TEST SEQUENCES
The test sequences developed for this program were selected to be representative of fighter
and transport wing load-time-temperature profiles. In selecting the sequences, consideration
was given to the plasticity of the strain field around the stress riser and subsequent changes
(creep) in the strain state during sustained loadings and constant amplitude cycling. Data
in References 1 , 2 , and 3 were also used in selecting the sequences.
Each sequence is Illustrated in Figure 1 . The test conditions shown are considered to be
typical of in-service events for transport and fighter aircraft and the sequence development
follows a logical building block format for analytically modeling a wing loading profile.
The following paragraphs discuss in more detail the rationale for selecting these test sequences,
All stress levels shown in Figure I are net section stresses.
5

wl C
In
In Cn
14 1
0 K.
> -2
LUU
I. ... .. .

jj I.
-ii
0L 0.
00 C3

E 61.
ii LA
L _CA
IN1
14.
L Z*w - g u
LL JU L Z e Zz-
Lr0
u-t_ __
gg,
.. cc w

B
LA
U4-
u -oIt, -I
8o § -I §4)n 4) .*
u co U c
7, -oj cz - 0* z w U
z
8 zIA4 C9K K
U T
LL' -
00~
C14C1
9I
...... .....

vi,L-J
CA z
UU0 -0
00
-~ K
S .
z 0
z ~1 ~I
u-j
01

VI-
0 u0
I I
zL coIo -~ I I4
0J
cc LL.
LLiJ
I0. ZN C4c
......... .........

0
00
IAJ A-
§ 12

Sequence 1. TiO!s is a constant amplitude test to astab:Ish baseline data free from the
effects of overlcids, onderloads, efc. The stresses selected are considered
to bo •-ri adequate simulatior, of l-g flight mean and alternaiing stresses for
a cargo "nd a fightur ý.ircraft. Thesci constanW amplitUde test conditions
-.. thibe -,.me for all subsequent sequences.
Sequeance 2-.ý, Each of these sequences has an Inltlal hold period with either a sustained
tension or compreslon Iloading followed by congtant amplitude cycling to
aolfurc. Two hold times are h•n.luded, 1 0 and 24 hours. These sequencos
are conildered typical of upper and lower surfaces uo a wing of an aircraft
on ground followed by flight cycling, The data are considered essential as
A.! simple building blocks for any analytiaol model.i,'Sequence 6-7. Toraslon overloads are Included which represent periodic high Inflight lo,.ids
that Introduce bentficial residual strusses, Variation in the cyclic perl'd
between overlooids (NOL) is included In these sequences. The Reference 2
data Indicate that NOL Is a significant parameter In th, evaluation of the
resldual stress-straln Field and thase sequences are included to develop data
necssary for the analytical model development.
Sequence 9-2, Th'ese tests cm'nblns compressive loading (uoderlouds) with the tension overloods
and cc.ntanl amplitude cycling from preceding sequences. These compressive
loads are Included to represent ground operation ond/or negative loadings as
in the case of a flghter. Again, two NoL periods are Included to develop
basic data for analysis. Variations In the underloads are included to represent
negative maneuvers and high on-ground mean stresses.
Sequence 13-19. Periods of sustained loading were Introduced in Sequence 13 to evaluate
the effect of on-ground conditions under constant loads, Previous data
(References I and 3) had shovn these hold times to significantly affect
time to failure. It was anticipated that strain relaxation or creep would
be evident and measurable from these sequences and then used In formu-
lation of a strain relaxation module for the analytical model. The one-hour
hold periods were repeated through-out the test as indicated; however a
maximum of five 24-hour hold periods were run in any given sequjence.
1 3

Sequence 20-21. This was a repeat of Sequences 13 and 14 except the entire sequences
were run at + 160 0 F.
Sequence 22-23. These sequences include high compressive loadings followring the tension
overload. Considerable plasticity occurs at the stress riser from those
loading sequences and these data are Intended to evaluate the effeci of
this strain state and subsequent detrimental residual strains.
Sequence 24-25. Hold times are Introduced following the compression yield in Sequences
23 and 23. Again, primary concern Is on the changes in the plastic
state at the stress riser during sustained loading. Two NO periods are
Included,
Sequence 26-27, In these two tests, the Initial tension overload is deleted and the specimens
are loaded to 50 Ksl In compression. These sequences are again Included
to evaluate time and cycle dependent changpes in the plastic stress-straln
field at the stress riser.
Sequence 28-29. These two test sequences are included to determine if meaningful data
can be obt'alned from a combination of notch strain and strain gradient
measured data. These sequences were substituted late In the program
to evaluate the trends shown in the Reference 2 daa. A detailed
discussion of the tests and results are Included In paragraph 3.5.2.
Sequence 30. This sequence was included to evaluate cyclic creep. The test includes
variable peak overloads combined with blocks of constant amplitude
cycling. Results from this have been used in the analytical modeling and
are discussed in detail In paragraph 4. 1.3.
Al! ttts were run continuously, on a 24-hour basis, such that only the scheduled loadings
have an effect on the recorded data. Testing Included a minimum of one super-scale specimen
for each sequence and three notched coupon specimens for selected sequences. Test specimen
geometry is discussed In paragraph 3.3.1. Notched coupons were tested for Sequences 1 , 6,
8, 14, 22, and 24 only, Continuous strain-load-time recordings were made for each super-
scale test. The notched coupons were tested for fatigue data only.
14

3.2 MATERIAL PROPERTY TESTS
3.2.1 Static Tests
Static tests were conducted on coupon specimens cut from 7075-T651 aluminum alloy
sheet material, 0.25-inch thick. Three tensile and three compressive coupons were
removed from each of three 4 feet x 12 feet sheets and tested to determine basic material
properties. The tensile and compressive specimen configurations are shown In Figure 2 (a)
and 2 (b).
All the tests were performed at room ;'emperature (77*F ± 5*F) in a universal testing
machine, calibrated to ASTM standards. Load was applied at an approximate rate of
2500 pounds per minute and strain was measured with an SR-4 frame/strain-gaged leaf
type 2.0-inch gage length extensometer. Load versus strain curves were plotted on an
autographic recorder. Tensile and compressive property data are given In Table I.
One tensile coupon was cut from a super scale specimen after the cyclic creep study
(Sequence 30) to establish an accurate value for modulus of elasticity of that piece of
material. The coupon was removed from an area as remote From the spacimen net section
as possible. This specimen was machined to the configuration shown in Figure 2 (a), and
tested in a universal testing machine as before. Load was applied in increments and a
1.0-1nch gago length Tuckerman optical extensometer was used to measure strain at each
load Increment. Prior to reaching the proportional limit load the specimen was unloaded
in order to remove the Tuckerman extensometer and replace it with an SR-4 frame/strain-
gaged leaf type extensometer. Load was reapplied but at a constant load rate until
failure occurred. A load versus strain curve was plotted on an autographic recorder. The
accurate strain dato obtained from the Tuckerman extensometer was then used to plot the
initial part of a stress-strain curve. After correcting the strain data generated by the
SR-4 frame extensorneter to match that obtained in the elastic zone with the Tuckerman
extensometer, the stress-strain curve was extended to a strain level of 0.025-inch/inch
and is presented as Figure 3.
15
S. . . .. . .. . . . . . . . .. ... . . . ...... ... ... .. . . ...... ,, .,° .... ...,. o.-... .

I.
7.00 MIN------
-2. 00 2.50-*: O. 25
,•i•.) 0 75
40 0.500 0.-50 RAD (rYP)
(a) TENSILE COUPON (2.0 INCH GAGE LENGTH)
r,..100
L, -o,25
0.500II
Q) COMPRESSION COUPON
Figure 2. Te- isi' and Cormpressive '-LopomrpF cmen Configuratioas
16 m

TABLE I - MATERIAl. PROPERTIES DATA
Sheet FC F T( FT Elong
(KSI) (KS) (KSI) (%)
S72.7 77.3 82.8 12.5
75.0 78.5 83.4 12.57. (2) 83.7 13.0
2 73.1 76.3 82.1 13.0
74.4 77.1 82.6 12.5
70.9 73.4 80.3 12.5
3 72.3 76.5 82.7 13.5
75.2 77.6 83. 1 13.5
70.9 75.2 81.5 13.0
Averoge 73.1 76.5 82.5 12.9
(1) 0.2 percent offset
(2) Stress-strain curve not adequate for measuring FT
TY,
17

"2i
II
, ,
L .. . 11 II .
118
h

3.2.2 Material Cyclic Characterization
In order to characterize the stable and transient cycle dependent response of the
7075-T651 plate used, strain controlled tests were run on thirty-seven specimens
machined from 1 .0-inch thick plate. The specimen geometry is illustrated in Figure 4.
Testing was done using the companion specimen test technique and range of fully reversed
strain varied from 0.0029 in/in up to 0.049 in/in. Typical hysteresis loops for four test
levels are illustrated in Figures 5 through 8. For clarity, only the initial loop and the
stable hysteresis loop Is shown along with the monotonic locus curve. These data are
used in formulating the analytical model for the stable.response and for cyclic hardening
and softening which Is discussed in detail in 4.1 . 1.
The monotornic stress-strain curve Is shown as a solid curve in Figure 9 and the cyclic
data points are superimposed on the plot. All testing here was run at a constant strain
rate of 0,06 in/in/mmn. Some Interesting and unexpected phenomena were observed
during these tests. In the plastic region the data general ly behave in the classical
manner for the 7075 alloy; that is, the data exhibit strain hardening tendencies, At the
knee of the curve there Is a slight strain softening, however. In general, at strains
above 0.008 in/In the data trends are as expected and the results were considered sufficient
and accurate for the program. However, at lower strains, in the elastic region, the cyclic
data points exhibit unexpected trends. The first data run exhibited a significant amount
of strain softening at strains of 0.00625 and 0.0060 in/In. Two additional data points
were run at lower strains to determine the deviation from the monotonic curve. Softening
also occurred at 0.0030 in/in; however, at A c/2 = 0.0044 in/in the cyclic data at
stabilizationwas totally unexpected. The specimen strain hardened and, at stabilization,
the maximum stress was 85 ksl. The strain hardening Is so drastic that the minimum stress
at stabilization is positive (1 .2 ksi). The path to stabilization for this and other points is
illustrated in Figure 10.
Additional specimens were fabricated and tested at strains between 0.0020 and 0.0045 to
check the original data developed in this strain range. Some of these data points agree
with the monotonic curve; however, there are additional data which show the main strain
hardening that occurred previously at 0.0040 In/in. For the delta strain of 0.0029, for
example, the maximum and minimum stresses at stabilization are +65 and +11 ksl, respectively.
The path to stabilization for two of these data points is also illustrated in Figure 10.
19

3.80- 1.10o 1.35
(TYP)
•r, .... (TYP)4"~ r006R
0.875 000- .010
0.500 0. 50R
-.005 (TYP) Q.636
MACHINE SPECIMEN ENDSFLAT AND PARALLEL
POLISH RADII AND TESTSECTION
Figure 4 • Button End Test Specimen
20
., _

I-
00
II
AU
IC)
-.. � L.
A vi
C)
C.,
-
N'.
-4'%.�
-OK -----�----HI
3
-.43
C?
C
0I
-C.
I)
.244'C)
C>
-
C,
/
0
¾.
CN
V. �
-N -9
�...ZJ%%w... � C)
I -
>4.
4)I
4
-'4
a
ci
VI
a'>4
6.a'U., II
4
0*i
LA. *4�)
21

-C,,
1i
i•'°' • °
¾t
N.. (N
0 -
,, 5•
0 ,
i ,
.1F-
tC)
I' 22

0
C)
"I
U
-JUU I.* 0N
0 -
U 0 C) N-
0
I &-J
U
2 9
()0 43/ a
U..
23

Y4.
~60
40
0060,024 0.032 0.040STRAIN IN./IN,
Flgure 9. CYclIc and Monotonic Stress-StramnData (7075-T6.51)
24

100-0.0364
0.0294
90 001
70
700.06
60
40
3000
20
10
1 10 CYCLES
Figure 10. Stress History for 7075-T651 (.0 Plate)
25
... ........ . .

Fri
A search of published data showed no similar results from other sources; however, cyclic
tests are not generally run at ,A 's in the elastic region of the curve. One possible explan-
ation for this ratcheting effect may be related to the inhomogeneity of the plate material
where these specimens wore taken. Inclusions, large particle sizes, etc. will cause local
stress concentrations which are washed out when a specimen Is loaded plastically at large
strains. The stress concentrations may dominate the material response at lower strains in
the elastic region, however. This may have been the predominate force In the specimenshere which demonstrated the stress ratcheting during cycling. Additional research Is
needed in this area to determine cause and subsequent effect on full-scale structures in
service. This research was beyond the scope of the current program and the elastic portion
of the monotonic curve has been used In analysis together with the cyclic hardening data
In the plastic region.
3.2.3 Unmatched Fatigue Tests
The hysteresis analysis program to be used to predict time to failure or life uses as a basis
for damage calculations either unnotched (Kto 1.0) S-N data or (- N data. In order to
verify the existing data base and to evaluate the plate material used in this program, a
limited fatigue test was run to develop Kt 1 .0 S-N data. Thirty 0.25-inch thick, flat
dogbone specimens were fabricated from the 7075-T651 plate used for the super-scale and
notched coupon specimens and fatiaue tested. The resulting data are listed In Table II
for six different mean stress levels. One specimen was tested at each alternating stress
level shown. These data are plotted as variable stress versus cycles to failure In Figure I I.
3M3 TEST SPECIMEN DESIGN AND FABRICATION
3.3.1 Specimen Configurations
Two specimen configurations were used In the load-time-temperature sequence testing,
The specimens are Illustrated in Figures 12 and 1 3and were fabricated from 0.25-inch
thick, 7075-T651 plate. Super-scale specimens are necessary to facilitate Installation
of the strain transducer, inside the centrally located hole (stress riser), for continuously
monitoring strain changes. The smaller notched coupons are Included for fatigue testing
only for six of the sequences. This Is to compare the times to failure between the two
configurations and ascertain that there are no size effects In the super-scale data. Based
on the data collected, there are no size effects seen which might bias the data.
26

TABLE II. UNNOTCHED FATIGUE DATA
FM 0 FM 60
F 41.5 Ksl N - 32,540 F =20.0 N 26,670V v
30.0 90,180 15.5 83,320
27.0 161,310 13.0 214,160
22.0 329,220 12.0 >1,600,000 (1)
20.0 556,450 12.0 155,550
Failed in Grips
FM -20 FM -20
F *39.0 KSI N= 10,300 F -53.0 N 14,500v V33.0 21,500 42.5 61,900
25.0 71,950 38.0 109,000
18.0 306,860 33.0 445,470
15.0 1,612,000 30.0 1,760,000
FM =40 FM :, -40
F [ 30.0 KSI N 14,930 F = 47.0 N= 350,000V v
24.0 10,800 45.0 610,000
19.0 178,820 37.0 1,790, 000 (N F)
17.0 261,000
14.0 2,000,000 (N F)
27

z
(3o o 0
U.J
LL.
cin
0)
C),
15 SSUIS R18IO Vl 'A
28

6.0 BONDED DOUBLER
2.0 DIA8.
24.0 -____
GRID FORLODCRACK GROWTHMEASUREMENT(Initial Tests)
It E ~STRAIN TRANSDUCER
CONTINUOUS
STRAIN RECORD
Figure 12. Super Scale Test Specimen - K T =2.43
29

C*1
LOf
(L
001
• 30..... .

All specimens were cut from three standard 4' x 12' plates, 0.25-inch thick. Specimen
location within the plate is illustrated in Figure 14. The specimens for moterials properties
evaluation were randomly selected from each plate as shown, Supor-scnle specimens were
taken from Zones A through F and were further identified us to plate nu.bi r and locotion
within a zone. For example, Specimen No, 1A-I was cut from Plate 1, Zone A, and is
the first specimen at the "top" edge of the plate.
Doublers were adhesively bonded to all the specimen ends to preclude fatigue failures at
the end grips and each specimen was laterally supported to prevent buckling during opplica-V tion of compression loads. Figure 15 shows a super-scale specimen installed For testing
with the lateral supports and strain transducer in place.
3.3.2 Initial Residual Stresses
The nature of this experimental program dictated that residual stresses at the stress risers
due to manufaciuring must be near zero, Iwo investigative studies wore conducted to
evaluate the manufacturing residual stresses around the holes in both the super-scale and
notched coupon specimens. All holes were cut under size using a trepanning tool and
then successive boring operations were made to obtain final hole size. This approach was
taken to minimize residual stresses at the holes and was confirmed by the test discussed
below.
The initial study involved the measurement of strains around the hole in both a super-scale
and a notched coupon specimen. Data were recorded From oxial ond rosette strain gages
located at the center of and immediately adjacent to the hole in each specimen durina the
cutting and boring operation. Four 3/8" diameter holes were drilled rlimote to the strain
gaged aiea and the specimen was mounted on four adjustable studs on the mac•ine Fixture.
The specimen installation is shown in Figure 16. Strain qage loca;ions ore shown in
Figure 17. With the test specinen free-standing in an unloaded condition, all 12 strain
gages were zeroed on the strain indicator. These initial readings were checked after
approximately 15 minutes to determine If any zero drift had occurred. None was apparent.
The specimen was then mounted on the adjustable studs on the milling machine end by
monitorinq the strain gage readings to assure no induced stresses, the necessary adjustments
were made to securely attach the specimen for machining.
31

Coupon Fatigue -/*.Majt . Proparfieg
IA-1 1
MatI). F'roper~les Matl. Properlies
(.OL~pon Fnfique
32

(c)Super-S~it ScIr' rinio willi uI-orc2I Supporh
(h~) Sire ;iF Ti ii-A t
33

"(a) Specir,, fl Installed in Milling Machine
(ho) I -illll •upport, and Strain Gages on Underside
Ficiuru 16 Inihal Rtidua l Sitres% Inv,•ti cation
34

(c) nitil Sa Cut 23" ept
to. t
ire"
Figure (c6 Initia eiul Sr%w Cuvetiqto 23"ncDepth
35

The first cut consisted of sawing out the center disc (Figure 16) to a diameter approximately
1.88" and a depth of 0.23" (just prior to breaking through the thickness). Strain data were
recordod from all gagns and are listed in Table Ill. The center disc was then removed and
successive boring operations were made until the final hole size wus achieved. As noted
In Table IIl significant compressive residuals were Introduced around -the hole on the initial
saw cut; however, they were successfully reduced to insignificant levels with the boring
operation for final sizing.
Four rosette gages were bonded on the small specimen as shown in Figure 17. Prior to
installation in the vice laws on the machine, all gages were again zeroed and checked
for zero drift. Strain data are listed in Table IV. An initial 1/8" diameter hole was
% •drilled and strain data recorded from all gages. This was followed by a 3/16" diameter
drilling operation and the successive boring operations until final hole size was reached.
Again, the final residual stresses are Insignificant. This Investigation has demonstrated
that the residual stresses after machining the holes in eaclh specimen type were in fact a
minimum and would not affect the experimental results.
A static tensile test was conducted to verify the results discussed above. This included
instrumenting a super-scale specimen w ith strain gages and recording elastic-plastic
strains frorn the gages as well as the transducer during loading. After loading, tensile
coupons were cut from the specimen and stress-strain data rocorded. A Neuber analysis
of the resulting data is shown In Figure 18 which indicated a residual stress of approximately
15.0 ksl.
Subsequent to this test and analysis a second super-scale specimen was Instrumented and
tested. This repeat was run for several reasons; I.e., (1) transducer was not properly
seated in the first test, (2) additional gages were installed on the hole side wall to check
the transducer, and (3) the Neuber analysis was questionable. A sketch of the specimen
and Instrumentation locations Is shown in Figure 19. Recorded data are tabulated in
Tables V and V 1.
It is significant to note In Table V that strain gages 3 and 4 located on the hole wall track
very closely the transducer up to the point where the gages were lost. The X-Y plot of
load versus deflection (inches) is shown in Figure 20. The specimen was loaded Incrementally36 i

z ' 0 R.-... ..- A.~~~~-
10 8
0 N
0 +n
Z0UC
LA .. ...r
5u AU -V, U z
- 0 U~37

L
I ,'
- 2:L.Ii i
.... . _.E-I •
•.° i

- C)N
N co 10(N (I
z-------------------------------------------------
o 4* 4" + r-
z~ m in +rwV
j -
mo JoQ A+ ; VT -ý
fviLtNE 0 r . 0 c, 0 j, .
d39

I,if
TRANSDUCER
30 / ,,, NEUBER
if,V')
20
K . E x 1o.,3x 106 _
10
0.005 0,010 0.015
STRAIN (in/In)
Figure 1B. Transducer Strain vs. Neuber Analysis
1.t Super-Scale Specimen
40

.4. .
"|i"
,.''•'~ ~ 3- 4'-9"
1/2 5/611i'; ~I I I
L2 J L2..J LjTENSILE COUPONS
Figure 19 Strain Gage and Tensile Coupon LocatonSecond Super-Scale Specimen
41

TABLE V
RECORDED STRAIN VS LOAD DATASECOND SUPER-SCALE SPECIMEN
Load Measured Strain * (in,/In.)
(lb, x 10") Transducer Gages 3/4 Gages 1/2 Gages 5/6
10 0.00148 0.00155 0.00078 0.00055
20 0,00321 0.00311 0,00156 0.00111
30 0,00494 0,00469 0.00235 0.00165
"40 0.0n61', 0.00629 0.00315 0.00222
S50 0.00840 0.00 95 0.00394 0.00278
60 0.01086 0.010.5 0.00479 0.00335
65 0.0126 Gages Out 0.00534 0.00364
69 0,0140 - -
70 - 0.00593 0.0039413 0.0157 - -75 - 0,00673 0.00426
77 0.0180 - -
77.5 - 0,0C711 0.0044
so 8 0.0077 0,00457
Zero 0.0074 0.00135 0.000088
* Average of two strain gages.
42

. J. .
40 o c .
C- 0
V, C;C lC
Lu-
0'
I-
V) u
-j
L43

0
zo zi
7; wi-Iii LI
C14
C, -1 ,
44-

in order to read data from the strain gages and at each incremental load the transducerrecorded specimen creep, as illustrated in the figure. This creep occurred within 1he
first few seconds after reaching the desired load level and no further creep was evident
while the data was being recorded. The data tracked the elastic-plastic surface whqn
the next load level was applied. At the conclusion of this static test, three one-half
inch wide tensile coupons were machined from the super-scale specimen and tested to
obtain strass-strain data. In this instance, sufficient load-deflection data were recordedto reproduce a stress-strain curve to 0.022 in/in strain. These data track the strels-strain
data shown in Figure 3.
A Neuber analysis of the data was run using this stress-strain curve and the data compared
with that from the transducer. As was seen earlier, this analysis indicated significant
residual stresses around the hole. The Neuber analysis was then modified to Include
residuals and the data compared with the transducer measurements. The assumptions for
this modification are Illustrated in Figure 21, Results of this analysis indicate a 20 ksi
residual at the hole as shown in Figure 22. The Neuber analysis was run for residuals of
0, -10, and -20 ksi and, as shown, the -20 ksl analysis correlates with the transducer Istrains.
Initially, It was assumed that there were residual stresses around the hole as evidenced
by the analyses shown in Figures 18 and 22. However, a previous analysis at Lockheed,
for an infinite plate with a central hole, using finite element methods of analysis and
.he Neuber analysis had shown similar trends for zero residual stress. This analysis Is
shown pictorially in Figure 23. The Neuber analysis deviates from the finite element
analysis in much the same manner as the data analysis from the super-scale specimens.
Further, the finite element analysis, of a similar geometry, closely approximates the
transducer response.
It was concluded that there are in fact minimum residual stresses at the holo and that the
Neuber analysis must be modific~d to accurately predict the stress-strain history at the stress
riser in a centrally notched hale. A finite element analysis of the super-scale specimen
was then run to determine correlation with the transducer response. This analysis Is reported
In detail in Section IV.
45
(T
prr
R
, c 1 TRUE NOTCH STRESS & STRAIN
0.R' {R RESIDUAL NOTCH STRESS & STRAIN
, NOTCH STRESS & STRAIN RESULTINGFROM A FAR FIELD STRESS 'S'
NEUBER'S RULE STATES
(a. C R) ( .Kt K K(K" E E
IF THE RESIDUALS ARE ELASTIC
cR
(KtS) 2 (o'i - cR) (E _ )
Figure 21. Residual Stress Calculations Using Neuber's Rule
46
I I i I I i i i i i ' I i i -i -

ri
I'
!,,i\i
40V1uJ
.- 20 K'.Lfl
•,N~~~1 i 0/ " ."°z2
Uj
30 TRANSDUCER .7 ' ,AV)-
I, " /
Ln 20 /10
0.005*- NEu(ER FoR K 0 3.35 (RoM .RANSDUCER)
r.'70.10.000I
r (STRAIN)
Figure 22 Nouber Analysis 2nd Super-Scale Specimen
': .1.

IF
II 40
*FINITE ELEMENT
;" NEUBER
"30"/
20 NO.005 x 10. 3 x 10⁶
t 17.200 . 2.994
10
* ANALYSIS FOR SIMILAR SPECIMEN GEOMETRY
0.005 Strain 0.010 0.015
Figure 23. Comparison Of Neuber And Finite Element Analysls48
..A.1

3.4 EXPERIMENTAL TECHNIQUES
The following paragraphs discuss the test techniques used, details of the strain transducer,
and the strain data recording system.
3.4.1 Small Scale Notched Coupon Tests
A quantity of small coupon specimens were cut from the test material and machined to the
configuration shown In Figure 13. These specimens were tested at room temperature in an
electro-hydraulically controlled closed-loop servo system, Interfaced to a computerized
two channel load programmer. In order to maintain consistency throughout the test program
all specimens were laterally supported during fatigue loading. All small scale notched
coupon fatigue test data are reported in paragraph 3.5.1.
3.4.2 Super Scale Tests
The super scale test specimens were cut from the test material and identified in relation
to the sheet of material used and the precise location within the bheet. The specimen
configuration Is shown in Figure 12, All tests were done In an electro-hydratilically
controlled closed-loop servo system, Interfaced to the same computerized two-channel
load programmer that was used for the small scale notched coupon tests. An aluminum
alloy frame fixture was attached to each specimen to provide lateral support during
compression loading. A typical test arrangement Is shown in Figure 24, The strain
transducer description, calibration procedures, strain measurement and recording details
are discussed In sections 3.4.3 and 3.4.4.
Two super scale specimens were tested at +1600F, The test setup was similar to that
used for the room temperature tests and heating was provided by "Briskheat" heating
tape, wrapped around the support fixture as shown in Figure 25. The specimen and end
fittings were then wrapped with many layers of plass-cloth In order to confine the low
level of heating to the specimen. A low heating level was necessary to prevent damage
to the strain gages on the transducer. Copper-constantan thermocouples were attahed
to the specimen with aluminum-foil tape. Two thermocouples were used, both were
located 0.40-inch from the hole wull with one on the centerline of the specimen length
and the other 900 apart on the centerline of the ipecimen width, Power input to the
49

SpecimeniData ..... ,j --- ' W ithout
Lge Support
Fixture
""" p
ChartRecorder
Sat-up for Room Temperature Test
Specimen with Support Fixture tn Place
Finure 24 Typical Room Temperature Test
Arrangement for Super-Scale Specimens
50

A
Super-Scalu Trist SpecirmwnWrapped with Heateri Top
Gloss Cloth Wrcp
Fiquro 25. E Iovcatuc TEo1ptrcnturo 'lost Set.. Up
51

heating tape was controlled by a manually operated autotransformer and specimen
temperature was monitored on a multichannel strip chart recorder. The elevated
temperature test setup is shown In Figure 25.
3.4.3 Strain Measurement
Strain measurements were made on all super scale specimens with a specially developed
strain transducer that was located In the specimen 2.0-Inch diameter hole. The trans- ,
ducer is shown In Figure 26, and was fabricated from 0.125-inch thick 7075-T6 aluminum
sheet material. The design is based on a NASA self-supporting strain transducer,
Reference 4, and allows measurement of large strain changes under repeated loading.
A pair of surface contact pins (I & 2) are held in Intimate contact with an area of high
stress concentration (3) by spring pressure acting diametrically In the hole. Pin (1) Is
held rigidly while pin (2) is held by a flat cantilever spring beam (4), Instrumented with
electrical resistance strain gages. As load is applied to the test specimen a chanoe In
strain causes the gage length (distance between pins I and 2) to change. The movement
"[ of pin (2) relative to pin (1) then causes the spring beam (4) to deflect which in turn
produces an electrical output from the strain gages. Applied load also causes dimensional
changes to the hole diameter which then changes the stress level in the spring beam (4).
It can be seen from Figure 26 that a vertical displacement of pin (2) will create a loading
moment to the spring beam (4) and produce additional changes In output from the strain
gages. This unwanted output is cancelled out (or nearly so) with a suitably attenuatod
and opposing strain output from a secondary spring beam (5). The transducer has two
sets of contact pins and also two strain paqed cantilever spring beams. The gage length
of the transducer contact pins is oipproximately 0.080 inches and the output from the spring
beams are combined to produce an average strain measurement over the measured average
gage length of the contact pins. The strain transducer output is then amplified and condi-
tioned before passing through a special data logger system, described In Section 3.4.4.
Sudden specimen Failure was likely to disturb the calibration of the highly sensitive
transducer, therefore calibrations were performed prior to each test. Each calibration
was performed in a certified Tinlus Olsen calibrator equipped with a specially designed
mounting attachment for the transducer as shown In Figure 27. The attachment consisted
of two plates with each plate having a semi-circle cut Into it on one side. Each plate
was attached to the calibrotory column (one on the movable part and one on the fixed
52

STRANSDUCER
INSTALLATION
STRAINGA GE
LOCCAT ION
~5
DETAIL. A
Figure 26. Strain, Transducer
53
....

Fic~mui 27. Thiuk is )on Cu IiIbrctor With,
54

part) such that the two semi-circular cutouts formed a complete circle of 2.0-inch
diameter. Movement of the micrometer 3crew on the calibrator would displace the
movable column and change the diameter of the circle. rhe transducer was mounted
In the circle and calibrated to establish strain gage output for known contact pin dis-
placement as shown in Figure 28 and also for known diametric changes by repositioning
the transducer as shfwn In Fsgure 29. In addition to the pratest calibrateon, provision
was made for performing periodic calibrations as required during test. This was achieved
by switching in a fixed shunt resistor havInq a value that was related to a known trans-
ducer displacement. This relationship was also established during the pretest calibration "
of the transducer.
After calibration the transducer was carefully positioned In the specimen hole and the
"four contact pins were "bedded-down" by applying light pressure to the free end of each
pin. A binocular microscope, equipped with a calibrated Filar eyepiece was then used
to accurately measure the contact pin gage lengths from which an average value was
determined.
3.4.4 Continuous Strain Recording
Continuous strain monitoring was achieved with a peak data logger system. A block
schematic diagram of the system Is shown In Figure 30, It consisted of a two-channel
multiplexer, 12 bit analog to digital converter, 8 bit microprocessor, and 7 track digital
Inctemental tape recorder.
High level load and strain inputs were fed Into the system but only the positive and
negative peaks were detected. The strcin peaks were compared with previous data and
If the current strain peak data had deviated by more than a pre-selected percentage from
the last recorded peak data, the new strain anJ corresponding load peak values were logged
on the recorder along with an event number. The event number was computed by counting
total cycles applied. During programmed hold periods the system recorded load and strain
data whenever the latest strain data deviated from the last recorded data by more than the
pre-selected percentage. In this case the event number was determined by counting the
elapsed time in seconds from the beginning of the hold period. The pre-selected percentage
for data collection or rejection in the system was intended to allow collection of only those
55
___, ,____,___,____, ,____,______......______

. t. " k40
¶110
I.-P
v rw l !rMour
' 1,6 , k li ! o

�
[ .. a. Pr
"q r
a ,., � q
.1 ';'4''t-•- 2 "'•tu� �
'1
1.
.1 � �

Z CL
0UU
ULii
.0cO
00
500
00
Is-
U..2
-II-t/l~
580
66 -J

data having significance, Tostinq was accomplished under load control which in general
is accurate to one percent. Data rercording, however, was under strain control, and
a one percent change in load for some casew would produce n greater percentaqe change
In strain. Generally, the pre-selected percentage was sot to allow changes in strain of
± 110 mlcroinches or greater to be recorded on the magnetic tape.
3.5 COMPLEX SEQUENCE TESTS
The load-time-temperature test sequences discussed in Section 3.1 and Illutrated in
Figure 1 were applied to thirty super-scale and 18-notched coupon specimens. Twenty-
ieven of the super-scale specimens and all of the coupons were tested to failure. Three
super-scale tests were to evaluate cyclic and time dependent creep only and were not tested
to failure. Failure data, strain histories, crack growth data, und frac.tographic analyies
are presented In the following paragraphs. Data analysis and correlation studies are
included In Section V.
3.5.1 Data Presentation
(a) Failure Summoay
A summary of the fatigue data for the super-scala and notched coupon tests Is included In
Tables VII and VIII. The super-scale summary includes sequence, specimen identification,
cycles to failure, cycles to crack initiation, and for convenience in comparing data sets,
the test conditions for each sequence are included. Refer to Figure 1 for a complete desctrip-tion of each sequence. The residual strength data in Table VIII is from 3tatic tension tests
after cyclic loading when fatigue runout was encountered. Cycles to crack initiation for
the super-scale tests Is an accurate indication of the onset of macroscopic cracking and
was measured from a change In the magnitude of strain recorded with the transducer. In
all cases, these strain changes were apparent before a crack was visually observed. In
these tests, failure Is defined as complete fracture of the specimen or Fracture from the hole
to one edge.
This series of tests was started with Sequence I to simply define the stress-strain state at
the stress riser and time to failure for constant amplitude cycling. Then in successive steps
the test complexity wras increased by adding overloads, underlonds, and periods nf sustained
loadinas. The intent was to determine relative efferc., of sequence variation and to measure
and quantify strain relaxation and/or creep.
59

01 00 a,oN NO 0. 0o
n N -0
CN N
I - <w u 'u
- §
-, 0-
Uo '0 §
u~0,
0I- m' C9 *, 0'10 ~r, III I NC 0 N L)
Z) Z 1 7 C1N (1 -1 I N
0c 0m . CN V' N,ý U" -0 N CO 01 0 ~ ,
(~60

U
0
>-~ LLL C,4 .
U. C)
UV) Z u
Z 0
A c U c
0
zb L/)ý) .
CC
6. 61

TABLE VIII - NOTCHED COUPON TEST SUMMARY
Sequence Specimen Cycles To Residual (I)Number Ident. Number Fai lure Strength
1 2E-2 103,620
2E-3 270,910
3B-1 96,290Tq) Ave.
6 IE-1 1,606,590 NF 85.9 KsiA 3B-2 2,387,950 NF 84.6 Ksl
3E-2 1,763,820 NF 83.5 Kit
8 IE-2 368,523
IE-3 1,435,400 NF 83.3 Ksi
2E-4 997,333W 3 Ave.
14 1E-4 398,280
3B-4 745,326
113-3 506,06154,8 Ave.
22 3A-1 45,006
3A-2 48,611
3A-3 37.23243,66- Ave.
24 3E-4 49,698
IF-I 40,864
3A-4 43,714____W " Ave.
(1) Residual strength tests ,un on specimens which did not fall In foftig'e,
62

Several pertinent data trends are evident from the data in Tables V!; and VIII.
(1) Application of Initial tension overloads and/or periodic tension overloads
significantly increases the specirtiol fatigue life as compared to the baseline
Nt.• constant amplitude testing, The single one-hour sustained overload in
Sequence 2 does not produce the some magnitude of Increase In life as the
pe-lodlc overloads In Sequences 6 and ý, however, Both the notched coupons
. nd super-scale specimen For Sequence 6 were cycled In excess of 1.5-'mlIlion
cycles with no failure and showed no reduction In tensile residual strength when!.• i tested statically, •
1t (2) InHeal campretion underloads, either sustoloed and/or repeated periodically,
',, : result In redua•,p the baseline constant amplitude life. Thi.s Is illustrated In !
Sequotrces 3-5 and 26 and 27.
(3) A compressive underloacd Immediately following a tei,sile overload tnds to Miagate
the beneficial rosidual stresses resulting froe,. the applied vierload alone. By
Including the -7.9 Ktl tndr-load imniediately following the 47.3 Ksi overlocod the
'ife was reduced jppraximately seventy percent from the case with an overload
only (Scqumnces 7 and 10). In general, the fatigue life decreases as the magnitude
..• the underload Increases. This trend is shown in the compeirison of data from
Sequences 8, 9, 12 and 22 for cyclic periods between overloads (N 0 1 ) of 15,000
cycles. The same trend for NIoL 1000 cycles Is shown in Sequences 10, I1,
and 23.
The trends discussed in ,i) through (3) have been reported by other Investig.ators; however,
qualitative stress-strain data has not been available to model these trends and this program
was rurF to attempt to obtain this neces,,ary experimental data. This will be discussed in
more detail :n subsequent paragraphs.
(4) Including a sustained load hold period ;mmedlately follo.ring the compressive oadding
results In a further life reduction. For example, comparing S1equences 8 and 13
shows a life reduction by a factor of 5 with the hold period inclucied. The reduction
63

is not cs pronounced with hold periods (t -15.8 Ks!, however. There is some life
reduction fur the 24-htour ti.,Id pi'rd wl,,ie N 0 L -- 15,000 cyc les (Sequences 9
and 16.) bh t nio .hIiunrcle for N(. 1" • 1000 .yc.h--s (Sequences 11 and 18). A sustained
24-hoar hold at -7,9 Ksi, whiclh is t, p iic(Al for o transport wing on-ground, has
substuntirCJIly nuqo~tad the beneficial effects which were introduced by the tensile
overload. This time dependeni reluxution/creep is a crucial part of understanding
and modelinq notched specimen fatigue life. A further study of thit phonomenci
was done in test Sequences 28 and 29 which are discussed in subsequent paragraiehs.
I-.1d times tit thu flight ni•coi (15.8 Ki) did not show ain effect in either increasing or
reduc ing spuicmun lifu. lbhis ,.an be seen in caiirpciriig Sequences 22,24 and 23,25.
,(5) I gener&, sequences with N1 1,0000 c.ycles resu I ted In shorter test lives than
identicol sequences with 15,000 cyclus lutwuven overloajds. This is illustrated In a
coirnpurison of Sequen(,es (6, 7), (8, 10), (9, II), (14, 17), etc. Only one sequence
pair (1.5 und 18. viokites this trend. Tire IeduceUd life moy be attributed to the magnitude
of uacch major cycle (-7.9 to 47.3 Ksi) reptuled more frequently with the shorter NOL
period, but conclusive d(atu to ihis ufloct has not been developed. On thko other hand,
Patter, in Referenc,'e 3, has shuwn thu.lt tit, [end with decreasing periods betw~en
overloads is an incirused life,. 1he dtit,. hec aappears to contrudict Potter's date;
howue,/e there is instifficient dutu here io show this is the -case. Additional overload
periods should t- tiv luicilu ad IL)i .-liur usil.lsh • a:dato base for ancalytical I modeling.
The•e nr•y be cyi.l i t. oxalion ororllI• idit t, u sh iies l er which also r.'ontribUted to the
increased lift! with t lieu Ionoer 0vei la,,,ud p Sio.i,
(6) Fo• U.l, e s(I13I , I.|), (16, 1/), (i! (zŽ0, 21) 1hoi 24-hour hold period resulted in a
shiorlui lif,- thMlo tle t ,UriU.• li:u will IhL (,, o eo howr hold period. It wa . noted In (4) that
eua(h snqLom. wit -l1 .- ,tst ilried Io;mih ,l it - .') .si resulted in significant life reductions
c'onijpasred tl s•ec•,•nL ,,s Wit hot the sust. ined loatd pei lad. Thls data is rtn indication of
(.reep follwiinl ti l rust) u dehiriiuIion (i t tli sira,,, ri-,ir due no the tensile overloads.At -15.8 Ksi thL, t10 1i s Is, rUveis:u ; ' l,, i;e sinortei hold period results in a shorter
lift! (us i t)i,, IL.es W -ind 1Y. Al. ,, thee is rru:,h luss voriroition in life with and
witlhout thu -15.8 sustuino, i l ,t tl I id I i,.: is k .,,th ilie -7.9 arcid acs pointed out in (4).
664
--- .... ., ..

No conclusions have been drawn about the --15.8 K6i data and additional tests
should be run to evaluate the trends here.
An additional study' of the creep cit -7.9 Ksi viws run and these dataoi al reported
in paragroph 3.5.2.
(b) Load - Strain Histories
Thu strain response for the transducer was ccontinuously recorded during on'.1l tes5t
sequence. These data have been platted as tirrie histories 1%-)r 1t, ical seqce~~rCS
in Figures 31 through 43. Maximum and minimnum notch strains ate illust-raied for
4 the major over load/under load cycles along with the Lipper and lower strain limits
for the constant amplitude cycling. Each noiojr cycle is identified by number.
Mean strain was only recorded before and after each block of ronstant amplitude
cycles and a dashed line Is shown connertinqi these two data point%, The constant
amplitude limits are shown as a dlash mark (it the beainri ng , mtidl pci it, and end 1
of each block of cycles. All of thie data shown were recorded over on 0.080 , aie '
length Inside the central hole In the SL)[,r scaile %pecimens and are considered typical
of the data recorded.
Several trends are obvious from these time historlc, For example, in oach sequence
there is a chanqe in the recordad meain strnin during the blocks of constant amplitude
cycling. Also, the major load cycles, ovorloods and under ioads, affitct a change in
the mean strain. There is a m in itnum hancge in the pooak stra inr during any ~.e(,ence
and little change in the constant amnpi it udc penk Ntrain until uinder lood-s of -25 ksi or
largqer are applied. The more significant tirtev cepandwnt channes which appear ore
the changes in the mean strain, midntimm constont aimpl itudm,, stirnins, and the MinimuIM
strain associated with the LUnderloads . These cire moro pVoI)nouncd with it~craosing
underload also.
It was pointed out earir er, that the sequeinces il1 000--block cyclic periodls rtesultad
in shorter test lives than the sequienc-,.s wi th 1 5,000 cycle baIor k5 . Sequenc.es 9 and 1i1
(Figures 32 and 33) are typical of the dota rncanrded for fifteen-cued one- thousand
cycle block tests. There is a greater rate (if O;Iianqo in the mecin and minimnum strains
for Sequence I11 (1000 cycles) which may eoff.r sonuie insiciht rinto explainingl this
phenomena,65

....... _____________ .-..----.-.-.-......
( '1u (IJI H0O
66C
'.I \
SI-
I -
'If
~o1
/
- - .-\
CI
I)I
I. i*,z\
T ......... _iI•nh:n: fu un .i• .i...ir

I I
-cl
I U I
U.J
I Z U
! , 0
.4o
,..)
(-5------
(67
, I I '
-1 __...-----7' - -• .-- -----..-..... L' °" ' (N
• t 2•
(N , )

I-. I
INN
i;.jI Li.
I H "
\ i g, ,
r .2o
- - - ____|_V
4040N
68..-\C, I... , i
,./ tu__~ ~~N
to8K4 E'

r -' -
V4)
U
Uo�.
U-z -
0z0)UC
0IA
0
I.-
0
4)
0)U-
___ I
-0 mi-siOki
0 S (U�/U�) U�DJ� '�-'U'
69

r...Du.
LL
Iz
I I I
(Ul~ -l IJ4 0C
a7

t..l
IfI
LUUC)C
u 10-14 i
71

Iu I
LL~
zz
C)
LL
I u/l ulrJ4 44O
726

N
z
AL
V) C14
(ul/ul 4D40
73I

il
If)I
( Ul
00
7 4
•'• •
.,o • . ,

Cil
(NZ
.- I LL.
z
(NC ___ ____ ___ ____ ___ ___ ____ ___ ____ ___ ___
(Ul/Ul U104 qOvO
75 .

.- 4'
CIAu
767

I--!
UC
(I U-)
770
. .........

crr
C~I
UC
NL
(Ul/Ul uj~js p4-
78z

The sequences wl th hold times at the compressive loads have shown evidence of time
dependent creep during periods of sustained load, This creep is more pronounced in
file 24-hour hold periods than during the one-hour hold periods as illustrated in
Figures 35 through 37. In each case there Is creep Indicated for all five of the 24-hour
hold periods but only during the first of the one hour hold periods. Again, earlier
discussion had pointed out that the 24-hour hold period resulted in a shorter life than a
one-hour hold, except for the -15.8 ksl sustained stress, and this data tends to sub-
k' stantiate that trend, Another observation is the time dependent changes in the constant
amplitude strain limits In Sequences 8, 13, and 14 with and without the sustained under-kr ' "load of -7.9 ksi, Without a sustained underload (Sequence 8) there is little change In
the constant amplitude strains; but, following the hold period in Sequences 13 and 14
f there Is a definite trend toward more positive strain limits. This again substantiates
the shorter life obtained when the hold periods are Included In sequences with -7.9 ksl
[ underloads. In Sequences 9 and 15 with a -15.8 ksi underload, the trend is different,
however. As skown in Figures 32 and 37, there Is a change in strain with or without
the hold period. Sequences with the -15.8 ksl underloczd did not follow the same trends
of significant reductions in life with hold times that Is quite apparent with the -7.9 ksl
underload and this apparent strain change way be a partial explanation of the phenomena.
There was evidence of creep during the hold periods at negative loads; however, no
creep was apparent during the sustained loads at the flight mean loading conditions,
This is illustrated in Figures 41 and 43 and reflected in the times to failure for Sequences
(22, 24), (23, 25), and (26, 27).
In addition to the strain time histories discussed above, the recorded load-strain histories
for selected sequences ore Illustrated in Figures 44 through 52. The firs, and third major
load cycle is plotted for each sequence shown. These curves do not include strain data
from the constant amplitude cycles or the sustained loading periods. This data does Illustrate
ýR the time dependent changes In mean and peak strains discussed enrlier. In each case, the6 new origin for Initial loading for the third cycle Is indicated as point A.
3.5.2 Creep Studies
As the experimental program evolved it became apparent that there are significant effects
of the creep during the sustained load periods and this does effect fatigue life.
i! 79

I-V budj~ Cy. u
60
-CL
p.a.
20
00M(,0041 0.008 0.0 12 0,016
3 ~Notch Strriin in in
.,gur 44. Recorded Loci Strain Data Sequence 6
os
I 80-
I/,

kI 0t batd Cy In
- - 3rd Land Cyclu
60 / 'A / /
C 4u
A/
201
m"
/-4:F' 20 /!
-0.004 .- 0.004 o.8 o.01.,0 11
,•. -20
Figure 45. Recorded Load - Strait Data Sequence 8
81

r
3rd Ltald Cycle
60 /LICL
"20
, //
f •//
-0 , 00 ., 0 4,0 0 8 0 . 0 1 2 0 ,0 1 6
N.,tclc Stranh in in,1•
-20
-40
/Flqure 46. Recorded Load - Strain Data Sequence 12
/8
../....

80
)i L.ad Cycle
3rd J.ood Cyelo ,
60 /
L.x
0 o. o
I20 "
V.. !
-0.004• 0.004 0.,00 ,1 0.,0,6
N dci, Sirain in in
-2)'
Figure 47. Recorded Load - Strain Data Sequence 13
'1
• 83

BUI
15t L.,od Cyclt
3rd L &Od Cycle
60'
//
q 40-
/.///
-0. J04 O,0o4 0,0OO5 0.01l2 O,0i6
N/id Strolr in In
1'1
Figure 48. Recorded Load - Strain Data Sequence 15
84
* .. * -~ *, ~ .... 1I

80
S 1 t L ,ad Cycle
S... 3rd Lo rd Cyrie
60 60
Ki
a--CL
40IA20
-0.004 0.004 0.Q. (,1mm
Nth Stro n it) irl
-20
Figure 49. Recorded Load - Strain Data Sequence 21
85.,.~ . .

'I
i.i
I Loal Cyc • .
31( L.,cd Cyclo
60
"A /86& 460 /;
20 7/0
//
j. /,//
/ -2
//
/I
-I.
Figure 50. Recorded Load - Strain Data Sequence 22
86

-11 ,,[ . ,1 cr>I, ,-P .... •
'3- •: .- / //
///
/ ji',
A ',3 "
'3 / /
7// / /
/ /
//
S/
/(
At..
jI.
Figure 51, Roc-orded Loadr - Strain OData Secp-ence 24
87

40
A
20 /+"I: /
"Notch Sra'cih fl in in
S-0.01e, -0.i,2 -0,008 -0,004 0.004
-20
///
// / 40
gt I
/ C,/
Al
/ *2I/
/ -60
//Ir -~d C lo I
I., L C,,,I clu-
Figure 52. Recorded Load - Strain Data Sequence 26
88

Two sequences were run to obtain additional strain data at the stress concentration and
to define a distribution of strain across the net section of the specimen. These tests are
identified as Sequences 28 and 29 in Figure 1. For Sequence 28, the tensile overload was
applied, then the specimen was held at the -7.9 Ksi stress for 24-hours. In Sequence 29
the tensile overload was applied followed by a -32.5 Ksi underload and then held at +15.8
Ksi for one hour. In each case the transducer was Installed in the hole and eight strain
gages were located on the specimen surface as illustrated in Figure 53. Data was con-
tinuously recorded from all nine data channels and Is listed In Tables IX and X.
The strain distribution across the specimen Is plotted In Figure 54. This includes the
transducer and strain gage measurements at the start of the hold period and then at one-
minute, one-hour, and 16-hours. These data definitely confirm that creep Is taking place
Immediately adjacent to the stress riser. Strains Inside the hole, as measured by the trans-
ducer, are decreasing from 1130 p., Inches initially to 980 g Inches after 16-hours, However,
data For strain gages 1, 2, and 3 (Figure 53) show a significant increase In strain adjacent
to the hole. There is a 1000 /, inch change In strain recorded on Gage 2, located 0.15-
Inches from the edge of the hole, Figure 55 illustrates the time dependent creep data
from the transducer and Gages I and 2. Also included in this fig,..e are the recorded strains
after unloading the specimen. Apparently, the strain and associated stress changes shown
here are of sufficient magnitude to result In differences in specimen fatigue life with and
without the hold periods in the test sequence, Test life is signlficantly reduced when the
hold periods at -7.9 Ksi are included as discussed earlier.
Since only strain can be measured directly In a test such as Sequence 28, changes in
stress and subsequent effect on life have been hypothesized as Illustrated in Figure 56.
In evaluating Sequences 8, 9, and 12, for example, it Is evident that the reduced life
associated with Increasing compressive load magnitude is dependent on the notch stress
limits during constant amplitude cycling and not on the strain limits. Therefore, it Is
hypothesized that during the sustained load periods when there is strain creep there must also
be a stress relaxation such that subsequent constant amplitude cycling will give a shorterlife than expected without the hold time included. In Figure 56, a specimen loaded from
O-A-B with no hold at B would cycle between the limits C-D. With a hold time at B1 I and the known reduction in notch strain (Table IX), it is assumed that there is a stress
89

2---2.60 -" -- 2.20
1.300. 80
0.40-o0.25- 10. 15-0.05-1-
.56 78
2
3
Figure 53, Strain Gage LocationsSequences 28 and 29
90

co.
4)C4
.00 S -
I LM
* -C
Nt~ CO
~ ii0 C.) I
01 x UU 11Spise
C--
91.

CN4
C3
ol~~I X '-K-U14
92 1

A
D0I//
Cl7"
/ c
o NOTCH STRAIN
I-
Figure 56. Hypothesis of Time Dependent Stress-Strain Change
93

0 0 0 00 C 0 C
0 0 0 On0 Lr Ln W0 to0 o L)
"n .n 'n n L L n o L
LU
V))
(D
uJ
U.ca
(N0
aa '- - - C4
4)4

00 (N (N (N4 (N (
CD C) C1) (*ý C)
(4 C14 (N 'I ' N
'0
(CN C)-
A L U) 10 10 It) a0
u* aý 0 C0 0 0CN c
Cl*
L) L/I
tAO 0
LLJO 1 0 1o .40 10 '0 100 Uj (N4 (N (N (N C14 C1
0L ~
LI-
x~ UN C N0 CN C
E T.
95

relaxation from B to B'. Subsequent cycling will then be between C' and D'. This will
then result in the decrease in life shown when hold times are included in the sequences.
Additional experimental studies and finite element simulations are planned to further
evaluate this phenomena.
3.5.3 Crack Growth Data
Initially It was planned to record crack growth data for all test sequences, but this was
deleted as the program evolved. Accurate measurements were difficult to obtain as crack
growth was ,ery rapid at the high alternating stresses for this program. Crack growth was
a small percentage of the total life to fracture. The limited data which was recorded is
listed in Table XI.
3.5.4 Froctographlc Studies
The strain transducer when installed in the hole, has four contact pins which are Inbedded
into the hole sidewall for support. These pin marks were not thought to Influence specimen
cracking; however, several failed specimens were evaluated to determine if cracks did
originate from these marks. Fractographic study results for two specimens are shown In
Figures 57 and 58. In Figure 57 the crack goes between the pin marks and Initiated at
the corner of the hole, Figure 58 shows a crack outside the transducer pin marks wh ich
started from Imbedded flaws In the hole sidewall. These are typical of all failures and no
failure originated from the pin marks caUsed by transducer installation.
96 ••

KI
K ~LE
0 0
040 u
C4)
0 Ltn f
LU
-j IA I 4) d
0I C5 DA C3 D C> C)
0 Os0OW C
6.UC
D 0)
4) *) u
u1 -. u, u u v u -

I1 3
irl)ken Ipd e LIE-4iI r
98

K%
Fracture Surfuce With I-le Crock COricin
Lucat ion Notod By The Arro~w
Ficlure 57. (Con c Iud.KI)
99

AMA
.1 7X
,m.
Y Broken Specimen 2F-1Ito4•
"" nJ~i'•*V''(7
la3x
Transducer Contact Pin MarksOn The 1oloe Wall
Figure 58. Fractoqrophic Analysis of
Specimen 2F-1 Fa lure
100
A_: J.•

rA
'7j0.,
LL ) (iw
At 01
W1 Wiw

SECTION IV
ANALYTICAL
4. I ANALYTICAL PROGRAM
A conventional fatigue analysis which uses notched S-N data and computes an accumula-
"tive damage based on the Palmgren-Miner rule neglects many parameters which can have
an effect on fatigue life. The parameters and their effect are generally understood but
have to be discarded for the sake of economy. One such parameter ii the sequencing of
applied loodsý H. Neuber in his paper, Reference 5, presents a theory which makes it
economically feasible to Include the effects of load sequencing In a fatigue analysis.
Fatigue cracks originate from structural discontlnuitles such as fastener holes. The dlscon-
tinuities cause stress concentrations which are usually large enough that the material
becomes plastic when the structure is subjected to normal aircraft operating loads. Upon
removal of a load which has caused plasticity, residual stresses become locked into the
material, These residuals are additive to the stresses resulting from subsequent load appll-
cations and In the case of fatigue they alter the mean stress and hence the damage caused
by subsequent cycles. An analysis procedure based on Neuber's theory calculates the peak
elastic-plastic stresses In a discontinuity (notch) which includes the residuals from previous
cycles.
This report presents an analysis procedure which uses the stresses resulting from Neuber's
theory together with unnotched S-N data to calculate a damage based on the Palmgren-
Miner rule. The analysis, which is in the form of a Fortran V computer program, Is based on
algorithms which simulate the following three phenomena:
o Material response
0 Notch response
a Damage predictions
The algorithms, and the development work leading to them, are presented In the following
sections.
102

4.1.1 Material Rosponse Characterizution of 7075-T651 Aluminum
A study of the cyclic stress-strain response resulting from the strirul control led tests G.)I
through GJ37 is presented in this section. The purpose of ti is study is to churicturizu ,the
cyclic response for /075-T651 alurinurilm both luring hurdening and in the stulla . ('0 1 ditioll.
When a material is cycled between fixed strain limits, the increment of stress required for
each successive cycle will initially either increase or decrease depending onl whether the
material is hardening or softening. After a number of cycles, which depends on the strain
increment, this hardening or softening stops at which time the material Is said to Ibo iln u
stable condition. The strain controlled tests GJI through GJ37 show that 7075-T651
aluminum both hardens and softens. The response ]or four of these tests is plotted in
Figures 59 through 62. Shown Is the initial loading curve called the monrotonic Iouns
curve and the initial and stable cyclic curves consisting of an upper and lower branch,
The stable cyclic curves for those tests have been superimposed in Figure 63 and a line
plotted through the peaks. This line defines the cyclic locus curve.
4.1.1.1 Stable Response - The algorithm for simulating the stable response of 7075-1651
will be based on the assumption that when a material Is hardened at a purticulur strain
increment it is in the hardened condition for all higher increments. From this It can be said
that
(1) The stress and strain will always expand along the cyclic locus cinrvO.
(2) Excursions from the cyclic locus curve, for intermedi•te loadings, will follow
a branch curve.
In reality there are an infinite number of hranch curves, the particular one that is followed
being dependent on the previous loaditig history. To efficiently represent thle response, it Is
necessary to characterize these curve% into a conveniently usable form. For example, the
cyclic locus curve can be charucterized by the Rumberg-Osgood expression
n
103

':1C
0
II-.
6
0
S
:1'V IU-
U
z)
41 - 0z Ni
C,
��1
______ 0
I-
I.'-o
-IU'
U'
=
It,
6
4 0�
.4.
104
* - ,, . '***I.* *
III
*1 �*
.9,
I,I,
,I�.
5 I,
I . I -
'I K:I: o
* ,,I L
........... ,u, �SjU��
I. * I .1.I I
'I * '*I I I .
I-,I..,. Iz��
K .
* I
** , .. I
F;
I . I
I t . . , . . * I ,I i . .
I.
105

I 4
II
, I I ii106

jai :7144Al
ol
~g ,107

r11In (issit~ii'S thoi cull 1 i. .1' ''- cii L]'! .1 ildl c, ...1 hiki I , liii t bii ut muagnified by
(urIC fotar of 21 i .1.
whlorei supurci cipt B wdurs lu k) oncli C.tIII
Consider the stub Ic cy>'c. I ciirvas p ott ad in Figuarl 64 wvith theIr lower tips matching.
Obviously nona oF thu i~j4~)ui 1)1 un..h5, ais 1hey leave thu c~yclic locus curve , are aim;ilar
nor arcj any of hormn 1-~u 111(1 L.theCycHI IuiAib CiJ0vi] iuicigiiifltid by> o fuctor of 2.0,
ihansoleci, In Raferencai 6, chol tIoritas a inciter a I that cxhlbi ts this phenomenon as a
"Nm asin'IuctrL lnioc llS however, suggelst that these branch curves are
14 ~ ai sintar It anl 0IrUIppruprl h l~itlis hut ) ki I iiiad' a.)long file linear a lope. Th is has been donek ~Icc Figuri 65, wkth i u. hows. H ilo ilii. qqtio hiauimlues, att tliay leuve th cycl~Ic locus curve
~fo I?0 ~7!5--1651 ccll'ciiiii'i, , on IW .IiiiliiIO'lJ I b"d y ci 5scIYU iglyu..v
A sinclicur study i ilii: I-. mc to ii lit., I .. I . on)is l Oa IS Sh'.iwci ci Figure 66, In
which theu utiulc tipls 'cirt' ciiiii..it, )bvliisly , sluiuu thu uasIistl iiojcilli o re not the
VciIij Ilk) cuiiioiiiit Mt tr"Iis lictIon Lilia cj liii I iiiwcr Jclipu Yill innala the ecirves match.* There-
faro, cans idor a bocSI, v luwer I'i icicl circa
c~ilci Ilcl ic hc1 I b hjriC .iii c ,ici' ciiP SIi'll licis tih s1a'ci u lust ic acodulais 'E ias the
loCtUS ricr-vc. No4w, o.ilI~t lypLa ltj II, cr ~rccthcre
IiI~III 11318)(2)
docfflc Ind Illt l ctiwu Il~ i i ' liiI ' t l .l ccl '1111is litib ci o rust I c Iclo&i Ilus Ot 'E if
Iliu rlrig Icc cit Ilii 1 I . 1 ,1.i It ''t ki I._ 'liii .Ii Icet Ililiclul o iii l oii f thn, bas15c hcatch
Cilivil cit Iwjic-cIit ltiuiii 61/' Illo g u it it huiit'vuicii tho t~vo sysiclilis is:
(3)
hi LI [1 Itt 1 It 1
fTilo i Icustli ii: cat Idiiic Ji.. I
'III I(4)

IIS
110

".5
U=
110 .:: r • 'A
., .... .... . . .. ... .. , . . .. • :, : •, •, ,J. :, .,: :• ,, : . , : : . : . , :. . ,. ,: . : o . .. ' • " ° i :••'

k.
k
III
t*II t . .
II ... . . . t
I . .:
LI...3I 111
VI'

-h0
L.2
112

anddBB ES - (5)
IFrom (3) equation (4) can be written
driBBa dB(LB (6)
d cr B
4k,' Ithen as long as e and remain elastic eaicatons (5) and (6) giveB LB
d BLB -d B .B d -
Integrating• •B B =/ 1\Bc
CLB CB a " /U + C
Now whe BqBWhn cr E r
then
and
It will now be assumed that equation (7) defines the relationship between a basic branch
curve and the lower branch curve For the full elastic/plastic range. Then thu torm
(1 Ba
lines up the e jstlc slopes of the curves nnd the term
ispastranslation along the elasthc axis of the basic brnnch curve such that the nonlinear
B(B!i ~ ~portions match. To ,"erify this the curve rBI(a )- has bcen created from equation 7 for eaeth
of the five tests shown in riaures 59 throuqlh 62 with the translations alonq the elastic nxis
chosen to give the best match over the nonlinear portions of the curve. These are superimposed
in Figure 68 showing that a single basic curve together with equation (7) can adequately be
113

I.IA
00
LL
1141-Ja

IJ
be used to represent all the lower branch curves. Figure 68 also shows that the upper branch
curve Is very similar to the basic lower branch curve, Therefore, the single basic branch
curve shown In Figure 69 will be used for both the upper and lower branches, To use
equation (7), It Is necessary to relate the branch curve modulus E to the strain Increment
Ae/2. This has been done In Figure 70, using the lower branch elastic modulil from the
five basic tests. Finally, the branch curves are located In the basic s'ress-strain space by
requiring that they reintersect the cyclic locus curve at a magnitude of strain equal and
opposite to that for the point on the cyclic locus curve from which they started,
"From the above procedure the trace of ikh upper branch curves leaving the compression
segment of the cyclic locus curve and the trace of the lower branch curves leaving the
tension segment of the cyclic locus curve are defined. What is still not known Is the trace
of a branch curve when it leaves another branch curve. Although the tests thus for run are
not loaded to this condition it is expected that when a branch curve leaves the elastic
portion of another branch curve they will have the same elastic moduill. This meant thatthe upper branch curves will also have to change their shape. It will therefore be assumed
that the shape of both the upper and lower branch curves vary linearly between the basic
curve and the lower branch curve corresponding to the maximum A/2 thus far
experienced, see Figure 71. If the material has been loaded along the cyclic locus curve
to a strain whose absolute magnitude Is 1(A/21 then the lower branch curve would leave
the point P on the tension segment of the locus curve with an elastic modulus of fB defined
In Figure 70. The upper branch curve would leave the point P' an the compression segment
of the locus curve with an elastic modulus of E. Now, consider a loading from point P
along the lower branch curve to S. Then a loading from S will follow an upper branch
curve which has an elastic modulus defined as follows.
€MAX = P - a'P/ E B (8)
•MIN P'- , / E (9)
4(1 =(S - S / EB - 'MIN (10)
2 MAX - BMIN (11)
115

Q4.!
[i
'',
"" 4
116•

0 .1
I i
0 GJ6
9
0.01 0.02 0.03A (/2
Figure 70. Lower Branch Curve Elastic ModulUS
117

I'
I
4L
118

rri
rh~r - ' F. 12)
4 ~~~~Substltutlrng for Ate I, ,Q /L
B
or
E B : (.OSL~ 1i 2
Finally, Oth bt-rach curvoi, whun bhuy lucvu aniothear brunchi vurvu , (iru bc-utijd in liw
stress-strdin spacu by reqilring that thuy alway>s forin ciosud loops. Mowu spkc(.ifir'dI y,
hils cat) bu stalud by thu cond it ion that the brainchb curvu miustI Iniunaect tho or Ig;in nf
thu branch curvu t hat it lovum.
The camplIc I a igori thin for sinu lat irti thnt stubl) respiorsu of /0/5- T651I alumin umn ii
II lustratud in) Flquru 72., Tbhis uxtimp Ic procaukds throuqb th lefollow inq Steps.
* Assumro thrit thu mmorioali Ims bua-n cyt liIc hiicudoiud to point /4(Y0,0,02) on th1k
A'. 2 0.02
9. 29~5X 0 fromt FiqlUIo /B
P1 (9,0.02), Pl' (-9, Q .,02)
MAX 0.02 - Y0,000 9, 295... 10 0,0ol.)102
r MI-.21Y,0 0406-0016
Akr 0.01032 1 0.0106; 0.020i~9
m0 L itu l'I ofrn Ai 2 ) We) Ht( i t, 00/) , I,. 'iit ti s htii it . .t iiv: vii i hut it uk'SL! 1111"k)t1
l tIm i ni A t roind " inttjjjl T- jjj' lj 111J

C" �.,
A.
* .�
*1.
-4
L .1
A.
IN C'
.4
x
120
C- .-. . II.

6 + (-90,000/l0.4xlo6 )(10.4/9.295 -1),/.02099110.4x10 M 9.689x 1
0 Loading from B to C(84,0.016) along the bronch curve which hals an elastic mcldulus
of 9.689x 10⁶. The branch curve Is located so that it passes through points B and A.
Then -= (84,0.016) and the elastic modulus for the next loading Increment It
E61 + (84,ooo/1o. 40 10)(10.4/9.295 -91/0.02099 6[B 1 + (.016"+ O.01067)(10.4/9.295 -1)/O.0209 949x1 6
Loading from C to D(-78,-0.003) along the branch curve Yh Ich has an elastic
modulus of 9.449x10⁶, The branch curve Is located so that It passes through
polnts C and B. Then, S (-78,-0.003) and the elastic modulus for the next
loading Increment Is
* +(-78 000/10.400•0)(10.4/9.295I)0.02099 6 4
0, Loading from D to E(95, 0.03), The material It first loaded to C along the branch
curve which has an wlastic modulus of 9.544106. It then follows the branch curve
which has a modulus of 9.68910 6 and passes through points B and A. At Point A
follows thu cyclic locus curve to E.
A.e/2 w 0.03
B B.92x10 6 from Figure 70
"P2 (95,0.03), P2 ,' (-100,-0,03)
(MAX - 0.03 - 95,000/8.92x 106 '0.02087
rMIN .- -0,03 + 100,000/10.4x 06. -0,02038
0.020 87+ 0.020 38- 0.04125
Loading from E to F(-100,-0.03) along the branch curve which has on elastirmodulus of B.92x10 6 . Then, S (-100,-0.03) and the elastic modulus for the
next loading Increment Is
6[1 + (-100,000/10.4x106)(10,4/8.92-1)0.041251 6B 10.4 0 lO T s - -.' - 10,4x 1
V' 121

Loud 'rq from point r will follow thn basi c biranch r~ urve. which has anl elI sli
modu uis of 10, 4xiO6
4.1 L1.2 Cylic Hodrilricila and Softonianq- It is Firsl ilacrssury to raprosan i th trrii or~ nt
losIn a smilarc fashioin to t ho ~toh ib loops. Tho loop% nonrotirtd diuring t ho first ry Iri for
loui of t ho taits Ciro soporIrimposod :)n t ho lbmi c strb Ia branuch curve in Firj iro 73 witlh thIe
Lupp.)r brandies miatch ing . Also, a brisi r branch cur-ve licis beaen rletleoted for the in it ini I Fowor
hi-cinll Cut.%,( of wit h1 of the four lusts irsinct uoci0tioa 7 and arer suporimnposail on t ha baxsic brotich
~ :uryo ill rlaure 74, Flnur-os Y3 anud 74 sho.w t ho t he basic bruonch rurve cots ho uisod to repro-
%o-mt the ti-nosiratm pSi Illa uIrr way, it ks usod 1. t'o prosririt tile stab Fe loops.
Inl order to FiirIidv cyrclic. hardtnlIig or sot totidnIq l ti ': ystoresis loop fot quo analysis it Is
irircessoy to dlrflrr' ha11 rota (it which th hatinniaal hardons for acicli cyr: Ia Based on
-bSorwni lomi .,.f lIk hilly rnkorm.'dr'r yc:lie fitash CGA throughi Ci37 It Is 4i own that tho
limot'.Iiliq ti~f 10i5-- F "r r Iota itrum carn be adequately> defined by two iiliriple (:urvoi, Figure 75I
shows thri p klis of tiro pokik tatit Fn itrali vorsus thre rombur of fully revorsod cyc les For four (IF
thu totilst F romj tho so rllotý Flio rruriihr of FulIly ruverstid cyc les roqulrrsd to comp late I> hardan
ilm intorrrnarl ill 1.11 Fins how In iitw cind is plattud In Piqurci 76 versus tho strain Incoetiant
*ACj2. Also, fICI I Four''0 _"i flt,1 mrl onon't 'ACT Firlwearr thro conipictaly hardenud pruak
t'riristr''ss% (I.-nilit-, ,-.n illo (:V, Fir I n I ' O~') ultrI t11(j pririk noonriteato t onsiari struss
(IInts oil f~mi! twaotln Id. Fourc1iiv,) litive k- '' o'r-tinedF. I'lFr dclatr, Ioirits in lFihlou 76
hivE' I'auir i r lmIqii/o 'kFy ii11 11 rAid 1'Ao rimnd r-ip .Ft d lIn F Furn ;/. 11his shows lliat al
sincrln Ouvi r-criritnIfly idofiFrm lb' hind' k iirmkq r'ntu of /0j?,6! .651 llnnrufore', tiMs CLItVal
toqnothir w ith lhto. r~urvu ili Hquirrr /6, (. cIii I.'r tisc, tu ocr icu cita flt)m rinior rot of Iaranclo Fnc~
clc/Ari~ ue to fully ravursod cyc lo% nt airy strain incrumornt 'r '2'. Consildar an oxoripla
In whinln a spacmn F 0'r of ZOY-76' i Iyr FodIM hxrtwv.rtrjj 'ti~n Iri of o.(.1)2. morn
A; 2 C0.02
ni 7,4 from F~ifuri.l /6
1i I1 17.4-0.135 for thu first CYGIa
Ara 'Ar 17 0.415 frorn NorIr 7Y
l.a * the amtount r.f Fiardo ancj foi thun first cyncl is 4 1 .5TS''*
12?

4 7
IUt
.1.
K i -�
U'
U0K-c
U-'
U'
0�
U'
U'
I-
Ii)A U'
0C.) -
C
N
I..
U-
123
.......................................................................... **.�****��.

I' I,iI
L'
,, . IK2 I. -
IJ

r *1
LI
00 0 0
Ld 0
k 0
1251

>e
C'4coo0
... ..l- .
, -1
(N>. z
U I 4
•', _)o ©
"3~
L I !U-
U -

1.0
C GJ23
'1 0 GJ6
1.0
Figure 77. Normalized Hardening Cuirv(,
127

t :7A C. 6 Wi.L f orn II) .IAOI(. >'Ctu
iu thu amrount of harduning u.ftur thu sucond cyclec is 68.5%
This procedture it. based on tetits for fully ruvui,,ud cycias betwuen strains of equal and
opposile magnitudo. In reality, 1his very rarely occurs, the hysteresli loops being generally
offset a long tho strain axis. Also, Ful I bcurdning usually> results from loops of various sizes
Oind not Ironi locups of fixed size. In order that the analysis procedure may be applied to
thuso gorneral cond ition~s the following assurroptions will be made.
(1') 16K strain) incrurienti A L' usud ill Flqicur 76 is independenl, of where it is located
on tho stra in ox Is (I .o. moain strain).
(2) Hil inito nin rteutrin 'n/tm n is korcculmj at lye for cycles, I.e.
(3) tin oA (iimidnii A t' effntb the full range of the monotonic locus
W110111 tl]U 111HIMtirtl is1011- Icolul W ri 11hL IUclola ý.ogwi~til of the mniontonict curve to a strain 7
Of' IF ond thanI iulouduJO~ Uli 0111001t 2c a0pu fc ontunt of hardening will have occurod
to the Corripress ye wonlttmln of Owli mono ton? n cui "o A simui lar effect will bo seen to hove
uiccuri cd to tho tumbii mutnioftoimi. CUrvU if tufile [Id~tI1 were First loaded in compression.
Ownc tic m-ik-1 ii ki I oo'led iLm,.1 thu, timisii iiiulaiit.rj. curve an amnount c and then
nlloudu1(d Will 11.110ol.' 1 hu, k to ( IolticcilIly no hurdenirm(j will hovo occurred io the tension
S~ijIII" ."11 io i nvu. [Ili Skill 01QI wotild Le seen for the compression segmetint
il lie no it nitL IAIlId \'O0C iOd on huSO tw,) oh~eivat ions it will bo ossumoid that the hardenilng
of t~whu tototo, '110 IIwt.l'ru ill .toioitsi~. of1 the t111Iiotollit c.urves rer uncoupled. The harden-
* log1! of j111'.liu. lHIIii,,?,tiiL curv( 'Yill Iit: kII.,ud orn [lie anioun? of Incre~mental strain
* I5)iO iiiio Vill Oiiliui tic tons'ioti rn,,liiiotnit - rvv or tll(. Lipper branch curve. Similarly,
Iinit hloi~liiiit) Of l.U. 1dii$i-Aiii'I~iii~i vill. ht, li busd on lie amiount of Incremental
Y1ruiii JhNojioit~ od -it uitliu, 11W, coL11llU'isiVO 1iI'Mk~iiCI~~ k:urve or- the lower branch curves.
Hiilolty it" iioniloie .. osedtokl luoh tring tho itorisiint ,.ondition , it will be assumed that
128~

the points in the stress strain space will expond i longi the elastir slope of' tho krarnc:h
curve that initiates from that point.
Consider now this procedure included in the fllovilnq oxamtple w hiclh is fliown cir' phzcnilly
in Figure 78. Initial loading to A1 (86, I0:.025) Cllong the tension seginent of tho monotonic
locus curve. Then A1 '(-92,-0.025) Is the point on the ccipressive segment of thn monotonic
locus curve which a branch curve leaving A, nitl prss.
A /2 = 0. 025
E 9B = 906x106 from Figure 70
MAX;0.025 - 86,000/9.06x106 0.01551
ii 6•MIN=-0.025 + 92,000/10.4x10 0.01615
-2 0.03166
nH = 5.7 from Figure 76
(n/n) 1/5.7=0.1754
TEN
•(n/nH)TEN=0, 1754
(A/H) cop0.51 or 51% hardening, from Figure 7-P
Loading from A, (86,0.025) to B1 (-89.5,..0.008) along tho branch Curve which hrls an
elastic modulus of 9.06x10 6 and intersects the point A2' (-95.5,-0.029'3). A2 ' 1 ins on
the 51% hardened compression locus curves at the intarsectimn with th!e fxtensivn of a
basic branch curve originating from AI'.
Ac/2=0.0165
6 [1 +(-89,500/I/0.4xi16)(I0.4,"9.06.- )/).Oj166 9.,elI6x 106EB 1 xi06
n H= 9.5 from Figure 76
) 1/9. 50.1053(nnHC OMP: .
129

rI
U ..�.j..� 7�4 c3
� (I�vj
V ifLv
U
S..
* I
� ii
S 130

1 (n/nH) *=0. 1053COMP
(Ao/AaH) N0.335 or 33.5% hardening from Figure 77.
Loading from B1(-89.5,-0.008) to C1(87,0.022) along the branch curve which has an elastic
modulus of 9.616x10 6 and Intersects the point A2 (89.5,0.0252). A2 l.5%
hardened tension locus curve at the intersection with the extension of the branch curve
originating from point A1 and having on elastic modulus of 9.06xl 06
A (/2=0.015
104 16 [I + (87,000/10.4x1 6)(10.4/9.06-1)O.O31I66 9.172x10 6
S..IIB - 10.40i06 LJ+-,,oi615)(1i.4/9,06-1YO.03166
n H = 11 from Figure 76
(n/nH) 1/11 .0.0909I TEN
(rV'nH)TEN.0.1754 +0,0909 0. 2663HTEN
(AF/A OH)co H0.68 or 68% hardening, from Figure 77,
Loading from C 1(87,0.022) to D1(*.89.5,-0.006) along the branch curve which has an elustic
modulus 9.172x10 6 and Intersects the point B2(-91.5,-0.0082). B2 lies on the branch curve
which originates From A2 , has an elastic modulus of 9.06xi0 6 and passes through A3'(-97,0.0254)
at the intersection with the extension of 1he branch curve which originates from point Band has a
modulus of 9 .6 16x 106. A3 ' lies on the 68% hardened compression locus curve at the Intersection
with the extension of a basic branch curve originating from point A1 '.
A c/2 =.014
E• 6 ÷ (-895/I0,4x+ 165)(10,4/9.06-1)/0.03166] 6B -0.4x1I 47? 9.530
nH 12.8 from Figure 76
(n/'n .) ]//12.8=0.078H aP
{ 131
A l. . . . . . . . .. .. - • . . .. . . . . .. .. . . . .

(0.1053 +U.078= 0.1833H)COMP
(AH/oH) TEN0.55 or 55% hardening, from Figure 77.
Loading from D1(-89.5,-0.006) to E1(91.5,0.03) initially along the branch curve which
has an ulastic modulus of 9.53xl0 6 and intersects the point C2 (89,0,0222). C2 lies on the
branch curve which has on elastic modulus of 9.616x10 6 and passes through points B2 and
A3(90.5,0.0254) at the Intersection with the extension of the branch curve which originates
V from CI and has an elastic modulus of 9.172x10 6 . A3 Iles on the 55% hardened tension
locus curve at the intersection with the branch curve which originates from point A2 and has
an elaslic modulus of 9 .06x106. Loading continues from C2 to A3 then from A3 to Dialort•
the 550/c, hardened tension locus curve. El' (-98,-0,003) Is then the point on the 68%hardened compresslor locus curve through which a branch curve leaving EI must pass.
t./2, 0.03
B - 8.92 x 10⁶ from F;qure 70
MAX-0.03 - 91,500/8.92x10 6 -0.01974
MIN=-0.03 + 98,000/10.4x10 6 =0.02058
A(. ý:0,04032
nH 4.8 from Figure 76
(n/nH) = 1/4.8-0o2083TEN
1(n/nH)TEN-" 0,2663+0.2083=0.4746
(4 oy/,4a H) 40,88 or 88% hardening, from Figure 77.
132

4. 1.2 Notch Response3
Neuber's equat ion states thai the product of the true notch stress and strain is equal to
the prod uct of the stress and strain if the material remains e last~ Ic .e.
axrx E -(S x K d)2
~4lHence In order to predict the stress and strain at a notch with a concentration of K~
under the action of a far-ficild stress S. This equation has to be solved simultaneously
with the material stress strain response.
This relationship was developed for a very specific type of notch uinder the action of a
t very specific loading condition, Upon applying it to the super scale specimetns tested
In this program poor correiation was obtained In the high plastic region&. Based on a
study of this correlation the following modified Neuber'k equotion was developed.
T (S Kt)
This equation gives a much better correlation with the test dwia as cup' be seen In
Figure 79.
4.1 .3 Cyclic Creep
In an effort to understand the notch response to cycliC c.roep otnd or relaxation, (.1
special sequence (Sequence 30 in Figuire 1) of load was app lied to the super sir-oIa
specimen ME. The sequence of londs applied to tho specimen Is shown in Figure 80.
The specimen was first loaded to 29, 800 psi, A to 8, Which Was highl 01cOUgh to LOUSu
the edge of the hole to go plastic. The load was then removiud, resulting in u residuol
stress of 15,000 compression. It was then cycled 10,000 thimes between stresses of
±5000 psi, C to D), and reloaded to 33,200 psi, E. If any cyclic: relaxation accured
during the cycling between C and D) tihen the trace In the gross area strass-stroin spacii
would break away Laore it achieved the previous roachad valun at B, The specineon
was then unloaded and again cycled 10,000 times botwuori 5,000 pfl and 25,00 pOJsi
Again, reload ing~ andi relaxation would show up us an early break awoý :ii. Ow'i
area stress-strain sporce. T he results of the test 15 shown in FiCJLIe 81
133

vi i
rv i
- -i
c -. 4
USN') -s S I G3 V
134
Mi

40
60-',
50-
1 0-
/
C E
- Iyl¢ re
A.
BD
60
50g
~40-
U//
S~~~Cyclic Creep Eauto
II 0C
50,000 100,000 150,00020, 0E ~~STRAIN-E 200
Cyclic CreepFigure 80 - Analytical Simulation
Cyclic Creep Evaluation
13M

NN[ I-z
L4'n
V)Uz
zL
I;~~~v z~ld~L~GO iIdVNW~S-
~i~A .~ 13

4,1.4 _Damrage Predictions
The damcage for onch h 1ovl of cy, !i u locrm h colIculated once 111v truo notch
stresses cire know~n .The damciqe du) to 1ho irinsit in fromn ono [Aocl:k t,,o (lliotr hioý
to be hooid led in Cl ýpocial i~llattler . Hl~ uisie theQ cc 1 Flow lodImiipsbo:
determine, from the strain history, the oq iva lent cyclic Stresses and the nrunoib, of
cyr~les which reptesent the transition botwo'frt hlck~s of data.
The rain flow mothod uses i lie peake stroins% fromi eachl b lock of data to determiine the
tiqcuivailont cyclic: stresses anid flit.) ninuor Mhcc rs Tie nottio Ra in Flow (;cumof
from the unn logy thact is madhe to cain flowingc ,ff (iroof. Tim roofs aer considoered
LIS the 14t10s 10i rlit'1 the Ip1(11 sri r ns in ri si mtr-- I ire p lot whero t he tOlirn is the
vertical ax Is. Ra in Is all owed to flow from roof' to roof uinfIl it eincunteOrs raCin
that has flowed over a larger horizontal disteance . Tho horizontal lengthi of each~ rain
flow Is then counted as half a cycle and thia ormrr and alturnate stresses are detervine)(dfrom the si-resses at the beginninq Lind end of 1ho~ half cycle. Fitueh ae -rrni
Reference 7 shows an example of this method.
In applying this procedure to repeated cycloi It is oissurried that the~ results from InmdividualI
half cycles can be superirrposed . This is ii lusirated in) Figure 83, where, For the initlol
lomcding increment fihe material follows t he locus curve. Upon unload inct flie ma turin I,
Follows the branch curve Linti I it meets thle incdi fled Ne ijler curve dhefined relative to
the start Of the u~nloa-d lnL, branc~h
V, The analysis calculates an accurnulative doiwiciqi bosodc on thle Pa Irririen- Miner theory.
The acrLumulative damage is the sumn of the daniages fronm each individual block of cyclic
stresses and from each Half cycle represmntinci tha transition between blocks of data. The
individualI damages are defined as the number of cycles (ni) app lied ait the specific Stress
levelIs divided by the nurnbor of cyc les (N) it tokes for ai ciack to inc.le trif- Ot thle specifiC
stress level . Time aC~C~um a ted daranac Is t henl:
DAMAGE = n,'N
The number of cycles (N) to crack nuc. lentiocr is olbtained fromn time, test data of unnotched
cuupon Specimens, This data con be iriterpr tail fer e ithie t he stresses or strains resulits fronil
the Neubar analysis. Pied ic tod vorsus r' t uni turiw- railures nrc diiscuisseci in Section V
1 37

5
7 10
I Iy II cyclei
L /4c ycle-
109
Figure 82 -Rain Flow Counting
138 J

C 2
/"'3
Viue8 iutnosSluino ebrsEutoandtheStrss-tran C rv
I13

I AT A A (JAl 15 1 Ali) I C NICREI A I UN,
A. f'i 110' tii *' a;j~ nrji (111 n i ID I ou niteut
qeunt ify cind ntode I the s tress tit id s Ira le I stit o nit o Ortros ri1ser . These tests ;ic udo ai
.!tJiijniuf, chutFOOtui~lco ion)I study as4 wall Is Ci atrix of flt i(Poe lte5ts to mleusuraU thle00 ci sti u11 hi iiIis t ory t.I en r uig L:o~i iE xI o o,.0t10(1 L J U l~I L: t IS . ThI- va oatIe r rlIIno Is du hos b)eetýn
"iSotd to noulyt judl y muxi~e I the cyc i ( ti-t1)'Jfl~Jlii '10 ilq i cjutnt (31(1 tile stob le con.-
cili on, Sect COn IV. Notch lospuine1h Oimd 'lcIniw,1t pied jut onn using this clanalysia moded
ore comopsrod wvith uxperiilentln ruw tsl, ill the, fol l'wing( 50eCt0011r5
1. NOTCH RESPONSE
Thle 11t10lYs1Is discussedl in 4.* 1 .1 . I linus 10011 1 'smd for pred icting tire nut ah btrainr rosponmefor Ouuc 5uJFJOIsucil km tst soqcl o l.. A plot iouitii W110Wh cb uloIu~id from 1-m is ulgoeIi 1mmfort p it inmj el flier app lied load verses SC tllm )1I.Io notch si 'ass versus notch sfIruin.
This uIses +0 (,Cyl; c otlCh, ~ 10 q uu'i)(]bu"11 ýiii II o Whose dovel 1iimorf wa WOS ut I hd. in
4. 1 .1 . 1. The locus% cijrve is Used tc u olnei inl sp5 11' thu ktica1 loading, either over-
loadJ01 emUldL lucid. Thnl ýhe bronmeh t-lr1vU , fluom Fit ere 69, is usfed to lit through thle
mop1i 1ia (cs locidings) !, defineo Uxu,~rsmohs iotim lilt! Cyclic locus cu~rve inl thu sjtress
Stlitiii spmOO I.Either tIso Whole or ports of ilium Ironcli curve aie used fo describe tilie
lood.-stroin hlisory cis a lesf lit filiol-Ii lll' dtli'''lot po~ints. Ficqeres) 84 tliroteqh' 91 i Illstrofe-
01, t imt! i~ C,'.[- , el'imm.(i rink' ,, h 1i tls o iii A'e t, ,v'nm. rhmo ,olid curives orti frii thim
(111(1 '/i ý h0 istcurisk symiii,-)l ru~pruatiim tOw chippst alooed '.iirdit cans (mrixinmuii, jininirmin
(miiid immoumi I !ods). l usi Iklohc, lw 0O1( Ii50ieC ik rut:rcsSUttll by 111 ('1a 1 riisynIhoVIS . Thu
5' ~ ~ ~ ~ ~ w ('h jiati shoawnis frzri tle trcaitsclit or mti'iis'mi 'crit' i isrrtrl , roW 'Sl, inl Ficiros 44
1li1 iigim 52.
Ill cru'lreol, tIme letý5 duto ucarru 0th, yr 7y Vo1l %Y11 lilt CiiuilytiCol predictions, 11 his
thoum toeIds to sui-Ihsltiniriut2 hoIlw lyJovue Iqicioit ill 5mLtioli IV, spec ifitlly thic
'y liL: It' ISý ii' s ied hint',0 ii 'iv leuiri Wilth this concalys.is, itis n5ow
p),Oil, It" t!i oI. iQill 4 ' icr'-soot mc 1CI, li 1''d '01st'l ili ci o ml tic, '1i I I sit
II It I. I' ,, I k 1 , nh1
Iui jut, k.Im It Iiirt! 101Od f 1) 1 s 1ýt I Qss
V ~ l !, 1 , t-11 11 ] ll I C S - II I N II CI II It .-N 2 11 r It CI I Y ' 1'0 11 1 Ii F L t

:0=• / T .
L t../ /
Liit fo/h cntnam liud cyln in
V-0. 20 - 1 0.0 r0 C 0C1
•:..,
LodSranDt Sequence 1.
A 141

CNo
0
K. .
F e 8ev
c-ff
c. i ' IN.9
Li
Load Strain Data Sequence 8
1:42
142 .'_t• ,'U
•:.L {" e"
• £'. . |

L1'*
I'
oo
C 0~0
C.C 3
,0
*. U, /
0
a -
C)
IK
-44
0~
0
[I•
14,
i ,C

V).
nf
I;
CL2
CLaCL
,,. ۥ VI. ,/ ,
Fiur 87 rdce -v.Maue
j I/f
a- .tai D! Seq
C144
I "" I
" ~aJ
ci
Li
c.o OI0-.0 .. 06 0.00 0.95 0.10 0.16 0'.200.2 0d -010 NOTCH STRAiN ,i1
S~Figure 87. Predicted vs. Measured{, Load Strain Data Sequence 12
t,4

'P-
0/
e-.
Lj
'-1
V CL
CL?
-0.20 0o.,• 0. 0c 0.-06 -o.a0 C. 6 a.a,, 0.20
NOTCH 5'RAIN "I P
Figure 88. Predicted vs. MhasuredLoad Strain Data Sequence 13
145

cm.
C)
C;,
00
C:) L1"
O -
/ 12
w /
U-
C.,
f A
-JIL.
-- ,1U ._0I - Ili] - ,US C( ,OU , V. . ( , [ CIS rU 2N 0T C H 5IjT RAN 010
; Figure 89. Predicted vs. Measuredi Load Strain Data Sequence 21
:a!
i*1
i; i 1,C,

I:'i
C;'
00
C.)
0 1W
LO.J
n /
U-
T"
919
-. --.0,-20 -0,15 --.O,10 -0.05 -0,00 0, - 5 0. 10 0 0•: .701
NOTCHI STRAIN 1o0'-
Figure 90. Proddicted vs. MeaosuredLoad Strain Data Sequen2.o 22
147 ,
-J . ...

t'l
16
mm
I;J
_jC
i L '
t.
La'
-A , -,
'
n , NTH b r R
148
a 0
/ ,A
• , / o4...
tii
148

0i
C14.i
a
a
4 7a/
a/
LiisFo h cntn
/
a /
t ~a t
o-.--O Limits For the constant
a amplitude cycling in* Sequence 1.
aaq
-' r .. .. "'-- -- T<-1""" '"-'"•I•!,.0.20 -0.15 -0.10 -0.05 -0.ao 5. ,0 a.• 1.5 ,.NOTCH STRRIN m10
Figure 92. Notch Stress vs. Notch StrainSequence 6
149

Cc,
C;5
--- ii
U. wa
'V)
Lnifl
-o0z ,o.0 - .0 - as -0-00 0-95 0.10 o.15 0 2o .NOTCH 5TRRIN ,10'l
Figure 93. Notch Stress vs. Notch Strain
Sequence a
15

r- 1
r.13
Lfl.
*1 --............ .... .-...... .. .-.. .... ----.. - -,-
I • "
:i•", ~ -0-20 -0.15 -0.00 N-0'OO -T0~I''0 110'• 7ro,1• o.(•,.
•.•il ~ ~~Figure 94. SqncNotch Stress vs. Notch Strain :~
Se 9
•i: 151
:; . j .. . .. :. . . . . . . . . . . . , _ , _... .. .:. .. .. . . : . , . .• . . .. . . . .. a. ! ! i

IA(4
NOC" bTRAIN Gl
tJJ
Figure 95. Notch Stress vs. Notch Strain ;Sequence 12i
I1
115

U4U
-• ::
ino
Li
.'. . .. .
-C02 -O1b. 0.10C05C C0.00 0.-51C0NOTCH 5TRi IN M1C
Figure 96. Notch Stress vs. Notch StrainSequence 13
153

c221
CD1
/ //
U.') ,-
I.--
00/
C'
a.0 .0-1.5 -0.10 -0.05 .0.000 0.05 0.10 0.15 0.20NOTCH S rR A I N , '"
Figure 97. Notch Stress vs. Notch Strain
Sequence 21
154

I.t,
Cl
C.7
ll,.C
ji 20 L/I/1
./
1.i, I /./,"
II
z115
LI n / / .
tii
;ij
r " "1 1-" -"1'
u .2 11 -.15e. t .111 .Obr -Ii .00r 0] 0•b .11 0l. l .NO]ILII ',_TRRIN '10"
Figure 98. Notch Stress vs. Notch Strain
Sequence 22
• .,. 155.i

a
* aV3"
C,
VVA__/
z
Co
7//
I"- /C2
-o.0 C -C,2 b. .c -C.CS -C C - CC C bC 0o '.o,NOTCH ST RRIN *1"
Figure 9, . Notch Stress vs. Notch StrainSequence 26
156

iV
Neuber equation discussed in 4.1.2 is used in the analysis for developing these data.
Damage or life predictions are made using these calculated notch strains along with
the cyclic counting technique discussed in 4.1.4.
At this point, there is good correlation between the predicted and measured load-
notch strain data using the analysis model as It currently exists, The analysis does not
currently include a cyclic or time dependent creep module. This will be the subject
of the Phase II study and will be Included in the analysis after completion of that study.
5.2 DAMAGE PREDICTIONS
Two analysis methods have been used to compare predicted versus actual fatigue life
for the super-scale tests. Both a simple Minor's linear analysis and the hysteresis
analysis in 4.1.4 were used for life predictions. Typical results are shown in Table XII.
For the Miner analysis, damage for the constant amplitude portion of each sequence
wus based on the data from Sequence No. 1. Cycles to failure for this sequence is
47,647 cycles as listed In Table VII. Then for each sequence
'D constant amplitude cycles•, 47,647
and D 1.0 at failure.
Damage from the overload and underload cycles was derived from the data presented in
F:l Figure 100. Based on these assumptions and the linear damage analysis, the maximum
life for any sequence would be 47,647 cycles - Sequence No. 1 . This is a prime
example of the short comings of any analysis which does not account for residual
stresses or plasticity.
The hysteresis predictions do not correlate as well as expected with the test data;
however, the same trends in the test data are evident from the analysis. Better corre-
lotion is achitved in the test sequences with under'oads greater than 7.9 Ksi. Perhaps
the delta stress between the tensile and compression yield was greater for the super scale
157

C. I -
V.L
r.. o
J.4 k'4 co 1

U.
.-z zLU
wvI Li
ci4nl kn* - - r.
(NU0 ' 0% 0
Ln tn LO '
U tt
z)
U,
x LL 'o c 159

plate material than for the 1 .0" plate stock used to generate unnotched cyclic data.
StO II missing In the predictions, however, is the creep module to account for periods of
sustained loadings. For example, 430,000 cycles is the predicted life for Sequence 8.
The some life is calculated for Sequences 13 and 14. These two sequences are identical
to Sequence 8, except for the 24- and 1.0-hour hold periods (see Table VII) but the
test life is significantly different for the three sequences. The same is true for So-
quences 10, 16, arid 17 and Sequences 9, 14, and 15, for example.
J, Cresep studles to be conducted ;n Phase II of this program are expected to provide data
to formulate an analysis module to account For these periods of sustained loading.
I1.'.
Ij
I '1
160 -

SECTION Vi
CONCLUSIONS
The following conclusions are based on the Phase I results.
1 The experimental approach used here has produced quantative results; however,
improvements in the data recording methods and system sensitivity are necessary
for the Phase II study. Expected variations In the strain field were observed and
were measurable.
2. The Neuber Hypothesis is not sufficiently accurate for a notch stress-notch
strain study of a finite width plate with a central circular notch.
* 3. Overloads and underloods do effect specime., life. Cyclic block size has a
* significant effect on life and rate of change of strain. Strain variation during
blocks of constant amplitude cycling Is dependent on the previous load history.
Li 4. Specimen life Is effected by sustained compression loadings and there Is evidencithat creep exists during the loading periods. This creep/relaxation at a notch Is
very complex and Is a function of both notch stress and notch strain. Elastic-
plastic stress and strain field definition is Important to both crack initiation and
crack growth In the damage process.
5. Events included in test sequences do occur in service and will effect structural
life. Both component and full scale tests are effected specifically as regards
test spectra development and interpretation of data.
161

r/ , . .*.. ... fl* . .
REFERENCES
"1Sitpkins, D., NeulIeb, R. L. , Golden, D. J., "Load-Time Dependent Relaxation
of Residual Stresses," Journal of Aircraft, Vol. 9, No. 12, December 1972.
2. Potter, J. M., "The Effect of Load Interaction and Sequencing on the Fatigue
Behavior of Notched Coupons," Cyclic Stress-Strain Behavlor Analysis, Experl-
i,,eiitation and Failure Predictions, ASTM STP No. 519, March 1973.
3. Carroll, J. R., "Time Dependent Residual Stress Relaxation in Low Load Transfer
".hnints," Lockheed Report SMN 388, to be published.
4. Awards Abstract, "Self-Supporting Strain Transducer," NASA Case LAR 11263-1,
Filing date May 23, 1974.
'3o, Nher, H. "Theory of Stress Concentration for Shear-Strained Prismatic Bodies
with Arbitrary Nonlinear Stress-Strain Law,"• ASME Journal, Vol. 28, Dec. 1961,
6., s. ilurle, 1H1. R. "A New Parameter for the Hysteretic Stress-Strain Behavior of
Metals," •ournl of Engineering Matv rlnl. and I Nn 'hnnlogy , Jin 75, pp '.1 33-18.
2'. Dowlinq, N. E., "Fatigue Failure Predictions for Complicated Stress-Strain
Histories." Journal of Materials, Vol 7 #1. ASTM, March 1972, pp. 71-87.
162II I II I II I