Embed Size (px)
Citation preview
Investigation of Shape with Patients Suffering from Unilateral
Lymphoedema
KEVORK KARAKASHIAN ,1 LAWRENCE SHABAN,1 CHERYL PIKE,2 and RAOUL VAN LOON1
1Zienkiewicz Centre for Computational Engineering, College of Engineering, Swansea University Bay Campus, Fabian Way,Swansea SA1 8EN, UK; and 2Lymphoedema Network Wales, Cimla Health & Social Care Centre, Abertawe Bro-Morgannwg
University Health Board, Neath SA11 3SU, UK
(Received 29 June 2017; accepted 14 September 2017; published online 20 September 2017)
Associate Editor Scott I. Simon oversaw the review of this article.
Abstract—This study investigates the use of a 3D depthsensing camera for analysing the shape of lymphoedematousarms, and seeks to identify suitable metrics for monitoringlymphoedema clinically. A fast, simple protocol was devel-oped for scanning upper limb lymphoedema, after which arobust data pre- and post-processing framework was builtthat consistently and quickly identifies arm shape andvolume. The framework was then tested on 24 patients withmild unilateral lymphoedema, who were also assessed usingtape measurements. The scanning protocol developed led toscanning times of about 20–30 s. Shape related metrics suchas circumference and circularity were used to distinguishbetween affected and healthy arms (p £ 0.05). Swelling mapswere also derived to identify the distribution of oedema onarms. Topology and shape could be used to monitor or evendiagnose lymphoedema using the provided framework. Suchmetrics provide more detailed information to a lym-phoedema specialist than solely volume. Although testedon a small cohort, these results show promise for furtherresearch into better diagnostics of lymphoedema and forfuture adoption of the proposed methods across lym-phoedema clinics.
Keywords—Edema, 3D camera, Swelling, Geometric analy-
sis, Topology, Limb volume.
INTRODUCTION
Lymphoedema is a condition in which a patientsuffers from chronic swelling of subcutaneous tissue asa result of deficient drainage of interstitial fluid.11,16,17
In homeostasis, an amount of fluid leaves the capil-laries and flows into the interstitia. Under normalcircumstances, most of this fluid is absorbed back into
the blood stream and the lymphatic system pumpsaway the remaining imbalance in fluid. An interstitialfluid build-up occurs when the microvascular (capil-laries and venules) filtration rate exceeds lymph drai-nage for a period of time; this is either due to a highfiltration rate, low lymph flow or a combination of thetwo.6,17 A consequence of poor drainage is a rise ofproteins and solutes in the soft tissue, which over timecan cause fibrosis resulting in the soft tissue becomingharder and stiffer.11,24 The causes of an impededlymphatic system can be divided into two main types,primary and secondary lymphoedema. Primary lym-phoedema is characterised by impaired lymph vesselsor lymph node development; this can be present frombirth or develop throughout life.24 Secondary lym-phoedema takes place as a consequence of damage tothe lymphatic system due to cancer, trauma, infection,and obesity.4,16,22
Lymphoedema is currently treatable, but not cur-able. The condition can be treated through deconges-tive lymphatic therapy (DLT), which consists ofmanual lymphatic drainage (MLD), a specialisedmedical massage to soften and drain lymph fluid,compressive bandaging, decongestive exercises andskin hygiene procedures in the intensive phase.9,22
Furthermore, patient adherence to medical treatmentsas part of home maintenance approach plays a vitalrole in controlling the morbidity of lymphoedema.
The treatments mentioned above all have a directinfluence on the topology/shape of the oedemic arm,which in return constitutes to change in volume. Thus,a common indicative measure of treatment efficacy ischange in volume.4,7 Current methods of volumemeasurement consist of water displacement, circum-ferential limb measurements, perometry andbioimpedance.11 It should be noted that the latter
Address correspondence to Kevork Karakashian, Zienkiewicz
Centre for Computational Engineering, College of Engineering,
Swansea University Bay Campus, Fabian Way, Swansea SA1 8EN,
UK. Electronic mail: [email protected]
Annals of Biomedical Engineering, Vol. 46, No. 1, January 2018 (� 2017) pp. 108–121
DOI: 10.1007/s10439-017-1929-y
0090-6964/18/0100-0108/0 � 2017 The Author(s). This article is an open access publication
108
method aims to measure fluid volume within the tis-sues, whilst the remaining methods are based on vol-ume measurements of the entire limb. The waterdisplacement method is based on the principle that thelimb will displace its own volume in a 1:1 ratio withthat of water, resulting in accurate measurementsindependent of geometrically complex shapes.20 Forarms and legs circumferential limb measurements(CLM) are an alternative, which consists of subdivid-ing the limb into regularly spaced segments andrecording their respective circumference measurementsusing tape meters.11,20 Total volume is then the sum-mation of all constituent segments via geometric for-mulae such as disc or frustum (truncated cone). Theperometer is an optoelectronic device that relies on theocclusion of light to detect shape. Limb volume is thencalculated by fitting an elliptical disc to the registeredlimb diameters.2,23 Lastly, an alternative method tomonitor lymphoedema is bioimpedance, which mea-sures the opposition/impedance to an alternatingelectrical current travelling through soft tissues.3,19
Both perometry and bioimpedance have shown to havehigh intra/inter-rater reliability values.2,7
Not all above assessment methods can providegeometrical data, with only CLM and perometerhaving the ability to provide circumference measure-ments. Even so, the use of such methods has beenlimited to calculate volume,4 without further investi-gation into shape. Therefore, the main objectives ofthis study were to:
� Examine the use of three-dimensional (3D) cam-eras to scan upper limbs and capture shapeinformation.
� Identify different shape related metrics that couldbe used to monitor/diagnose lymphoedema.
Other studies that have used 3D cameras weremerely interested in finding accurate volume measure-ments without analysing shape further indepth.1,8,12,13,18 Thus, due to the lack of informationand tools available to analyse shape of oedemic limbs,a factor contributing to change in volume, we providea cost-effective method and the tools necessary forcreating metrics that could be used to monitor lym-phoedema.
MATERIALS AND METHODS
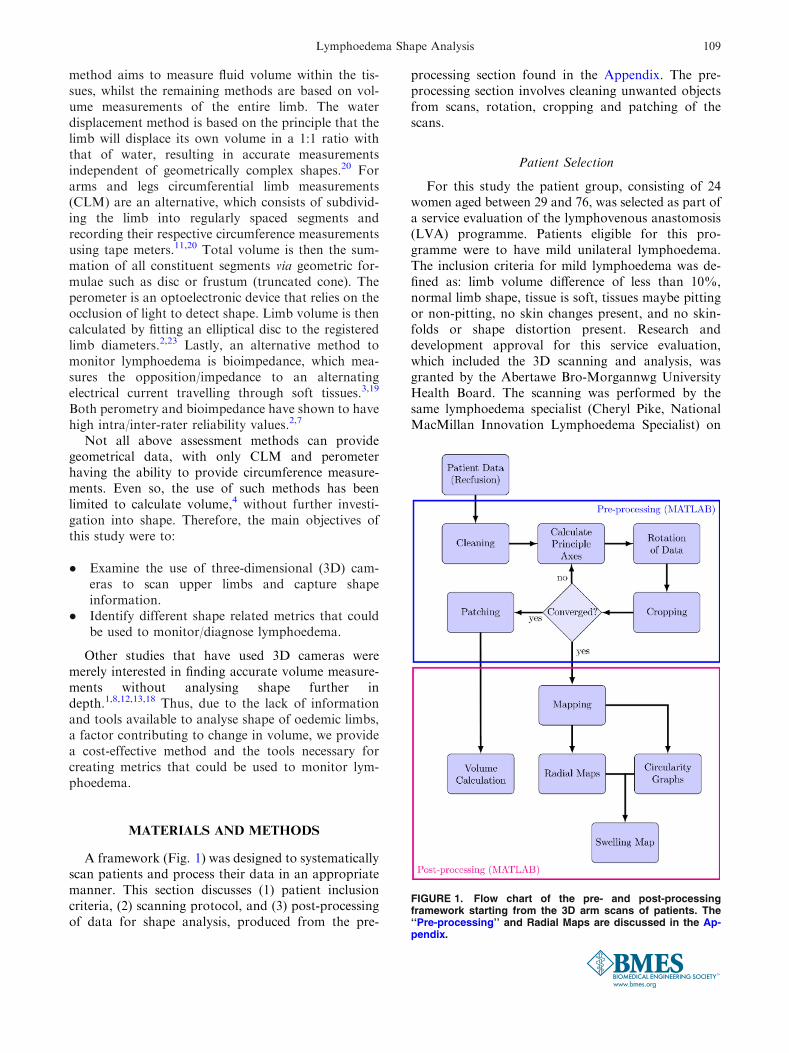
A framework (Fig. 1) was designed to systematicallyscan patients and process their data in an appropriatemanner. This section discusses (1) patient inclusioncriteria, (2) scanning protocol, and (3) post-processingof data for shape analysis, produced from the pre-
processing section found in the Appendix. The pre-processing section involves cleaning unwanted objectsfrom scans, rotation, cropping and patching of thescans.
Patient Selection
For this study the patient group, consisting of 24women aged between 29 and 76, was selected as part ofa service evaluation of the lymphovenous anastomosis(LVA) programme. Patients eligible for this pro-gramme were to have mild unilateral lymphoedema.The inclusion criteria for mild lymphoedema was de-fined as: limb volume difference of less than 10%,normal limb shape, tissue is soft, tissues maybe pittingor non-pitting, no skin changes present, and no skin-folds or shape distortion present. Research anddevelopment approval for this service evaluation,which included the 3D scanning and analysis, wasgranted by the Abertawe Bro-Morgannwg UniversityHealth Board. The scanning was performed by thesame lymphoedema specialist (Cheryl Pike, NationalMacMillan Innovation Lymphoedema Specialist) on
FIGURE 1. Flow chart of the pre- and post-processingframework starting from the 3D arm scans of patients. The‘‘Pre-processing’’ and Radial Maps are discussed in the Ap-pendix.
Lymphoedema Shape Analysis 109
two sites; Wrexham Maelor Hospital in Wrexham andCimla Health and Social Care Centre in Neath. Pa-tients’ arms, after their informed consent, were mea-sured using 4 cm spaced tape measurements andscanned using a 3D camera. All scans used in thisstudy were taken preoperatively.
Scanning Protocol
Requirements for the scanning equipment andprotocol were predominantly defined by the lym-phoedema specialists in the clinic. The aim was to de-velop a fast and low cost alternative for assessinglymphoedema of the upper limbs. Therefore, a com-mercially available ASUS Xtion Pro 3D (A.X.Pro3-D—ASUS, Taiwan) depth sensing camera was chosenin conjunction with software from RecFusion (ImFu-sion, Munich, Germany). The device consists of twoelectronic cameras that utilise the projection of struc-tured light to capture 3D data. The first camerareproduces colour and brightness by detecting thereflection of visible light off the scanned surface. Thesecond depth camera detects reflected infrared radia-tion to estimate distance. These two parameters areprocessed in RecFusion, resulting in a three-dimen-sional point cloud. This enabled us to capture trian-gulated 2D manifolds of the arm surface. Thesetriangulations were then exported as STL-files(STereoLithography) containing the vertices and con-nectivity of the 3D points.
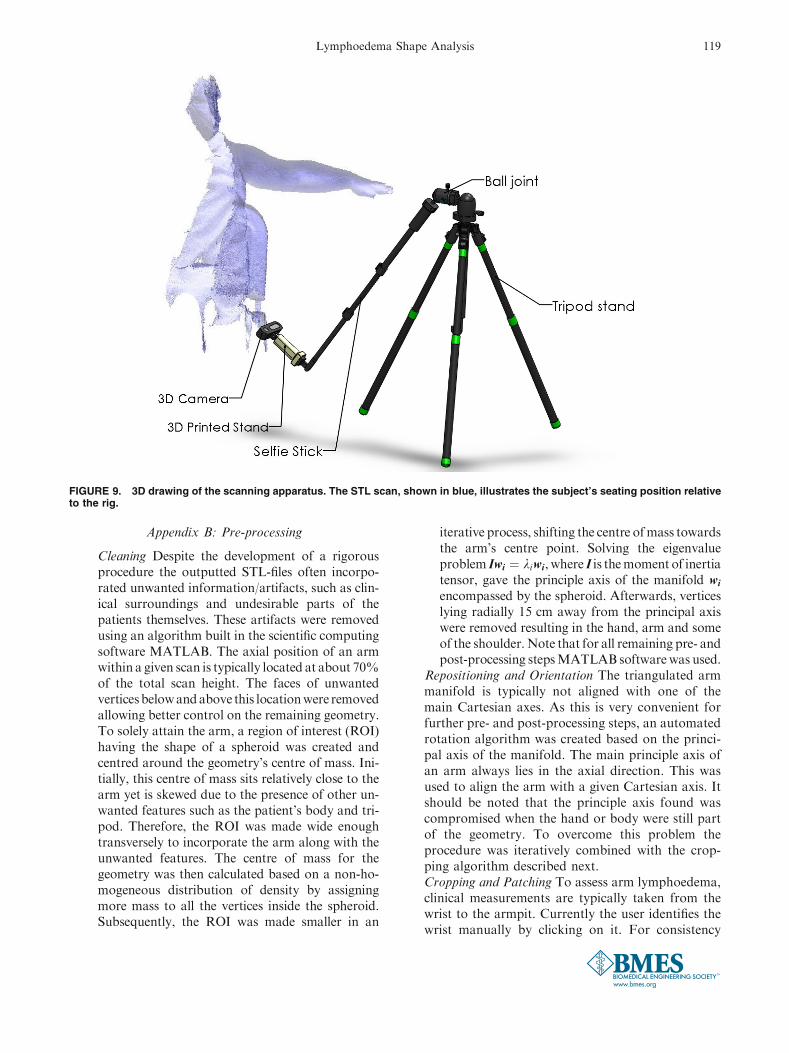
To ensure consistency in data capture, a scanningprocedure was developed to control variables as well aspossible. A stable camera rig was constructed frominexpensive off-the-shelf equipment (Fig. 9, AppendixA). The rig consisted of a camera tripod, ball jointmount, selfie stick with groove (to suppress rotationabout its axis) and a 3D printed A.X.Pro3D cameramount in order to connect the camera to a standard0.25 inch tripod mount. The total cost of rig, cameraand software licence was just under 500 GBP. Wherepossible, the rig was chosen to utilize common cameraequipment in order to aid clinical use by ensuring costswere kept to a minimum and replacement parts couldbe easily sourced. Patients were seated on a stool andasked to stretch out their arm horizontally ensuring thearm was at the same height as the ball joint by varyingthe height of the stool. The camera was then rotated360� around the arm in about 20–30 s. Both arms ofthe patients were scanned in this manner.
Post-processing
Volume Calculation
Volumes are used clinically to establish the severityof the swelling through comparison between affected
and healthy limb (unilateral lymphoedema).14 Once aclosed surface triangulation for the arm was estab-lished, the volume of the limb was calculated forcomparison with tape measurement data. In currentpractice of CLM, the volume of an arm is calculatedbased on the assumption that arm cross-section iscircular. First, the circumference of each cross-sectionwas calculated as the perimeter from the structuredgrid mapped on the arm (Fig. 10b, Appendix B). Ra-dius R zð Þ was then derived from the calculated cir-cumference, which was assumed to be 2pR zð Þ. Theseradii were then used to calculate the cross-sectional
areas p R zð Þð Þ2. Finally, the volume was calculated foreach of the arm segments between 2 measurements asfrustums and discs in Eqs. (1) and (2), respectively,
VFrustum ¼ p3
PNm�1
i
R2i þ R2
iþ1 þ RiRiþ1
� �ziþ1 � zið Þ; ð1Þ
VDisc ¼ pPNm�1
i
RiþRiþ1
2
� �2ziþ1 � zið Þ; ð2Þ
where Nm is the number of measurements taken andRi :¼ RðziÞ.
An alternative, more accurate, formulation for thevolume was found through the divergence theorem,which states that in the absence of creation/destructionof mass, density of an object can only change throughthe flow of mass in or out of the boundaries. Hence, thetotal volume of the closed manifold was calculated as,
V ¼ZZZ
r � FdV ¼ZZ
�F � ndA ð3Þ
where F is a vector field, r� is the divergence and n thesurface normal. Note that F ¼ ½x; 0; 0� leads tor � F ¼ 1, which is a valid solution to Eq. (1). Theintegral across the closed surface can now be evaluateddiscretely with vector x, the x-coordinates of the cen-troids of all surface triangles. If triangle j is one of thetriangles describing the triangulated arm surface, thenthe volume can be calculated as
V �PNf
j¼1
PNd
i¼1
Fj;inj;iAj ð4Þ
where Nf is the number of vertices and Nd is thenumber of dimensions. Equations (2) and (3) weresubsequently used to calculate arm volumes usingdifferent segment lengths (ziþ1 � ziÞ, and comparethem with the more accurate integral method, Eq. (4).
Circularity
One of the known drawbacks of the tape measure-ments is that it relies on the idea that the arm isapproximately circular. The 2D manifold allowed us to
KARAKASHIAN et al.110
evaluate how true this assumption is and a measure ofcircularity could help with this. Hence, a relation forthe dimensionless parameter circularity, C, was definedbased on perimeter and cross-sectional area that hasthe value one for a perfectly circular cross-section andvalues less than one for distorted shapes.
C ¼ 2ffiffiffiffiffiffiffiffiffiffiffiffiffiffiffiffiffiffiffiffiffiffiffiffiffiffiffiffiffiffiffiffiffiffiffiffiffiffiffiffiffiffiffiffiffiffiffiffiffipCross - sectional area
pPerimeter
¼ 2ffiffiffiffiffipA
p
P: ð5Þ
This value can also be used to identify non-circularanatomical features on the arm such as the elbow.Finding such a clear anatomical landmark in anautomated manner was important for realignment ofconsecutive scans of the same arm in order to calculatevolumes consistently.
Swelling Maps
When scanning the two individual arms for a givenpatient or the same arm at different points duringtreatment, there will always be variability in the ori-entation of the arm and inconsistency in the identifi-cation of the wrist (currently the only user inputrequired). This hindered a straightforward comparisonof scans and a 2-step process was introduced to make aconsistent comparison possible. First, the elbow wasidentified using the circularity metric introduced ear-lier. This then allowed alignment in z-direction byimposing the same z-coordinate for the arm scans to becompared. The second step was a cross-correlationbetween the radial maps (discussed in the Appendix) ofboth scans, which relies on the fact that the shapes ofthe right and left arm have similar features. Both radialmaps, f and g, were multiplied together after eachsuccessive circumferential shift of Dhj ¼ 2p=Nh. After
every shift the cross-correlation r was calculated as,
r ¼PNh
j¼1
f hj; z� �
g hj þ Dhj; z� �
; ð6Þ
and the shift required to align arms circumferentiallycould then be defined by argmaxDhjr. After the align-
ment, it was possible to subtract radial maps betweenthe affected and healthy arm which resulted in a radialdifference map indicating those areas on the arm thatwere swollen relative to the healthy arm. If a given armis scanned at different points in time the radial differ-ences will indicate in which areas swelling has gonedown or where swelling has occurred. This could be avaluable monitoring tool for clinicians.
Data Clustering
To further examine the effect of shape, patients weresought to be grouped together using volume and cir-cularity measurements. If these metrics gave similarpatient groupings, it can be concluded that shape has
no additional effect in distinguishing different classesof patients/lymphoedema with respect to volume. Onthe other hand, if different clusters were produced,then shape could be used as a complimentary metric tostudy lymphoedema, being more sensitive to changesin topology when comparing healthy and oedemicarms. Patient grouping was achieved via k-meansclustering. In this iterative process, initial cluster cen-tres are specified at random, assigning the closest sur-rounding observations/data points to each clustercentre. The cluster centres then move towards themean position of surrounding observations till there isno change in data grouping. Since the position of oe-dema varies from one patient to another, k-means wasapplied on lower arm and upper arm data.
RESULTS
The data of 24 patients with mild lymphoedema wasprocessed, analysed and compared using the methodsdescribed in the previous section.
Reliability of Scanning and Post-processing
First a suitable scanning process is defined for thearms ensuring repeatability and speed. The same armof a healthy subject was scanned 10 times over a periodof 10 min, post-processed to output volumes startingfrom wrist to a height of 35 cm, leading to a mean andstandard deviation (SD) of 2.5222 ± 0.0250 L. Thecoefficient of variation was 0.9911%. This suggestedthat the rotation speed and starting point of the cam-era have a very small influence on the final recon-struction of the arm. To analyse the effect of wristidentification, a second test was conducted by identi-fying the wrist five times for a given scan. This led to amean volume of 2.5151 ± 0.0058 L, suggesting thatthe wrist can be determined consistently.
As the first two tests measured the reliability of thecamera to detect the same shape/arm, the reliability todetect different shapes/arms was also assessed. Botharms of seven healthy subjects were scanned threetimes, and a test–retest analysis was carried out usingintraclass correlation coefficient (ICC). Volume mea-surements were calculated based on a segment startingfrom the wrist with a height of 40 cm. ICC and its 95%confidence intervals were calculated using the statisti-cal software SPSS (Table 1). The single form 2-waymixed model, ICC(3,1), was used along with theabsolute agreement type. We choose not to generaliseour ICC findings by using ICC(3,1) rather than the 2-way random model ICC(2,1), since the rater is fixedand the repeated arms are no longer considered to berandom.10,25 Nonetheless, according to McGraw and
Lymphoedema Shape Analysis 111
Wong formulations,15 also used in SPSS, bothICC(2,1) and ICC(3,1) will yield equal results.
Carrying out the same repeatability test using meanarm circumference measurements, rather than volume,resulted in a ICC(3,1) value of 0.946 with lower andupper bounds of 0.869 and 0.981 respectively.
The last factor considered was the resolution of thescan, which can be defined by the user in the RecFu-sion software. The resolution of scans was tested bycompleting three scans of the same limb taken at high(512 voxels at 1.95 mm), medium (256 voxels at3.9 mm) and low (128 voxels at 7.8 mm) resolutions.The reduced resolutions effectively result in an STLmesh consisting of fewer but larger triangles. Thisevidently increases the volume of the STL as the lowestresolution has an increased volume of 5.76% whencompared to that of the highest resolution (Table 2).Based on these results the high-resolution scans wereused in the remainder of this work.
Volume Calculations
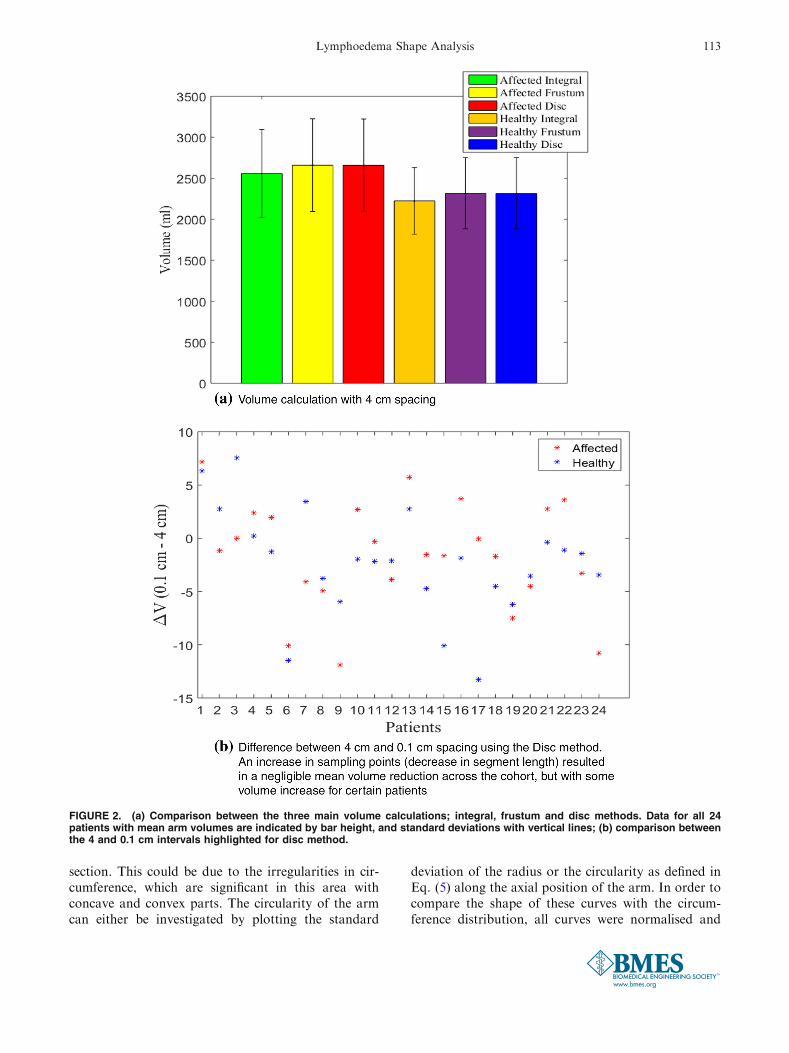
Volume is a standard metric used to establish theseverity or monitor the progression of lym-phoedema.4,7 The 3D arm scans allow the investigationof errors introduced when using approximations suchas the frustum or disc method (Fig. 2a). The number ofsampling points along the arm was increased resultingin spacings from 4 to 0.1 cm i.e., the height ziþ1 � zið Þin Eqs. (1) and (2) was equal to 4 and 0.1 cm respec-tively. As the spacing was decreased from 4 to 0.1 cm,average volume of all affected arms decreased by 2 and1 mL using frustum and disc methods respectively, anda decrease of 4 and 2 mL was noticed for healthy armsrespectively. It should be noted that this decrease is anaverage, as the 0.1 cm spacing increased limb volumefor some patients (Fig. 2b).
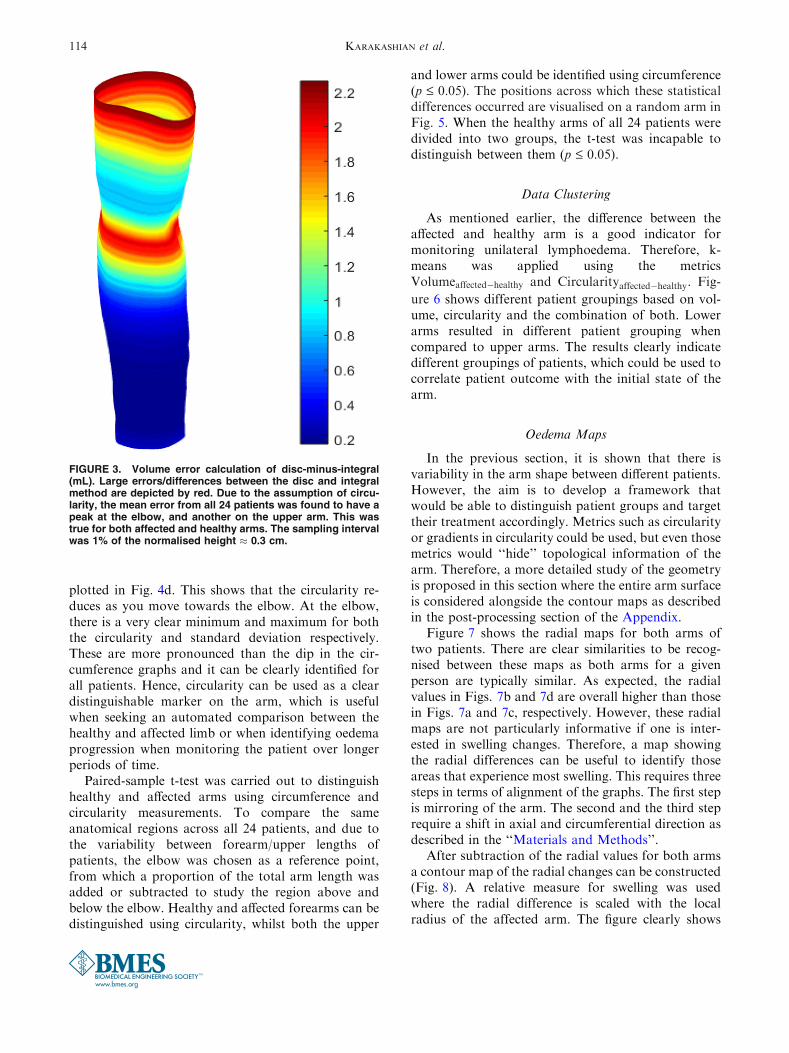
The volume difference between integral and theother circular methods was calculated to see whichpositions along the arm suffer most from the assump-tion of circularity. Not all scans were cropped at thearmpit. To allow for a sensible comparison all armswere therefore normalised by the length of the lowerarm. Hence, all arms started at the wrist and ended atthe same anatomical position on the upper arm. Twopositions of maximum error were noticed, one at el-bow, having the least circular shape as shown in thenext section (Fig. 4d), and the other on the upper arm,where the skin is most loose (Fig. 3).
Circumference, Cross-Sections and Circularity
This section highlights the relevance of some geo-metric features of the arms and identifies statisticallysignificant differences between affected and healthyarms.
The circumference of an arm is intuitively smallestat the wrist with a gradual incline towards the elbow.At that point the circumference experiences a shortdecline after which it gradually increases further. Thistrend is shown for the affected arms of three selectedpatients in Fig. 4a.
Figure 4b shows a comparison of the healthy armvs. the affected arm. This illustrates the variability incircumference changes between patients as a result ofthe lymphoedema.
Figure 4c demonstrates the difference between thetape measurements and the 3D camera scans. It can beobserved that the lower resolution sampling of the tapemeasurements results in a loss of detail compared tothe scans. Shape features of the arm might be missed asa result of this. The difference between the camera andtape measures was typically larger near the elbow re-gion, which will enhance any differences in the calcu-lation of volume as described in the previous
TABLE 1. ICC results for volume calculations based on single rating, absolute agreement and 2-way mixed model.
Intraclass correlation
95% confidence interval
Lower bound Upper bound
Single measure 0.957 0.898 0.985
TABLE 2. Influence of scanning resolution on volume.
Resolution
High Medium Low
Volume (L) 2.5072 2.5369 2.6516
KARAKASHIAN et al.112
section. This could be due to the irregularities in cir-cumference, which are significant in this area withconcave and convex parts. The circularity of the armcan either be investigated by plotting the standard
deviation of the radius or the circularity as defined inEq. (5) along the axial position of the arm. In order tocompare the shape of these curves with the circum-ference distribution, all curves were normalised and
FIGURE 2. (a) Comparison between the three main volume calculations; integral, frustum and disc methods. Data for all 24patients with mean arm volumes are indicated by bar height, and standard deviations with vertical lines; (b) comparison betweenthe 4 and 0.1 cm intervals highlighted for disc method.
Lymphoedema Shape Analysis 113
plotted in Fig. 4d. This shows that the circularity re-duces as you move towards the elbow. At the elbow,there is a very clear minimum and maximum for boththe circularity and standard deviation respectively.These are more pronounced than the dip in the cir-cumference graphs and it can be clearly identified forall patients. Hence, circularity can be used as a cleardistinguishable marker on the arm, which is usefulwhen seeking an automated comparison between thehealthy and affected limb or when identifying oedemaprogression when monitoring the patient over longerperiods of time.
Paired-sample t-test was carried out to distinguishhealthy and affected arms using circumference andcircularity measurements. To compare the sameanatomical regions across all 24 patients, and due tothe variability between forearm/upper lengths ofpatients, the elbow was chosen as a reference point,from which a proportion of the total arm length wasadded or subtracted to study the region above andbelow the elbow. Healthy and affected forearms can bedistinguished using circularity, whilst both the upper
and lower arms could be identified using circumference(p £ 0.05). The positions across which these statisticaldifferences occurred are visualised on a random arm inFig. 5. When the healthy arms of all 24 patients weredivided into two groups, the t-test was incapable todistinguish between them (p £ 0.05).
Data Clustering
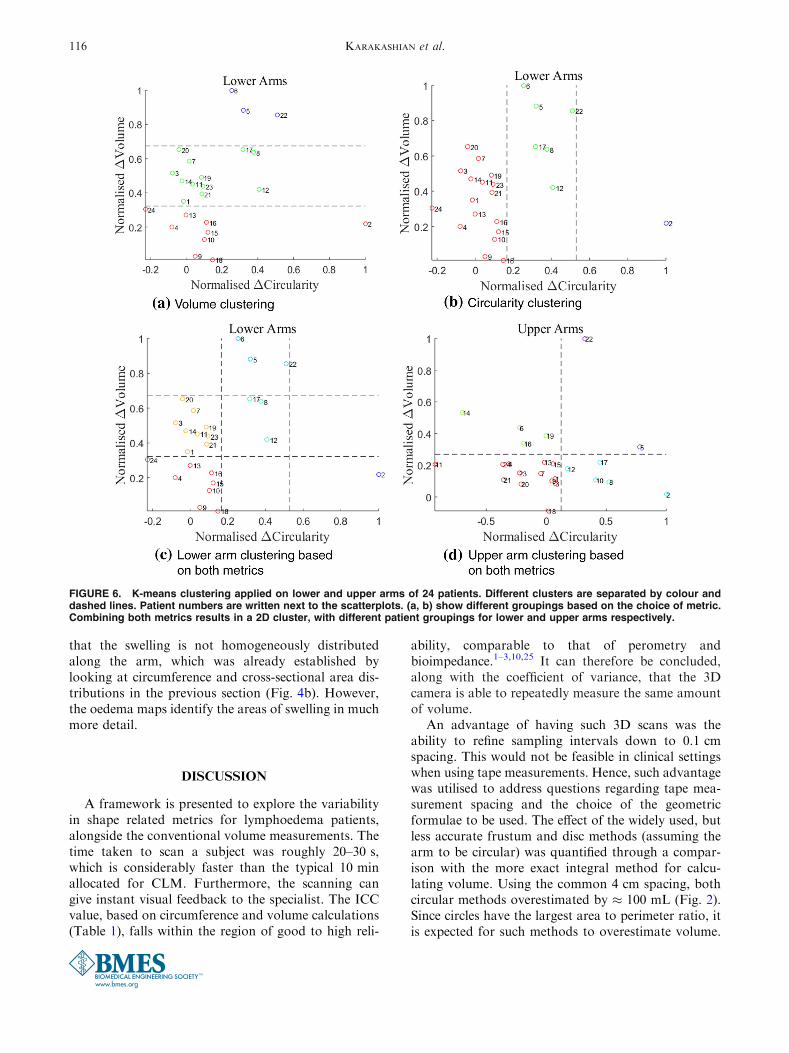
As mentioned earlier, the difference between theaffected and healthy arm is a good indicator formonitoring unilateral lymphoedema. Therefore, k-means was applied using the metricsVolumeaffected�healthy and Circularityaffected�healthy. Fig-
ure 6 shows different patient groupings based on vol-ume, circularity and the combination of both. Lowerarms resulted in different patient grouping whencompared to upper arms. The results clearly indicatedifferent groupings of patients, which could be used tocorrelate patient outcome with the initial state of thearm.
Oedema Maps
In the previous section, it is shown that there isvariability in the arm shape between different patients.However, the aim is to develop a framework thatwould be able to distinguish patient groups and targettheir treatment accordingly. Metrics such as circularityor gradients in circularity could be used, but even thosemetrics would ‘‘hide’’ topological information of thearm. Therefore, a more detailed study of the geometryis proposed in this section where the entire arm surfaceis considered alongside the contour maps as describedin the post-processing section of the Appendix.
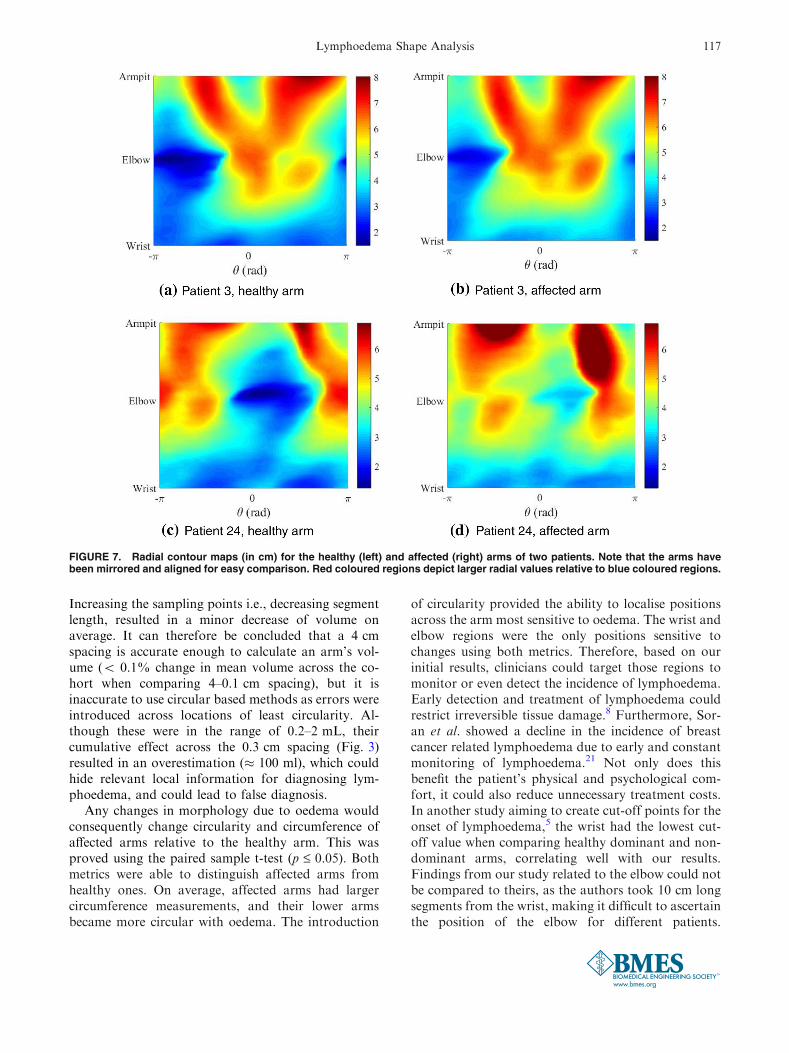
Figure 7 shows the radial maps for both arms oftwo patients. There are clear similarities to be recog-nised between these maps as both arms for a givenperson are typically similar. As expected, the radialvalues in Figs. 7b and 7d are overall higher than thosein Figs. 7a and 7c, respectively. However, these radialmaps are not particularly informative if one is inter-ested in swelling changes. Therefore, a map showingthe radial differences can be useful to identify thoseareas that experience most swelling. This requires threesteps in terms of alignment of the graphs. The first stepis mirroring of the arm. The second and the third steprequire a shift in axial and circumferential direction asdescribed in the ‘‘Materials and Methods’’.
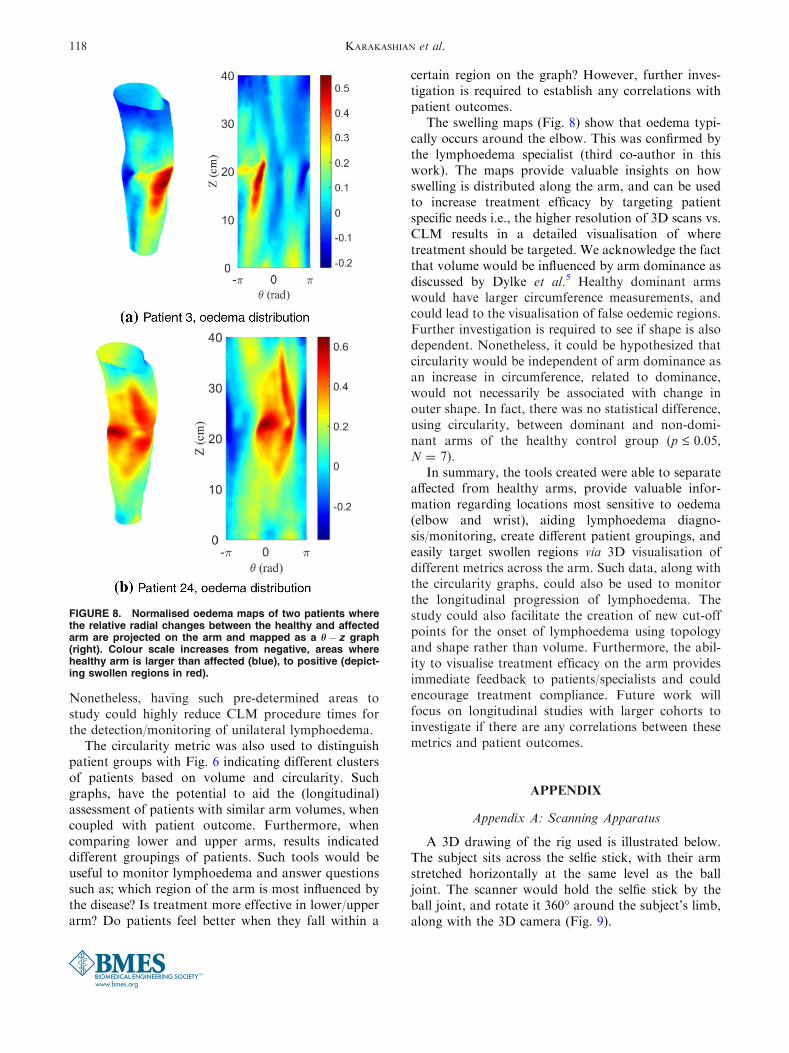
After subtraction of the radial values for both armsa contour map of the radial changes can be constructed(Fig. 8). A relative measure for swelling was usedwhere the radial difference is scaled with the localradius of the affected arm. The figure clearly shows
FIGURE 3. Volume error calculation of disc-minus-integral(mL). Large errors/differences between the disc and integralmethod are depicted by red. Due to the assumption of circu-larity, the mean error from all 24 patients was found to have apeak at the elbow, and another on the upper arm. This wastrue for both affected and healthy arms. The sampling intervalwas 1% of the normalised height � 0.3 cm.
KARAKASHIAN et al.114
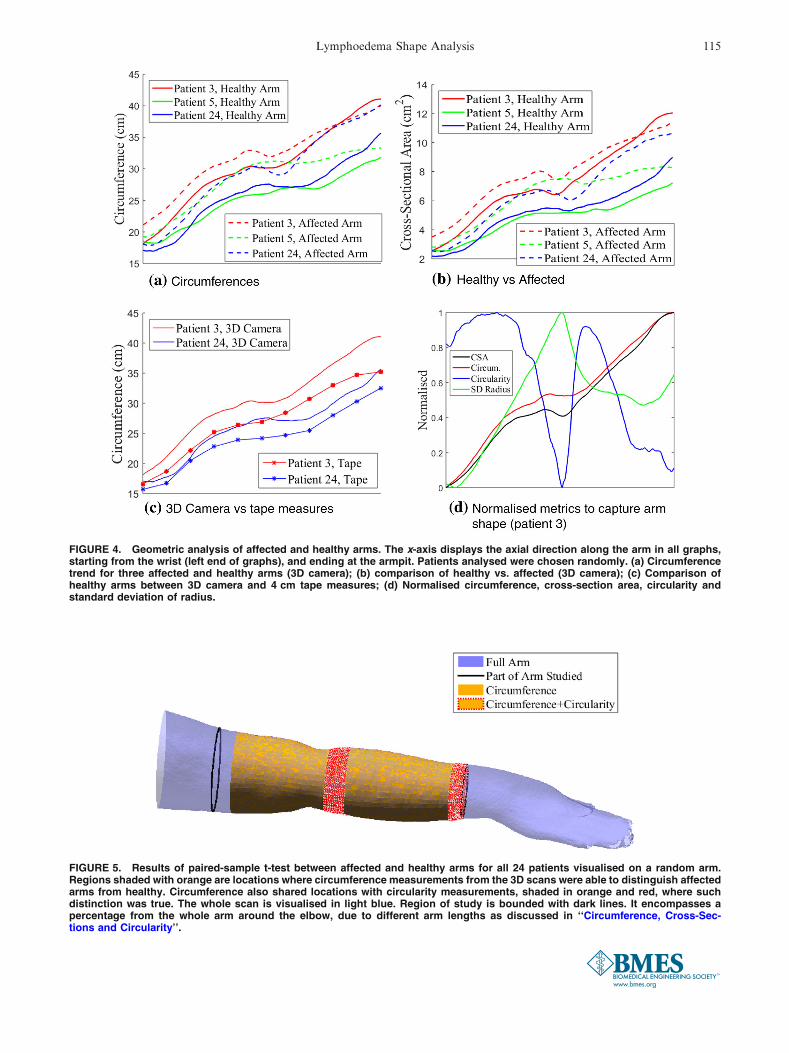
FIGURE 4. Geometric analysis of affected and healthy arms. The x-axis displays the axial direction along the arm in all graphs,starting from the wrist (left end of graphs), and ending at the armpit. Patients analysed were chosen randomly. (a) Circumferencetrend for three affected and healthy arms (3D camera); (b) comparison of healthy vs. affected (3D camera); (c) Comparison ofhealthy arms between 3D camera and 4 cm tape measures; (d) Normalised circumference, cross-section area, circularity andstandard deviation of radius.
FIGURE 5. Results of paired-sample t-test between affected and healthy arms for all 24 patients visualised on a random arm.Regions shaded with orange are locations where circumference measurements from the 3D scans were able to distinguish affectedarms from healthy. Circumference also shared locations with circularity measurements, shaded in orange and red, where suchdistinction was true. The whole scan is visualised in light blue. Region of study is bounded with dark lines. It encompasses apercentage from the whole arm around the elbow, due to different arm lengths as discussed in ‘‘Circumference, Cross-Sec-tions and Circularity’’.
Lymphoedema Shape Analysis 115
that the swelling is not homogeneously distributedalong the arm, which was already established bylooking at circumference and cross-sectional area dis-tributions in the previous section (Fig. 4b). However,the oedema maps identify the areas of swelling in muchmore detail.
DISCUSSION
A framework is presented to explore the variabilityin shape related metrics for lymphoedema patients,alongside the conventional volume measurements. Thetime taken to scan a subject was roughly 20–30 s,which is considerably faster than the typical 10 minallocated for CLM. Furthermore, the scanning cangive instant visual feedback to the specialist. The ICCvalue, based on circumference and volume calculations(Table 1), falls within the region of good to high reli-
ability, comparable to that of perometry andbioimpedance.1–3,10,25 It can therefore be concluded,along with the coefficient of variance, that the 3Dcamera is able to repeatedly measure the same amountof volume.
An advantage of having such 3D scans was theability to refine sampling intervals down to 0.1 cmspacing. This would not be feasible in clinical settingswhen using tape measurements. Hence, such advantagewas utilised to address questions regarding tape mea-surement spacing and the choice of the geometricformulae to be used. The effect of the widely used, butless accurate frustum and disc methods (assuming thearm to be circular) was quantified through a compar-ison with the more exact integral method for calcu-lating volume. Using the common 4 cm spacing, bothcircular methods overestimated by � 100 mL (Fig. 2).Since circles have the largest area to perimeter ratio, itis expected for such methods to overestimate volume.
FIGURE 6. K-means clustering applied on lower and upper arms of 24 patients. Different clusters are separated by colour anddashed lines. Patient numbers are written next to the scatterplots. (a, b) show different groupings based on the choice of metric.Combining both metrics results in a 2D cluster, with different patient groupings for lower and upper arms respectively.
KARAKASHIAN et al.116
Increasing the sampling points i.e., decreasing segmentlength, resulted in a minor decrease of volume onaverage. It can therefore be concluded that a 4 cmspacing is accurate enough to calculate an arm’s vol-ume (< 0.1% change in mean volume across the co-hort when comparing 4–0.1 cm spacing), but it isinaccurate to use circular based methods as errors wereintroduced across locations of least circularity. Al-though these were in the range of 0.2–2 mL, theircumulative effect across the 0.3 cm spacing (Fig. 3)resulted in an overestimation (� 100 ml), which couldhide relevant local information for diagnosing lym-phoedema, and could lead to false diagnosis.
Any changes in morphology due to oedema wouldconsequently change circularity and circumference ofaffected arms relative to the healthy arm. This wasproved using the paired sample t-test (p £ 0.05). Bothmetrics were able to distinguish affected arms fromhealthy ones. On average, affected arms had largercircumference measurements, and their lower armsbecame more circular with oedema. The introduction
of circularity provided the ability to localise positionsacross the arm most sensitive to oedema. The wrist andelbow regions were the only positions sensitive tochanges using both metrics. Therefore, based on ourinitial results, clinicians could target those regions tomonitor or even detect the incidence of lymphoedema.Early detection and treatment of lymphoedema couldrestrict irreversible tissue damage.8 Furthermore, Sor-an et al. showed a decline in the incidence of breastcancer related lymphoedema due to early and constantmonitoring of lymphoedema.21 Not only does thisbenefit the patient’s physical and psychological com-fort, it could also reduce unnecessary treatment costs.In another study aiming to create cut-off points for theonset of lymphoedema,5 the wrist had the lowest cut-off value when comparing healthy dominant and non-dominant arms, correlating well with our results.Findings from our study related to the elbow could notbe compared to theirs, as the authors took 10 cm longsegments from the wrist, making it difficult to ascertainthe position of the elbow for different patients.
FIGURE 7. Radial contour maps (in cm) for the healthy (left) and affected (right) arms of two patients. Note that the arms havebeen mirrored and aligned for easy comparison. Red coloured regions depict larger radial values relative to blue coloured regions.
Lymphoedema Shape Analysis 117
Nonetheless, having such pre-determined areas tostudy could highly reduce CLM procedure times forthe detection/monitoring of unilateral lymphoedema.
The circularity metric was also used to distinguishpatient groups with Fig. 6 indicating different clustersof patients based on volume and circularity. Suchgraphs, have the potential to aid the (longitudinal)assessment of patients with similar arm volumes, whencoupled with patient outcome. Furthermore, whencomparing lower and upper arms, results indicateddifferent groupings of patients. Such tools would beuseful to monitor lymphoedema and answer questionssuch as; which region of the arm is most influenced bythe disease? Is treatment more effective in lower/upperarm? Do patients feel better when they fall within a
certain region on the graph? However, further inves-tigation is required to establish any correlations withpatient outcomes.
The swelling maps (Fig. 8) show that oedema typi-cally occurs around the elbow. This was confirmed bythe lymphoedema specialist (third co-author in thiswork). The maps provide valuable insights on howswelling is distributed along the arm, and can be usedto increase treatment efficacy by targeting patientspecific needs i.e., the higher resolution of 3D scans vs.CLM results in a detailed visualisation of wheretreatment should be targeted. We acknowledge the factthat volume would be influenced by arm dominance asdiscussed by Dylke et al.5 Healthy dominant armswould have larger circumference measurements, andcould lead to the visualisation of false oedemic regions.Further investigation is required to see if shape is alsodependent. Nonetheless, it could be hypothesized thatcircularity would be independent of arm dominance asan increase in circumference, related to dominance,would not necessarily be associated with change inouter shape. In fact, there was no statistical difference,using circularity, between dominant and non-domi-nant arms of the healthy control group (p £ 0.05,N = 7).
In summary, the tools created were able to separateaffected from healthy arms, provide valuable infor-mation regarding locations most sensitive to oedema(elbow and wrist), aiding lymphoedema diagno-sis/monitoring, create different patient groupings, andeasily target swollen regions via 3D visualisation ofdifferent metrics across the arm. Such data, along withthe circularity graphs, could also be used to monitorthe longitudinal progression of lymphoedema. Thestudy could also facilitate the creation of new cut-offpoints for the onset of lymphoedema using topologyand shape rather than volume. Furthermore, the abil-ity to visualise treatment efficacy on the arm providesimmediate feedback to patients/specialists and couldencourage treatment compliance. Future work willfocus on longitudinal studies with larger cohorts toinvestigate if there are any correlations between thesemetrics and patient outcomes.
APPENDIX
Appendix A: Scanning Apparatus
A 3D drawing of the rig used is illustrated below.The subject sits across the selfie stick, with their armstretched horizontally at the same level as the balljoint. The scanner would hold the selfie stick by theball joint, and rotate it 360� around the subject’s limb,along with the 3D camera (Fig. 9).
FIGURE 8. Normalised oedema maps of two patients wherethe relative radial changes between the healthy and affectedarm are projected on the arm and mapped as a h� z graph(right). Colour scale increases from negative, areas wherehealthy arm is larger than affected (blue), to positive (depict-ing swollen regions in red).
KARAKASHIAN et al.118
Appendix B: Pre-processing
Cleaning Despite the development of a rigorousprocedure the outputted STL-files often incorpo-rated unwanted information/artifacts, such as clin-ical surroundings and undesirable parts of thepatients themselves. These artifacts were removedusing an algorithm built in the scientific computingsoftware MATLAB. The axial position of an armwithin a given scan is typically located at about 70%of the total scan height. The faces of unwantedverticesbelowandabove this locationwere removedallowing better control on the remaining geometry.To solely attain the arm, a region of interest (ROI)having the shape of a spheroid was created andcentred around the geometry’s centre of mass. Ini-tially, this centre of mass sits relatively close to thearm yet is skewed due to the presence of other un-wanted features such as the patient’s body and tri-pod. Therefore, the ROI was made wide enoughtransversely to incorporate the arm along with theunwanted features. The centre of mass for thegeometry was then calculated based on a non-ho-mogeneous distribution of density by assigningmore mass to all the vertices inside the spheroid.Subsequently, the ROI was made smaller in an
iterative process, shifting the centre ofmass towardsthe arm’s centre point. Solving the eigenvalueproblem Iwi ¼ kiwi, where I is themoment of inertiatensor, gave the principle axis of the manifold wi
encompassed by the spheroid. Afterwards, verticeslying radially 15 cm away from the principal axiswere removed resulting in the hand, arm and someof the shoulder.Note that for all remaining pre- andpost-processing stepsMATLAB softwarewas used.
Repositioning and Orientation The triangulated armmanifold is typically not aligned with one of themain Cartesian axes. As this is very convenient forfurther pre- and post-processing steps, an automatedrotation algorithm was created based on the princi-pal axis of the manifold. The main principle axis ofan arm always lies in the axial direction. This wasused to align the arm with a given Cartesian axis. Itshould be noted that the principle axis found wascompromised when the hand or body were still partof the geometry. To overcome this problem theprocedure was iteratively combined with the crop-ping algorithm described next.Cropping and Patching To assess arm lymphoedema,clinical measurements are typically taken from thewrist to the armpit. Currently the user identifies thewrist manually by clicking on it. For consistency
FIGURE 9. 3D drawing of the scanning apparatus. The STL scan, shown in blue, illustrates the subject’s seating position relativeto the rig.
Lymphoedema Shape Analysis 119
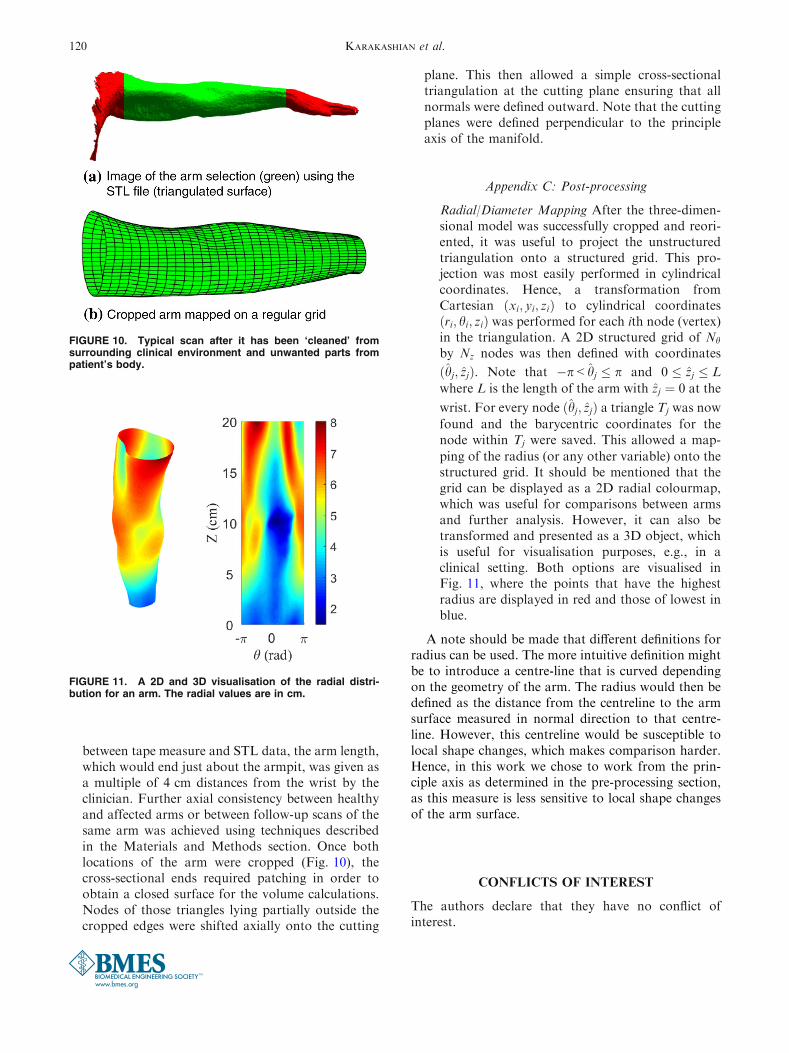
between tape measure and STL data, the arm length,which would end just about the armpit, was given asa multiple of 4 cm distances from the wrist by theclinician. Further axial consistency between healthyand affected arms or between follow-up scans of thesame arm was achieved using techniques describedin the Materials and Methods section. Once bothlocations of the arm were cropped (Fig. 10), thecross-sectional ends required patching in order toobtain a closed surface for the volume calculations.Nodes of those triangles lying partially outside thecropped edges were shifted axially onto the cutting
plane. This then allowed a simple cross-sectionaltriangulation at the cutting plane ensuring that allnormals were defined outward. Note that the cuttingplanes were defined perpendicular to the principleaxis of the manifold.
Appendix C: Post-processing
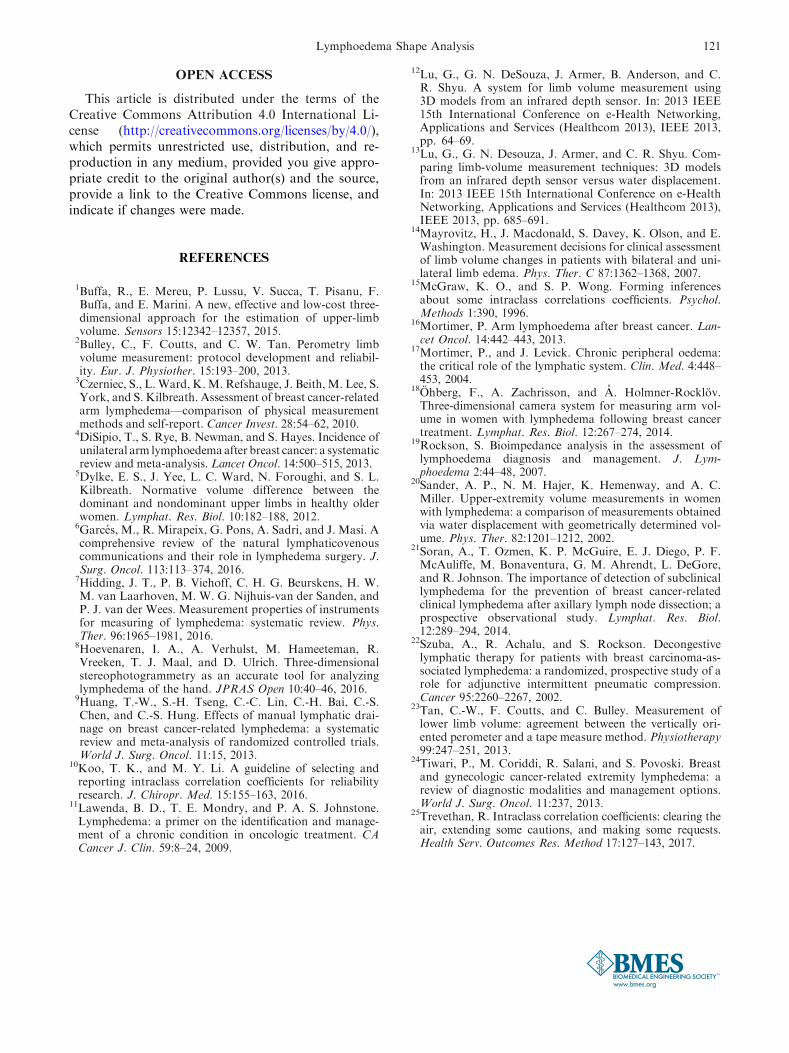
Radial/Diameter Mapping After the three-dimen-sional model was successfully cropped and reori-ented, it was useful to project the unstructuredtriangulation onto a structured grid. This pro-jection was most easily performed in cylindricalcoordinates. Hence, a transformation fromCartesian xi; yi; zið Þ to cylindrical coordinatesri; hi; zið Þ was performed for each ith node (vertex)in the triangulation. A 2D structured grid of Nh
by Nz nodes was then defined with coordinates
ðhj; zjÞ. Note that �p<hj � p and 0 � zj � L
where L is the length of the arm with zj ¼ 0 at the
wrist. For every node ðhj; zjÞ a triangle Tj was now
found and the barycentric coordinates for thenode within Tj were saved. This allowed a map-
ping of the radius (or any other variable) onto thestructured grid. It should be mentioned that thegrid can be displayed as a 2D radial colourmap,which was useful for comparisons between armsand further analysis. However, it can also betransformed and presented as a 3D object, whichis useful for visualisation purposes, e.g., in aclinical setting. Both options are visualised inFig. 11, where the points that have the highestradius are displayed in red and those of lowest inblue.
A note should be made that different definitions forradius can be used. The more intuitive definition mightbe to introduce a centre-line that is curved dependingon the geometry of the arm. The radius would then bedefined as the distance from the centreline to the armsurface measured in normal direction to that centre-line. However, this centreline would be susceptible tolocal shape changes, which makes comparison harder.Hence, in this work we chose to work from the prin-ciple axis as determined in the pre-processing section,as this measure is less sensitive to local shape changesof the arm surface.
CONFLICTS OF INTEREST
The authors declare that they have no conflict ofinterest.
FIGURE 10. Typical scan after it has been ‘cleaned’ fromsurrounding clinical environment and unwanted parts frompatient’s body.
FIGURE 11. A 2D and 3D visualisation of the radial distri-bution for an arm. The radial values are in cm.
KARAKASHIAN et al.120
OPEN ACCESS
This article is distributed under the terms of theCreative Commons Attribution 4.0 International Li-cense (http://creativecommons.org/licenses/by/4.0/),which permits unrestricted use, distribution, and re-production in any medium, provided you give appro-priate credit to the original author(s) and the source,provide a link to the Creative Commons license, andindicate if changes were made.
REFERENCES
1Buffa, R., E. Mereu, P. Lussu, V. Succa, T. Pisanu, F.Buffa, and E. Marini. A new, effective and low-cost three-dimensional approach for the estimation of upper-limbvolume. Sensors 15:12342–12357, 2015.2Bulley, C., F. Coutts, and C. W. Tan. Perometry limbvolume measurement: protocol development and reliabil-ity. Eur. J. Physiother. 15:193–200, 2013.3Czerniec, S., L. Ward, K.M. Refshauge, J. Beith, M. Lee, S.York, and S. Kilbreath. Assessment of breast cancer-relatedarm lymphedema—comparison of physical measurementmethods and self-report. Cancer Invest. 28:54–62, 2010.4DiSipio, T., S. Rye, B. Newman, and S. Hayes. Incidence ofunilateral arm lymphoedemaafter breast cancer: a systematicreview and meta-analysis. Lancet Oncol. 14:500–515, 2013.5Dylke, E. S., J. Yee, L. C. Ward, N. Foroughi, and S. L.Kilbreath. Normative volume difference between thedominant and nondominant upper limbs in healthy olderwomen. Lymphat. Res. Biol. 10:182–188, 2012.6Garces, M., R. Mirapeix, G. Pons, A. Sadri, and J. Masi. Acomprehensive review of the natural lymphaticovenouscommunications and their role in lymphedema surgery. J.Surg. Oncol. 113:113–374, 2016.7Hidding, J. T., P. B. Viehoff, C. H. G. Beurskens, H. W.M. van Laarhoven, M. W. G. Nijhuis-van der Sanden, andP. J. van der Wees. Measurement properties of instrumentsfor measuring of lymphedema: systematic review. Phys.Ther. 96:1965–1981, 2016.8Hoevenaren, I. A., A. Verhulst, M. Hameeteman, R.Vreeken, T. J. Maal, and D. Ulrich. Three-dimensionalstereophotogrammetry as an accurate tool for analyzinglymphedema of the hand. JPRAS Open 10:40–46, 2016.9Huang, T.-W., S.-H. Tseng, C.-C. Lin, C.-H. Bai, C.-S.Chen, and C.-S. Hung. Effects of manual lymphatic drai-nage on breast cancer-related lymphedema: a systematicreview and meta-analysis of randomized controlled trials.World J. Surg. Oncol. 11:15, 2013.
10Koo, T. K., and M. Y. Li. A guideline of selecting andreporting intraclass correlation coefficients for reliabilityresearch. J. Chiropr. Med. 15:155–163, 2016.
11Lawenda, B. D., T. E. Mondry, and P. A. S. Johnstone.Lymphedema: a primer on the identification and manage-ment of a chronic condition in oncologic treatment. CACancer J. Clin. 59:8–24, 2009.
12Lu, G., G. N. DeSouza, J. Armer, B. Anderson, and C.R. Shyu. A system for limb volume measurement using3D models from an infrared depth sensor. In: 2013 IEEE15th International Conference on e-Health Networking,Applications and Services (Healthcom 2013), IEEE 2013,pp. 64–69.
13Lu, G., G. N. Desouza, J. Armer, and C. R. Shyu. Com-paring limb-volume measurement techniques: 3D modelsfrom an infrared depth sensor versus water displacement.In: 2013 IEEE 15th International Conference on e-HealthNetworking, Applications and Services (Healthcom 2013),IEEE 2013, pp. 685–691.
14Mayrovitz, H., J. Macdonald, S. Davey, K. Olson, and E.Washington. Measurement decisions for clinical assessmentof limb volume changes in patients with bilateral and uni-lateral limb edema. Phys. Ther. C 87:1362–1368, 2007.
15McGraw, K. O., and S. P. Wong. Forming inferencesabout some intraclass correlations coefficients. Psychol.Methods 1:390, 1996.
16Mortimer, P. Arm lymphoedema after breast cancer. Lan-cet Oncol. 14:442–443, 2013.
17Mortimer, P., and J. Levick. Chronic peripheral oedema:the critical role of the lymphatic system. Clin. Med. 4:448–453, 2004.
18Ohberg, F., A. Zachrisson, and A. Holmner-Rocklov.Three-dimensional camera system for measuring arm vol-ume in women with lymphedema following breast cancertreatment. Lymphat. Res. Biol. 12:267–274, 2014.
19Rockson, S. Bioimpedance analysis in the assessment oflymphoedema diagnosis and management. J. Lym-phoedema 2:44–48, 2007.
20Sander, A. P., N. M. Hajer, K. Hemenway, and A. C.Miller. Upper-extremity volume measurements in womenwith lymphedema: a comparison of measurements obtainedvia water displacement with geometrically determined vol-ume. Phys. Ther. 82:1201–1212, 2002.
21Soran, A., T. Ozmen, K. P. McGuire, E. J. Diego, P. F.McAuliffe, M. Bonaventura, G. M. Ahrendt, L. DeGore,and R. Johnson. The importance of detection of subclinicallymphedema for the prevention of breast cancer-relatedclinical lymphedema after axillary lymph node dissection; aprospective observational study. Lymphat. Res. Biol.12:289–294, 2014.
22Szuba, A., R. Achalu, and S. Rockson. Decongestivelymphatic therapy for patients with breast carcinoma-as-sociated lymphedema: a randomized, prospective study of arole for adjunctive intermittent pneumatic compression.Cancer 95:2260–2267, 2002.
23Tan, C.-W., F. Coutts, and C. Bulley. Measurement oflower limb volume: agreement between the vertically ori-ented perometer and a tape measure method. Physiotherapy99:247–251, 2013.
24Tiwari, P., M. Coriddi, R. Salani, and S. Povoski. Breastand gynecologic cancer-related extremity lymphedema: areview of diagnostic modalities and management options.World J. Surg. Oncol. 11:237, 2013.
25Trevethan, R. Intraclass correlation coefficients: clearing theair, extending some cautions, and making some requests.Health Serv. Outcomes Res. Method 17:127–143, 2017.
Lymphoedema Shape Analysis 121