Embed Size (px)
Citation preview

Bull. Environm. Contain. Toxicol. 27,481-488 (1981)
Investigation of Selective Uptake of Polychlorinated Biphenyls by Spartina alternifiora Loisel 1,2
E. Mrozek, Jr. and R. B. Leidy
Department of Botany and Pesticide Residue Research Laboratory, North Carolina State University, Raleigh, NC 27650
Polychlorinated biphenyls (PCB's) are worldwide environmental contaminants which are generally toxic, resistant to degradation, and have been detected in organisms at all trophic levels. Although the combination of their chemical and physical properties and the processes which distribute and transport these xenobiotic substances results in their concentration in the coastal-estuarine ecosystem (WAL~H, 1972) few investigations have been reported which address the results of exposure of estuarine vegetation to PCB's and other chlorinated hydrocarbons.
The present study was conducted as part of an investigation of the role of Spartina alterniflora Loisel. (saltmarsh cordgrass) in the movement of chlorinated hydrocarbons in the estuarine ecosystem. Uptake of 14C-polychlorinated biphenyls has been reported (MROZEK et al. 1981). Chromatograms which confirm that the 14C-radioactivity represents PCB molecules, appeared to indicate that PCB uptake by S. alterniflora was selective for the early eluting (i.e., lesser chlorinated) components of a technical PCB mixture, Aroclor | 1254. The purpose of the present investigation was to I) provide further evidence that S. alterniflora represents a potential pathway for the movement of chlorinated hydrocarbons in the estuarine system using the PCB's as model chlorinated hydrocarbons, 2) determine if uptake of PCB's by ~. alterniflora is a selective process, and 3) assess the effect of selective uptake on the reliability of concentration estimates based on the use of standard-sample chromatogram comparisons for concentration estimates.
1 Paper No. 6964 of the Journal Series of the North Carolina State University Agricultural Research Service.
2 Mention of a trademark or proprietary product by North Carolina State University at Raleigh does not imply approval of the products named to the exclusion of other products that may be suitable.
481
0007-4861/81/0027-0481 $01.60 �9 1981 Springer-Verlag New York Inc.

MATERIALS AND METHODS
Plant materials. Plants of S. alterniflora were collected from a marsh fringe in the Morehead City channel east of the state Port Authority area, Morehead City, NC (34 ~ 43' N, 76 ~ 41' W). The plants were transported to the greenhouse facility with the roots and rhizomes covered with sand and saturated with water from the channel (salinity = 18 parts per thousand).
PCB material. Analytical grade Aroclor @ 1254 (Monsanto Co.) Lot AM 51 was supplied by the Food and Drug Protection Division Laboratory, North Carolina Department of Agriculture.
Culture vessel establishment. A total of 0.3 mg of Aroclor ~ 1'254 was applied to 3.0 kg of washed coarse river bottom sand contained in 5.5 buckets. The chemical was applied in a benzene: hexane (i:i) solution and sufficient time was allowed for solvent evaporation before the sand was mixed to homogeneously distribute the chemical. Five plants of S. alterniflora were planted in the treated soil and immediately watered with i of nutrient solution from the Southeastern Plant Environmental Laboratories, North Carolina State Unit (Phytotron) (DOWNS and BONAMINIO 1976). Salinity of the initial nutrient solution was adjusted to 15 ppt with Instant Ocean @ . Initial water levels were recorded and maintained by daily additions of nutrient solution. The final PCB concentration was 1.0 or 0.75 ppm based on soil dry weight or soil and water weight, respectively.
Plant sample preparatio n . Plants were harvested after a 90-day growth period with average minimum and maximum daily temperature of 15.32 0.2 and 31.4 0.5 ~ respectively (n=90). Aerial portions (stems and leaves) and belowground portions (roots and rhizomes) were separated, washed with tap water for gas chromatographic examination by methods outlined in MROZEE et al. (1981).
Soil sample preparation. One-kg soil samples were collected from each pot and air dried. Subsamples (75g) were extracted and cleaned up by the procedure referenced above. Untreated samples fortified with known concentrations of PCB and analyzed indicated a 93.0% recovery efficiency for all samples and thus, no correction factor was used in estimating PCB concentrations in sample materials.
Gas chromatography. A Model MT 220 (Tracor, Inc.) gas chromatograph equipped with a 63Ni electron capture detector was used in this study. Two column systems were used for PCB determinations: i) U-shaped glass (183 X 0.63 cm; 0.4 em i.d.) packed with 4% SE 30 + 6% OV-210 on Gas Chrom Q (80/100). Nitrogen was the carrier gas with a flow rate of 70 ml/min.; 2) U-shaped glass (183 x 0.63 cm; 0.2 cm i.d.) packed with 3% OV-I on Gas Chrom Q (60/80). Nitrogen flow rate was 38 ml/min. Attenuation was held constant for both systems and sample concentrations were adjusted by serial dilution for chromatography under the set conditions.
482

Duplicate injections of samples were bracketed by injections of known amounts of standard. The resulting chromatograms were used to determine the retention times of standard and sample peaks. Peak height measurements of 17 consistent peaks (1-17) on column 1 were used to determine shifting in the relative intensities of the components of the sample extract and compared with those of standard Aroclor | 1254. PCB concentrations were estimated by measuring the heights of 13 consistent peaks (A-M) resolved with column 2. Three different PCB concentration estimates were based on i) the height of the 13 individual peaks, 2) the mean of the 13 estimates, and 3) the total height of all 13 peaks by proportional height comparisons to chromatograms of the analytical standard.
RESULTS AND DISCUSSION
Preliminary chromatograms of Aroclor | 1254 were used to define the peaks to be used for assessment of soil and plant tissue samples. Designation of peak numbers (letters) was based on consistent separation, general shape, and reliable retention times. This analysis produced 17 peaks (1-17) on column i (Figure 7). Although responses were observed with retention times less than that of peak 1 (4.14 min.), these components were only present in the standard at trace levels. Chromatograms of the standard material produced on column 2 yielded 15 peaks (A-O) (Figure 7).
Retention times of Aroclor | 1254 peaks, and those extracted from soil, belowground tissues, and aerial tissues on both chromatography systems are summarized in Table 4. Retention times for peaks in chromatograms of soil extracts exhibited the greatest similarity to those of standard material. All designated peaks were detected in soil extracts while belowground and aerial plant tissue samples did not contain detectable levels of some of the more chlorinated (i.e. later eluting) components in chromatograms produced on column I. Peak 17 from belowground tissues and peaks 15 through 17 from aerial tissue samples were not present at detectable levels. Additionally, peak 8 was detected only at trace levels in the aerial tissue extracts. Similar results were obtained on column 2 (Table 5). Retention times of PCB's from soil extracts were nearly identical to those of the standard. Later eluting components (peaks L-O) were not present in all tissue samples or were entirely missing, as in the aerial tissue samples.
Increasing absence of the later eluting components in the progression from soil, to belowground tissues, to aerial tissues suggests that the uptake of PCB's by ~. alterniflora is selective for the lesser chlorinated (i.e., early eluting) components of Aroelor | 1254; similar to that seen in carrot plants (IWATA et al. 1974). In order to examine the possibility of selectivity, height measurements of the 17 peaks detected on column 1 were normalized to percent height of peak 5 for all samples and mean
483

150_
130_
~: 110_
90_
~. 70_
<~ 50_
30_
10_
|
( n
i i
�9
2'0 3() 4() 5() RETENTION TIME (rain.)
I I I I
2 3 4 5 6 7 8 9 10 11 12 13 14 16 17 PEAK NUMBER
Figure I. (A) Chromatogram of 3.5 ng of Aroclor | 1254 on column 1 (4% SE 30 and 6% OU 210 on Gas Chrom Q; 80/100); Attenuation, 16 X 102 . Peak numbers correspond to those in Figure C and Table I. (B) Chromatogramic of 1.6 ng of Aroclor | 1254 on column 2 (3% OV 1 on Gas Chrom Q; 60/80); Attenuation, 16 X 102 . Chromatographic conditions described in methods and materials. (C) Relative height of chromatographic peaks designated in Figure A. Calculated as percent height of peak 5 for ~ standard (Aroclor | 1254), ~ belowground tissue samples, ~ aerial tissue samples, and ~ soil samples. Brackets represent 1 standard error and the number above the bracket indicates the number of samples used in calculating the standard error.
484

TABL
E i
Mean
ret
enti
on ti
mes
and
(sta
ndar
d er
rors
) fo
r ch
roma
togr
aphi
c pe
aks
obta
ined
wi
th A
rocl
or |
1254,
soil
sa
mple
s an
d be
lowg
roun
d an
d ae
rial
pl
ant
tiss
ue sa
mple
s on
2
chro
mato
grap
hy sy
stem
. Pe
ak d
esig
nati
on fo
r co
ltmm
1 an
d 2
foll
ow t
hat
outl
ined
in
Fig
ure
A an
d B, re
spec
tive
ly.
4~
Colu
mn:
Colu
mn I
(4%SE-30, 6%
or-
210)
Co
lumn
2
(3%
OV-l
) Sample:
Aroc
lor
1254
So
il
Belo
wgro
und
Aeri
al
Aroc
lor
1254
So
il
Belo
wgro
und
tiss
ues
tiss
ues
tiss
ues
R.T.
(S
.E.)
a R
.T.
(S.E
.)
R.T.
(S
.E.)
R.
T. (S
.E.)
R.
T. (S
.E.)
R.T.
(S
.E.)
R.
T. (S.E.)
Peak
I.D.
1 4.
14(0
.03)
b 3.
99(0
.06)
c
4.12
(0.1
3)
4.26
(0.1
3)
A 0.
97(0
.01)
b 0.
94(0
.02)
0.
98(<
0.01
) 2
5.13
(0.0
3)
5.07
(0.0
5)
5.11
(0.1
3)
5.28
(0.2
4)
B 1.
21(0
.01)
1.
21(0
.03)
1.
24(0
.02)
3
5.97
(0.0
3)
5.80
(0.0
6)
5.98
().1
6)
6.08
(0.1
7)
C 1.
38(0
.02)
1.
36(0
.02)
1.
39(<
0.01
) 4
7.75
(0.0
3)
7.68
(0.0
6)
7.71
(0.2
6)
7.91
(0.0
6)
D 1.
50(0
.01)
1.
49(0
.04)
1.
46(0
.04)
5
9.06
(0.0
5)
9.05
(0.0
0)
9.02
(0.2
5)
9.14
(0.0
8)
E 1.
82(0
.01)
1.
83(0
.03)
1.
84(<
0.01
) 6
10.8
6(0.
06)
10.8
7(0.
01)
10.8
5(0.
14)
10.9
5(0.
06)
F 2.
15(0
.05)
2.
12(<
0.01
) 2.
12(0
.03)
7
11.7
6(0.
05)
11.7
9(0.
00)
11.7
2(0.
32)
11.7
7(0.
02)
G 2.
53(0
.06)
2.
53(0
.02)
2.
56(0
.01)
8
13.3
2(0.
07)
13.3
9(0.
01)
13.2
6(0.
37)
Tr d
(--)
H 2.
70(0
.03)
2.
69(0
.02)
2.
72(<
0.01
) 9
14.1
9(0.
06)
14.2
4(0.
02)
14.1
8(0.
26)
14.1
2(0.
03)
I 3.
24(0
.03)
3.
24(0
.02)
3.
28(0
.01)
10
15
.97(
0.09
) 16
.05(
0.04
) 15
.95(
0.21
) 15
.81(
0.13
) J
3.82
(0.0
3)
3.78
(0.0
3)
3.81
(0.0
2)
II
17.0
2(0.
08)
17.1
8(0.
12)
16.9
9(0.
24)
16.8
4(0.
16)
K 4.
51(0
.04)
4.
43(0
.05)
4.
56(0
.05)
12
19
.22(
0.10
) 19
.35(
0.07
) 19
.18(
0.32
) 19
.02(
0.03
) L
5.29
(0.0
3)
5.27
(0.0
3)
5.24
(0.0
4) e
13
23.1
1(0.
13)
23.3
1(0.
12)
23.1
1(0.
29)
23.0
0(0.
00)
M 6.
37(0
.04)
6.
36(0
.04)
6.
31(0
.04)
e
14
26.2
5(0.
13)
26.3
6(0.
06)
27.3
2(0.
60)
Tr f
(--)
N 7.
31(0
.04)
7.
34(0
.03)
7.
24(<
0.01
~ 15
29.7
8(0.
25)
30.2
0(0.
20)
29.6
2(0.
53)
n.d.
(m)
0 8.
77(0
.08)
8.
73(0
.10)
8.
52(0
.04)
e
16
36.2
0(0.
23)
36.3
7(0.
17)
35.8
5(0.
49).
n.
d.
(--)
17
42.6
0(0.
24)
42.8
0(0.
19)
n.d.
(__) ~d
n.d.
(m)
Aeri
al
tiss
ues
R.T.
(S
.E.)
1.02
(0.0
1)
1.30
(<0.
01)
1.40
(<0.
01)
1.56
(<0.
01)
1.88
(0.0
1)
2.23
(0.0
1)
2.59
(0.0
3)
2.74
(0.0
2)
3.33
(<0.
01)
3.90
(0.0
1)
4.62
(<0.
01)
5.31
(0.0
2) e
6.46
( O.
02)e
7.40
(-
-) ~
n.d.
(--)
R.T. (S~bE.) =
Rete
ntio
n ti
me wi
th st
anda
rd er
ror
in p
aren
thes
es.
Aroc
lor
1254
ret
enti
on ti
mes
and
stan
dard
er
rors
ba
sed
on I0
and
7
repl
icat
e in
ject
ions
on
Co
lumn
1 an
d 2,
resp
ecti
vely
. c
Samp
le r
eten
tion
ti
mes
and
stan
dard
er
rors
ba
sed
on d
upli
cate
in
ject
ions
of
3
samp
les
each
. u
n.d.
= no
t de
tect
ed;
(--)
in
dica
tes
that
th
e ca
lcul
atio
n wa
s no
t ma
de;
Tr =
tr
ace
amou
nts
dete
cted
. e
Peak
obs
erve
d in
2 sa
mple
s of
th
at ti
ssue
type.
z Pe
ak o
bser
ved
in 1 sa
mple
of
th
at ti
ssue
type.
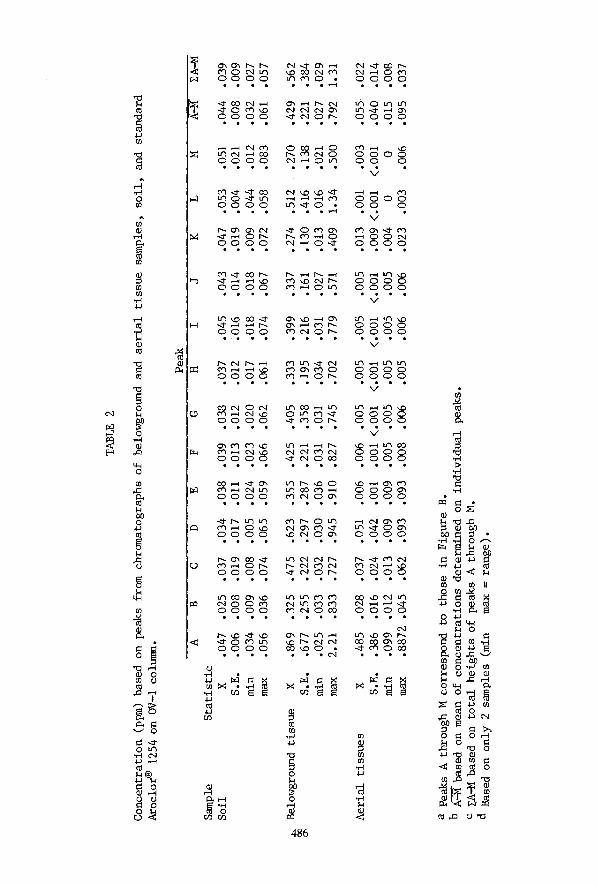
TABLE 2
Concentration (ppm)
based on peaks from chromatographs of belowground and aerial tissue samples, soil,
and standard
Aroclor |
1254 o
n OV-I colunm.
Peak
A B
C D
E F
G H
I J
K L
M ZA-M
Sample
Statistic
Soil
X .047
.025
.037
.034
.038
.039
.038
.037
.045
.043
.047
.053
.051
.044
.039
S.E.
.006
.008
.019
.017
.011
.013
.012
.012
.016
.014
.019
.004
.021
.008
.009
min
.034
.009
.008
.005
.024
.023
.020
.017
.018
.018
.009
.044
.012
.032
.027
max
.056
.036
.074
.065
.059
.066
.062
.061
.074
.067
.072
.058
.083
.061
.057
Belowground tissue
X .869
.325
.475
.623
.355
.425
.405
.333
.399
.337
.274
.512
.270
.429
.562
S.E.
.677
.255
.222
.297
.287
.221
.358
.195
.216
.161
.130
.416
.138
.221
.384
min
.025
�9
.032
.030
.036
.031
.031
.034
.031
.027
.013
.016
.021
.027
.029
max
2.21
.833
.727
.945
.910
.827
.745
.702
.779
.571
.409
1.34
.500
.792
1.31
X �9
�9
�9
�9
.006
.006
.005
.005
.005
.005
�9
.001
.003
�9
S.E.
.386
.016
.024
.042
.001
.001 <.001
<.001
<.001
<.001
.009 <.001
<.001
.040
min
.099
.012
.013
.009
.009
.005
.005
.005
.005
.005
.004
0 0
.015
max
.8872 .045
.062
.093
.093
.008
.006
.005
.006
.006
.023
.003
.006
.095
Aerial tissues
�9 022
.014
�9 008
�9 037
a Peaks A
through M
correspond to those in Figure B.
b A-~ based on m
ean of concentrations determined on individual peaks.
c ZA-M based on total heights of peaks A
through M.
d Based on only 2
samples (min
max -- range).

relative height for each peak in each sample was plotted (Figure 7). This analysis demonstrates that the early components (peaks I to 4) are enhanced relative to the standard in both types of tissue sample. Also the relative height of peaks from tissue sample extracts with retention times greater than 9.06 min were reduced. Conversely, the relative height for peaks in chromotograms of soil samples were reduced for the early eluting components and equal to or greater than the relative height of the standard for peaks 6 through 17.
Shifting of the chromotographic pattern of Aroclor | 1254 as a result of PCB uptake by S. alterniflora indicates that this process alters the character of the PCB mixture. Enhancement of the early eluting components in belowground tissues is probably a result of the water solubility of the variously chlorinated cogeners. However, further shifting of the pattern towards the lesser chlorinated components in the aerial tissues suggest that some alteration of the mixture occurs within the plant. These findings are very similar to those reported by IWATA et al. (1974) with Aroclor | 1254.
The assumption underlying the quantitation of multi-component residues by the direct comparison of chromatograms of standard and samples is that the standard material continues to represent compounds extracted from samples. Chromatograms of soil and plant tissue extracts exhibited differences relative to the standard. In order to determine the analytical implications of these differences, PCB concentrations were estimated based on height measurements of 13 individual peaks. Concentration values were calculated i) for each of the 13 peaks, 2) the mean of the 13 individual values, and 3) on the sum of peak height measurements, relative to the Aroclor | 1254 standard. The results of these calculations are summarized in Table 5. Soil sample concentration based on the 13 individual peaks was found to be the most consistent and ranged from 0.025 to 0.051 ppm, with a mean value of 0.044 ppm, which was nearly equal to the value calculated by summing the peak heights (0.039 ppm). Belowground tissue concentrations were consistently an order of magnitude greater than the soil samples. Soil values ranged from 0.869 to 0.270 ppm with a mean value of 0.429 ppm and this also was nearly equal to the value calculated on total peak height (0.562 ppm). Belowground tissue values appeared to reflect the increased importance of the early eluting components, but this was more apparent in values calculated for aerial tissues. Individual peak concentrations for aerial tissue samples ranged from 0.001 to 0.485 ppm with the first 4 peaks (A-D) contributing values from 0.051 to 0.485 ppm. The mean of the individual peak values was 0.055 ppm which was approximately twice that of the value calculated on total peak height.
It is evident from the above results that estimation of PCB concentrations by the direct comparison of plant tissue extracts and standard material results in estimate values which are of
487

questionable accuracy. This problem might be partially eliminated by the use of multiple technical mixture standards and estimating PCB concentration based on the standard which most closely resembles the sample extract in retention time and peak height patterns. A more accurate alternative to the use of multiple standards would be the use of chlorine addition reactions to convert all of the PCB material to decachlorobiphenyl, similar to that outlined by TANABE (1976). The advantage of this procedure is that it provides an estimate of total chlorobiphenyl based on a single chromatographic response.
Summary and Conclusions
The results of this study supply additional evidence that S. alterniflora represents a potential pathway for the mobilization of PCB's from estuarine sediments. The uptake process does not appear to be uniform for all of the components of the technical PCB mixture, Aroclor | 1254. Increased relative height of the early eluting components suggests selective uptake of the lesser chlorinated components. The resulting alteration of the chromatographic pattern is sufficient in some samples to warrant the use of analytical techniques other than standard-sample chromatograph comparisons for the determination of sample concentration.
REFERENCES
DOWNS, R.J., and BONAMINIO, V.P.: Phytotron Procedural Manual for Controlled-Environment Research at the Southeastern Plant Environment Laboratories. North Carolina Agricultural Experiment Station Tech. Bull. No. 244. 1976.
IWATA, Y., GUNTHER, F.A., and WESTLAKE, W.E.: Bull. Environ. Contam. Toxicol. 11(6):523-528 (1974).
MROZEK, E., Jr., SENECA, E.D., and HOBBS, L.L.: Water, Air, and Soil Pollution. In Press (1981).
TANABE, H.: In HIGUCHI, K. (ed.); PCB Poisoning and Pollution. Tokyo: Kodansha Ltd.; New York, and London: Academic Press, Inc. 1976.
WALSH, G.E.: J. Wash. Acad. Sci. 62:122-128 (1972)~
Accepted July 21, 1981
488