Embed Size (px)
Citation preview
AUTEX Research Journal, Vol. 7, No2, June 2007 © AUTEX
http://www.autexrj.org/No2-2007/0220.pdf 89
INVESTIGATION INTO THE PERIODICITY OF MASS VARIATION OF YARN AND ITS EFFECT ON FABRIC APPEARANCE
Ferede Addisu and Peer Mohamed Abdul Hameed Department of Textile Technology A. C. College of Technology Anna University Chennai 600 025, India Phone: +91-44-22203557 E-mail: [email protected]
Abstract:
The appearance of a fabric can be greatly affected if the yarn has a sufficiently pronounced periodic component. The severity of the periodic fault can only be estimated if its intensity is quantified. Even though a spectrogram is more reliable than other tools at determining periodicity, it gives only the resolved mass variation, which may not be present in the final yarn when different faults are superimposed. The relative index of irregularity of yarn is considered as a measure of the intensity of a periodic fault of a spun yarn. By correlating the above index with the relative unlevelness indices of finished fabrics knitted from yarn samples produced at different levels of roller eccentricity, we have established the threshold value of the relative index of irregularity of yarn which produces worse appearance values in the fabric.
Key words:
Eccentric roller, relative index of irregularity, relative unlevelness index, superimposed periodic faults.
Introduction Mass variation in yarn can adversely affect many properties of textile materials such as shade variations and strength. Mass variation can be attributed to the properties of raw materials, inherent short comings in yarn making and preparatory machines, mechanically defective machinery and/or external causes as a result of working conditions and improper housekeeping [1]. The variation in mass per unit length of yarn comprises three basic types [9], namely (i) irregularity of a completely random nature, (ii) irregularity of a markedly periodic nature, (iii) irregularity of a quasi-periodic nature. Purely random irregularity forms an unavoidable component of total irregularity, so that a minimum achievable random irregularity can be acceptable for apparel usage. The periodic irregularities which are found in the spun yarns may be the result of machinery defects such as eccentric drafting rollers, variability in the covering of drafting rollers, inaccurately cut or worn-out drafting rollers and the vibration of drafting rollers [3]. Yarns which are affected by any of these defects occurring in the drafting prior to spinning can appreciably affect the yarn and the resulting fabric. Periodic mass variations in yarn can cause weft bars, diamond barring effects [3], moiré effects, weft stripes or rings in the resulting fabric [8]. Hence, periodic irregularity should not be permitted at all, since it greatly affects the appearance of fabric and must be controlled. However, the presently available tools used to measure the periodicity of mass per unit length variation have limitations. The spectrogram is more reliable compared to other tools for determining periodicity; it works on the principle of Fourier analysis [8], which sets out any function in a series of sine curves. The actual mass variation will be resolved into different sinusoidal waves with different amplitudes and wavelengths. Hence, spectrogram gives only the resolved mass variation, which may not be present in the final yarn when different faults are superimposed.

AUTEX Research Journal, Vol. 7, No2, June 2007 © AUTEX
http://www.autexrj.org/No2-2007/0220.pdf 90
The main objective of the present work is to understand these limitations and establish supplementary methods for the available tools which are used to measure the periodicity of mass variation, and to suggest new measures to understand the effect of periodic mass variation of yarn on fabric appearance. Materials and methods The front bottom roller, covering eight delivery heads in a ring frame, was bent to introduce four different levels of eccentricity with two delivery heads each with the same level of eccentricity. Combed cotton yarns of 14.8 tex (40 Ne) were spun in the ring frame from the roving of 0.39 ktex (1.5 Ne) with four levels of eccentricity introduced as mentioned above (Table 1). Moreover, yarn samples without eccentricity on the front bottom roller were spun at a three-spacer thickness for two different yarn counts (Table 2). All these yarn samples were tested for irregularity in an evenness tester.
Table 1. Yarn samples produced at different levels of front bottom roller eccentricity.
Sample Yarn count, tex Spacer thickness, mm
Level of front bottom roller eccentricity, mm
1 14.8 3.0 0.254
2 14.8 3.0 0.508
3 14.8 3.0 0.762
4 14.8 3.0 1.016
Table 2. Yarn samples produced at different spacer thicknesses with out front bottom roller eccentricity
Sample Yarn count, tex Spacer thickness, mm
1 14.8 3.0
2 14.8 2.5
3 14.8 3.5
4 7.4 2.0
5 7.4 2.5
6 7.4 3.0
In order to make a quantitative assessment of the effect of periodic irregularity on fabric appearance, single jersey fabric samples were knitted using all the four yarn samples mentioned in Table 1. Fabric sample was also produced using the yarn sample 1 mentioned in Table 2 which was produced without introducing any periodic faults. These five fabric samples have been scoured, bleached and dyed in identical conditions. Finally, the fabric’s appearance was assessed by a U-3210 model spectrophotometer using a D2 illuminant and an aperture of 20 mm diameter. Determination of relative index of irregularity of yarn
The relative index of irregularity of yarn (RI) can be defined as the difference between the index of irregularity of any spun yarn ( I ) and that of an equivalent yarn without any peak in the spectrogram ( RI ). This can be written as,
RI % = ( )
−
R
R
III
* 100 (1)
AUTEX Research Journal, Vol. 7, No2, June 2007 © AUTEX
http://www.autexrj.org/No2-2007/0220.pdf 91
Expressing I in terms of CV%, the above equation can be rewritten as:
RI % = ( )
−
R
R
CVCVCV%
%%* 100 (2)
where: CV% - the coefficient mass variation of any spun yarn, CV% R - the coefficient mass variation of an equivalent yarn without any peak in the spectrogram.
As it accounts for the difference in irregularity present between the yarn with periodic variation and one with no peak in its spectrogram, the above index should be the measure of the intensity of periodic irregularity present in the final yarn spun. Determination of relative unlevelness index The relative unlevelness Index (RUI) is a measure of unlevelness of dyed fabric based on reflectance values measured throughout the visible spectrum, and can be calculated using the following equation as proposed by Chong et al [4].
RUI = ∑=
700
400__ *
λλ
λ VRs = [ ]∑
=
700
400*
λλVCV (3)
where:
R__
= the means of reflectance values of ‘n’ measurements for each wavelength sλ = the standard deviation of reflectance values measured at a specific wavelength CV = the coefficient of variation of reflectance values measured for each wavelength V λ = the phototopic relative luminous efficiency function
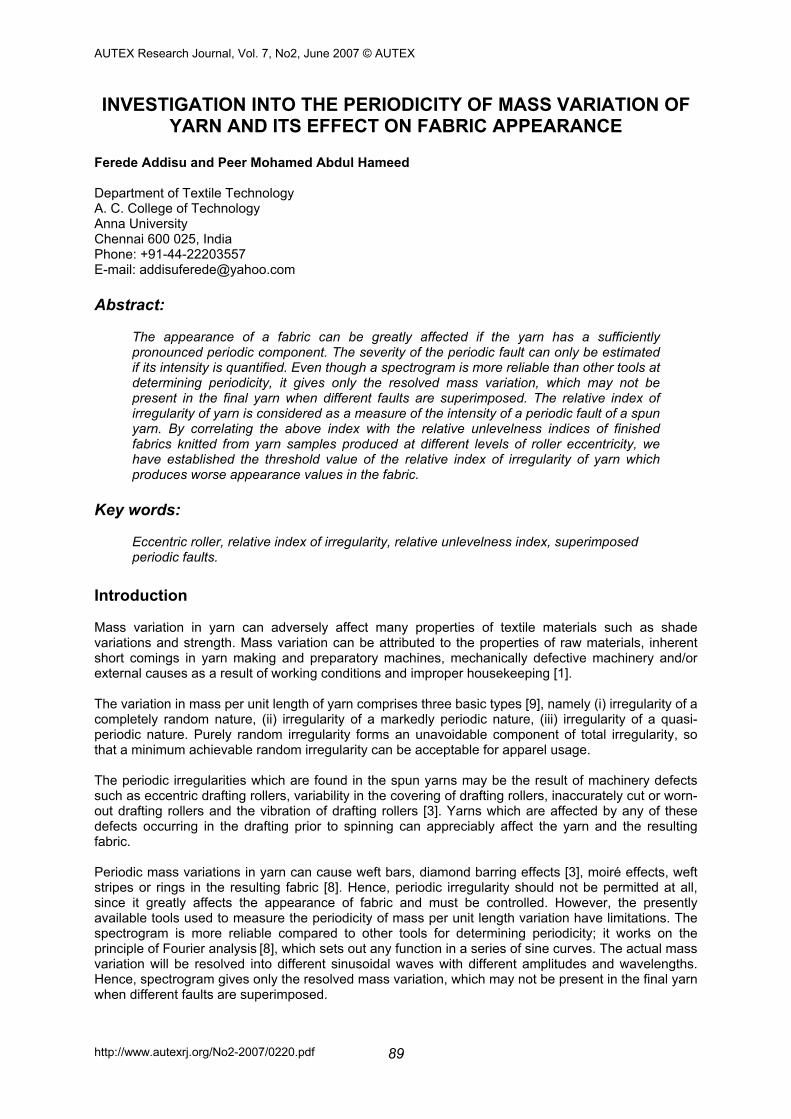
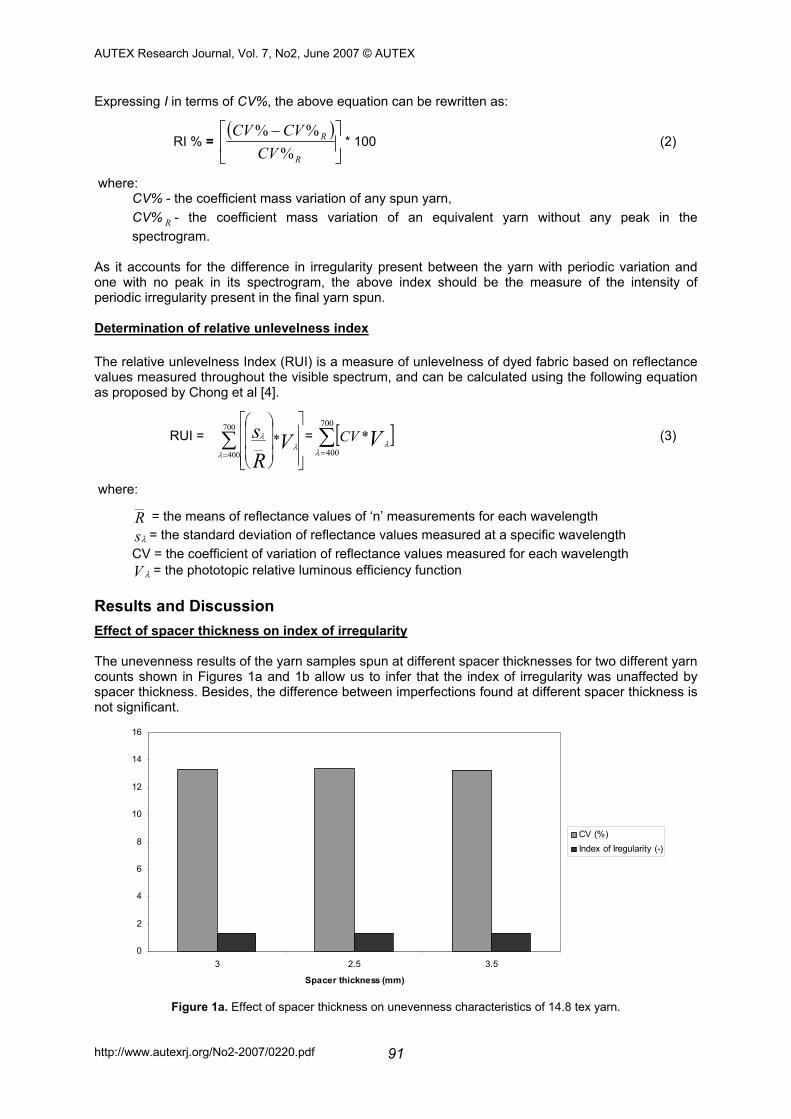
Results and Discussion Effect of spacer thickness on index of irregularity The unevenness results of the yarn samples spun at different spacer thicknesses for two different yarn counts shown in Figures 1a and 1b allow us to infer that the index of irregularity was unaffected by spacer thickness. Besides, the difference between imperfections found at different spacer thickness is not significant.
0
2
4
6
8
10
12
14
16
3 2.5 3.5
Spacer thickness (mm)
CV (%)Index of Iregularity (-)
Figure 1a. Effect of spacer thickness on unevenness characteristics of 14.8 tex yarn.
AUTEX Research Journal, Vol. 7, No2, June 2007 © AUTEX
http://www.autexrj.org/No2-2007/0220.pdf 92
0
2
4
6
8
10
12
14
16
18
2 2.5 3
Spacer thickness (mm)
CV (%)Index of irregularity (-)
Figure 1b. Effect of spacer thickness on unevenness characteristics of 7.4 tex yarn.
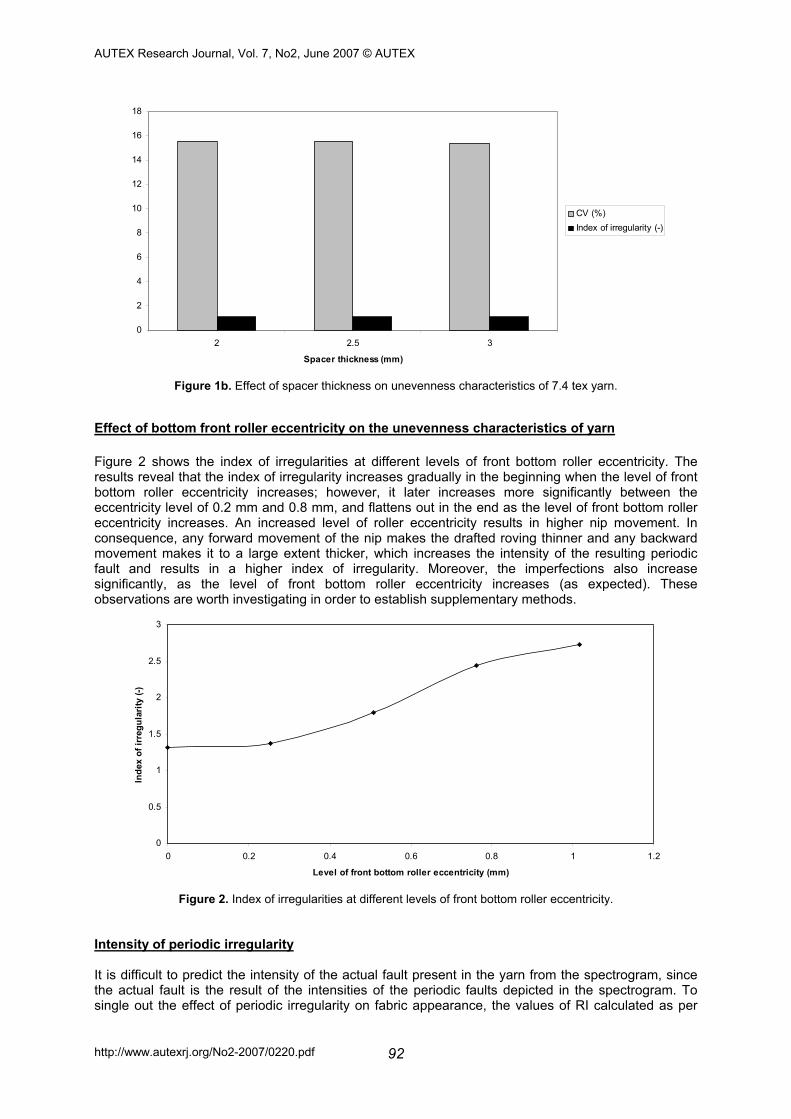
Effect of bottom front roller eccentricity on the unevenness characteristics of yarn Figure 2 shows the index of irregularities at different levels of front bottom roller eccentricity. The results reveal that the index of irregularity increases gradually in the beginning when the level of front bottom roller eccentricity increases; however, it later increases more significantly between the eccentricity level of 0.2 mm and 0.8 mm, and flattens out in the end as the level of front bottom roller eccentricity increases. An increased level of roller eccentricity results in higher nip movement. In consequence, any forward movement of the nip makes the drafted roving thinner and any backward movement makes it to a large extent thicker, which increases the intensity of the resulting periodic fault and results in a higher index of irregularity. Moreover, the imperfections also increase significantly, as the level of front bottom roller eccentricity increases (as expected). These observations are worth investigating in order to establish supplementary methods.
0
0.5
1
1.5
2
2.5
3
0 0.2 0.4 0.6 0.8 1 1.2
Level of front bottom roller eccentricity (mm)
Inde
x of
irre
gula
rity
(-)
Figure 2. Index of irregularities at different levels of front bottom roller eccentricity.
Intensity of periodic irregularity It is difficult to predict the intensity of the actual fault present in the yarn from the spectrogram, since the actual fault is the result of the intensities of the periodic faults depicted in the spectrogram. To single out the effect of periodic irregularity on fabric appearance, the values of RI calculated as per

AUTEX Research Journal, Vol. 7, No2, June 2007 © AUTEX
http://www.autexrj.org/No2-2007/0220.pdf 93
equation (1) are plotted against the front bottom roller eccentricity (Figure 3). It is understood from the figure that an increased level of eccentricity results in increased RI values, which in turn reflect the intensity of periodic irregularity present in the yarn. The relationship between RI and fabric appearance is established next.
0
20
40
60
80
100
120
0 0.2 0.4 0.6 0.8 1 1.2
Level of front bottom roller eccentricity (mm)
Rel
ativ
e in
dex
of ir
regu
larit
y (%
)
Figure 3. Relationship between levels of front bottom roller eccentricity and the relative index
of irregularities of yarn.
Relative unlevelness index of fabric samples The effect of periodic irregularity introduced during yarn production on the appearance of dyed single jersey knitted fabric samples is shown in Figure 4, and the corresponding values are given in Table 3. The results clearly reveal that the level of roller eccentricity highly influences the relative unlevelness index (Equation 3).
0
0.02
0.04
0.06
0.08
0.1
0.12
0 0.2 0.4 0.6 0.8 1 1.2
Level of front bottom roller eccentricity (mm)
Rela
tive
Unle
veln
ess
inde
x (-)
Figure 4. Effect of levels of front bottom roller eccentricity on the relative unlevelness indices.
Table 3 shows the relationships between the relative index of irregularity of yarn and relative unlevelness index with the fabric samples’ visual appearance. The correlation coefficient between the relative index of irregularity of yarn and the relative unlevelness index is found to be 0.99. It can be inferred from the table that a yarn produced from a front bottom roller eccentricity of up to 0.25 mm does not produce any significant variations in the appearance of the resulting fabric. The results also reveal that the appearance of fabric is highly affected if the relative index of irregularity of yarn exceeds 40%.

AUTEX Research Journal, Vol. 7, No2, June 2007 © AUTEX
http://www.autexrj.org/No2-2007/0220.pdf 94
Table 3. Relationship between relative index of irregularity of yarn and relative unlevelness index with fabric samples’ appearance.
Sample Level of front bottom roller eccentricity, mm RI, % RUI, - Visual appearance of levelness of
fabric samples
1 0.00 0.00 0.06186
Better levelness
2 0.254 4.58 0.06914 Good levelness
(Noticeable unlevelness under close examination)
3 0.508 36.64 0.08070 Poor levelness
(Apparent unlevelness)
4 0.762 86.26 0.09462 worse levelness
(Conspicuous unlevelness)
5 1.016 107.63 0.10385 Worst levelness
(Conspicuous unlevelness)
Conclusions
1. A yarn produced with a front bottom roller eccentricity of up to 0.25 mm does not produce any significant variations in the appearance of the resulting fabric.
2. It is found that the appearance of the fabric is highly affected if the value of relative index of irregularity of yarn, which is considered as a measure of the intensity of a periodic fault of a spun yarn, exceeds 40%.
References:
1. Basu A., ‘Textile Testing: Fiber, Yarn and Fabric’, (SITRA, Coimbatore), 2001, pp. 211-226 2. Bornet G.M., ‘The rating of yarns for short-term unevenness’ , Textile Research Journal,
(1964) pp. 385-390 3. Catling H., ‘Some effects of sinusoidal periodic yarn thickness variations on the appearance
of woven cloth’, Journal of Textile Institute, 49, (1958) pp. T232-T246 4. Chong C.L., Li S.Q. and Yeung K.W., ‘An objective method for assessment of levelness of
dyed materials’, Journal of Societies of Dyers and Colorists, 108, (1992) pp. 528 - 530 5. Erwin Kreyszig, ‘Advanced Engineering Mathematics’, (John Wiley & Sons. Inc, New York),
1996, pp.462 - 494 6. Foster G.A.R, ‘The principles of roller drafting and the irregularity of drafted materials’,
Volume IV Part I, (The Textile Institute, Manchester),1958, pp. 60 - 128 7. Foster G.A.R and Tyson A., ‘The amplitude of a periodic variations caused by eccentric top
drafting rollers and their effect on yarn strength’, Journal of Textile Institute, 47, (1956) pp. T385-T393
8. Furter R.., ‘Evenness Testing in yarn production: Part I & II’, (The Textile Institute, Manchester), 1982, pp. 53-73 & 15-39
9. Garde A.R. and Subramanian T.A. , ‘Process control in spinning’, (ATIRA, Ahmedabad),1978, pp. 188-213
10. Hasler A. and Honegger E., ‘Yarn evenness and its determination’, Textile Research Journal, (1954) pp. 73-77
11. Martindale J.G., ‘A new method of measuring the irregularity of yarns with some observations on the origin of irregularities in worsted slivers and yarns’, Journal of Textile Institute, (1954) pp.135-147
12. Shenai V.A., ‘Technology bleaching ’, (Sevak publications, Bombay),1984, pp.78-157, 243 - 300
13. Shenai V.A., ‘Technology of Dyeing’, (Sevak publications, Bombay),1991, pp.260-291
∇∆